
Rheological Behavior Features of Feedstocks with a Two-Component Wax–Polyolefin Binder Compared to Analogs Based on Polyoxymethylene
Abstract
:1. Introduction
2. Literature Review
3. Research Methods and Results
3.1. Composition and Structure of the Compared Powder–Polymer Mixtures
3.2. Methods and Results of Evaluating Rheological Properties
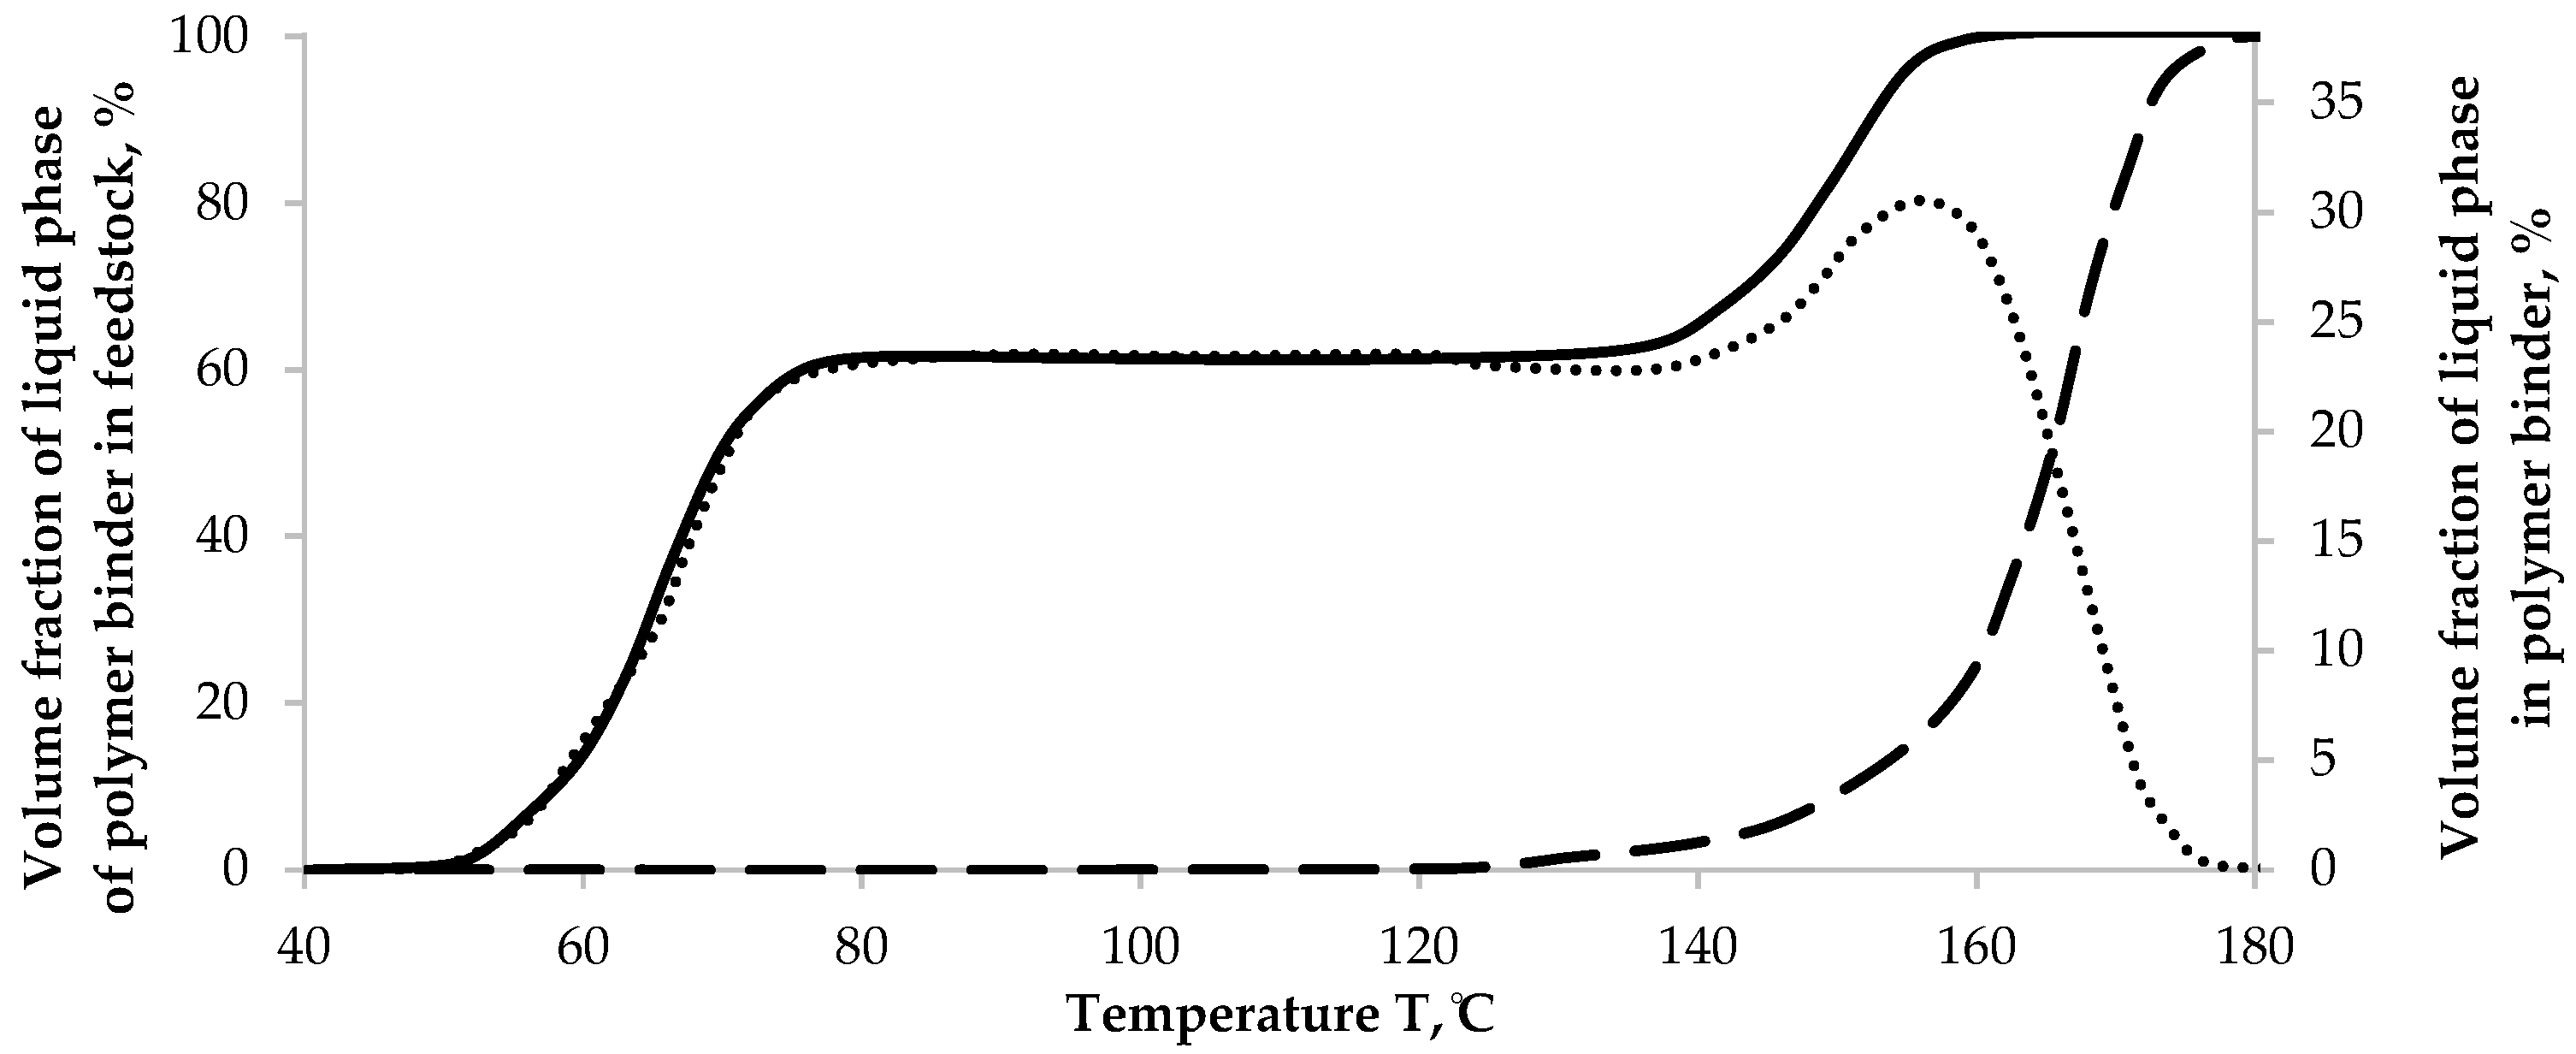
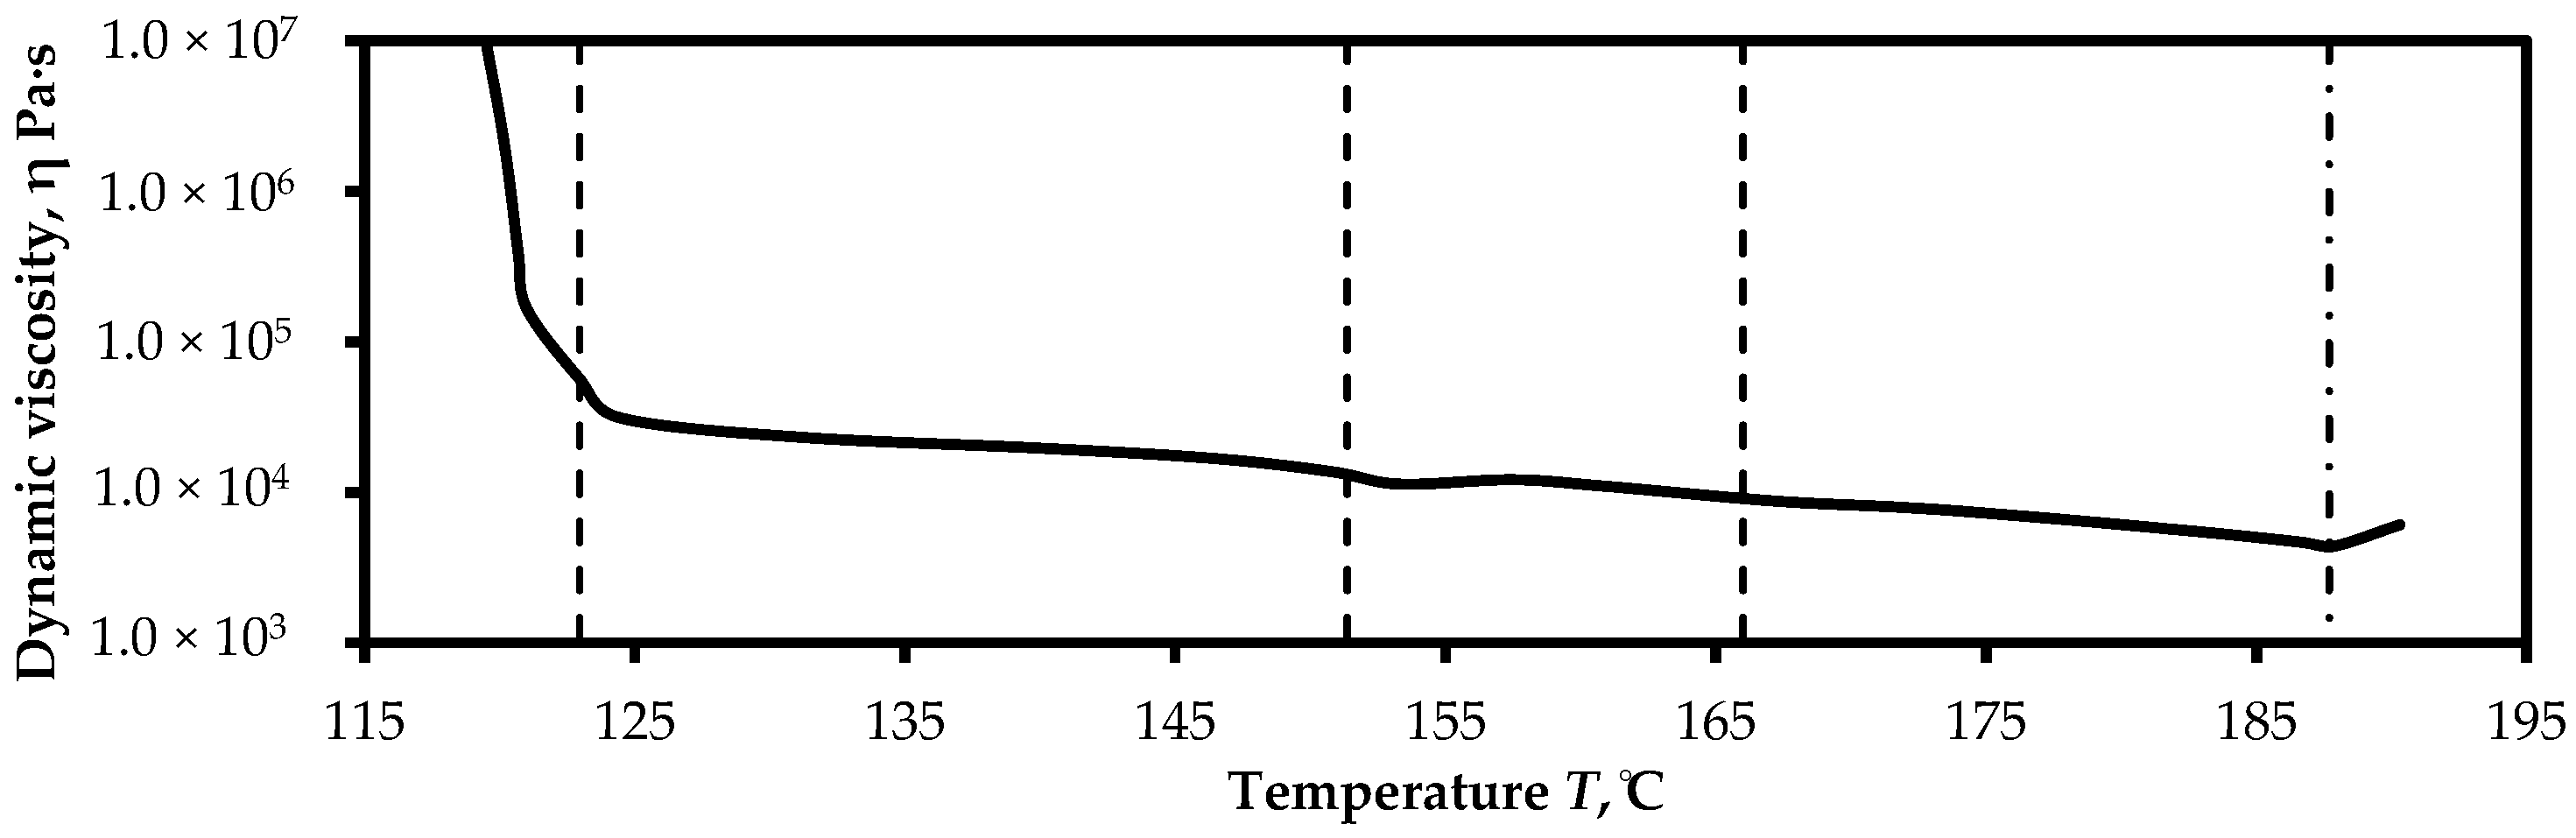
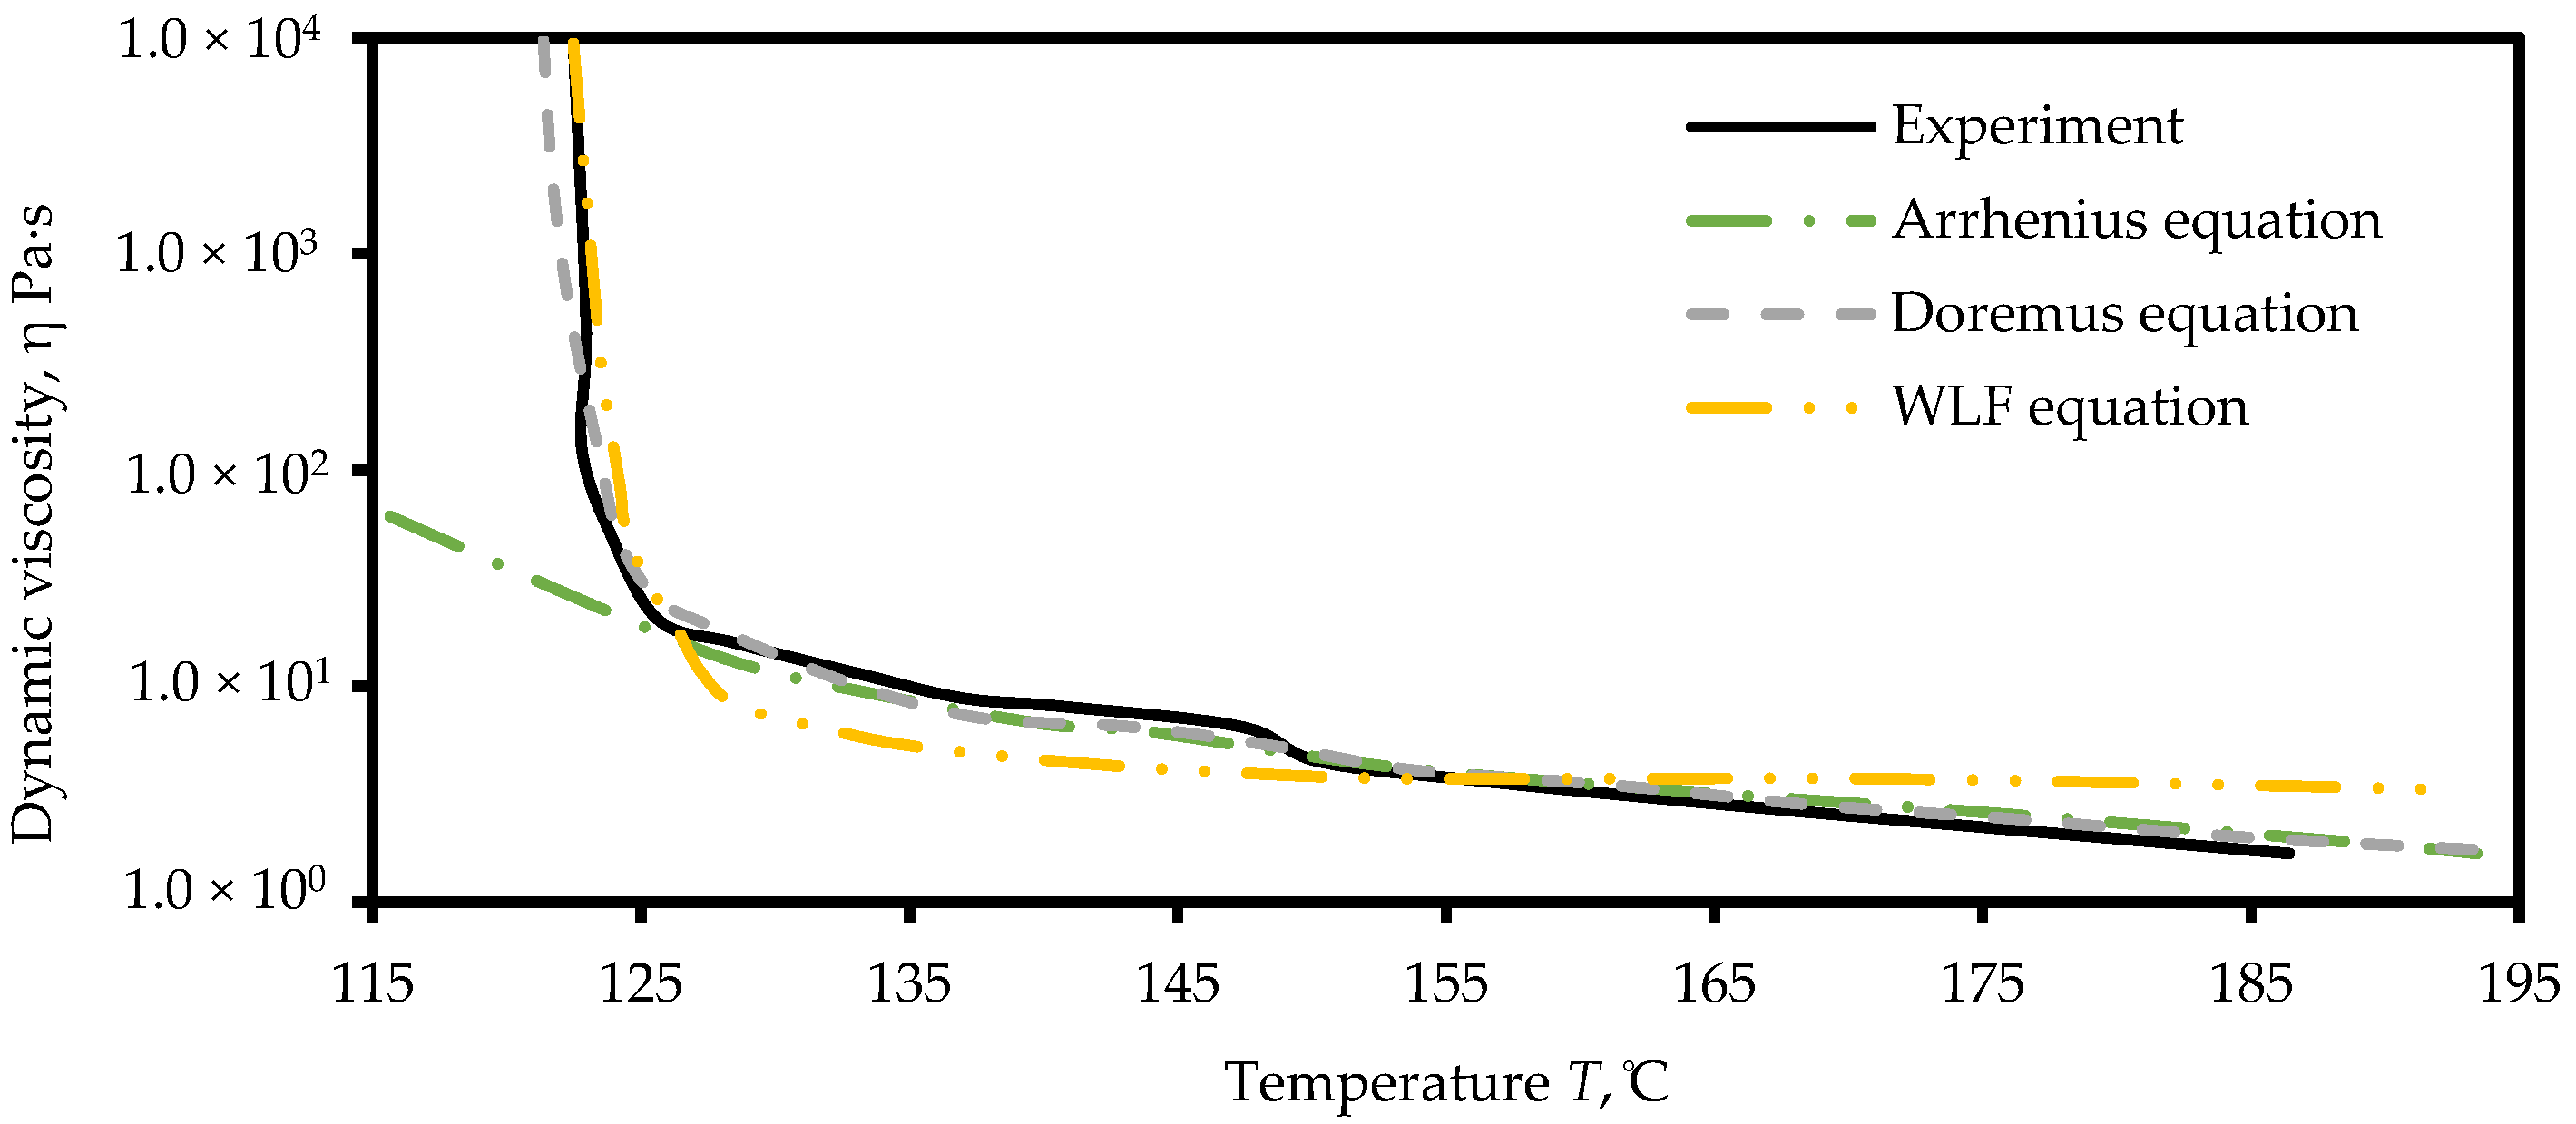
- At temperatures below 125 °C and up to 80 °C, the viscosity of the feedstock with the wax–polyolefin binder depends only on temperature; the proportion of liquid dispersion medium is constant and equal to 24 vol.%;
- At temperatures from 125 °C to 147 °C, the viscosity of the feedstock mainly depends on temperature, and an increment in the volume fraction of the liquid dispersion medium by 5% has little effect on the viscosity decrease in the feedstock as a whole;
- At temperatures from 147 °C to 166 °C, the process of transition to the structurally free flow of the whole feedstock slurry is observed because of the appearance of a sufficient volume of structurally free thermally activated liquid dispersion medium;
- In the range from 166 °C to 185 °C, viscosity depends only on temperature; an increase in the volume fraction of the liquid dispersion medium by 5% almost does not affect the viscosity of the feedstock with the wax–polyolefin binder.
4. Analysis and Discussion of the Results
5. Conclusions
Author Contributions
Funding
Data Availability Statement
Conflicts of Interest
References
- Heaney, D.F. Designing for Metal Injection Molding (MIM). In Handbook of Metal Injection Molding; Woodhead Publishing Ltd.: Cambridge, UK, 2012; pp. 29–49. [Google Scholar] [CrossRef]
- Zhao, T.; Ei, B.; Wang, X.; Qi, G.; Lowe, H. Research Progress on Optimization Methods of Powder Injection Molding Process Parameters. Adv. Transdiscipl. Eng. 2022, 22, 257–262. [Google Scholar] [CrossRef]
- Gonzlez-Gutierrez, J.; Beulke, G.; Emri, I. Powder Injection Molding of Metal and Ceramic Parts. In Some Critical Issues for Injection Molding; IntechOpen: London, UK, 2012. [Google Scholar] [CrossRef]
- Semenov, A.B.; Muranov, A.N.; Kutsbakh, A.A.; Krotov, D.M.; Logachev, I.A.; Semenov, B.I. Development of a Binder System for the Powder Injection Molding of Titanium: Foreign and Russian Experience. Part 1. Russ. Metall. (Met.) 2020, 2020, 1590–1599. [Google Scholar] [CrossRef]
- Hausnerova, B. Binder Systems for Powder Injection Molding: A Review. Adv. Mater. Proc. 2021, 2, 761–768. [Google Scholar] [CrossRef]
- Momeni, V.; Hufnagl, M.; Shahroodi, Z.; Gonzalez-Gutierrez, J.; Schuschnigg, S.; Kukla, C.; Holzer, C. Research Progress on Low-Pressure Powder Injection Molding. Materials 2022, 16, 379. [Google Scholar] [CrossRef] [PubMed]
- Malkin, A.Y.; Mityukov, A.V.; Kotomin, S.V.; Shabeko, A.A.; Kulichikhin, V.G. Elasticity and Plasticity of Highly Concentrated Noncolloidal Suspensions under Shear. J. Rheol. 2020, 64, 469–479. [Google Scholar] [CrossRef]
- Malkin, A.Y.; Kulichikhin, V.G.; Mityukov, A.V.; Kotomin, S.V. Deformation Properties of Concentrated Metal-in-Polymer Suspensions under Superimposed Compression and Shear. Polymers 2020, 12, 1038. [Google Scholar] [CrossRef] [PubMed]
- Mityukov, A.; Govorov, V.; Malkin, A.; Kulichikhin, V. Rheology of Highly Concentrated Suspensions with a Bimodal Size Distribution of Solid Particles for Powder Injection Molding. Polymers 2021, 13, 2709. [Google Scholar] [CrossRef]
- Malkin, A.Y.; Kulichikhin, V.G.; Khashirova, S.Y.; Simonov-Emelyanov, I.D.; Mityukov, A.V. Rheology of Highly Filled Polymer Compositions—Limits of Filling, Structure, and Transport Phenomena. Polymers 2024, 16, 442. [Google Scholar] [CrossRef]
- Hausnerova, B.; Filip, P. Processability of High Metal and Ceramic Concentration Compounds. Encycl. Mater. Compos. 2021, 2, 855–872. [Google Scholar] [CrossRef]
- Baum, M.; Anders, D.; Reinicke, T. Approaches for Numerical Modeling and Simulation of the Filling Phase in Injection Molding: A Review. Polymers 2023, 15, 4220. [Google Scholar] [CrossRef]
- Semenov, A.B.; Kutsbakh, A.A.; Muranov, A.N.; Semenov, B.I. Development of a Technique to Simulate the Injection Molding of Metallic-Powder-Filled Polymers. Russ. Metall. (Met.) 2019, 2019, 1351–1356. [Google Scholar] [CrossRef]
- Dragoni, M.; Pondrelli, S.; Tallarico, A. Longitudinal Deformation of a Lava Flow: The Influence of Bingham Rheology. J. Volcanol. Geotherm. Res. 1992, 52, 247–254. [Google Scholar] [CrossRef]
- Caggioni, M.; Trappe, V.; Spicer, P.T. Variations of the Herschel–Bulkley Exponent Reflecting Contributions of the Viscous Continuous Phase to the Shear Rate-Dependent Stress of Soft Glassy Materials. J. Rheol. 2020, 64, 413–422. [Google Scholar] [CrossRef]
- Heaney, D.F.; Zauner, R.; Binet, C.; Cowan, K.; Piemme, J. Variability of Powder Characteristics and Their Effect on Dimensional Variability of Powder Injection Moulded Components. Powder Metall. 2004, 47, 144–149. [Google Scholar] [CrossRef]
- Malkin, A.Y.; Patlazhan, S.A. Wall Slip for Complex Liquids—Phenomenon and Its Causes. Adv. Colloid Interface Sci. 2018, 257, 42–57. [Google Scholar] [CrossRef] [PubMed]
- De La Rosa, Á.; Ruiz, G.; Castillo, E.; Moreno, R. Calculation of Dynamic Viscosity in Concentrated Cementitious Suspensions: Probabilistic Approximation and Bayesian Analysis. Materials 2021, 14, 1971. [Google Scholar] [CrossRef] [PubMed]
- Baldino, S.; Osgouei, R.E.; Ozbayoglu, E.; Miska, S.Z.; May, R. Quemada Model Approach to Oil or Synthetic Oil Based Drilling Fluids Rheological Modelling. J. Pet. Sci. Eng. 2018, 163, 27–36. [Google Scholar] [CrossRef]
- Horri, B.A.; Ranganathan, P.; Selomulya, C.; Wang, H. A New Empirical Viscosity Model for Ceramic Suspensions. Chem. Eng. Sci. 2011, 66, 2798–2806. [Google Scholar] [CrossRef]
- Zhou, G.; Willett, J.L.; Carriere, C.J. Temperature Dependence of the Viscosity of Highly Starch-Filled Poly(Hydroxy Ester Ether) Biodegradable Composites. Rheol. Acta 2000, 39, 601–606. [Google Scholar] [CrossRef]
- Malkin, A.; Kulichikhin, V.; Ilyin, S. A Modern Look on Yield Stress Fluids. Rheol. Acta 2016, 56, 177–188. [Google Scholar] [CrossRef]
- Sherwood, J.D.; Durban, D. Squeeze Flow of a Power-Law Viscoplastic Solid. J. Non-Newton. Fluid Mech. 1996, 62, 35–54. [Google Scholar] [CrossRef]
- Adams, M.J.; Aydin, İ.; Briscoe, B.J.; Sinha, S.K. A Finite Element Analysis of the Squeeze Flow of an Elasto-Viscoplastic Paste Material. J. Non-Newton. Fluid Mech. 1997, 71, 41–57. [Google Scholar] [CrossRef]
- Roussel, N.; Lanos, C. Plastic Fluid Flow Parameters Identification Using a Simple Squeezing Test. Appl. Rheol. 2003, 13, 132–141. [Google Scholar] [CrossRef]
- Korotchenko, A.Y.; Khilkov, D.E.; Tverskoy, M.V. The Development of New Materials and Modes of Casting Metal Powder Mixtures (MIM Technology). Mater. Sci. Forum 2019, 945, 538–542. [Google Scholar] [CrossRef]
- Kutsbakh, A.A.; Muranov, A.N.; Semenov, A.B.; Semenov, B.I. The Rheological Behavior of Powder–Polymer Blends and Model Description of Feedstock Viscosity for Numerical Simulation of the Injection Molding Process. Polym. Sci. Ser. D 2022, 15, 701–708. [Google Scholar] [CrossRef]
- Gonzalez-Gutierrez, J.; Stringari, G.B.; Megen, Z.M.; Oblak, P.; von Bernstorff, B.S.; Emri, I. Selection of Appropriate Polyoxymethylene Based Binder for Feedstock Material Used in Powder Injection Moulding. J. Phys. Conf. Ser. 2015, 602, 012001. [Google Scholar] [CrossRef]
- Schrank, T.; Berer, M.; Haar, B.; Ramoa, B.; Lucyshyn, T.; Feuchter, M.; Pinter, G.; Speranza, V.; Pantani, R. Injection Molding Simulation of Polyoxymethylene Using Crystallization Kinetics Data and Comparison with the Experimental Process. Polym. Cryst. 2022, 2022, 2387752. [Google Scholar] [CrossRef]
- Stolin, A.M.; Khokhlov, A.V. Nonlinear Model of Shear Flow of Thixotropic Viscoelastoplastic Continua Taking into Account the Evolution of the Structure and Its Analysis. Mosc. Univ. Mech. Bull. 2022, 77, 127–135. [Google Scholar] [CrossRef]
- ISO 11357-1:2023; Plastics—Differential Scanning Calorimetry (DSC)—Part 1: General Principles. ISO: Geneva, Switzerland, 2023.
- Tverskoy, M.V.; Khilkova, A.A.; Khilkov, D.E. Study of Particularities of Metal Powder Mixtures Injection Molding. Politech. Stud. J. 2018, 11, 1–8. [Google Scholar] [CrossRef]
- Mannella, G.A.; La Carrubba, V.; Brucato, V.; Zoetelief, W.; Haagh, G. No-flow Temperature in Injection Molding Simulation. J. Appl. Polym. Sci. 2010, 119, 3382–3392. [Google Scholar] [CrossRef]
- Ojovan, M.I.; Travis, K.P.; Hand, R.J. Thermodynamic Parameters of Bonds in Glassy Materials from Viscosity–Temperature Relationships. J. Phys. Condens. Matter 2007, 19, 415107. [Google Scholar] [CrossRef] [PubMed]
- Williams, M.L.; Landel, R.F.; Ferry, J.D. The Temperature Dependence of Relaxation Mechanisms in Amorphous Polymers and Other Glass-Forming Liquids. J. Am. Chem. Soc. 1955, 77, 3701–3707. [Google Scholar] [CrossRef]


| Model Name | Model Description | Model Equation |
|---|---|---|
| Bingham model [14] | The Bingham plastic model is the most common rheological model used in the drilling industry. This model is a two-parameter model that includes the yield stress and plastic viscosity of the fluid. After the fluid starts to flow, there is a linear relationship between shear stress and the shear rate. | , where —yield point; —plastic viscosity; —shear stress |
| Herschel–Bulkley model [15] | The Herschel–Bulkley fluid is a generalized model of a non-Newtonian fluid in which the strain experienced by the fluid is related to the stress in a complicated, non-linear way. The consistency is a simple constant of proportionality, whereas the flow index measures the degree to which the fluid is shear-thinning or shear-thickening. Finally, yield stress quantifies the amount of stress that the fluid may experience before it yields and begins to flow. | , where K and n are material constants determined experimentally |
| Casson model [16] | The equation shows that the effective viscosity of the Bingham medium decreases with an increasing shear rate. | (used only when σ > ) |
| Einstein model [17] | This model is used for very dilute suspensions of non-Brownian hard spheres. It ignores any particle–particle hydrodynamic interactions. It is generally valid for φ ≤ 0.03. | , where —filler volume fraction |
| Krieger–Dougherty model [18] | This model is used to describe the viscosity of the cement mixtures. The Dougherty equation gives the dynamic viscosity from the volume fraction of cement particles, which may be obtained from the relationship between water and cementitious materials. The interest in and application of the Krieger–Dougherty equation in these suspensions are, from a theoretical point of view, due to its robustness and the fact that its parameters have a physical significance. | , where —relative viscosity; φ—volume of the loaded fraction;—maximum degree of compaction; —characteristic viscosity |
| Quemada’s model [19] | Quemada’s model is based on the generalization of the hard sphere model and a revised effective volume fraction concept. For the latter, individual particles and small irreducible aggregates (referred to as individual flocs) are assumed to be the main components of the structural units. However, because it is improbable to have all individual flocs included in structural units, the possibility of finding free individual flocs in the stabilized suspension is considered. | |
| Orri model [20] | The Orri model equation reconciles Einstein’s model with more recent models using the mobility parameter. The parameters and can be determined from the experimental data by curve fitting analysis. | |
| Power-law model [21] | The Power-law model for non-Newtonian fluids is one of the most common viscosity models used in hydraulic analysis. This model states that shear stress requires shearing a fluid at a given rate. | , where τ—shear stress, Pa; K is flow density coefficient, Pa·s; —shear rate gradient along the axis perpendicular to the shear plane, s−1; n—dimensionless indicator of medium behavior |
| Second-order model [22] | A second-order fluid is a fluid in which the stress tensor is the sum of all tensors that can be formed from the velocity field with up to two derivatives, much as a Newtonian fluid is formed from derivatives up to the first order. This model can be obtained from a retarded motion expansion truncated at the second order. | , where —indeterminate spherical stress due to the constraint of incompressibility; —n-th Rivlin–Ericksen tensor; —zero-shear viscosity; —constants that are related to the zero shear normal stress coefficients |
| Carreau model [23] | A Carreau fluid in physics is a type of generalized Newtonian fluid in which viscosity depends on the shear rate. At a high shear rate, which depends on the power index and the infinite shear rate viscosity, a Carreau fluid behaves as a Newtonian fluid again with viscosity . | where µ0—viscosity at a zero-shear rate (Pa·s); µinf—viscosity at infinite shear rate (Pa·s); —characteristic time (s); n—power index |
| Cross model [24] | A Cross fluid is a type of generalized Newtonian fluid whose viscosity depends on the shear rate. The zero-shear viscosity is approached at very low shear rates, whereas the infinite shear viscosity is approached at very high shear rates. | , where ,, k, n are coefficients |
| Cross-WLF model [25] | The Cross-WLF viscosity model describes the temperature, shear rate, and pressure dependency of the viscosity for thermoplastic materials. | —critical stress level at the transition to shear thinning, determined by curve fitting; n—power law index in the high shear rate regime, determined by curve fitting |
| Temperature Value, °C | The Type of Polymer in the Binder | ||
|---|---|---|---|
| Wax | PP | POM | |
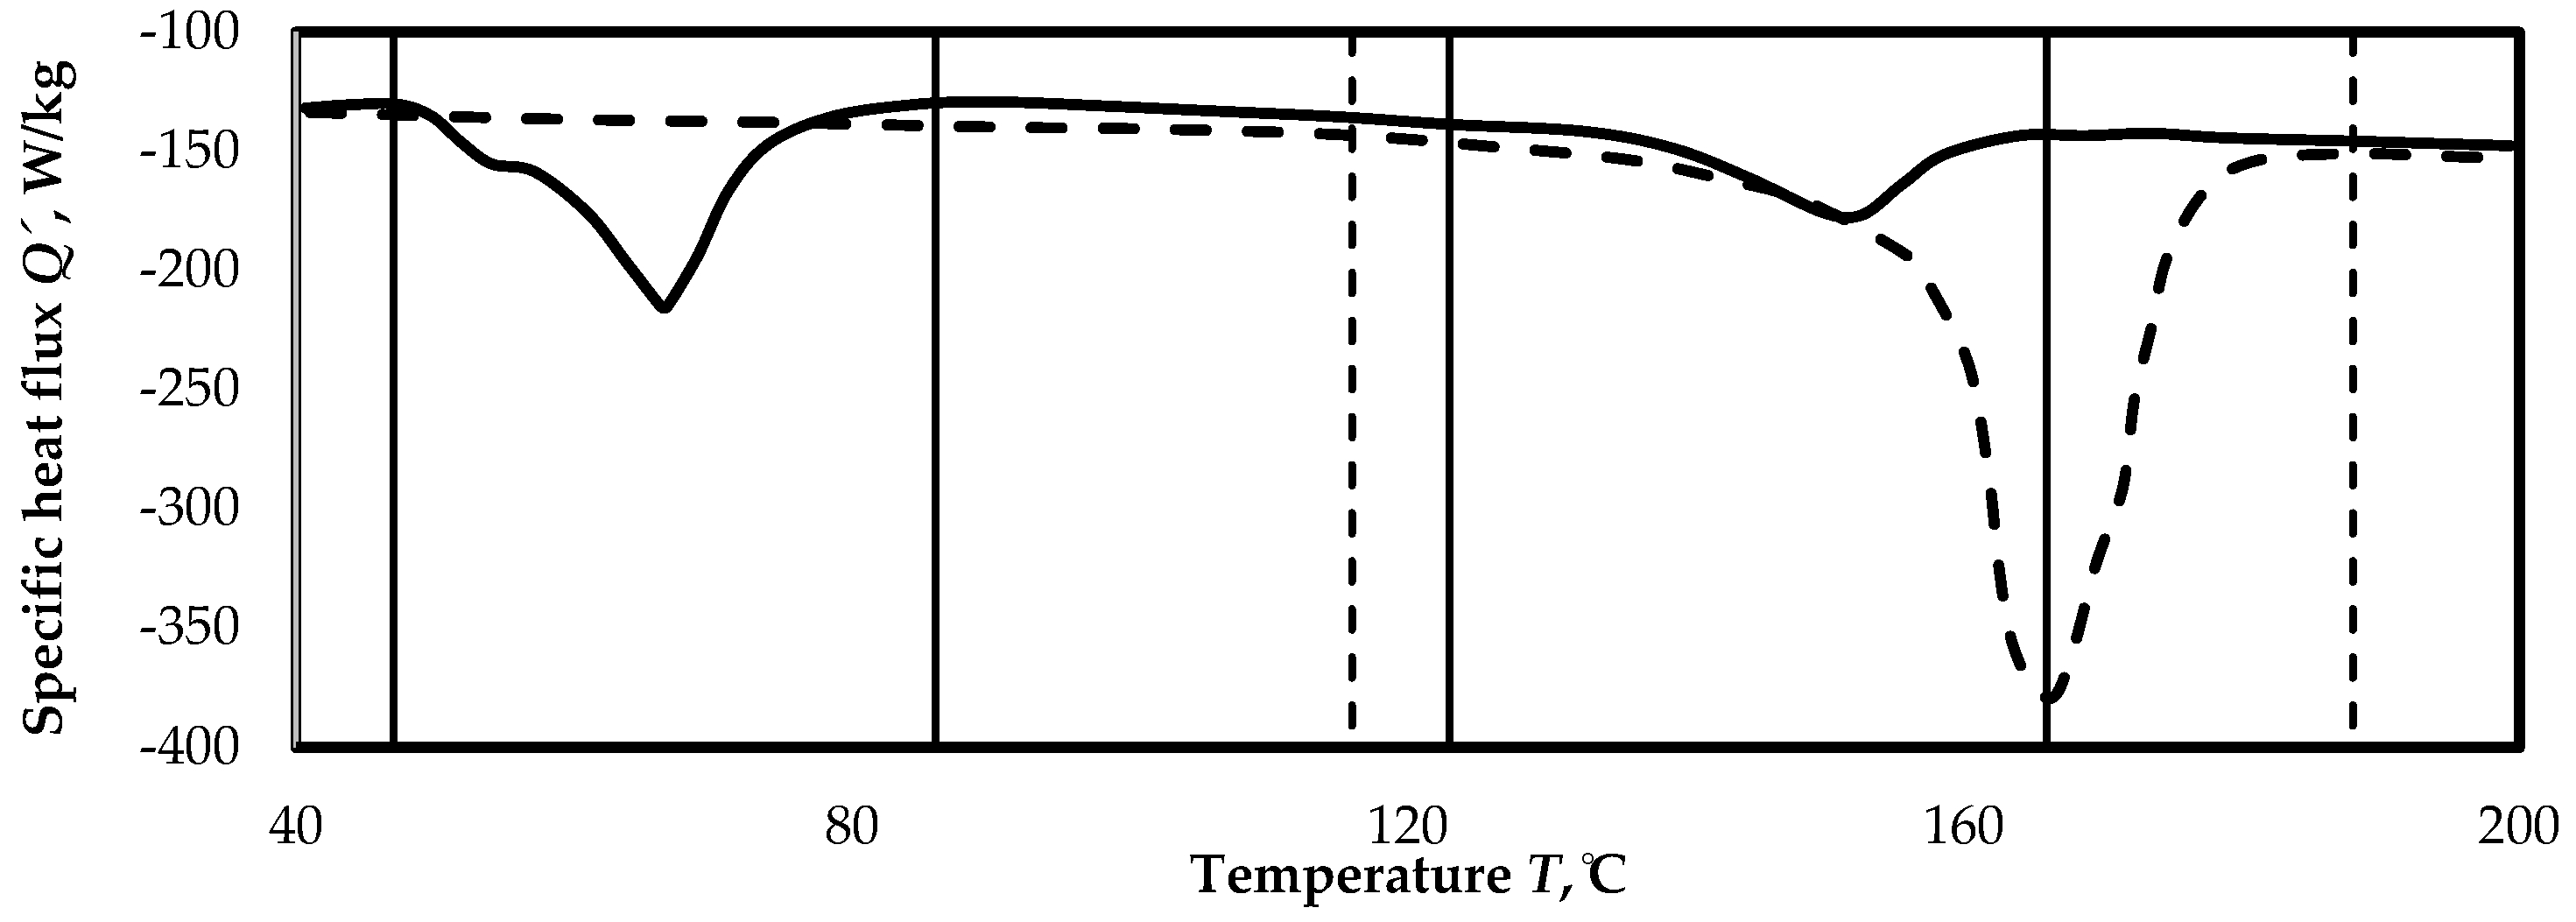
| Melting process start temperature TM1 | 47 | 123 | 116 |
| Temperature of the maximum melting intensity TM2 | 66 | 151 | 166 |
| Melting process start temperature TM3 | 86 | 166 | 188 |
| Coefficient | , (Pa·s)/K | , J/mol | , J/mol | ||
|---|---|---|---|---|---|
| Value | 0.1061 | 0 | 5.719 × 10⁵ | 5.83 × 10⁻³ | 3.799 × 10⁴ |
Disclaimer/Publisher’s Note: The statements, opinions and data contained in all publications are solely those of the individual author(s) and contributor(s) and not of MDPI and/or the editor(s). MDPI and/or the editor(s) disclaim responsibility for any injury to people or property resulting from any ideas, methods, instructions or products referred to in the content. |
© 2024 by the authors. Licensee MDPI, Basel, Switzerland. This article is an open access article distributed under the terms and conditions of the Creative Commons Attribution (CC BY) license (https://creativecommons.org/licenses/by/4.0/).
Share and Cite
Muranov, A.N.; Lysenko, V.R.; Kocharov, M.A. Rheological Behavior Features of Feedstocks with a Two-Component Wax–Polyolefin Binder Compared to Analogs Based on Polyoxymethylene. J. Compos. Sci. 2024, 8, 199. https://doi.org/10.3390/jcs8060199
Muranov AN, Lysenko VR, Kocharov MA. Rheological Behavior Features of Feedstocks with a Two-Component Wax–Polyolefin Binder Compared to Analogs Based on Polyoxymethylene. Journal of Composites Science. 2024; 8(6):199. https://doi.org/10.3390/jcs8060199
Chicago/Turabian StyleMuranov, Alexander N., Viktor R. Lysenko, and Maxim A. Kocharov. 2024. "Rheological Behavior Features of Feedstocks with a Two-Component Wax–Polyolefin Binder Compared to Analogs Based on Polyoxymethylene" Journal of Composites Science 8, no. 6: 199. https://doi.org/10.3390/jcs8060199