Abstract
Biocharcoal (BioC), a cost-effective, eco-friendly, and sustainable material can be derived from various organic sources including agricultural waste. However, to date, complex chemical treatments using harsh solvents or physical processes at elevated temperatures have been used to activate and enhance the functional groups of biochar. In this paper, we propose a novel easy and cost-effective activation method based on electrochemical cycling in buffer solutions to enhance the electrochemical performance of biocharcoal derived from almond shells (AS-BioC). The novel electrochemical activation method enhanced the functional groups and porosity on the surface of AS-BioC, as confirmed by microscopic, spectroscopic characterizations. Electrochemical characterization indicated an increase in the conductivity and surface area. A modified SPCE with activated AS-BioC (A.AS-BioC/SPCE), shows enhanced electrochemical performance towards oxidation and reduction of nitrite and paraxon ethyl pesticide, respectively. For both target analytes, the activated electrode demonstrates high electrocatalytic activity and achieves a very LOD of 0.38 µM for nitrite and 1.35 nM for ethyl paraxon with a broad linear range. The sensor was validated in real samples for both contaminants. Overall, the research demonstrates an innovative technique to improve the performance of AS-BioC to use as a modifier material for electrochemical sensors.
1. Introduction
Electrochemical methods offer several advantages over chromatographic and spectroscopic techniques, including lower cost, simpler instrumentation, faster analysis, and the ability to perform on-site, real-time monitoring. These methods are highly sensitive, selective, and suitable for portable devices, making them more efficient for detecting contaminants at very low concentrations [1].
In this regard, electrochemical sensors based on different nanocomposites of graphene, nanotubes, polymers, and metal, metal oxide nanoparticles have been demonstrated in the past for the detection of various contaminants in the environment [2]. Among the different electrodes, screen-printed carbon electrodes (SPCEs) stand out due to their cost-effectiveness and ease of mass production. Traditional electrodes such as glassy carbon electrodes are bulky and require external counter and reference electrodes for operation which limits their portability. SPCEs, on the other hand, have compact size allowing for easier integration with electronics and making them ideal for portable sensors, for a range of environmental applications. It is also suited for biomedical applications wherein typically very low amounts of samples are used for analysis [3].
However, the demand for integrating sustainable and eco-friendly approaches into technology has surged to unprecedented levels, driven by the adverse impacts associated with conventional methods and materials. Biocharcoal (BioC) is one such alternative material that can be produced from different organic sources such as agricultural, household, and industrial wastes [2]. It is a less expensive and environmentally supportive alternative to produce activated carbon material as a byproduct during the thermochemical degradation of biomass [4,5]. Various raw materials [6,7] and different strategies [8] have been implemented for the production of BioC.
Nevertheless, the obtained BioC has poor physiochemical activity and surface areas that limit its applicability in electrochemical sensors. Different methods are investigated for its activation to enhance its properties such as active surface area, porosity, and functional groups on the surface. Current activation methods such as physical activation involve steam, ozone, or CO2, and chemical activation is achieved using activators such as zinc chloride or potassium hydroxide in either alkaline or acidic media [4]. In physical activation, temperatures above 700 °C for long durations under controlled atmospheres must open up the internal pores and thus enhance the surface area of the BioC. Further, the properties of the activated biocharcoal (A. BioC) obtained through physical mechanisms are dependent on multiple factors such as type of biomass, activating gases, and reaction environment which requires complicated and resource-extensive optimizations [5].
On the other hand, chemical activation involves doping with a chemical agent followed by dehydration and oxidation. Chemicals such as KOH, ZnCl2, K2CO3, H2SO4, and H3PO4 have been widely reported in the literature for the activation [7,9,10] and are more efficient than physical methods as low temperatures are required and produce greater carbon yield with high surface areas [8]. Most of the work related to chemical activation is carried out in alkaline or acidic media and also leads to the enhancement of the functional groups on the surface apart from an increase in the porosity that leads to a higher adsorptive capacity of the surface [11]. Nevertheless, the typical chemical activation procedures for the addition of functional groups use harsh chemicals and heat under reflux for long durations [12]. Other methods such as plasma-induced functional groups have also been proposed that require specific gases and reactors to obtain the functionalized surfaces. Other methods such as plasma-induced functional groups have also been proposed that require specific gases and reactors to obtain the functionalized surfaces [13].
A. BioC has demonstrated various applications including as an adsorbent for water contaminants [14] and air purification [15], as a catalyst [16], for enhancing the fertility of soil [17], hydrogen storage through adsorption [18] and battery to name a few. Apart from these, A. BioC has been used in recent times as a modification material for electrochemical sensors, facilitating the detection and analysis of a wide spectrum of contaminants [19,20].
The high adsorptive behavior of the BioC was achieved by activation with HNO3 as an oxidant that breaks the C-C bonds due to H+ ions thus forming the functional groups on the surface which increased the surface area and pore volumes [21]. Indeed, a careful balance must be maintained between the extent of carbonization and the introduction of functional groups to achieve the desired performance, especially in the field of electrochemical sensors. For instance, in [22] it has been demonstrated that depending on the KOH amount and the activation temperatures, surfaces with either higher porosity or large surface functional groups are formed and the performance of these was evaluated through CO2 adsorption capacity which was higher for surfaces with a large number of functional groups.
Only one work until now has shown the electrochemical activation of biocharcoal and an increase in the oxygen functional groups was observed which was useful for the adsorption of metal ions. However, four hours were required for the activation followed by the separation and drying of biocharcoal at elevated temperatures [23]. In this work, BioC obtained from the carbonization of AS modified on screen printed carbon electrodes was activated electrochemically in a single step to induce oxygen functional groups on the surface and also to increase the conductivity which has not been reported before. The morphology, chemical composition, surface areas, and electron transfer properties of AS-A. BioC was systematically evaluated. The enhancement in the performance of AS-A. BioC was validated by investigation of its detection capability of two diverse contaminants, nitrite and paraxon ethyl pesticide. Nitrite, an important part of the nitrogen cycle is found abundantly in the environment [24]. Excessive amounts of nitrite intake reduce the transport of oxygen and are carcinogenic by nature [25], which leads to a high interest in sensing this analyte in water and the environment. A second analyte is paraxon ethyl, an organophosphate pesticide, that is banned in several countries due to serious health risks associated with its use in agriculture. It is known to be easily absorbed via the skin and can eventually lead to seizures and brain damage [26]. The AS-A. BioC-modified screen-printed carbon electrode (SPCE) termed AS-A. BioC/SPCE displayed enhanced performance towards the oxidation of nitrite and reduction of paraxon ethyl at very low concentrations with good selectivity. This paper presents a novel, simple and cost-effective method to enhance the electrochemical performance of BioC and thereby was capable of achieving sensitive detection of nitrite and paraxon ethyl. The work would contribute to enhancing the research and applications of BioC as functionalization material for electrochemical sensors which is currently limited due to the complex activation procedures. Further, the developed sensors modified with activated BioC would be a sustainable solution with the potential for monitoring the contaminants in the environment.
2. Materials and Methods
2.1. Solutions and Electrodes
Analytical grade sodium dihydrogen phosphate monobasic, sodium phosphate pentahydrate, calcium sulfate, magnesium chloride, calcium sulfate, sodium nitrate, sodium nitrite, paraxon ethyl, and potassium chloride were purchased from Sigma Aldrich, Darmstadt, Germany. SPCE from Italsens was obtained from EKT Technologies, Nufringen, Germany, wherein the working and counter electrode was carbon, and the reference electrode was made of silver. The pH of the solutions was optimized by 0.1 M hydrochloric acid and sodium hydroxide solutions. The screen printed Gold electrodes were obtained from Metrohm, Germany.
2.2. BioC Preparation from Almond Shell
The almond shell (AS) used in this study was collected from the region of Sfax, Tunisia, and carbonized at a constant temperature of around 600 °C in a pilot plant using recycled gas as fuel. Five kilograms of AS were loaded in the carbonization chamber and thermochemically decomposed for 2 h generating pyrolytic fumes used as fuel for the auto-feeding of the flame in the external combustor. The almond shell bio-charcoal (1.7 kg with a mass efficiency of about 34%) was collected from the carbonization chamber after a cooling period of around 2 h [27]. The produced almond shell bio-charcoal (AS-BioC) is then grounded and sieved between 40 and 60 mesh before physicochemical characterization and performance evaluation in electrochemical sensors.
2.3. Electrode Modification and Electrochemical Measurements
All the electrochemical measurements were carried out by commercial potentiostat from PalmSens. Initially, BioC was dispersed in different solvents (acetone, ethanol, tetrahydrofuran, acetonitrile, isopropanol) for a certain sonication time and their homogeneity was investigated. BioC dispersed in isopropanol showed optimal dispersing capability for BioC compared to other solvents. Hence, 5 mg of as obtained BioC was dispersed in 10 mL of isopropanol solution and was ultrasonicated for 90 min at 30% power to obtain a homogenous dispersion of BioC. 3 µL of the dispersion was subsequently dropped cast on the working electrode of SPCE. The electrochemical activation was carried out by running cyclic voltammetry (CV) from 0 to −1.5 V at 0.075 V s−1 in phosphate buffer solution (PBS) of pH 3 followed by drying in an ambient environment before subsequent use. The electrochemical characterization of the surface was performed in 5 mM potassium hexacyanoferrate (II)/potassium hexacyanoferrate (III) (K3Fe (CN)6]3−/4−) prepared in a 0.1 M KCl solution. Specifically, a potential range from −0.4 to 0.6 V was selected for CV at different scan rates. Electrochemical impedance spectroscopy (EIS) was implemented at an AC amplitude of 0.01 V and a frequency range from 0.1 to 15,000 Hz. The detection of both contaminants was investigated through square wave voltammetry (SWV) at a frequency of 10 Hz. In the case of paraxon ethyl, an accumulation potential of 0.1 V was applied for 100 s before the detection.
2.4. Microscopic and Spectroscopic Characterization
Fourier transform infrared spectroscopy (FTIR) analysis of the surfaces was performed by INVENIO S spectrometer from Bruker, Bremen, Germany. The measurements were recorded in attenuation total reflection mode (ATR) on germanium crystal (550 to 4000 cm−1). Appropriate baseline corrections and atmospheric compensations were carried out in OPUS 8.8 software provided with the instrument. Raman measurements were obtained by a Raman plus 532H laser from Metrohm, Germany with a power of 30 mW. The integration time of 60 s and power of 30 mW were used for spectra acquisition. The scanning electron microscopy (SEM) images were obtained by Nova NanoSEM 200 microscope from Thermo Fisher, Dreieich, Germany. AFM imaging was performed by the Keysight 5600LS system (Keysight, Colorado Springs, CO, USA) in contact mode. The images were processed using Gwyddion 2.62, an open-source software for SPM data analysis [28]. Images of the AS-BioC sample were prepared on a silicon substrate by drop casting after 20 times dilution of the original solution. Images of the electrodes both bare and functionalized were also performed.
3. Results
3.1. Physical and Electrochemical Characterization
3.1.1. AS-BioC on Silicon Substrate
The morphological characterization of derived AS-BioC after pyrolysis was performed by drop coating 2 µL of the prepared dispersion in isopropanol on a silicon substrate. Figure 1 shows the AFM, and FTIR characterization of AS-BioC on Silicon. As can be seen, AFM images were able to reveal individual flakes of AS-BioC on a silicon substrate. A 2D structural nature of the bio charcoal where flake sizes ranging from several nanometers to 20 nm was observed in Figure 1a. In addition, the lateral size varies by several hundred nanometers to several micrometers as seen from the profiles at two different regions shown on the right side in Figure 1a. Stacked layers are also observed in larger flakes which resemble to a considerable extent the structure of multiple-layer graphene nanoplatelets. Moreover, amorphous structures can be observed. FTIR analysis of the AS-BioC revealed the presence of bands related to C-H, C-O, and C=O in the spectrum as compared to Silicon as seen in Figure 1b. Further, the highly intense peaks at around 2300 cm−1 are due to the asymmetric stretching of atmospheric CO2. The results from FTIR conclude the existence of functional groups on the surface. The effect of electrochemical activation of AS-BioC on SPCE through FTIR, AFM, and Raman spectroscopy is elaborated in the forthcoming discussion.

Figure 1.
(a) AFM image of the AS-BioC flakes on Silicon and its corresponding profile to the right, (b) shows FTIR analysis of AS-BioC, respectively.
3.1.2. Morphological and Structural Characterization of AS-BioC Modified SPCE Electrodes
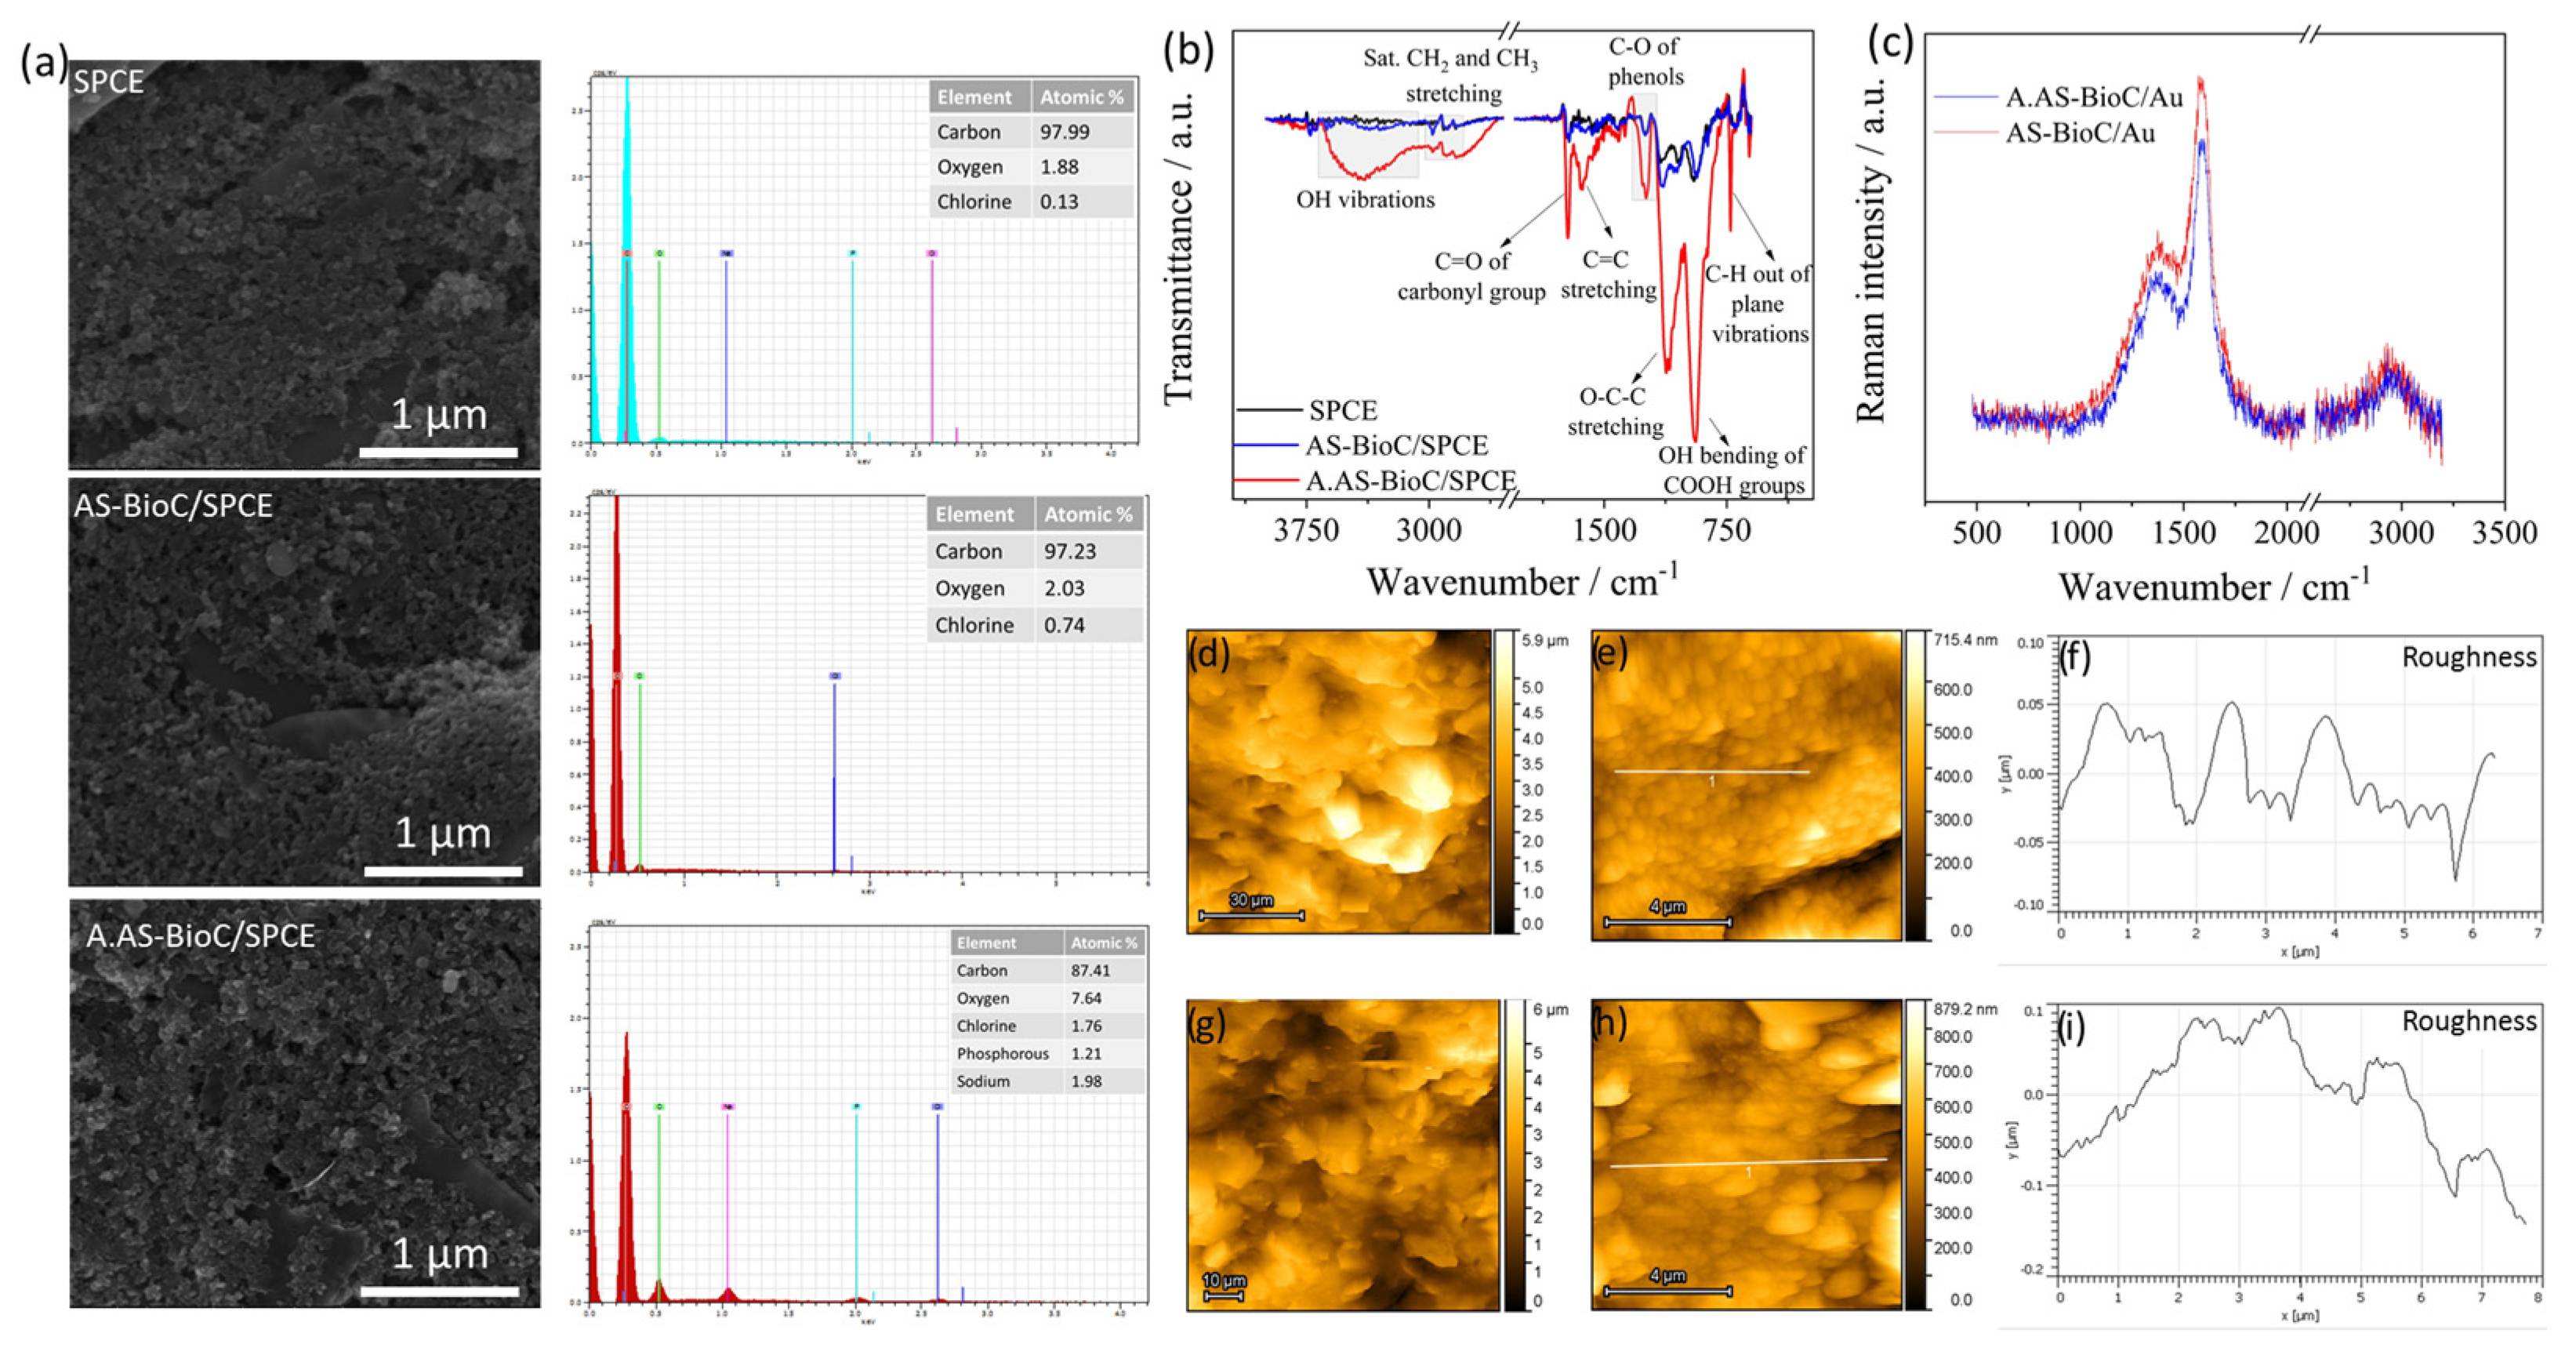
The electrochemical activation of the AS-BioC/SPCE electrode was performed in a buffer solution with pH 2. Figure 2a shows the SEM images of bare SPCE, AS-BioC/SPCE, and A.AS-BioC/SPCE electrode surfaces and the corresponding images to the right are the obtained EDX spectra to determine the elemental composition. The SEM image of the SPCE consists of amorphous carbon with flakes distributed along the surface [29]. AS-BioC/SPCE surfaces did not show any significant changes except for a slight change in the pore density. However, A.AS-BioC/SPCE was significantly distinguishable from the latter two as the pore volume and density appeared to be higher. The EDX spectra shown to the right correspond to the surface obtained by SEM imaging and the inset of the spectra shows the atomic percentage of individual elements. As can be seen, the carbon content for SPCE was found to be the highest and a minute reduction in its percentage on the surface to 97.23 from 97.99% was observed after modification with AS-BioC. However, a higher reduction in the carbon content of A.AS-BioC/SPCE to 87.41% was observed. In parallel, an increase in the oxygen content on the surface increased from 1.88% for bare SPCE to 7.64% for the A.AS-BioC/SPCE electrode suggests the presence of oxygen functional groups. In addition to carbon and oxygen other elements such as phosphorous and sodium were identified on the activated surface as the electrochemical activation was performed in phosphate buffer solution. The peak for chlorine present for all three surfaces could be possibly due to the substrate of SPCE itself.

Figure 2.
(a) Shows the SEM images of SPCE, AS-BioC/SPCE and A.AS-BioC/SPCE, and their corresponding EDX spectra are shown to the right with the inset showing the percentage of individual elements (b) shows FTIR spectra of SPCE; AS-BioC/SPCE, and A.AS-BioC/SPCE, (c) shows Raman spectra of AS-BioC and A.As-BioC on gold electrode, (d,e) show AFM images of a bare electrode, (g,h) for the A.AS-BioC/SPCE and (f,i) show the roughness profiles of the two surfaces, respectively.
FTIR analysis shown in Figure 2b for the three surfaces provided information about the chemical composition of functional groups present on the surface. The spectra for SPCE and AS-BioC/SPCE comprised similar bands and A.AS-BioC/SPCE surface revealed significant changes in the spectra. Starting from right to left, at around 3350 to 3400 cm−1 a broad band was observed for AS-BioC modified surfaces that corresponds to the OH vibrations on the surface. The next observations were bands from 2830 to 2984 cm−1 which are related to the stretching of saturated methyl and methylene bonds as they lie below 3000 cm−1 [30]. Moving towards the left, the typical C=O band is present at 1715 cm−1 is present for all the surfaces [31]. The band at 1641 cm−1 corresponds to the C=C stretching in the aromatic rings and is visible for A.AS-BioC/SPCE which indicates carbonization was also achieved during electrochemical activation. At around 1255 cm−1, the band is related to the C-O stretching in phenolic compounds. The bands around 1100 cm−1 and 937 cm−1 correspond to O-C-C stretching and OH bending of the carboxylic groups on the surface, respectively, are higher for AS-A. BioC/SPCE surfaces which is evidence for the enrichment of functional groups on the AS-BioC surface. These bands also conclude the presence of strong acidic functionalities on the surface compared to SPCE and AS-BioC/SPCE. To elaborate more about the different peaks for the C-O bands, biomass constitutes cellulose, hemicellulose, and lignin as three fundamental units [32]. The peak at 1244 cm−1 which is significantly higher is related to the C-O stretching in lignin, at 1100 cm−1 is assigned to the stretching in carboxylic, ester, or ether groups in cellulose and hemicellulose [33] and the peak from 905 to 995 cm−1 corresponds to C-O stretching in cellulose [34]. On the other hand, the aromaticity of surfaces was revealed by the band from 1590 to 1620 that is related to C=C skeletal vibrations arising from hemicellulose [34]. The analysis of FTIR spectra concludes the addition of functional groups on the surface of AS-BioC and carbonization as well after the electrochemical treatment in acidic media.
Figure 2c shows the normalized Raman spectra obtained for the AS-BioC and A.AS-BioC on gold electrodes. The reason for using gold electrodes is that the peaks of carbon from SPCE could be superimposed on the spectra of BioC-modified electrodes which could lead to inconclusive results. However, the parameters used for activation were used in the case of Au electrodes without any optimization. The typical peaks of carbon consist of the D peak that represents the defects in the sample and the G peak arises due to the doubly degenerate E2g mode and represents the extent of graphitization of the surface [35]. The Raman spectra of AS-BioC were similar to those previously reported [27] and constituted a D peak at around 1364 cm−1 and a G peak at 1595 cm−1 [36]. After the activation, the ratio of intensities of the D and G bands, termed as ID/IG ratio increased from 0.57 to 0.61. The rise in the defect density is related to the enhancement of functional groups on the surface based on FTIR analysis. Further, a shift in the peak positions to 1375 for the D band and 1573 for the G band was observed. In Figure 2d–i, a comparison between SPCE and A.AS-BioC/SPCE reveals a slight increase in the roughness of the surface, and in addition, the enrichment of the surface by the small bio charcoal 2D layers could be observed in comparison to the amorphous pattern featured for SPCE.
3.1.3. Electrochemical Characterization of AS-BioC Modified SPCE Electrodes
The electrochemical performance and interaction of the BioC with different ions are correlated with different aspects such as the degree of porosity, active sites, and surface areas of the surfaces. To characterize the electrochemical performance, CV and EIS measurements were obtained in a standard redox solution. Figure 3a shows the CV curves for the three surfaces and it is evident that the peak current rises with an increase in scan rate. A slight increase in the currents and a decrease in the peak potential differences were observed for A.AS-BioC/SPCE as compared to SPCE and AS-BioC/SPCE. Figure 3b shows the plot of peak currents obtained versus the root of scan rates. The peak currents for SPCE and AS-BioC/SPCE were almost identical as was the information obtained from FTIR, EDX, and Raman. The fitting of the data from Figure 3 reveals a linear increase in current with the root of scan rate (R2 value ~ 0.99) and thus infers the involvement of a diffusion-controlled mechanism. To assess the sensor’s electrochemically active area, the Randles-Sevcik equation for quasi reversible reactions is employed from [37]. Using the equation and the measured peak current from cyclic voltammetry experiments, the electrochemically active area of AS-A. BioC/SPCE sensor was estimated to be 1.26 cm² with an increase of 25% compared to bare SPCE and an increase of 17.24% compared to AS. BioC/SPCE sensor.
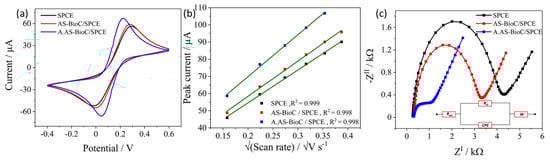
Figure 3.
(a) shows the CV curves for the three electrodes, (b) shows the plot of peak current versus root of scan rate, and (c) shows the EIS spectra of the three surfaces with inset showing the fitted equivalent circuit.
EIS spectra provided more significant changes due to their ability to provide comprehensive details about the surface at different frequencies. As can be seen from Figure 3c, the EIS spectra for A.AS-BioC/SPCE had a very small semicircular region that resembled the transfer resistance of the electrode. To obtain quantitative information, the obtained spectra were fitted with a Randel’s circuit comprising of the solution resistance (Rsol), charge transfer resistance (Rct), constant phase element (CPE) modeling the electrode-electrolyte interface, and Warburg element (W) that corresponds to the diffusion. The Rct values decreased from 3738 to 2792 ohms for AS-BioC/SPCE and to a very small value of 695 ohms for AS-A. BioC/SPCE electrodes. The reduction in Rct suggests the high electron transfer capability of electrochemically activated BioC. Further, the exponent value of CPE which denotes the heterogeneity of the surface was particularly very high for bare SPCE at 0.955 and an almost similar value was quantified for AS-BioC/SPCE (0.951). However, the exponent value reduces drastically to 0.705 for A.AS-BioC/SPCE which conveys the higher heterogeneity caused by the addition of functional groups on the surface.
To conclude, electrochemical cycling in acidic media led to enhancement in the functional groups of AS-BioC as confirmed through Raman spectroscopy and FTIR, enhanced the pore density as seen from SEM images, and also improved the conductivity of the surface confirmed by electrochemical characterization.
3.2. Optimization of pH and Electrochemical Response of SPCE, AS-BioC/SPCE and AS-A. BioC/SPCE
After the morphological and electrochemical characterization, the next step involved investigating the performance of A.AS-BioC/SPCE towards nitrite and paraxon ethyl. Owing to the pH-dependent electrochemical reaction mechanism involved for both targets, SWV curves were recorded on the AS-A. BioC/SPCE electrode for nitrite and paraxon ethyl at different pH values as seen in Figure 4a and Figure 4b, respectively. In the case of nitrite, pH 4 was identified to provide the highest oxidative currents as seen in and a further increase in pH leads to a reduction in currents. Similar behavior had already been reported previously in the literature [38,39]. At pH lower than 4, nitrite ions are relatively unstable and tend to decompose according to the following reaction [40]
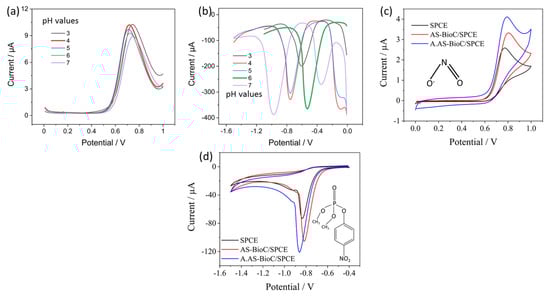
Figure 4.
pH optimization for (a) nitrite, (b) paraxon ethyl, (c,d) shows the electrochemical response of SPCE, AS-BioC/SPCE, and A.AS-BioC/SPCE towards nitrite and paraxon ethyl, respectively, by cyclic voltammetry.
However, at a pH greater than 4, due to the shortage of protons, the oxidation of nitrite becomes difficult and thus the currents are reduced. On the other hand, pH 6 provided the optimal reduction currents at lower negative potentials for paraxon ethyl. One important aspect to highlight is that an initial preconcentration step at open circuit potential for 100 s was carried out on the electrode for paraxon ethyl solution before the reduction. As can be seen from Figure 4b, the currents in the acidic media are lower and the peak currents for pH 7 were slightly higher by around 5 µA compared to pH 6. Previous reports have also obtained pH 7 as the best pH for supporting electrolytes [41]. However, in this work, pH 6 was selected for further investigation, due to the possibility of reducing paraxon ethyl at lower negative potentials than at pH 7. pH studies above 7 were not conducted as the existing reports suggest the decomposition of OPs in alkaline media [42]. Further, the two distinct peaks observed at pH 4, 5 and 7 could be attributed to the extent of protonation and stability of the intermediate formed. At mildly acidic pH values, the protonation degree is sufficient to induce two different peaks wherein the peak at lower negative potential is related to the conversion of nitro to nitroso groups and at high potentials is related to the conversion of nitroso to hydroxylamine. However, at pH 7, although there is no protonation, the media provides the required stability for the intermediate compound resulting in two distinct peaks. After the selection of the best pH for the detection of both the target analytes, the electrochemical response and thereby the catalytic activity provided by A.AS-BioC/SPCE towards the oxidation and reduction of 100 µM of nitrite and 100 nM of paraxon ethyl, respectively, was investigated. From Figure 4c,d, it is evident that the activation of the BioC significantly enhanced the performance towards the oxidation of nitrite and reduction in paraxon ethyl. The performance of AS-BioC/SPCE was slightly better than bare SPCE for both targets. Overall, the results suggest that the electrochemical activation of BioC enhanced the catalytic activity of the electrode towards the target ions.
3.3. Catalytic Activity of AS-A. BioC/SPCE towards Nitrite and Paraxon Ethyl
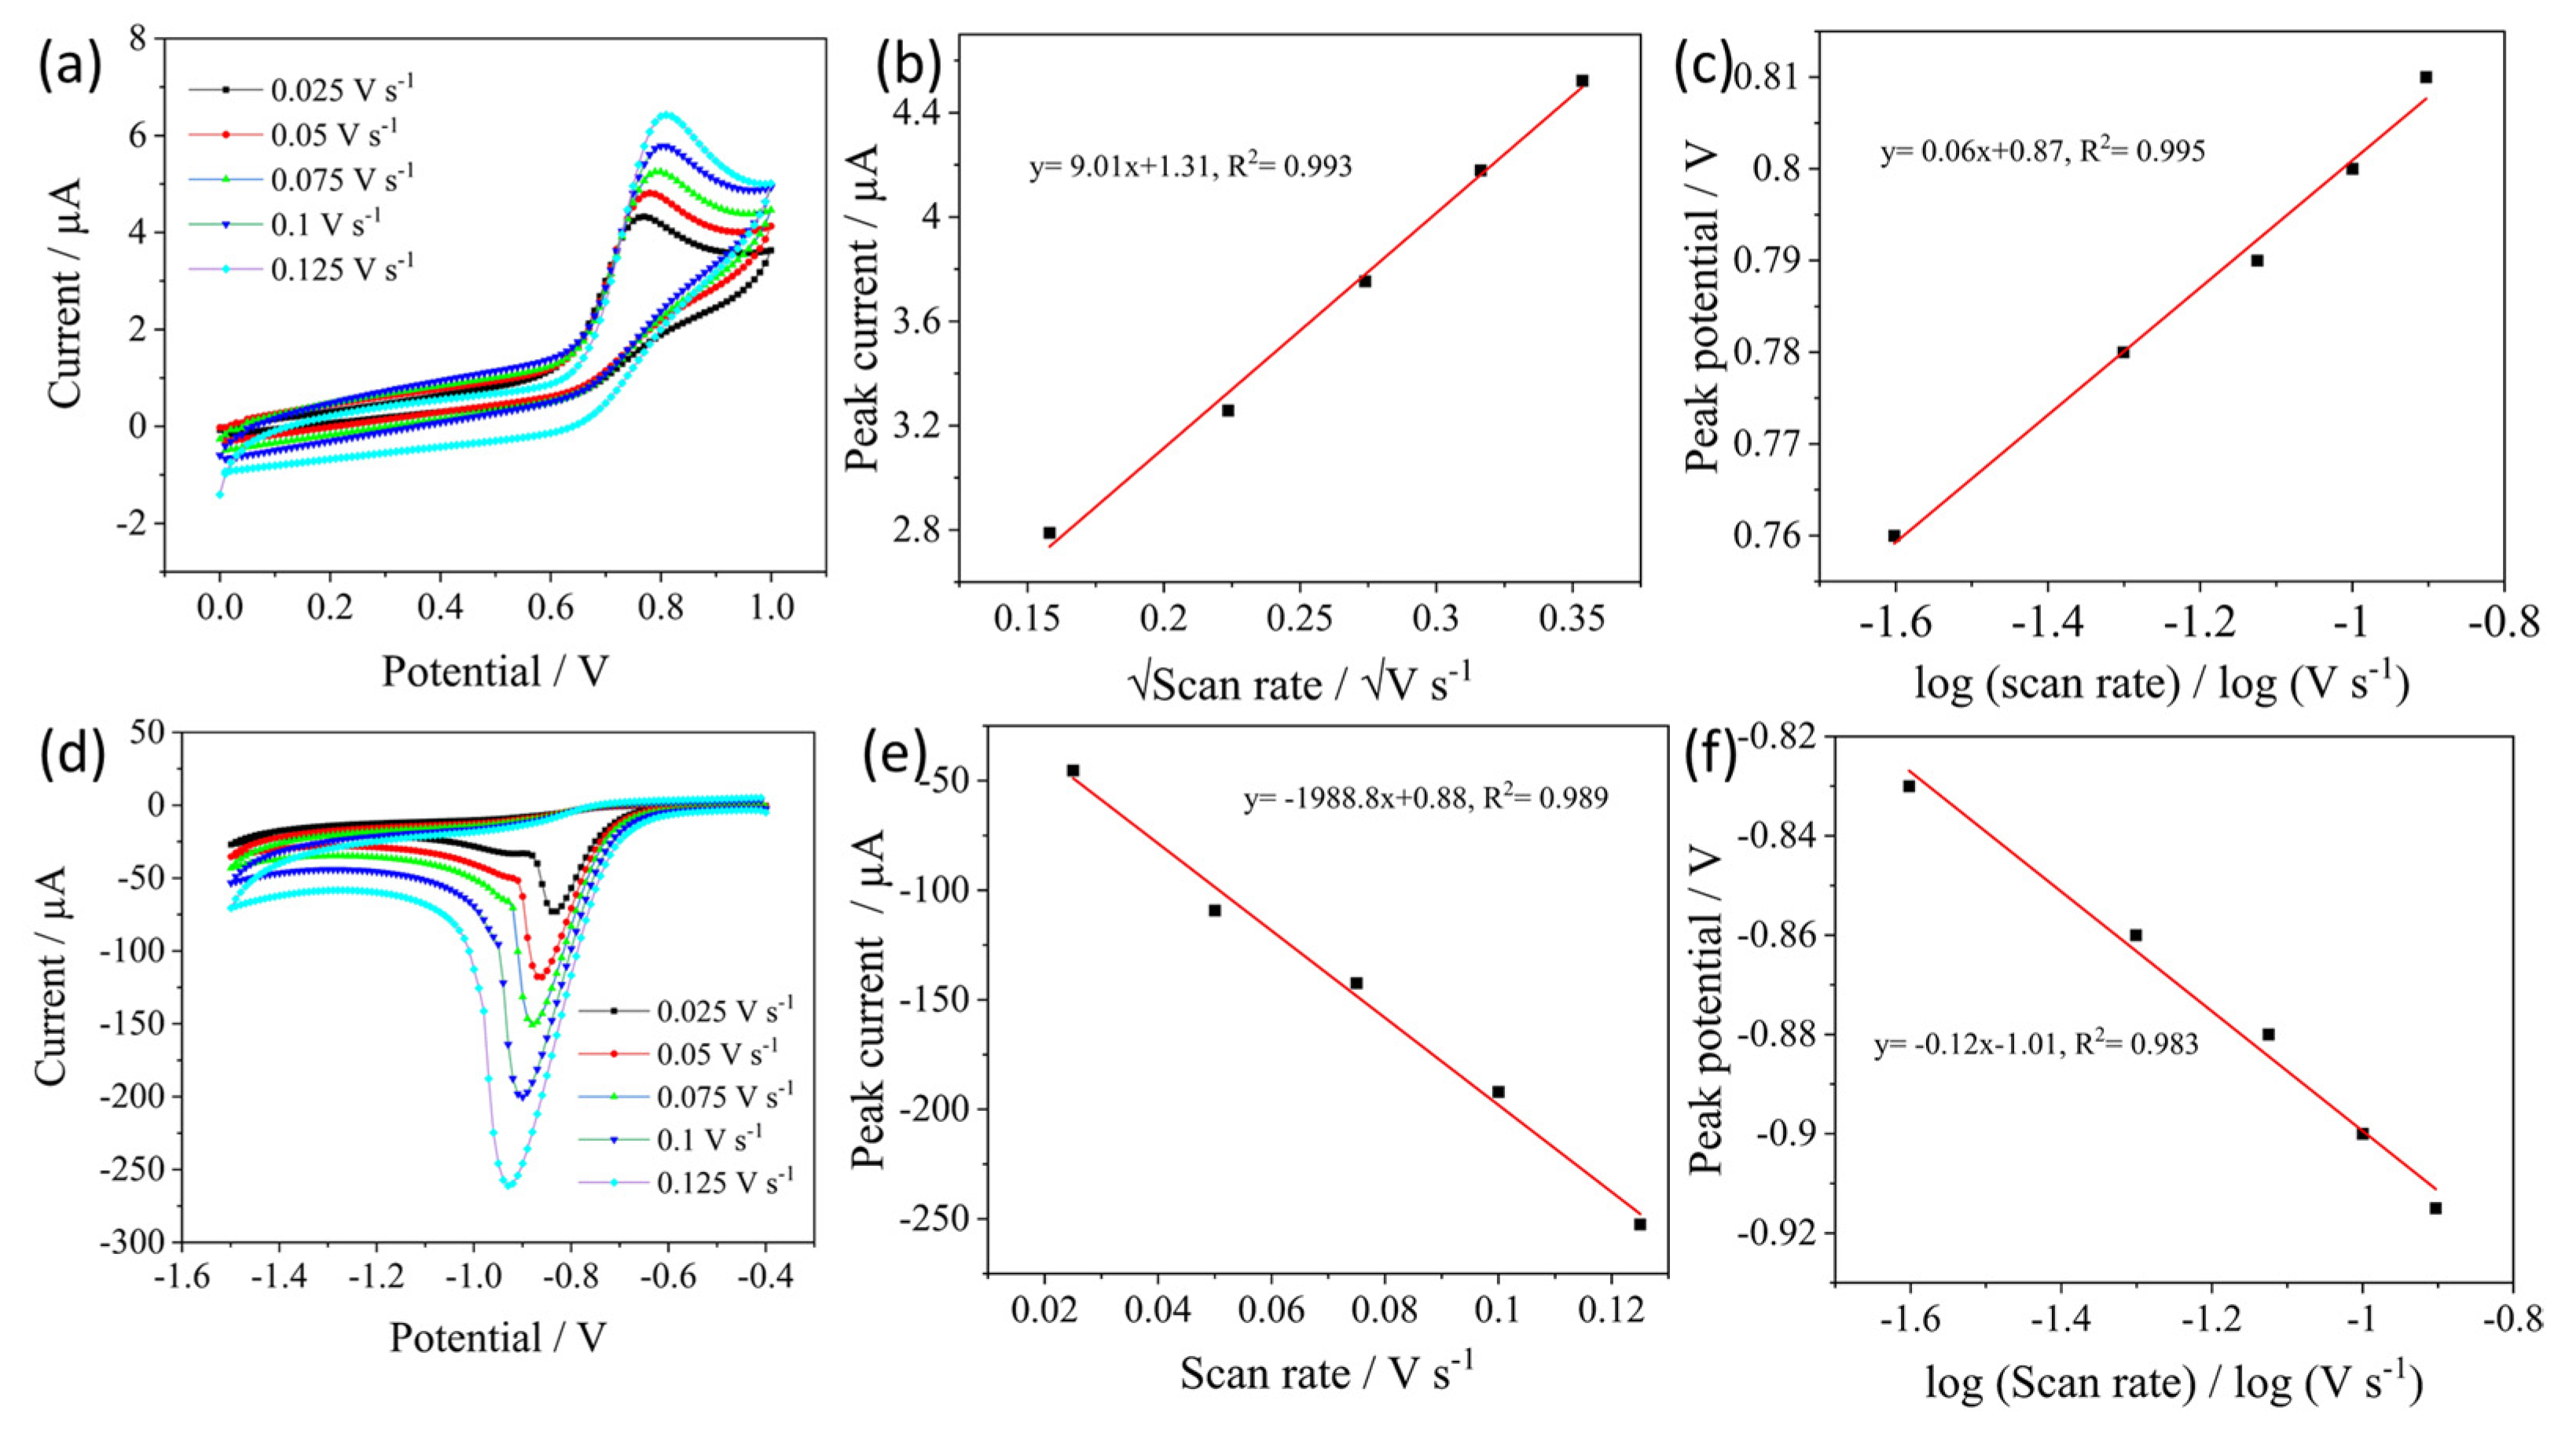
Prior to the detection, to explore the reaction mechanism and behavior of the A.AS-BioC/SPCE electrode towards the contaminants, CV under different scan rates was recorded. Figure 5a displays the CV profile of A.AS-BioC/SPCE towards oxidation of nitrite from 0.025 to 0.125 V s−1 and Figure 5d shows the profile for a reduction in paraxon ethyl. For both cases peak current escalates with an increase in scan rate and a shift of peak potential to higher values was observed. The oxidation of nitrite at pH 4 involves typically a one-electron process as displayed in Equations (2) and (3) [38].
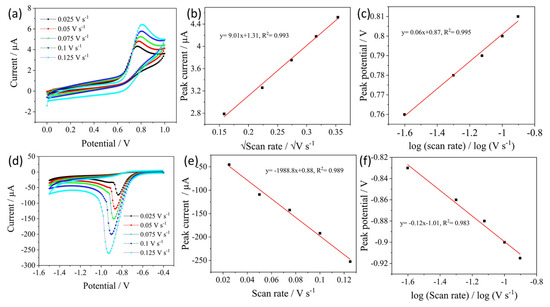
Figure 5.
(a) CV curves of electro-oxidation of nitrite at different scan rates on A.AS-BioC/SPCE electrode, (b,c) the plot of the root of scan rate versus peak current from CV and plot of the log of scan rate versus peak potential from CV, respectively, (d) shows the CV behavior of the reduction in paraxon ethyl at different scan rates and (e,f) plot of root of scan rate versus peak current from CV and plot of log of scan rate versus peak potential from CV, respectively.
To investigate the controlling step of the electrode reaction, the plot of peak current versus the root of scan rate in Figure 5b shows a good linear relationship with an R2 value of 0.993, suggesting a diffusion-controlled mechanism involved in the electro-oxidation of nitrite. In the case of paraxon ethyl, the reduction peak at around −0.9 V was observed with similar behavior to other works [41,43] with its intensity increasing with an increase in the scan rate.
The reduction peak is linked to the direct four-electron and four-proton reduction in paraxon ethyl to phenylhydroxylamine as shown below in Scheme 1.
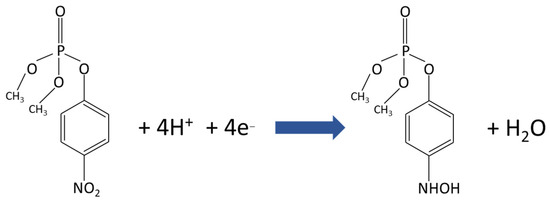
Scheme 1.
Electrochemical reduction in paraxon ethyl by four electron transfer on A.AS-BioC/SPCE electrode.
Nevertheless, unlike nitrite, in which the dominant process was diffusion, for paraxon ethyl, the reaction determining step was adsorption as the plot of peak current versus the scan rate was obtained to be linear with an R2 value of 0.989 as displayed in Figure 5e. To quantify the electron transfer coefficient for both the contaminants, changes in the peak potential as a function of the log of scan rate are displayed for nitrite (Figure 5c) and paraxon ethyl (Figure 5f) and the corresponding regression Equations (4) and (5) are shown below.
By using the Laviron equation [41,44,45], which describes the relation between the peak potential of the reaction and scan rate in cyclic voltammetry, the electrode kinetic parameters, and charge transfer coefficient can be determined through Equations (6)–(8). In the equations, R is the gas constant (8.135 J K−1 mol−1), T is the temperature in K, and F is the faradays constant (9.68 × 10⁴ C mol−1), α is the transfer coefficient n is the number of electrons transferred, E0 is the formal potential, Ecathodic and Eanodic as the name represents are the cathodic and anodic peak potentials (V), respectively, υ is the scan rate (V s−1) and k is the rate constant.
From the above equations, the charge transfer coefficient (α) value for nitrite and paraxon ethyl was quantified to be 0.483 and 0.562, respectively.
3.4. Electrochemical Detection and Selectivity Studies
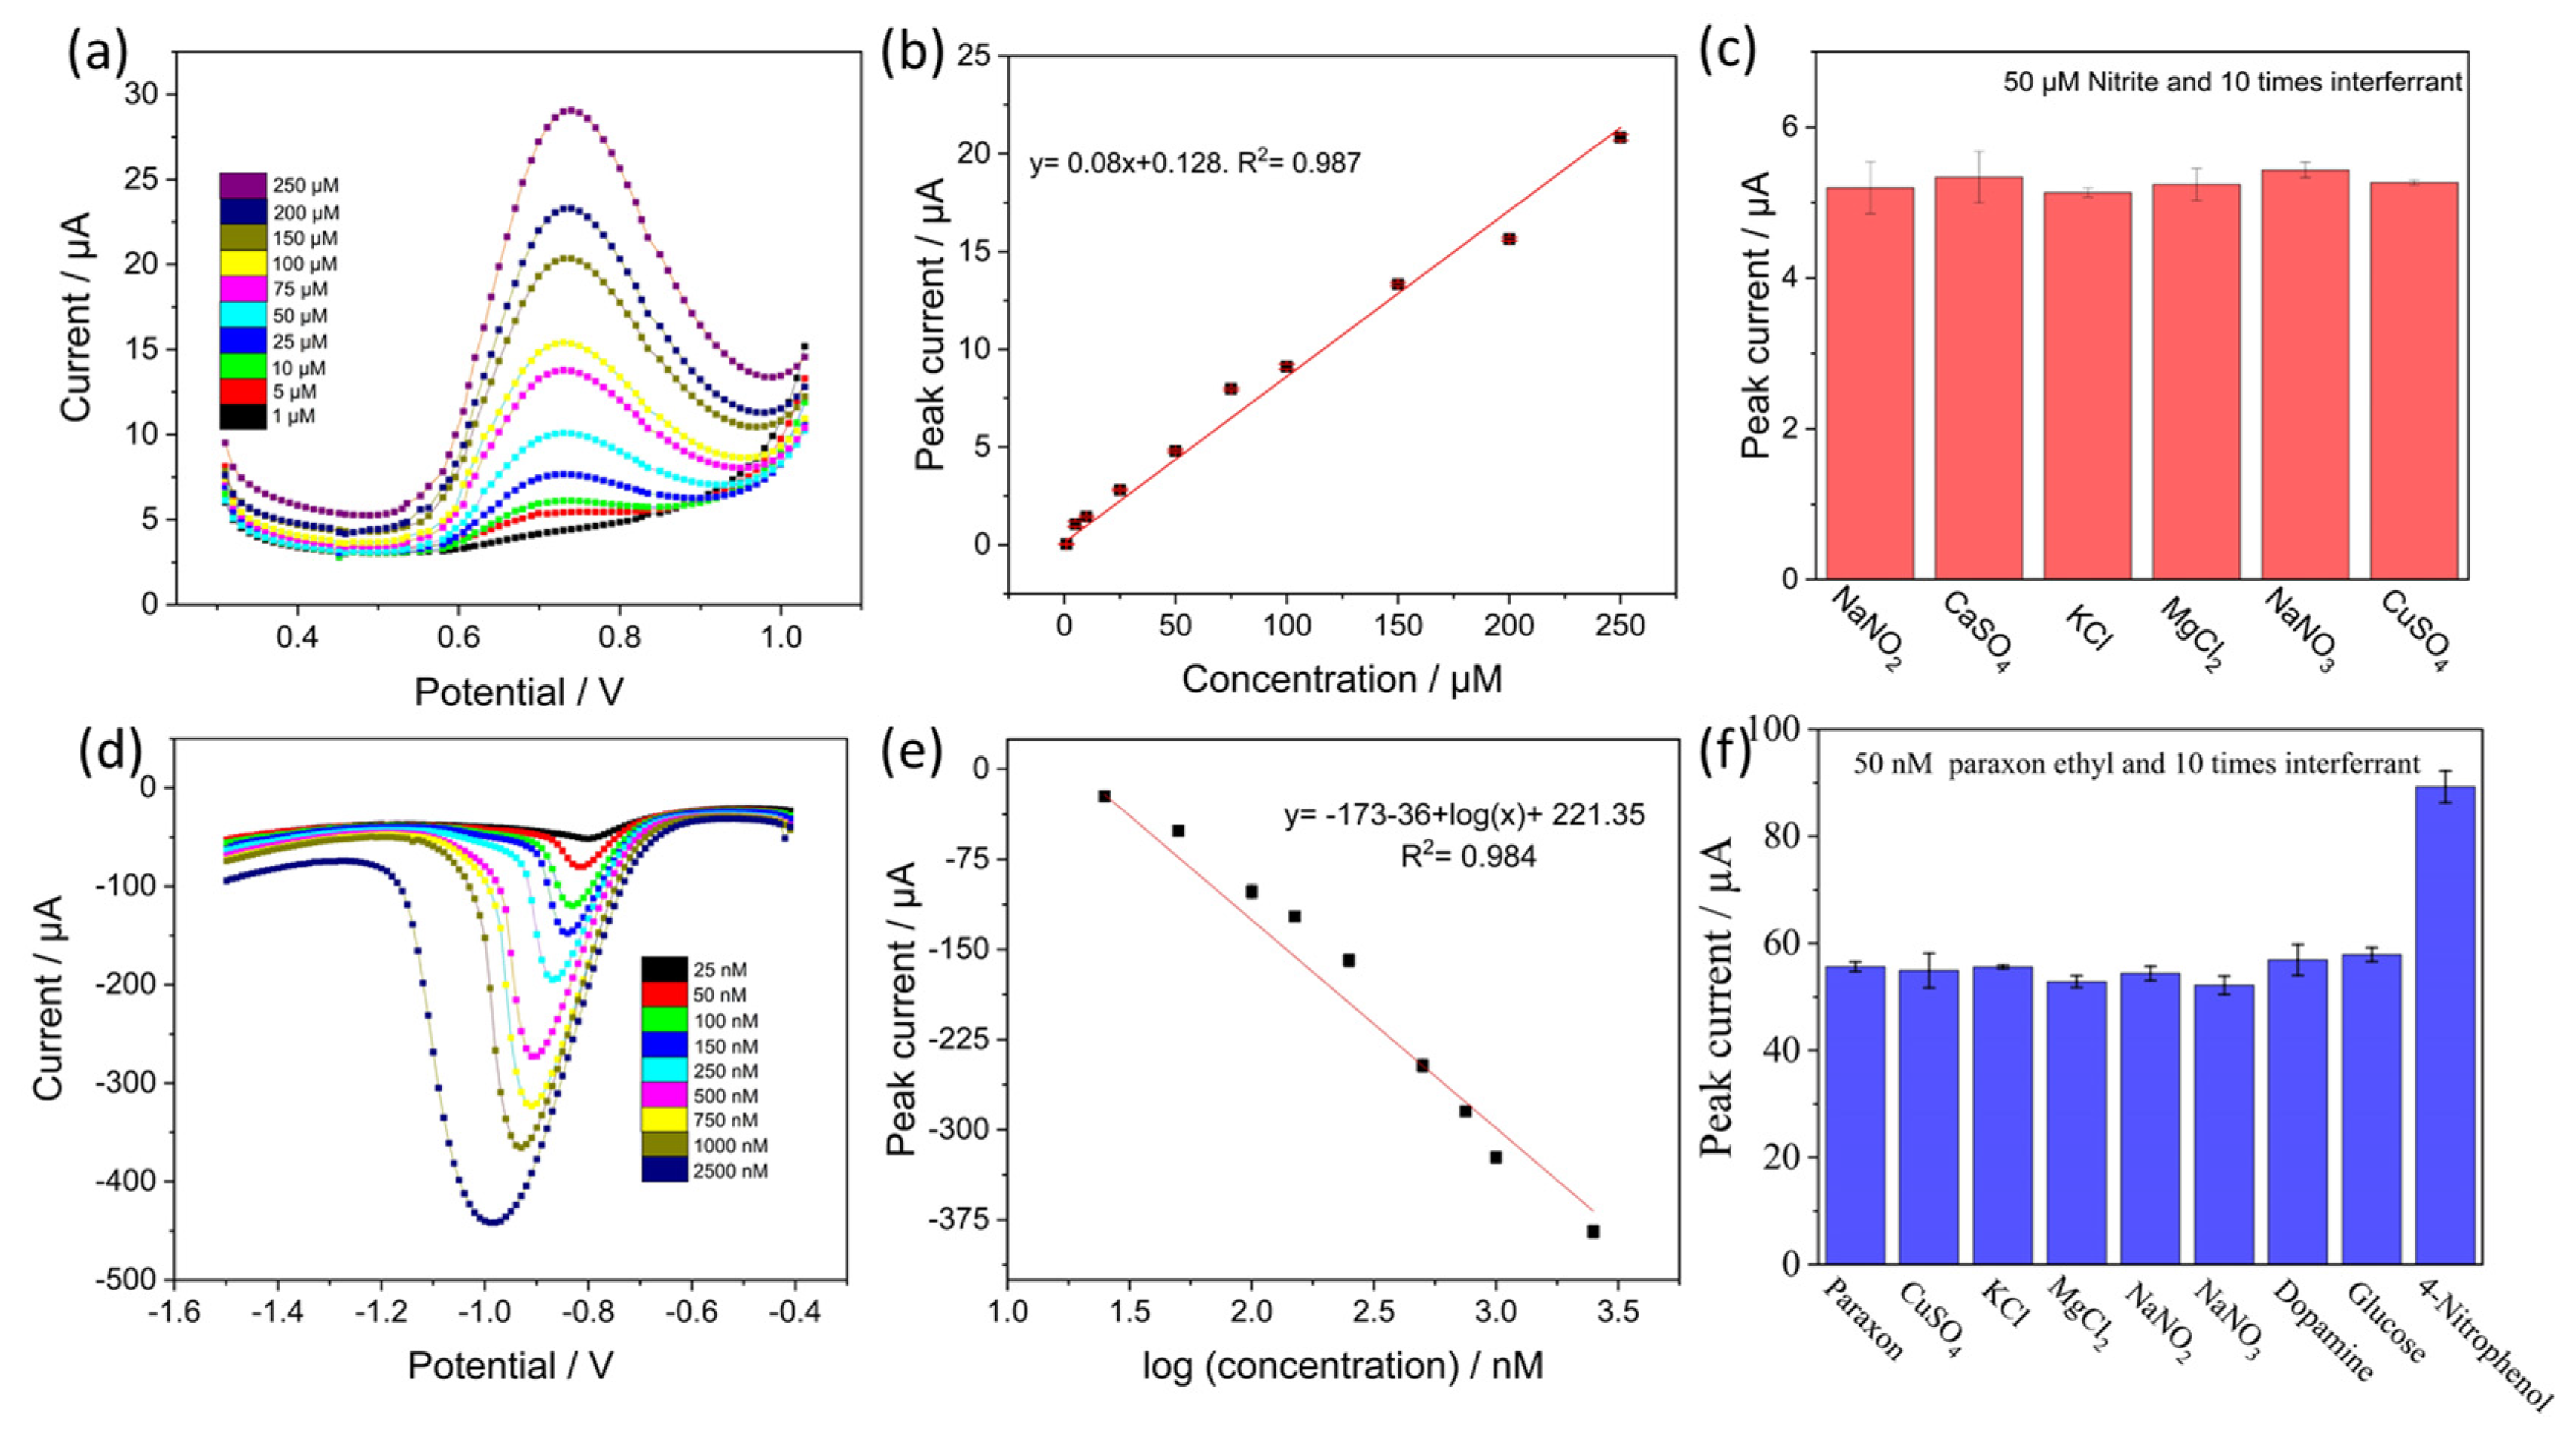
The electrochemical detection of nitrite and paraxon ethyl was carried out by square wave voltammetry at a frequency of 10 Hz and the solution pH of 4 for nitrite and 6 for paraxon ethyl and each concentration was measured in triplicate. In the case of nitrite, the optimal potential range was selected from 0.35 to 1 V. Figure 6a shows the curves of SWV with increasing concentrations of nitrite from 1 to 250 µM. As evident, the peak currents increase with a rise in concentrations. Figure 6b, displays the calibration curve plotted as peak current versus the concentration of nitrite. The linear regression equation shown within the plot shows good fitting with an R2 value of 0.987.

Figure 6.
(a) Electrochemical detection of nitrite by SWV at a frequency of 0 Hz from 1 to 250 µM, (b) shows the calibration curve with linear regression equation, (c) selectivity studies of A.AS-BioC/SPCE towards nitrite (50 µM) with 10 times the concentration of interferants mentioned in the plot, (d) electrochemical detection of paraxon ethyl by SWV from 25 to 2500 nm, (e) calibration curve with a log of concentration and linear regression equation, and (f) depicts the selectivity investigations of the electrode towards paraxon ethyl (50 nM) in the presence of ten times the interferant concentration.
In the detection of paraxon ethyl, an initial preconcentration step for 100 s was applied before the detection. Figure 6d shows the corresponding voltammograms for the detection of paraxon ethyl from 25 nM to 2500 nM. The reduction peak increases and shifts to a higher negative potential with an increase in concentration. The shift in the peak potential could be related to the adsorption mechanism involved in the reduction in paraxon ethyl on the surface. Also, limitations occurring due to mass transport could be related to the shift in peak potential. Further, the electrochemical detection of pesticides such as paraxon ethyl is based on adsorption phenomena as discussed earlier, the calibration curves previously have mostly been shown with two linear ranges, one at low concentrations and the other at higher. Herein, to circumvent the idea of two linear ranges and two different linear regression equations, instead of concentration, the logarithm of concentration was plotted versus the peak currents that allowed for fitting the entire concentration range by a single linear regression equation displayed in Figure 6e with R2 value of 0.984. First observations of the magnitude of currents achieved from both the contaminants reveal the favorability of the A.AS-BioC/SPCE surfaces for adsorption-based processes as higher currents are obtained due to the abundance of functional groups. Nevertheless, the lack of a similar preconcentration step for the detection of nitrite is one of the factors that could be decisive in the magnitude of peak currents. Based on the obtained calibration curves, the limit of detection was calculated from the below Equation (9) [46]
LOD stands for limit of detection, Sb is the standard deviation of the blank sample and m is the slope of the calibration curve. Based on the above equation, the quantified LOD is 0.375 µM for nitrite and 1.63 nM for paraxon ethyl with a linear range from 1 to 250 µM for nitrite and 25 to 2500 nM for paraxon ethyl. Additionally, the sensitivity is 0.08 µA/µM and 17.3 µA/nM for nitrite and paraxon ethyl, respectively.
The selectivity of AS-A. BioC/SPCE towards both the contaminants was investigated with 50 µM nitrite, 50 nM paraxon ethyl and the concentration of interferant was 10 times the target concentration. The most common inorganic interferants were selected for the study. Figure 6c,f show the bar graph of the peak current obtained for nitrite and paraxon ethyl, respectively, in the presence of different interferants. All the readings were recorded in triplicate and are plotted with appropriate standard deviations. As can be seen, the electrode was highly selective for both the contaminants within their respective potential range with minimal interference from the ions even at ten times the concentration. In the case of paraxon ethyl, the interference analysis was further performed in the presence of dopamine, glucose and 4-Nitrophenol. In the presence of dopamine and glucose, the electrode was selective towards paraxon ethyl. However, in the presence of 4-Nitrophenol, higher currents were recorded as can be seen in Figure 6f. The reason could be related to the presence of nitro group in 4-nitrophenol which also becomes reduced at the same potential and thereby intensifies the peak current.
Table 1 and Table 2 show a detailed comparison of the achieved LOD and linear range with previous works for the detection of nitrite and paraxon ethyl, respectively. BioCharcoal, prepared by different methods was only used for detecting nitrite. Hence, Table 1 corresponding to nitrite shows only papers related to biocharcoal, and Table 2 for paraxon ethyl is not restricted to any particular aspect. The results reported from the previous literature on nitrite and paraxon ethyl, although used multiple materials based on glassy carbon electrodes, the LOD and linear range were not superior or like the A.AS-BioC/SPCE electrode properties were achieved through this work. A few papers that used BioC for the detection of nitrite such as in [47,48,49,50] use complicated methods such as microwave synthesis, and chemical activation by phosphoric acids for long durations at elevated temperatures to activate the material. This highlights the advantages of the electrochemical method proposed here in this paper for the activation without compromising on the sensing properties.

Table 1.
LOD, sensitivity and linear range obtained for electrochemical detection of nitrite by different modified electrodes.
Table 2.
LOD, sensitivity and linear range for electrochemical detection of paraxon ethyl by different modified electrodes from literature.
3.5. Reproducibility, Stability and Real Sample Analysis
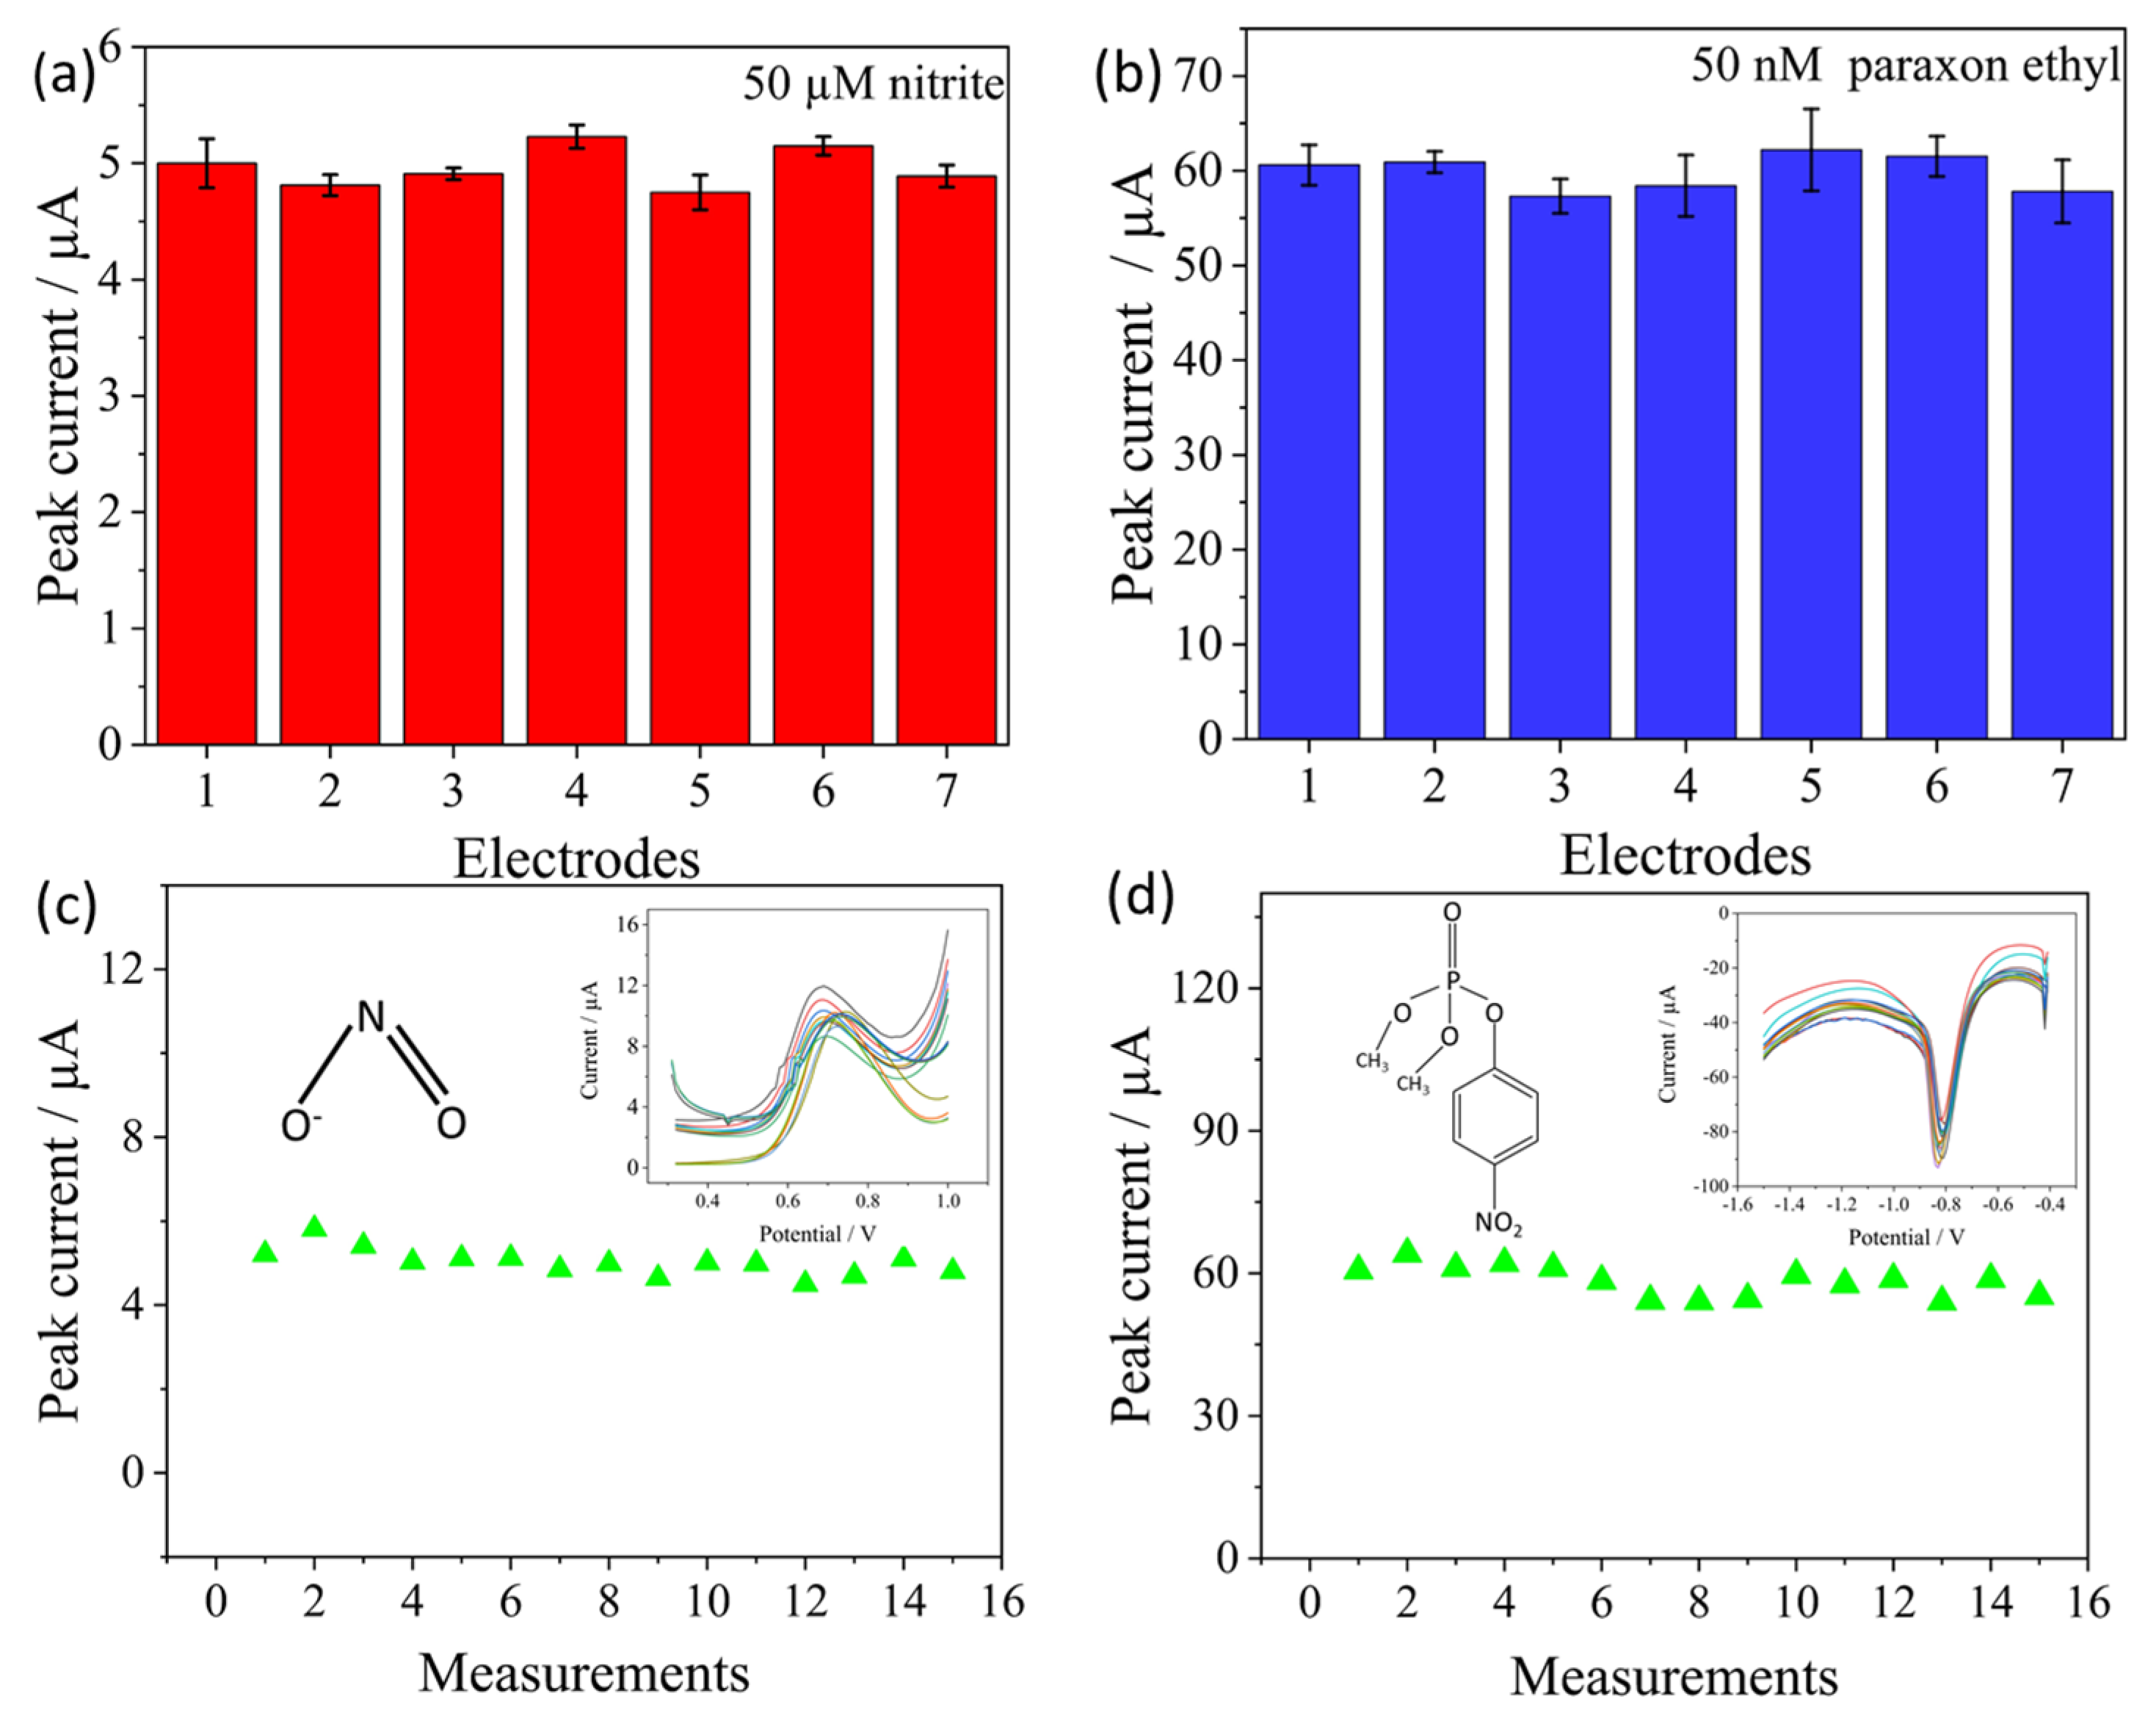
Reproducibility in the response of the electrochemical sensor is one of the important aspects to investigate in order to validate the reliability of the fabrication procedure and the material used. In this regard, Figure 7a,b shows the reproducibility characteristics of the proposed sensor in this work. The investigation involved the fabrication of 7 different A.AS-BioC/SPCE electrodes under similar conditions and by testing the response of individual electrodes towards 50 µM concentration of nitrite and 50 nM concentration of paraxon ethyl. As can be seen from Figure 7a,b, the developed sensor showed good reproducibility towards the detection of both the contaminants with relative standard error of the error percentage was less than 10% for both the contaminants and thus indicates good reproducibility and reliability of the fabrication procedure.

Figure 7.
(a,b) shows the reproducibility of A.AS-BioC/SPCE electrode towards 50 µM nitrite and 50 nM paraxon ethyl, respectively, (c,d) shows the stability of electrode towards the nitrite and paraxon ethyl, respectively, and inset shows the corresponding SWV curves.
In the case of stability, a single electrode for each of the targets was developed and 15 successive measurements were performed on the same electrode. The concentrations of each of the contaminants were the same as those selected for reproducibility analysis. Before every measurement, the electrode was washed with distilled water and dried in an ambient atmosphere. Figure 7c,d shows the stability characteristics of the developed sensor towards both the contaminants and the inset shows the corresponding curves recorded for each measurement. As can be seen from the inset, although, a shift in baseline of the recorded curves was observed, the effect on the peak current intensities was minimal with measurements. The sensor was quite stable with deviations in measurements less than 12% for both the contaminants.
The analytical capability of the electrode was tested by evaluating its performance in the detection of nitrite and paraxon ethyl in ground water. The Ground water samples were provided by Landesamt für Umwelt, Landwirtschaft und Geologie (LfULG), Saxony, Germany. The pH of the samples was optimized to 5 for nitrite and 6 for paraxon ethyl and 50 µM concentration of nitrite and 50 nM of paraxon ethyl was spiked in the samples. Table 3 shows the recovery characteristics of the electrode. As can be seen, a good recovery within the range of 95 to 110% was achieved for both contaminants which indicates the good analytical capability of the sensor in real matrices such as ground water.
Table 3.
Quantification of practical analytical capability of electrode in ground water samples.
4. Conclusions
In this work, a novel and simple technique to enhance the oxygen functional groups on the surface of BioC derived from almond shells was proposed. Initial characterization of BioC on silicon revealed flake sizes of a few nm to around 20 nm and the presence of small quantities of oxygen groups on the surface. The technique based on electrochemical cycling on the BioC-modified electrode in an acidic buffer solution significantly enhances the C-O groups and also the conductivity. This hypothesis was confirmed through an increase in the porosity through SEM, an increase in oxygen content through EDX spectroscopy analysis and changes in the FTIR spectra observed after activation, and an increase in defect density through Raman spectroscopy. These results confirm the successful improvement in the density of functional groups on the activated BioC without using any harsh chemicals, higher temperatures, and complicated setups. The electrochemical behavior investigated through CV and EIS reveals an increase in the electron transfer capability compared to bare SPCE and non-activated AS-BioC/SPCE as the peak current rises in CV and reduction in charge transfer resistance. The reduction in exponent value in EIS for the activated electrode is related to a rise in inhomogeneity and roughness of the surface mostly due to the functional groups on the surface. The A.AS-BioC/SPCE electrode showcased enhanced sensing properties for both contaminants as compared to non-activated electrodes and thereby a very low LOD and good linear range were attained as compared to previous reports. In addition, the developed sensor had good reproducibility and the capability of detecting the targets in real matrices such as ground water. The research serves as a proof of concept to use electrochemical methods as a cost-effective strategy to enhance the functional groups and conductivity of biocharcoal instead of complex chemical and physical activation methods.
Author Contributions
Conceptualization, O.K., K.H., A.A. and A.B.; methodology, A.A., A.B. and T.L.; software, A.A., Y.Z., L.W. and A.J.; validation, A.A., A.B., L.W. and T.L.; formal analysis, A.A., A.B., A.A.-H. and T.L.; investigation, A.A., A.B., Y.Z., A.A.-H., T.L. and L.W.; resources and AS-BioC preparation, O.K., C.T. and K.H.; data curation, A.B. and T.L.; writing—original draft preparation, A.A., A.B. and A.A.-H.; writing—review and editing, O.K., C.T. and K.H.; visualization, A.A., T.L. and A.A.-H.; supervision, A.A., A.B., T.L. and O.K.; project administration, O.K. and K.H.; funding acquisition, A.A.-H. and O.K. All authors have read and agreed to the published version of the manuscript.
Funding
A.A., A.A.-H. and O.K. acknowledge that “This research was funded by Deutsche Forschungsgemeinschaft within the projects ‘Dualsens’ and “Photosens” with grant numbers “KA 1663/13-1” and “KA1663/12” respectively.
Data Availability Statement
The data will be provided by the corresponding author upon considerable request.
Acknowledgments
The authors would like to acknowledge Landesamt für Umwelt, Landwirtschaft und Geologie (LfULG), Saxony, Germany for providing ground water samples for invstigation.
Conflicts of Interest
The authors declare no conflict of interest.
References
- Hassan, M.H.; Khan, R.; Andreescu, S. Advances in electrochemical detection methods for measuring contaminants of emerging concerns. Electrochem. Sci. Adv. 2022, 2, e2100184. [Google Scholar] [CrossRef]
- Kanoun, O.; Lazarević-Pašti, T.; Pašti, I.; Nasraoui, S.; Talbi, M.; Brahem, A.; Adiraju, A.; Sheremet, E.; Rodriguez, R.D.; Ben Ali, M.; et al. A Review of Nanocomposite-Modified Electrochemical Sensors for Water Quality Monitoring. Sensors 2021, 21, 4131. [Google Scholar] [CrossRef] [PubMed]
- Li, M.; Li, Y.-T.; Li, D.-W.; Long, Y.-T. Recent developments and applications of screen-printed electrodes in environmental assays—A review. Anal. Chim. Acta 2012, 734, 31–44. [Google Scholar] [CrossRef] [PubMed]
- Hui, T.S.; Zaini, M.A.A. Potassium hydroxide activation of activated carbon: A commentary. Carbon Lett. 2015, 16, 275–280. [Google Scholar] [CrossRef]
- Kambo, H.S.; Dutta, A. A comparative review of biochar and hydrochar in terms of production, physico-chemical properties and applications. Renew. Sustain. Energy Rev. 2015, 45, 359–378. [Google Scholar] [CrossRef]
- Liu, W.-J.; Jiang, H.; Yu, H.-Q. Development of Biochar-Based Functional Materials: Toward a Sustainable Platform Carbon Material. Chem. Rev. 2015, 115, 12251–12285. [Google Scholar] [CrossRef] [PubMed]
- Yorgun, S.; Vural, N.; Demiral, H. Preparation of high-surface area activated carbons from Paulownia wood by ZnCl2 activation. Microporous Mesoporous Mater. 2009, 122, 189–194. [Google Scholar] [CrossRef]
- Sakhiya, A.K.; Anand, A.; Kaushal, P. Production, activation, and applications of biochar in recent times. Biochar 2020, 2, 253–285. [Google Scholar] [CrossRef]
- Angın, D.; Altintig, E.; Köse, T.E. Influence of process parameters on the surface and chemical properties of activated carbon obtained from biochar by chemical activation. Bioresour. Technol. 2013, 148, 542–549. [Google Scholar] [CrossRef]
- Jin, H.; Capareda, S.; Chang, Z.; Gao, J.; Xu, Y.; Zhang, J. Biochar pyrolytically produced from municipal solid wastes for aqueous As(V) removal: Adsorption property and its improvement with KOH activation. Bioresour. Technol. 2014, 169, 622–629. [Google Scholar] [CrossRef]
- Kalinke, C.; Oliveira, P.R.; Oliveira, G.A.; Mangrich, A.S.; Marcolino-Junior, L.H.; Bergamini, M.F. Activated biochar: Preparation, characterization and electroanalytical application in an alternative strategy of nickel determination. Anal. Chim. Acta 2017, 983, 103–111. [Google Scholar] [CrossRef] [PubMed]
- Jiang, J.; Zhang, L.; Wang, X.; Holm, N.; Rajagopalan, K.; Chen, F.; Ma, S. Highly ordered macroporous woody biochar with ultra-high carbon content as supercapacitor electrodes. Electrochim. Acta 2013, 113, 481–489. [Google Scholar] [CrossRef]
- Zhang, H.; Wang, T.; Sui, Z.; Zhang, Y.; Norris, P.; Sun, B.; Pan, W.-P. Plasma Induced Addition of Active Functional Groups to Biochar for Elemental Mercury Removal. Plasma Chem. Plasma Process. 2019, 39, 1449–1468. [Google Scholar] [CrossRef]
- Lalander, C.; Dalahmeh, S.; Jönsson, H.; Vinnerås, B. Hygienic quality of artificial greywater subjected to aerobic treatment: A comparison of three filter media at increasing organic loading rates. Environ. Technol. 2013, 34, 2657–2662. [Google Scholar] [CrossRef] [PubMed]
- Creamer, A.E.; Gao, B.; Wang, S. Carbon dioxide capture using various metal oxyhydroxide–biochar composites. Chem. Eng. J. 2016, 283, 826–832. [Google Scholar] [CrossRef]
- Li, M.; Zheng, Y.; Chen, Y.; Zhu, X. Biodiesel production from waste cooking oil using a heterogeneous catalyst from pyrolyzed rice husk. Bioresour. Technol. 2014, 154, 345–348. [Google Scholar] [CrossRef] [PubMed]
- Ahmad, Z.; Gao, B.; Mosa, A.; Yu, H.; Yin, X.; Bashir, A.; Ghoveisi, H.; Wang, S. Removal of Cu(II), Cd(II) and Pb(II) ions from aqueous solutions by biochars derived from potassium-rich biomass. J. Clean. Prod. 2018, 180, 437–449. [Google Scholar] [CrossRef]
- Ramesh, T.; Rajalakshmi, N.; Dhathathreyan, K.S. Activated carbons derived from tamarind seeds for hydrogen storage. J. Energy Storage 2015, 4, 89–95. [Google Scholar] [CrossRef]
- Kalinke, C.; de Oliveira, P.R.; Bonacin, J.A.; Janegitz, B.C.; Mangrich, A.S.; Marcolino-Junior, L.H.; Bergamini, M.F. State-of-the-art and perspectives in the use of biochar for electrochemical and electroanalytical applications. Green Chem. 2021, 23, 5272–5301. [Google Scholar] [CrossRef]
- Li, Y.; Xu, R.; Wang, H.; Xu, W.; Tian, L.; Huang, J.; Liang, C.; Zhang, Y. Recent Advances of Biochar-Based Electrochemical Sensors and Biosensors. Biosensors 2022, 12, 377. [Google Scholar] [CrossRef]
- Chingombe, P.; Saha, B.; Wakeman, R.J. Surface modification and characterisation of a coal-based activated carbon. Carbon 2005, 43, 3132–3143. [Google Scholar] [CrossRef]
- Wu, R.; Ye, Q.; Wu, K.; Wang, L.; Dai, H. Highly efficient CO2 adsorption of corn kernel-derived porous carbon with abundant oxygen functional groups. J. CO2 Util. 2021, 51, 101620. [Google Scholar] [CrossRef]
- Kim, J.-G.; Kim, H.-B.; Baek, K. Novel electrochemical method to activate biochar derived from spent coffee grounds for enhanced adsorption of lead (Pb). Sci. Total Environ. 2023, 886, 163891. [Google Scholar] [CrossRef]
- Soliman, M.; Eldyasti, A. Ammonia-Oxidizing Bacteria (AOB): Opportunities and applications—A review. Rev. Environ. Sci. Biotechnol. 2018, 17, 285–321. [Google Scholar] [CrossRef]
- Brahem, A.; Al-Hamry, A.; Gross, M.A.; Paterno, L.G.; Ali, M.B.; Kanoun, O. Stability Enhancement of Laser-Scribed Reduced Graphene Oxide Electrodes Functionalized by Iron Oxide/Reduced Graphene Oxide Nanocomposites for Nitrite Sensors. J. Compos. Sci. 2022, 6, 221. [Google Scholar] [CrossRef]
- Xiao, B. Electrochemical sensor based on Bimetallic phosphosulfide Zn–Ni–P–S Nanocomposite-reduced graphene oxide for determination of Paraoxon Ethyl in agriculture wastewater. Int. J. Electrochem. Sci. 2022, 17, 220672. [Google Scholar] [CrossRef]
- Elleuch, A.; Boussetta, A.; Yu, J.; Halouani, K.; Li, Y. Experimental investigation of direct carbon fuel cell fueled by almond shell biochar: Part I. Physico-chemical characterization of the biochar fuel and cell performance examination. Int. J. Hydrogen Energy 2013, 38, 16590–16604. [Google Scholar] [CrossRef]
- Nečas, D.; Klapetek, P. Gwyddion: An open-source software for SPM data analysis. Open Phys. 2012, 10, 181–188. [Google Scholar] [CrossRef]
- Anurag, A.; Al-Hamry, A.; Attuluri, Y.; Palaniyappan, S.; Wagner, G.; Dentel, D.; Tegenkamp, C.; Kanoun, O. Optimized Reduction of a Graphene Oxide-MWCNT Composite with Electrochemically Deposited Copper Nanoparticles on Screen Printed Electrodes for a Wide Range of Detection of Nitrate. ChemElectroChem 2023, 10, e202200945. [Google Scholar] [CrossRef]
- Amin, F.R.; Huang, Y.; He, Y.; Zhang, R.; Liu, G.; Chen, C. Biochar applications and modern techniques for characterization. Clean Technol. Environ. Policy 2016, 18, 1457–1473. [Google Scholar] [CrossRef]
- Tran, H.N.; Lee, C.-K.; Vu, M.T.; Chao, H.-P. Removal of Copper, Lead, Methylene Green 5, and Acid Red 1 by Saccharide-Derived Spherical Biochar Prepared at Low Calcination Temperatures: Adsorption Kinetics, Isotherms, and Thermodynamics. Water Air Soil Pollut. 2017, 228, 401. [Google Scholar] [CrossRef]
- Deng, J.; Xiong, T.; Wang, H.; Zheng, A.; Wang, Y. Effects of Cellulose, Hemicellulose, and Lignin on the Structure and Morphology of Porous Carbons. ACS Sustain. Chem. Eng. 2016, 4, 3750–3756. [Google Scholar] [CrossRef]
- Siipola, V.; Tamminen, T.; Källi, A.; Lahti, R.; Romar, H.; Rasa, K.; Keskinen, R.; Hyväluoma, J.; Hannula, M.; Wikberg, H. Effects of biomass type, carbonization process, and activation method on the properties of bio-based activated carbons. BioResources 2018, 13, 5976–6002. [Google Scholar] [CrossRef]
- Reza, M.S.; Afroze, S.; Bakar, M.S.; Saidur, R.; Aslfattahi, N.; Taweekun, J.; Azad, A.K. Biochar characterization of invasive Pennisetum purpureum grass: Effect of pyrolysis temperature. Biochar 2020, 2, 239–251. [Google Scholar] [CrossRef]
- León, V.; Quintana, M.; Herrero, M.A.; Fierro, J.L.G.; de La Hoz, A.; Prato, M.; Vázquez, E. Few-layer graphenes from ball-milling of graphite with melamine. Chem. Commun. 2011, 47, 10936–10938. [Google Scholar] [CrossRef] [PubMed]
- Tagliaferro, A.; Rovere, M.; Padovano, E.; Bartoli, M.; Giorcelli, M. Introducing the Novel Mixed Gaussian-Lorentzian Lineshape in the Analysis of the Raman Signal of Biochar. Nanomaterials 2020, 10, 1748. [Google Scholar] [CrossRef] [PubMed]
- González-Meza, O.A.; Larios-Durán, E.R.; Gutiérrez-Becerra, A.; Casillas, N.; Escalante, J.I.; Bárcena-Soto, M. Development of a Randles-Ševčík-like equation to predict the peak current of cyclic voltammetry for solid metal hexacyanoferrates. J. Solid State Electrochem. 2019, 23, 3123–3133. [Google Scholar] [CrossRef]
- Pham, X.-H.; Li, C.A.; Han, K.N.; Huynh-Nguyen, B.-C.; Le, T.-H.; Ko, E.; Kim, J.H.; Seong, G.H. Electrochemical detection of nitrite using urchin-like palladium nanostructures on carbon nanotube thin film electrodes. Sens. Actuators B Chem. 2014, 193, 815–822. [Google Scholar] [CrossRef]
- Manikandan, V.S.; Durairaj, S.; Boateng, E.; Sidhureddy, B.; Chen, A. Electrochemical Detection of Nitrite Based on Co3O4-Au Nanocomposites for Food Quality Control. J. Electrochem. Soc. 2021, 168, 107505. [Google Scholar] [CrossRef]
- Brylev, O.; Sarrazin, M.; Roué, L.; Bélanger, D. Nitrate and nitrite electrocatalytic reduction on Rh-modified pyrolytic graphite electrodes. Electrochim. Acta 2007, 52, 6237–6247. [Google Scholar] [CrossRef]
- Mutharani, B.; Ranganathan, P.; Chen, S.-M.; Karuppiah, C. Enzyme-free electrochemical detection of nanomolar levels of the organophosphorus pesticide paraoxon-ethyl by using a poly(N-isopropyl acrylamide)-chitosan microgel decorated with palladium nanoparticles. Mikrochim. Acta 2019, 186, 167. [Google Scholar] [CrossRef] [PubMed]
- Wang, J.; Chatrathi, M.P.; Mulchandani, A.; Chen, W. Capillary electrophoresis microchips for separation and detection of organophosphate nerve agents. Anal. Chem. 2001, 73, 1804–1808. [Google Scholar] [CrossRef] [PubMed]
- Aghaie, A.; Khanmohammadi, A.; Hajian, A.; Schmid, U.; Bagheri, H. Nonenzymatic Electrochemical Determination of Paraoxon Ethyl in Water and Fruits by Graphene-Based NiFe Bimetallic Phosphosulfide Nanocomposite as a Superior Sensing Layer. Food Anal. Methods 2019, 12, 1545–1555. [Google Scholar] [CrossRef]
- Zhang, C.; Govindaraju, S.; Giribabu, K.; Huh, Y.S.; Yun, K. AgNWs-PANI nanocomposite based electrochemical sensor for detection of 4-nitrophenol. Sens. Actuators B Chem. 2017, 252, 616–623. [Google Scholar] [CrossRef]
- Laviron, E. Adsorption, autoinhibition and autocatalysis in polarography and in linear potential sweep voltammetry. J. Electroanal. Chem. Interfacial Electrochem. 1974, 52, 355–393. [Google Scholar] [CrossRef]
- Adiraju, A.; Jalasutram, A.; Wang, J.; Tegenkamp, C.; Kanoun, O. Electrodeposited Silver Dendrites on Laser-Induced Graphene for Electrochemical Detection of Nitrate with Tunable Sensor Properties. Adv. Mater. Interfaces 2024. [Google Scholar] [CrossRef]
- Cao, L.; Kang, Z.-W.; Ding, Q.; Zhang, X.; Lin, H.; Lin, M.; Yang, D.-P. Rapid pyrolysis of Cu2+-polluted eggshell membrane into a functional Cu2+-Cu+/biochar for ultrasensitive electrochemical detection of nitrite in water. Sci. Total Environ. 2020, 723, 138008. [Google Scholar] [CrossRef] [PubMed]
- Ambaye, A.D.; Muchindu, M.; Jijana, A.; Mishra, S.; Nxumalo, E. Screen-printed electrode system based on carbon black/copper-organic framework hybrid nanocomposites for the electrochemical detection of nitrite. Mater. Today Commun. 2023, 35, 105567. [Google Scholar] [CrossRef]
- Allende, S.; Liu, Y.; Zafar, M.A.; Jacob, M.V. Nitrite sensor using activated biochar synthesised by microwave-assisted pyrolysis. Waste Dispos. Sustain. Energy 2023, 5, 1–11. [Google Scholar] [CrossRef]
- Jiang, J.; Nie, Y.; Fozia; Lin, J.; Dai, Z.; Xu, X.; Huang, X.; Wang, C.; Hu, Z.; Xu, H. Preparation of Spirogyra-derived biochar modified electrode and its application in nitrite detection. Biomass Conv. Bioref. 2023. [Google Scholar] [CrossRef]
- Renganathan, V.; Balaji, R.; Chen, S.-M.; Kokulnathan, T. Coherent design of palladium nanostructures adorned on the boron nitride heterojunctions for the unparalleled electrochemical determination of fatal organophosphorus pesticides. Sens. Actuators B Chem. 2020, 307, 127586. [Google Scholar] [CrossRef]
- Kokulnathan, T.; Wang, T.-J.; Wang, Y.-Y.; Suvina, V.; Ahmed, F. Three-dimensional manganese cobaltate: A highly conductive electrocatalyst for paraoxon-ethyl detection. Mikrochim. Acta 2022, 189, 315. [Google Scholar] [CrossRef] [PubMed]
- Arduini, F.; Neagu, D.; Scognamiglio, V.; Patarino, S.; Moscone, D.; Palleschi, G. Automatable Flow System for Paraoxon Detection with an Embedded Screen-Printed Electrode Tailored with Butyrylcholinesterase and Prussian Blue Nanoparticles. Chemosensors 2015, 3, 129–145. [Google Scholar] [CrossRef]
- Deo, R.P.; Wang, J.; Block, I.; Mulchandani, A.; Joshi, K.A.; Trojanowicz, M.; Scholz, F.; Chen, W.; Lin, Y. Determination of organophosphate pesticides at a carbon nanotube/organophosphorus hydrolase electrochemical biosensor. Anal. Chim. Acta 2005, 530, 185–189. [Google Scholar] [CrossRef]


Disclaimer/Publisher’s Note: The statements, opinions and data contained in all publications are solely those of the individual author(s) and contributor(s) and not of MDPI and/or the editor(s). MDPI and/or the editor(s) disclaim responsibility for any injury to people or property resulting from any ideas, methods, instructions or products referred to in the content. |
© 2024 by the authors. Licensee MDPI, Basel, Switzerland. This article is an open access article distributed under the terms and conditions of the Creative Commons Attribution (CC BY) license (https://creativecommons.org/licenses/by/4.0/).