Abstract
In this study, we performed milling machining on carbon-epoxy polymer composites and jute-epoxy composites using a CNC vertical machining center. We focused on spindle speed, feed rate, depth of cut, and flute number and analyzed the cutting force and surface roughness. The optimal parameter combination to reduce cutting force in both composites was as follows: S = 600 rpm, FR = 100 mm/min, DOC = 0.25 mm, and FN = 6. The jute-epoxy composites required less cutting force (11.85 N/m2) compared to the carbon-epoxy composites (18.77 N/m2). The average surface roughness of the carbon-epoxy composites (6.685 µm) is higher than that of the jute-epoxy composites (3.08 µm). The type of reinforced material used greatly affects the cutting force and surface roughness during milling.
1. Introduction
The push to reduce carbon footprints has led regulatory bodies to stringently adopt the 3Rs (Reduce, Reuse, and Recycle) in almost all industrial practices. This calls for the efficient use of available resources and extensive use of environmentally friendly materials, methods, and processes. The need to reduce the harmful effects of petroleum-based fuels has necessitated the use of light-weight structures through the use of composites in place of traditional monolithic metals and alloys. The ability to tailor the mechanical, thermal, and electrical properties of composites through combining different matrix and reinforcing phases is very helpful to develop new materials suited to specific applications. Amongst the various types of composites, polymer matrix composites have shown extensive adaptability in various engineering applications due to their high strength-to-weight ratio [1], excellent resistance to corrosion, and ease of processing [2]. Fiber-reinforced polymer composites (FRPs) have been proven to be comparable to their metallic counterparts due to their attractive mechanical properties, including high strength at lower weights along with superior rigidity and resistance to fatigue and impact loads [3]. An added advantage of FRPs is that their material properties can be tailored not only by changing the type of fiber reinforcement but also by changing their fiber orientation [4].
Carbon-fiber-reinforced polymer composites (CFRPs) are a class of high-performance materials that not only possess high strength at lower weights, with exceptional resistance to tensile, fatigue, and impact loads, but have also demonstrated an impressive resistance to oxidation compared to metals and alloys. These attractive features have made CFRPs candidate materials for several on-ground, in-air, and marine engineering applications. However, CFRPs are considered harmful for the environment as they are not biodegradable [5]. Also, the processing of carbon fibers in itself is a highly energy-intensive process that significantly increases the carbon footprint [6,7]. However, due to their exceptional properties, CFRPs are still used extensively and research is progressing on the recyclability of CFRPs. On the other hand, polymer composites reinforced with natural fibers have shown promise owing to their enhanced mechanical properties coupled with biodegradability [8]. Being high-performance materials, natural-fiber-reinforced polymer composites (NFRPs) are widely used in applications spanning from structural and automotive to defense, sports, marine, and aerospace [9,10,11]. Amongst numerous natural fibers, jute fibers have been shown to improve the mechanical properties of epoxy matrix composites [12]. Motaleb et al. reported that jute-epoxy composites (JFRPs) have better resistance to gamma irradiation, which aids in improving the crosslinking between the matrix and the fiber up to 300 krad [13]. Rangasamy et al. highlighted the effect of different fiber orientations on the properties of jute-epoxy composites. They concluded that the 30° orientation of the jute fiber within the epoxy matrix results in an improvement in the mechanical properties of the composites [14]. Jute fibers are also successfully used with other natural and synthetic fibers to prepare hybrid polymer composites with excellent mechanical properties. Mohanavel et al. experimented with woven ramie fiber mats and chopped jute fibers in an epoxy matrix and found that increasing the content of chopped jute fibers improved the impact strength of jute-ramie-epoxy composites [15]. Khalid et al. reported that jute fibers, through hybridization, can replace a fraction of carbon fibers in epoxy polymer composites without compromising the strength of the composite [16].
The ongoing technological advancements in the fields of both CFRPs and NFRPs have widened their application base. This calls for investigating their post-processability more thoroughly and intensely to ensure their service reliability under all operating conditions. Although FRPs are manufactured to near net shape, machining of the composites is essential for obtaining the final geometrical dimensions and to ensure close tolerance fit during assembly [17]. Both CFRPs and JFRPs, which are extensively used in aircraft and automobile manufacturing, require secondary processing operations in the form of milling, grinding, drilling, and turning for tasks such as edge contouring, connecting holes, and forming functional windows for part assembly. During such machining operations, CFRPs and JFRPs undergo structural degradation through delamination and burr formation owing to their heterogeneity and anisotropic nature [18]. Such machining-induced damages serve as stress risers and will strain the rivets and bolts, leading to the disintegration of the assembly [19]. Several machining parameters have also been found to affect the structural and surface integrity of CFRPs and JFRPs.
The study and optimization of the machining of FRPs are thus mandated by regulatory bodies to predict and prevent catastrophic failures of FRPs under service. Ozdemir et al. investigated the effect of drilling on JFRPs and concluded that machining parameters such as feed, speed, temperature, and vibration influence the quality of the hole produced and emphasized that the judicious selection of machining parameters is important during the high-speed drilling of JFRPs [20]. Sun et al. reported that during helical end milling of CFRPs, low feed rates induced burr formation and high feed rates resulted in tears occurring at the top surface with increased surface roughness [21]. Adda et al. optimized the drilling parameters to reduce delamination in JFRPs using Artificial Neural Networks (ANNs) and Response Surface Methodology (RSM) models. They concluded that the drill size and feed rate influence the delamination, whereas spindle speed has no effect on the delamination [22].
The quality of machined surfaces is significantly influenced by the surface roughness, which is determined by various machining parameters. In their study, Kashaba et al. concluded that when drilling glass-fiber-reinforced polymers, the surface roughness is directly proportional to the cutting speed and cutting temperature and inversely proportional to the feed rate [23]. Sonia Braiek et al. worked on the drilling of mechanical and anticorrosion filament-wound hybrid composites to predict the effect of machining parameters and drill geometry on the surface roughness. Different geometry drilling tools were used to study the effect of drill geometry on the surface roughness. They found that the roughness obtained over the mechanical layer is higher than that of the anticorrosion layer. The results also confirmed that the variation in drill geometry significantly affects the roughness of the machined surface [24]. Murthy et al. conducted water jet machining on jute-epoxy composites to investigate the effect of machining parameters on surface roughness and to optimize the process parameters for minimum roughness. The results confirmed that the parameter stand-off distance had the most significant effect on roughness compared to the parameter traverse speed and mass flow rate. They utilized Taguchi and RSM techniques for the optimization [25].
The abovementioned paragraphs highlight the need for exercising caution during the machining of FRPs to obtain the required surface finish and save cost. Thus, in the present work, an effort is made to utilize the principles of design of experiments to conduct the exact number of machining experiments to mill jute-epoxy and carbon-epoxy composites. The cutting force developed during milling of FRPs is measured and its effect on surface roughness was studied. To obtain a defect-free milled surface, an effort was also made to optimize the machining variables such as speed, feed, depth of cut, and end mill flute number.
2. Methods and Methodology
2.1. Material Preparation
The hand layup technique is a popular and simple manufacturing method to create a composite. A general-purpose polyester Bisphenol A (BPA) resin from Huntsman Polymers was used as the matrix material. This resin is purchased from Renuka Enterprises in Mumbai, India. The physical characteristics of BPA are: Its molecular weight is 228.29 g/mol. It appears as a white solid at room temperature. The melting point of BPA is 158–159 °C and the boiling point is 220 °C at 4 mmHg. The density of BPA is 1.20 g/cm3. K6 hardener was used with a 10 wt.% addition to prepare the composite specimens. K6 hardener is largely an amine-based hardener. It reacts with epoxy resins and initiates a chemical reaction to change the liquid resin into a solid thermoset polymer. This hardener appears slightly yellow and generally has a low to moderate viscosity. The density is generally about 0.95–1.0 g/cm3. Before starting the process, jute fiber mats were cut to the required size. To reach the desired volume fraction, a specific amount of resin and fiber mat was used. The jute fiber fraction was kept at 35% by weight, while the epoxy was kept at 65% by weight. To make it easier to remove the composite, the supporting plate was thoroughly cleaned and a releasing agent was applied. The first layer of jute fiber mat (tensile strength 400–800 Mpa, Young’s modulus 10–30 GPa, density 1.3–1.5 gm/cm3, elongation at break 1.5–2.0%) was placed on the plate, and resin was added. Once enough resin was added to soak the fiber, a roller was used to remove any trapped air from the mat. This stacking process was repeated until all the estimated fiber mats and resin were added, with the jute fiber inclined at a 90° angle. After stacking, the upper plate was placed on top of the stack. The fiber and resin were protected with a polythene cover. The entire assembly was then placed in a hot compression device for 48 h while maintaining a temperature of 60 °C and applying a force of 100 kg/mm2 to remove any trapped air and to cure. Once the curing was complete, the excess fibers were trimmed off from all sides. The flow chart of the hand layup method used is represented in Figure 1. The same procedure was repeated to produce the sample specimen of carbon fiber (tensile strength 3500–7000 MPa, Young’s modulus 230–600 GPa, density 1.6–2.0 g/cm3, elongation at break 1.0–2.5%).
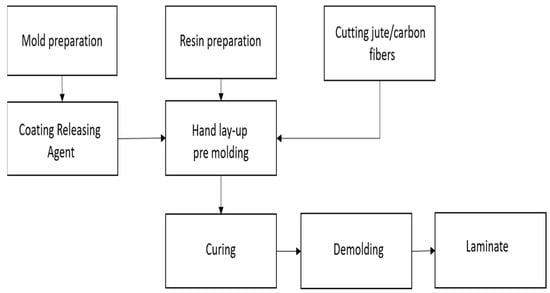
Figure 1.
Flow chart of hand lay-up method.
2.2. Milling of Composites
The number of necessary experiments was determined by using the design of the experiment method. The final parameter combination for each experiment was determined using the Taguchi L9 array. The considered range for each input variable is presented in Table 1.

Table 1.
Input parameters and their levels.
Milling operations on both jute-epoxy composite and carbon-epoxy composites were conducted on a CNC Vertical Machine Centre (VMC) manufactured by AMC machines, Bangalore, India. The milling method used was slot milling. Slot drills of various diameters and flute numbers were used for machining. Machining was carried out in dry conditions. No coolants were used during machining. The drills were made of HSS. The weather conditions in the laboratory during machining were, the temperature was 24–28 °C, precipitation was 18–19% and the humidity was around 89–92%. The thrust force (cutting force) generated during machining was recorded using a Kistler Dynamometer, manufactured by the KISTLER company, Switzerland. It is a highly precise instrument primarily used for measuring forces and moments in various engineering and research applications. The average cutting force generated from the beginning to the end of machining was estimated and considered as the thrust force produced during machining. The surface roughness of each machined surface was measured with the help of the Taylor-Hobson Mitutoyo surtronic 3+ instrument manufactured by the collaboration of Taylor-Hobson and the Mitutoyo Company. Taylor-Hobson is located in the United Kingdom and Mitutoyo is located in Kanagawa, Japan. The Taylor Hobson Surtronic series is popular for measuring surface texture and roughness in various industries. Before measuring, the machined surface is cleaned and made free from any contaminants. The stylus is checked for connection. The instrument was set for a cutoff length (λc) of 10 mm. The average roughness value (Ra) is measured for that cutoff length. Three readings were taken at different intervals and the average of three readings was considered as the surface roughness.
3. Results and Discussions
3.1. Analysis of Jute-Epoxy Composites
The output results for cutting force and surface roughness obtained for jute-epoxy composites are presented in Table 2. The regression equation for the cutting force generated during the machining of the jute-epoxy composite is presented in Equation (1) and the regression equation for surface roughness is presented in Equation (2). These equations can be utilized to estimate the cutting force and surface roughness for various levels of input parameters.
Table 2.
Machining results of jute-epoxy composites.
The main effect plot for cutting force and surface roughness recorded during the machining of jute-epoxy composite is illustrated in Figure 2 and Figure 3 respectively.
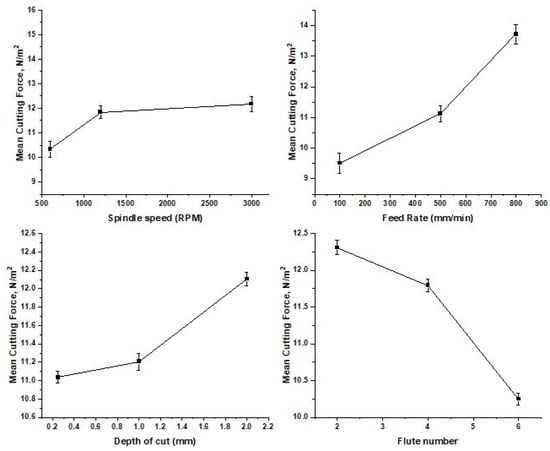
Figure 2.
Main effect plot for cutting force recorded during machining of jute-epoxy composites.
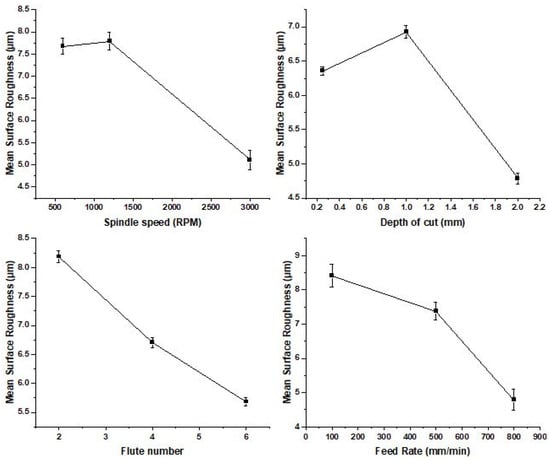
Figure 3.
Main effect plot for surface roughness recorded during machining of jute-epoxy composites.
As observed from the trend of the lines in the main effect plot for the cutting force, it is evident that an increase in spindle speed leads to a rise in the cutting force. This is because the cutting edges of the tool approach the material surface more quickly with an increase in speed, resulting in more cutting force being generated. Similarly, as the feed rate increases, more material is removed per unit of time, leading to a corresponding increase in the cutting force. It is a well-known phenomenon in all machining processes that an increase in the depth of cut leads to a higher cutting force due to the increased material-tool interface. Hence, an increase in the depth of cut leads to a rise in the cutting force. However, an increase in the number of cutting edges causes the cutting action to be shared by more cutting edges. This sharing results in a decrease in the cutting force on each cutting edge, which, in turn, may cause a reduction in the overall cutting force.
Jute fibers are soft and weak, and they tend to shear rather than cut when being machined at lower speeds and feed rates. This shearing action can result in a rough surface, with more roughness at lower speed and feed rate. As the depth of cut increases, more fibers come into contact with the cutting edge, which increases the shearing of fibers and leads to even more roughness. However, as more cutting edges are involved in the cutting action simultaneously if fibers are sheared by one cutting edge, the next one cuts the remaining fibers and reduces the roughness. Therefore, as the number of cutting edges increases, there is a reduction in surface roughness.
The deflection of the line on the main effect plot represents the influence of that particular parameter over the cutting force. The higher the deflection, the higher the influence. It is clear from the figure that the parameter FR dominates the generation of the cutting force with the maximum deviation of the line. The next dominating parameter is FN followed by the parameter S. The least dominating parameter is DOC. In the case of surface roughness, the highest dominating parameter is FR followed by S. The third dominating parameter of surface roughness is FN and the parameter DOC is the last one. The sequence of dominating parameters for cutting force and surface roughness is not the same.
ANOVA tables for the cutting force and surface roughness of the jute-epoxy composite are presented in Table 3 and Table 4, respectively. According to Table 3, it is confirmed that the parameters FR and FN have a highly significant effect on the cutting force. Hence, any small variation in these parameters will cause a huge difference in the produced cutting force. The next significant parameter is S and the least significant is the DOC. Hence, these parameters can be changed to any level according to the requirements.
Table 3.
Analysis of variance for CF, using Adjusted SS for tests for jute-epoxy composites.
Table 4.
Analysis of variance for Ra, using Adjusted SS for Tests.
Table 4 demonstrates that the parameters FR and S have a significant impact on the surface roughness. Hence, even a slight variation in these parameters can cause a significant difference in the cutting force produced. The next parameter with significant impact is S, while the least significant is the DOC. Hence, these parameters can be taken to any level based on the requirements.
Figure 4a shows the percentage contribution of each parameter to the cutting force generation. With a 68.4% contribution to the total cutting force, the parameter FR leads the way, followed by FN with 16.8%. The parameter S makes up 9.9% of the total contribution, while the parameter DOC only makes up 4.8%. The percentage contribution of each parameter for the surface roughness is depicted in Figure 4b. Once again, the parameter FR is dominating with a contribution of 51.4% followed by the parameter S with a 29.8% contribution. The parameter FN stands in third place with a 14% contribution and the parameter DOC stands last with a contribution of 4.8%.
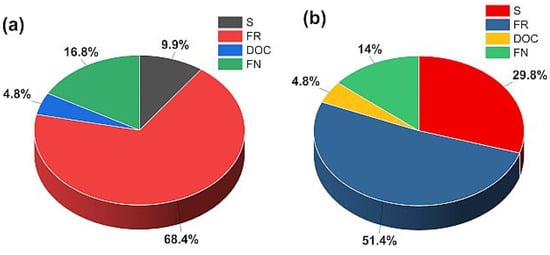
Figure 4.
Percentage contribution of each parameter on (a) CF and (b) Ra of jute-epoxy composites.
3.1.1. Optimization for Low Cutting Force and Minimum Surface Roughness by Taguchi Method
Response Surface Methodology (RSM) comprises a set of mathematical and statistical techniques that help develop, improve, and optimize processes. This methodology is particularly useful when multiple variables affect the response, and the goal is to optimize this response. In the field of engineering, RSM is applied to improve manufacturing processes, enhance product quality, and increase efficiency. RSM aids in identifying the optimal levels of factors to attain the desired response.
Response tables depict the output values of each parameter at different levels and also rank the influencing parameters by allotting the rank in descending order. By selecting the level of each parameter that yields the lowest value (highlighted in the table) and combining them, the optimum combination can be obtained. The response tables for cutting force and surface roughness are presented in Table 5 and Table 6. The ranking in Table 5 shows that the parameter FR has the highest influence on the cutting force followed by FN. The parameter S stands in the third position. Finally, the parameter DOC is ranked fourth with very low significance on the cutting force. According to Table 5, to generate the least cutting force, the parameters S, FR, and DOC need to be at level 1, while the parameter FN should be at level 3. Choosing these levels and combining them will result in the optimum combination of parameters to obtain the lowest cutting force.
Table 5.
Response table for cutting force.
Table 6.
Response table for surface roughness.
From the response table obtained for surface roughness, the ranking shows that the parameter FR has the highest influence on the surface roughness. Following the parameter FR, the parameter S stands in second place. The parameter FN takes the third position and the parameter DOC takes the last position. According to Table 6, to achieve the least surface roughness value, the parameters S, FR, and FN need to be at level 3, while the parameter DOC should be at level 1.
3.1.2. RSM Optimization Plot of Minimum Cutting Force and Surface Roughness for Jute-Epoxy Composites
Response surface optimization plots give the optimum set of process parameters for any considered output parameter within the considered experimentation limit. The plot that was created for the present experimentation to minimize the cutting force during the milling process is illustrated in Figure 5 and the optimum level of each parameter is displayed in red color. According to the plot, we should use the following combination to obtain the least cutting force. The parameter S should be at level 1, FR should be at level 1, DOC should be at level 1, and the parameter FN should be at level 3. Figure 6 is the optimization plot for minimum surface roughness and according to the plot to obtain the minimum surface roughness, the parameter S should be at level 3, FR should be at level 3, DOC should be at level 1, and FN should be at level 3.
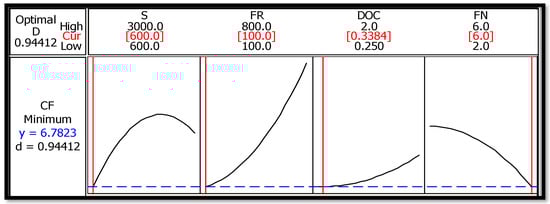
Figure 5.
RSM optimization plot for minimum cutting force.
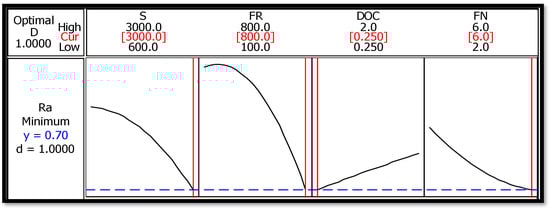
Figure 6.
RSM optimization plot for minimum surface roughness.
3.2. Analysis of Carbon-Epoxy Composites
The output results for cutting force generated and surface roughness obtained for the carbon-epoxy composite are presented in Table 7.
Table 7.
Machining results of carbon-epoxy composites.
Equation (3) represents the regression equation used to estimate the cutting force generated while machining the carbon-epoxy composite. Equation (4) represents the regression equation used to estimate the surface roughness. By inputting various values of the input parameters within the specified range, these equations can be used to determine the cutting force and surface roughness mathematically.
Figure 7 displays the main effect plot for the cutting force generated during the machining of the carbon-epoxy composite, while Figure 8 depicts the main effect plot for the surface roughness. Graphs clearly show that the cutting force is mainly influenced by the parameter FR, followed by FN, S, and DOC, in descending order of significance. As for surface roughness, FR and S are the most influential parameters, followed by FN, with DOC being the least significant parameter.
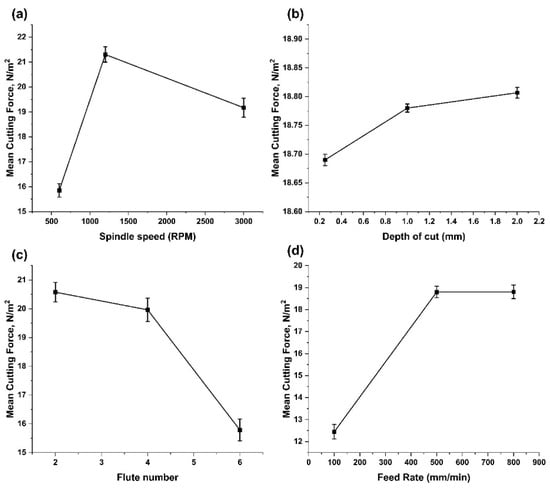
Figure 7.
(a–d) Main effect plot for cutting force recorded during machining of carbon-epoxy composites.
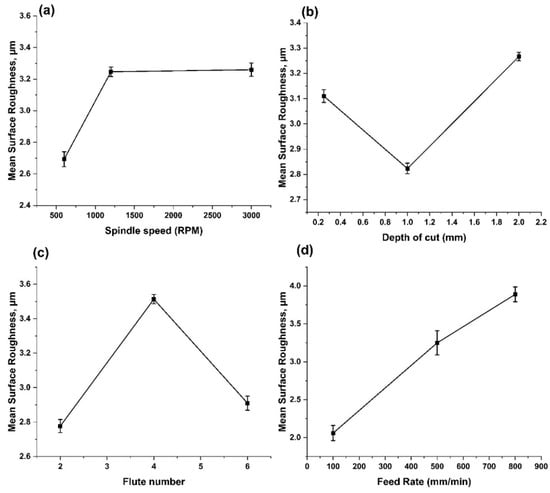
Figure 8.
(a–d) Main effect plot for surface roughness recorded during machining of carbon-epoxy composites.
When the cutting force is considered, in the case of carbon-epoxy composite milling, the same trend is shown by the main effect plots and the reasons already discussed. When the parameters speed and feed rate are considered concerning surface roughness, since the carbon fibers are hard and stronger, the surface roughness increases when these parameters increase. Other trends are similar to those of jute-epoxy composites and explained earlier.
Table 8 and Table 9 display the ANOVA tables for the cutting force and the surface roughness of the carbon-epoxy composite. Table 8 confirms that the cutting force is significantly affected by the FR and FN parameters. S is the third most influential parameter, while DOC is the least influential one. Therefore, these parameters can be fixed to any level within the considered range based on the needs. Table 9 confirms that FR is the most dominant parameter, followed by S. Hence, it is advisable to avoid varying the levels of these two parameters.
Table 8.
Analysis of variance for CF, using Adjusted SS for Tests for carbon-epoxy composites.
Table 9.
Analysis of variance for Ra, using Adjusted SS for tests.
In Figure 9a, the percentage contribution of each parameter to the generation of cutting force is shown. The FR parameter has the highest contribution of 84.2% to the total cutting force, followed by FN with 12.2%. S contributes only 3.2% to the total, while DOC contributes only 0.5%. Similarly, Figure 9b shows the percentage contribution of each parameter to the surface roughness. Here also, the FR parameter dominates with a contribution of 85.6%. The S parameter has a contribution of 12.6%, while FN contributes only 1.3% to the surface roughness. DOC makes up a negligible contribution of 0.5%.
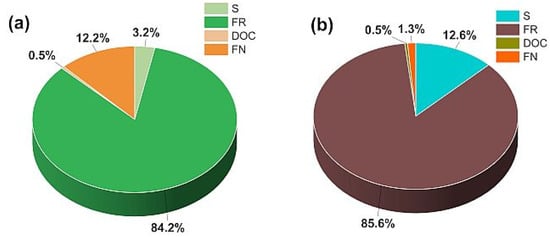
Figure 9.
Percentage contribution of each parameter on (a) CF and (b) Ra of carbon-epoxy composites.
3.2.1. Taguchi Method Optimization for Low Cutting Force and Minimum Surface Roughness
The cutting force and surface roughness response tables for the carbon-epoxy composite are presented in Table 10 and Table 11. The first table indicates that the parameter FR has the greatest influence on the cutting force, followed by the parameter FN. The parameter S comes in the third position and the parameter DOC takes the last position. According to the table, to minimize cutting force, parameters S, FR, and DOC should be set to level 1, while parameter FN should be set to level 3. Based on the response table obtained for surface roughness, it was found that the parameter FR has the highest influence on surface roughness, followed by parameter S in the second position. The parameter FN comes next, and the last parameter is DOC. According to the table, to achieve the least surface roughness, parameters S, FR, and FN should be set at level 1, while parameter DOC should be set at level 3.
Table 10.
Response table for means for cutting force.
Table 11.
Response table for means for surface roughness.
3.2.2. RSM Optimization Plot of Minimum Cutting Force and Surface Roughness for Carbon-Epoxy Composites
Figure 10 displays the RSM optimization plot to obtain the minimum cutting force required for milling carbon-epoxy composite. The optimum level of each parameter is displayed in red color inside the brackets. Based on the plot analysis, to achieve the lowest cutting force, we should fix level 1 for the parameters S, FR, and DOC and level 3 for the parameter FN. According to the RSM, the optimization plot obtained for the carbon-epoxy composite is given in Figure 11. Here, we should fix the parameters S, FR and DOC at level 1 and FN at level 3 to obtain the minimum surface roughness.
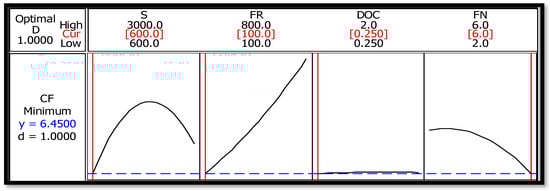
Figure 10.
RSM optimization plot for minimum cutting force.
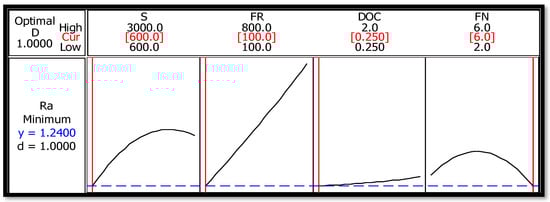
Figure 11.
RSM optimization plot for minimum surface roughness.
The cutting force generated during the milling of jute-epoxy composites and carbon-epoxy composites is compared in Figure 12. Figure 12 shows that the cutting force generated during the milling of carbon-epoxy composites is higher than that in jute-epoxy composites. The average cutting force for jute-epoxy composites is 11.45 N/m2 while for carbon-epoxy composites it is 18.77 N/m2. This discrepancy can be explained by the fact that jute fibers are less hard and strong compared to carbon fibers. Due to their properties, jute fibers can be cut easily by the cutting tool at a lesser force.
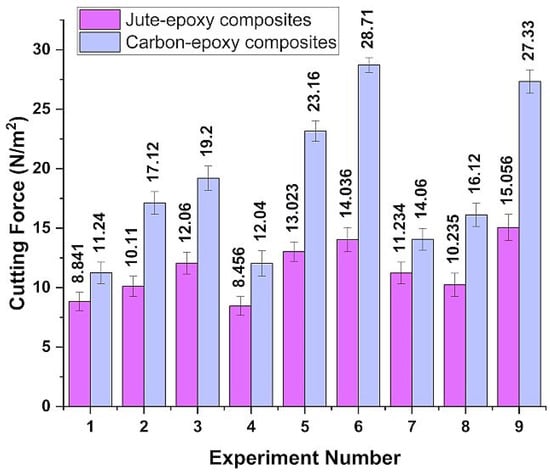
Figure 12.
Cutting force of jute-epoxy and carbon-epoxy composites.
The comparative values of surface roughness during the milling of jute-epoxy composites and carbon-epoxy composites are represented in Figure 13. From Figure 13, it is clear that the roughness values generated in all the experiments during the carbon-epoxy composite are higher than the roughness values obtained for carbon-epoxy composites. The reason is that, compared to jute fibers, carbon fibers are harder. Because of this characteristic of the carbon fibers, during machining, the carbon fibers will be completely cut by the cutting tool and, due to their softness, the jute fibers will be torn/sheared rather than completely being cut; this shearing of the fibers produces a rough machining surface. The estimated average surface roughness for carbon-epoxy composite is 3.06 µm and for the jute-epoxy composite, it is 6.85 µm. The optimum combination of parameters obtained for the minimum cutting force for both jute-epoxy and carbon-epoxy composites is S = 600 rpm, FR = 100 mm/min, DOC = 0.25 mm, and FN = 6.
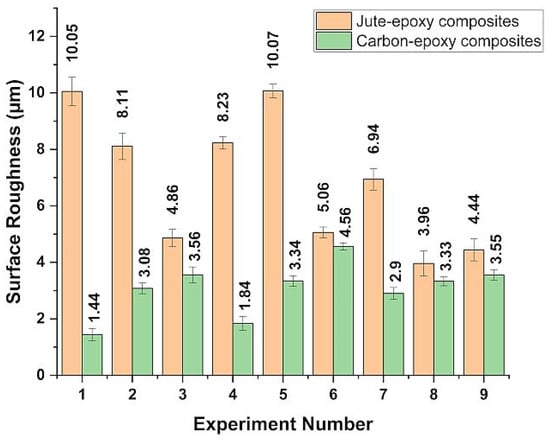
Figure 13.
Measured surface roughness of jute-epoxy and carbon-epoxy composites.
4. Conclusions
Based on the results obtained from the present experimentation, the following conclusions can be drawn:
This study revealed that both jute-epoxy and carbon-epoxy composites share the same optimal combination for minimum cutting force. However, the optimal combination for minimum surface roughness differs between the two composites. This suggests that the cutting force required for jute-epoxy composites is consistently lower than that required for carbon-epoxy composites due to the softness of jute fibers. The average cutting force for carbon-epoxy composite is 18.77 N/m2, whereas for jute-epoxy composite, it is 6.85 N/m2. This difference can be attributed to the contrasting properties of the reinforced materials.
Additionally, the average surface roughness is 6.85 µm for jute-epoxy composite and 3.06 µm for carbon-epoxy composite. Despite the same matrix material and machining parameters being used, the values of surface roughness and cutting force obtained for both composites differ. This difference is attributed to the type of fibers used for reinforcement. Consequently, it is clear that the choice of material for reinforcement significantly influences the quality of machining.
Author Contributions
Conceptualization, B.R.N.M.; methodology, S.R.H.; software, G.D.D.; validation, G.D.D.; formal analysis, P.H.; investigation, S.R.H.; resources; B.R.N.M.; Data curation, S.R.H.; writing—original draft preparation, B.R.N.M.; writing—review and editing, S.R.H.; visualization, G.D.D.; supervision, P.H. All authors have read and agreed to the published version of the manuscript.
Funding
This research received no external funding.
Data Availability Statement
This article has no associated data generated and/or analyzed.
Conflicts of Interest
The authors declare no conflicts of interest.
References
- Rajak, D.K.; Pagar, D.D.; Menezes, P.L.; Linul, E. Fiber-Reinforced Polymer Composites: Manufacturing, Properties, and Applications. Polymers 2019, 11, 1667. [Google Scholar] [CrossRef]
- Liang, C.; Gu, Z.; Zhang, Y.; Ma, Z.; Qiu, H.; Gu, J. Structural Design Strategies of Polymer Matrix Composites for Electromagnetic Interference Shielding: A Review. Nano-Micro Lett. 2021, 13, 181. [Google Scholar] [CrossRef]
- Turaka, S.; Chintalapudi, R.; Geetha, N.K.; Pappula, B.; Makgato, S. Experimental and Numerical Analysis of the Microstructure and Mechanical Properties of Unidirectional Glass Fiber Reinforced Epoxy Composites. Compos. Struct. 2024, 331, 117887. [Google Scholar] [CrossRef]
- Nagaraja, K.C.; Rajeshkumar, G.; Sanjay, M.R.; Siengchin, S. Influence of Stacking Sequence and Halloysite Addition on the Fracture Toughness and Low-Velocity Impact Strength of Carbon/Glass Fiber Reinforced Hybrid Composites. Polym. Compos. 2024, 45, 328. [Google Scholar] [CrossRef]
- Borjan, D.; Knez, Ž.; Knez, M. Recycling of Carbon Fiber-Reinforced Composites-Difficulties and Future Perspectives. Materials 2021, 14, 4191. [Google Scholar] [CrossRef]
- Akter, M.; Uddin, M.H.; Anik, H.R. Plant Fiber-Reinforced Polymer Composites: A Review on Modification, Fabrication, Properties, and Applications. Polym. Bull. 2024, 81, 1. [Google Scholar] [CrossRef]
- Zhang, J.; Chevali, V.S.; Wang, H.; Wang, C.-H. Current Status of Carbon Fibre and Carbon Fibre Composites Recycling. Compos. Part B Eng. 2020, 193, 108053. [Google Scholar] [CrossRef]
- Gani, A.; Ibrahim, M.; Ulmi, F.; Farhan, A. The Influence of Different Fiber Sizes on the Flexural Strength of Natural Fiber-Reinforced Polymer Composites. Results Mater. 2024, 21, 100534. [Google Scholar]
- Kumar, R.; Haq, M.I.U.; Raina, A.; Anand, A. Industrial Applications of Natural Fibre-Reinforced Polymer Composites-Challenges and Opportunities. Int. J. Sustain. Eng. 2019, 12, 212. [Google Scholar] [CrossRef]
- Keya, K.N.; Kona, N.A.; Koly, F.A.; Maraz, K.M.; Islam, M.N.; Khan, R.A. Natural Fiber Reinforced Polymer Composites: History, Types, Advantages and Applications. Mater. Eng. Res. 2019, 1, 69. [Google Scholar] [CrossRef]
- Jariwala, H.; Jain, P.J. A Review on Mechanical Behavior of Natural Fiber Reinforced Polymer Composites and Its Applications. Reinf. Plast. Compos. 2019, 38, 441. [Google Scholar] [CrossRef]
- Boopalan, M.; Umapathy, M.J.; Jenyfer, P. A Comparative Study on the Mechanical Properties of Jute and Sisal Fiber Reinforced Polymer Composites. Silicon 2012, 4, 145. [Google Scholar] [CrossRef]
- Motaleb, K.Z.M.A.; Milašius, R.; Ahad, A. Influence of Gamma Radiation on Mechanical Properties of Jute Fabric-Reinforced Polymer Composites. Fibers 2020, 8, 58. [Google Scholar] [CrossRef]
- Rangasamy, G.; Mani, S.; Kolandavelu, S.K.S.; Alsoufi, M.S.; Ibrahim, A.M.M.; Muthusamy, S.; Panchal, H.; Sadasivuni, K.K.; Elsheikh, A.H. An Extensive Analysis of Mechanical, Thermal and Physical Properties of Jute Fiber Composites with Different Fiber Orientations. Case Stud. Therm. Eng. 2021, 28, 101612. [Google Scholar] [CrossRef]
- Mohanavel, V.; Raja, T.; Yadav, A.; Ravichandran, M.; Winczek, J. Evaluation of Mechanical and Thermal Properties of Jute and Ramie Reinforced Epoxy-Based Hybrid Composites. J. Nat. Fibers 2022, 19, 8022. [Google Scholar] [CrossRef]
- Khalid, M.Y.; Nasir, M.A.; Ali, A.; Al Rashid, A.; Khan, M.R. Experimental and Numerical Characterization of Tensile Property of Jute/Carbon Fabric Reinforced Epoxy Hybrid Composites. SN Appl. Sci. 2020, 2, 577. [Google Scholar] [CrossRef]
- Shahabaz, S.M.; Sharma, S.; Shetty, N.; Shetty, S.D.; Gowrishankar, M.C. Influence of Temperature on Mechanical Properties and Machining of Fibre Reinforced Polymer Composites: A Review. Eng. Sci. 2021, 16, 26. [Google Scholar] [CrossRef]
- Gao, T.; Li, C.; Wang, Y.; Liu, X.; An, Q.; Li, H.N.; Zhang, Y.; Cao, H.; Liu, B.; Wang, D.; et al. Carbon Fiber Reinforced Polymer in Drilling: From Damage Mechanisms to Suppression. Compos. Struct. 2022, 286, 115232. [Google Scholar] [CrossRef]
- Kesarwani, S.; Verma, R.K.; Jayswal, S.C. Evaluation of the Cutting Force, Burr Formation, and Surface Quality during the Machining of Carbon Nanoparticle Modified Polymer Composites for Structural Applications. Mater. Today Commun. 2023, 34, 105375. [Google Scholar] [CrossRef]
- Özdemir, B.; Yardimeden, A.; Bahce, E.; Kilickap, E.; Emir, E. Analysis of Drilling Behaviour in Jute Fibres Reinforced Natural Composites. J. Nat. Fibers 2023, 20, 2159608. [Google Scholar] [CrossRef]
- Sun, Z.; Geng, D.; Zheng, W.; Liu, Y.; Liu, L.; Ying, E.; Jiang, X.; Zhang, D.J. An Innovative Study on High-Performance Milling of Carbon Fiber Reinforced Plastic by Combining Ultrasonic Vibration Assistance and Optimized Tool Structures. Mater. Res. Technol. 2023, 22, 2131. [Google Scholar] [CrossRef]
- Adda, B.; Belaadi, A.; Boumaaza, M.; Bourchak, M. Experimental Investigation and Optimization of Delamination Factors in the Drilling of Jute Fiber--Reinforced Polymer Biocomposites with Multiple Estimators. Int. J. Adv. Manuf. Technol. 2021, 116, 2885. [Google Scholar] [CrossRef]
- Khashaba, U.A. Analysis of Surface Roughness, Temperature, Short Aging, and Residual Notched and Bearing Strengths in Supported Drilling of Thin GFRP Composites. Alexandria Eng. J. 2024, 86, 157. [Google Scholar] [CrossRef]
- Braiek, S.; Zitoune, R.; Krishnaraj, V.; BenKhalifa, A.; Ameur, M.F.; Khashaba, U.A.; Zidi, M. Drilling of Filament Wound Hybrid Composite Tubes: An Experimental Study. Compos. Struct. 2023, 308, 116686. [Google Scholar] [CrossRef]
- Murthy, B.R.N.; Makki, E.; Potti, S.R.; Hiremath, A.; Bolar, G.; Giri, J.; Sathish, T.J. Optimization of Process Parameters to Minimize the Surface Roughness of Abrasive Water Jet Machined Jute/Epoxy Composites for Different Fiber Inclinations. Compos. Sci. 2023, 7, 498. [Google Scholar] [CrossRef]
Disclaimer/Publisher’s Note: The statements, opinions and data contained in all publications are solely those of the individual author(s) and contributor(s) and not of MDPI and/or the editor(s). MDPI and/or the editor(s) disclaim responsibility for any injury to people or property resulting from any ideas, methods, instructions or products referred to in the content. |
© 2024 by the authors. Licensee MDPI, Basel, Switzerland. This article is an open access article distributed under the terms and conditions of the Creative Commons Attribution (CC BY) license (https://creativecommons.org/licenses/by/4.0/).