Article

Numerical Assessment of the Effect of CFRP Anchorages on the Flexural and Shear Strengthening Performance of RC Beams

by
Pedram Ayyobi
1,*,
Joaquim António Oliveira Barros
2 and
Salvador José Esteves Dias
2
1
University of Coimbra, ISISE, ARISE, Department of Civil Engineering, 3030-788 Coimbra, Portugal
2
University of Minho, ISISE, ARISE, Department of Civil Engineering, 4800-058 Guimarães, Portugal
*
Author to whom correspondence should be addressed.
J. Compos. Sci. 2024, 8(9), 348; https://doi.org/10.3390/jcs8090348
Submission received: 5 August 2024 / Revised: 26 August 2024 / Accepted: 3 September 2024 / Published: 5 September 2024
(This article belongs to the Section Composites Modelling and Characterization)

Abstract

:
This study investigates the effectiveness of a hybrid solution that combines carbon fiber-reinforced polymer (CFRP) systems for the flexural and shear strengthening of T-cross section reinforced concrete (RC) beams. The hybrid solution consists of near-surface mounted CFRP laminates for flexural enhancement and externally bonded U-shaped CFRP strips for shear strengthening. Moreover, an innovative CFRP anchorage system is proposed to prevent premature debonding of the U-CFRP strips and to improve their shear contribution. To address the limitations of the experimental program and propose an efficient and design-oriented simulation approach for NSM-EBR strengthening RC beams with the innovative anchorage system, a comprehensive numerical investigation was conducted by considering the key parameters affecting the performance of the strengthened system. This paper presents the results of an experimental program and a nonlinear finite element analysis that simulate the behavior of the materials up to their failure and the bond conditions between CFRP and concrete. This study also includes a numerical parametric study to assess the effectiveness of the proposed strengthening concept with several possible scenarios, as well as the predictive performance of the fib Bulletin 90 and ACI 440.2R-17 formulations.

1. Introduction

Carbon Fiber Reinforced Polymer (CFRP) materials offer significant advantages over traditional strengthening methods like steel plates and concrete jackets. These advantages include a high strength-to-weight ratio, high stiffness-to-weight ratio, resistance to corrosion, electromagnetic neutrality, design flexibility, and ease of application [1,2,3,4]. CFRP composites have been effectively used to enhance the flexural and shear strength of reinforced concrete (RC) beams [1,2,5,6,7,8,9]. Furthermore, the use of CFRP materials for strengthening steel beams is also gaining attention due to CFRP’s high modulus of elasticity and effectiveness in the tension zones of damaged steel beams. With their excellent strength-to-weight ratio, fatigue performance, and durability, CFRP is also a strong candidate for reinforcing steel structures [10,11].
The two primary CFRP-based strengthening methods are Externally Bonded Reinforcement (EBR) and Near Surface Mounted (NSM). The EBR technique involves adhering CFRP materials, such as wet lay-up sheets or laminates, directly to the surface of the concrete, while the NSM technique involves embedding CFRP reinforcements of various cross-sectional shapes (circular, square, or rectangular) into grooves cut into the concrete cover, which are then filled with adhesive. Among these, the NSM technique, particularly with CFRP laminates, has been recognized as more effective than EBR for strengthening RC beams, due to its higher anchoring capacity and bond performance between the CFRP and concrete [7,8]. However, one challenge with NSM-CFRP reinforcements is the premature rip-off failure mode, which prevents full utilization of the reinforcement’s strengthening potential [12,13].
In some cases, RC beams require both flexural and shear strengthening. When flexural strengthening necessitates the use of CFRP, shear strengthening might also be required, especially if the existing steel stirrups are insufficient to prevent brittle shear failure. Moreover, when a high ratio of CFRP flexural strengthening is applied using the EBR technique, the risk of premature debonding failure increases. This failure is attributed to the high in-plane shear strains that develop between the concrete substrate and the CFRP systems, particularly in critical zones, which are exacerbated by the axial stiffness of these systems [14,15]. Additionally, using the NSM technique to apply CFRP laminates on the lateral faces of the beam to enhance its shear capacity does not fully mitigate the risk of premature debonding failure associated with EBR [16,17]. Furthermore, when the shear strengthening requires closely spaced CFRP laminates applied using the NSM technique, there is a significant risk of the concrete cover layer detaching where these laminates are introduced. This premature failure mode occurs at a load level where the tensile strain in the laminates is much lower than their ultimate strain, meaning their tensile capacity is not fully utilized [12,13].
A hybrid strengthening technique using CFRP may offer a more effective solution. By combining NSM-CFRP reinforcements for flexural strengthening with U-shaped CFRP strips applied using the EBR technique for shear strengthening [18,19,20], the necessary flexural and shear capacity can be achieved without encountering premature rip-off failure [12]. However, the shear-strengthening effectiveness of U-shaped CFRP strips is still limited by the risk of premature debonding. To address this, various anchorage solutions have been developed [4,21,22]. Recently, Dias et al. [13] proposed a hybrid NSM-EBR technique that simultaneously strengthens RC beams in shear and flexure. This technique uses U-shaped EBR CFRPs with specially designed -shaped anchorages for shear strengthening and NSM CFRP laminates for flexural strengthening. The anchorages help prevent the premature debonding of EBR, thereby enhancing the beam’s shear strengthening capacity and preventing premature rip-off failure in NSM-CFRP flexural strengthening, ultimately leading to a higher level of flexural strengthening.
Due to budget restrictions and rationality on spending materials and human resources, the experimental program carried out was designed to evaluate exclusively the influence of some critical aspects of the novel strengthening technique. Therefore, parameters like the percentage of NSM CFRP laminates ( ρ f l ), percentage of wet lay-up CFRP sheets ( ρ f w ), and percentage of longitudinal tensile steel bars ( ρ s l ) were not investigated experimentally. Finite element simulations with reliable models can provide more comprehensive and complementary information about the effectiveness of the proposed strengthening technique at a lower cost than the experimental alternative [23,24,25].
This study primarily focuses on the numerical simulation of two series of RC beams tested in [13], using ABAQUS software version 2023, which is capable of simulating the relevant nonlinear behavior of the materials involved. The simulation aims to predict the behavior of the beams in terms of load vs. displacement, crack pattern, strain in CFRP and steel reinforcements, and debonding of the EBR technique. Furthermore, this study also uses sixteen RC beams created solely through computer simulations, based on numerical verification with experimental tests. These sixteen beams were then used to investigate the anchorage effectiveness of the proposed hybrid strengthening technique when varying ρ f l , ρ f w , and ρ s l . Additionally, the maximum strain in CFRP was compared with the values specified in fib Bulletin 90 [26] and ACI-440-2R [27]. This study provides a comprehensive evaluation of the accuracy of these design recommendations in the context of this specific application.

2. Testing Framework

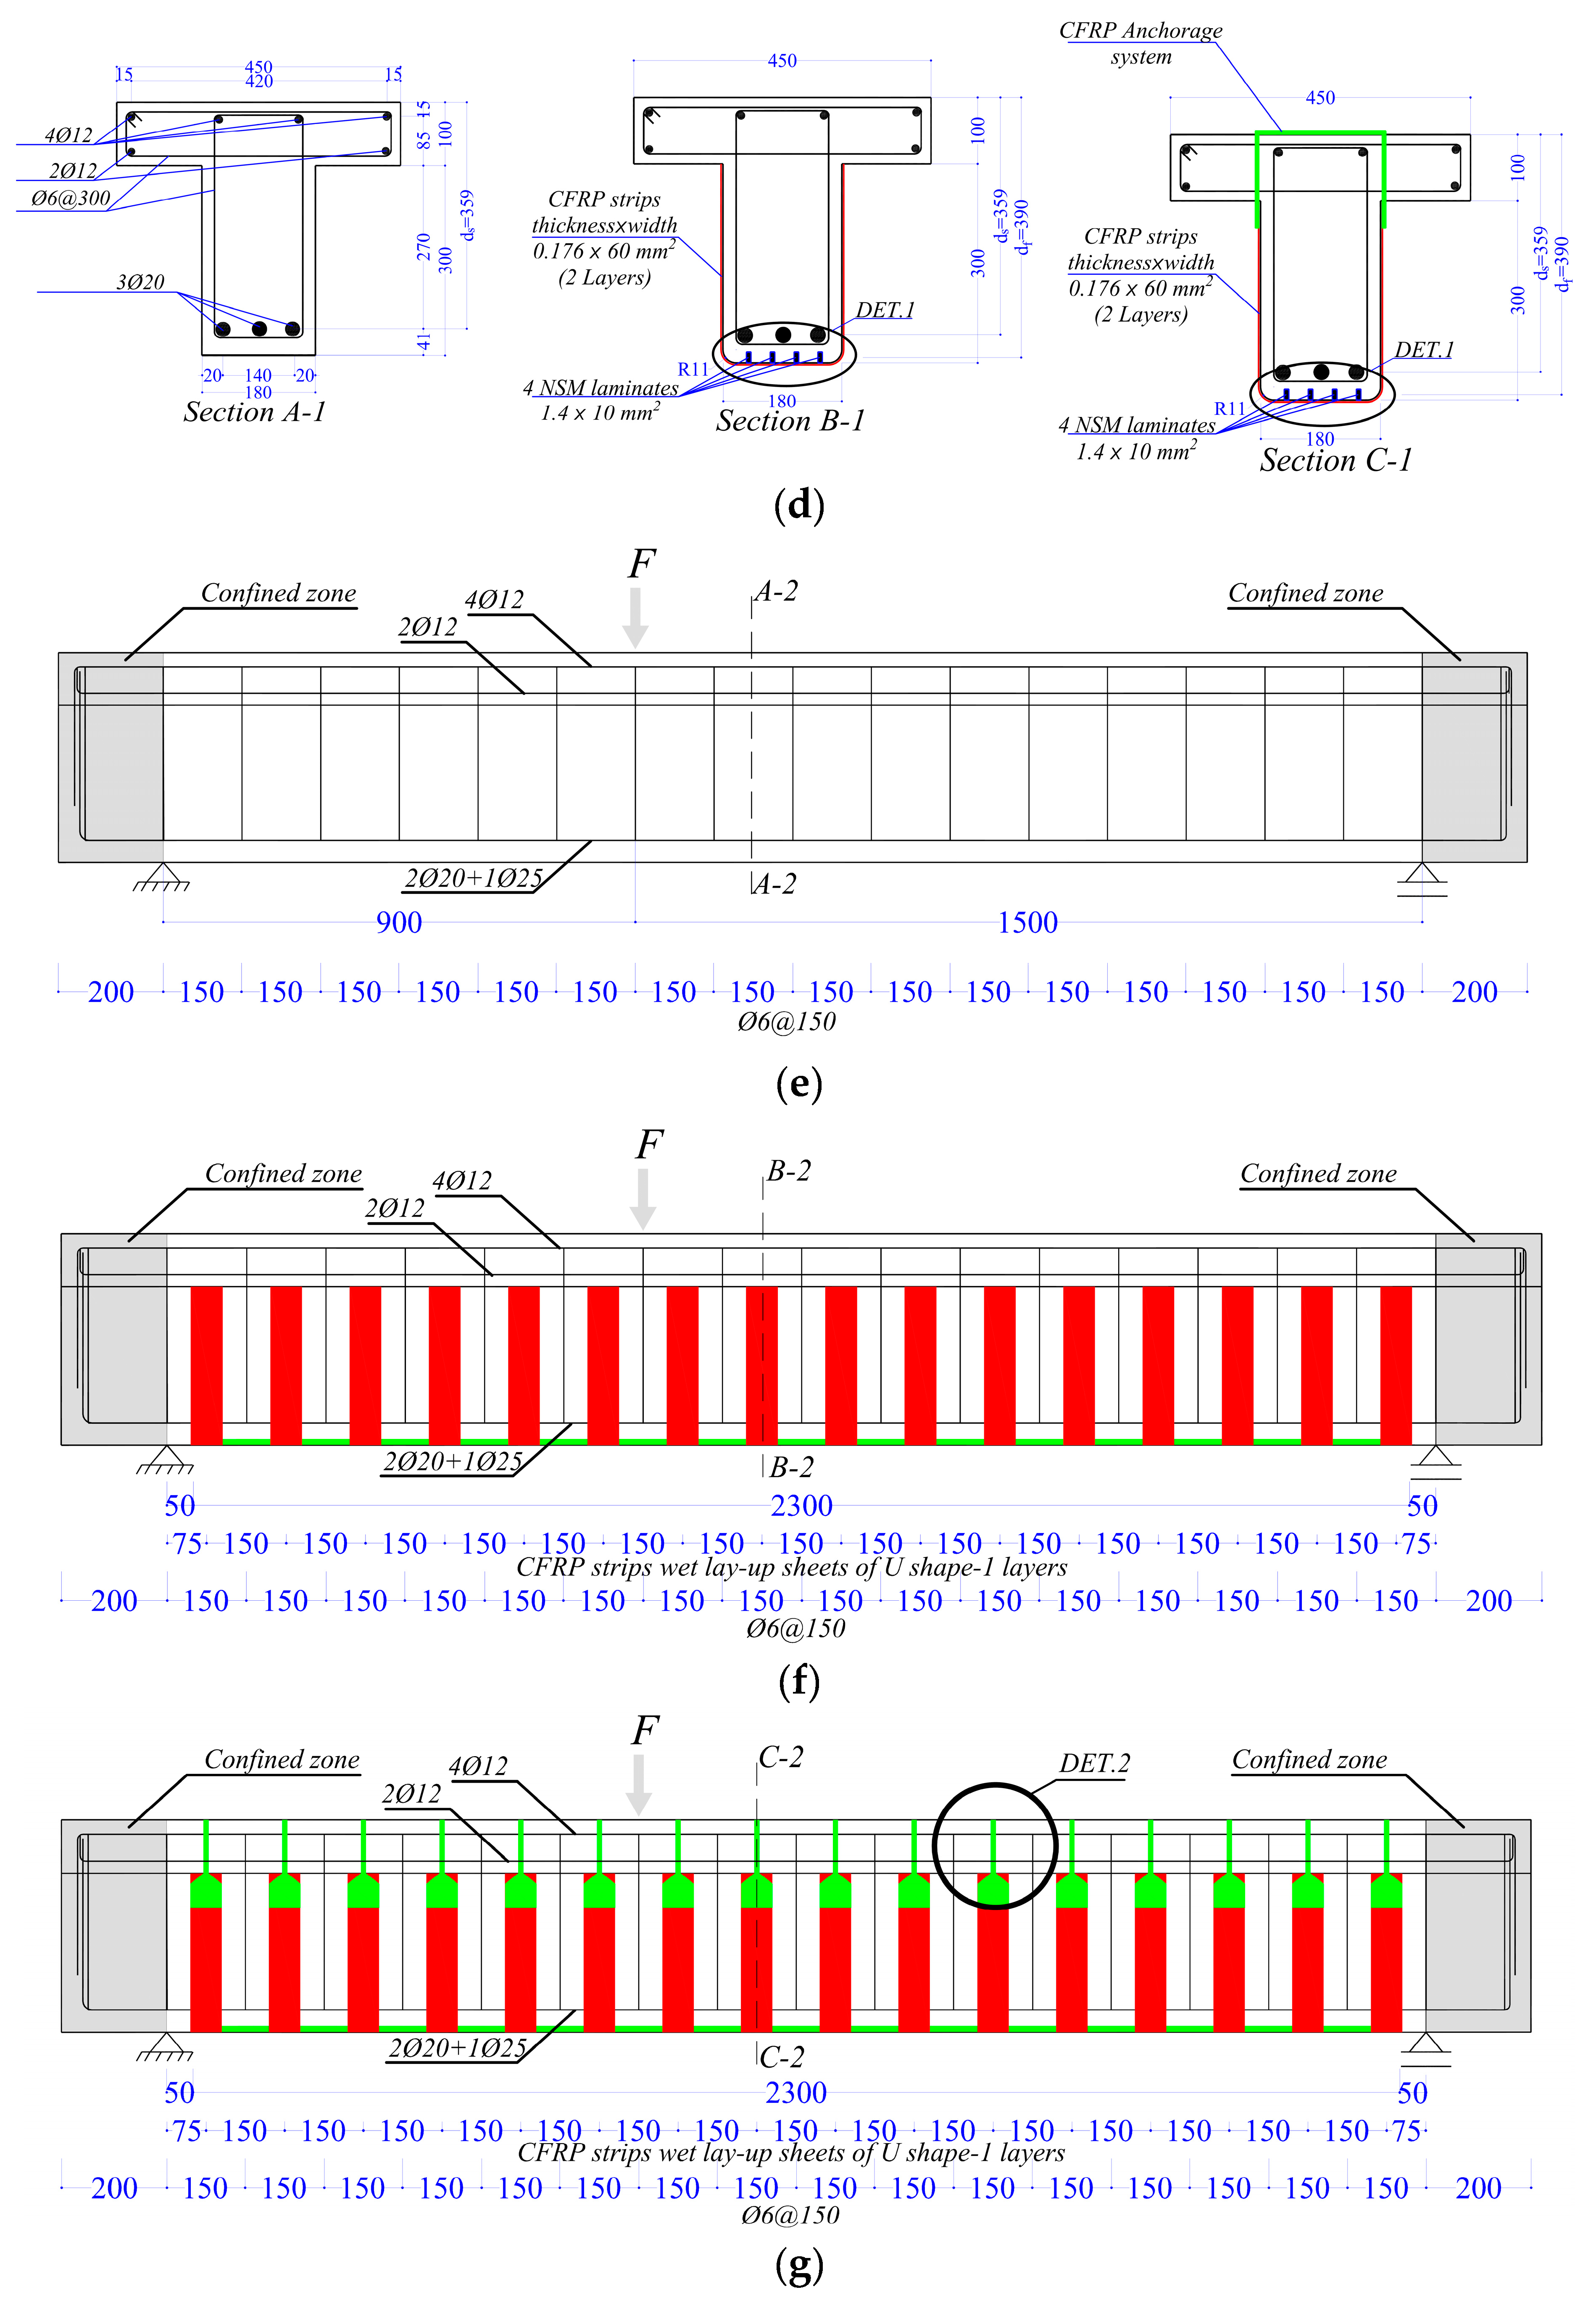
2.1. Details of Experimental Beams

This section outlines the main features of six RC beams (three from series I and three from series II) that were experimentally tested [13]. Figure 1 depicts the beams’ geometric dimensions, reinforcement details, and loading and support conditions, which are critical for the numerical simulations.
For the beams in series I, which include the reference beam REF-I and the strengthened beams SFS-I and SFSA-I, the longitudinal tensile reinforcement consisted of three 20 mm diameter bars (3ϕ20). Transverse reinforcement was provided by 6 mm diameter stirrups spaced 300 mm apart (ϕ6@300 mm). In contrast, the beams in series II, comprising the reference beam REF-II and the strengthened beams SFS-II and SFSA-II, used a combination of two 20 mm diameter bars and one 25 mm diameter bar (2ϕ20 + 1ϕ25) for longitudinal tensile reinforcement. These beams had 6 mm diameter stirrups spaced 150 mm apart (ϕ6@150 mm) for transverse reinforcement. All beams were also reinforced with six 12 mm diameter bars (6ϕ12) in the flange. To mitigate the risk of brittle spalling at the beam supports, a reinforcing cage was used, featuring 6 mm diameter horizontal stirrups spaced 65 mm apart and 10 mm diameter vertical stirrups spaced 50 mm apart (see Figure 1k). This arrangement was applied in the areas marked as “Confined zone” in Figure 1a–c,e–g.
A three-point loading scheme was employed with varying shear span lengths (900 mm and 1500 mm as shown in Figure 1) to ensure a higher shear force in the shorter shear span. Sensors were placed in this span to monitor the CFRP and steel reinforcements due to the increased likelihood of shear failure. A shear span-to-effective depth ratio (ds) of 2.5 was selected to promote shear failure conditions while avoiding the formation of compressive struts from the loading point to the nearest support [28,29].
The beams designated as SFS-I and SFSA-I (from series I) and SFS-II and SFSA-II (from series II) were strengthened for flexure using four CFRP laminates (CFK 150/2000 S&P laminates) placed at 36 mm intervals, each with a cross-sectional area of 1.4 × 10 mm2, following the NSM technique (refer to Figure 1d,h,i). Additionally, these beams received shear strengthening through U-shaped CFRP strips (60 mm wide) made of wet lay-up sheets. For series I beams, two layers of wet lay-up sheets were used per strip, while, for series II, only one layer per strip was applied. Each wet lay-up sheet (S&P 240–300 g/m2) has a thickness of 0.176 mm. The main difference between the beams of series I and series II lies in the inclusion of an anchorage system for the U-shaped CFRP strips in the latter, which aims to mitigate premature debonding that could reduce the shear strengthening effectiveness [13,30]. The extremities of each layer of these discrete strips were anchored to the compressive zone of the RC beam adopting an inverted U-shaped CFRP strip ( ) that was divided into two parts: the rolled part in the flange and the overlap part (in the lateral faces of the beam’s web, Figure 1j). The bond area of the overlap part was determined experimentally (40 × 50 = 2000 mm2) to ensure the stress transference between the U and shaped strips without premature debonding [13]. The flexural and shear reinforcement as well as the strengthening ratios for the beams are presented in Table 1. At the time of beam testing, the average value of the cylindrical compressive strength (fcm) and modulus of elasticity (Ecm) of the concrete were, respectively, 44.3 MPa and 34.1 GPa. The average value of the yield stress (fsym) of the steel bars of 6, 20, and 25 mm diameter was 641, 636, and 657 MPa, respectively, while the average value of the tensile strength (fsum) for these corresponding bars was 737, 767, and 790 MPa. The average value of the tensile strength (ffum), modulus of elasticity (Efm), and ultimate strain (εfu) of the adopted CFRP laminate (flexural strengthening) was 3165 MPa, 175 GPa, and 18.0‰, respectively. The average value of the tensile strength (ffum), modulus of elasticity (Efm), and ultimate strain (εfu) of the adopted CFRP wet lay-up sheet (shear strengthening and anchorage system) were 3096 MPa, 245 GPa, and 12.6‰, respectively.

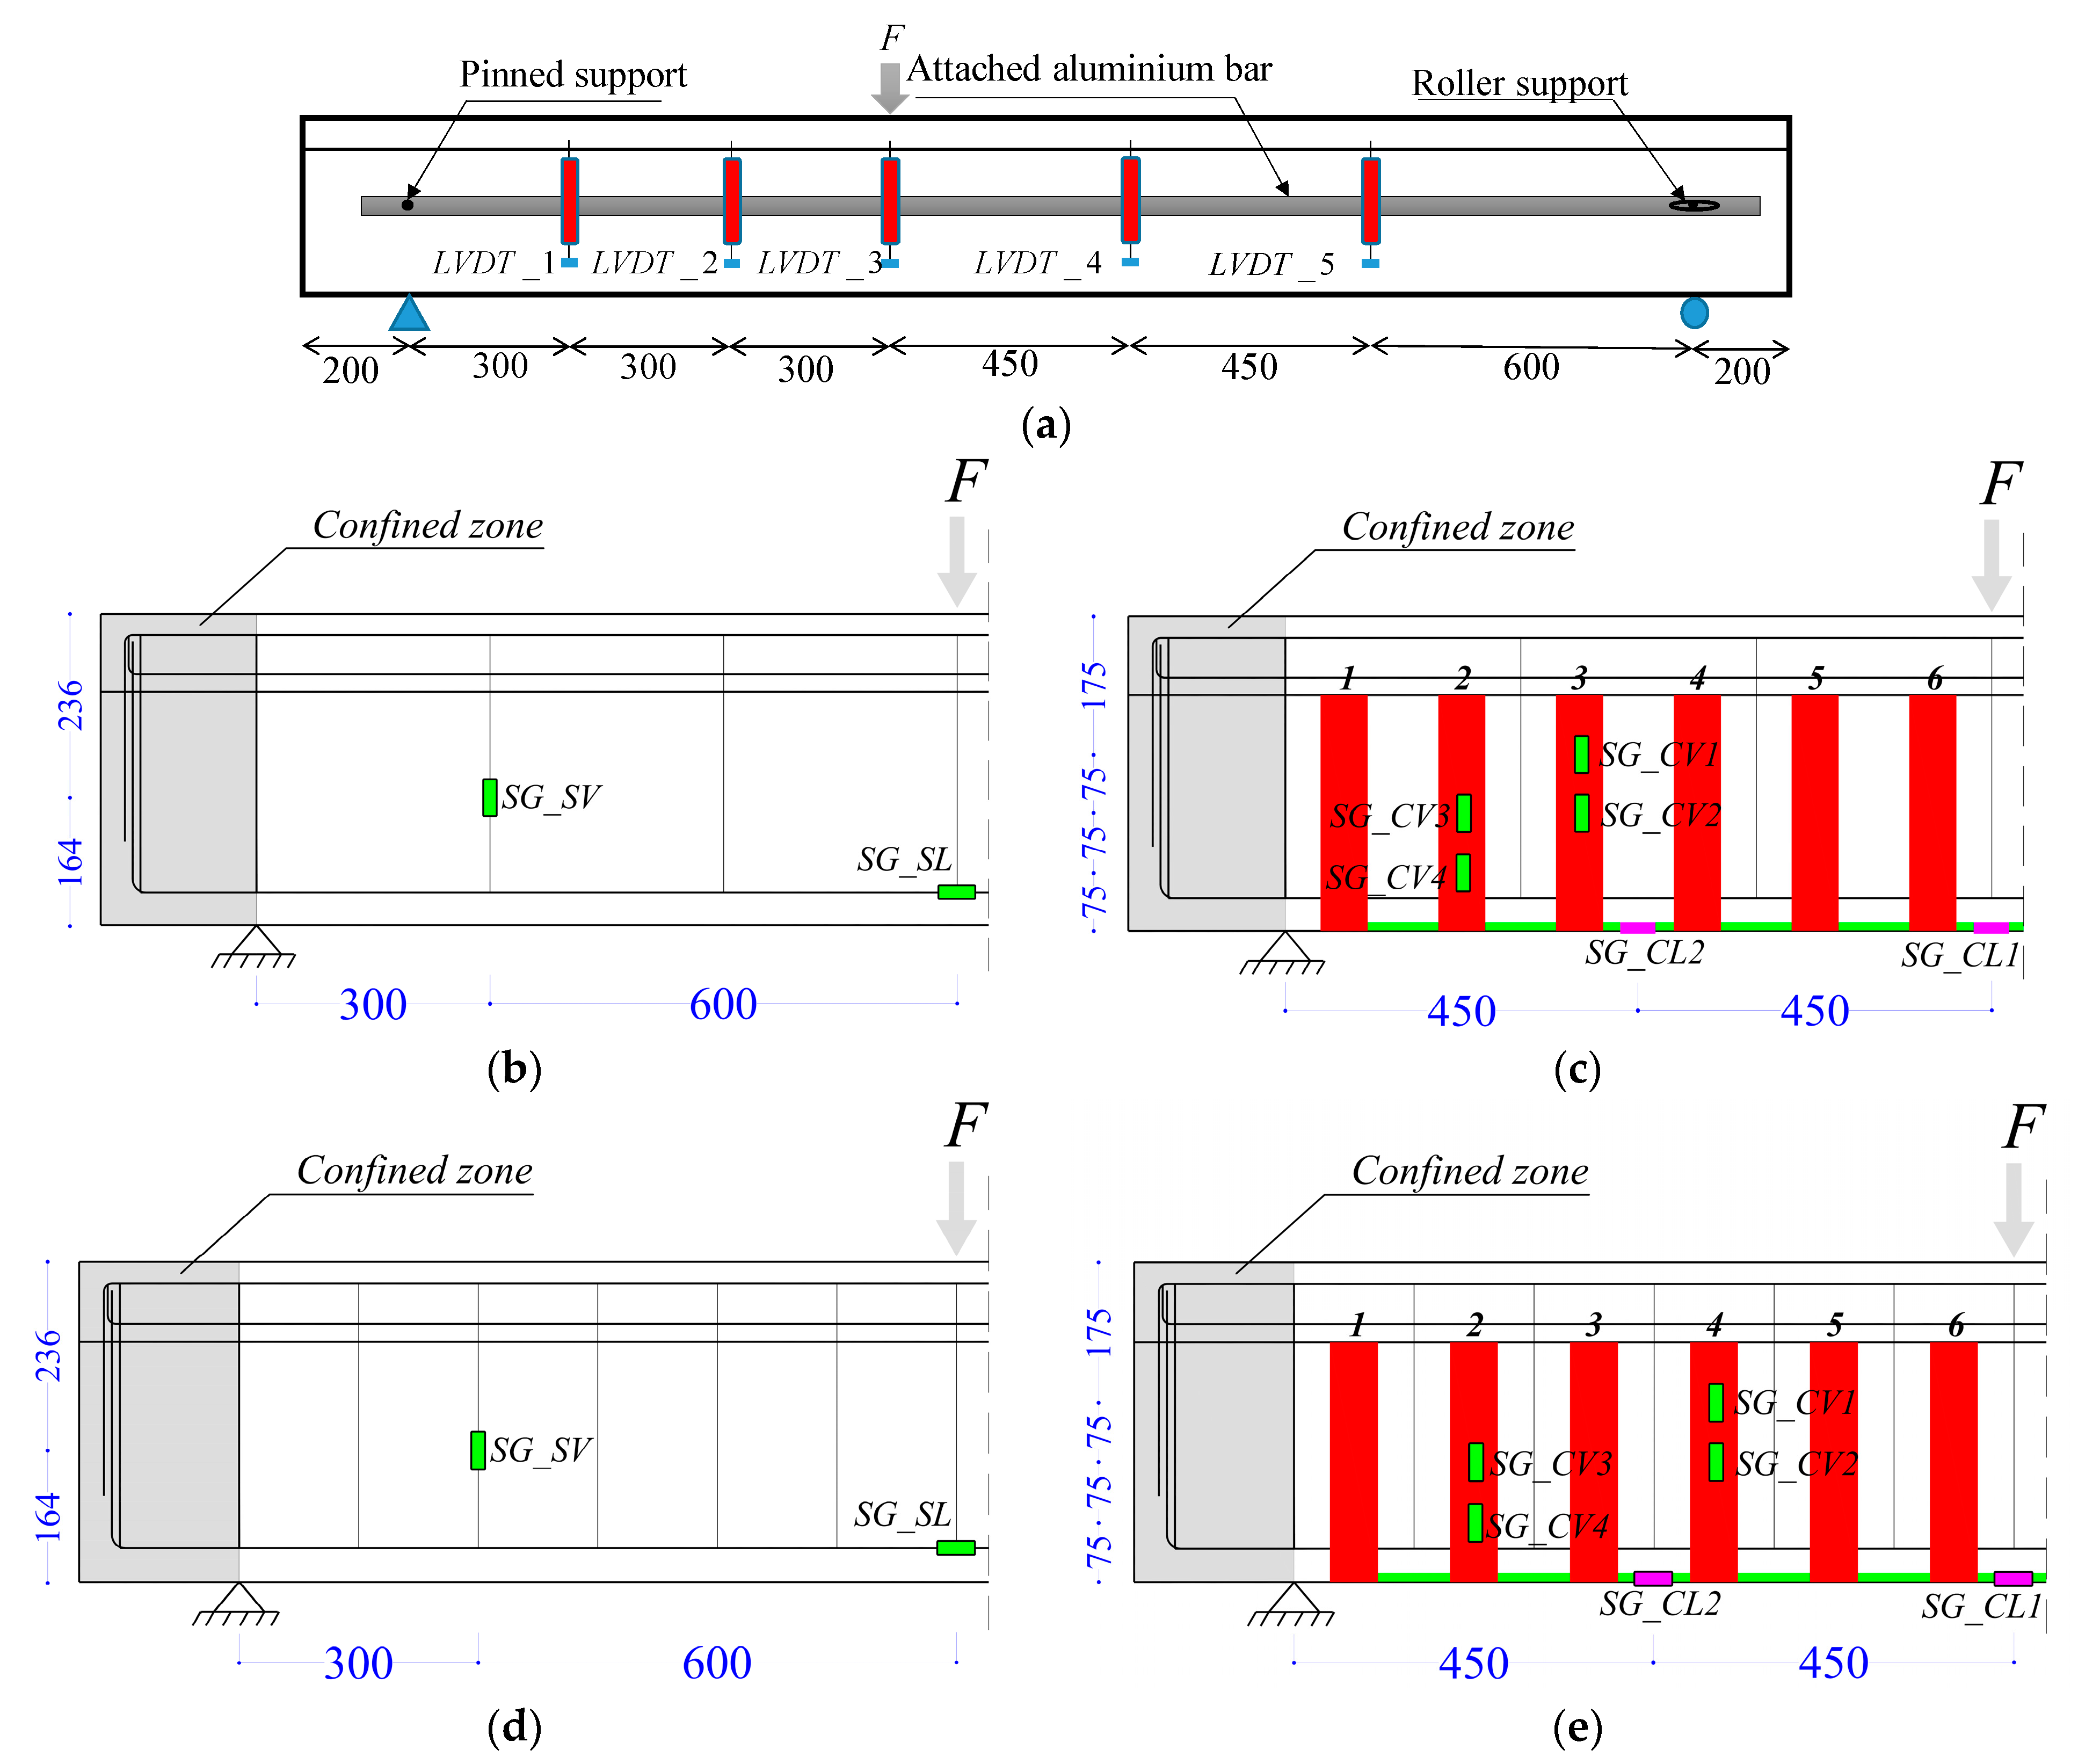
2.2. Measurement Instrumentation

The experimental setup utilized a three-point loading scheme as depicted in Figure 1 and Figure 2. Testing was performed using a servo-hydraulic system with a 600 kN actuator and a 500 kN load cell. Displacement was precisely controlled at 0.01 mm/sec by a Linear Variable Differential Transformer (LVDT) integrated into the actuator. For accurate deflection measurements, LVDTs (LVDT_1 to LVDT_5) were mounted on an aluminum bar positioned over the beam’s supports to avoid interference from support settlements, as shown in Figure 2a. Strain gauges were strategically placed on the REF, SFS, and SFSA beams, as illustrated in Figure 2b–e. SG_SV and SG_SL were used for measuring strain in steel stirrups and longitudinal bars, respectively. In the NSM laminate strengthening system, SG_CL1 and SG_CL2 were installed at the loaded section and midpoint of the shear span. Additionally, two strain gauges (SG_CV1 to SG_CV4) were attached to each of the CFRP strips anticipated to contribute significantly to shear strengthening.

2.3. Key Experimental Findings

Table 2 summarizes the principal performance metrics for the beams, including maximum load capacity (Fmax), deflection at the loaded section corresponding to Fmax ( u L S ), failure mode, and peak strains recorded by strain gauges in both the NSM CFRP laminates (used for flexural strengthening) and the U-shaped CFRP strips (applied for shear strengthening). The experimental data are illustrated in the section dedicated to the numerical simulations of the beams, where the accuracy of the predictive model is evaluated based on force–deflection relationships and strain gauge readings.
The beams reinforced with the hybrid CFRP configuration and incorporating the anchorage system (SFSA-I and SFSA-II) demonstrated a significant enhancement in load-carrying capacity compared to the reference beams (REF-I and REF-II), as well as the SFS-I and SFS-II beams. Specifically, SFSA-I and SFSA-II beams achieved a maximum load increase of 54.4% and 50.6% over the reference beams without CFRP, and 17.9% and 17.7% higher than the beams strengthened without the anchorage system, respectively. Additionally, these beams showed a 128% and 123% increase in deflection at maximum load compared to the reference beams, and a 174% and 260% increase compared to the strengthened beams lacking the anchorage system.

3. Finite Element Simulation

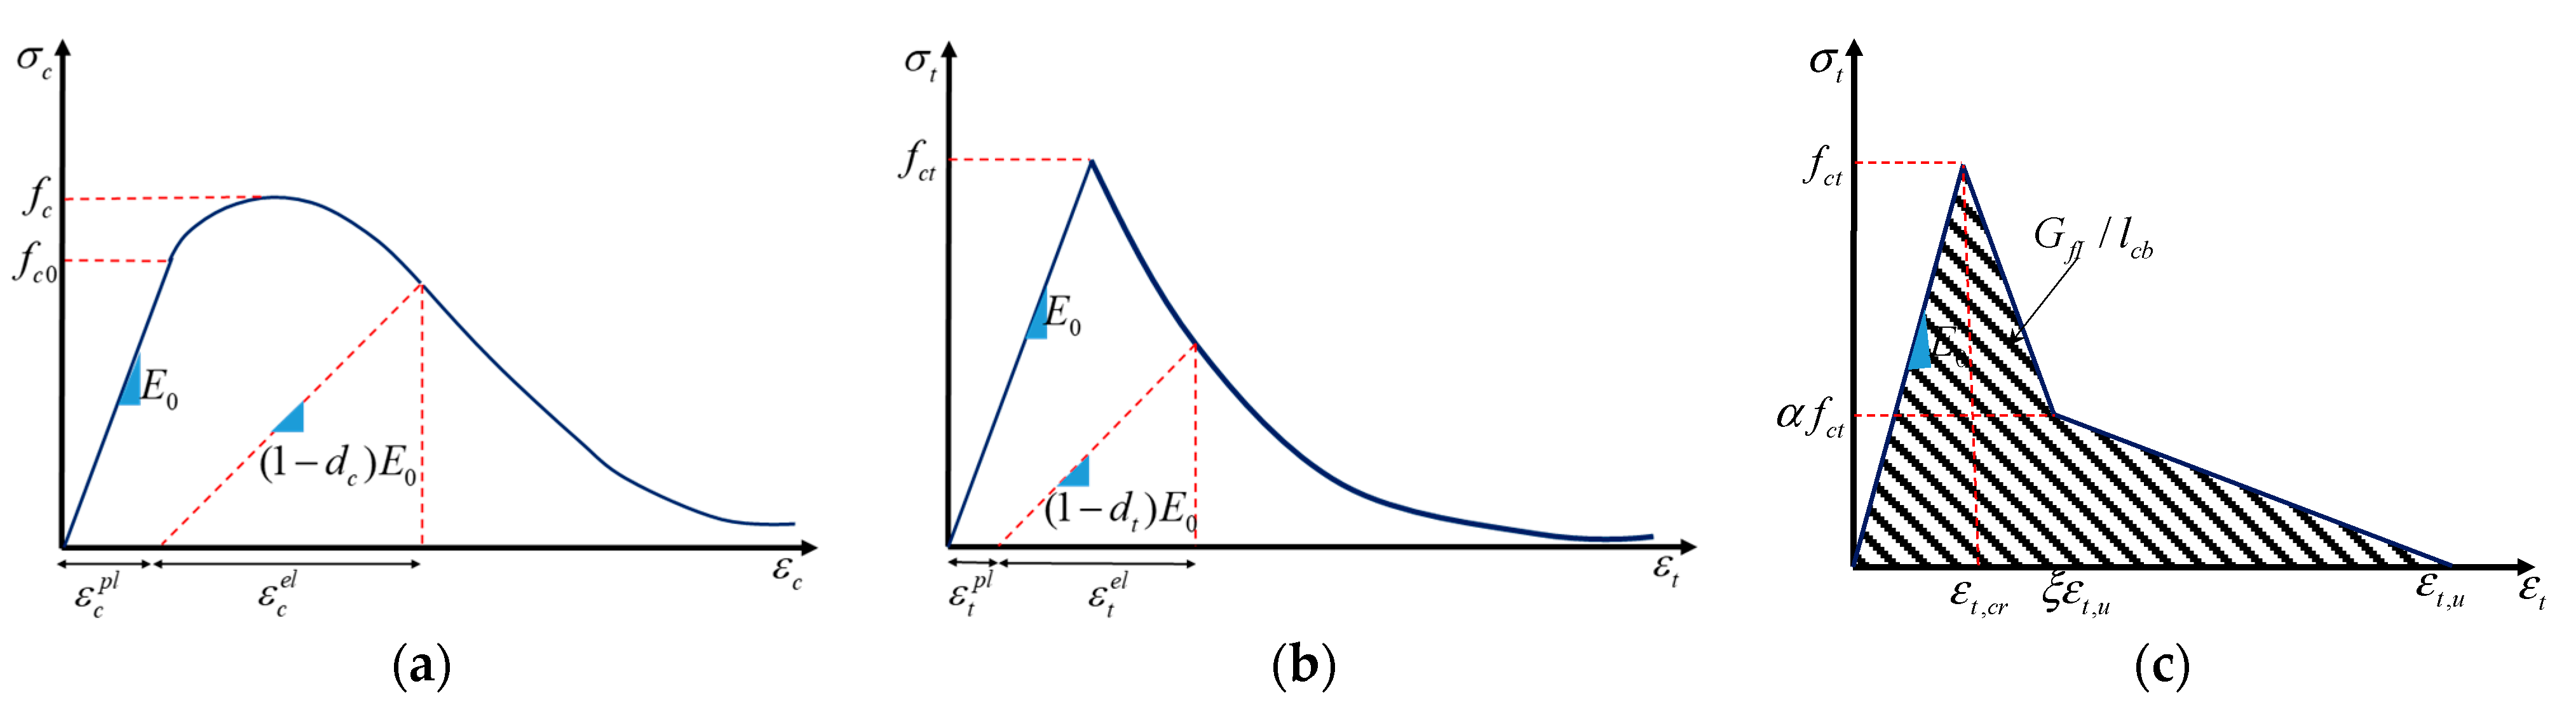
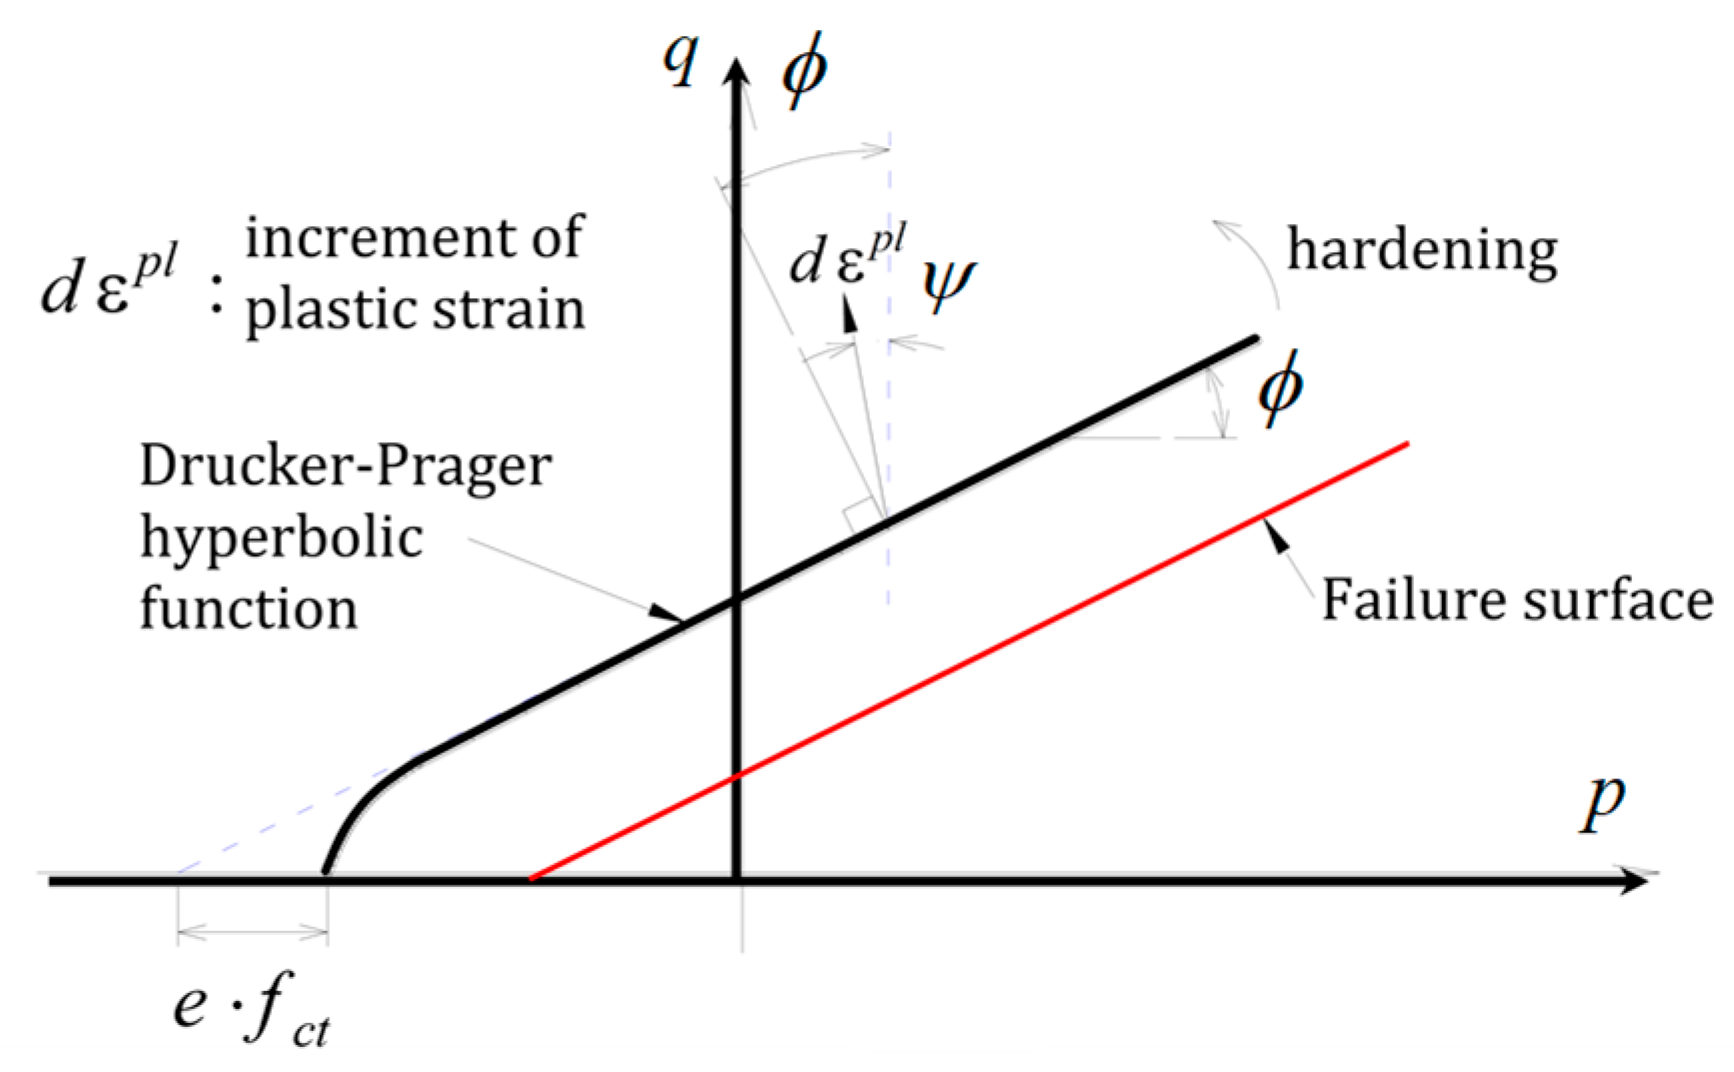
3.1. Summary of Concrete Damage Plasticity Framework and Constitutive Material Models

The Concrete Damage Plasticity (CDP) model enables the simulation of concrete’s tensile and compressive behavior (illustrated in Figure 3 [31]) through the application of the specified stress–strain equations:
σ t = ( 1 d t ) E 0 ( ε t ε t p l )
σ c = ( 1 d c ) E 0 ( ε c ε c p l )
The tensile stress and strain are represented by σ t and ε t , while compressive stress and strain are denoted by σ c and ε c . The longitudinal modulus of the elasticity of concrete is E 0 . Damage parameters d t and d c , ranging from 0 to 1, quantify the degree of damage in tension and compression, respectively. These parameters simulate the degradation of stiffness with increasing plastic strains in tension ( ε t p l ) and compression ( ε c p l ):
ε t p l = ε t d t ( 1 d t ) f c t E 0
ε c p l = ε c d c ( 1 d c ) f c 0 E 0
The concrete tensile strength is denoted by f c t , and f c 0 represents the compressive stress at which the material exhibits nonlinear behavior (illustrated in Figure 3). Mander’s model [32] is employed to simulate the compressive behavior of concrete.
Figure 3. Concrete compression and tension stress–strain relation under uniaxial loading: (a) compression, (b) tension; (c) numerical representation of concrete tensile behavior [33].
Jcs 08 00348 g003
Simulating Concrete’s Uniaxial Tension Characteristics
The post-cracking tensile response of concrete is captured using the diagram illustrated in Figure 3c. This diagram incorporates the Mode I fracture energy, denoted as G f I , along with the tensile strength f c t and a bilinear curve shape, in line with the guidelines from the Model Code 2010 [33], with minor modifications. To maintain the accuracy of results irrespective of the finite element mesh refinement, the area under the tensile stress-strain curve is treated as G f I / l c b , where l c b denotes the crack bandwidth (as shown in Figure 3c). The crack bandwidth l c b is approximated as the cubic root of the solid finite element volume used. As the finite element mesh becomes more refined, the l c b effectively reduces, reflecting the decrease in element volume.
Characterizing Concrete’s Multiaxial Stress–Strain Behavior
The concrete’s response under multiaxial stress and strain conditions is characterized by the following equation:
σ = ( 1 d ) D 0 e l : ε ε p l
D 0 e l represents the elastic stiffness, which is determined by the concrete’s modulus of elasticity and Poisson’s ratio, while σ and ε are the stress and strain tensors, respectively.
To consider simultaneously the damage in tension and compression, the damage parameter, d, is determined from the following:
( 1 d ) = ( 1 s t d c ) ( 1 s c d t )
where
s t = 1 w t r ( σ ^ ) ;       0 w t 1 , s c = 1 w c ( 1 r ( σ ^ ) ) ;     0 w c 1
with wt and wc being material properties that control the level of stiffness recovery, typical of concrete under cyclic loading, mainly from tension to compression. In Equation (7) the following is true:
r ( σ ^ ) = i = 1 3 σ ^ i i = 1 3 σ ^ i ;       0 r ( σ ^ ) 1
where σ ^ i are the principal stress components and . is the Macaulay bracket ( x = 1 / 2 x + x ).
To determine how the stress field evolves under a multiaxial stress field and attending the concrete constitutive law, the following yield surface function is utilized:
F = 1 1 α ( q 3 α p + β σ max γ σ max ) σ ¯ c = 0
where
0 α = f b 0 / f c 0 1 2 f b 0 / f c 0 1 0.5
β = σ ¯ c ε c p l σ ¯ t ε t p l ( 1 α ) ( 1 + α )
γ = 3 1 K c 2 K c 1
In Equation (9), p = 1 / 3 σ : I represents the hydrostatic equivalent pressure, q = 2 / 3 S : S stands for the Von Mises equivalent deviatoric stress (where S = p I + σ ), and σ max corresponds to the maximum principal effective stress, which is explained in detail elsewhere [34]. In Equation (10), f b 0 signifies the concrete strength under biaxial compression. In Equation (11), σ ¯ c and σ ¯ t are the equivalent stress in compression and tension:
σ ¯ c = σ c ( 1 d c ) σ ¯ t = σ t ( 1 d t )
Lastly, K c is a parameter that typically falls within the range from 0.5 to 1.0, and is commonly assumed as 2/3 for concrete [35].
To account for the nonlinear volume change of concrete in compression, the CDP model employs a non-associated flow rule, which is based on the following flow potential function:
G = e f c t tan ψ 2 + q 2 p tan ψ
In this equation ψ represents the dilation angle, i.e., the tendency of concrete to expand in volume under high compressive shear loading. The parameter e determines the rate at which the G function approaches its asymptote (as illustrated in Figure 4, which ϕ corresponds to the concrete internal friction angle).
Modeling the steel reinforcement and CFRP materials
Steel used for longitudinal and shear reinforcement is simulated by a bilinear plasticity model considering the average values of yield stress, ultimate stress, yield strain, and ultimate strain obtained experimentally, as detailed in Section 2.1.
For CFRP materials, including NSM bars and CFRP strips, a similar model was used, considering the average ultimate stress and strain obtained experimentally, as presented in Section 2.1, materials were modeled as linear elastic, failing completely upon reaching the ultimate stress. The CFRP strips were modeled as Lamina material with orthotropic elasticity under plane stress, using the average modulus of elasticity in the fiber direction from the material tests. Very low values were attributed to the transverse modulus of elasticity and shear modulus to simulate the unidirectional nature of the CFRP.
Simulation of Concrete–CFRP Strip Interface Behavior
The NSM-CFRP laminates were assumed to have a perfect bond to the substrate. However, in the case of the EBR-CFRP strips using wet lay-up sheets, the possibility of debonding was taken into account and simulated using the following failure criteria:
max t n t n , 0 , t s t s , 0 , t t t t , 0 = 1
In this equation, t n , 0 represents the resisting tensile strength of the interface, while t s , 0 and t t , 0 denote the resisting shear strength of the interface in s and t directions. In the present context, the interface is the system formed by the CFRP–adhesive and adhesive–concrete substrate bonding zones and the adhesive. It is important to note that the shear strength was assumed to be the same in both the s and t shear directions.
To model the sliding components, the t s and t t relationships (assumed both equal) and the bilinear diagram proposed in fib Bulletin 90 [26], and represented in Figure 5, were adopted. Consequently, t s , 0 = t t , 0 = τ 0 , s s , 1 = s t , 1 = s 1 , and s s , 0 = s t , 0 = s 0 were used in the calculations.
The stress distribution within this interface is derived from the following equations:
t n d = ( 1 D ) t n , 0         when         t n 0 t n , 0                             when         t n 0
t s d = ( 1 D ) t s , 0
t t d = ( 1 D ) t t , 0
In Equations (16)–(18), the scalar damage parameter, D, varies between 0 and 1, and is determined by the following relationship:
D = s 1 ( s m max s 0 ) s m max ( s 1 s 0 )
where s 0 represents the slip at peak bond strength and s 1 signifies the ultimate slip, with their specific values according to the fib Bulletin 90 recommendations. Additionally, s m max represents the maximum slip occurred in the two sliding directions, i.e., s m max = max ( s s ; s t ) .

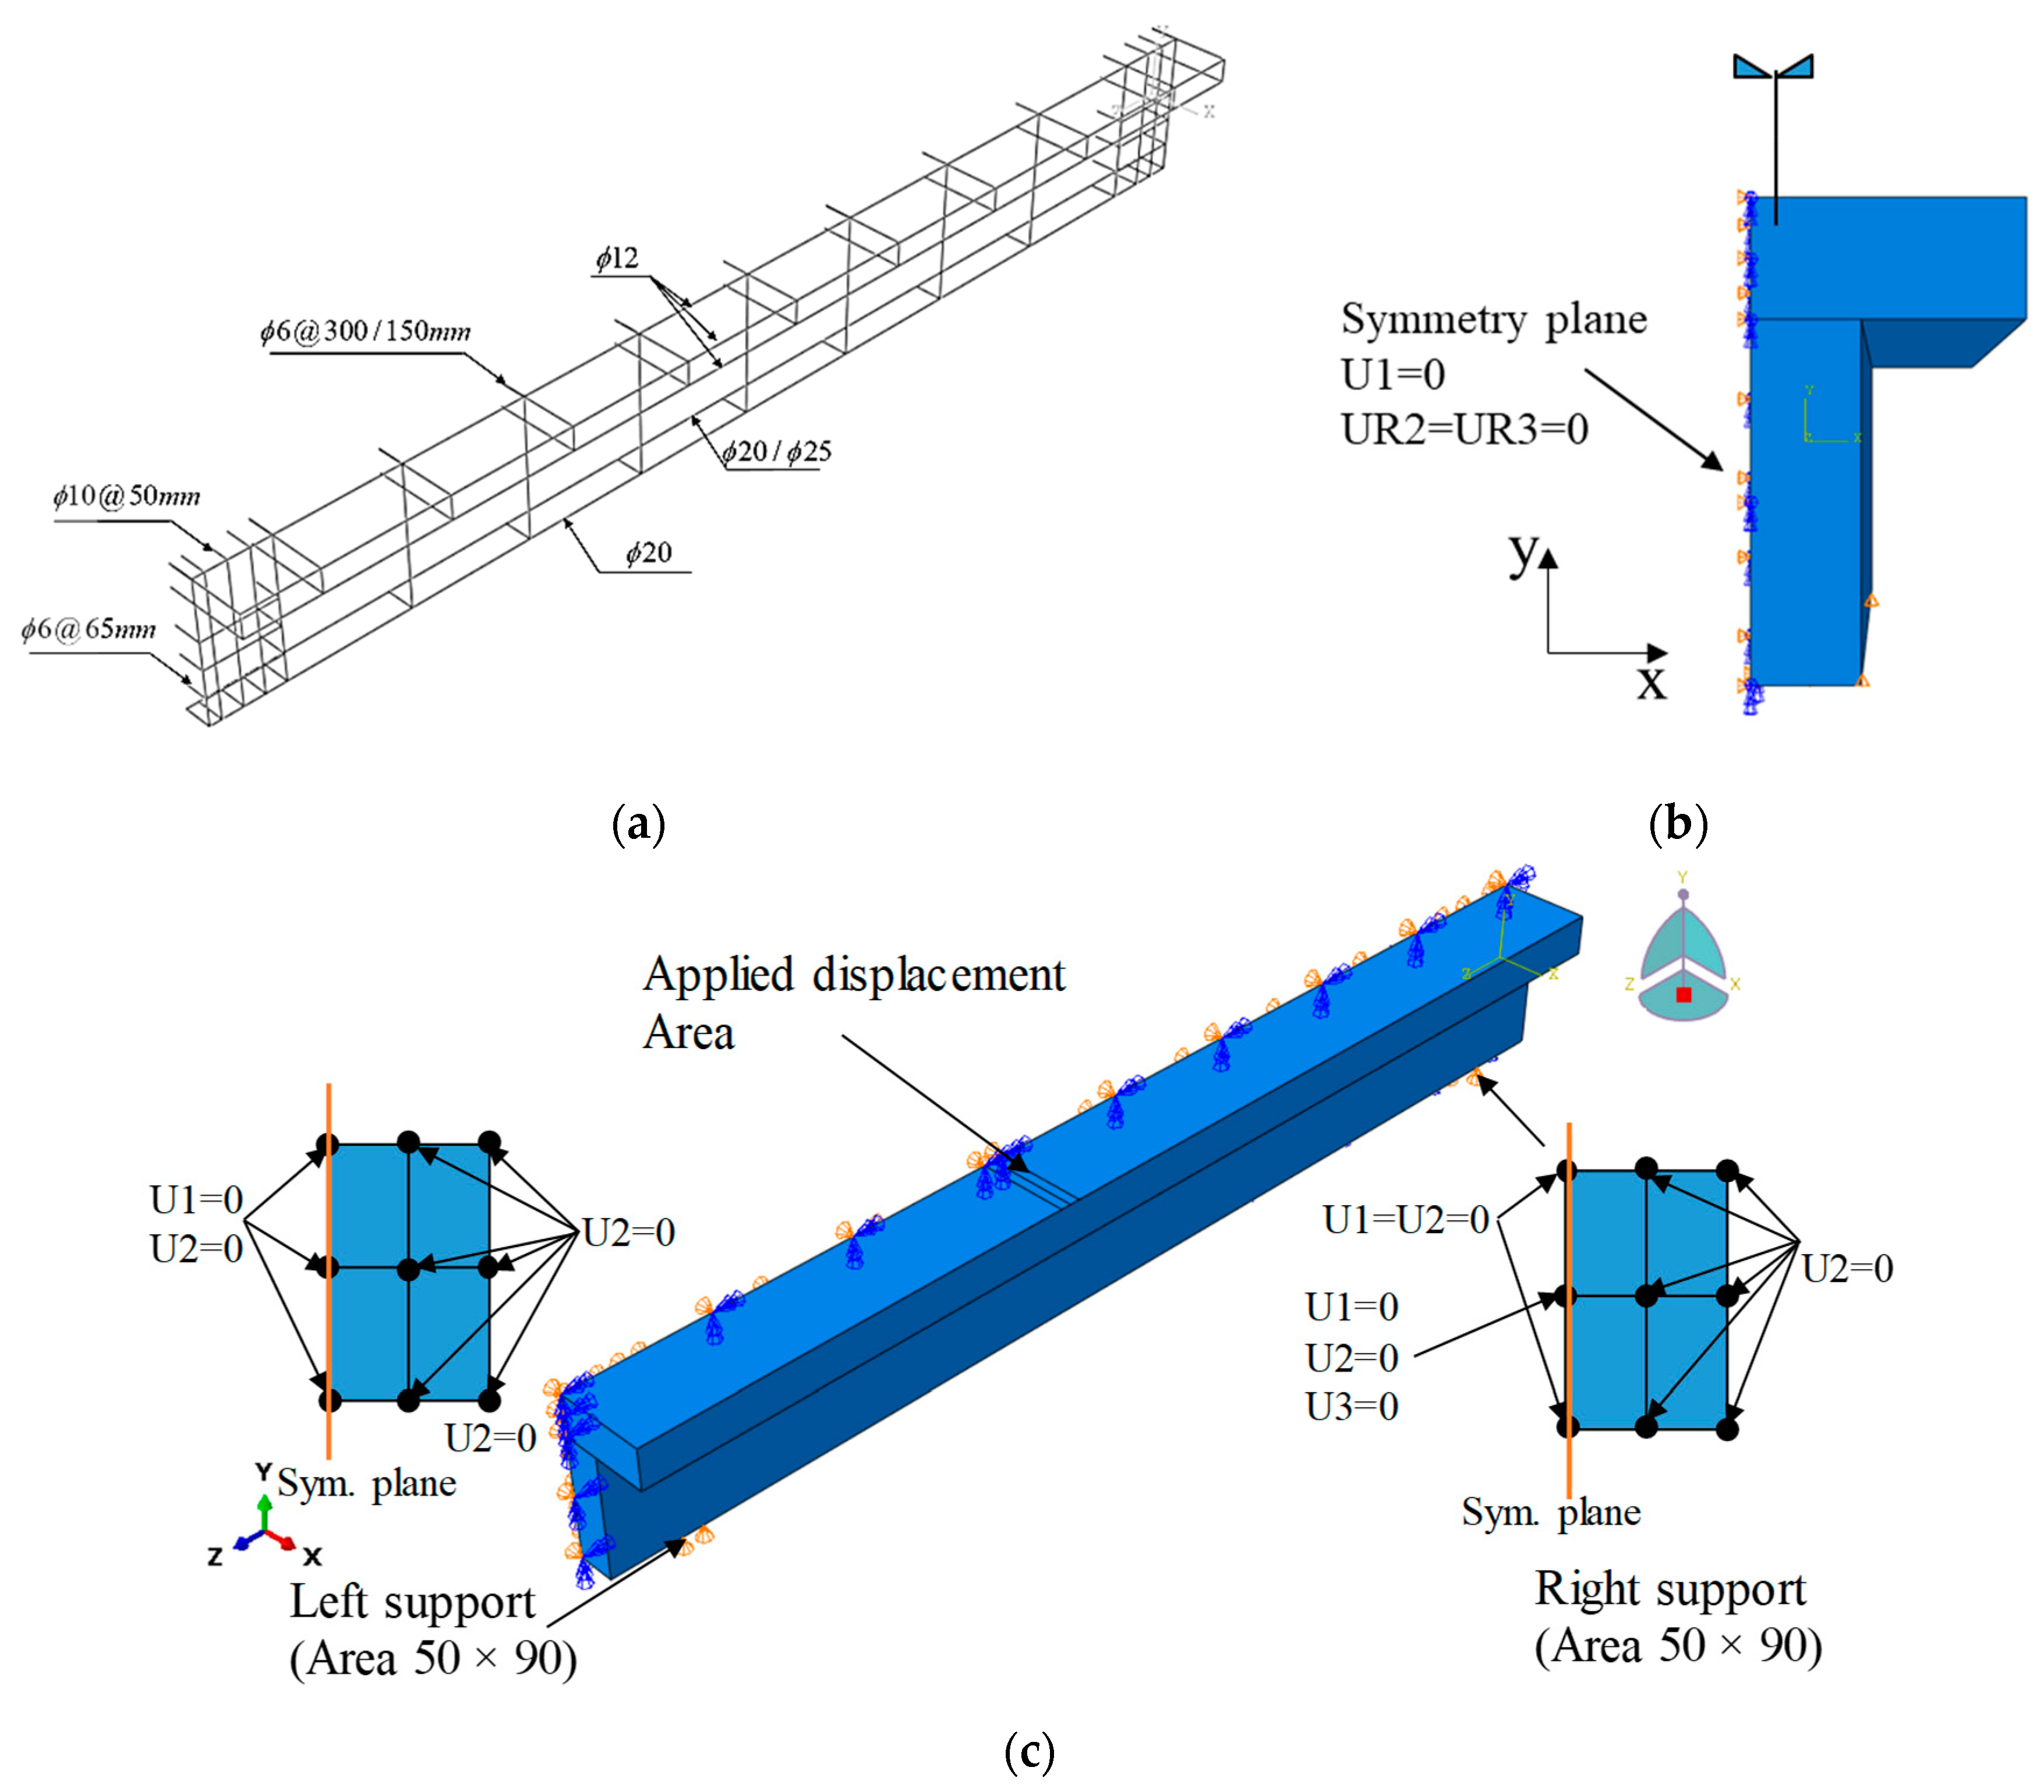
3.2. Discretization of the Model, Boundary Conditions, and Parameter Specifications

To optimize the computational process, only half of the beam was modeled, taking advantage of its longitudinal symmetry. Details on the support and loading conditions are provided in Figure 6a,b. The parameters for the Concrete Damage Plasticity (CDP) model are specified in Table 3.
For the concrete component, eight-node solid elements (C3D8) were employed, using a 2 × 2 × 2 Gauss–Legendre integration scheme. The steel reinforcement was represented using 2-node 3D truss elements (T3D2), which were assumed to be perfectly bonded to the concrete, as illustrated in Figure 6a.
The Near Surface Mounted (NSM) CFRP laminates were modeled with 2-node beam elements (B33) featuring a 50 mm mesh size. Meanwhile, the CFRP strips were represented by 4-node quadrilateral elements (M3D4) that focus exclusively on membrane stiffness, with each element having a 35 mm edge length.
A sensitivity analysis was conducted to assess the influence of finite element (FE) mesh refinement on the force versus loaded–section deflection relationship. The reference beam REF-I (Figure 1a and Table 1) was used for this analysis, and the results are presented in Figure 7. The analysis revealed a tendency for the load-carrying capacity to decrease with the decrease in the size of the FE (more refined meshes). A compromise between accuracy and computing time suggests a mesh size of 35 mm, which will be used for subsequent simulations, as shown in Figure 8. Figure 12a shows the numerically predicted principal plastic strains (with a mesh size of 35 mm) compared to the experimental crack pattern observed, demonstrating that the model was capable of accurately localizing the occurrence of the critical diagonal crack. This comparison assumes that damage due to crack formation and propagation can be identified in the CDP model by the maximum principal plastic strains. Therefore, when, in this document, the “numerical crack pattern” designation is used, it represents the maximum principal plastic strain field.

4. Modeling Results

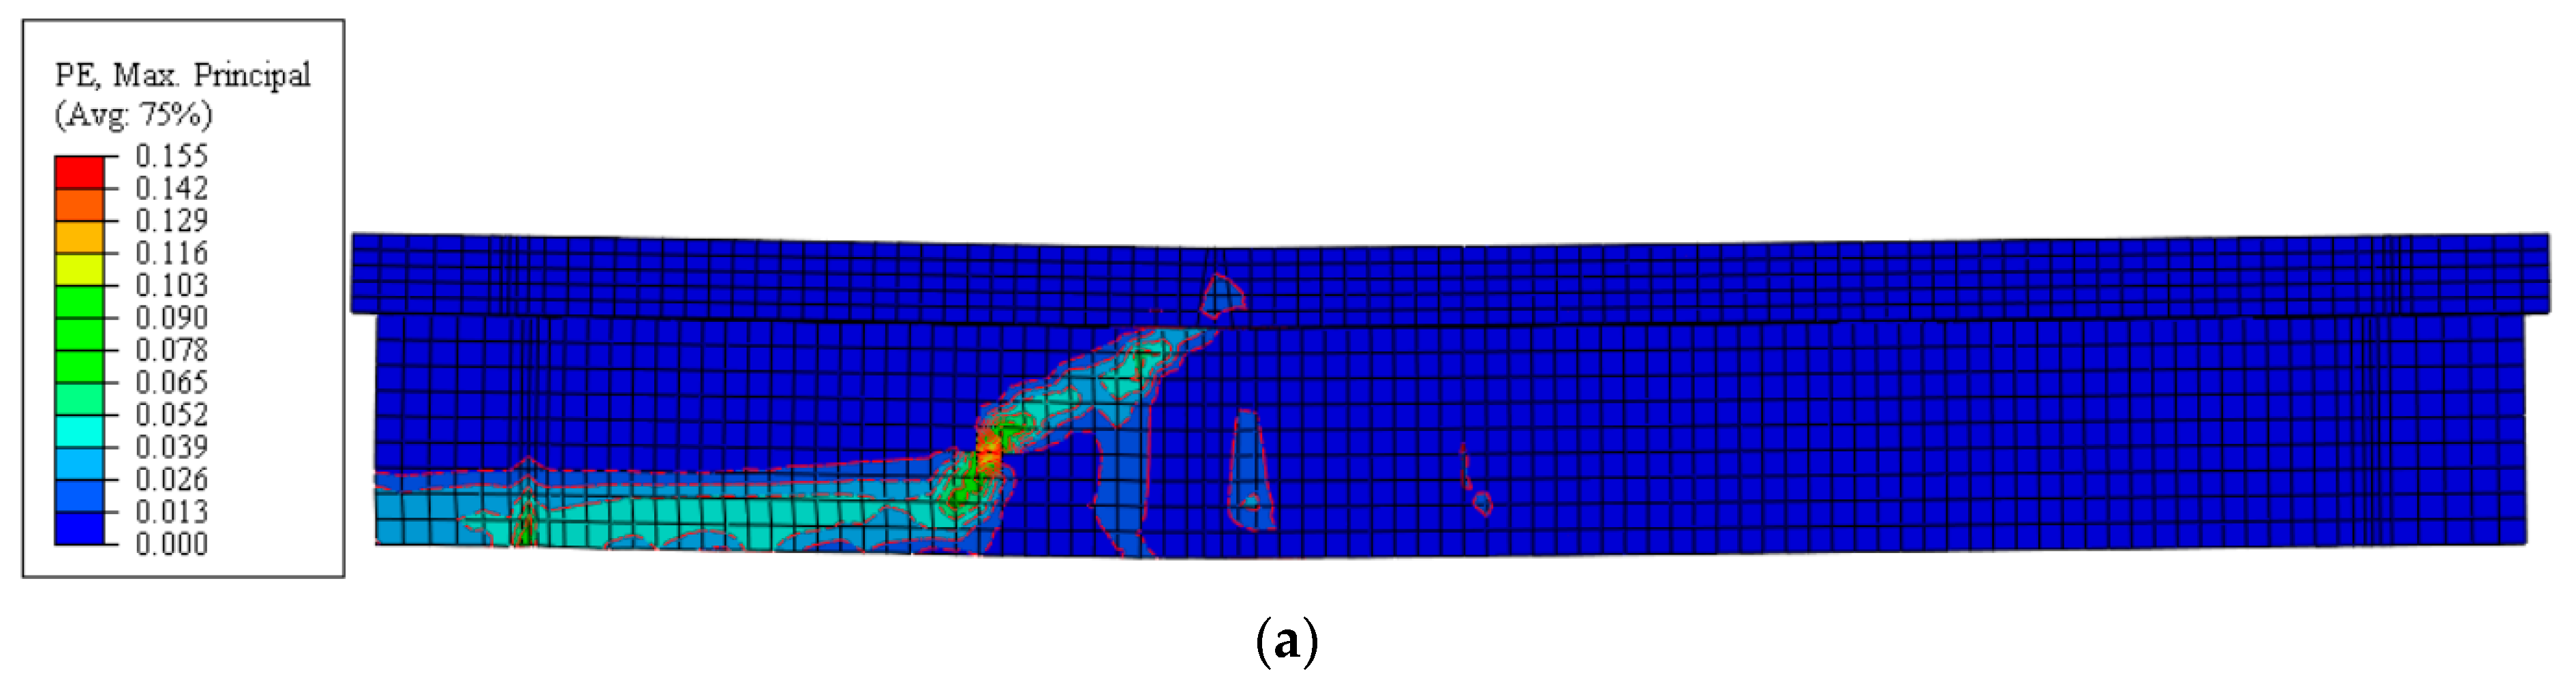
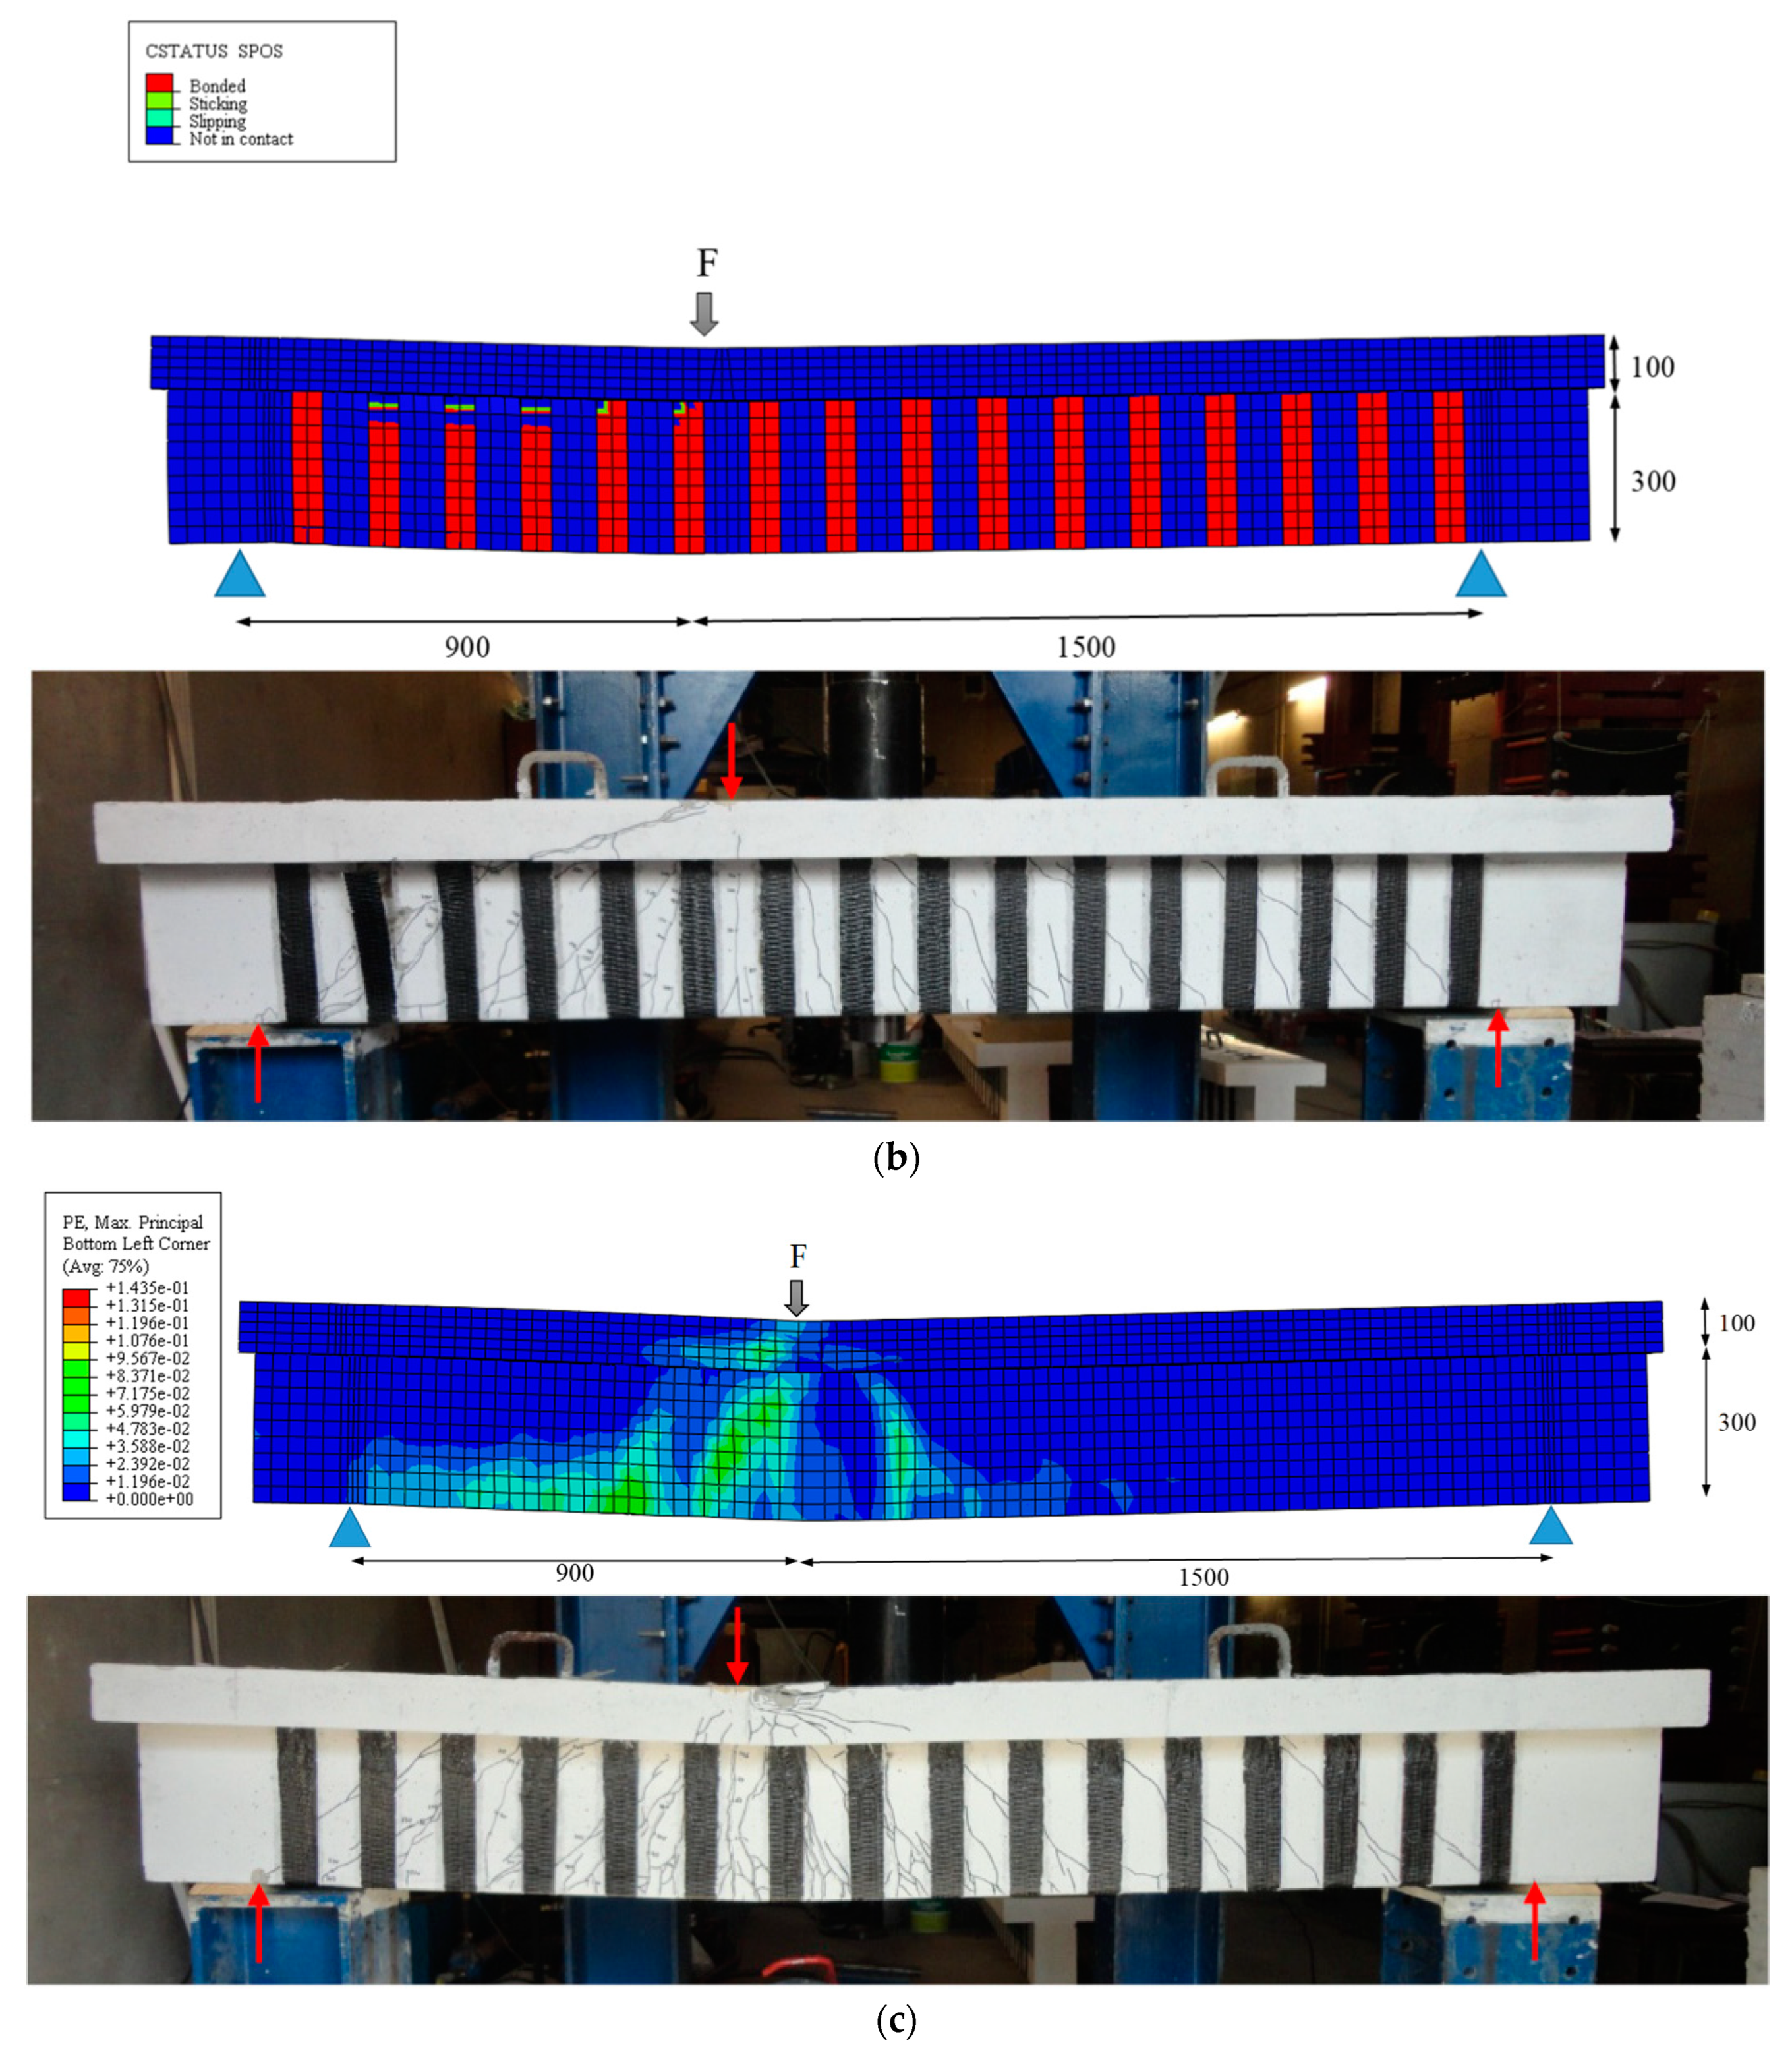
4.1. Impact of Bonding Interfaces on the Behavior of U-Shaped CFRP Strips

The influence of bond conditions between U-shaped EBR-CFRP strips and concrete substrate was assessed by simulating the tests of the SFS-I and SFS-II beams and analyzing the force versus deflection relationship. Two distinct bond conditions were considered: (1) perfect bonding and (2) debonding as per fib Bulletin 90 recommendations (as illustrated in Figure 5). In the debonding scenario, the values adopted for the bond strength ( τ 0 ), peak debonding slip ( s 0 ), and ultimate debonding slip ( s 1 ) were 6.95 MPa, 0.0107 mm, and 0.24 mm, respectively. Figure 9 presents a comparison between the numerical simulations and experimental records for the SFS-I and SFS-II beams. In the SFS-I beam (Figure 9a), just after a deflection of approximately 6 mm, the beam’s stiffness decreases more pronouncedly when the debonding is simulated. The SFS-II beam (Figure 9b) exhibits lower sensitivity to bond parameters, with failure occurring at around 8 mm, closely resembling the experimental failure point (at 9.23 mm). The lower sensitivity of the SFS-II beam to the bond parameters can be attributed to the percentage of shear stirrups; as the shear steel reinforcement in the SFS-II beam is higher than in SFS-I (by altering the spacing of stirrups from 300 mm in SFS-I to 150 mm in SFS-II), and the percentage of shear CFRP reinforcement is smaller (one layer of U-shaped CFRP strips in SFS-II beam when compared to SFS-I beam with two layers of U-shaped CFRP strips), the contribution of CFRP reinforcement becomes less significant compared to its contribution in the SFS-I beam. Consequently, the shear load is primarily borne by the steel stirrups and concrete. Notably, when a perfect bond condition is assumed, the degradation of stiffness is considerably smaller, and beam failure is not observed up to the maximum experimentally recorded deflection in both beams.
The failure mode of SFS-I and SFS-II beams was characterized by the debonding of the wet lay-up CFRP sheets intersected by the shear failure crack [13]. Figures 12b and 13b illustrate the crack pattern in SFS-I and SFS-II beams near the failure occurrence. At approximately 8.2 mm deflection and a load of 330 kN, in the case of the SFS-I beam, and 10.42 mm deflection and a load of 382 kN for the SFS-II beam during experimental testing, the upper part of the third CFRP strip from the left support of the beam (strip 3) experienced debonding. This resulted in a reduction in the beam’s load-carrying capacity, accompanied by the propagation of the shear failure crack toward the second CFRP strip (strip 2) from the left support. The force previously supported by strip 3 was transferred to the remaining shear ligaments, leading to an increase in the force sustained by the beam, until the upper part of strip 2 debonded, ultimately causing the beam to fail. According to the experimental results, the SFS-II beam experienced an abrupt failure primarily due to debonding, as observed in Figure 13b, and this sudden failure was accurately captured by the numerical simulation.
The utilization of parameters’ values suggested by fib Bulletin 90 (with τ 0 = 6.95 MPa, s 0 = 0.0107 mm, and s 1 = 0.24 mm) for modeling the debonding of these strips resulted in earlier initiation of failure than observed in experiments. This led to a more significant degradation of the beam’s stiffness and an anticipation of U-shaped CFRP debonding (as depicted in Figure 9b). In an attempt to avoid this occurrence, the SFS-I beam was also simulated with a larger ultimate sliding value ( s 1 = 0.3 mm) and bond strength ( τ 0 = 8.5 MPa), while the SFS-II beam was simulated with s 1 = 0.28 mm and τ 0 = 6.95 MPa, maintaining s 0 = 0.0107 mm, as suggested by fib Bulletin 90. Figure 10 shows that premature debonding, as previously reported, did not occur. This led to a significant increase in the beam’s load-carrying capacity, emphasizing the relevance of the bond–slip relationship properties.

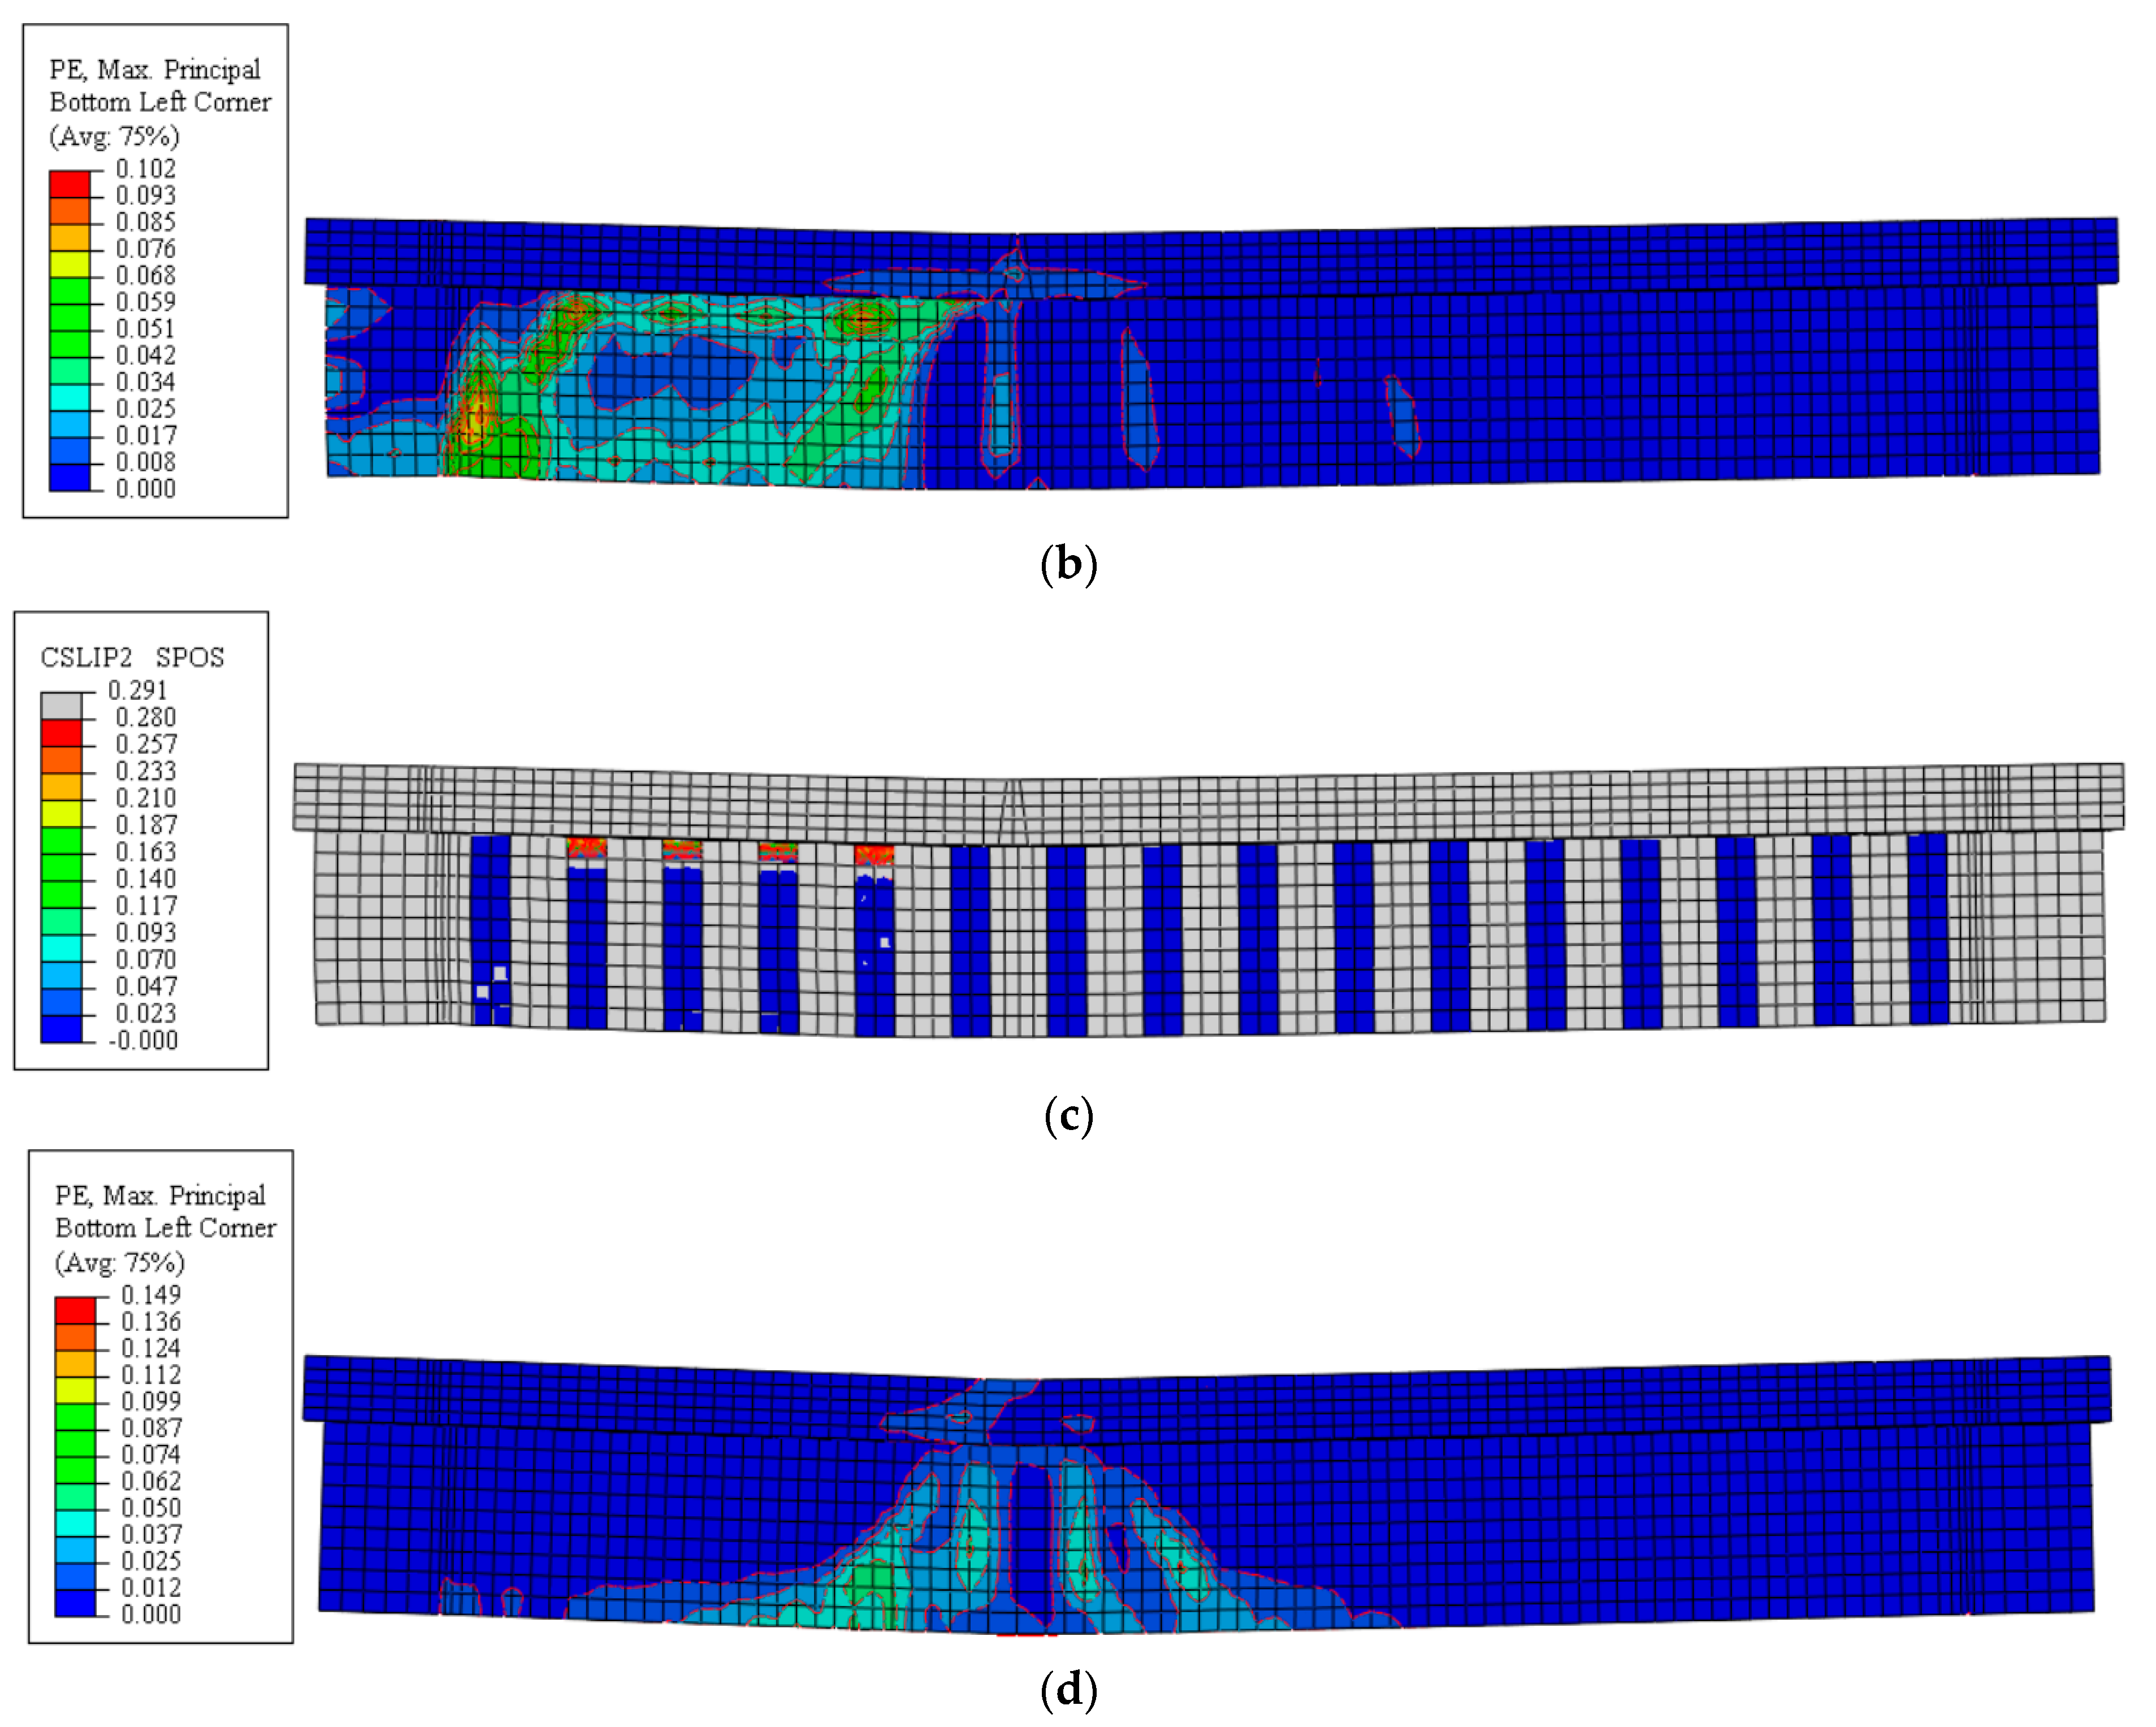
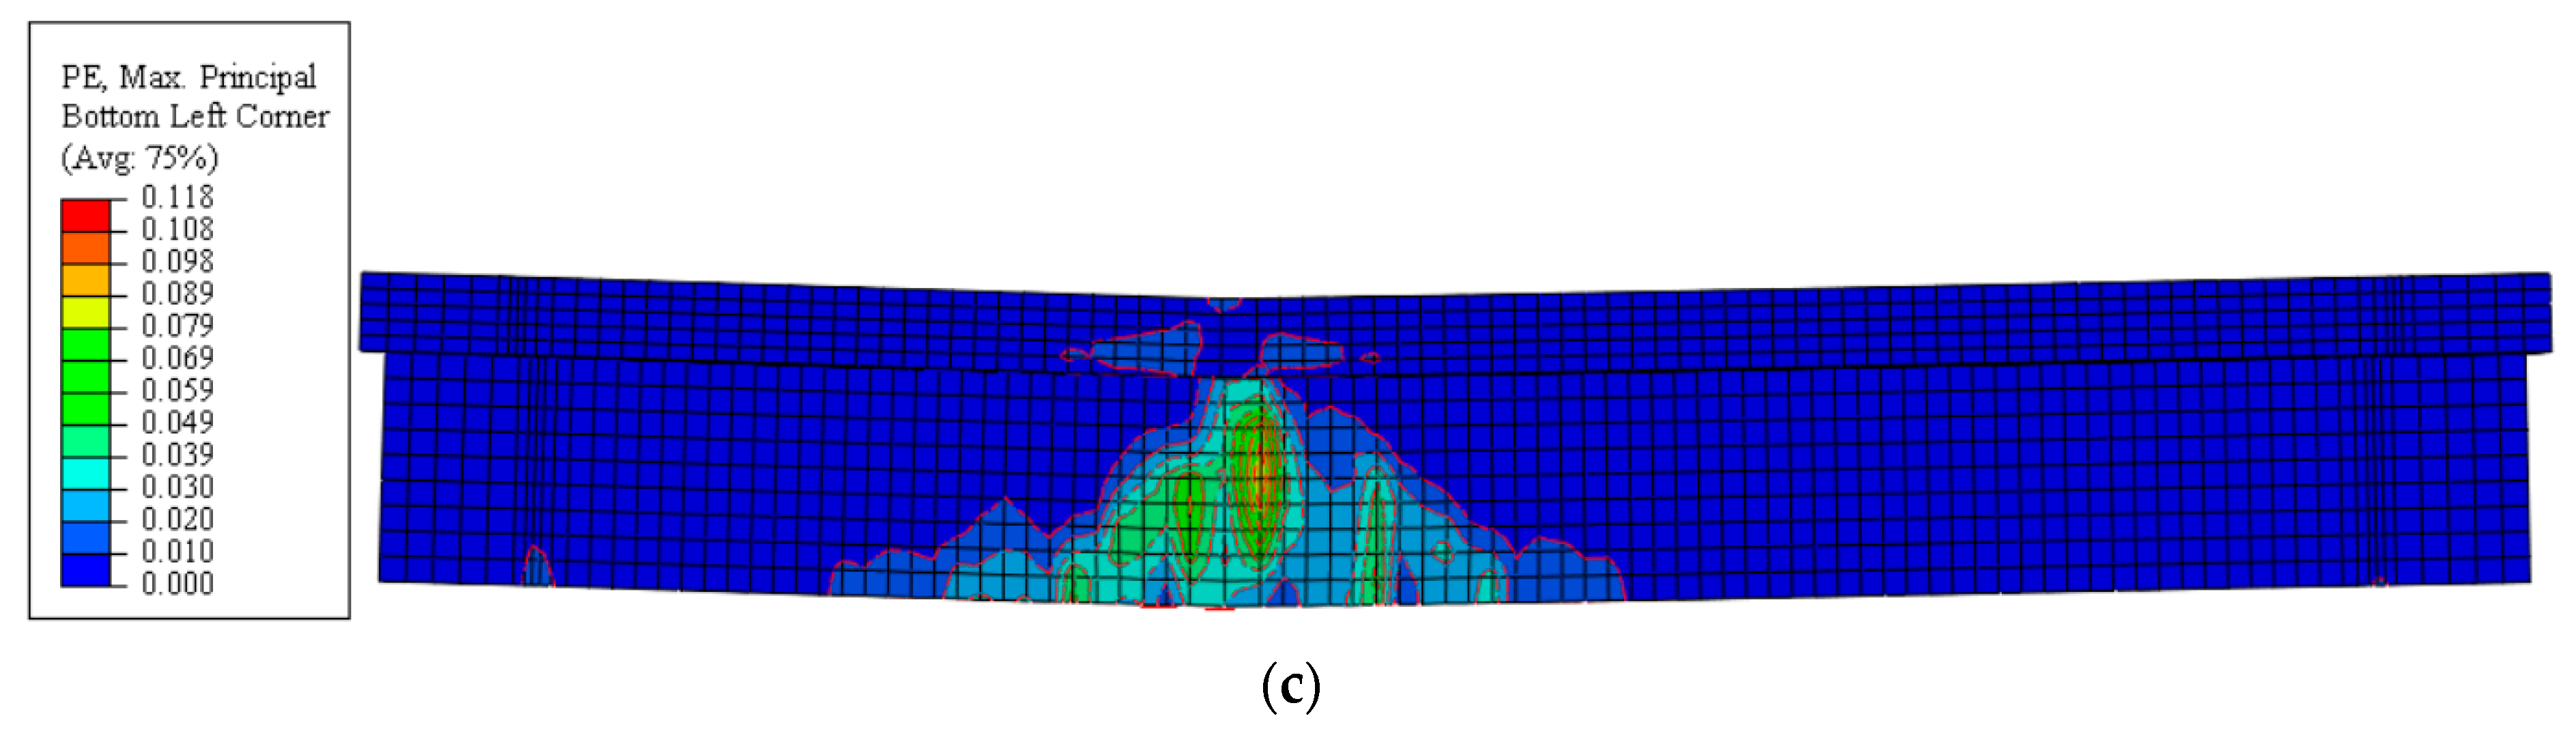
4.2. Beam with Anchorage System: SFSA-I and SFSA-II Beams

As described in Section 2.1, the geometry of the anchors and their installation in the flange region of the beam introduce restrictions on assuring perfect bond conditions to the concrete substrate. The anchors are wrapping concrete mostly submitted to compression, and, due to the concrete’s Poisson effect, they are submitted to radial pressure, which introduces an extra tensile stress to the one applied by their corresponding U-shaped strip through the bond transfer zone connecting these two CFRPs. Probable misalignments and geometric imperfections of anchors that occurred during their installation contribute to the delay of their activation, which can be simulated merely by decreasing their modulus of elasticity. Introducing interface finite elements in between the anchors and concrete substrate would be another possibility but would require more computational exigency and more parameters to be tailored without any rational basis. Therefore, two numerical analyses were executed: (1) both the U-shaped and corresponding anchorage, forming an O-shaped strip fully wrapping the cross-section, are considered in perfect bond conditions with the concrete substrate; (2) the modulus of elasticity of the CFRP of the finite elements simulating the anchors was decreased, while the U part was maintained in perfect bond conditions.
Figure 11 compares the experimental and numerical force versus deflection of SFSA-I and SFSA-II beams, both strengthened with anchorages. Assuming perfect bond conditions for the anchors, the numerical simulations predicted peak loads 6% and 7.5% higher than the experimental results for SFSA-I and SFSA-II, respectively. The higher stiffness of the predictions started during the cracking propagation stage, suggesting that the assumption of perfect bond conditions is not realistic. By reducing by 20% the modulus of elasticity of the CFRP of the anchors, the stiffness degradation before and after the yield initiation registered experimentally was better captured. From the obtained results, it seems that the decreased level of the modulus of elasticity of the anchors should increase with the beam’s load-carrying capacity, due to the larger volume of concrete in compression that interacts with the anchors through transversal pressure. In fact, by reducing by 30% the modulus of elasticity of the anchors, a better prediction was obtained for the SFSA-II beam (Figure 11b).
It should be realized that fib bulletin 90 recommends a reduction of 20% (at parameter) on the bond strength, ffwd,c = kR at ffd (ffd: FRP tensile strength; kR: reduction factor due to radius of the corners of the beam’s section) when using closed strips applied according with the EBR technique (O shape configuration). When using U strips with anchors, fib bulletin 90 recommends an extra reduction of at least 10% (ka parameter): ffwd = ka ffwd,c, therefore a reduction of between 20 and 30% of the modulus of elasticity of the material forming the anchors seems an adequate interval, as shown in Figure 11. In the following numerical simulations, a reduction of between 20% and 30% of the modulus of elasticity of the CFRP of the anchors was considered for the series SFSA-I and SFSA-II, respectively.
The experimental crack patterns at failure and the maximum principal plastic strain field are represented in Figure 12c and Figure 13c, where it is visible that the model was able to predict the shear failure for the reference beams and flexural failure for the strengthened beams of these two groups.

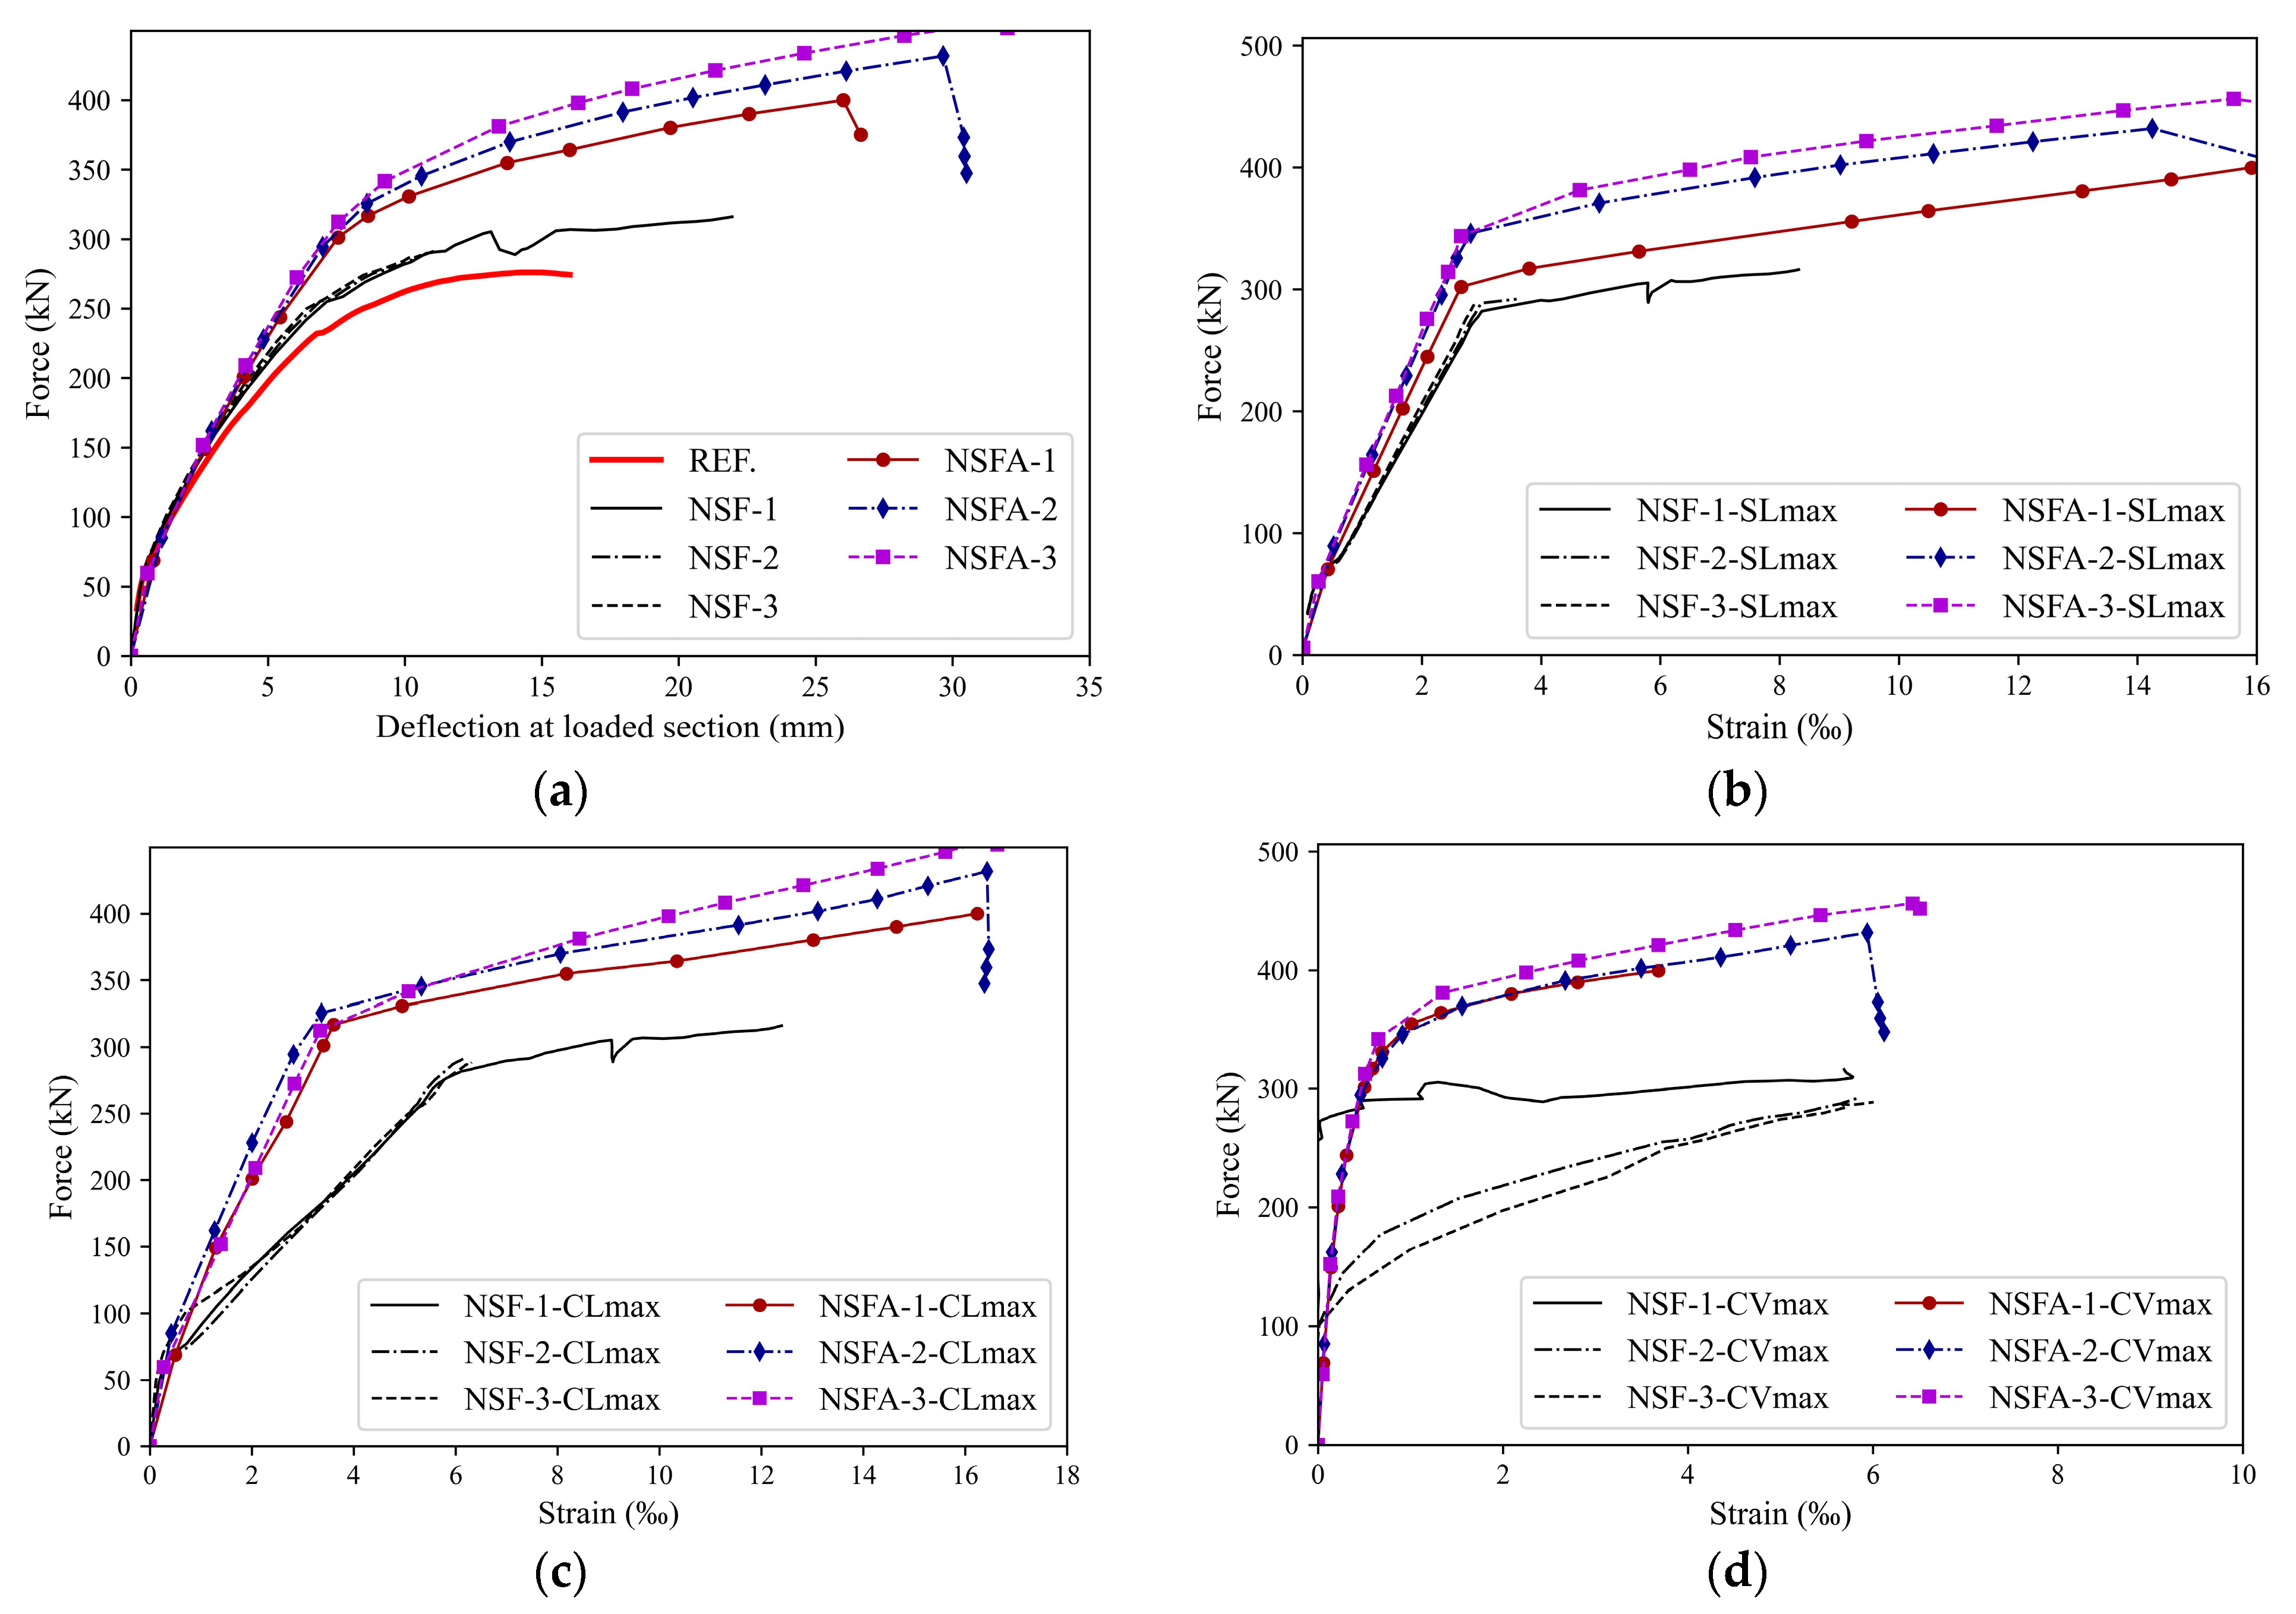
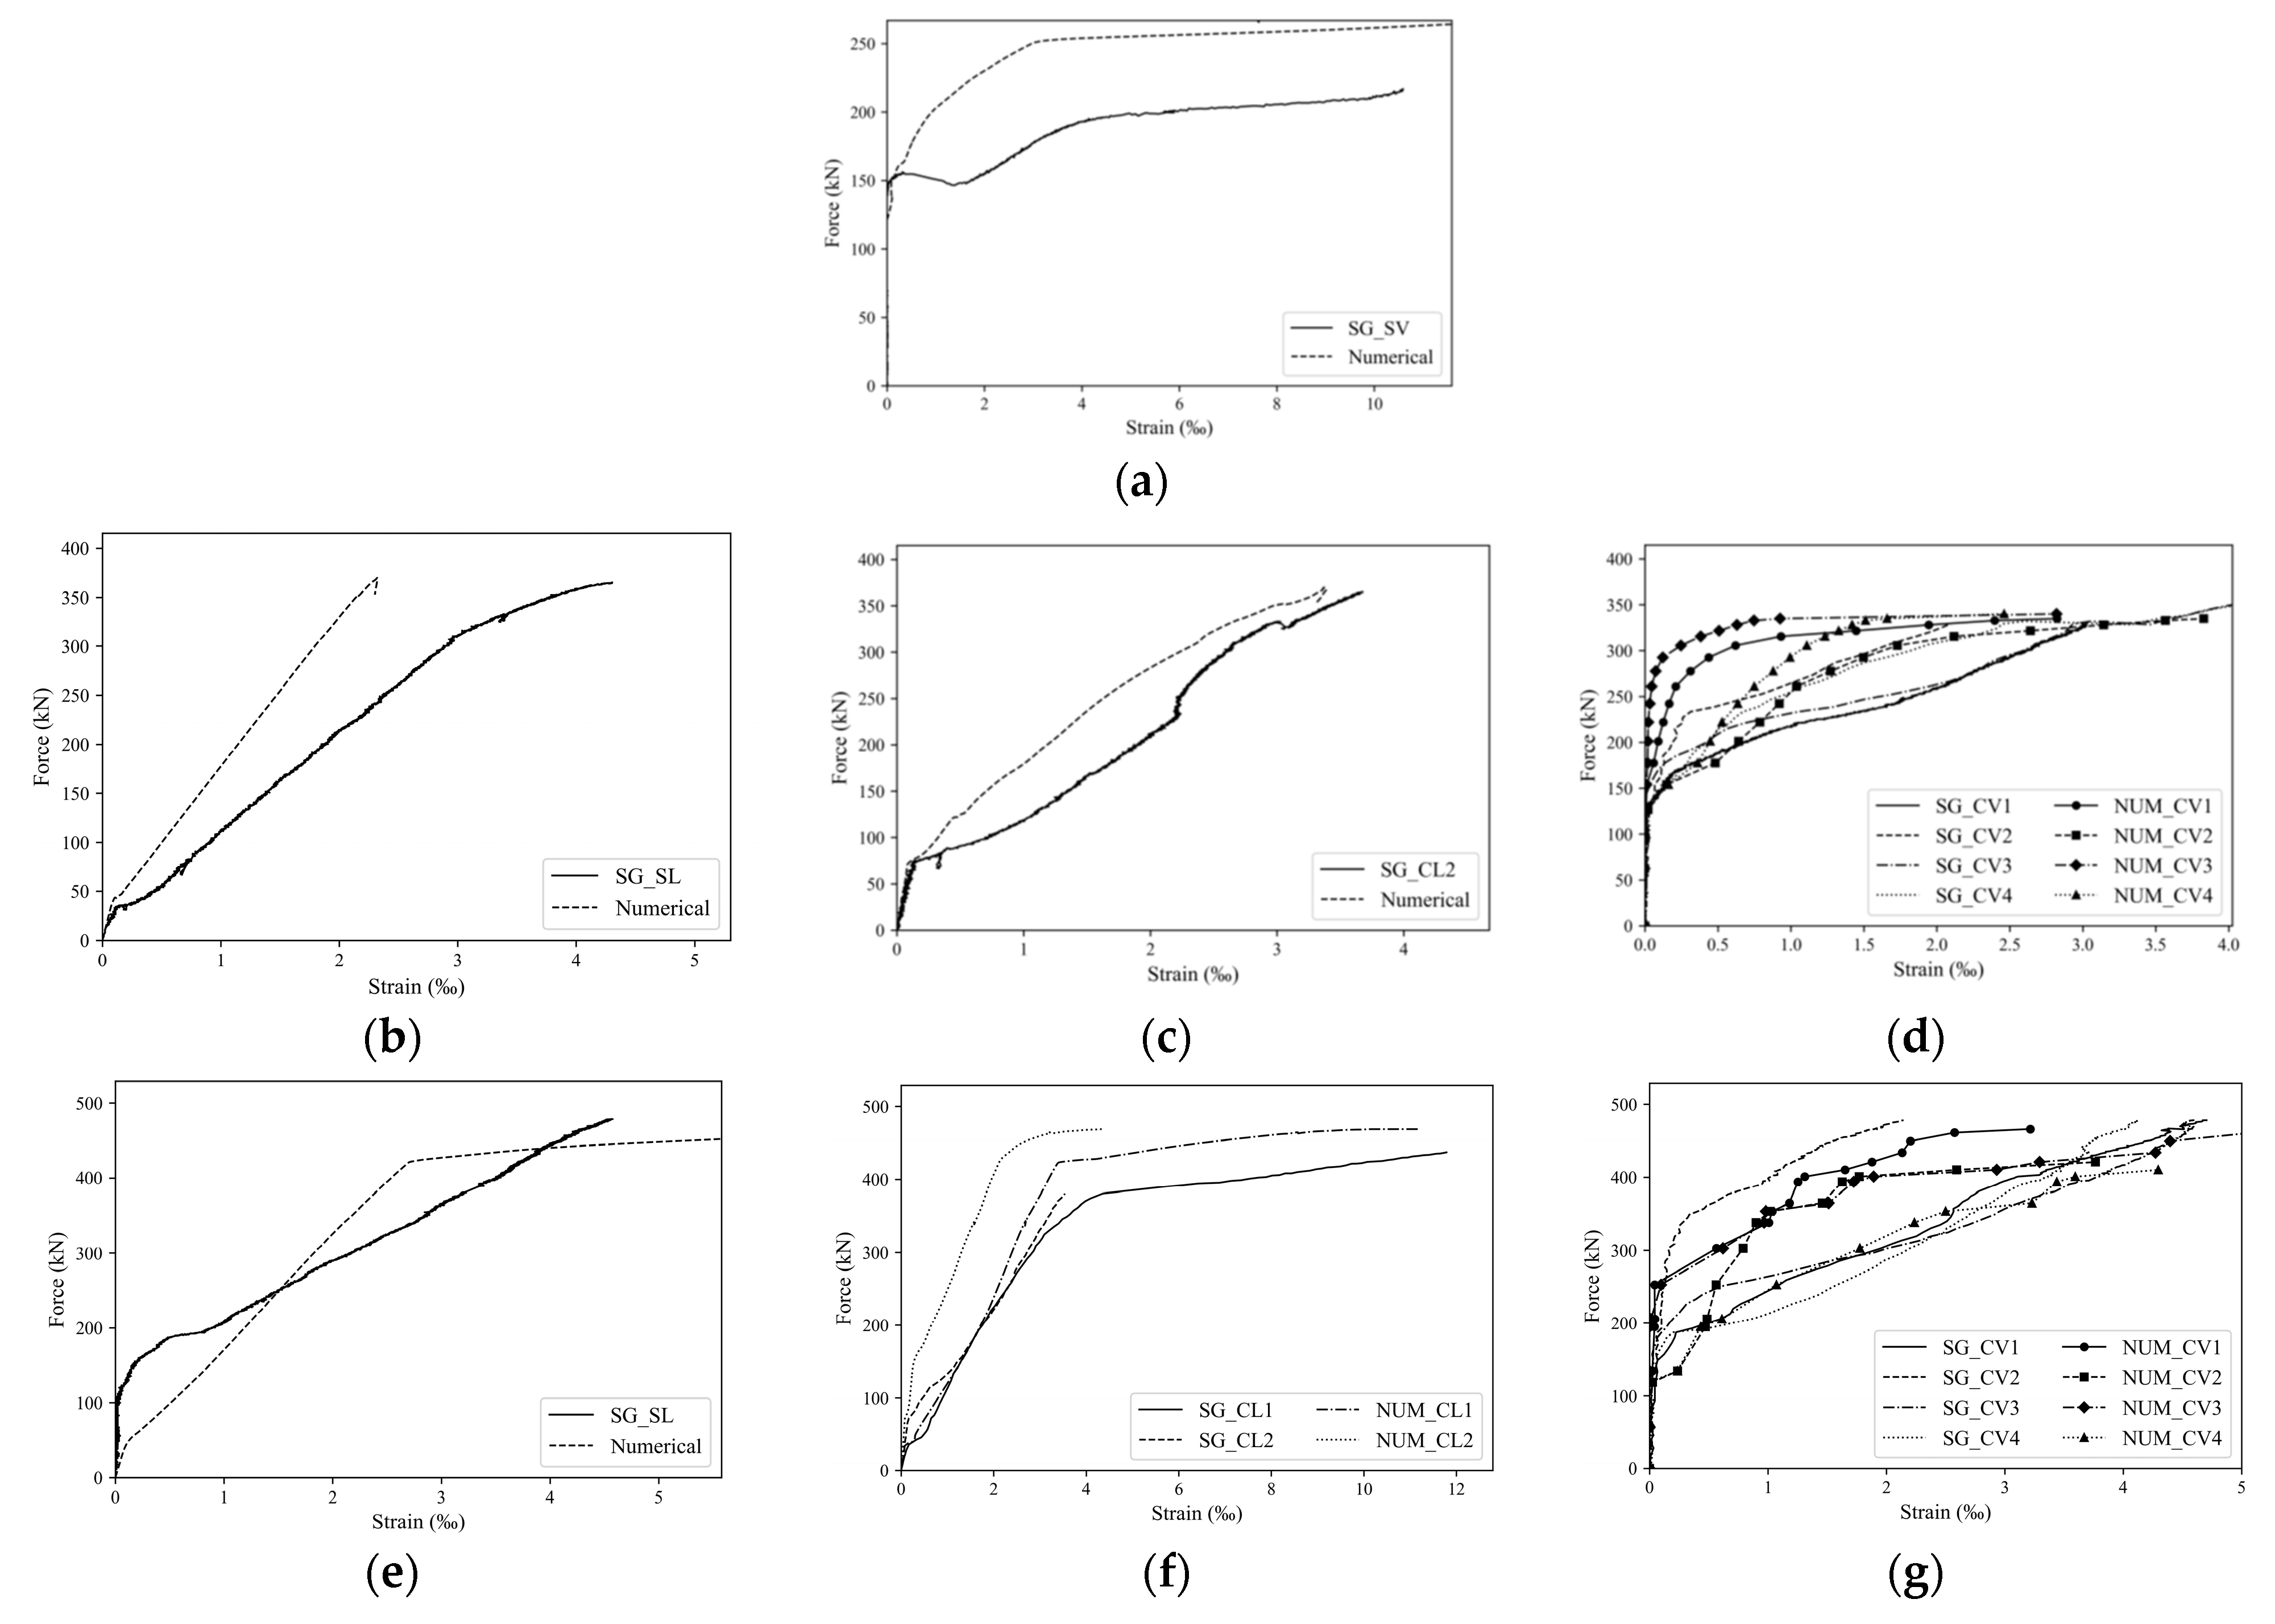
4.3. Beams Behavior in Terms of Strain–Load Relationship

The strains in steel reinforcements, CFRP laminates, and CFRP strips predicted numerically and registered experimentally (the location of the corresponding SGs is indicated in Figure 2) are compared in Figure 14 and Figure 15 for Series I and II, respectively. As already indicated, in the beams shear strengthened but without anchors (Figure 15b–d and Figure 16b–d), the fib Bulletin 90 bond law was adopted for simulating the contact of the U strips with the concrete substrate, using 0.3 mm and 8.5 MPa for the parameters representing the ultimate sliding ( s 1 ) and bond strength ( τ 0 ) in the case of SFS-I beam, and ultimate sliding of 0.28 mm and bond strength of 6.5 MPa in the SFS-II beam (in both beams s0 = 0.0107 mm). In the shear-strengthened beams with anchors, the parametric study, the simulation strategy was the one described at this section (perfect bond with a decrease of 20/30% on the modulus of elasticity for the anchorage part).
In terms of strains in steel reinforcement and CFRP laminates, there is an acceptable agreement between the numerical simulations and experimental findings. However, during the cracking formation and propagation stages, the numerical simulations predict smaller strains compared to the experimentally recorded values for the CFRP shear reinforcement. Recent blind simulation competitions [36] have demonstrated that continuous models, such as the one used in these simulations, exhibit inferior predictive performance compared to discrete crack models in terms of strains in constituent materials and crack width at serviceability limit state conditions.
Despite this recognition, Figure 14 shows that, in general, the numerical predictions tend to approximate the experimental strains when the loading level becomes close to the peak load, reaching a better predictive performance at the beam failure stage. It should be noted that the design guidelines are estimating the CFRP shear contribution for ultimate limit state conditions. Therefore, in the case that the effective strain from these guidelines is similar to the one predicted by the numerical simulations at shear failure conditions of the beams, it may be assumed that the corresponding formulations are capable of estimating reliable values for the maximum strain possible to be mobilized in the CFRP.

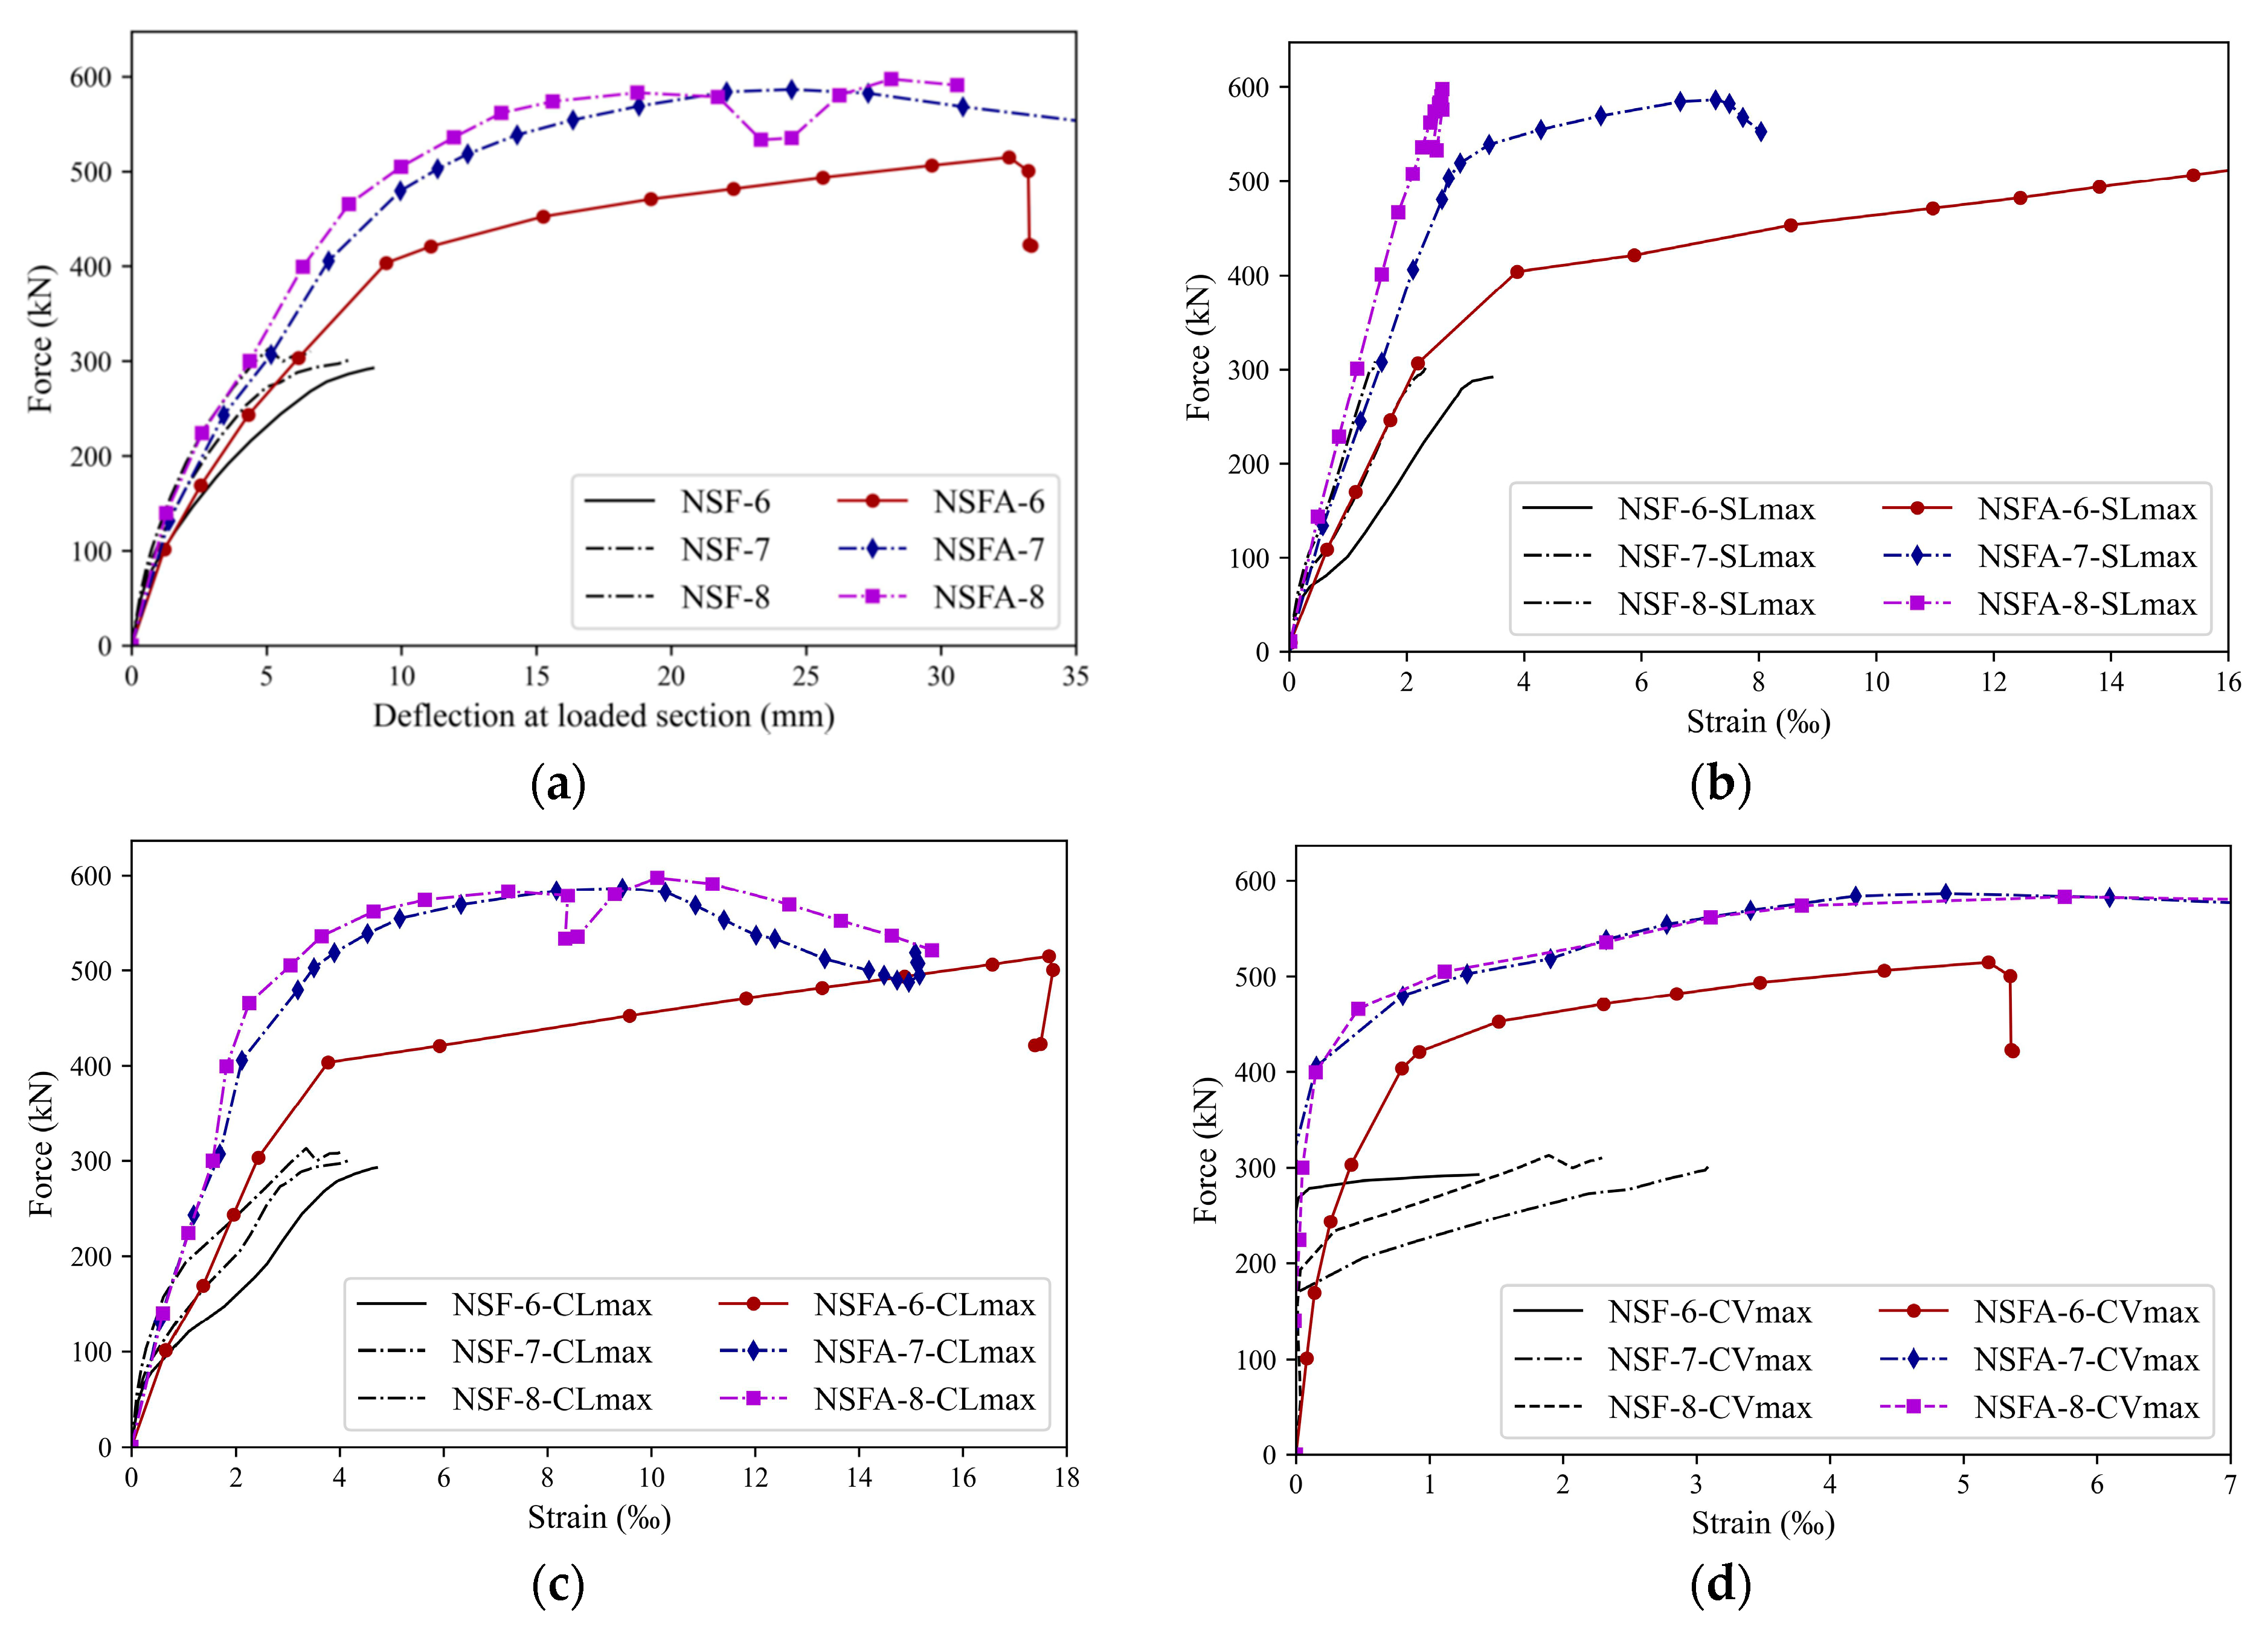
5. Numerical Parametric Study

The effectiveness of a CFRP strengthening system can be evaluated by determining the maximum strain at its failure and its contribution to the load-carrying capacity of the strengthened element. Since the numerical simulations could predict with an acceptable level of accuracy the strains in the CFRP systems at the failure condition of the beams, a sensitivity analysis was carried out to investigate the contribution of important parameters to the performance of the adopted CFRP strengthening solution. In fact, the effect of the flexural strengthening ratio with NSM CFRP laminates ( ρ f l ), the shear strengthening ratio with EBR CFRP strips ( ρ f w ), and the flexural reinforcement ratio of longitudinal steel bars ( ρ s l ) on that strengthening performance was analyzed. For this purpose, two series of eight RC beams were considered, with the properties presented in Table 4. Beams NSF-1 to NSF-8 do not include the anchorage to the EBR CFRP strips, while beams NSFA-1 to NSFA-8 include this anchorage. The NSF-labeled beams inherit the SFS-II configuration, including stirrup spacing (150 mm) and bond-slip characteristics ( τ 0 = 6.5 MPa , s 0 = 0.0107   mm , and s 1 = 0.28   mm ). The NSFA series inherits the SFSA-II beam’s stirrup spacing (150 mm) and assumes a perfect bond between CFRP strips and concrete substrate with a reduction of 30% on the modulus of elasticity of the anchorage part of this O shape strip configuration, in agreement with the modeling strategy described in Section 4.3.
The strains in the CFRP laminates were obtained in the integration point of the FEs where the maximum axial strain (CLmax) was predicted numerically. For the beams that failed by flexure mode, the strains in CFRP laminates obtained from numerical simulations are compared with the ones determined using design code recommendations (specifically the effective strain from fib Bulletin 90 [26] and ACI 440.2R-17 [27]). Assuming the numerical simulations can predict with good accuracy the strains in these CFRPs, this analysis will bring interesting information about the reliability of the equation provided by these codes. According to the fib model code 90, the maximum design strain is determined from the following:
ε f d , max = η f f k γ f E f
ε f m , max = η f f u m E f
where η = 1.0 , f f k , and E f are the characteristic tensile strength and module of elasticity of CFRP laminates, while γ f is a safety factor to convert the f f k in the corresponding design value. Since, in the numerical simulations, average values were considered for the materials’ properties, an average maximum strain is determined ( ε f m , max ) by adopting the average tensile strength for the CFRP and γ f = 1.0 (Equation (20b)). Considering the values for the used CFRP laminates, a value of 18‰ is obtained for ε f m , max .
According to the ACI 440.2R-17, the effective strain in FRP reinforcement is determined from the following equation.
ε fm , max = ε c u d f x n e x n e 0.7 ε f u = 12.6
where x n e is the depth of the neutral axis. To predict the flexural capacity of the beams (MRd) of the parametric study, two approaches are considered, fib bulletin 90 and ACI 440.2R-17 [27]. The following is true according to fib bulletin 90:
M R d = σ s 1 A s 1 ( d s 1 k 2 x n e ) + σ s 2 A s 2 ( d s 2 k 2 x n e ) + A f ε f m , max E f m ( d f k 2 x n e )
where d s 1 , d s 2 , A s 1 , A s 2 , σ s 1 , σ s 2 ; ε f , A f , d f ; k 2 ; x n e are the effective depth, cross-section area, and stress in the tensile and compression steel reinforcements; the strain, cross-section area, and internal arm of CFRP laminates; the factor defining the percentage of the neutral axis where is located the force corresponding to the resultant rectangular block of compressive stresses in concrete (equivalent to the linear-parabola diagram); and the neutral axis of the section, respectively. In the case of ACI 440.2R-17, the following is true:
M R d = A s 1 f s 1 d s 1 β 1 x n e 2 + ψ f A f ε f m , max E f m ( d f β 1 x n e 2 )
where ψ f represents a safety parameter (considered equal to one, due to the same reasons pointed out for the fib formulation).
Figure 16 assesses the influence of increasing ρ f l in beams with the minimum ρ s l (0.97%) and ρ f w (0.08%) considered in this parametric study. When considering the reference beam for comparison purposes, which failed in shear (Figure 17a), it is verified that the NSM CFRP laminates with the U-strips without anchorages were able to increase the stiffness, but the load-carrying capacity was only increased in the NSF-1 beam with one laminate. By increasing ρ f l from 0.06 to 0.12%, the stiffness of the beams of series NSF-1 to NSF-3 did not change significantly up to the yield initiation of the steel flexural reinforcement, as also demonstrated by the force versus maximum strain the in steel flexural reinforcement, SLmax (Figure 16b), and by the force versus maximum strain in the NSM-CFRP laminates, CLmax (Figure 16c). Figure 16d represents the relationship between the applied load and the maximum strain in the U-shaped CFRP strips (CVmax). In the series of beams without anchorages that failed in shear, the maximum strain was about 6‰. For this maximum strain in the U-shaped CFRP strips, the beams with anchorages supported a much higher load-carrying capacity. Figure 17b represents the principal plastic strains in NSF-3 (identical to the NSF-2) when convergence was no longer possible to assure, suggesting the occurrence of premature debonding of the U strips from their free extremities (Figure 17c). However, when anchorages were used to avoid this premature debonding, the beams failed by bending (series NSFA-1 to NSFA-3), as shown in Figure 17d, which assured a significant increase in load-carrying capacity with a good exploitation of the flexural strengthening potential of the CFRP NSM laminates. A ρ f l of 0.06, 0.09, and 0.12% provided an increase in maximum load of 45%, 57%, and 66% when compared to the maximum load of the reference beam.
Figure 16. NSF-1 to 3 and NSFA-1 to 3: (a) Load-deflection in these beams and its corresponding reference beam; (b) load versus maximum strain in the flexural steel reinforcements; (c) load versus maximum strain in the NSM CFRP laminates; (d) load versus maximum strain in the U-shaped CFRP strips.
Jcs 08 00348 g016
Figure 17. Representation of principal plastic strains in the (a) reference beam, (b) NSF-3, (c) CFRP strips debonding slip in NSF-3, and (d) NSFA-3.
Jcs 08 00348 g017aJcs 08 00348 g017b
Figure 18 illustrates the influence of increasing ρ f w in beams with intermediate ρ f l (0.08%) and minimum ρ s l (0.97%). Figure 18a shows that, in a series without anchorages, the increased ρ f w anticipated occurrence of premature debonding of the U-shaped CFRP strips, as shown in Figure 19a,b (larger principal plastic strains in their free end regions). By increasing the number of U-shaped CFRP layers, the larger stiffness of these systems would require a larger bond transfer length to ensure a stable transference of stresses between these systems and the concrete substrate, which did not occur (Figure 18d). By anchoring these regions of the U-shaped CFRP strips, the beams failed in bending with full mobilization of the steel flexural reinforcement potential (Figure 18b,c and Figure 19c), providing an increase in maximum load of 41% and 45% when compared to the maximum load of the corresponding beams without anchorages. Figure 18d shows that the maximum strain in the U-shaped CFRP strips decreases with ρ f w .
In Figure 20, the influence of increasing ρ s l in beams with intermediate ρ f l (0.08%) and minimum ρ f w (0.08%) is evaluated. Figure 20a shows that, in a series without anchorages, the increase in ρ s l results in increased stiffness of the beams, as expected, but shear failure was anticipated due to premature debonding of the U strips, as is visible in Figure 21a,b (larger principal plastic strains in their free end regions), without the possibility of mobilizing the potential of flexural strengthening of NSM laminates (Figure 20c). Figure 20d demonstrates that, due to the anticipation of shear failure with the increase in ρ s l in the beams without anchorages, the maximum strain in the U-shaped CFRP strips decreases, which did not happen in the series of beams with anchorages. Apart from the NSFA-8 beam, which failed in shear (Figure 21c) due to its relatively high ρ s l , by anchoring these regions of the U strips, the beams failed in bending with full mobilization of the steel flexural reinforcement potential (Figure 20b), providing an increase in maximum load of 71%, 72%, and 49%, when compared to the maximum load of the corresponding beams without anchorages.
Table 5 compares the load-carrying capacity of the beams of this parametric study predicted numerically and using the ACI 440.2R-17 and fib bulletin 90 formulations. In Appendix A, the design methodology using ACI 440.2R-17 and fib bulletin 90 formulations are applied to a beam failing in bending and to a beam failing in shear. In this evaluation, the properties of the materials were those adopted in the numerical simulations (average values of the properties of the materials) and no safety factors were considered; therefore, the optimum fit of the analytical formulation (Fana) to the numerical simulation (Fnum) in terms of maximum load, Fnum/Fana, is 1.0. Since the beams of series NSF failed in shear (char “S” in the last column of Table 5), their load-carrying capacity was estimated by the shear formulation of ACI 440.2R-17 and fib bulletin 90, while the remaining beams were simulated by the flexural failure formulations (char “F” in the last column of Table 5). It is verified that both formulations have good predictive performance in terms of Fnum/Fana, since the average and coefficient of variation (CoV) were 1.06 and 0.18 for the ACI 440.2R-17 formulations and 1.02 and 0.14 for the fib bulletin 90 formulations. When this type of analysis is made independently for the series NSF and NSFA, an average of 0.93 and a CoV of 0.07 are obtained for the NSF series (shear failure mode) with the ACI 440.2R-17 formulation, and 0.99 and 0.11 with the fib bulletin 90 formulation. In the NSFA series (flexural failure mode), an average was obtained and a CoV of 1.19 and 0.17 with the ACI 440.2R-17 formulation, and 1.06 and 0.15 with the fib bulletin 90 formulation. Therefore, flexural and shear based on the fib bulletin 90 formulations have a little bit better predictive performance than the ACI 440.2R-17 formulations. Unsafe analytical predictions were obtained in the NSF-5 and NSF-4 beams regarding the NSF-3 beam (increase in ρ f w , Table 5), which indicates that the decrease in the maximum strain possible to be mobilized in the U-shaped CFRP strips with the increase in ρ f w considered by the analytical formulations is not sufficient to properly capture the tendency of the anticipation of the debonding failure mode predicted by the numerical simulations. Regarding the NSFA-8 beam, the unsafe prediction of both analytical formulations is due to the fact that this beam failed numerically in shear, caused by the highest ρ s l amongst the NSFA series (2.28%). In fact, according to Figure 20 and Figure 21, after a relatively large deflection, when the flexural steel reinforcement was in the eminence of entering its yielding initiation, internal stress redistribution occurred, leading to a shear failure (flexural–shear failure mode). If a shear formulation is considered for this beam, a Fnum/Fana of 1.49 and 1.62 is obtained using ACI 440.2R-17 and fib bulletin 90, respectively.
For the NSF series, which failed in shear, the average of the maximum strain in the U-shaped CFRP strips was 3.57‰, while the effective strain in these composites according to ACI 440.2R-17 and fib bulletin 90 (ffwd/Ef in this last case) was 3.8‰ and 6.3‰, respectively. Making the comparison more in detail, it is verified that the over-prediction of the maximum possible strain to be mobilized in these composites increases with ρ f w (beams NSF-4 and NSF-5) and with ρ s l (beams NSF-6 to NSF-8) due to the anticipation of the debonding of these shear reinforcements. Despite this, unconservative Fnum/Fana is only significant in the NSF-4 and NSF-5, which are the beams with the highest ρ f w , indicating that these are the critical parameters to define the maximum possible strain to be mobilized in U-shaped CFRP strengthening systems.
Regarding the NSFA series, the average of the maximum strain in the CFRP laminates was 16.8‰, which is 93% of the tensile rupture of these laminates. By providing a degree of confinement and preventing premature debonding of the U-shaped CFRP strips, the anchorage system effectively mitigates shear failure. This allows the NSM system to operate at its full capacity, enhancing the overall efficiency of the strengthening intervention. The anchorage system optimizes stress transfer between the concrete and CFRP laminate, preventing stress concentrations at the laminate ends and promoting a more uniform strain distribution. This enhanced stress transfer mechanism contributes to the high strain capacity observed in the CFRP laminates and the overall effectiveness of the NSM strengthening system.

6. Conclusions

This study conducted a numerical investigation of RC beams, as previously tested in [13], focusing on the performance of an innovative CFRP anchorage designed to enhance shear and flexural capacity when used with wet layup U-shaped CFRP strips and NSM bars.
  • The Concrete Damage Plasticity (CDP) model was employed to simulate the behavior of these beams, with a detailed examination of the influence of finite element mesh refinement and CFRP bond conditions on the numerical results.
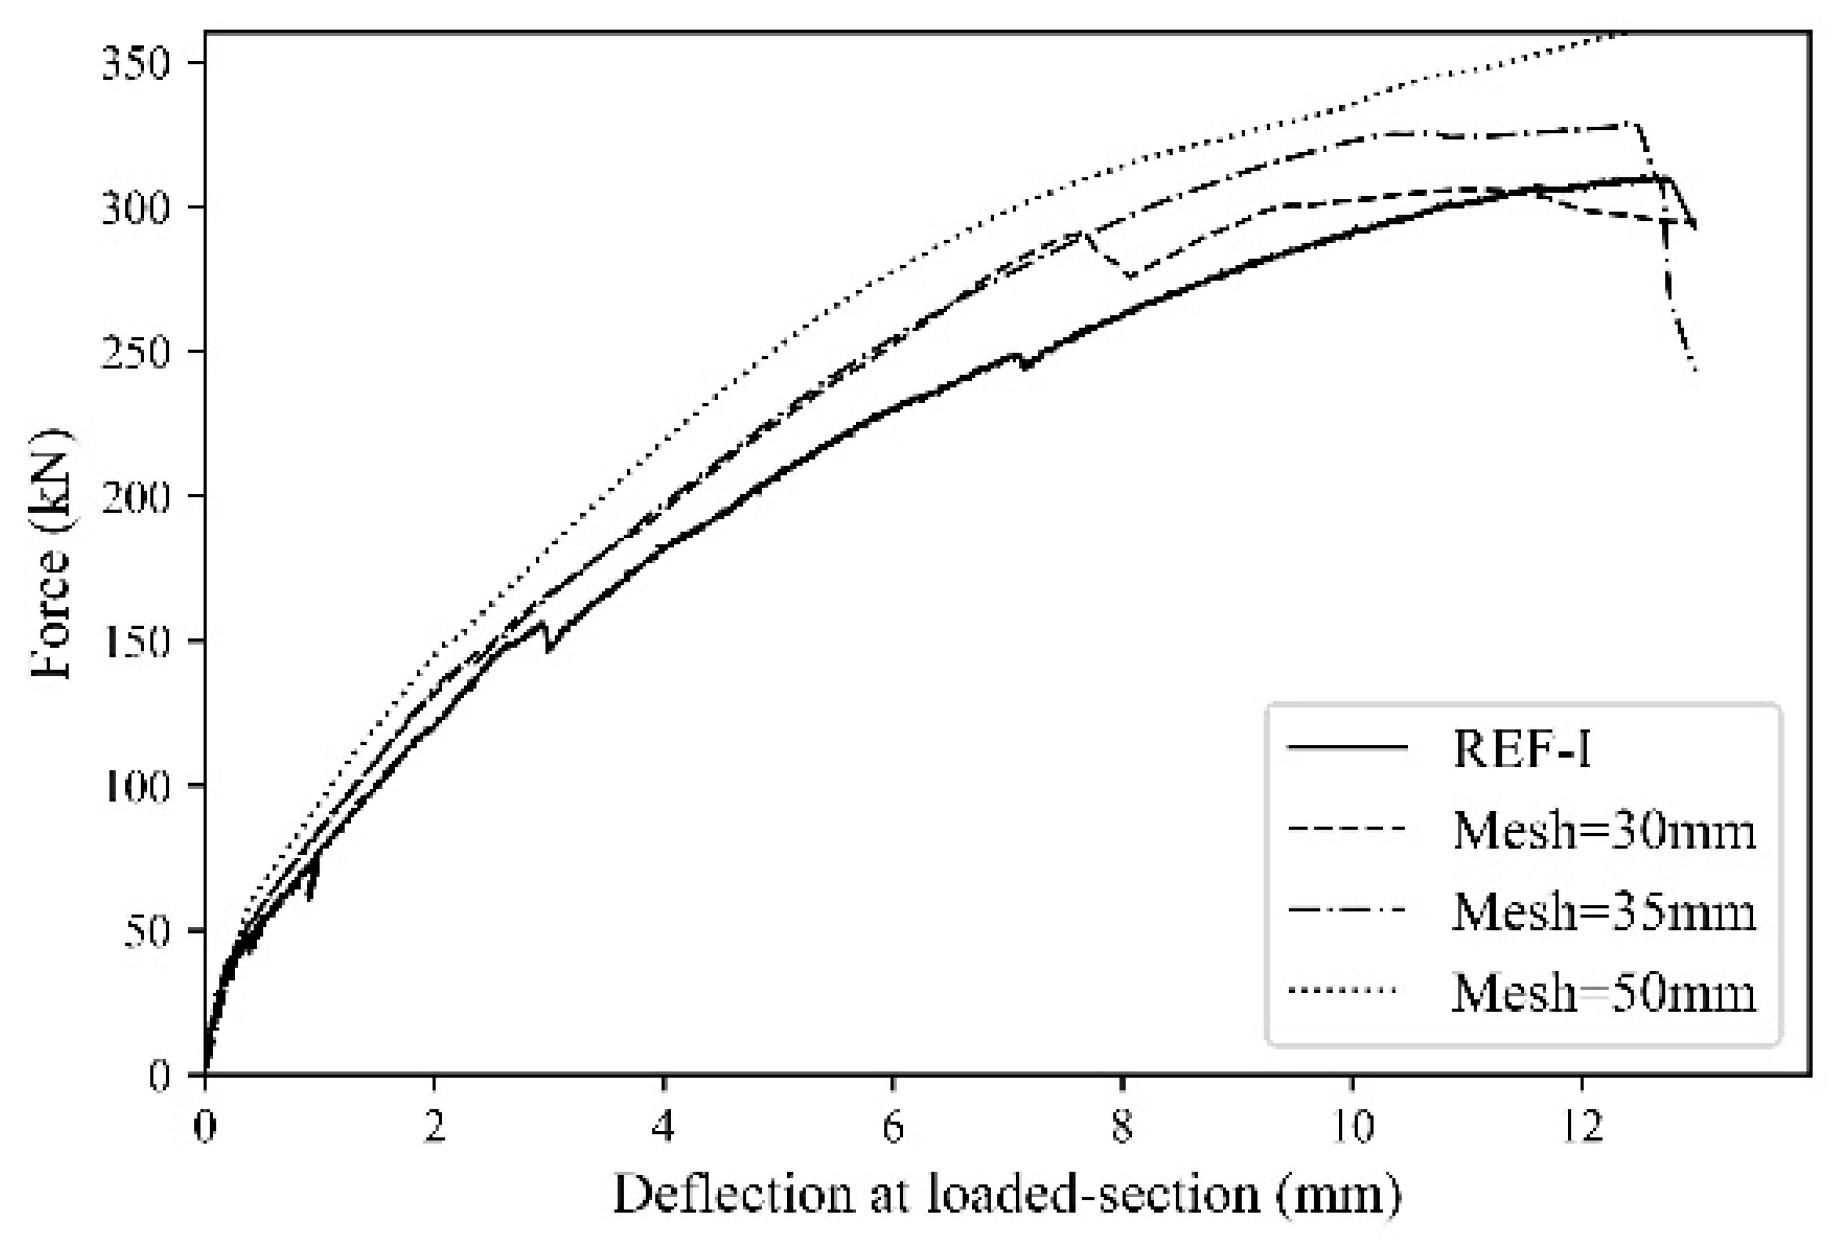
  • It was observed that reducing the finite element size tends to decrease the predicted load-carrying capacity of the beams. A mesh with elements less than three times the maximum dimension of the concrete aggregates provided a good balance between accuracy and computational efficiency.
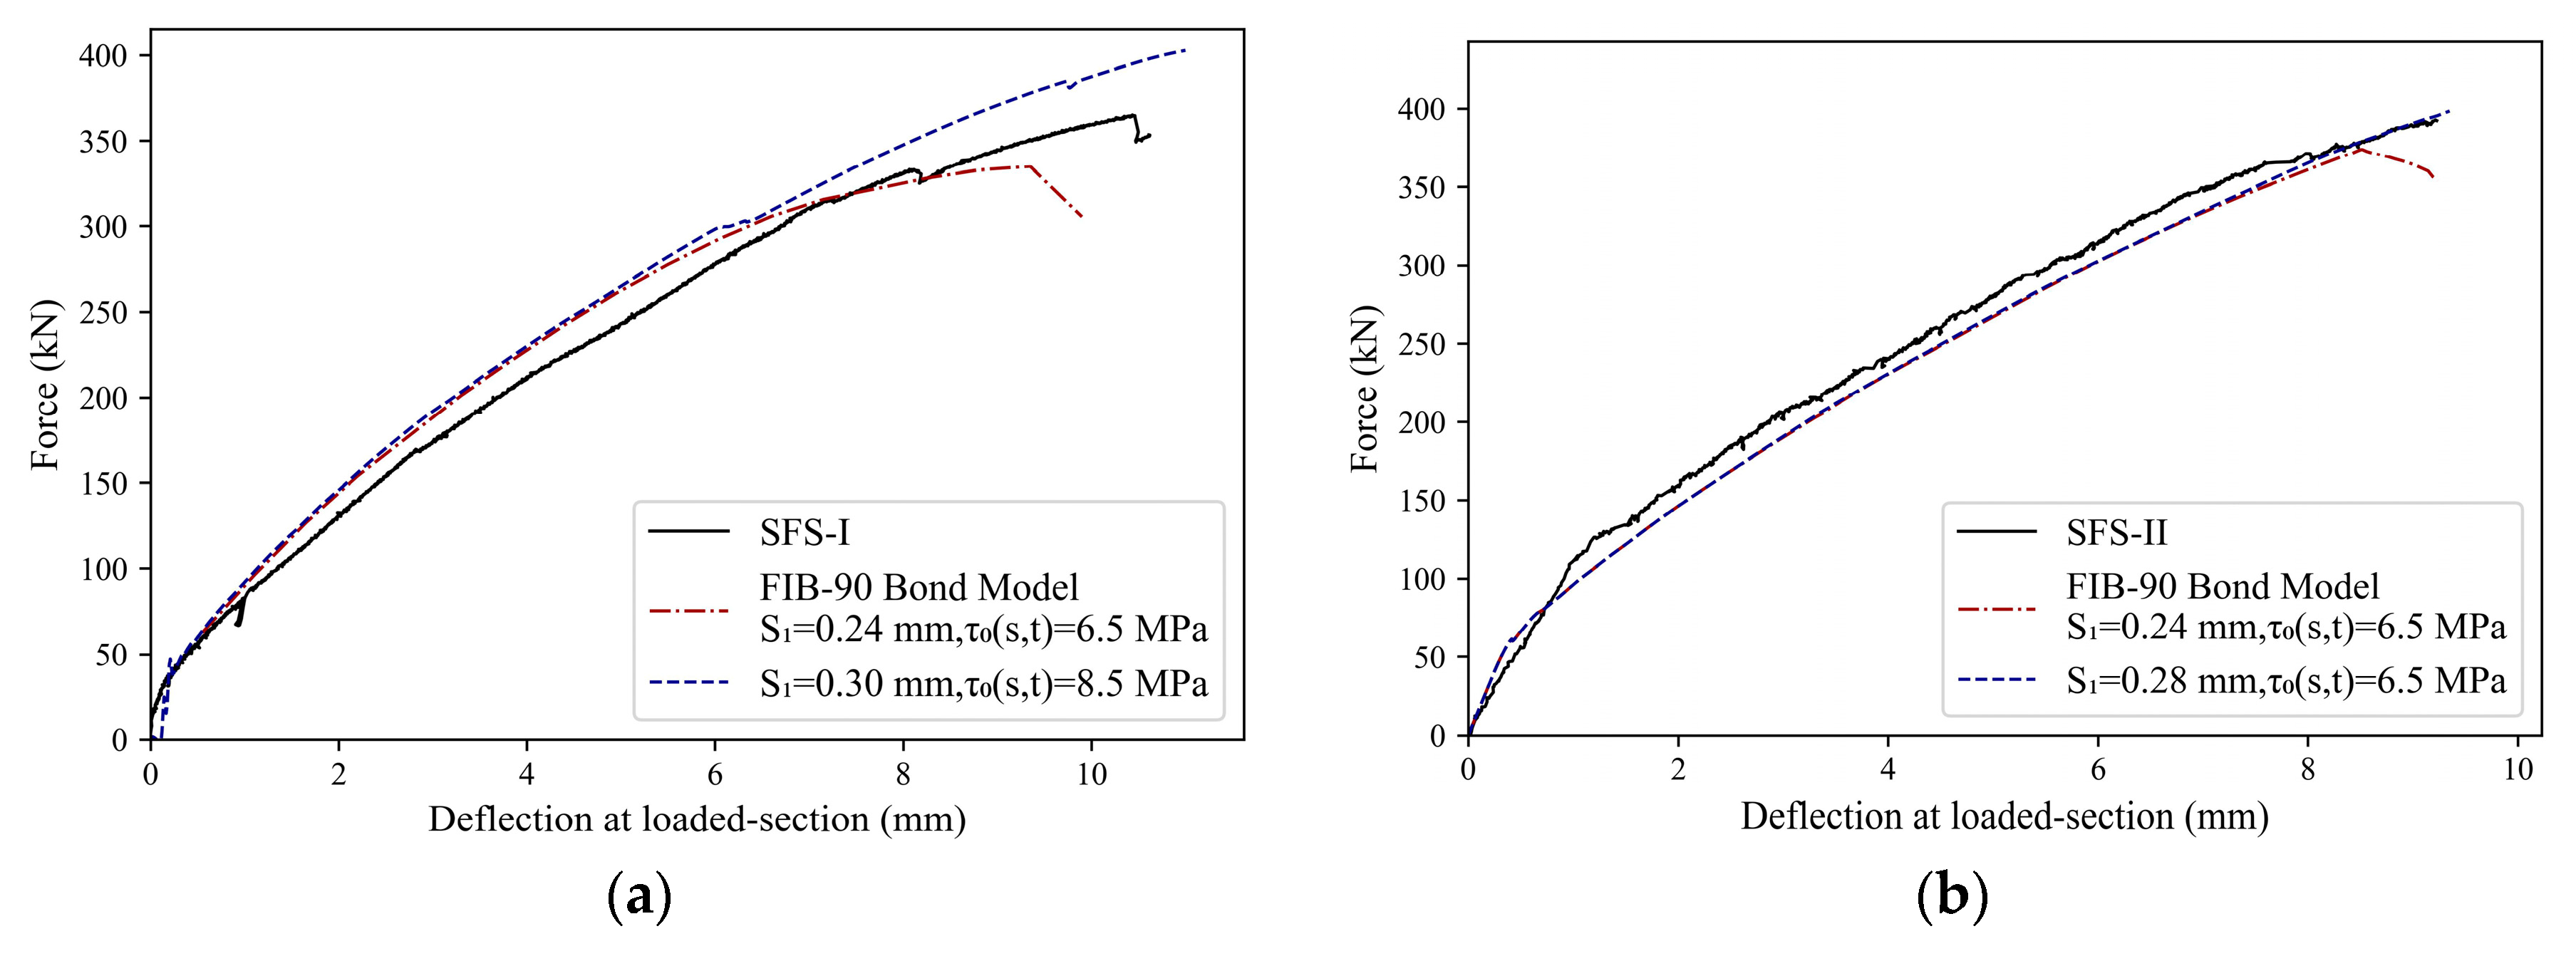
  • The bond conditions of the CFRP strips were critically evaluated. The bond law proposed by fib Bulletin 90 was found to predict premature debonding and failure, highlighting the sensitivity of the beams’ load-carrying capacity to the parameters defining this bond law. Suitable parameter values were determined through inverse analysis to accurately capture key results, including force vs. deflection behavior and failure modes.
  • Numerical simulations confirmed that the CFRP anchors provided effective bonding conditions for the U-shaped strips. However, it was necessary to reduce the modulus of elasticity of the CFRP in the anchorage by 20–30% to reflect real stiffness, acknowledging challenges in perfect material placement in the anchorage zone.
  • Using the calibrated CDP model, a parametric study assessed the predictive accuracy of the fib Bulletin 90 and ACI 440.2R-17 formulations for designing flexural and shear strengthening solutions. The ratio between the numerically predicted maximum load and the load determined by the ACI and fib formulations was 1.10 and 1.08, respectively, with CoV values of 0.18 and 0.17.
  • Future studies should explore the impact of varying CFRP anchorage configurations and bond parameters on the long-term performance of strengthened RC beams under different loading conditions, including fatigue and environmental effects. Additionally, the development and validation of other numerical models (e.g., smeared crack for concrete and advanced bond criteria) that can more accurately simulate the complex interactions of the concrete behavior itself and the CFRP–concrete interface would be beneficial for refining design guidelines and improving the reliability of CFRP strengthening techniques.

Author Contributions

Conceptualization, P.A., J.A.O.B. and S.J.E.D.; Methodology, P.A., J.A.O.B. and S.J.E.D.; Software, P.A.; Validation, J.A.O.B.; Investigation, P.A.; Data curation, P.A.; Writing—original draft, P.A.; Writing—review & editing, P.A., J.A.O.B. and S.J.E.D.; Supervision, J.A.O.B. and S.J.E.D. All authors have read and agreed to the published version of the manuscript.

Funding

This work was partly financed by FCT/MCTES through national funds (PIDDAC) under the R&D Unit Institute for Sustainability and Innovation in Structural Engineering (ISISE) under reference UIDB/04029/2020 (doi.org/10.54499/UIDB/04029/2020), in the scope of project FemWebAI, under reference PTDC/ECI-EST/6300/2020 and PID2021-125553NB-I00 (MCI/AEI/FEDER, UE), and under the Associate Laboratory Advanced Production and Intelligent Systems ARISE under reference LA/P/0112/2020, and the support from the project PID2021-125553NB-I00 (MCI/AEI/FEDER, UE).

Data Availability Statement

Data available on request from the authors.

Acknowledgments

This work was partly financed by FCT/MCTES through national funds (PIDDAC) under the R&D Unit Institute for Sustainability and Innovation in Structural Engineering (ISISE) under reference UIDB/04029/2020 (doi.org/10.54499/UIDB/04029/2020), in the scope of project FemWebAI, under reference PTDC/ECI-EST/6300/2020 and PID2021-125553NB-I00 (MCI/AEI/FEDER, UE), and under the Associate Laboratory Advanced Production and Intelligent Systems ARISE under reference LA/P/0112/2020. The support from the project PID2021-125553NB-I00 (MCI/AEI/FEDER, UE) is also acknowledged.

Conflicts of Interest

The ChatGPT OpenAI version 3.5 has only been used in some parts for grammatical and fluency corrections. The authors declare no conflict of interest.

Appendix A

In this annex, the ACI 440.2R-17 [25] and fib Bulletin 90 [24] formulations are applied for one of the beams that failed in bending and shear, as shown in Table 4. For this purpose, the beams NSF-1 (representative of beams failing in shear) and NSFA-1 (representative of beams failing in bending) were selected. The corresponding parameters that were used in the calculations can be found in Section 2 and Section 5 of the main text.

Appendix A.1. NSF-1 Beam

Appendix A.1.1. ACI 440.2R-17 Formulation

The contribution of the concrete to the shear resistance is as follows:
ϕ V c = ϕ 0.17 f c b w d = 0.17 44.3 × 180 × 359 = 73.1   kN   ( ϕ = 1.0 )
The contribution of the steel stirrups to the shear resistance is as follows:
ϕ V s = ϕ A v f y t d s = 2 × π × 6 2 / 4 × 641 × 359 150 = 86.8   kN     ( ϕ = 1.0 )
The contribution of the CFRP to the shear resistance is as follows:
V f d = ϕ ψ f . A f v f f e d f s f = 21.12 × 0.004 × 245000 × 259 150 = 35.7   kN   ( ϕ = ψ f = 1.0 )
A f v = 2 n t f w f = 2 × 0.176 × 60 = 21.12   mm 2
ε f e = k v ε f u = 0.3615 × 0.0126 0.004 = 0.004       ( f o r   U W r a p s )
k v = k 1 k 2 L e 11900 · ε f u = 1.3911 × 0.8155 × 47.78 11900 × 0.0126 = 0.3615 0.75
L e = 23300 n t f E f 0.58 = 23300 1 × 0.176 × 245000 0.58 = 47.78   mm
k 1 = f c 27 2 / 3 = 44.3 27 2 / 3 = 1.3911
k 2 = d f L e d f = 259 47.78 259 = 0.8155
The total shear resistance and maximum load are as follows:
V t = V c + V s + V f = 195.6   kN
F = 1.6 V t = 1.6 × 195.6 = 313   kN     ( S e e   F i g u r e   1 )

Appendix A.1.2. fib Bulletin 90

The contribution of the steel stirrups to the shear resistance is as follows:
V R d , s = A s w s z f y w d cot θ = 2 × π × 6 2 / 4 150 × 0.9 × 359 × 641 × cot ( 39.8 ° ) = 93.7   kN
The contribution of the CFRP to the shear resistance is as follows:
V R d , f = A f w s f h f f f w d cot θ = 2 × 60 × 0.176 150 × 300 × 1703.9 × cot ( 39.8 ° ) = 86.4   kN
A f w = 2 b f t f = 2 × 60 × 0.176 = 21.12   mm 2
w h e r e   h f = 300   mm l e = 54.21   mm     a n d   l e = 54.21 s f cot θ = 125   mm h f = 300   mm then
f f w d = E f s 0 k τ b 1 k t f γ b = 245000 × 0.24 × 8.69 0.176 1.0 = 1703.9   MPa     ( γ b = 1.0 )
τ b 1 k = 0.72 f c m f c t m = 0.72 44.3 × 3.29 = 8.69   MPa
f c t m = 0.3 f c m 8 2 / 3 = 0.3 × ( 36.3 ) 2 / 3 = 3.29   MPa
l e = π 2 E f t f s 0 k τ b 1 k = π 2 245000 × 0.176 × 0.24 8.69 = 54.21   mm
The total shear resistance and maximum load are as follows:
V t = V s + V f = 180.1   kN       F = 1.6 V t = 1.6 × 180.1 = 288.2   kN     ( S e e   F i g u r e   1 )

Appendix A.2. NSFA-1 Beam

Appendix A.2.1. ACI 440.2R-17 Formulation

ϕ M n = ϕ A s l f s d s β 1 c / 2 + γ f A f f f e d f β 1 c / 2 = 626.814 × 636 359 0.7174 × 45.97 2 + 42.12 × 2205 390 0.7174 × 45.97 2 = 171.2   kN m     ( ϕ = γ f = 1.0 )
ε f e = ε c u d f c c ε b i = 0.003 × 390 45.97 45.97 0.0 0.7 × ε f u = 0.7 × 0.018 = 0.0126
ε c = ε f e c d f c = 0.0126 45.97 390 45.97 = 0.001684
ε s = ε f e d c d f c = 0.0126 × 359 45.97 390 45.97 = 0.01146     ( f s = 636   MPa )
f f e = E f ε f e = 175000 × 0.0126 = 2205   MPa
ε c = 1.7 f c 4700 f c = 1.7 × 44.3 4700 44.3 = 0.002407
c = A s l f s + A f f f e γ 1 f c β 1 b = 626.814 × 636 + 42.12 × 2205 0.7478 × 44.3 × 0.7174 × 450 = 45.97   mm   ( o . k )
β 1 = 4 × ε c ε c 6 × ε c 2 × ε c = 4 × 0.002407 0.001684 6 × 0.002407 2 × 0.001684 = 0.7174
γ 1 = 3 × ε c ε c ε c 2 3 × β 1 ε c 2 = 3 × 0.002407 × 0.001684 0.001684 2 3 × 0.7174 × 0.002407 2 = 0.7478
F = M n 0.5625 = 171.2 0.5625 = 304.4   kN     ( S e e   F i g u r e   1 )

Appendix A.2.2. fib Bulletin 90

From the beam configuration (Figure 1 and Table 4), the following parameters can be determined:
A s 1 = 626.814   mm 2 ;   d s 1 = 359   mm ;   d s 2 = 27   mm ;   A s 2 = 452.389   mm 2 ;   A s 3 = 226.195   mm 2 ;   d s 3 = 73   mm ;   A f = 42.12   mm 2 ;   ε f u = 0.018 ;   d f = 390   mm
The initial guess for neutral axis location, x , is 40.31 mm.
M R d = A s 1 σ s 1 d s 1 k 2 x + A f E f ε f d f k 2 x + A s 2 σ s 2 d s 2 k 2 x + A s 3 σ s 3 d s 3 k 2 x = 626.814 × 636 × 359 0.3774 × 40.31 + 42.12 × 175000 × 0.018 × ( 390 0.3774 × 40.31 ) + 226.195 × 0.001683 × 20000 × 73 0.3774 × 40.31 + 452.389 × 0.000685 × 200000 × 0.3774 × 40.31 27 = 190.4   kN m
ε f e = 0.0035 × d f x x = 0.0035 × 390 40.31 40.31 = 0.03036 ε f u = 0.018 ε f e = 0.018
ε c = ε f u × x d f x = 0.018 × 40.31 390 40.31 = 0.002075
F c = k 1 f c d b x = 0.6787 × 44.3 × 450 × 40.31 = 545.39   kN
k 1 = 1 2 3000 × ε c = 0.6787
ε s 1 = ε f e × d s f x d f x = 0.018 × 359 40.31 390 40.31 = 0.016404
ε s 2 = ε f e × x d s 2 d f x = 0.018 × 40.31 27 390 40.31 = 0.000685
ε s 3 = ε f e × d s 3 x d f x = 0.018 × 73 40.31 390 40.31 = 0.001683
k 1 f c d b x + A s 2 σ s 2 = A s 1 σ s 1 + A f E f ε f + A s 3 σ s 3 x = 626.814 × 636 + 226.195 × 0.001683 × 200000 + 42.12 × 175000 × 0.018 19935 × 0.6787 452.389 × 0.000685 × 200000 19935 × 0.6787 = 40.31   mm
k 2 = 1000 × ε c 3000 × ε c 4 + 2 2000 × ε c 3000 × ε c 2 = 1000 × 0.002075 × ( 3000 × 0.002075 4 ) + 2 2000 × 0.002075 × ( 3000 × 0.002075 2 ) = 0.3774
F = M R d 0.5625 = 190.4 0.5625 = 338.6   kN     ( S e e   F i g u r e   1 )

References

  1. Barros, J.A.O.; Dias, S.J.E.; Lima, J.L.T. Efficacy of CFRP-based techniques for the flexural and shear strengthening of concrete beams. Cem. Concr. Compos. 2007, 29, 203–217. [Google Scholar] [CrossRef]
  2. Dias, S.; Barros, J. Performance of reinforced concrete T beams strengthened in shear with NSM CFRP laminates. Eng. Struct. 2010, 32, 373–384. [Google Scholar] [CrossRef]
  3. Bakis, C.E.; Bank, L.C.; Brown, V.L.; Cosenza, E.; Davalos, J.F.; Lesko, J.J.; Machida, A.; Rizkalla, S.H.; Triantafillou, T.C. Fiber-Reinforced Polymer Composites for Construction—State-of-the-Art Review. J. Compos. Constr. 2003, 6, 73–87. [Google Scholar] [CrossRef]
  4. Muciaccia, G.; Khorasani, M.; Mostofinejad, D. Effect of different parameters on the performance of FRP anchors in combination with EBR-FRP strengthening systems: A review. Constr. Build. Mater. 2022, 354, 129181. [Google Scholar] [CrossRef]
  5. Bilotta, A.; Ceroni, F.; Nigro, E.; Pecce, M. Efficiency of CFRP NSM strips and EBR plates for flexural strengthening of RC beams and loading pattern influence. Compos. Struct. 2015, 124, 163–175. [Google Scholar] [CrossRef]
  6. Khalifa, A.M. Flexural performance of RC beams strengthened with near surface mounted CFRP strips. Alex. Eng. J. 2016, 55, 1497–1505. [Google Scholar] [CrossRef]
  7. Sharaky, I.A.; Torres, L.; Comas, J.; Barris, C. Flexural response of reinforced concrete (RC) beams strengthened with near surface mounted (NSM) fibre reinforced polymer (FRP) bars. Compos. Struct. 2014, 109, 8–22. [Google Scholar] [CrossRef]
  8. Sun, W.; Lou, T.; Achintha, M. A novel strong and durable near-surface mounted (NSM) FRP method with cost-effective fillers. Compos. Struct. 2021, 255, 112952. [Google Scholar] [CrossRef]
  9. Polskoy, P.P.; Mailyan, D.; Beskopylny, A.N.; Meskhi, B. Bearing Capacity of Reinforced Concrete Beams with Initial Cracks Reinforced with Polymer Composite Materials. Polymers 2022, 14, 3337. [Google Scholar] [CrossRef]
  10. Wang, H.-T.; Guo, C.-C.; Liu, Q.-L.; Wu, Q. Influences of the bond-slip on the flexural performance of CFRP plate-strengthened damaged steel beams with intermediate debonding: A numerical study. Structures 2023, 58, 105661. [Google Scholar] [CrossRef]
  11. Teng, J.; Yu, T.; Fernando, D. Strengthening of steel structures with fiber-reinforced polymer composites. J. Constr. Steel Res. 2012, 78, 131–143. [Google Scholar] [CrossRef]
  12. Bianco, V.; Barros, J.; Monti, G. Three dimensional mechanical model for simulating the NSM FRP strips shear strength contribution to RC beams. Eng. Struct. 2009, 31, 815–826. [Google Scholar] [CrossRef]
  13. Dias, S.; Silva, J.; Barros, J. Flexural and shear strengthening of reinforced concrete beams with a hybrid CFRP solution. Compos. Struct. 2021, 256, 113004. [Google Scholar] [CrossRef]
  14. Akbarpour, A.; Volz, J.; Vemuganti, S. An Experimental Study Incorporating Carbon Fiber Composite Bars and Wraps for Concrete Performance and Failure Insight. J. Compos. Sci. 2024, 8, 174. [Google Scholar] [CrossRef]
  15. Salib, M.N. Flexural Behavior of RC T-Section Beams Strengthened with Different Configurations of CFRP Laminates. Int. J. Curr. Eng.Technol. 2012, 2, 418–426. [Google Scholar]
  16. Barros, J.A.O.; Dias, S.J.E.; Baghi, H.; Ventura-Gouveia, A. New Shear Strengthening Configurations of Near-Surface-Mounted CFRP Laminates for RC Beams. ACI Struct. J. 2016, 113, 1275–1287. [Google Scholar] [CrossRef]
  17. Shomali, A.; Mostofinejad, D.; Esfahani, M.R. Effective strain of CFRP in RC beams strengthened in shear with NSM reinforcements. Structures 2020, 23, 635–645. [Google Scholar] [CrossRef]
  18. Sabol, P.; Priganc, S. Shear Strengthening of Concrete Members Using NSM Method. Procedia Eng. 2013, 65, 364–369. [Google Scholar] [CrossRef]
  19. Triantafyllou, G.G.; Rousakis, T.C.; Karabinis, A.I. Effect of patch repair and strengthening with EBR and NSM CFRP laminates for RC beams with low, medium and heavy corrosion. Compos. Part B Eng. 2018, 133, 101–111. [Google Scholar] [CrossRef]
  20. Alwash, D.; Kalfat, R.; Al-Mahaidi, R.; Du, H. Shear strengthening of RC beams using NSM CFRP bonded using cement-based adhesive. Constr. Build. Mater. 2021, 301, 124365. [Google Scholar] [CrossRef]
  21. Arslan, M.H.; Yazman, Ş.; Hamad, A.A.; Aksoylu, C.; Özkılıç, Y.O.; Gemi, L. Shear strengthening of reinforced concrete T-beams with anchored and non-anchored CFRP fabrics. Structures 2022, 39, 527–542. [Google Scholar] [CrossRef]
  22. Kotynia, R.; Oller, E.; Marí, A.; Kaszubska, M. Efficiency of shear strengthening of RC beams with externally bonded FRP materials–State-of-the-art in the experimental tests. Compos. Struct. 2021, 267, 113891. [Google Scholar] [CrossRef]
  23. Naser, M.Z.; Hawileh, R.A.; Abdalla, J. Modeling Strategies of Finite Element Simulation of Reinforced Concrete Beams Strengthened with FRP: A Review. J. Compos. Sci. 2021, 5, 19. [Google Scholar] [CrossRef]
  24. Abbasi, A.; Benzeguir, Z.E.A.; Chaallal, O.; El-Saikaly, G. FE Modelling and Simulation of the Size Effect of RC T-Beams Strengthened in Shear with Externally Bonded FRP Fabrics. J. Compos. Sci. 2022, 6, 116. [Google Scholar] [CrossRef]
  25. Assad, M.; Hawileh, R.; Abdalla, J. Finite Element Simulation of FRP-Strengthened Thin RC Slabs. J. Compos. Sci. 2022, 6, 263. [Google Scholar] [CrossRef]
  26. Fib Bulletin 90. Externally Applied FRP Reinforcement for Concrete Structures, fib Task Group 5.1: Lausanne, Switzerland, 2019.
  27. ACI 440.2R-17; Guide for the Design and Construction of Externally Bonded FRP Systems for Strengthening Concrete Structures. American Concrete Institute: Farmington Hills, MI, USA, 2017.
  28. Collins, M.P.; Mitchell, D. Pre-Stressed Concrete Structures; Prentice Hall: Englewood Cliffs, NJ, USA, 1991; Volume 9. [Google Scholar]
  29. Kani, G.N.J. The Riddle of Shear Failure and its Solution. ACI J. Proc. 1964, 61, 441–468. [Google Scholar] [CrossRef]
  30. Eslami, A.; Moghavem, A.; Shayegh, H.R.; Ronagh, H.R. Effect of FRP stitching anchors on ductile performance of shear-deficient RC beams retrofitted using FRP U-wraps. Structures 2020, 23, 407–414. [Google Scholar] [CrossRef]
  31. Smith, M. ABAQUS/Standard User’s Manual, Version 2023; Dassault Systèmes Simulia Corp.: Johnston, RI, USA, 2023. [Google Scholar]
  32. Mander, J.B.; Priestley, M.J.N.; Park, R. Conducted Providing the Stress-Strain Model for Confined Concrete. J. Struct. Eng. 1988, 114, 1804–1826. [Google Scholar] [CrossRef]
  33. Fib Bulletin 70. Code-Type Models for Concrete Behavior, Task Group 8.7: Lausanne, Switzerland, 2013.
  34. Lee, J.; Fenves, G.L. Plastic-Damage Model for Cyclic Loading of Concrete Structures. J. Eng. Mech. 1998, 124, 892–900. [Google Scholar] [CrossRef]
  35. Kupfer, H.; Hilsdorf, H.K.; Rusch, H. Behavior of concrete under biaxial stresses. J. Proc. 1969, 66, 656–666. [Google Scholar] [CrossRef]
  36. Barros, J.; Sanz, B.; Filho, M.; Figueiredo, F.; Kabele, P.; Yu, R.C.; Meschke, G.; Planas, J.; Cunha, V.; Caggiano, A.; et al. Blind competition on the numerical simulation of continuous shallow steel-fiber reinforced concrete beams failing in bending. Struct. Concr. 2023, 24, 3877–3907. [Google Scholar] [CrossRef]
Figure 1. Series I and II of the experimental program [13]: (a) REF-I beam; (b) SFS-I beam; (c) SFSA-I beam; (d) section A1 (REF-I), section B1 (SFS-I), and section C1 (SFSA-I); (e) REF-II beam; (f) SFS-II beam; (g) SFSA-II beam; (h) section A2 (REF-II), section B2 (SFS-II) and section C2 (SFSA-II); (i) DET.1; (j) DET.2; (k) reinforcement cage detail in confined zone. (All dimensions are in mm).
Jcs 08 00348 g001aJcs 08 00348 g001bJcs 08 00348 g001c
Figure 2. (a) Arrangement of the LVDTs to record the beam displacement (all dimensions are in mm) depicted schematically; (b) strain gauges’ configuration in the steel reinforcements of REF-I, SFS-I, and SFSA-I beams; (c) strain gauges configuration in the CFRP (flexural and shear strengthening) of SFS-I and SFSA-I beams; (d) strain gauges configuration in the steel reinforcements of REF-II, SFS-II, and SFSA-II beams; (e) strain gauges configuration in the CFRP (flexural and shear strengthening) of SFS-II and SFSA-II beams.
Jcs 08 00348 g002
Figure 4. Non-associated plasticity potential function for concrete [31].
Jcs 08 00348 g004
Figure 5. τ-s relation for simulating the bond between EBR U-shaped CFRP strips and concrete substrate [26].
Jcs 08 00348 g005
Figure 6. Applied boundary and support constraints. (a) Steel reinforcement of the beams, (b) beam section and degree of freedom of symmetry plane, and (c) boundary conditions and applied displacement of the beams.
Jcs 08 00348 g006
Figure 7. Sensitivity analysis in terms of the refinement of the finite element mesh.
Jcs 08 00348 g007
Figure 8. The finite element mesh refinement which applied to all beams and CFRP strips (elements of 35 mm edge).
Jcs 08 00348 g008
Figure 9. Influence of the bond conditions on the force versus deflection of beam: (a) SFS-I and (b) SFS-II.
Jcs 08 00348 g009
Figure 10. Alteration of the τ - s specified in fib Bulletin 90 and its impact on the force–deflection behavior of SFS-I and SFS-II beams: (a) SFS-I beam, (b) SFS-II beam.
Jcs 08 00348 g010
Figure 11. Experimental and numerical comparison in terms of force versus deflection in beam: (a) SFSA-I; (b) SFSA-II.
Jcs 08 00348 g011
Figure 12. Experimental crack pattern at the failure of the series I beams and numerical representation of the maximum principal plastic strains: (a) REF-I; (b) SFS-I; and (c) SFSA-I.
Jcs 08 00348 g012aJcs 08 00348 g012b
Figure 13. Experimental crack pattern at the failure of the series II beams and numerical representation of the maximum principal plastic strains: (a) REF-II; (b) SFS-II; and (c) SFSA-II.
Jcs 08 00348 g013aJcs 08 00348 g013b
Figure 14. Strain vs. applied load relationship in beams series I. (a) Shear steel reinforcement (REF-I), (b) longitudinal steel reinforcement (SFS-I), (c) NSM CFRP laminate (SFS-I), (d) EBR CFRP strips (SFS-I), (e) longitudinal steel reinforcement (SFSA-I), (f) NSM CFRP laminate (SFSA-I), and (g) EBR CFRP strips (SFSA-I).
Jcs 08 00348 g014
Figure 15. Strain vs. applied load relationship in beams series II. (a) Shear steel reinforcement (REF-II), (b) NSM CFRP laminate (SFS-II), (c) EBR CFRP strips (SFS-II), (d) shear steel reinforcement (SFSA-II), (e) NSM CFRP laminate (SFSA-II), and (f) EBR CFRP strips (SFSA-II).
Jcs 08 00348 g015aJcs 08 00348 g015b
Figure 18. NSF-4 and 5 and NSFA-4 and 5 beams: (a) Load-deflection; (b) load versus maximum strain in the flexural steel reinforcements; (c) load versus maximum strain in the NSM CFRP laminates; (d) load versus maximum strain in the U-shaped CFRP strips.
Jcs 08 00348 g018
Figure 19. (a) Representation of principal plastic strains in NSF-5 beam, (b) debonding slip field in the U-shaped CFRP strips of the NSF-5 beams, and (c) principal plastic strains in NSFA-5 beam.
Jcs 08 00348 g019aJcs 08 00348 g019b
Figure 20. NSF-1 to 3 and NSFA-1 to 3 beams: (a) load-deflection; (b) load versus maximum strain in the flexural steel reinforcements; (c) load versus maximum strain in the NSM CFRP laminates; (d) load versus maximum strain in the U-shaped CFRP strips.
Jcs 08 00348 g020
Figure 21. (a) Representation of principal plastic strains in the NSF-8 beam, (b) debonding slip field in the U-shaped CFRP strips of the NSF-8 beam, and (c) principal plastic strains in the NSFA-8 beam.
Jcs 08 00348 g021
Table 1. Summary of test beam specifications.
Beam ρ s l  1 (%)CFRP Flexural Strengthening ρ s w  3 (%)CFRP Shear Strengthening
Technique ρ f l  2 (%)Technique ρ f w  4 (%)Anchorage
REF-ISeries I1.46--0.1---
SFS-I1.46NSM0.080.1EBR0.16No
SFSA-I1.46NSM0.080.1EBR0.16Yes
REF-IISeries II1.74--0.21---
SFS-II1.74NSM0.080.21EBR0.08No
SFSA-II1.74NSM0.080.21EBR0.08Yes
1 Ratio of steel reinforcement in flexure, ρ s l = A s l × 100 / b w d s , where the cross-sectional area of the steel bars located at the bottom is denoted by A s l , b w refers to the width of the web of the beam and d s refers to the width of the web of the beam (Figure 1d,h). 2 Ratio of CFRP used for flexural strengthening ρ f l = A f × 100 / b w × d f , where the NSM laminates have a cross-sectional area denoted by A f and the internal lever arm of the NSM reinforcement is denoted by d f (Figure 1d,h). 3 Steel reinforcement ratio for shear, ρ s w = A s w × 100 / b w s w , where A s w corresponds to the total cross-sectional area of the two legs that make up a steel stirrup, and s w represents the spacing between adjacent stirrups (Figure 1a,b,e–h). 4 Shear CFRP reinforcement ratio, ρ f w = ( 2 × t f × n f × b f ) × 100 / ( b w × s f × sin θ f ) , where t f represents the thickness of the CFRP wet lay-up strip, n f denotes the number of layers (where n can be 1 or 2), b f is the width of the CFRP strip, and s f refers to the spacing between consecutive CFRP strips, while θ f indicates the angle between the orientation of the CFRP fibers and the longitudinal axis of the beam (Figure 1b–d,f–h).
Table 2. Summary of main experimental findings.
BeamFmax
(kN)
uLS
(mm)
Failure
Mode
CFRP Maximum Strains (‰)
CL1CL2CV1CV2CV3CV4
REF-I310.312.54Shear------
SFS-I365.110.44Shear-3.73.02.14.34.4
SFSA-I479.028.59Flexural12.13.64.72.24.64.2
REF-II349.514.89Shear------
SFS-II411.49.22Shear3.92.70.81.44.78.2
SFSA-II526.233.23Flexural15.310.64.92.13.16.6
Table 3. Numerical model parameters: concrete damage plasticity.
ParametersValues
Dilation angle, ψ (Degree)40
e0.1
f b 0 / f c 0 1.16
Kc0.667
f c t (MPa)2.1
G f t (N·m)100
α 0.2
ξ 0.05
Crack bandwidth:
Mesh 30 mm30 mm
Mesh 35 mm35 mm
Mesh 50 mm50 mm
f l / f c (REF-I, REF-II, SFS-I, and SFS II beams) [32]0.0
f l / f c ((SFSA-I and SFSA-II beams) [32]0.26
f c (MPa)44.3
E 0 (GPa)27.28
ε c u *0.0045
* It is the ultimate strain in concrete and should be considered in the Mander model to obtain the compressive behavior of concrete.
Table 4. Variation of the properties considered in the parametric study.
No.Model IDFlexural Strengthening Ratio with NSM CFRP Laminates— ρ f l (%)Shear Strengthening Ratio with EBR CFRP Strips— ρ f w (%)Flexural Reinforcement Ratio of Longitudinal Steel Bars— ρ s l (%)Anchorage
1NSF-10.060.080.97No
2NSF-20.090.080.97No
3NSF-30.120.080.97No
4NSF-40.080.160.97No
5NSF-50.080.240.97No
6NSF-60.080.081.28No
7NSF-70.080.081.83No
8NSF-80.080.082.28No
9NSFA-10.060.080.97Yes
10NSFA-20.090.080.97Yes
11NSFA-30.120.080.97Yes
12NSFA-40.080.160.97Yes
13NSFA-50.080.240.97Yes
14NSFA-60.080.081.28Yes
15NSFA-70.080.081.83Yes
16NSFA-80.080.082.28Yes
Table 5. Maximum strains and comparison of numerical and analytical solutions.
BeamMaximum Load [kN]Strain SLmax [‰]Strain CLmax [‰]Strain CVmax [‰]Load Capacity
ACI 440.2R-17 [kN]
Load Capacity
fib90 [kN]
Fnum/Fana
ACI440
Fnum/Fana
fib90
Failure
Mode (1)
NSF-1315.988.3212.405.78313.0288.21.011.10S
NSF-2291.823.596.195.80313.0288.20.931.01S
NSF-3288.392.876.306.00313.0288.20.921.00S
NSF-4298.975.086.842.39349.4345.40.860.87S
NSF-5296.444.095.631.86370.1389.30.800.76S
NSF-6300.883.465.411.36313.0288.20.961.04S
NSF-7300.892.334.213.08313.0288.20.961.04S
NSF-8312.851.474.082.29313.0288.21.001.09S
NSFA-1399.8217.4317.883.86304.4338.61.311.18F
NSFA-2431.6520.0917.166.12334.3380.81.291.13F
NSFA-3456.1316.4716.636.81364.1422.91.251.08F
NSFA-4420.6120.2716.694.26324.4366.81.301.15F
NSFA-5428.4117.7417.862.32324.4366.81.321.17F
NSFA-6514.8320.9517.745.37398.8440.51.291.17F
NSFA-7518.428.0415.1711.53527.8569.20.980.91F
NSFA-8465.592.6115.4111.00629.8(F)
313.0(S)
672.7(F)
288.2(S)
0.74(F)
1.49(S)
0.69(F)
1.62(S)
F
Average 1.06 (2)1.02 (2)
CoV 0.18 (2)0.14 (2)
(1) S: shear failure mode; F: flexural failure mode; (2) assuming a flexural failure mode for the NSFA-8 beam.
Disclaimer/Publisher’s Note: The statements, opinions and data contained in all publications are solely those of the individual author(s) and contributor(s) and not of MDPI and/or the editor(s). MDPI and/or the editor(s) disclaim responsibility for any injury to people or property resulting from any ideas, methods, instructions or products referred to in the content.

