Abstract
Reinforcing crack-damaged concrete structures with ultra-high-performance concrete (UHPC) proves to be more time-, labor-, and cost-efficient than demolishing and rebuilding under the dual-carbon strategy. In this study, the extended finite element method (XFEM) in ABAQUS was first employed to develop a numerical model of UHPC-reinforced single-notched concrete (U+SNC) beams, analyze their crack extension behavior, and obtain the parameters necessary for calculating fracture toughness. Subsequently, the fracture toughness and instability toughness of U+SNC were calculated using the improved double K fracture criterion. The effects of varying crack height ratios (a/h) of SNC, layer thicknesses (d) of UHPC reinforcement, and fiber contents in UHPC (VSF) on the fracture properties of U+SNC beams were comprehensively investigated. The results indicate that (1) the UHPC reinforcement layer significantly enhances the load-carrying capacity and crack resistance of the U+SNC beams. Crack extension in the reinforced beams occurs more slowly than in the unreinforced beams; |(2) the fracture performance of the U+BNC beams increases exponentially with d. Considering both the reinforcement effect benefit and beam deadweight, the optimal cost-effective performance is achieved when d is 20 mm; (3) with constant d, increasing a/h favors the reinforcement effect of UHPC on the beams; (4) as VSF increases, the crack extension stage in the U+BNC beam becomes more gradual, with higher toughness and flexural properties; therefore, the best mechanical properties are achieved at a VSF of 3%.
1. Introduction
The durability, load-bearing capacity, and safety of concrete structures in use are compromised by human and natural factors, leading to structural damage and crack propagation issues [1]. Since these damaged structures may no longer meet operational standards, comprehensive quality assessments and evaluations are crucial. It is essential to implement subsequent reinforcement and strengthening measures to ensure compliance with current safety and performance standards [2]. Nowadays, the focus of many engineering structures has shifted from construction to reinforcement and strengthening. The effectiveness of these efforts is critical to ensuring secondary seismic safety, durability, and cost-effective maintenance. In the context of “carbon peaking and carbon neutrality”, reinforcing damaged structures with advanced materials is more sustainable than demolition and reconstruction, which are more time-consuming and resource-intensive. Strengthening the weak layers, components, or critical parts of reinforced concrete structures can significantly enhance their overall strength, stiffness, and ductility [3].
Research indicates that concrete structures reinforced with ultra-high-performance concrete (UHPC) composite exhibit not only high flexural [4,5,6], tensile [7,8,9], crack resistance [10], and seismic performance [11,12,13,14], but also ensure bond durability [15,16]. Men et al. [17] observed that the UHPC reinforcement layer effectively suppresses crack propagation, with the cracking load and ultimate load of UHPC-reinforced T-beams increasing by 39–339% and 26–113%, respectively. Al-shaadi et al. [18] investigated the bond strength between UHPC and normal concrete (NC) under different surface treatments, concluding that the interface bond strength between UHPC and NC is excellent under all conditions, affirming UHPC’s potential as a repair composite material. Wu et al. [19] investigated the effect of restoring the bonding properties of pre-damaged NC by the modification method using UHPC, and the results of the study proved that UHPC was able to substantially improve the bonding properties of the pre-damaged NC.
Establishing a reliable and precise model is beneficial for future research and engineering practice applications. Researchers use the FEM to study the performance of UHPC-reinforced NC (U+NC) structures, aiming to obtain critical data that are difficult to acquire through experiments. This approach provides practical structural model analysis, allowing for parameter adjustment and the optimization of reinforcement performance, thereby demonstrating broad application potential [4,7,8,9,20,21,22]. The modeling of U+NC beams by different FEM software is summarized in Table 1.

Table 1.
Modeling of U+NC beams by different FEM software.
However, there are still several areas that require further development at this stage [23,24,25,26,27]:
- a.
- There needs to be deeper investigation into the fracture toughness of U+NC beams.
- b.
- Quantitative formulas for calculating the ductility of U+NC are absent.
- c.
- Interfacial bond–slip properties are less often considered in simulations (mostly treated as a perfect connection or a constant is specified).
In summary, it is necessary to establish an FEM model for the fracture analysis of composite beams that considers the interface bond–slip between UHPC and NC. The model should be able to accurately predict the fracture parameters of the composite beam, and then calculate the toughness index of the UHPC-reinforced NC beam through a series of mathematical formulas, and finally realize the quantitative characterization of the toughness effect of the UHPC-reinforced NC structure.
The extended finite element method (XFEM) allows for the detailed modeling of crack initiation and propagation without requiring re-meshing while retaining the advantages of the traditional FEM in solving nonlinear problems. This method has been widely applied in fracture mechanics [28,29,30]. Tawfik et al. [31] used ABAQUS 2021 software and various methods (CIT, VCCT, and XFEM) to study the nonlinear bending characteristics of notched reinforced concrete beams and compared the results with experimental data, and found that the XFEM provided more accurate simulations of bending behaviors. Li et al. [32] simulated the damage evolution of cracked reinforced concrete beams using the concrete damage plasticity (CDP) model and XFEM, concluding that the CDP model failed to accurately represent the post-cracking behavior, rendering the XFEM the preferred method.
The cracking behavior of composite material-reinforced concrete structures is complex and influenced by multiple factors, which undoubtedly increases the computational difficulty [33,34]. Over the past 30 years, the double-K fracture criterion, as a standard and recommended method for testing concrete fracture performance, has been widely applied in engineering and composite material fracture mechanics [35]. Gao et al. [36] developed failure load prediction equations for concrete at different ages and obtained the double-K fracture parameters of concrete at various periods. Xie et al. [37] conducted an in-depth study on the crack propagation evolution in reactive powder concrete with varying basalt fiber content, concluding that when the fiber content reached 1.5%, the double-K fracture toughness of the concrete reached its maximum.
Therefore, this study first established a model of UHPC-reinforced sign-cracked concrete (U+SNC) beams based on the XFEM method, investigating the crack propagation patterns of U+BNC and obtaining the fracture parameters of U+BNC beams. The double-K fracture toughness of the U+SNC beams was then calculated using an improved double-K fracture model. This study explored the effects of the crack height ratio (a/h) of SNC, the layer thickness of the UHPC reinforcement (d), and the steel fiber content in the UHPC (VSF) on the fracture toughness of U+SNC beams, aiming to provide theoretical and technical support for crack propagation and fracture toughness calculations in UHPC and other composite material-reinforced concrete structures.
2. Methods
2.1. Double-K Fracture Criterion
- (1)
- SNC
The double-K fracture model for concrete proposed by Xu et al. [35] divides the crack extension process of concrete into three stages, namely, crack initiation, stable crack extension, and unstable crack extension, and the model introduces the initiation fracture toughness and the unstable fracture toughness , through which the crack extension is judged.
The initiation fracture toughness is the stress intensity factor corresponding to the crack initiation, the load applied at this time is defined as the initiation load , and the crack length is the initial crack length . The destabilization fracture toughness is the stress intensity strain corresponding to the crack destabilization development; the load applied at this time is the destabilization load , which is also the maximum load; the crack length is the critical effective crack length ; and the CMOD is the critical .
The calculation of the stress intensity factor for three-point bending concrete beams, as mentioned in the literature [38], is shown in Equations (1)–(5) below.
where
where F is the load applied to the concrete beam, kN; m is the mass between the specimen supports, kg; g is the acceleration of gravity, taken as 9.81 ; S is the span between the two supports of the specimen, m; and t and h are the thickness and height of the specimen, respectively, m.
If , , then . Here, is the cracking load of the notched beam, kN; the load corresponds to the turning point in the rising section of the F-CMOD curve of the specimen from a straight section to a curved section. a and h are the initial crack length and height of the concrete beam, respectively, m.
If F = , , then . Here, is the maximum load of the beam, kN, and is the effective crack length, m.
is calculated according to the following equation:
where is the thickness of the thin steel plate of the device clamping extension cutter, m. The finite element calculation takes h = 0. is the critical CMOD, . E is the calculated modulus of elasticity, GPa.
The calculated modulus of elasticity E can be determined from the F-CMOD relationship given in the literature [39], which is as follows:
where
where is the initial stiffness of the specimen, calculated at any point in the linear elastic stage of the F-CMOD curve.
- (2)
- U+SNC
Due to the restriction effect of the UHPC layer on the development of cracks in notched concrete, the two parameters of initiation toughness and instability toughness in the double-K fracture criterion used in this study are different from the two parameters in the double-K fracture criterion for plain concrete. Therefore, the method in Ref. [40] is used in this study to calculate the initiation toughness and instability toughness of the U+SNC three-point bending beam.
The following assumptions are made for the U+SNC-reinforced beam: (1) the crack surface is linear, (2) the interface crack between the UHPC and concrete is not considered, and (3) the force of the UHPC on the concrete beam is equated to the concentrated force acting on the bottom of the beam.
The stress intensity factor resulting from the action of the UHPC during crack propagation is calculated as shown in Equations (6) and (7) below.
where
where d is the thickness of the UHPC reinforcement layer.
If , then . Here, is the tensile stress of the UHPC when the U+SNC beam starts to crack. is the stress intensity factor generated by the action of the UHPC when the initial crack in the U+SNC first starts to expand. Since the force of the UHPC acts to close the cracks, is negative.
If , then . Here, is the tensile stress of the UHPC when the crack in the U+SNC beam starts to destabilize. is the stress intensity factor at the crack tip generated by the action of the UHPC when the crack starts to destabilize and expand. Since the force of the UHPC acts to close the cracks, is negative. In order to make the calculation results more accurate, the of the U+SNC beams is calculated by extracting the critical effective crack length corresponding to the peak load using the Python secondary development program of ABAQUS software [41,42].
The cracking toughness and instability toughness of the U+SNC beam are found using the following Equations (8) and (9).
where is the U+SNC cracking toughness, and is the U+SNC destabilization toughness.
2.2. XFEM Crack Tip Processing Theory
- (1)
- XFEM crack tip processing theory
The displacement mode of the XFEM is based on the conventional FEM with the addition of the intermittent jump function of the reaction crack surface and the asymptotic displacement field function of the crack tip [43,44,45,46]. The formulae are shown in Equations (10)–(12) below.
where is the displacement form function of all nodes, is the vector of the degrees of freedom of all nodes, and is the vector of node degrees of freedom of the split-tip cell.
H(x) is an intermittent jump function along the crack plane, and it describes the discontinuity of the displacement field in the crack plane.
is the crack tip asymptotic displacement field function, and it describes the stress concentration phenomenon of the crack tip [24,25,26,27].
where is the integration point, which is the point located on the nearest point of the crack to X; n is the unit external normal vector of the crack at ; and is the polar coordinate system with the crack tip as the coordinate origin. Due to the introduction of the discontinuous displacement mode, the description of the discontinuous displacement field in the XFEM no longer depends on the cell boundary, and, compared with the conventional FEM, no mesh re-division is required when the discontinuous inner boundary evolves.
- (2)
- XFEM case validation
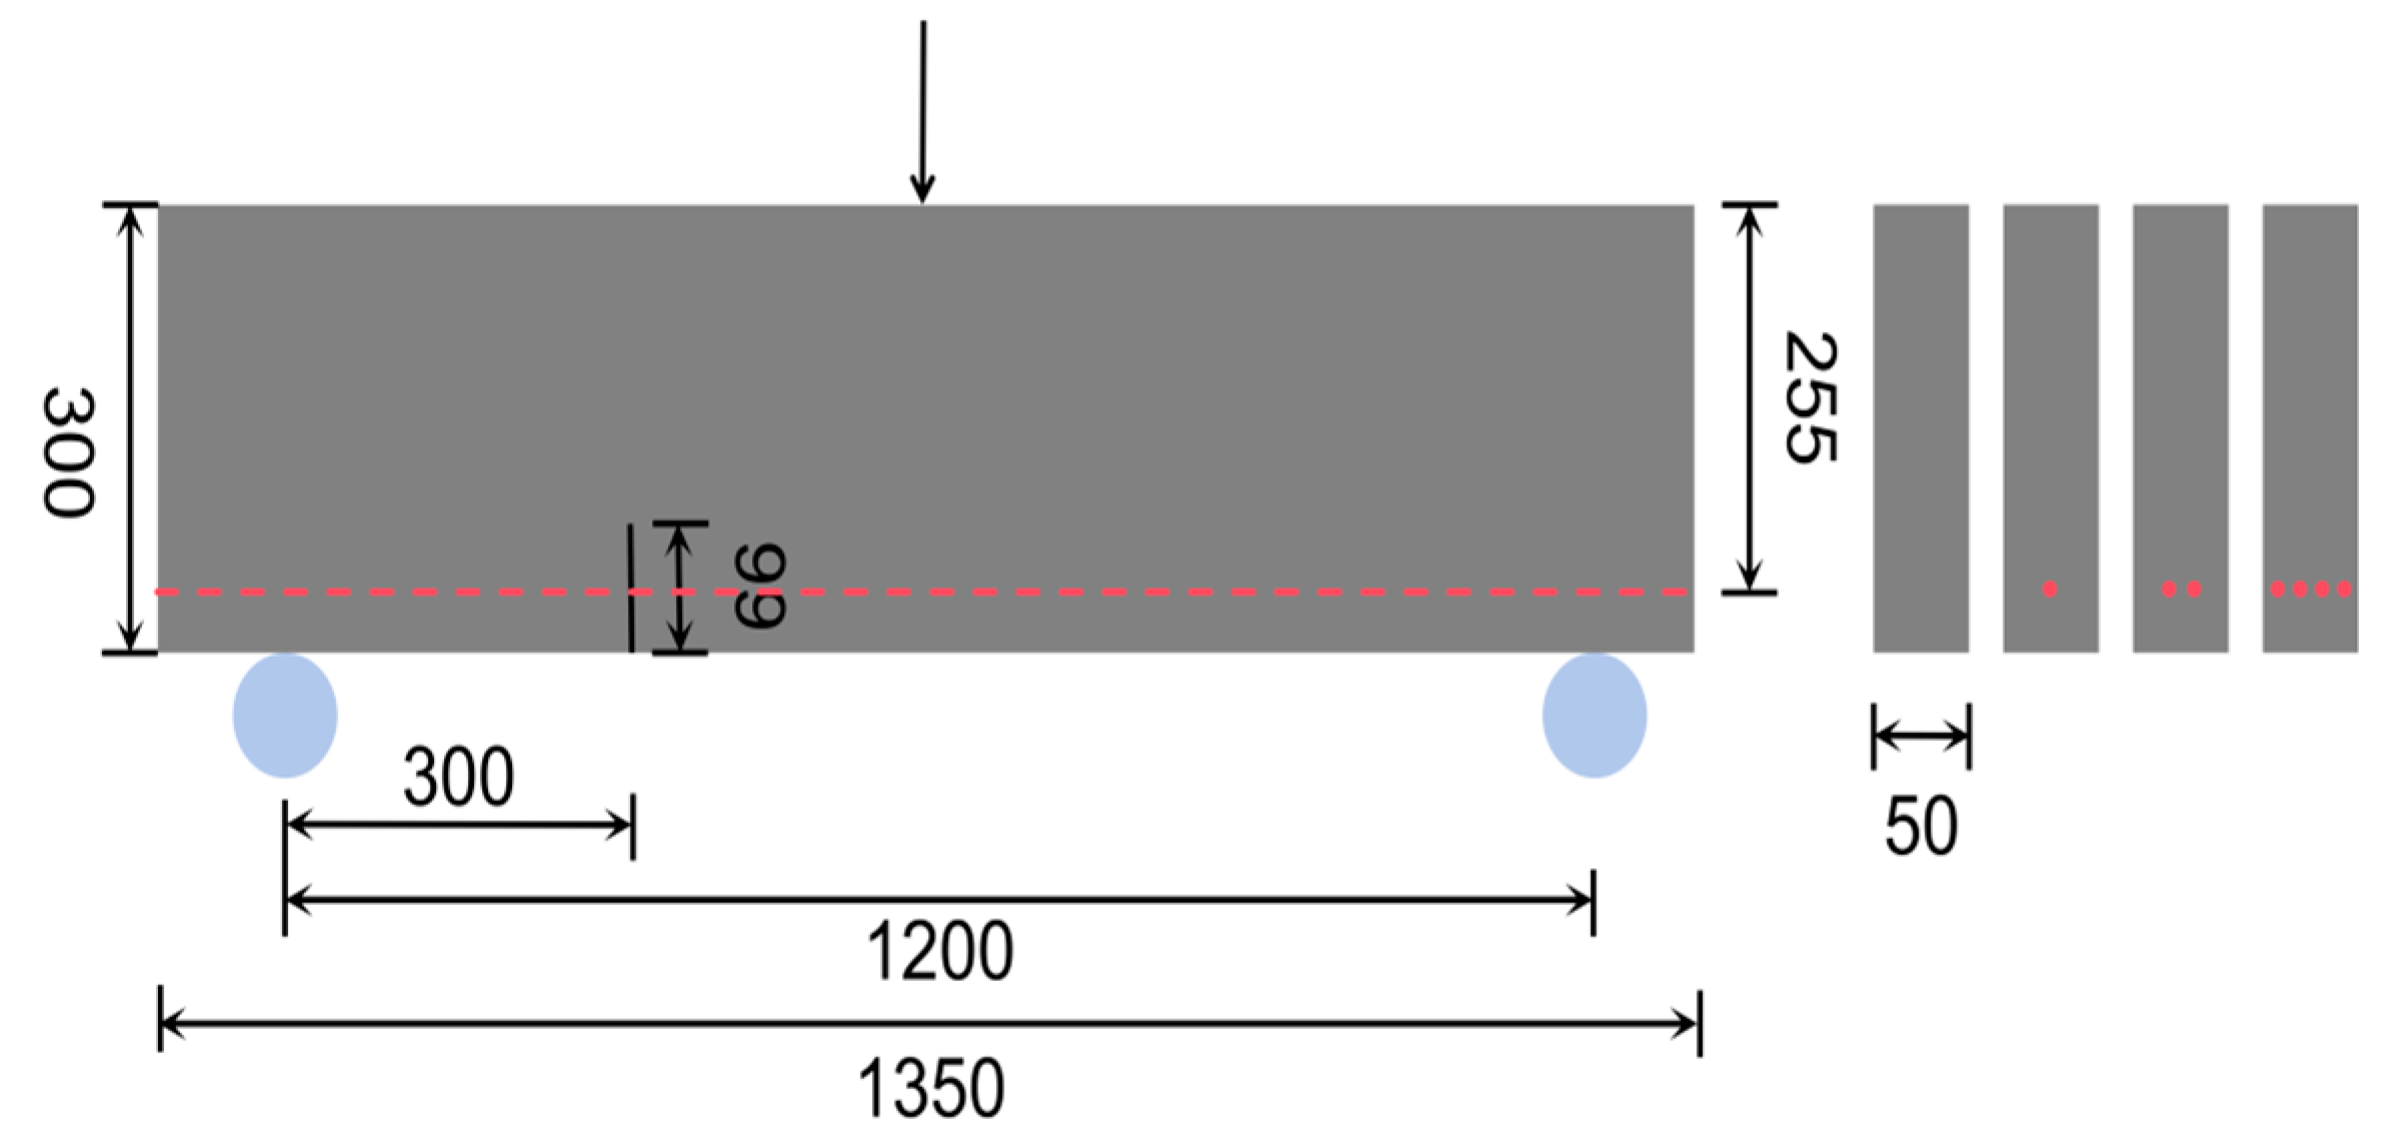
To validate the reliability of the XFEM method, this study modeled a reinforced concrete (RC) beam based on the experiment conducted by Carmona [47], as shown in Figure 1. The beam dimensions were 1350 mm × 300 mm × 50 mm, with an effective length of 1200 mm and a precast crack height of 100 mm, positioned 300 mm off-center from the beam’s mid-span. The longitudinal rebars were placed 45 mm from the lower edge of the RC beam, with a diameter of 2.5 mm, a yield strength of 563 MPa, and an ultimate tensile strength of 632 MPa. In the XFEM simulation, the constitutive relationship for concrete was defined using the maximum principal stress criterion to characterize material failure, while the mechanical behavior of the rebar was described by a bilinear model inserted into the concrete via an embedded region. The concrete and reinforcement were simulated using C3D8R solid elements and T3D2 truss elements, respectively.

Figure 1.
Geometric modeling of RC in Ref. [47] (The dotted line represents the longitudinal rebar).
Additionally, a small viscosity coefficient of 1 × 10⁻⁵ was set to stabilize damage, ensuring computational stability during the simulation. The experiment applied a displacement-controlled load at the mid-span of the beam to observe and analyze the structural response. The mechanical parameters of the RC material are listed in Table 2.
Table 2.
The mechanical parameters of the RC material.
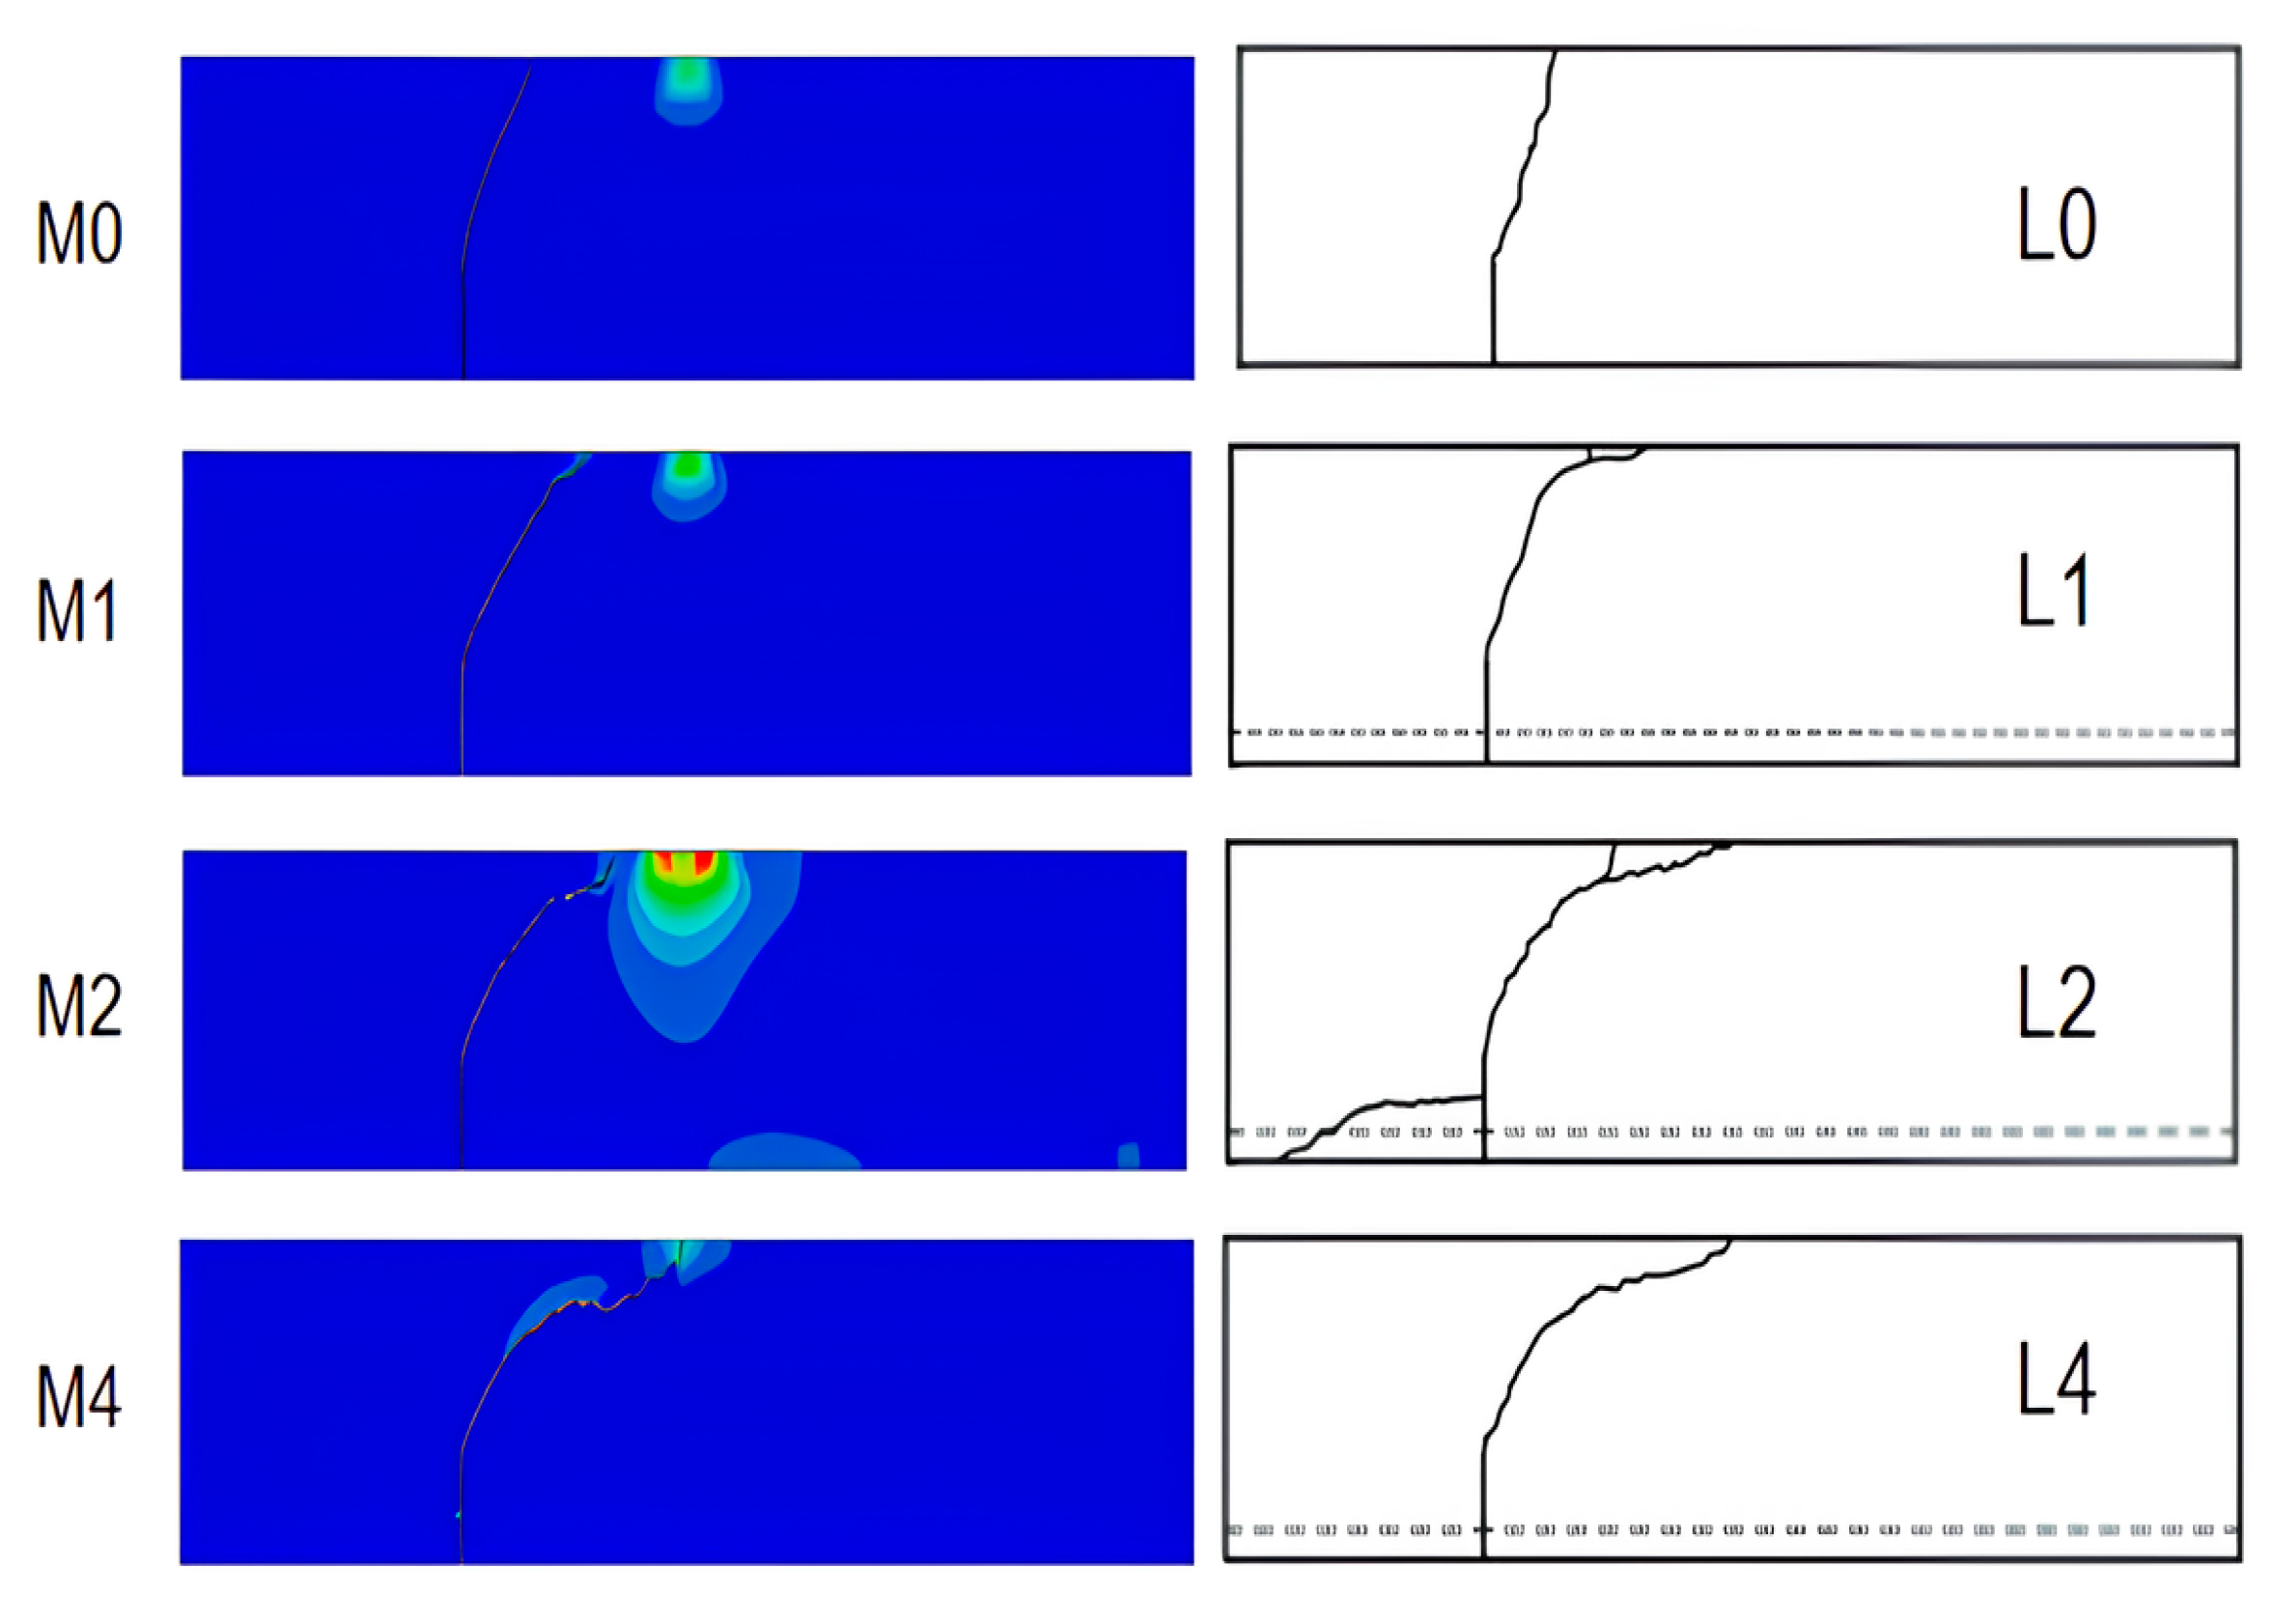
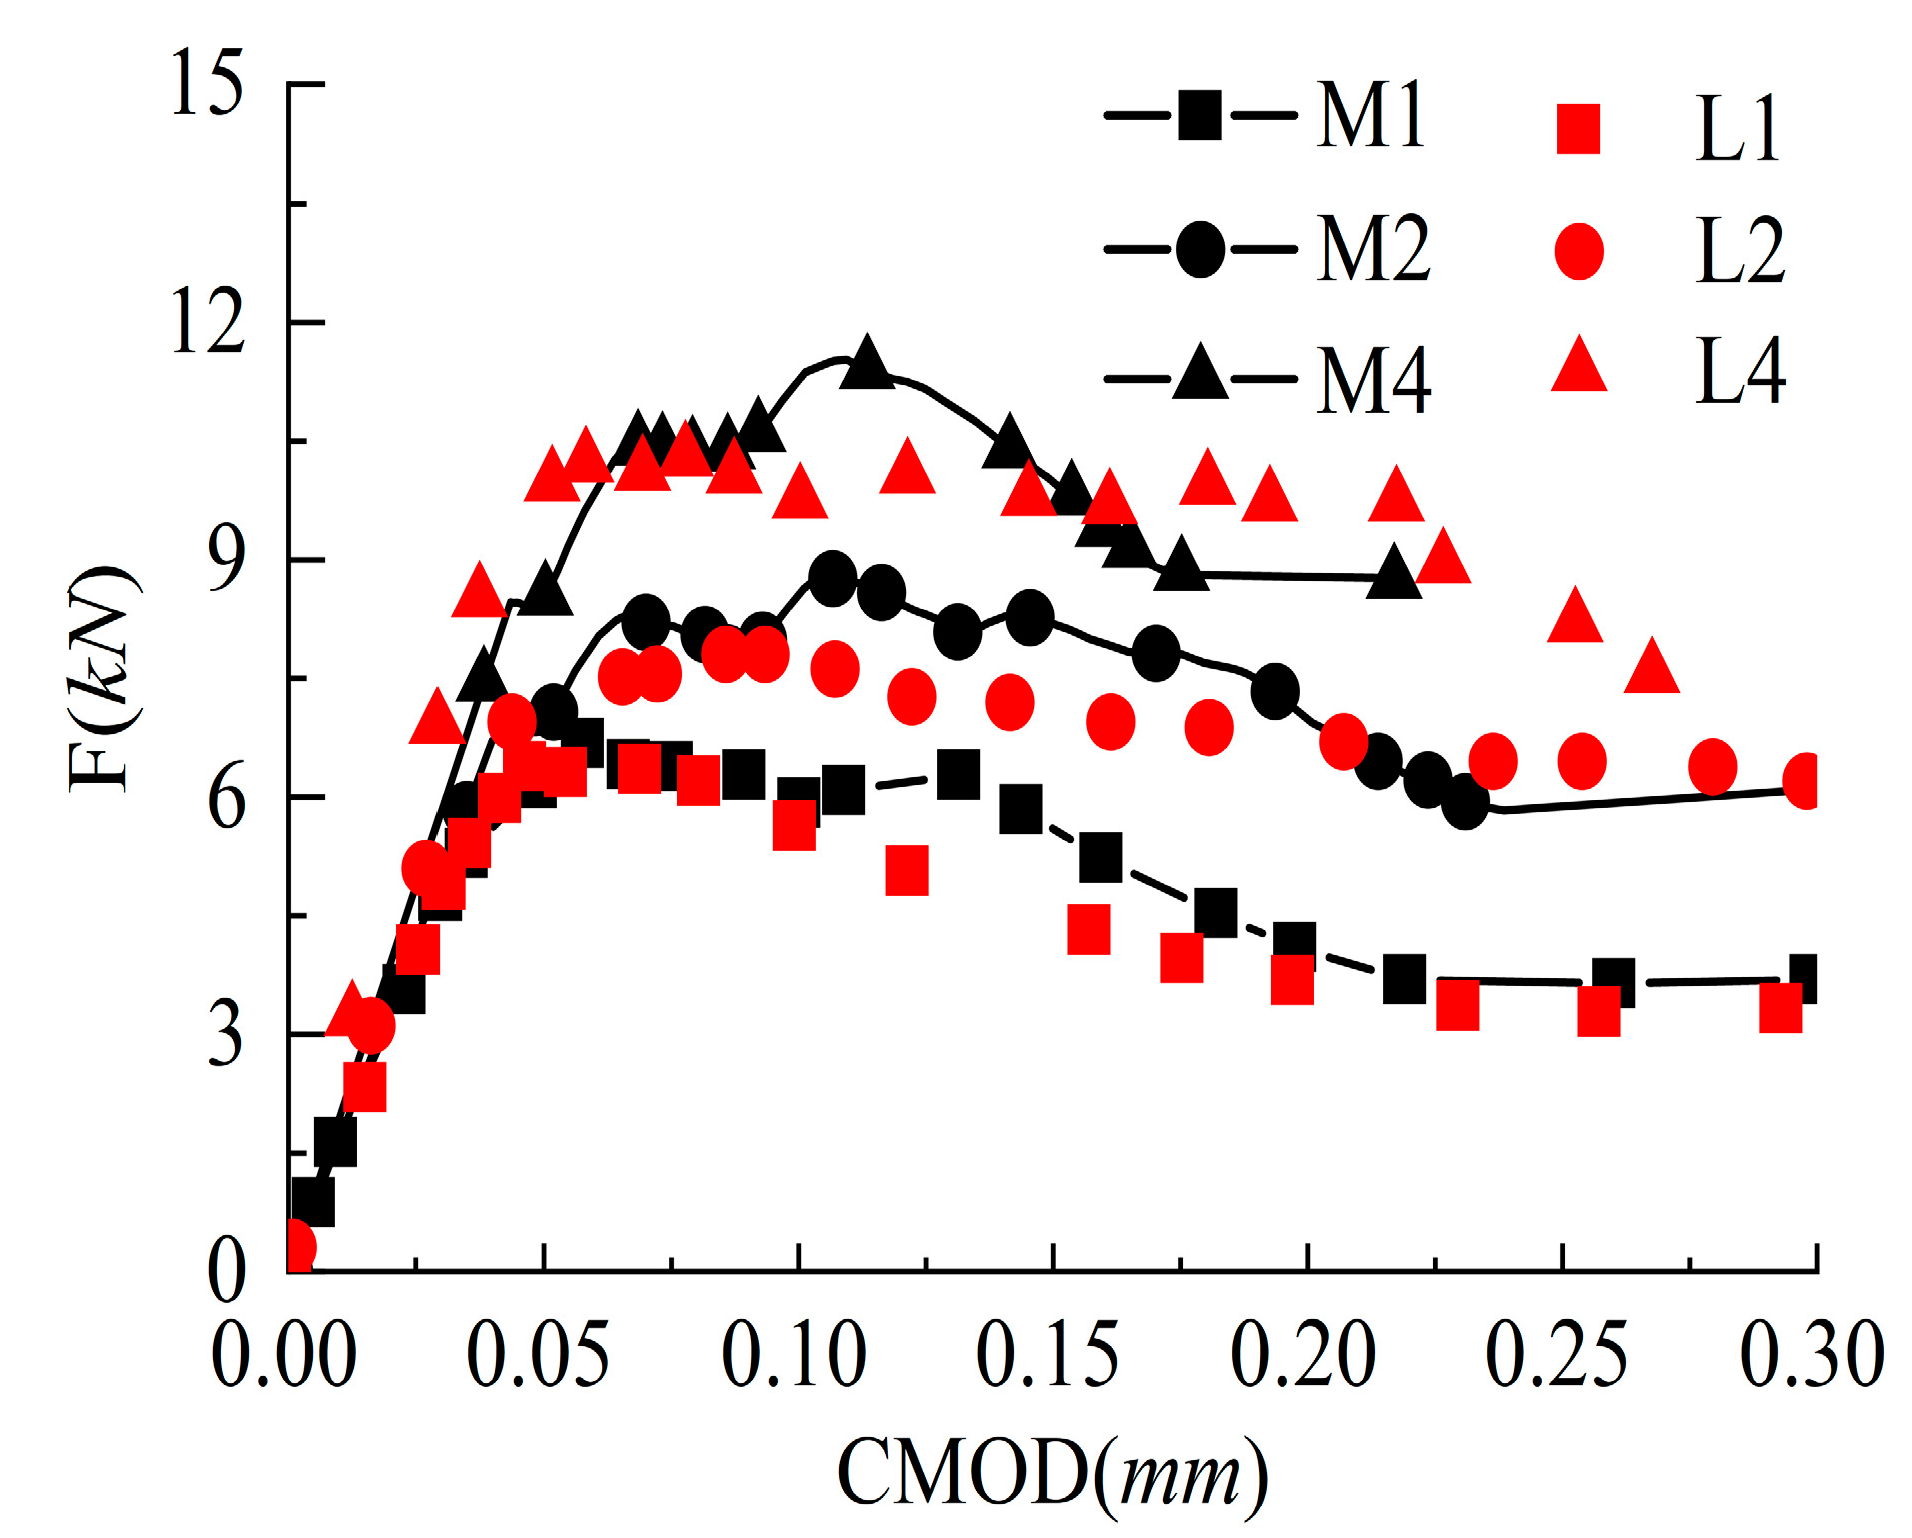
Figure 2 presents a comparison between the RC crack propagation states calculated in this study and those reported in [47]. Figure 3 and Table 3 compare the calculated results of this study with the experimental results from [47]. In this comparison, L0, L1, L2, and L4 represent the specimens in [47] with 0, 1, 2, and 4 rebars in the concrete, respectively, while M0, M1, M2, M3, and M4 represent the specimens in the XFEM simulation with 0, 1, 2, 3, and 4 reinforcing bars, respectively. As shown in Figure 2, using XFEM to predict the single fracture crack extension of RC beams with varying reinforcement amounts is highly consistent with the experimental results. Figure 3 and Table 3 indicate that the fracture toughness parameter indices obtained using the XFEM are more accurate, although errors increase with higher reinforcement content. Overall, the XFEM method presents high accuracy in studying the fracture behavior and parameters of predicted structures.

Figure 2.
Comparison of RC crack propagation state with that in Ref. [47].

Figure 3.
The calculated results of this study compared with the experimental results in Ref. [47].
Table 3.
Comparison of basic fracture parameters of RC beam with Ref. [47].
3. Finite Element Modeling of U+SNC
3.1. Geometric Model
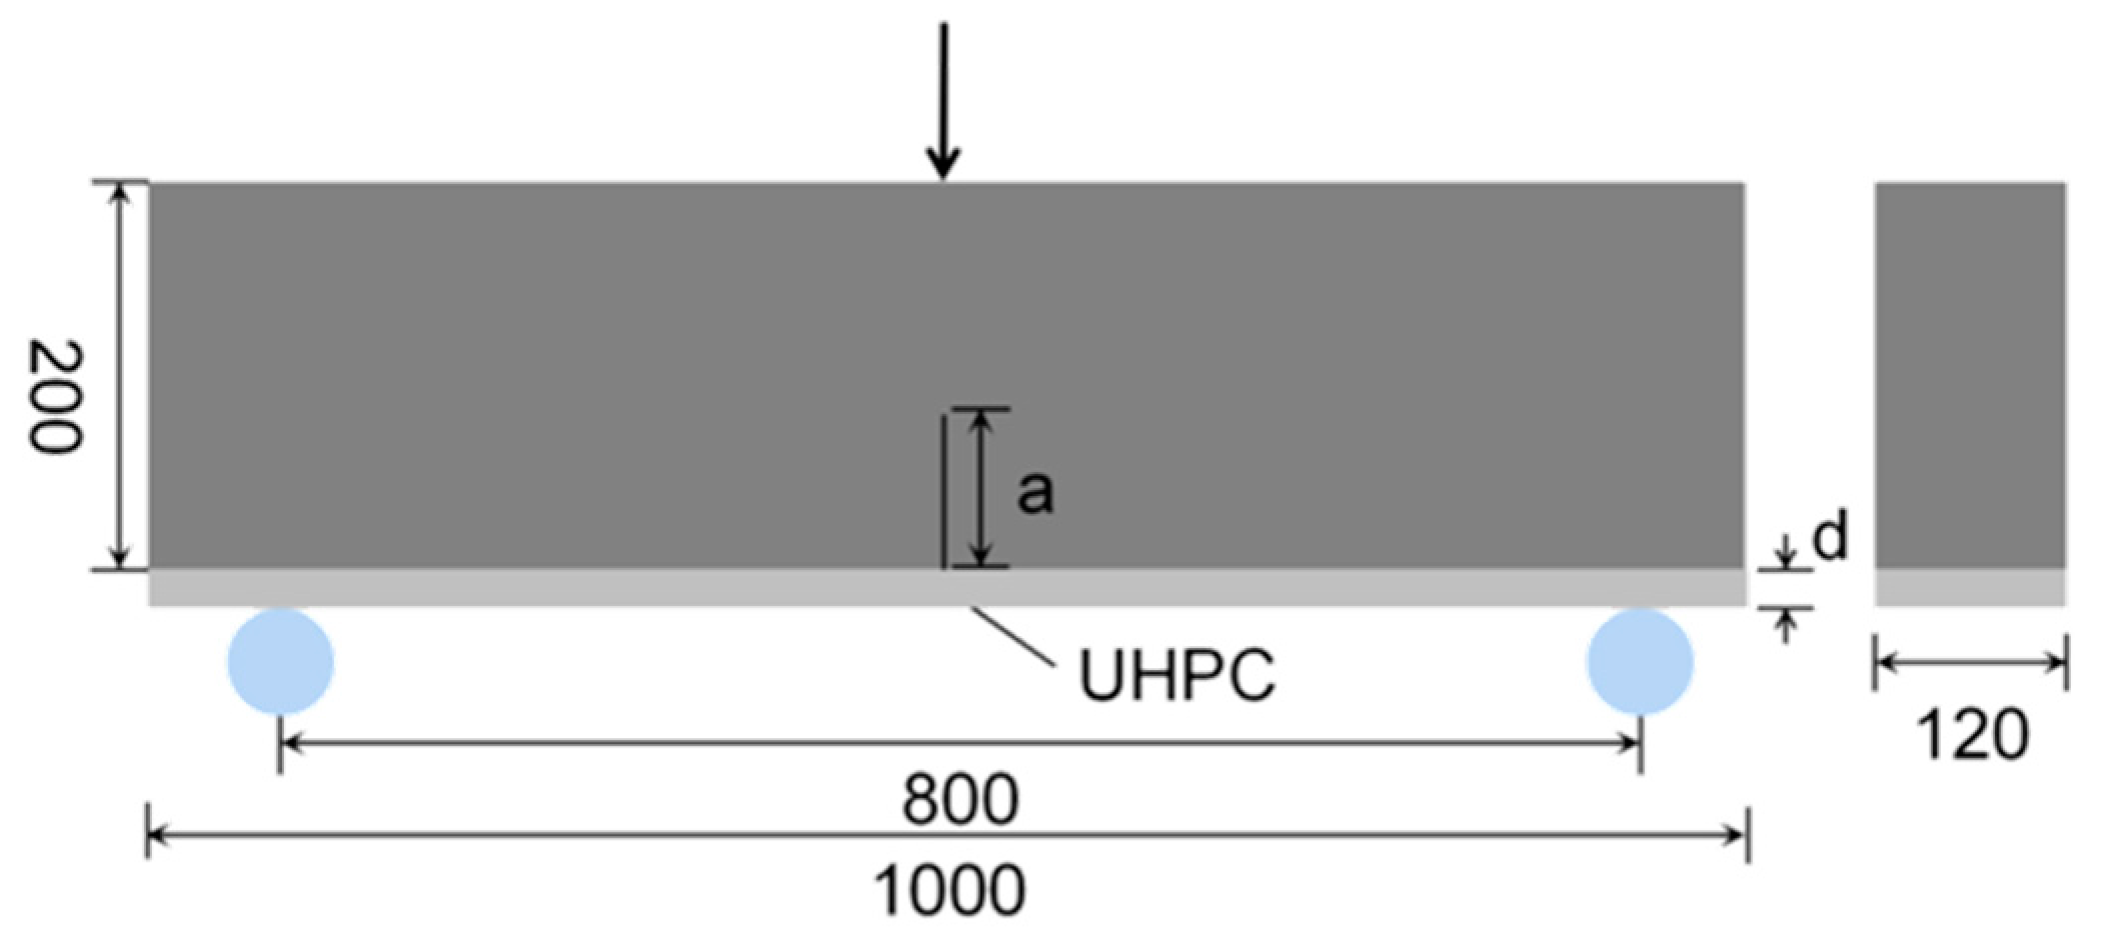
Figure 4 shows the geometric model of a three-point bending beam with a precast crack at mid-span, where a UHPC thin layer is bonded to the tensile surface. The SNC has a width of 120 mm, a height of 200 mm, a span of 800 mm, an initial crack length of a, and a UHPC thin layer thickness of d. The displacement loading rate was set at 1 mm/s. The concrete grade used in this study is C35, and its constitutive relationship is based on the maximum principal tensile stress criterion, with detailed performance parameters provided in Table 4 [48,49]. The UHPC material has an elastic modulus of 42.45 GPa and a Poisson’s ratio of 0.19, following the bilinear hardening model referenced in [50,51]. The constitutive equations for the tensile–compressive stress–strain relationship of UHPC are shown in Equations (13) and (14).
where ; is the compressive strength of the UHPC; and ε0 is the compressive strain of the UHPC at .
where . represents the tensile strength of the UHPC, is the tensile strain of the UHPC at , and is the ultimate tensile strain of the UHPC.

Figure 4.
Geometric model of U+SNC three-point bending beam (unit: mm).
Table 4.
Basic performance parameters of U+SNC.
3.2. Interface Model
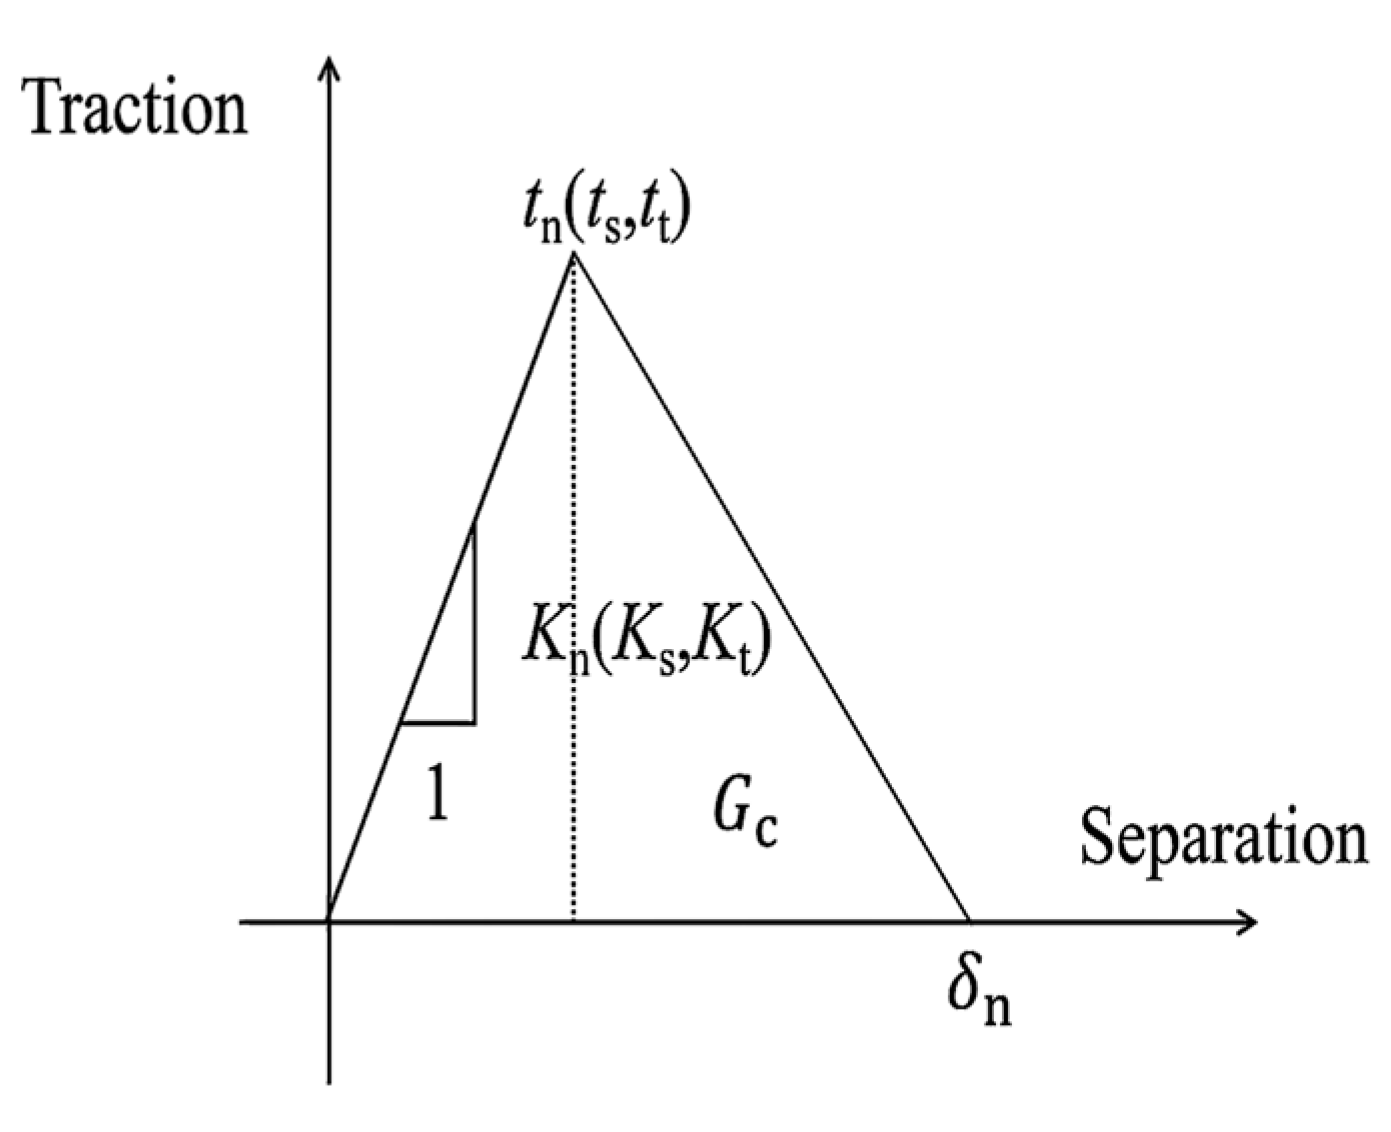
Interfacial bonding performance is a critical factor influencing the overall performance of U+SNC beams. Previous studies have confirmed the superior bonding characteristics of U+SNC [52,53,54], reinforcing the feasibility of strengthening concrete structures with UHPC. ABAQUS currently offers three primary approaches to simulate the interface between UHPC and concrete: The first approach employs a direct constraint method to bind the two materials, which offers advantages such as easy model convergence and reduced computation time [55]. The second approach accounts for the interaction between interfaces by assigning a friction coefficient, requiring constant adjustment of the penalty coefficient to align the experimental and simulation results, thus limiting the universality of the outcomes. The third approach considers the interface properties in combination with a cohesive model [56]. This method imports the cohesive unit’s experimentally derived traction–separation relationship (as shown in Figure 5) into the software, enhancing the simulation accuracy, albeit with a slightly longer running time. In order to obtain more realistic simulation results, the third method was used in this study. The traction–separation properties for U+SNC are detailed in Table 5 [57].

Figure 5.
Traction–separation curve of U+SNC.
Table 5.
Interface performance parameters of U+SNC [49].
In Table 5, are the normal and tangential stiffness components associated with normal and shear separation through the interface prior to the onset of damage. The contact stresses () at the interface are normal stress and two other shear stresses corresponding to the deformation perpendicular to the interface, parallel to the first and second shear directions, respectively. The contact stress () has the same assumed value and is equal to the direct tensile strength obtained from the direct tensile test. is the total plastic displacement.
3.3. XFEM Model
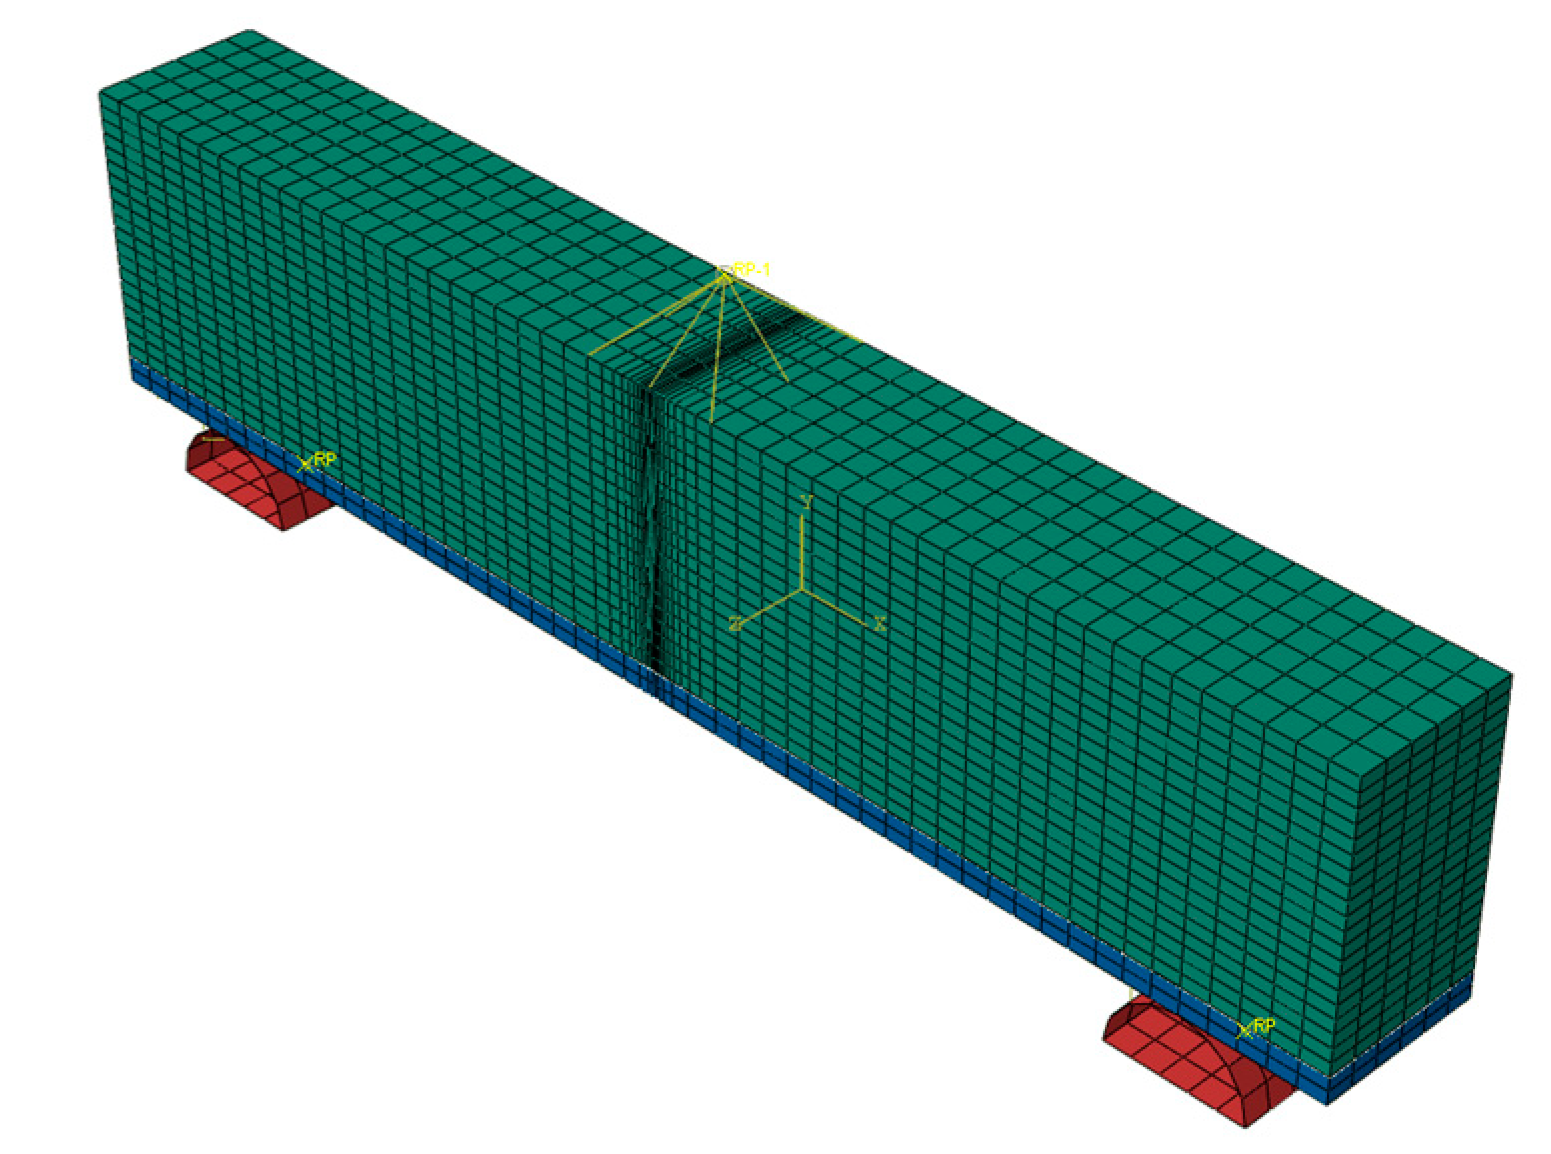
A simulation analysis of U+SNC was conducted using ABAQUS software, employing C3D8R solid elements for the SNC and UHPC layers and fiber using a truss unit. Local mesh refinement was applied in the crack extension region to enhance the accuracy of the calculated crack mouth opening displacement (CMOD) [58,59]. During modeling, a coupled displacement load (F) was applied to the U+SNC beam to prevent excessive artificial constraints and ensure model convergence. The specific XFEM model is illustrated in Figure 6, where the green sections represent the SNC, the blue sections represent the UHPC layer, and the red sections represent the beam’s mat.

Figure 6.
XFEM model of U+SNC beam with 0.4 a/h.
3.4. Workflows
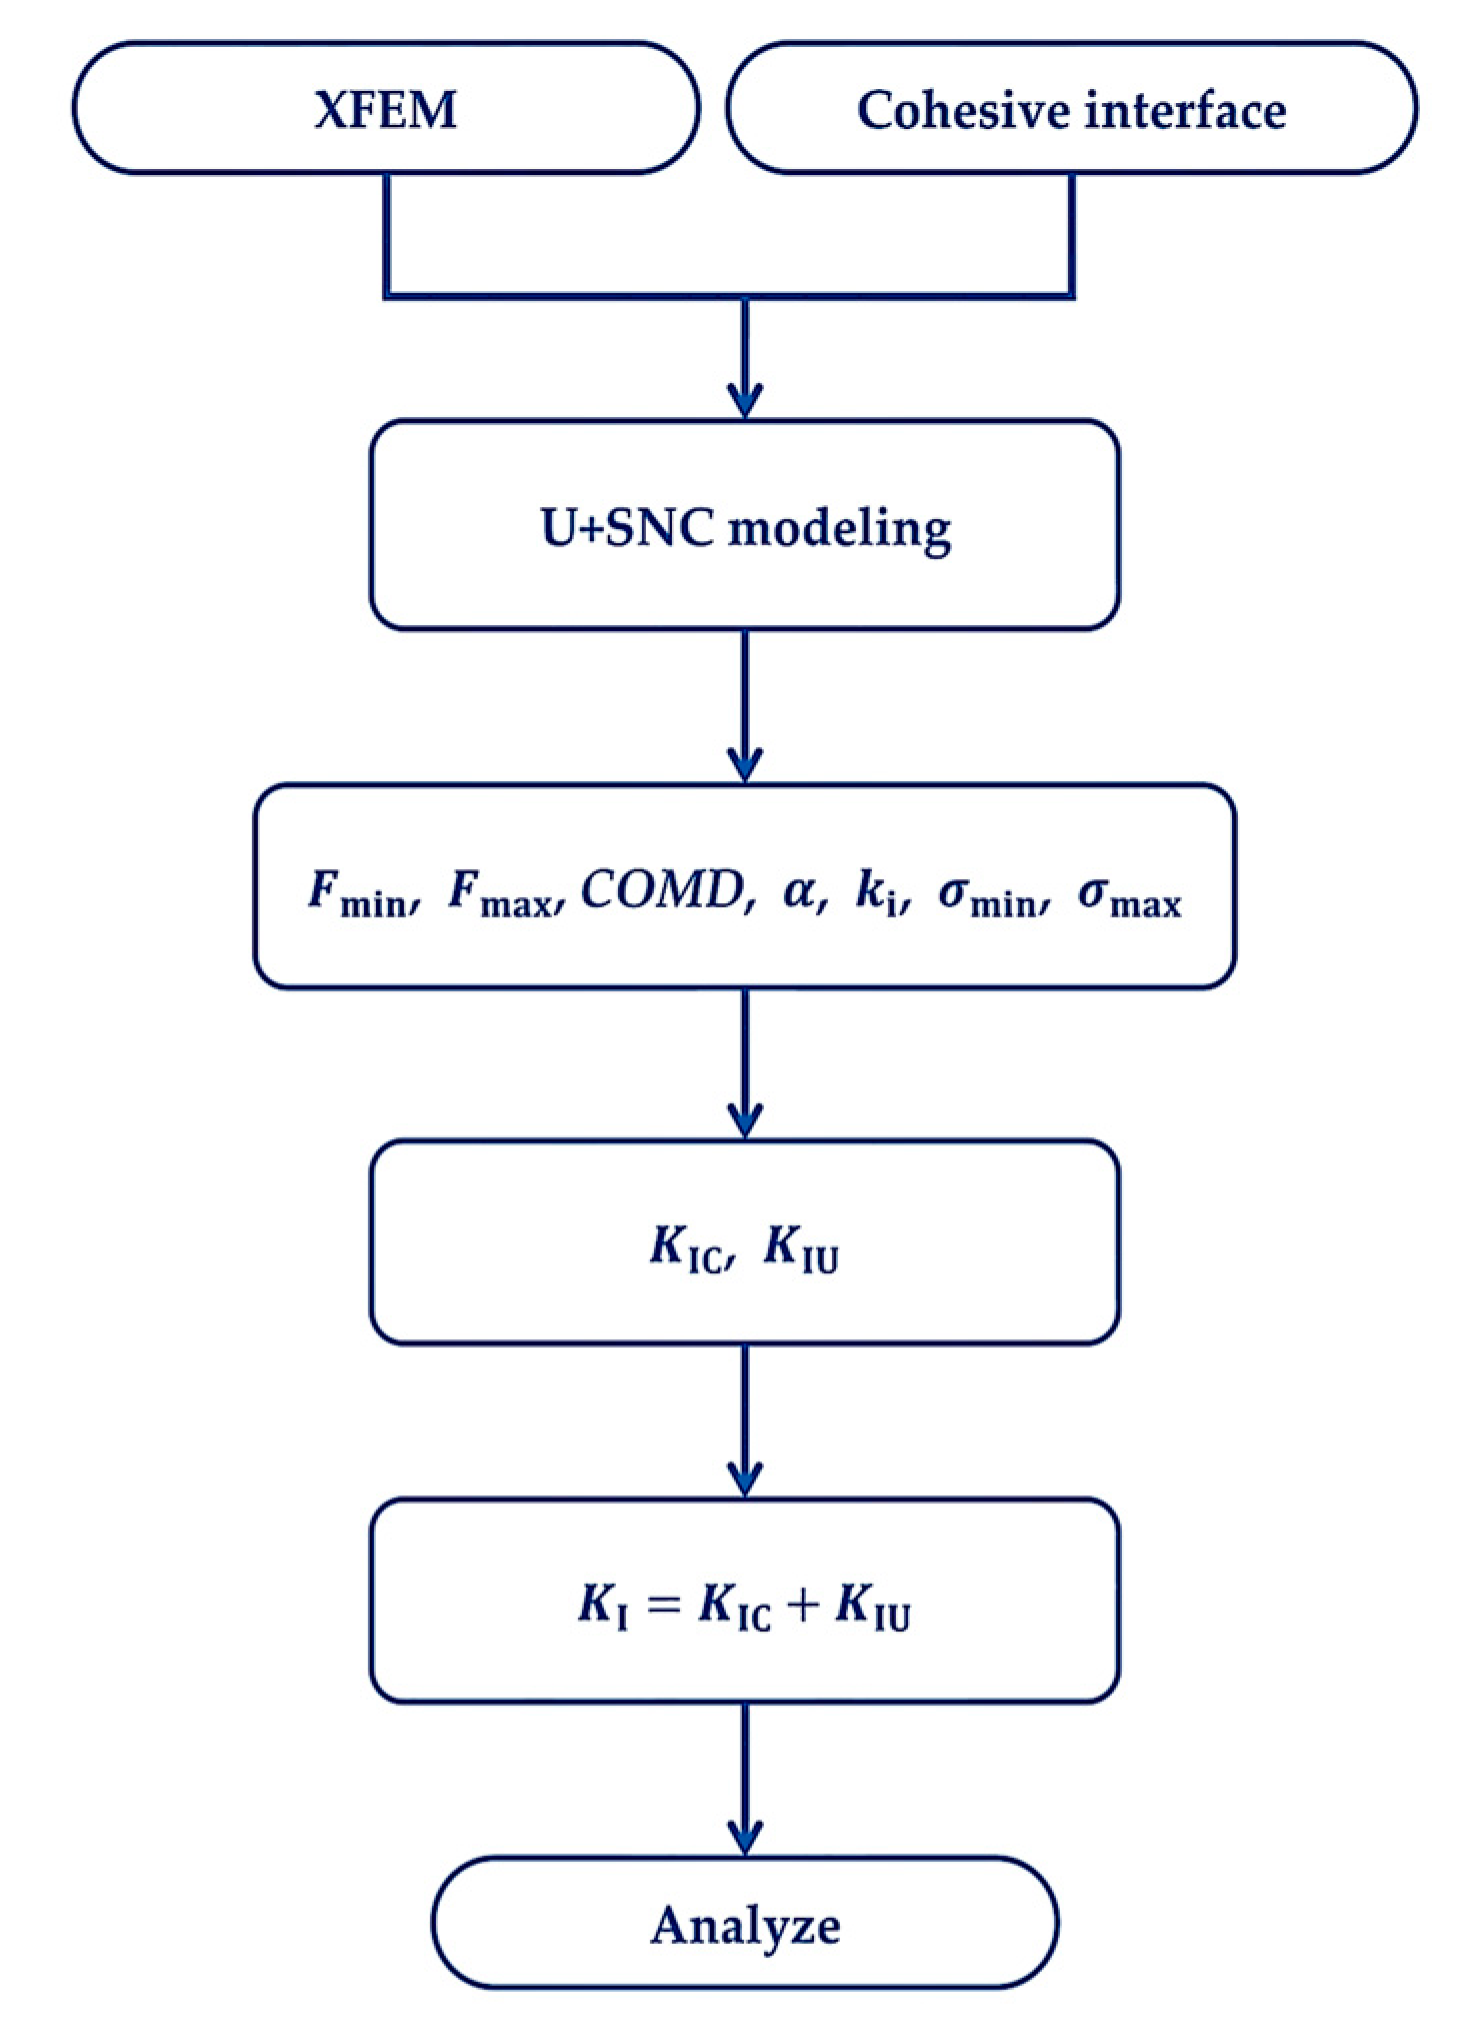
We first established a U+SNC model based on the XFEM method, using cohesive elements to represent the interface bonding–slip relationship between the UHPC layer and the NC. The fracture toughness parameters obtained from the simulation were then incorporated into the double-K fracture toughness calculation formula for U+SNC, allowing for the quantification effect of the UHPC reinforcement. Furthermore, the fracture toughness of U+SNC under different variables was analyzed to explore the influence of the UHPC reinforcement layer and potential optimization strategies, the corresponding full set workflow is illustrated in Figure 7.

Figure 7.
Roadmap of U+SNC fracture toughness calculation.
4. Analysis of Results
4.1. Crack Extension Process
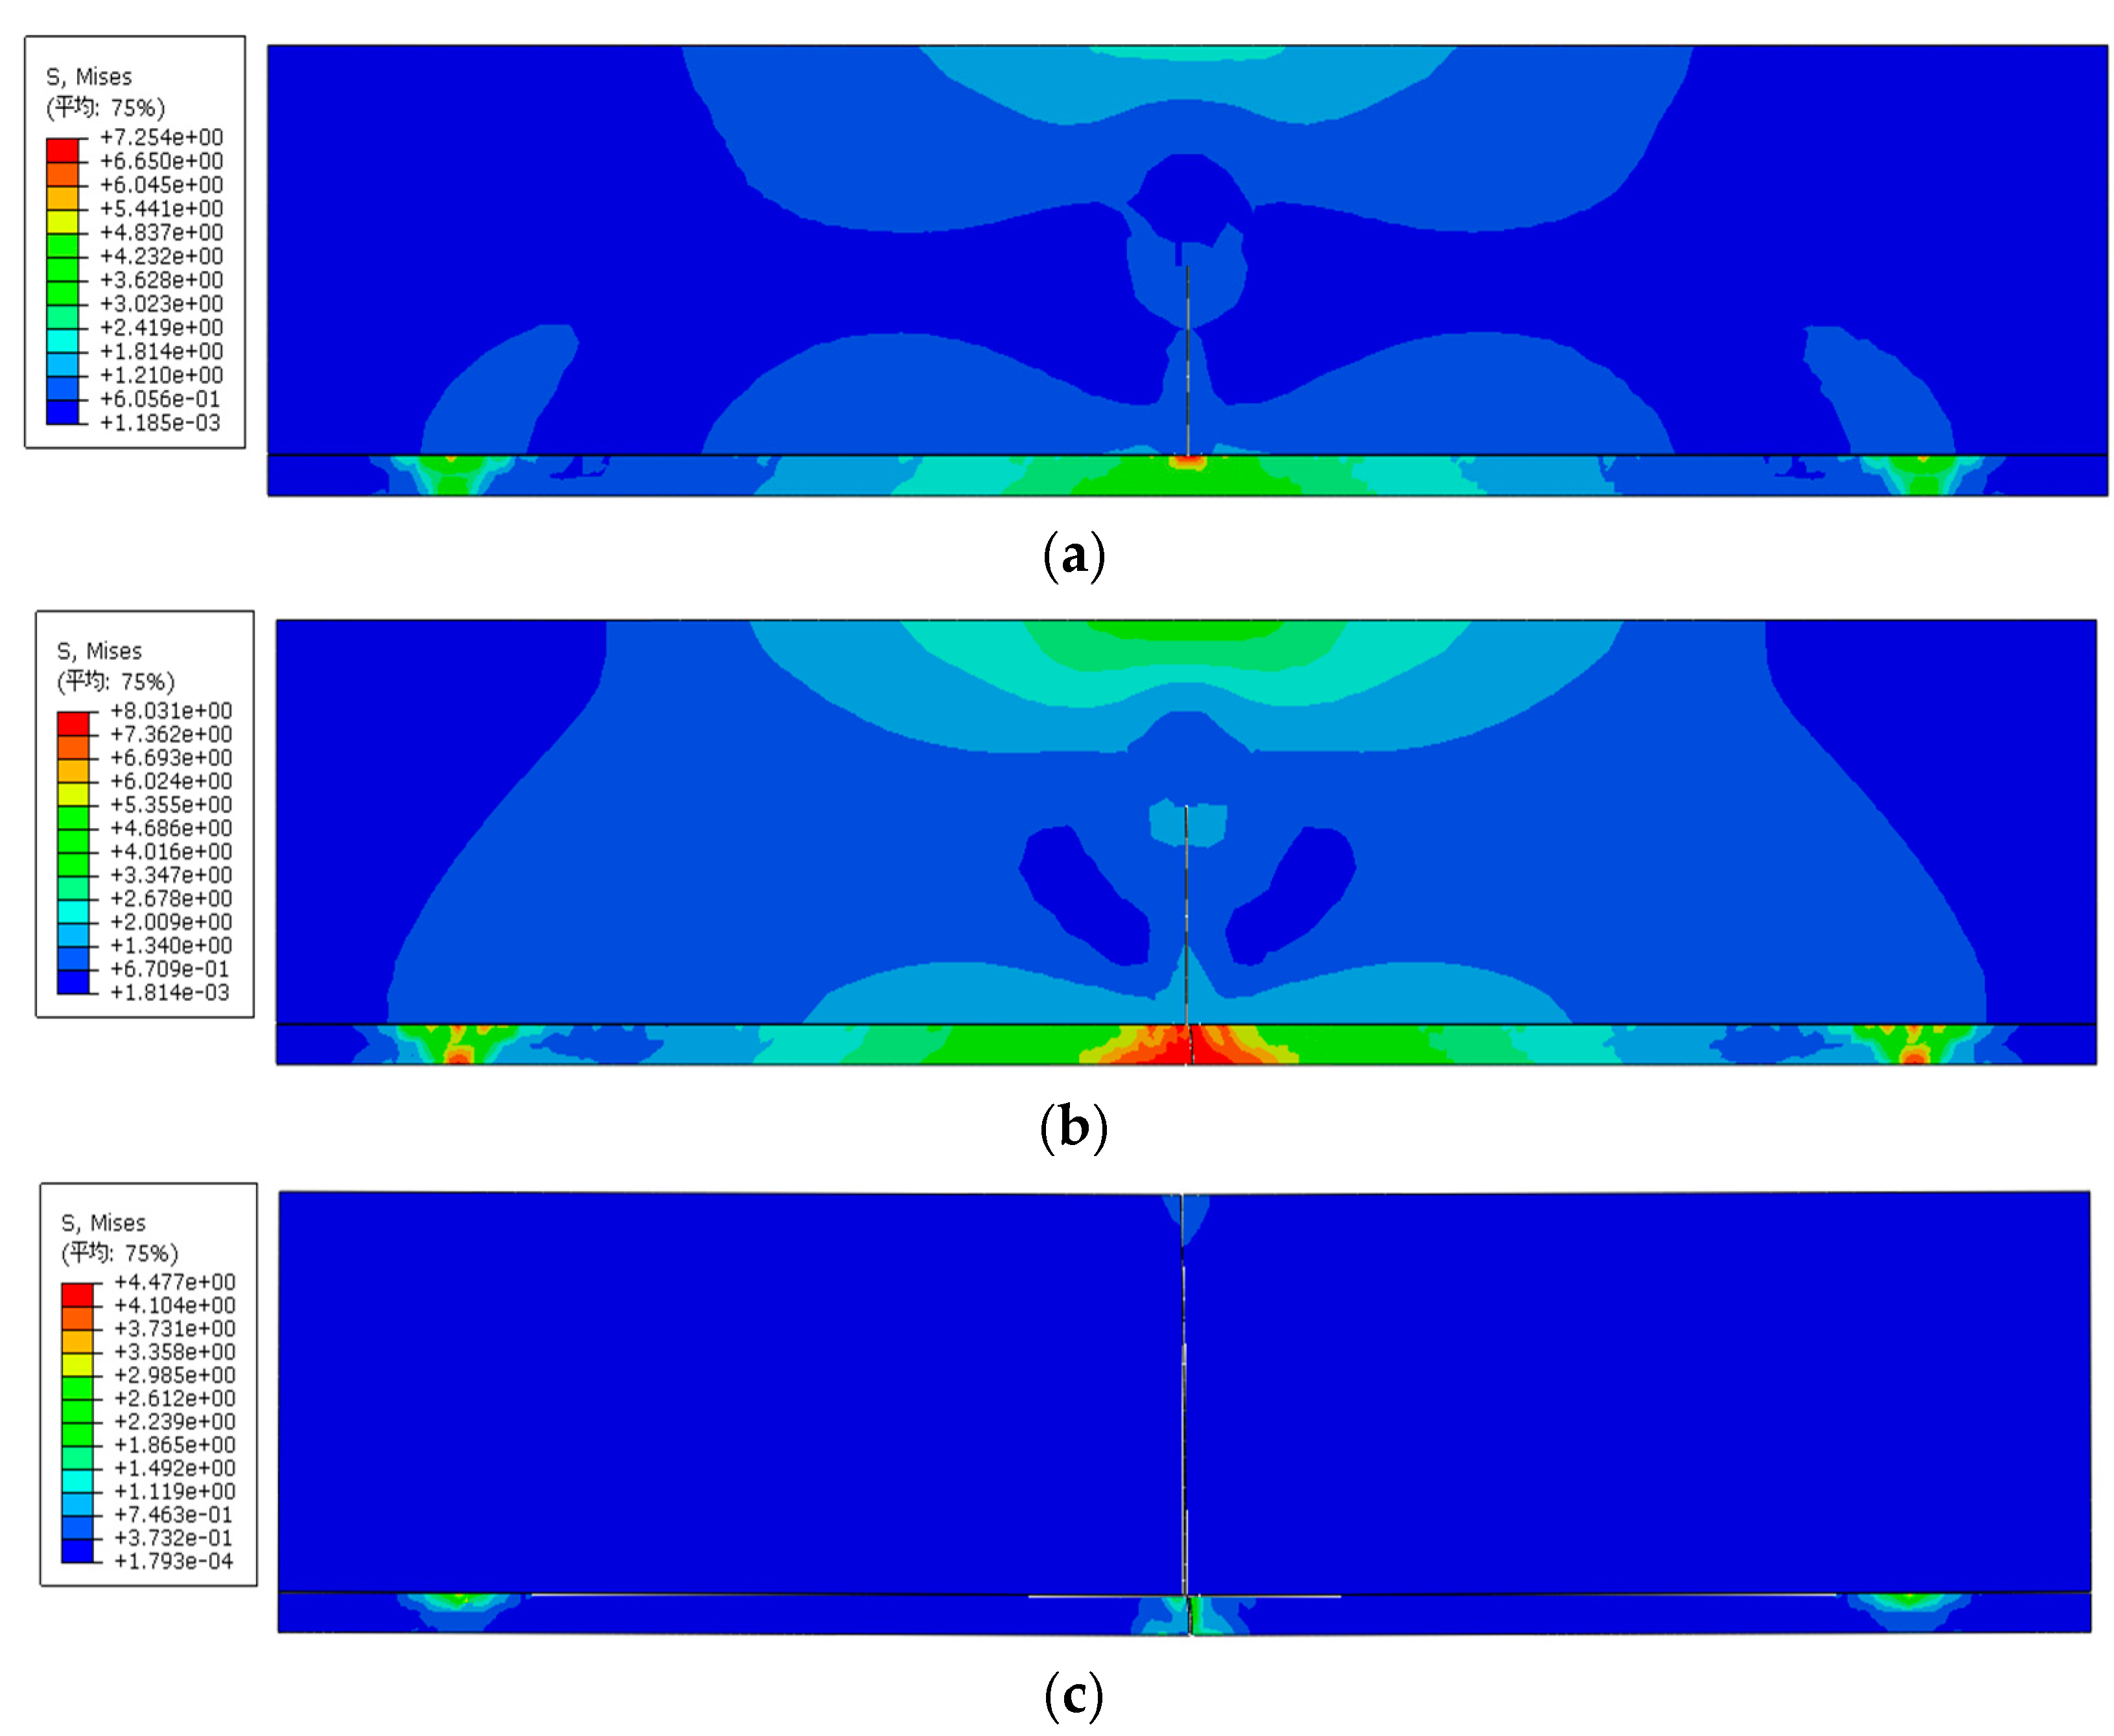
The crack development of U+SNC beams can be divided into several stages [34,60]. Initially, the tensile stress of the UHPC grows faster than that of concrete. After gradually increasing the load, cracks develop when the stress of the UHPC reaches the tensile strength (Figure 8a). As the UHPC cracks, some stresses are released instantaneously, causing a brief decrease in the specimen’s bearing capacity. However, it recovers quickly, resulting in a rapid increase in the internal tensile stresses in the concrete. Suppose that both the load and the UHPC at the crack’s mouth produce a stress intensity factor. In that case, the superposition of the net stress intensity factor reaches the fracture toughness of U+SNC, and the initial crack mouth of the concrete starts to crack (Figure 8b). If cracking occurs in the concrete, the crack will develop under the combined effect of the load, UHPC closure effect, and cohesion of the concrete crack surface, and it will enter the stable development stage. When the net stress intensity factor formed by mixing the load at the crack mouth with the stress intensity factor formed by the UHPC reaches the concrete instability fracture toughness, the crack will enter the unstable development stage, and the concrete will gradually lose its working condition. Once the SNC stops working, the cracks will stop developing, and the UHPC layer will fully bear the load. If the fibers in the UHPC cannot generate sufficient bridging stresses, the UHPC cracks will gradually develop and cause the U+SNC beam to completely rupture (Figure 8c).

Figure 8.
Three-stage stress nephograms of U+SNC beam with 20 mm d and 0.4 a/h: (a) U+SNC begins to crack; (b) UHPC layer completely ruptures; (c) U+SNC completely ruptures.
4.2. Effect of UHPC Layer Thickness on Fracture Performance of U+SNC Beams
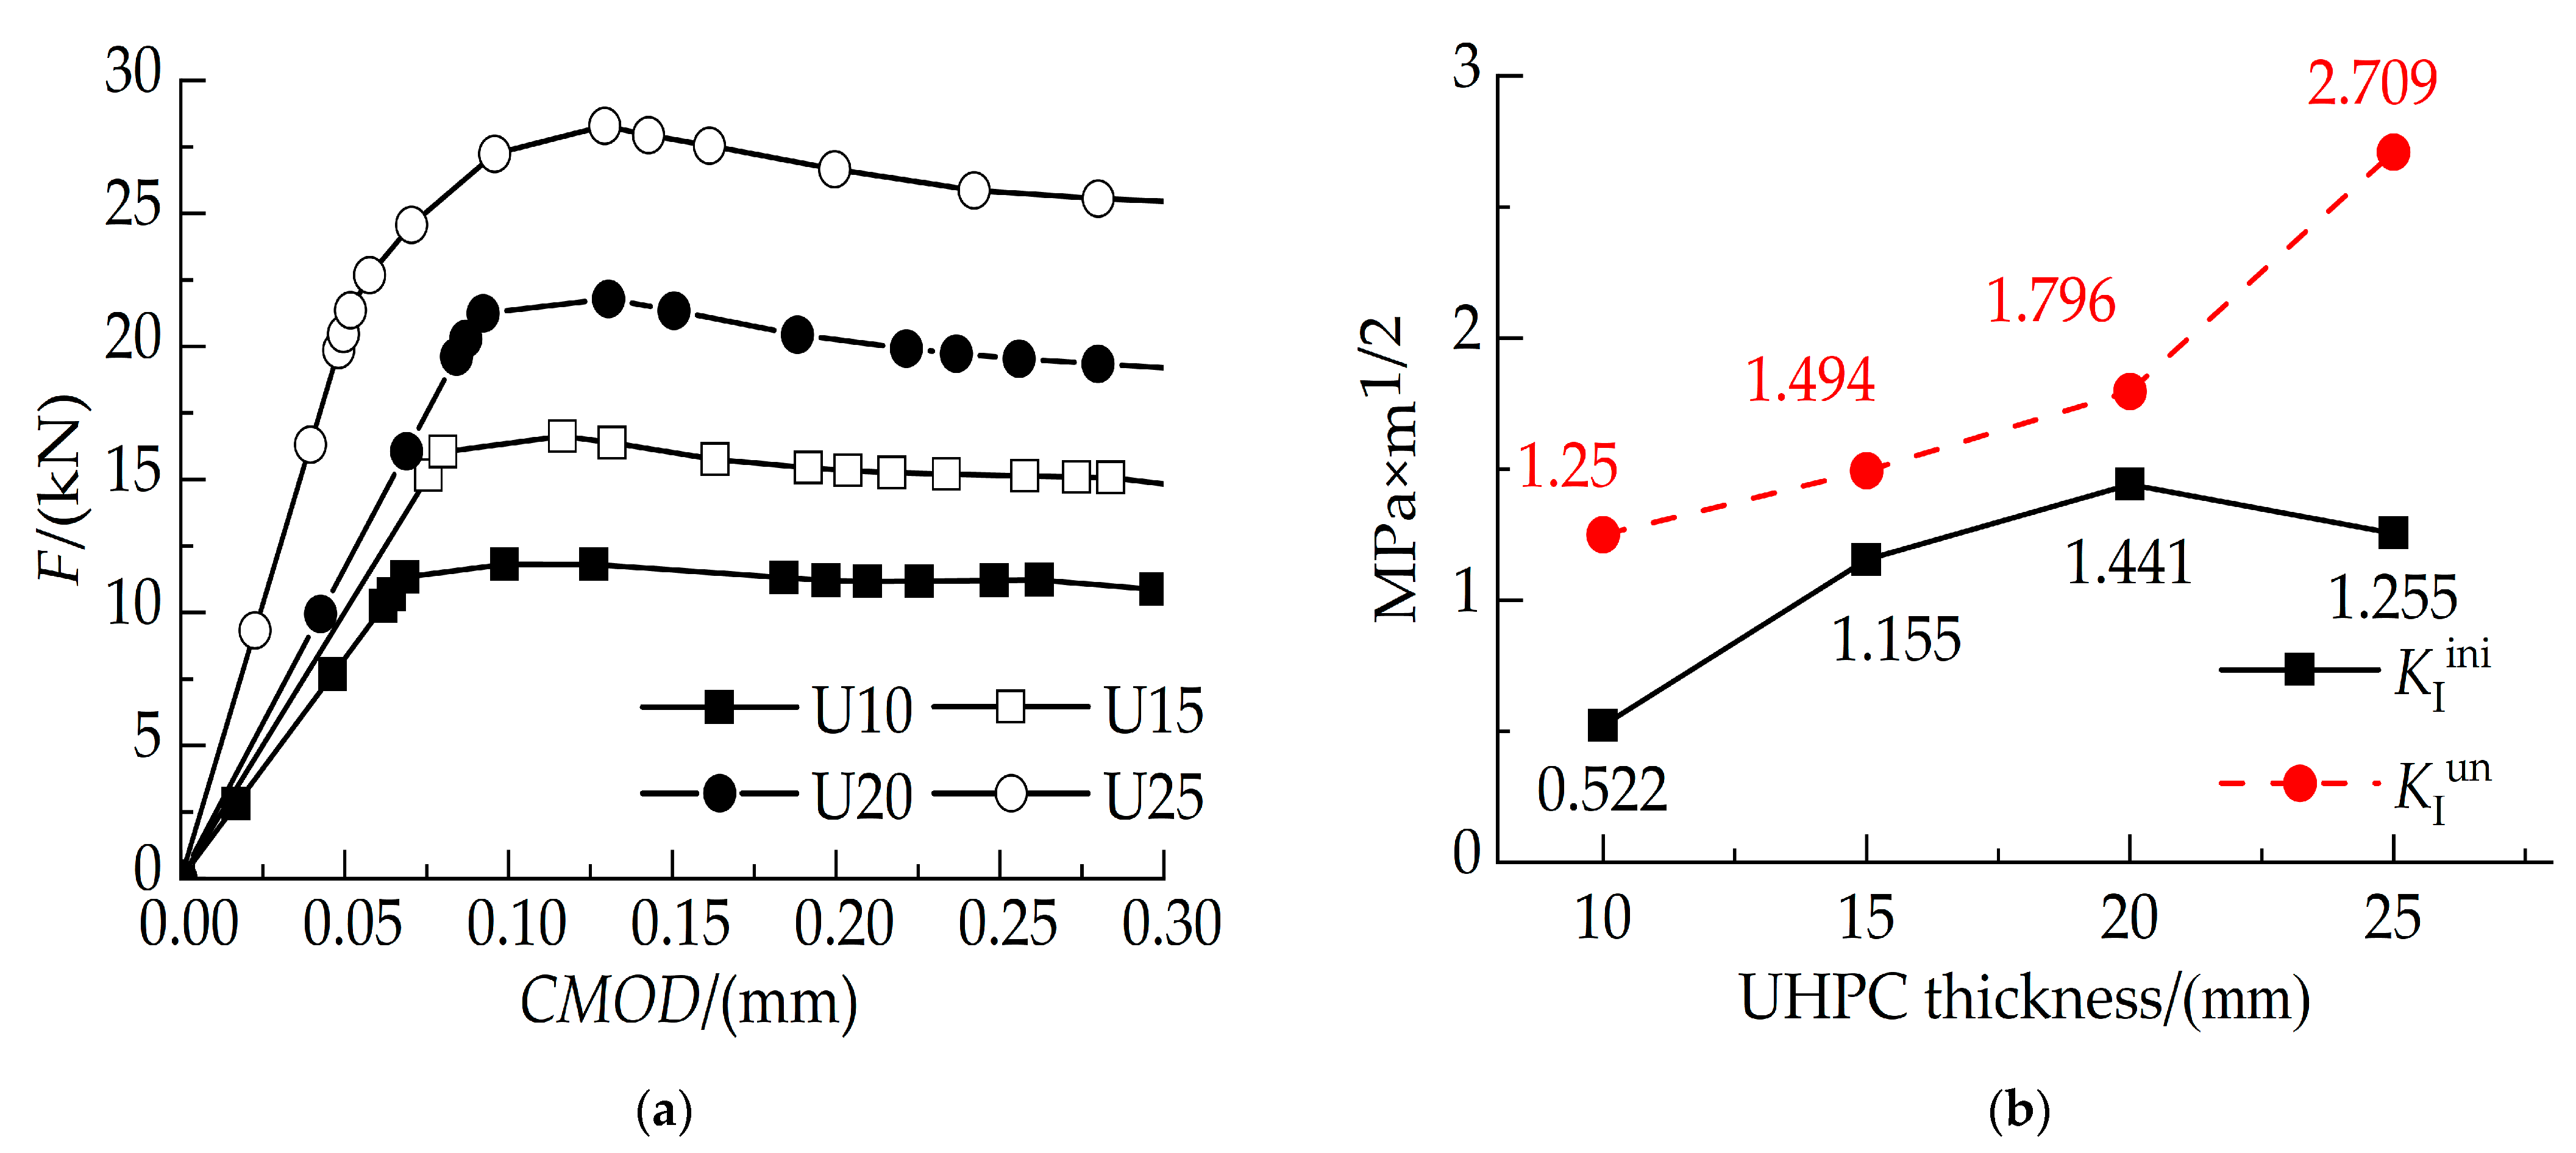
When utilizing UHPC in reinforcement projects, d is one of the critical parameters to be considered [61,62]. On the one hand, increasing d can increase the strength and bearing capacity of the U+SNC beam. On the other hand, an excessively high d will increase the self-weight of the beams and affect the reinforcement effect and costs. The F-CMOD curves of the U+SNC beams with different ds are shown in Figure 8. The F-CMOD curves and fracture toughness of the U+SNC beams with varied ds are shown in panel (a). Clearly, the cracking load and peak load of the reinforced beam increase gradually with the increase in d, which also means that the effect of d on the flexural performance of U+SNC is positive. The calculated results of the fracture toughness of U+SNC with the variation in d are shown in Table 6. With an increasing d, the ratio of the initiation load to the peak load first increases and then decreases, reaching a peak value at a thickness of 25 mm.
Table 6.
Fracture toughness parameters of U+SNC beams with different ds.
Figure 9b illustrates the variation in the fracture toughness of U+SNC with different d. As the d increases from 10 mm to 20 mm, both the crack initiation toughness and instability toughness of U+SNC rise significantly, consistent with the findings in Ref. [40]. However, when the d increases to 25 mm, the initiation toughness of the U+SNC beams decreases, indicating a weakening of the reinforcing effect of UHPC on the beams, while the destabilizing toughness increases dramatically. This phenomenon can be attributed to two factors. First, the FEM software of Abaqus 2021 might not account for the secondary effect of the UHPC layer on U+SNC during the subsequent cracking analysis [63]. Second, slight deviations in the ultimate tensile strength of the UHPC layer could cause maximum stresses to increase as d increases during testing [64,65]. Considering the overall performance improvement and economic benefits, the engineering application value with 20 mm d is the highest.

Figure 9.
F-CMOD curves and fracture toughness of U+SNC beams with different ds and 0.4 a/h: (a) F-CMOD curves; (b) fracture toughness.
4.3. Effect of Crack Height Ratio on Fracture Toughness of Reinforced Beams
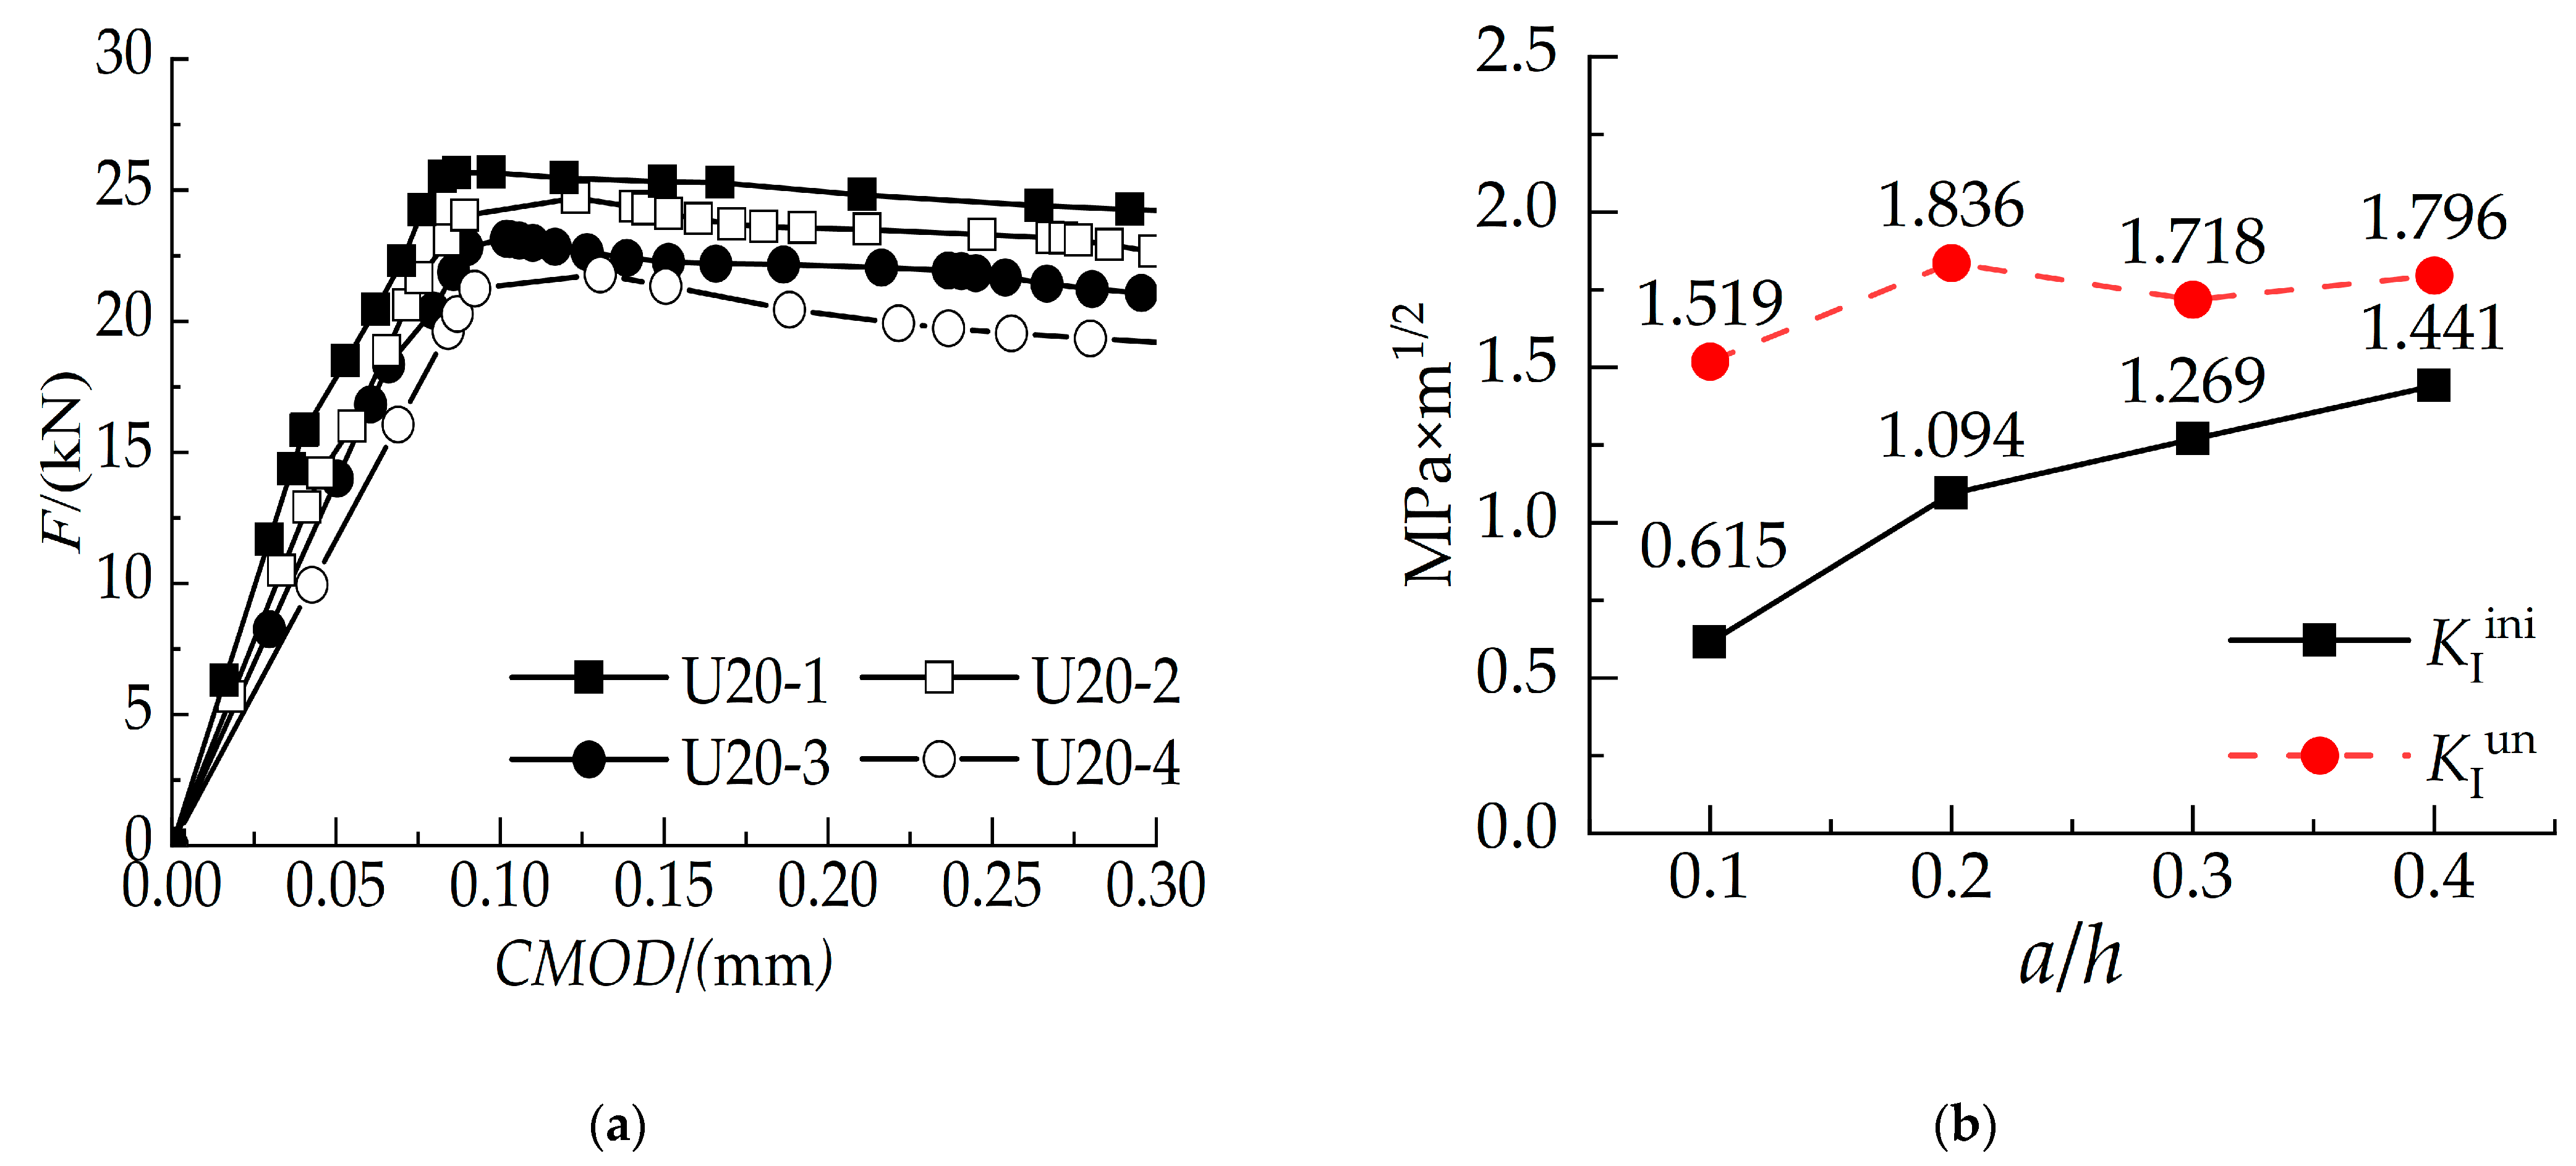
The a/h ratio is another vital parameter in reinforcement design, representing the depth of the damaged concrete cracks relative to the height of the beam [66]. As a/h increases, the fracture mode of the beam shifts from shear damage to bending damage, reducing the beam’s maximum load and load-bearing capacity. Thus, the effect of a/h must be considered in reinforcement design. Figure 10 and Table 7 show the F-CMOD curves and fracture toughness calculation results of reinforced beams with different a/h ratios, where U20-1, U20-2, U20-3, and U20-4 represent U+SNC with a 20 mm thickness and an a/h of 0.1, 0.2, 0.3, and 0.4, respectively. The table shows that the difference between reinforced and unreinforced beams becomes negligible as a/h increases. Figure 10a indicates that the crack initiation and peak loads of U+SNC do not change significantly with the increase in a/h. Compared to an a/h of 0.4, the crack initiation load increases by 18.4%, and the instability load increases by 17.8% at an a/h of 0.1. Moreover, Figure 10b shows that the crack initiation and destabilization toughness of U+SNC generally increase, indicating that the crack size affects the strengthening effect of the UHPC—the higher the a/h, the more pronounced the strengthening effect. However, as shown in Table 7, the crack initiation and destabilization loads of the reinforced beams are approximately double those of the unreinforced beams, directly proving that the thin UHPC layer significantly enhances the flexural strength of cracked concrete beams.

Figure 10.
F-CMOD curves and fracture toughness of U+SNC with different a/h ratios and 20 mm d: (a) F-CMOD curves; (b) fracture toughness.
Table 7.
Fracture toughness parameters of U+SNC beams with different a/h ratios.
4.4. Effect of VSF on Fracture Toughness of U+SNC
Random non-interfering fibers were modeled using Python and incorporated into the UHPC reinforcement layer to observe the effect of varying VSF on the fracture properties of the U+SNC beams. SF was embedded in the UHPC in the form of built-in zones. An increase in VSF increases the fracture toughness of the U+SNC beam. The reasons for this are as follows: (1) VSF reduces the shrinkage of the UHPC, thus effectively reducing the risks of interface stripping and cracking caused by material shrinkage. (2) When subjected to a load, the bridging effect between SF can effectively inhibit the internal microcrack propagation of the UHPC, increase the residual stress after cracking, and further change the failure mode of U+SNC. (3) Random distributed SF improves the surface roughness of the UHPC and leads to a higher mechanical bite force [52,67].
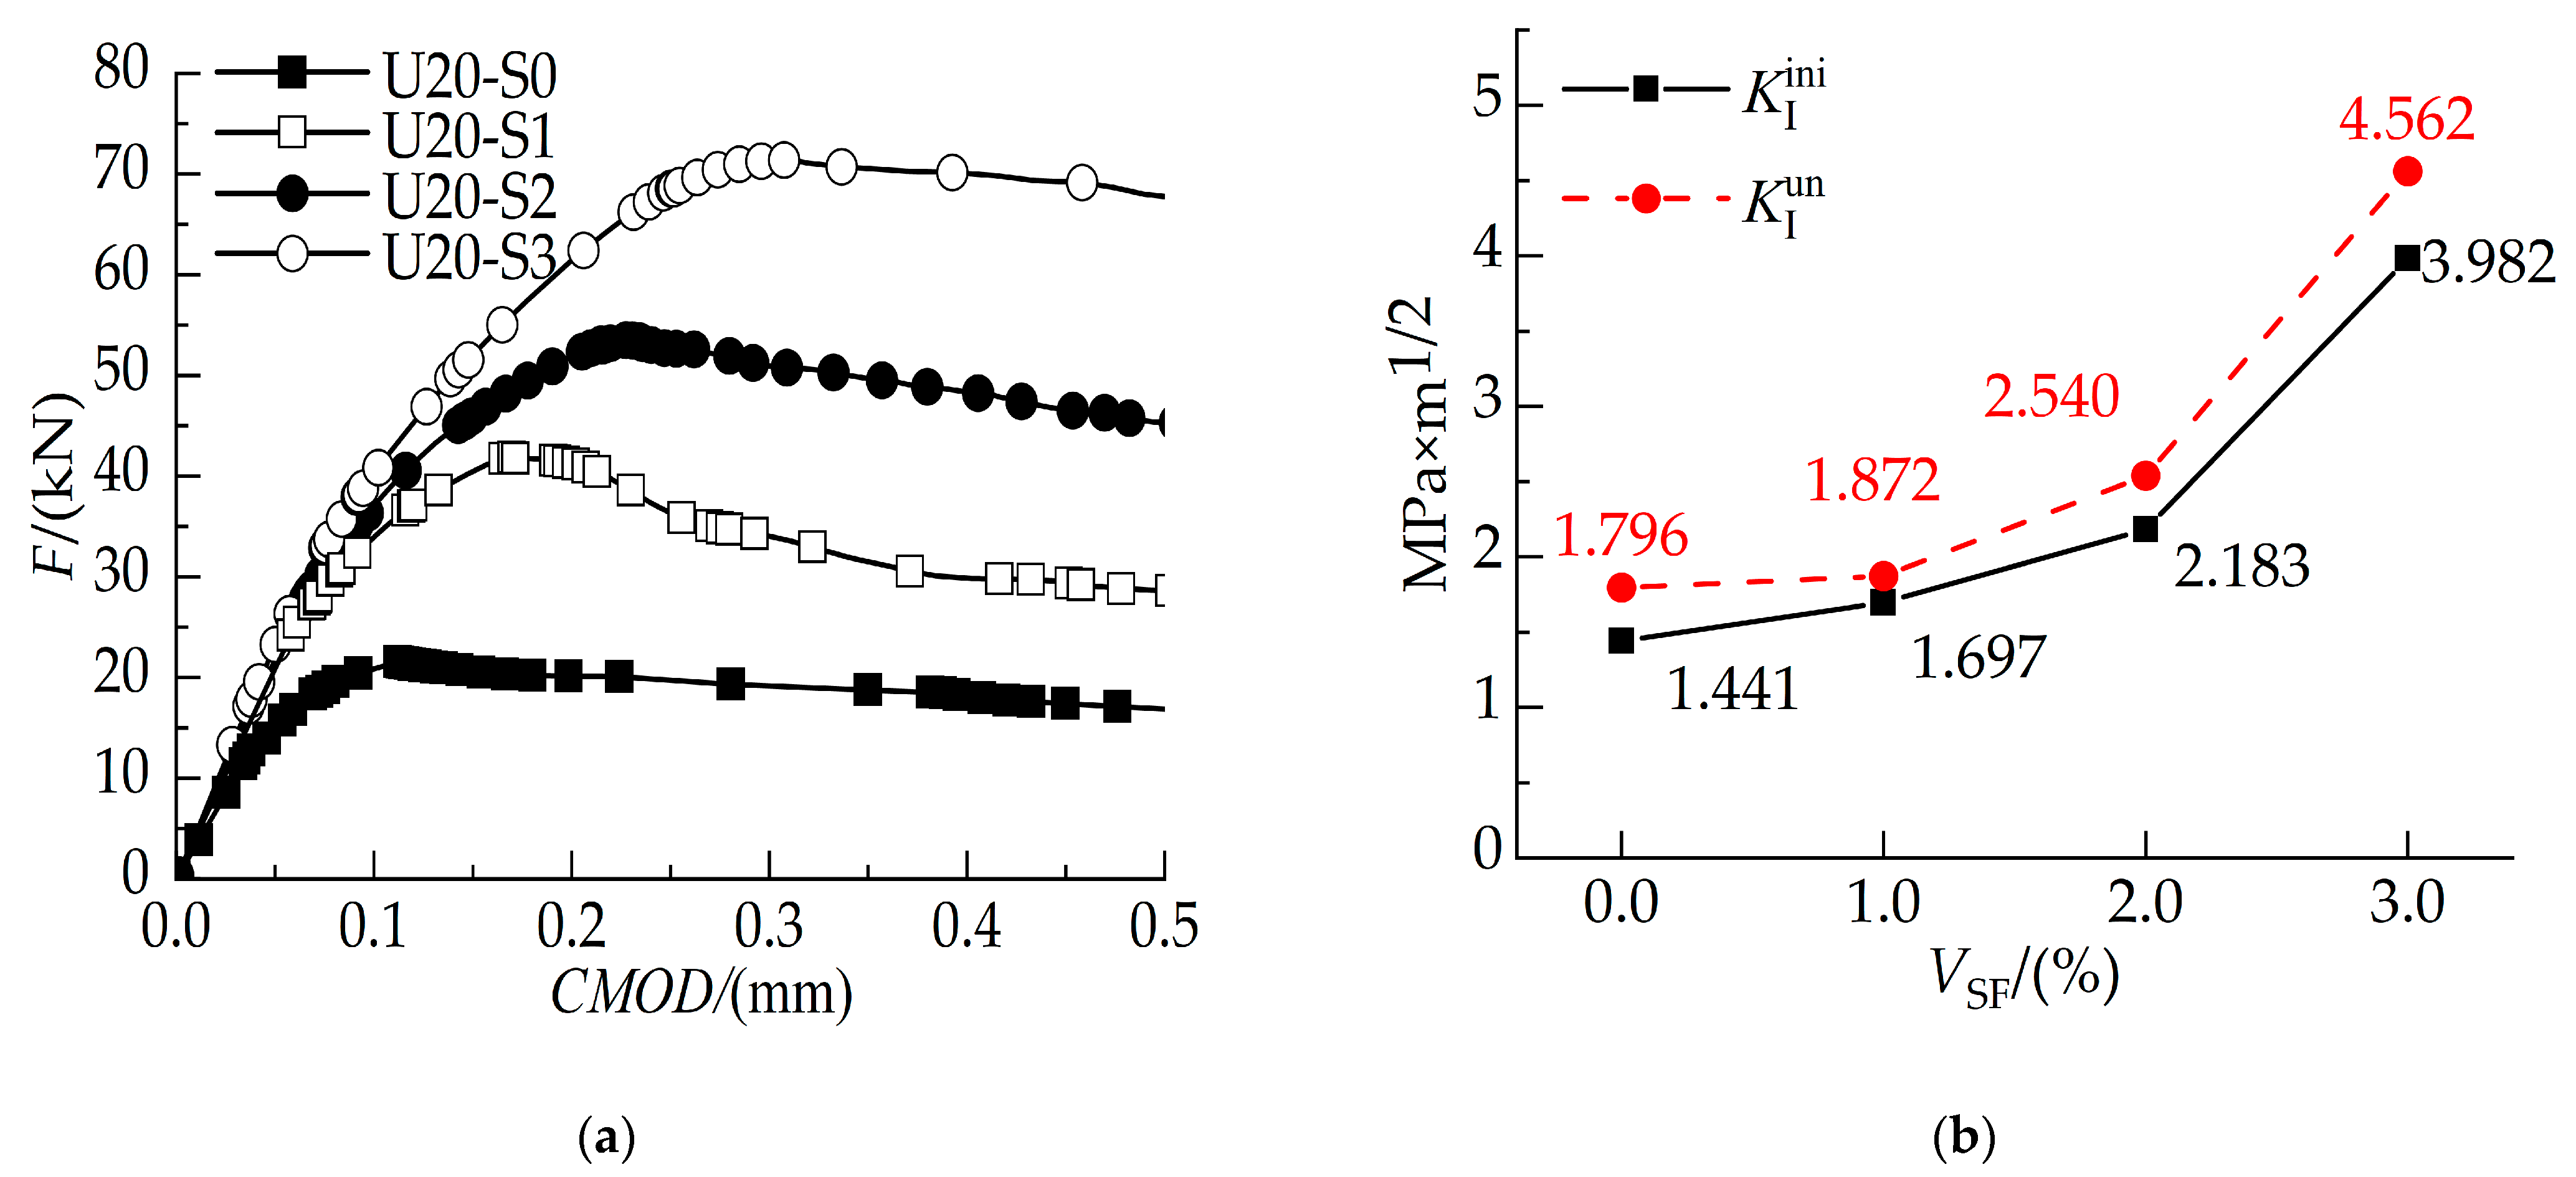
Figure 11 illustrates the F-CMOD curve and fracture toughness of U+SNC beams reinforced with VSF of 1%, 2%, and 3%. The designations U20-S0, U20-S1, U20-S2, and U20-S3 represent the fracture toughness of the U+SNC beams with a fixed spacing of 20 mm and SF contents of 0%, 1%, 2%, and 3%, respectively. As shown in Table 8, as VSF increases, the F-CMOD curve of the U+SNC during the crack growth stage becomes more gradual, indicating enhanced fracture performance. The fracture toughness results depicted in Figure 11 and summarized in Table 8 confirm that increasing VSF improves the resistance of the U+SNC beams to crack propagation, with the highest fracture toughness observed at a VSF of 3%. These findings align with those reported in Refs. [4,9,26,68], further supporting their reliability.

Figure 11.
F-CMOD curves and fracture toughness of U+SNC with different SF contents, 20 mm d, and 0.4 a/h: (a) F-CMOD curves; (b) fracture toughness.
Table 8.
Fracture toughness parameters of U+SNC with different SF contents.
5. Results and Outlook
This paper focuses on a method to calculate the fracture toughness of U+SNC, aiming to quantify the effectiveness of UHPC in reinforcing composite beams. First, the crack extension characteristics and fracture toughness parameters of U+SNC beams were obtained using the XFEM, followed by the application of the improved double-K fracture criterion to calculate the fracture toughness. This study investigated the effects of varying the d and a/h of SNC and the VSF in the UHPC on the fracture toughness of U+SNC beams, arriving to the following conclusions:
- (1)
- The XFEM method can accurately and reliably predict the crack extension trend and fracture parameters of materials;
- (2)
- The load-carrying capacity and toughness of the UHPC significantly increased with d, and the optimal d was 20 mm, allowing for the combined effects of self-weight of U+SNC and gain cost of the UHPC layer;
- (3)
- With a constant d, increasing a/h results in a modest improvement in the structural fracture performance of U+SNC;
- (4)
- As VSF increases, the U+SNC beam exhibits a smoother crack extension phase and higher toughness and flexural properties, where the best are achieved at a VSF of 3%.
Therefore, the double-K fracture toughness calculation method proposed in this paper for U+SNC beams can accurately evaluate the reinforcement effect of a UHPC layer on notched concrete beams and contribute to future research on the fracture properties of U+SNC or other composite-reinforced beams.
To minimize interference and improve the calculation accuracy, this study did not include the effect of rebars in SNC on the fracture properties of U+SNC; this issue will be addressed in future research.
Author Contributions
J.L.: conceptualization, supervision, and resources; Z.G., X.T. and J.L.: data curation, formal analysis, and methodology; J.L. and H.C.: funding acquisition, investigation, and project administration; X.T. and J.L.: validation, visualization, and writing—original draft; X.T., J.L., X.L. and Z.X.: writing—review and editing. All authors have read and agreed to the published version of the manuscript.
Funding
This research received no external funding.
Data Availability Statement
Data are available.
Acknowledgments
We are grateful for the technical support provided by Yang Liu from the Harbin Institute of Technology.
Conflicts of Interest
The authors declare no conflicts of interest. The company which is affiliated with some of the co-authors, had no role in the study design, data collection, analysis, or interpretation; manuscript writing; or decision to publish the results.
Abbreviations
| Full Name | Abbreviation |
| Ultra-high-performance concrete | UHPC |
| Finite element method | FEM |
| Crack mouth opening displacement | CMOD |
| Steel fiber | SF |
| UHPC-reinforced single-notched concrete beam | U+SNC |
| Extended finite element method | XFEM |
| Critical CMOD | CMODc |
| Crack height ratio | a/h |
References
- Dai, J.; Huang, B.; Shah, S.P. Recent advances in strain-hardening UHPC with synthetic fibers. J. Compos. Sci. 2021, 5, 283–291. [Google Scholar] [CrossRef]
- Ogaili, A.A.F.; Basem, A.; Kadhim, M.S.; Al-Sharify, Z.T.; Jaber, A.A.; Njim, E.K.; Al-Haddad, L.A.; Hamzah, M.N.; Al-Ameen, E.S. The effect of chopped carbon fibers on the mechanical properties and fracture toughness of 3d-printed PLA parts: An experimental and simulation study. J. Compos. Sci. 2024, 8, 273. [Google Scholar] [CrossRef]
- Wei, Y.; Chen, K.; Kang, J.; Chen, W.; Wang, X.; Zhang, X. Policy and management of carbon peaking and carbon neutrality: A literature review. Engineering 2022, 14, 52–63. [Google Scholar] [CrossRef]
- Al-Osta, M.A.; Isa, M.N.; Baluch, M.H.; Rahman, M.K. Flexural behavior of reinforced concrete beams strengthened with ultra-high performance fiber reinforced concrete. Constr. Build. Mater. 2017, 134, 279–296. [Google Scholar] [CrossRef]
- Gao, X.; Yin, C.; Guo, J.; Chen, G.; Huang, H. Experimental and theoretical study on the shear behaviors of an innovative precast UHPC composite beams reinforced with inverted t-shaped steel. J. Build. Eng. 2024, 96, 110504. [Google Scholar] [CrossRef]
- Hou, C.; Ma, G.; Hwang, H.; Li, S.; Kang, S. Seismic retrofit of intact and damaged RC columns using prefabricated steel cage-reinforced UHPC jackets and nsm gfrp bars. Eng. Struct. 2024, 317, 118665. [Google Scholar] [CrossRef]
- Lampropoulos, A.P.; Paschalis, S.A.; Tsioulou, O.T.; Dritsos, S.E. Strengthening of reinforced concrete beams using ultra high performance fibre reinforced concrete (UHPFRC). Eng. Struct. 2016, 106, 370–384. [Google Scholar] [CrossRef]
- Paschalis, S.A.; Lampropoulos, A.P.; Tsioulou, O. Experimental and numerical study of the performance of ultra-high performance fiber reinforced concrete for the flexural strengthening of full scale reinforced concrete members. Constr. Build. Mater. 2018, 186, 351–366. [Google Scholar] [CrossRef]
- Ramachandra Murthy, A.; Karihaloo, B.L.; Priya, D.S. Flexural behavior of RC beams retrofitted with ultra-high strength concrete. Constr. Build. Mater. 2018, 175, 815–824. [Google Scholar] [CrossRef]
- Taffese, W.Z.; Zhu, Y.; Chen, G. Ensemble-learning model based ultimate moment prediction of reinforced concrete members strengthened by UHPC. Eng. Struct. 2024, 305, 117705. [Google Scholar] [CrossRef]
- Xu, T.; Yang, J.; Wang, C.; Guo, T.; Deng, K.; Xie, T. Comparative sustainability and seismic performance analysis of reinforced conventional concrete and UHPC bridge piers. J. Clean. Prod. 2024, 467, 142959. [Google Scholar] [CrossRef]
- Ding, Y.; Zhou, Z.; Wei, Y.; Zhou, S. Experimental study and efficient shear-flexure interaction model of reinforced concrete shear walls with UHPC boundary columns. Case Stud. Constr. Mater. 2024, 20, e3059. [Google Scholar] [CrossRef]
- Hung, C.; Agrawal, S.; Hsiao, H. Rehabilitation of seismically-damaged RC beam-column joints with UHPC and high-strength steel mesh reinforcement. J. Build. Eng. 2024, 84, 108667. [Google Scholar] [CrossRef]
- Ding, Y.; Zeng, B.; Zhou, Z.; Wei, Y.; Zhu, M. Seismic retrofitting of RC columns using stainless steel grid-reinforced UHPC jackets in plastic hinge zone. J. Build. Eng. 2024, 84, 108637. [Google Scholar] [CrossRef]
- Su, Y.; Wu, C.; Shang, J.; Zhang, P.; Sheikh, S.A. Experimental and numerical simulation research on the flexural performance of beams reinforced with GFRP bars and three-sides UHPC layer. Structures 2024, 59, 105746. [Google Scholar] [CrossRef]
- Gao, X.; Wu, K.; Guo, Y.; Zhao, Y.; Guo, J. Experimental and numerical study on flexural behaviors of damaged RC beams strengthened with UHPC layer using the bonding technology of post-installed reinforcing bar. Constr. Build. Mater. 2023, 391, 131835. [Google Scholar] [CrossRef]
- Men, P.; Di, J.; Qin, F.; Huang, S.; Huang, Z.; Peng, X. Bending behaviour of reinforced concrete t-beams damaged by overheight vehicle impact strengthened with ultra-high performance concrete (UHPC). Case Stud. Constr. Mater. 2024, 21, e3393. [Google Scholar] [CrossRef]
- Al-Shawafi, A.; Zhu, H.; Bo, Z.; Haruna, S.I.; Ibrahim, Y.E.; Farouk, A.I.B.; Laqsum, S.A.; Shao, J. Bond behavior between normal concrete and UHPC and puc layers subjected to different loading conditions coupled with fracture analysis technique. J. Build. Eng. 2024, 86, 108880. [Google Scholar] [CrossRef]
- Wu, C.; Ma, G.; Hwang, H.J. Bond performance of spliced gfrp bars in pre-damaged concrete beams retrofitted with cfrp and uhpc. Eng. Struct. 2023, 292, 116523. [Google Scholar] [CrossRef]
- Safdar, M.; Matsumoto Kakuma, K. Flexural behavior of reinforced concrete beams repaired with ultra-high performance fiber reinforced concrete (UHPFRC). Compos. Struct. 2016, 157, 448–460. [Google Scholar] [CrossRef]
- Dang, Q. Study on flexural behavior of damaged deck strengthened with Ultra High Performance Concrete; Hunan Univ.: Guangxi, China, 2016. (In Chinese) [Google Scholar]
- Liu, T.; Charron, J. Determination of NSC-UHPC interface properties for numerical modeling of UHPC-strengthened concrete beams and slabs. Eng. Struct. 2023, 290, 116385. [Google Scholar] [CrossRef]
- Huang, Y.; Lee, M.; Kan, Y.; Wang, W.; Wang, Y.; Pan, W. Reinforced concrete beams retrofitted with UHPC or CFRP. Case Stud. Constr. Mater. 2022, 17, e1507. [Google Scholar] [CrossRef]
- Hung, C.C.; El-Tawil, S.; Chao, S.H. A review of developments and challenges for UHPC in structural engineering: Behavior, analysis, and design. J. Struct. Eng. 2021, 147, 03121001. [Google Scholar] [CrossRef]
- Figiela, B.; Simonova, H.; Korniejenko, K. State of the art, challenges, and emerging trends: Geopolymer composite reinforced by dispersed steel fibers. Rev. Adv. Mater. Sci. 2022, 61, 1–15. [Google Scholar] [CrossRef]
- Zhu, Y.; Zhang, Y.; Hussein, H.H.; Chen, G.D. Flexural strengthening of reinforced concrete beams or slabs using ultra-high performance concrete (UHPC): A state of the art review. Eng. Struct. 2020, 205, 110035. [Google Scholar] [CrossRef]
- Wei, J.; Li, J.; Wu, C.; Hao, H.; Liu, J. Experimental and numerical study on the impact resistance of ultra-high performance concrete strengthened RC beams. Eng. Struct. 2023, 277, 115474. [Google Scholar] [CrossRef]
- Mukhtar, F.; El-Tohfa, A. A review on fracture propagation in concrete: Models, methods, and benchmark tests. Eng. Fract. Mech. 2023, 281, 109100. [Google Scholar] [CrossRef]
- Tao, X.J.; Luo, J.L.; Zhang, J.G.; Zhu, M.; Zhang, L.Q.; Gao, Y.B. Progress in FEM modeling on mechanical and electromechanical properties of carbon nanotube cement-based composites. Nanotechn. Rev. 2023, 12, 20220522. [Google Scholar]
- Kuang, Y.; Wang, Y.; Xiang, P.; Tao, L.; Wang, K.; Fan, F.; Yang, J. Experimental and theoretical study on the fatigue crack propagation in stud shear connectors. Materials 2023, 16, 701. [Google Scholar] [CrossRef]
- Tawfik, A.B.; Mahfouz, S.Y.; Taher, S.E.D.F. Nonlinear ABAQUS simulations for notched concrete Beams. Materials 2021, 14, 7349. [Google Scholar] [CrossRef]
- Li, Y.C. Crack Propagation Analysis of Concrete Members Based on Extended Finite Element Method. Master’s Thesis, Guangxi University of Science and Technology, Guangxi, China, 2018. (In Chinese). [Google Scholar]
- Zhou, J.; Xia, G.; Wang, P.; Zhao, J.; Xu, L.; Pan, J. Investigation of flexural cracks in engineered cementitious composites beams reinforced with CFRP bars. Constr. Build. Mater. 2024, 438, 136900. [Google Scholar] [CrossRef]
- He, S.; Mustafa, S.; Chang, Z.; Liang, M.; Schlangen, E.; Luković, M. Ultra-thin Strain Hardening Cementitious Composite (SHCC) layer in reinforced concrete cover zone for crack width control. Eng. Struct. 2023, 292, 116584. [Google Scholar] [CrossRef]
- Yin, X.; Li, Q.; Wang, Q.; Reinhardt, H.; Xu, S. The double-K fracture model: A state-of-the-art review. Eng. Fract. Mech. 2023, 277, 108988. [Google Scholar] [CrossRef]
- Gao, X.; Ji, M.; Li, Q.; Zhou, M.; Yang, C.; Liu, Z. Prediction of fracture failure and fracture parameters for dam gallery concrete specimens of arbitrary size and age via boundary effect model and fracture extreme theory. Theor. Appl. Fract. Mech. 2024, 131, 104376. [Google Scholar] [CrossRef]
- Xie, H.; Yang, L.; Li, J.; Chen, Z.; Zhang, F.; Liu, Y.; Sui, Z.; Zhang, Q. Research on mode-I fracture characteristics of basalt fiber reactive powder concrete. J. Build. Eng. 2023, 80, 108159. [Google Scholar] [CrossRef]
- DL/T5332-2005; Norm for Fracture Test of Hydraulic Concrete. Hohai University, China Power Industry Standards: Beijing, China, 2005. (In Chinese)
- Lei, Z.P. Numerical Study on Cracking Behavior of Concrete Beams Based on Extended Finite Element Method. Master’s Thesis, South China University of Technology, Guangzhou, China, 2017. (In Chinese). [Google Scholar]
- Zhu, Y.; Xu, S.L. Study on fracture process of concrete three-point bending beams retrofitted with UHTCC. Eng. Mech. 2011, 28, 69–77. [Google Scholar]
- Wu, M.Y.; Zhang, D.M.; Li, M.H. An ABAQUS crack extension data extraction method, system and computer-readable storage medium. CN201910688214.5, 2 May 2023. (In Chinese). [Google Scholar]
- Liu, X.Q.; Xie, J.J.; Wu, X. An internal crack extension modeling method for finite element analysis of structures. CN201910017825.7, 5 July 2022. (In Chinese). [Google Scholar]
- Feng, W.; Xu, F.; You, H.; Li, M.L. Adhesive damage and defect analysis of scarf-repaired composite by combining extended finite element method and cohesive zone model. Acta Mater. Compos. Sin. 2018, 35, 1354–1360. [Google Scholar]
- Zaim, O.; Sugiman, S.; Hazrina, M.; Hilton, A. Utilizing XFEM model to predict the flexural strength of woven fabric Kenaf FRP plate strengthened on plain concrete beam. Case Stud. Constr. Mater. 2023, 18, e2056. [Google Scholar]
- El-Tohfa, A.; Mukhtar, F. Fracture and size effect analysis in concrete using 3-D G/XFEM and a CZM-LEFM correlation model: Validation with experiments. Comp. Struct. 2023, 282, 107043. [Google Scholar] [CrossRef]
- Jin, H.; Yu, S. Study on corrosion-induced cracks for the concrete with transverse cracks using an improved CDM-XFEM. Constr. Build. Mater. 2022, 318, 126173. [Google Scholar] [CrossRef]
- Carmona, J.R.; Ruiz, G.; Del Viso, J.R. Mixed-mode crack propagation through reinforced concrete. Eng. Fract. Mech. 2007, 74, 2788–2809. [Google Scholar] [CrossRef]
- Hu, S.W.; Mi, Z.X. Numerical simulation of concrete crack propagation process on extended finite element method. J. Hydraul. Eng. 2014, 45, 51–56. [Google Scholar]
- Zhu, Y.; Zhang, Y.; Hussein, H.H.; Chen, G.D. Numerical modeling for damaged reinforced concrete slab strengthened by ultra-high performance concrete (UHPC) layer. Eng. Struct. 2020, 209, 110031. [Google Scholar] [CrossRef]
- Zhang, Z.; Shao, X.D.; Li, W.G.; Zhu, P.; Chen, H. Axial Tensile Behavior Test of Ultra High Performance Concrete. China J. Highway Transp. 2015, 28, 50–58. (In Chinese) [Google Scholar]
- Yang, J. Flexural Behavior of Ultra-High Performance Concrete Beams Prestressed with CFRP Tendons. Ph.D. Thesis, Hunan University, Hunan, China, 2007. (In Chinese). [Google Scholar]
- Zhou, J.T.; Zhou, L.; Yang, J.; Wang, Z.S. Summarization on bonding behaviors of ultra-high performance concrete and normal concrete. J. Jiangsu Uni. (Nat. Sci. Ed.) 2020, 41, 373–381. (In Chinese) [Google Scholar]
- Yang, Y.; Xu, C.; Yang, J.; Wang, K. Experimental study on flexural behavior of precast hybrid UHPC-NSC beams. J. Build. Eng. 2023, 70, 106354. [Google Scholar] [CrossRef]
- Feng, S.; Shi, X.B.; Wang, W.; Xu, F.; Xiao, H.G. Research on evaluation method of UHPC-NSC bond strength. J. Build. Mater. 2023, 26, 1220–1228. [Google Scholar]
- Gao, S.L.; Guo, Y.D.; Wu, Y.Q.; Qiu, H.F. Experimental study and simulation analysis on the flexural capacity of high strength reinforced concrete/ECC composite beams. Build. Sci. 2017, 33, 44–51. (In Chinese) [Google Scholar]
- Guo, W.Q.; Wei, Y.; Ma, L.; Liu, Y.L.; Guo, R.X. Effect of grouped L-shape rebar connectors on the shrinkage behavior of UHPC overlay cast on hardened NSC substrate. Constr. Build. Mater. 2023, 382, 131319. [Google Scholar] [CrossRef]
- Hussein, H.H.; Walsh, K.K.; Sargand, S.M.; Al, R.F.T.; Steinberg, E.P. Modeling the shear connection in adjacent box-beam bridges with ultrahigh-performance concrete joints. i: Model calibration and validation. J. Bridg. Eng. 2017, 22, 4017043. [Google Scholar] [CrossRef]
- Greco, F.; Barendrecht, P.; Coox, L.; Atak, O.; Desmet, W. Finite element analysis enhanced with subdivision surface boundary representations. Finite Elem. Anal. Des. 2017, 137, 56–72. [Google Scholar] [CrossRef]
- Gibert, G.; Prabel, B.; Gravouil, A.; Jacquemoud, C. A 3D automatic mesh refinement X-FEM approach for fatigue crack propagation. Finite Elem. Anal. Des. 2019, 157, 21–37. [Google Scholar] [CrossRef]
- Wu, C.; He, X.; Wu, W.; Ji, K. Low cycle fatigue crack propagation and damage evolution of concrete beams reinforced with gfrp bar. Compos. Struct. 2023, 304, 116312. [Google Scholar] [CrossRef]
- Zhang, K.; Shen, X.; Liu, J.; Teng, F.; Zhang, G.H.; Wang, J.W. Flexural strengthening of reinforced concrete T-beams using a composite of prestressed steel wire ropes embedded in polyurethane cement (PSWR-PUC): Theoretical analysis. Structures 2022, 44, 1278–1287. [Google Scholar] [CrossRef]
- Ombres, L. Flexural analysis of reinforced concrete beams strengthened with a cement based high strength composite material. Compos. Struct. 2011, 94, 143–155. [Google Scholar] [CrossRef]
- Shirai, K.; Yin, H.; Teo, W. Flexural capacity prediction of composite RC members strengthened with UHPC based on existing design models. Structures 2020, 23, 44–55. [Google Scholar] [CrossRef]
- Tran, D.A.; Shen, X.; Sorelli, L.; Ftima, M.B.; Brühwiler, E. Predicting the effect of non-uniform fiber distribution on the tensile response of ultra-high-performance fiber reinforced concrete by magnetic inductance-based finite element analysis. Cem. Concr. Compos. 2023, 135, 104810. [Google Scholar] [CrossRef]
- Nguyen, D.; Le, H.; Vu, T.; Tran, N.T. Evaluating fracture characteristics of ultra-high-performance fiber-reinforced concrete in flexure and tension with size impact. Constr. Build. Mater. 2023, 382, 131224. [Google Scholar] [CrossRef]
- Dastgerdi, A.S.; Peterman, R.J.; Savic, A.; Riding, K.; Beck, B.T. Prediction of splitting crack growth in prestressed concrete members using fracture toughness and concrete mix design. Constr. Build. Mater. 2020, 246, 118523. [Google Scholar] [CrossRef]
- Wu, Y.X.; Zheng, X.Y.; Huang, W.; Zheng, X.Y.; Chen, B.C. Review of interface bond behavior between ultra-high performance concrete and existing concrete. Mater. Rep. 2023, 37, 21120057. (In Chinese) [Google Scholar]
- Prem, P.R.; Murthy, A.R.; Verma, M. Theoretical modelling and acoustic emission monitoring of RC beams strengthened with UHPC. Constr. Build. Mater. 2018, 158, 670–682. [Google Scholar] [CrossRef]
Disclaimer/Publisher’s Note: The statements, opinions and data contained in all publications are solely those of the individual author(s) and contributor(s) and not of MDPI and/or the editor(s). MDPI and/or the editor(s) disclaim responsibility for any injury to people or property resulting from any ideas, methods, instructions or products referred to in the content. |
© 2024 by the authors. Licensee MDPI, Basel, Switzerland. This article is an open access article distributed under the terms and conditions of the Creative Commons Attribution (CC BY) license (https://creativecommons.org/licenses/by/4.0/).