
Synergistic Effect in MoS2 Nanosheets–Biochar Nanocomposites with Enhanced Surface Area and Electrical Conductivity for Energy Storage Applications

 ,
,  and
and
Abstract
:1. Introduction
2. Materials and Methods
2.1. Materials
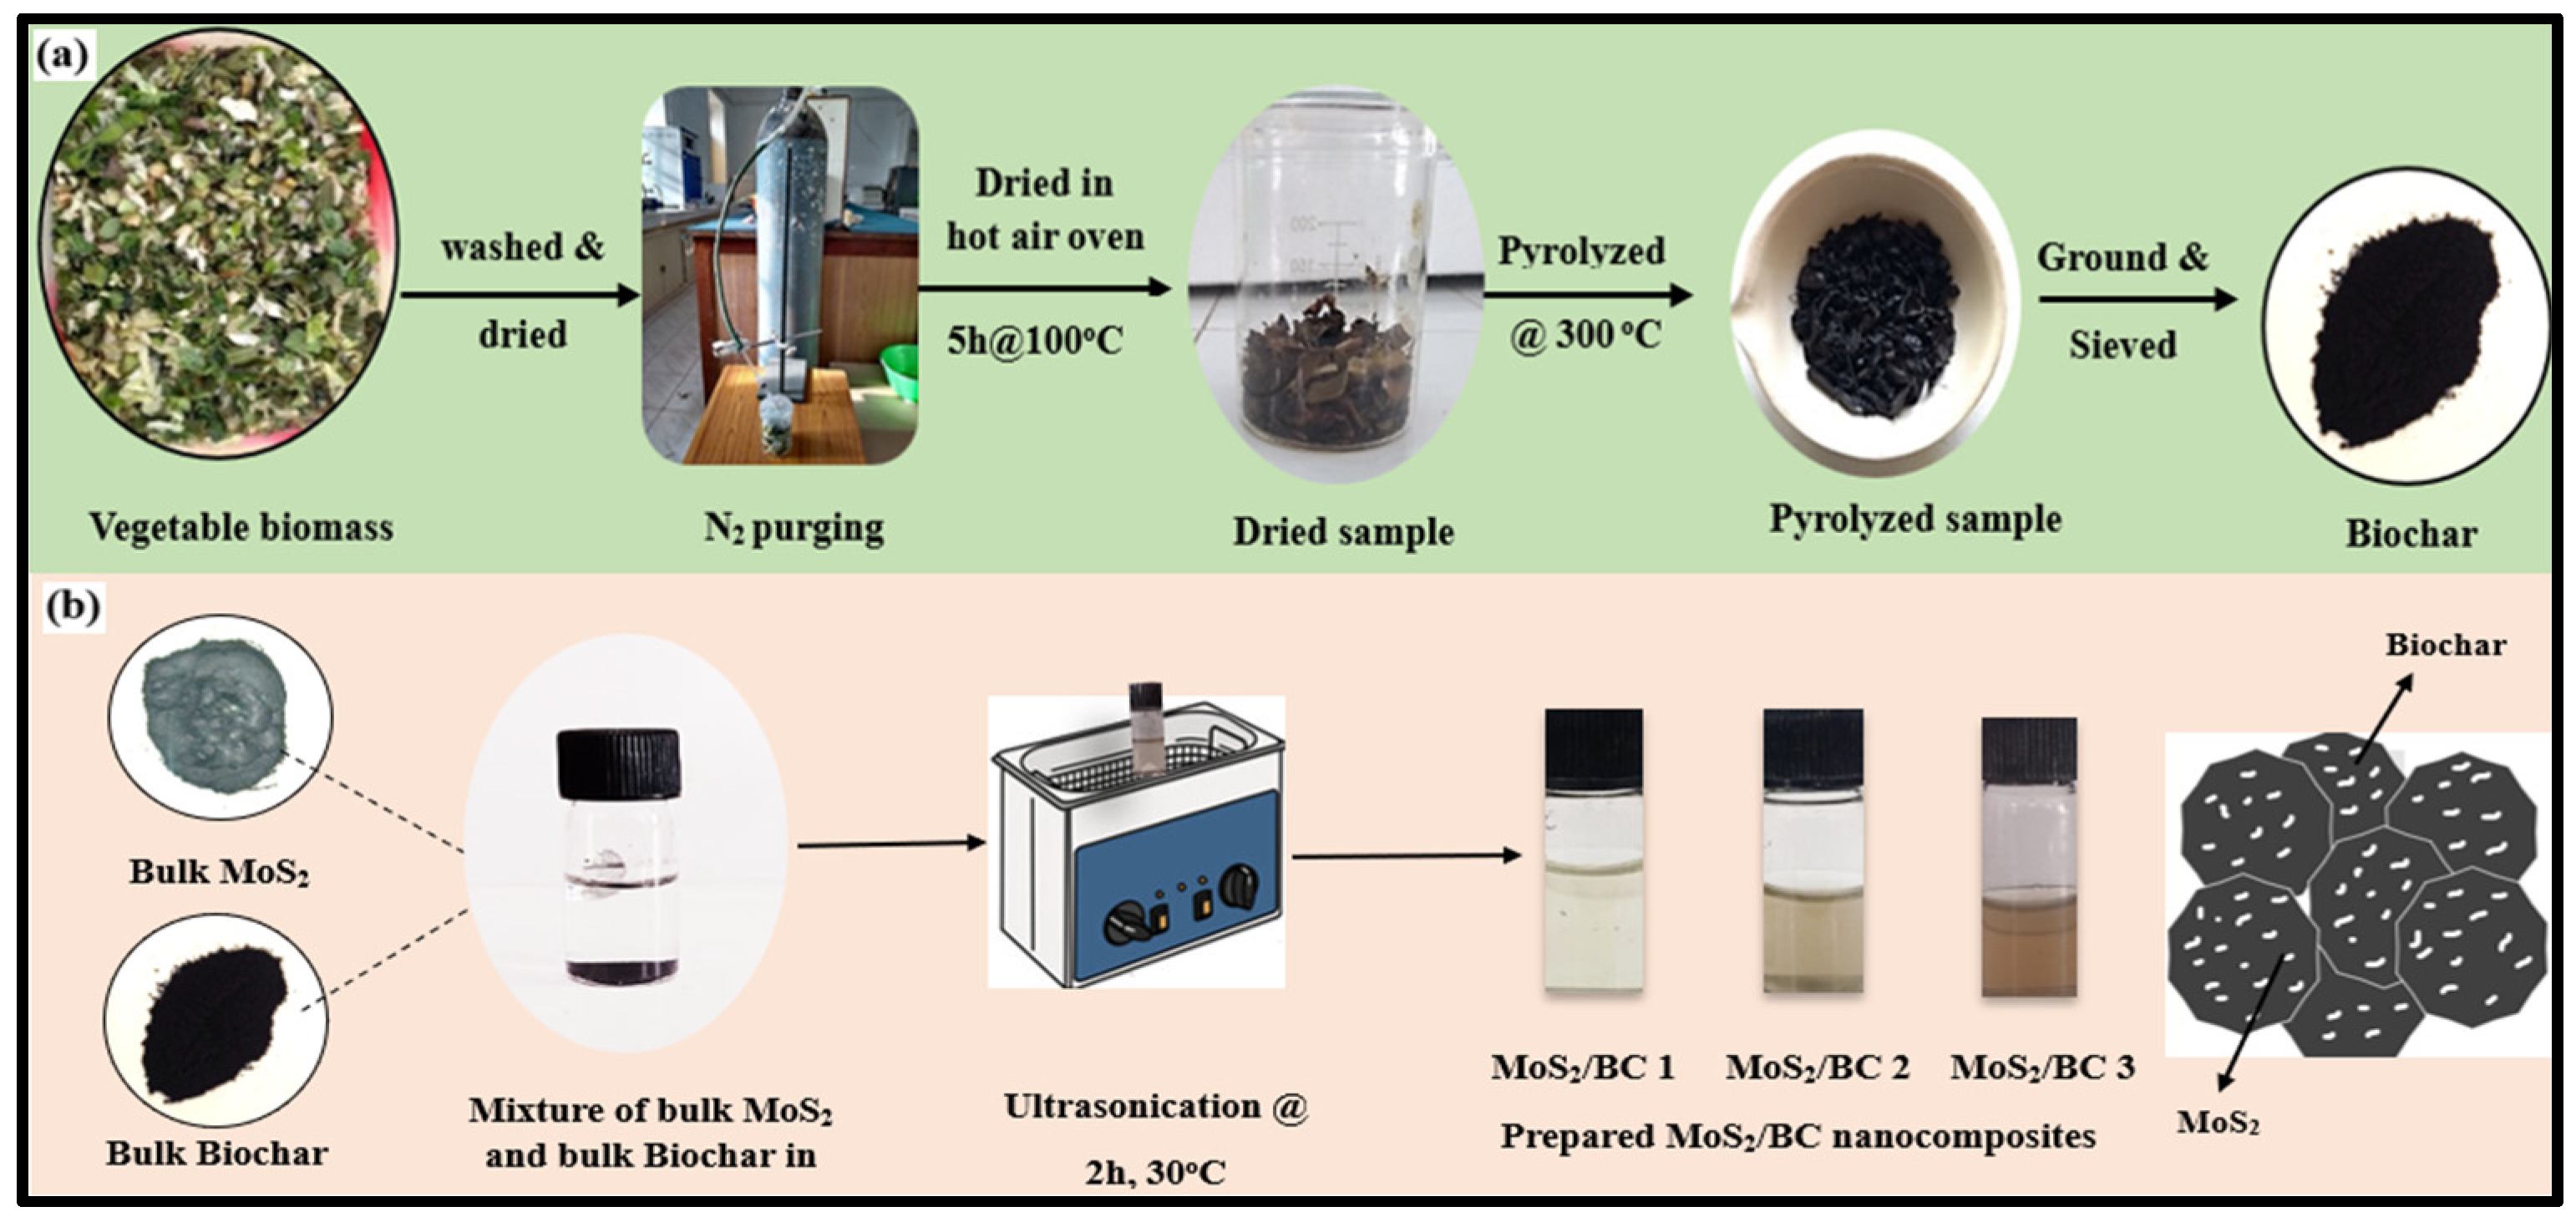
2.2. Preparation of BC
2.3. Preparation of MoS2/BC NCs
2.4. Characterization Techniques
2.5. Electrochemical Studies Using a Modified Glassy Carbon Electrode (GCE)
3. Results and Discussion
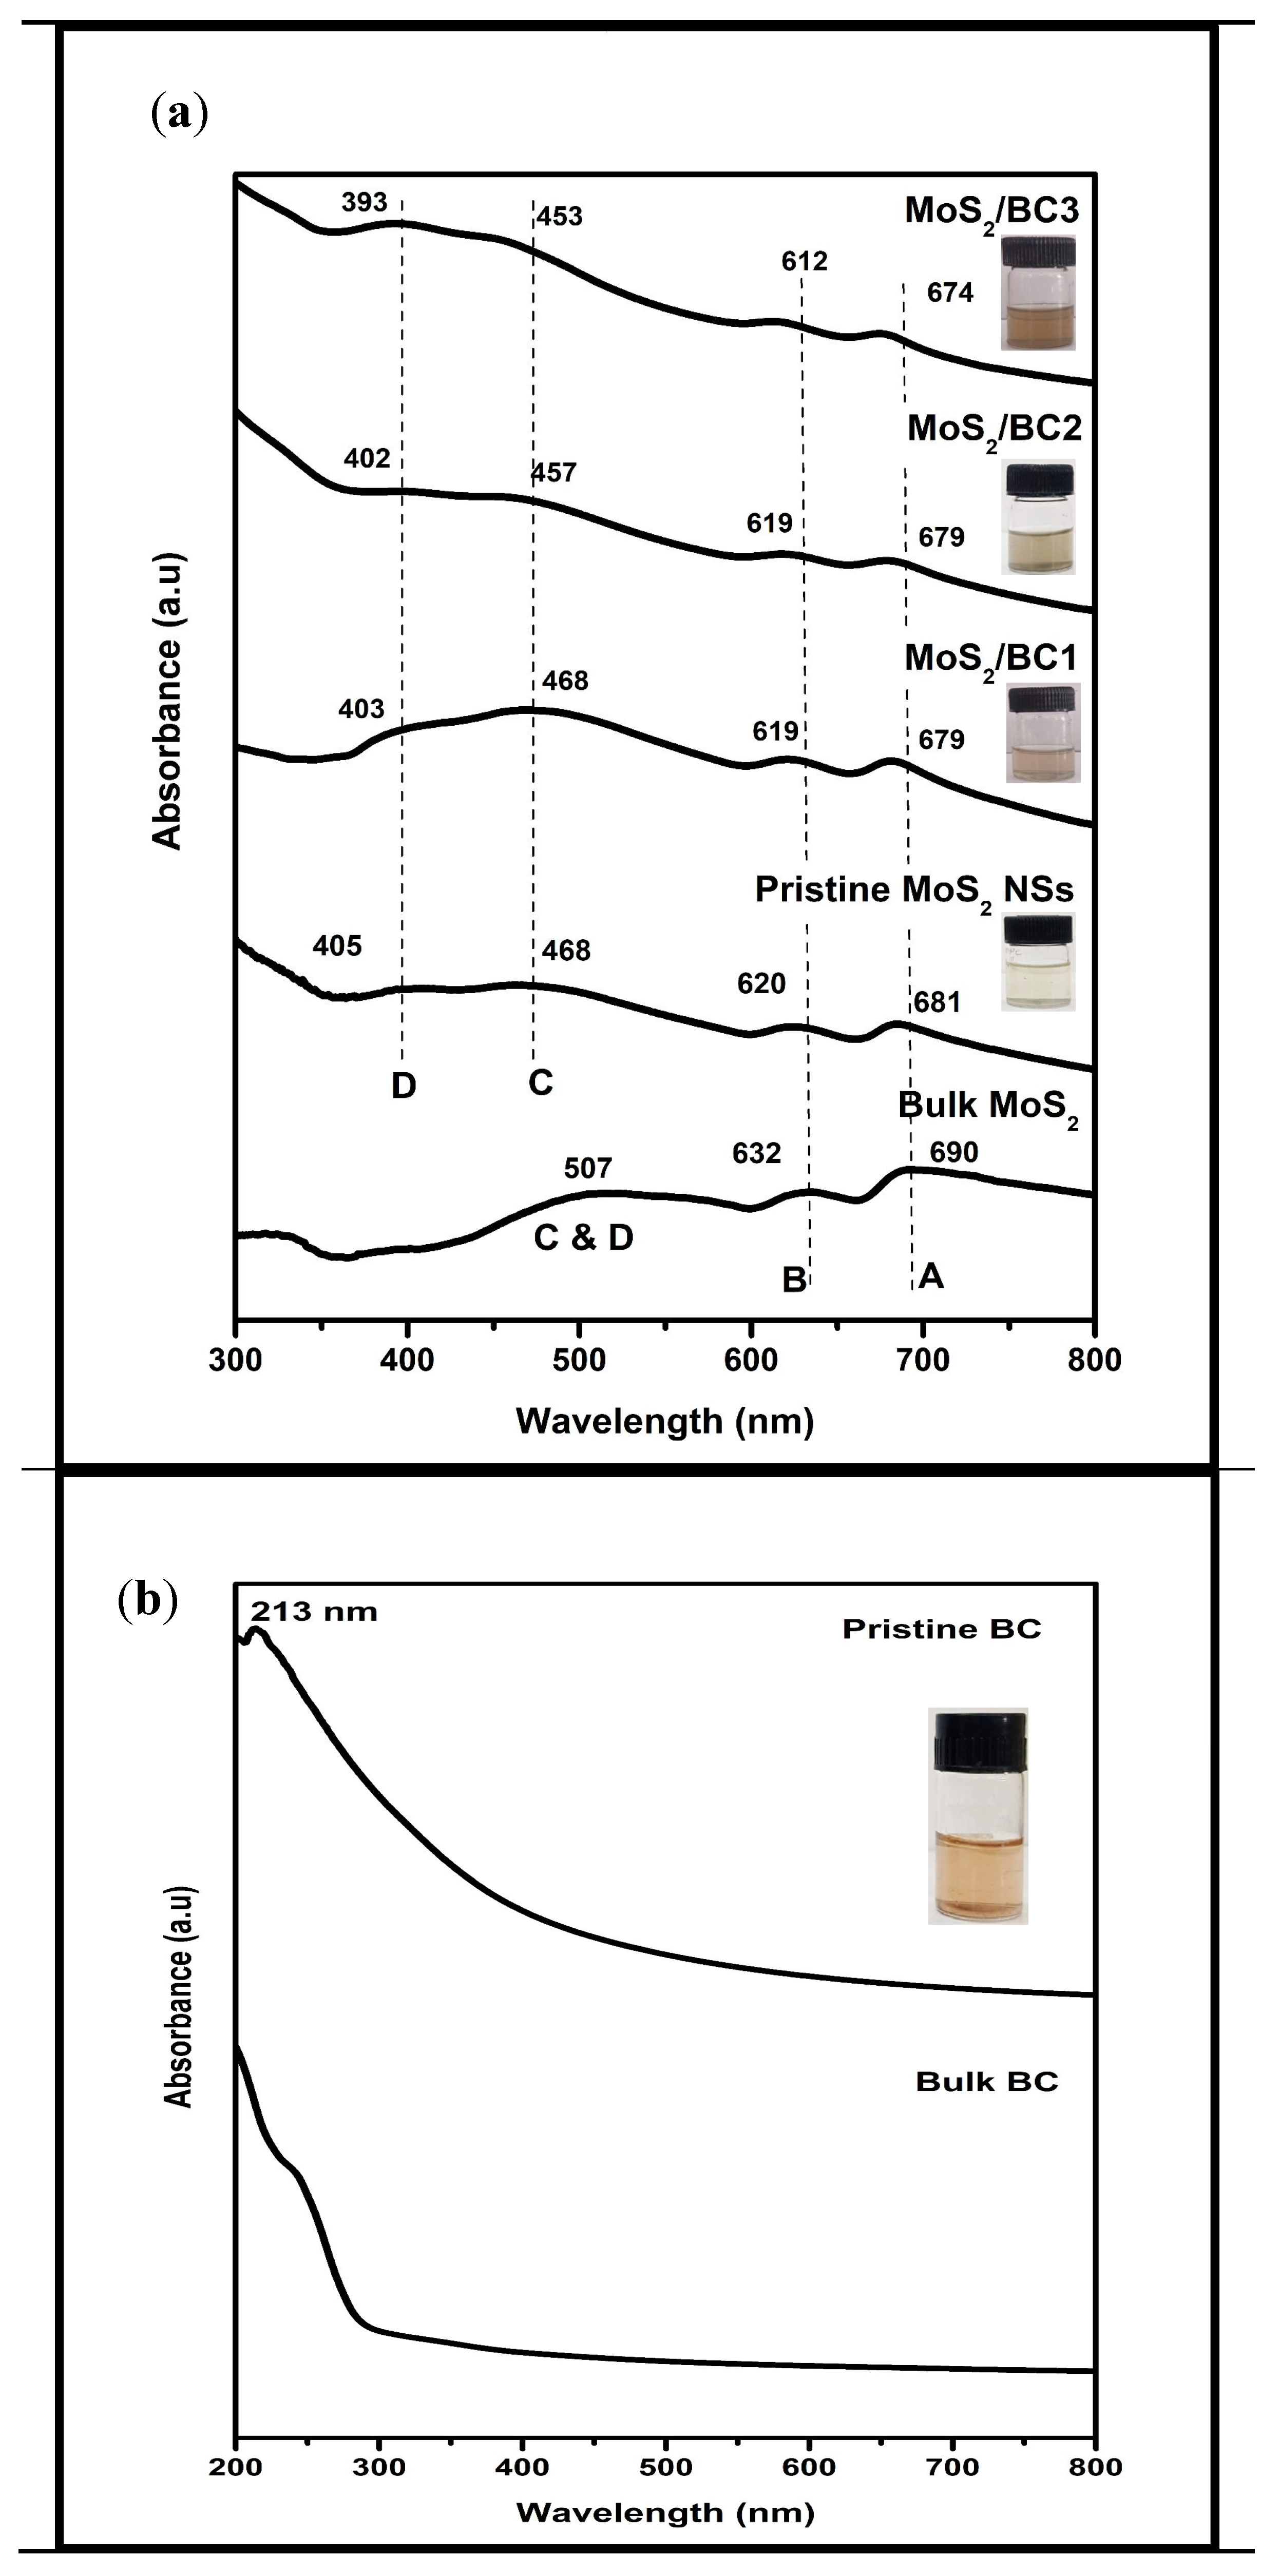
3.1. UV-Vis Spectroscopic Analysis
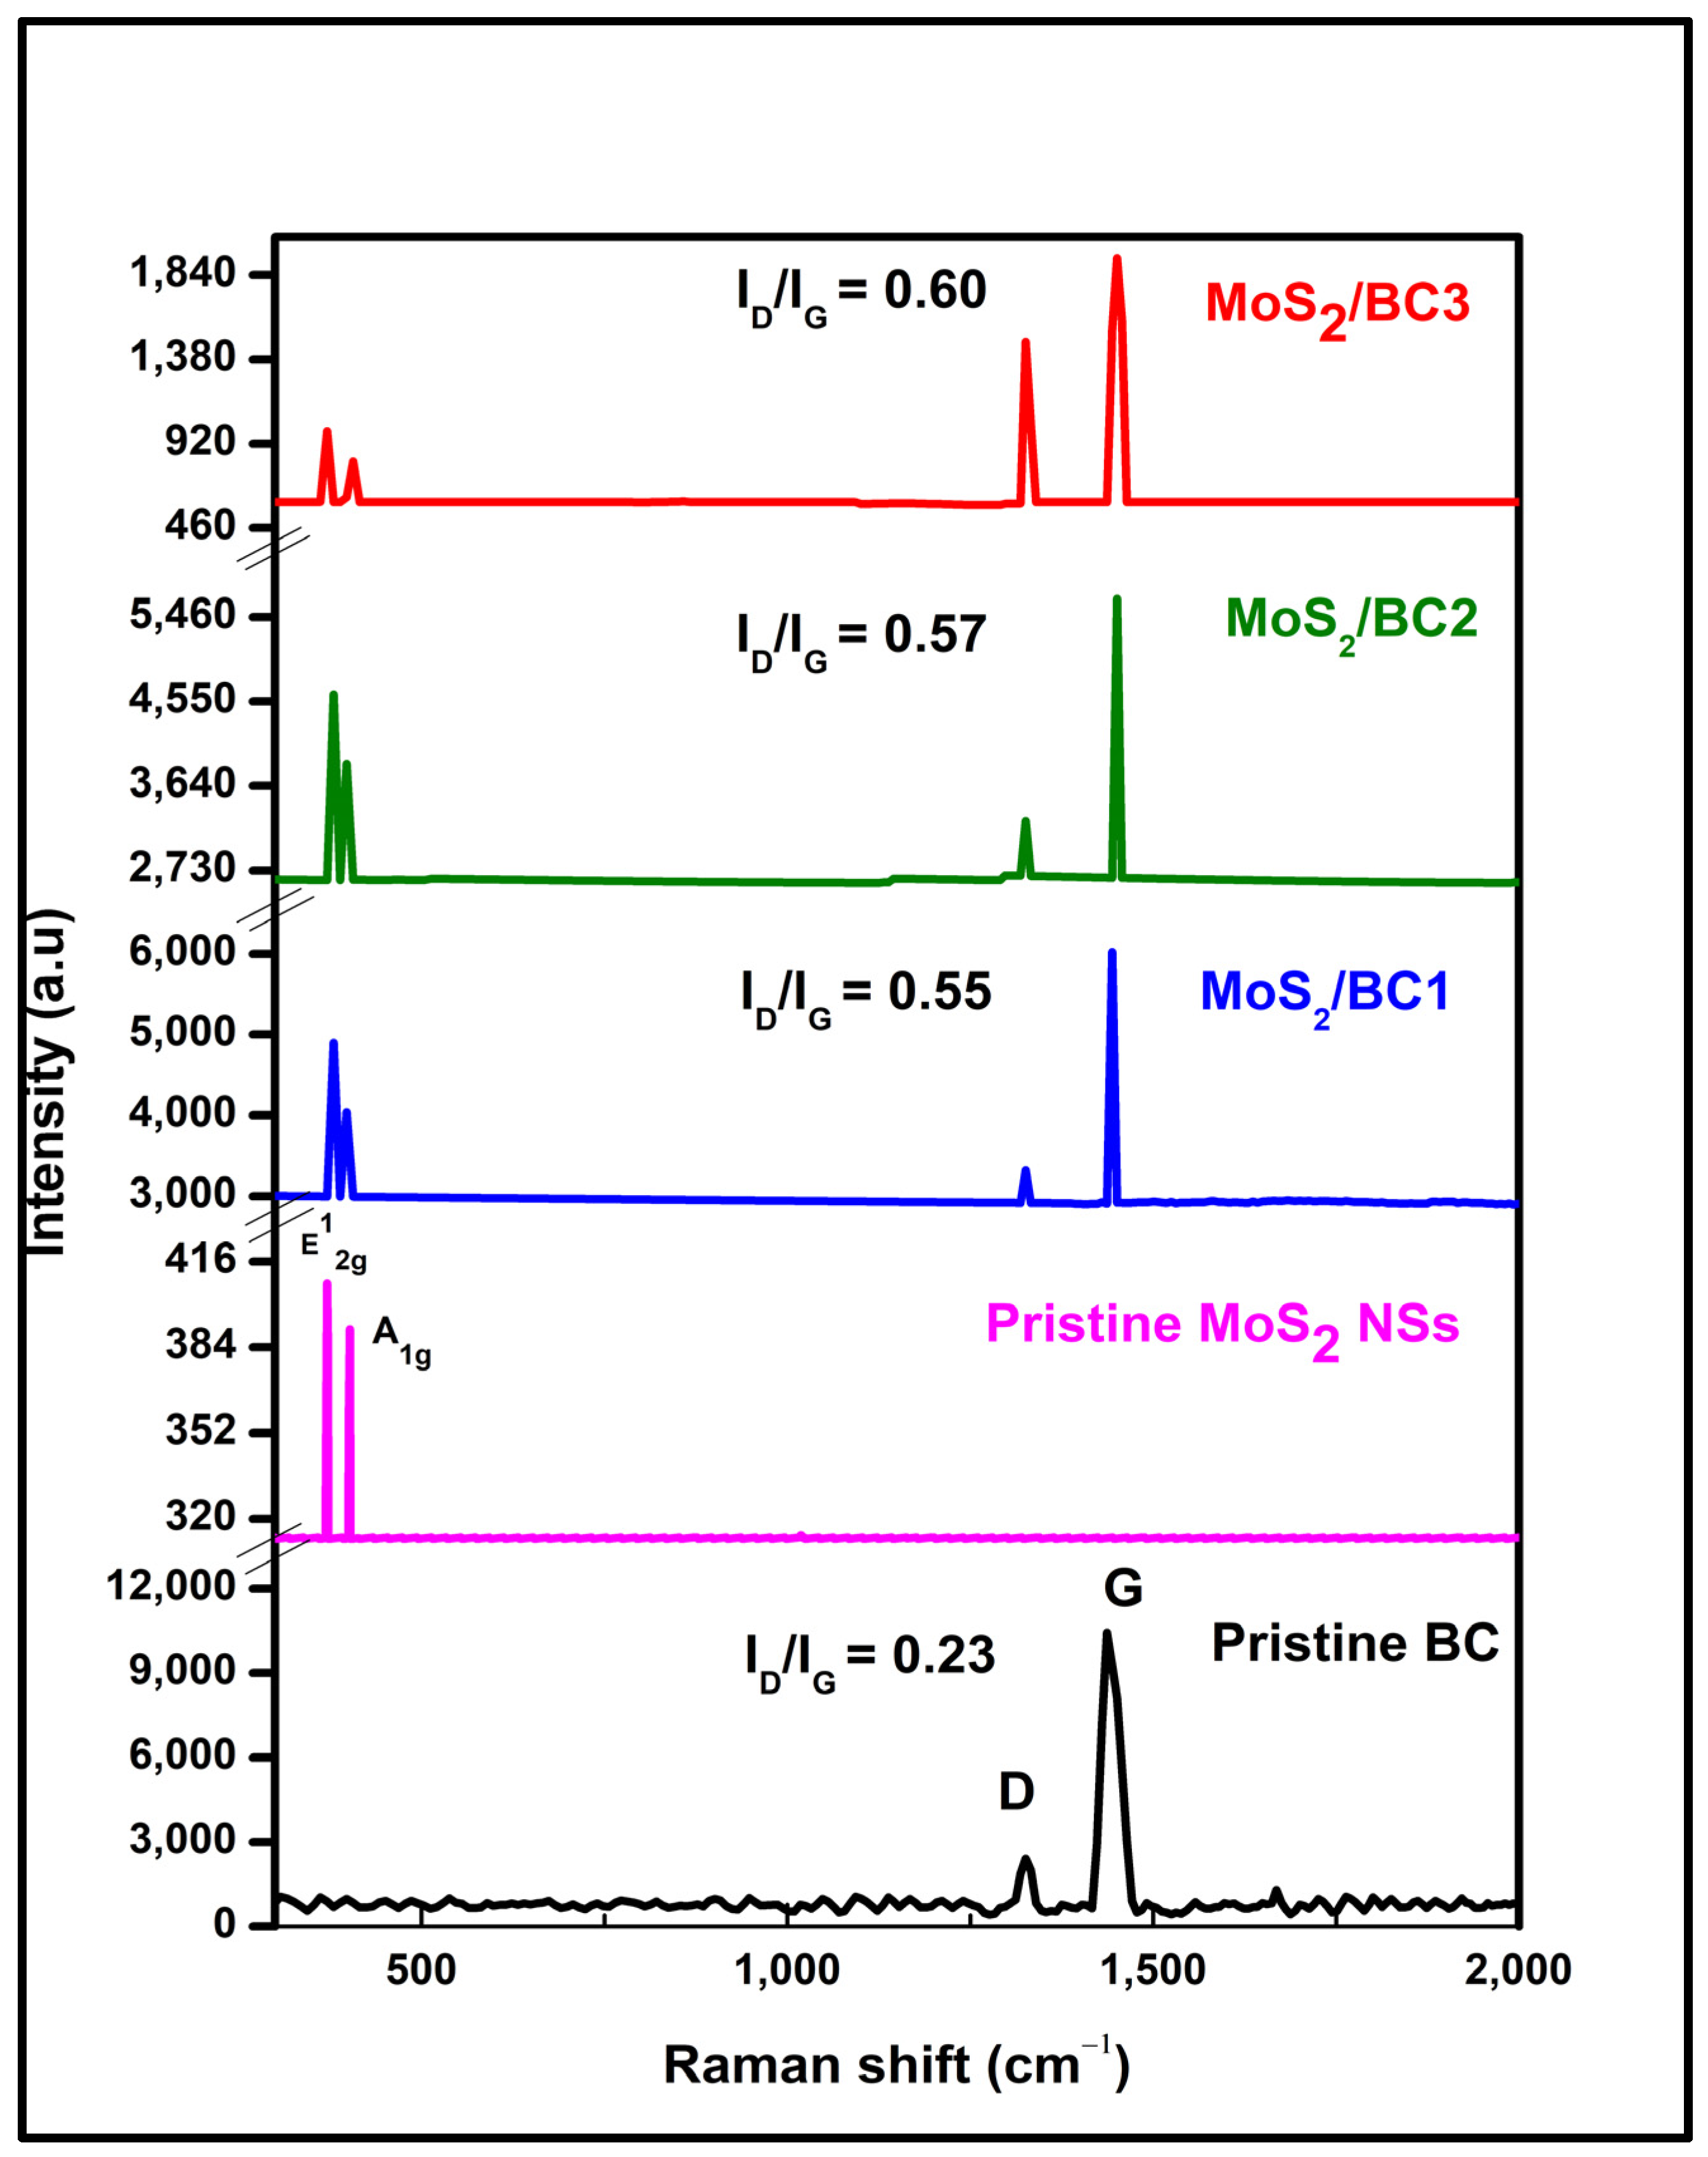
3.2. Raman Spectroscopic Analysis
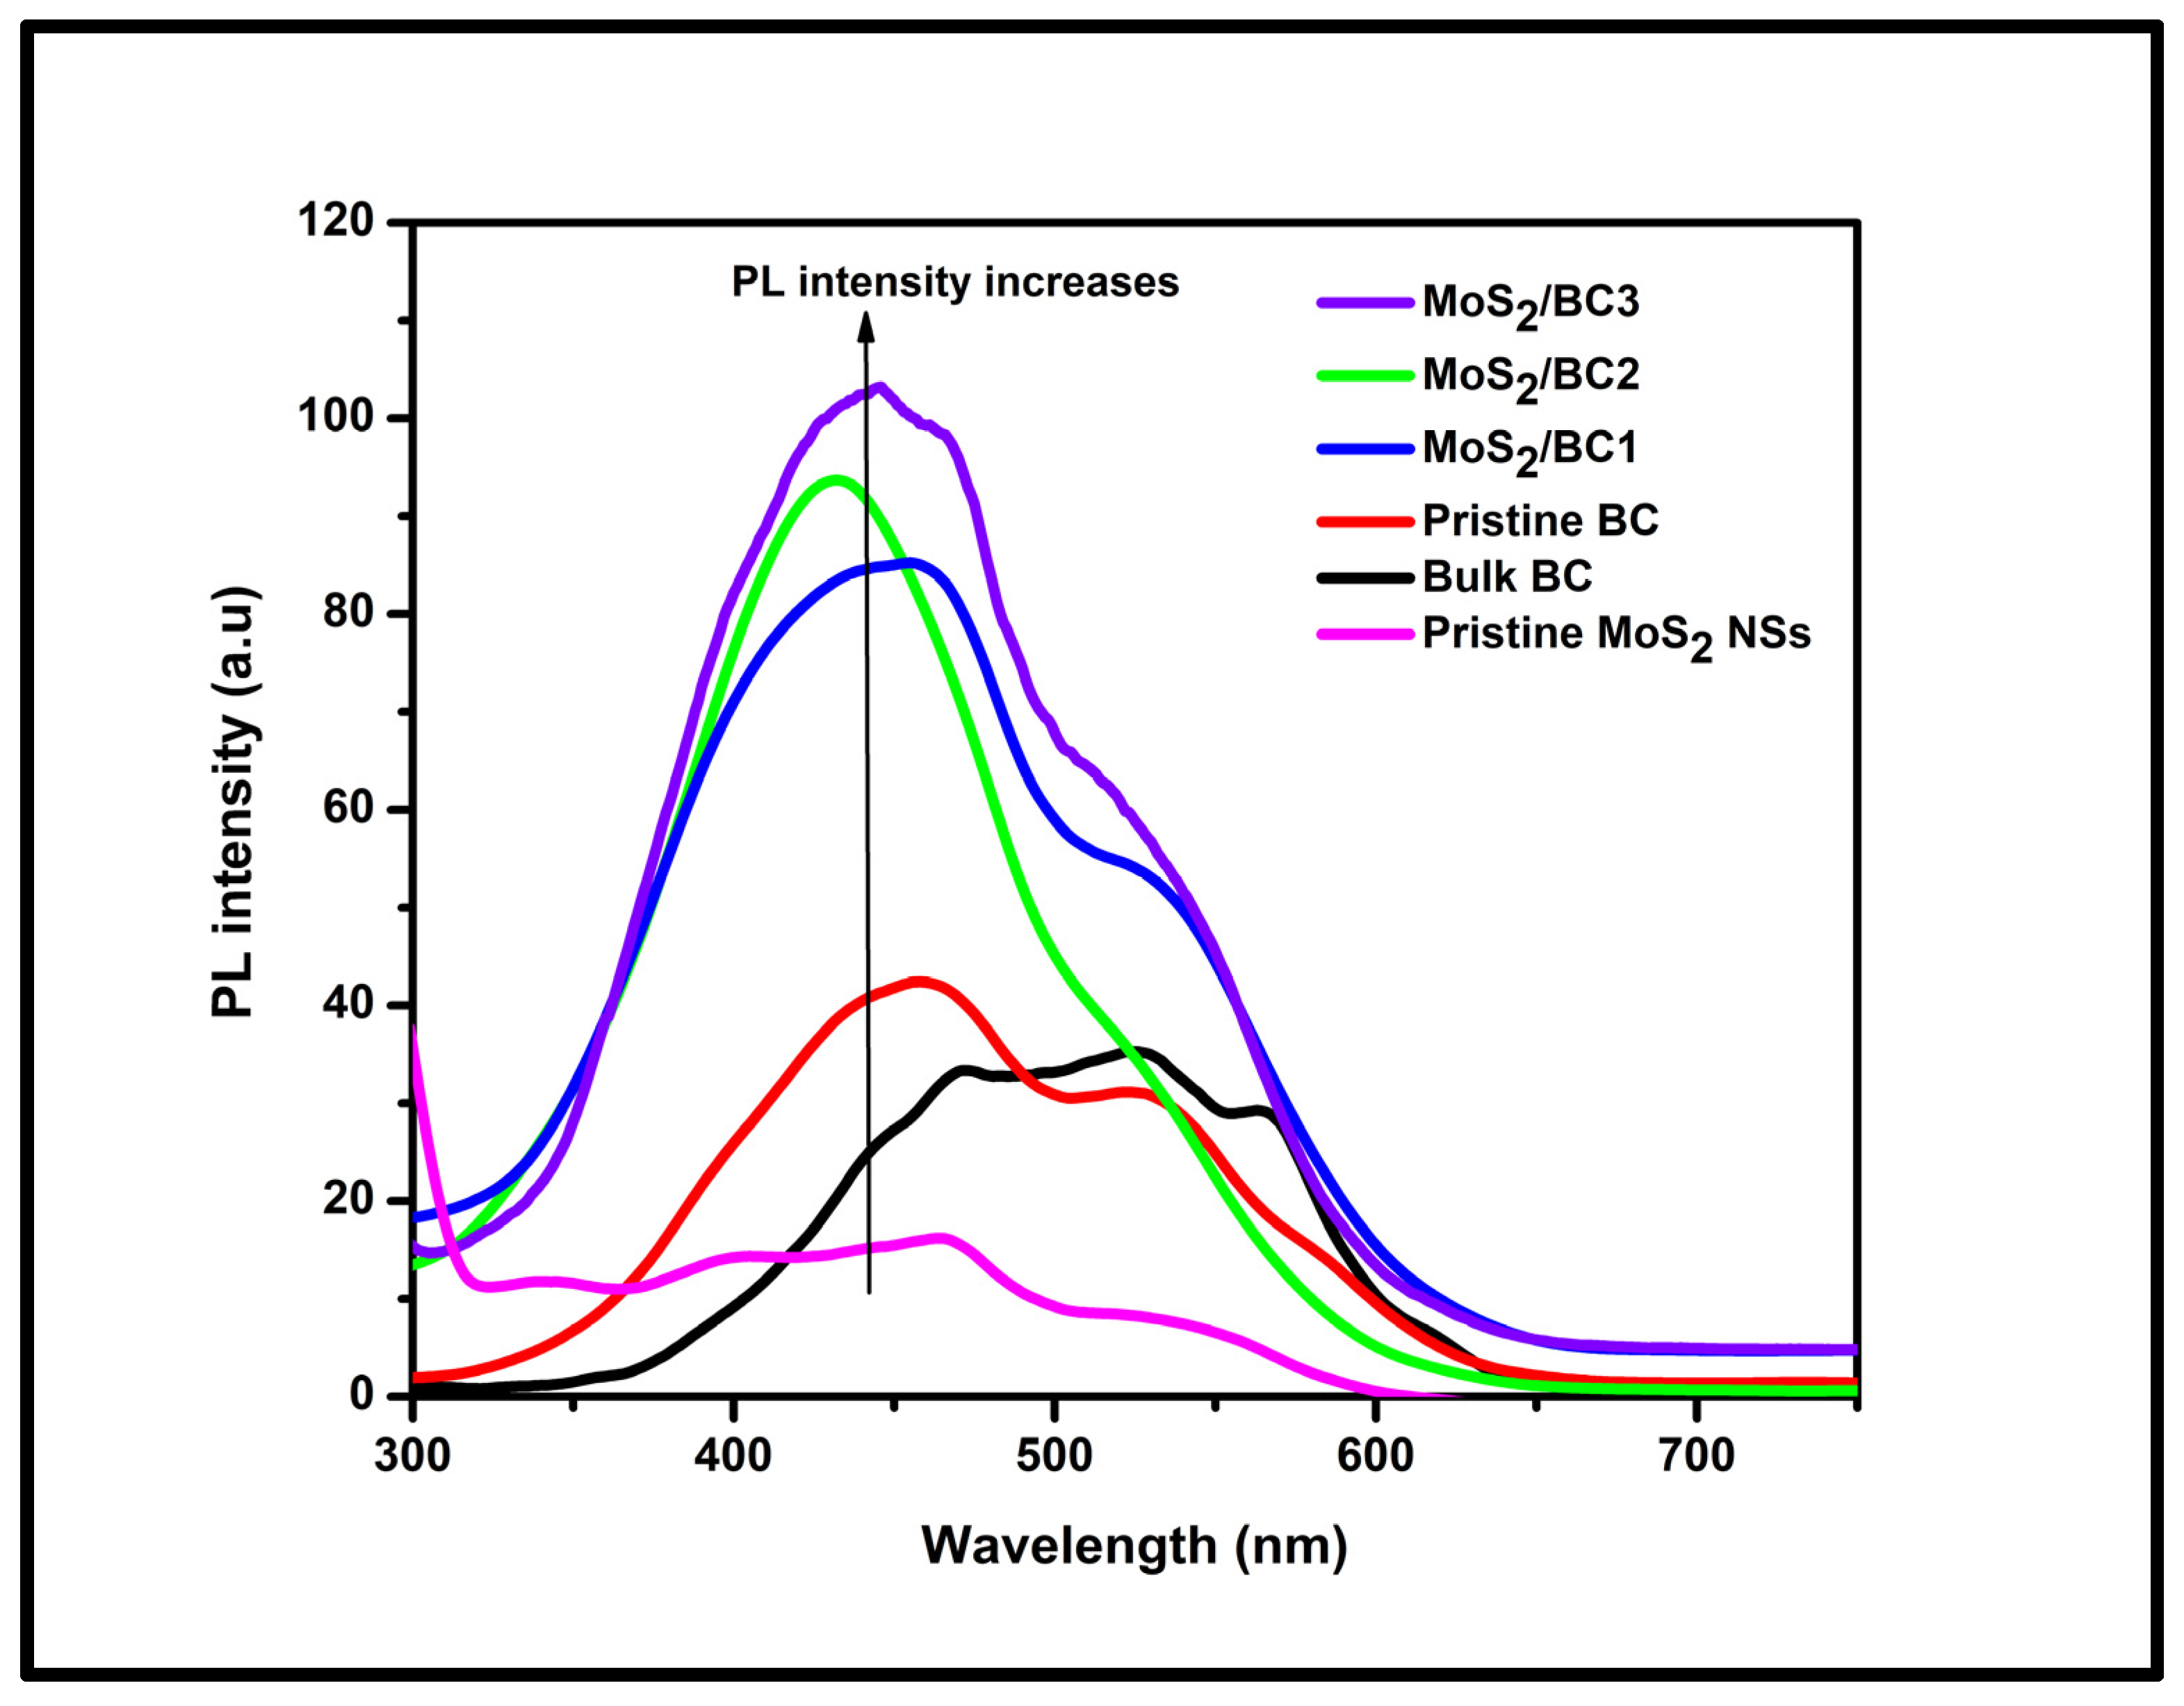
3.3. PL Spectroscopic Analysis
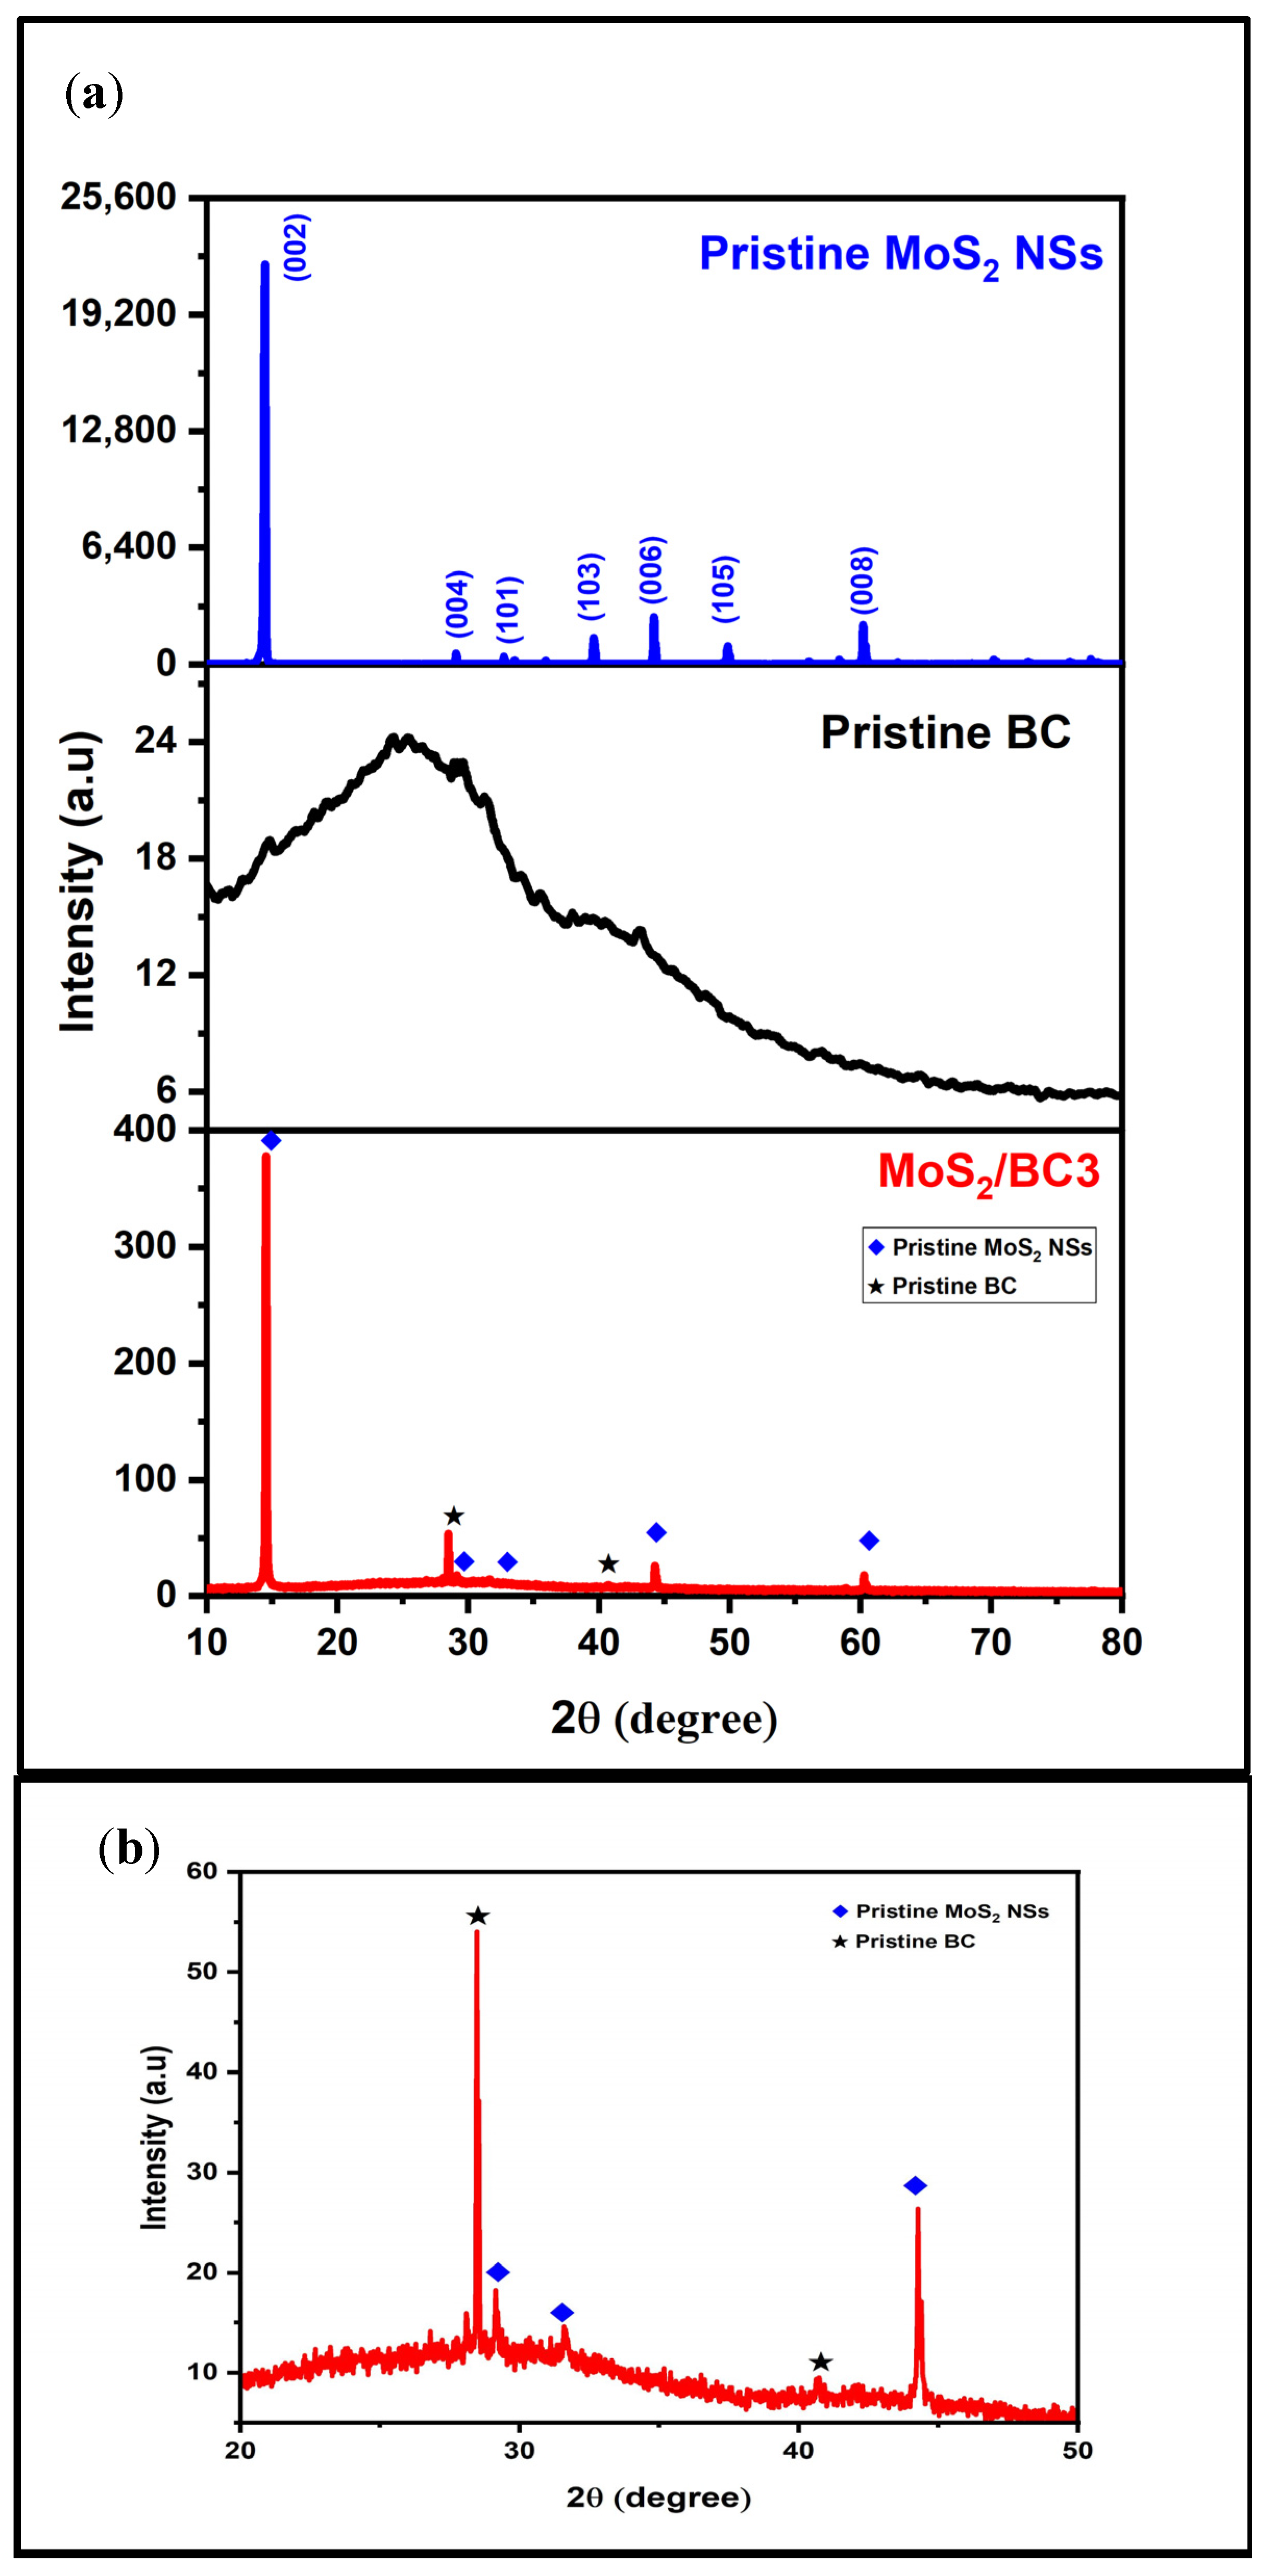
3.4. XRD Analysis
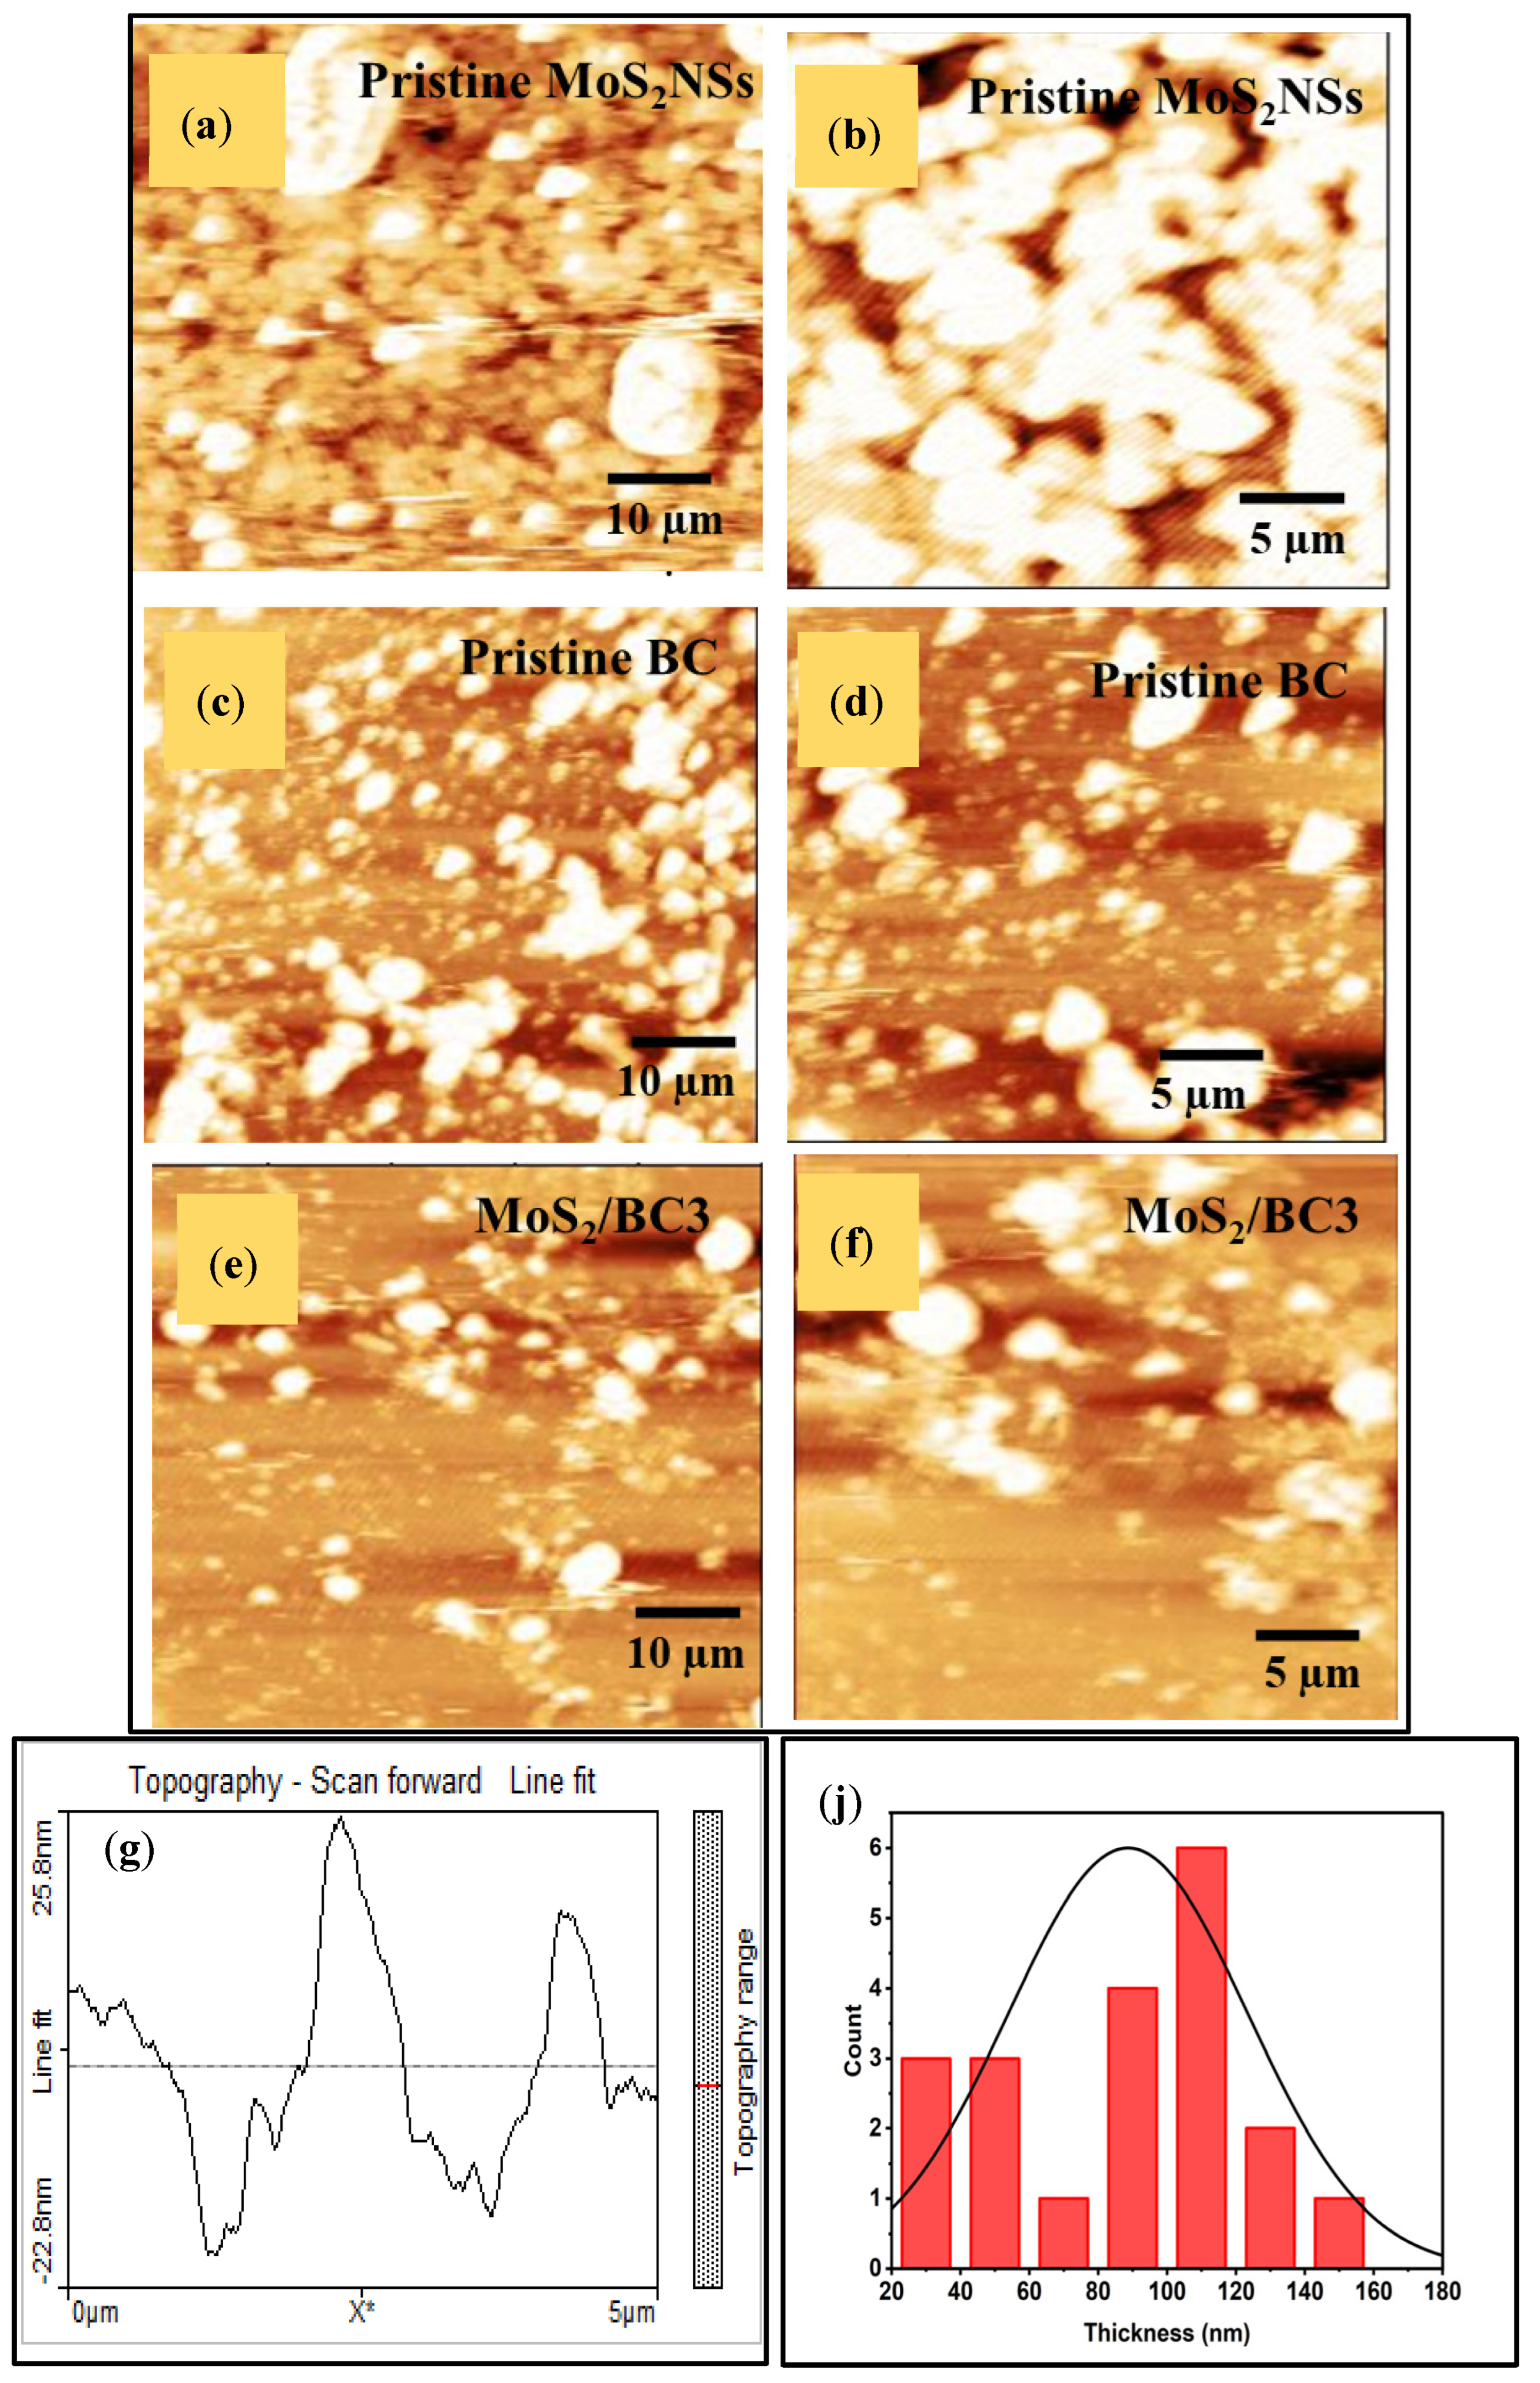
3.5. AFM Analysis
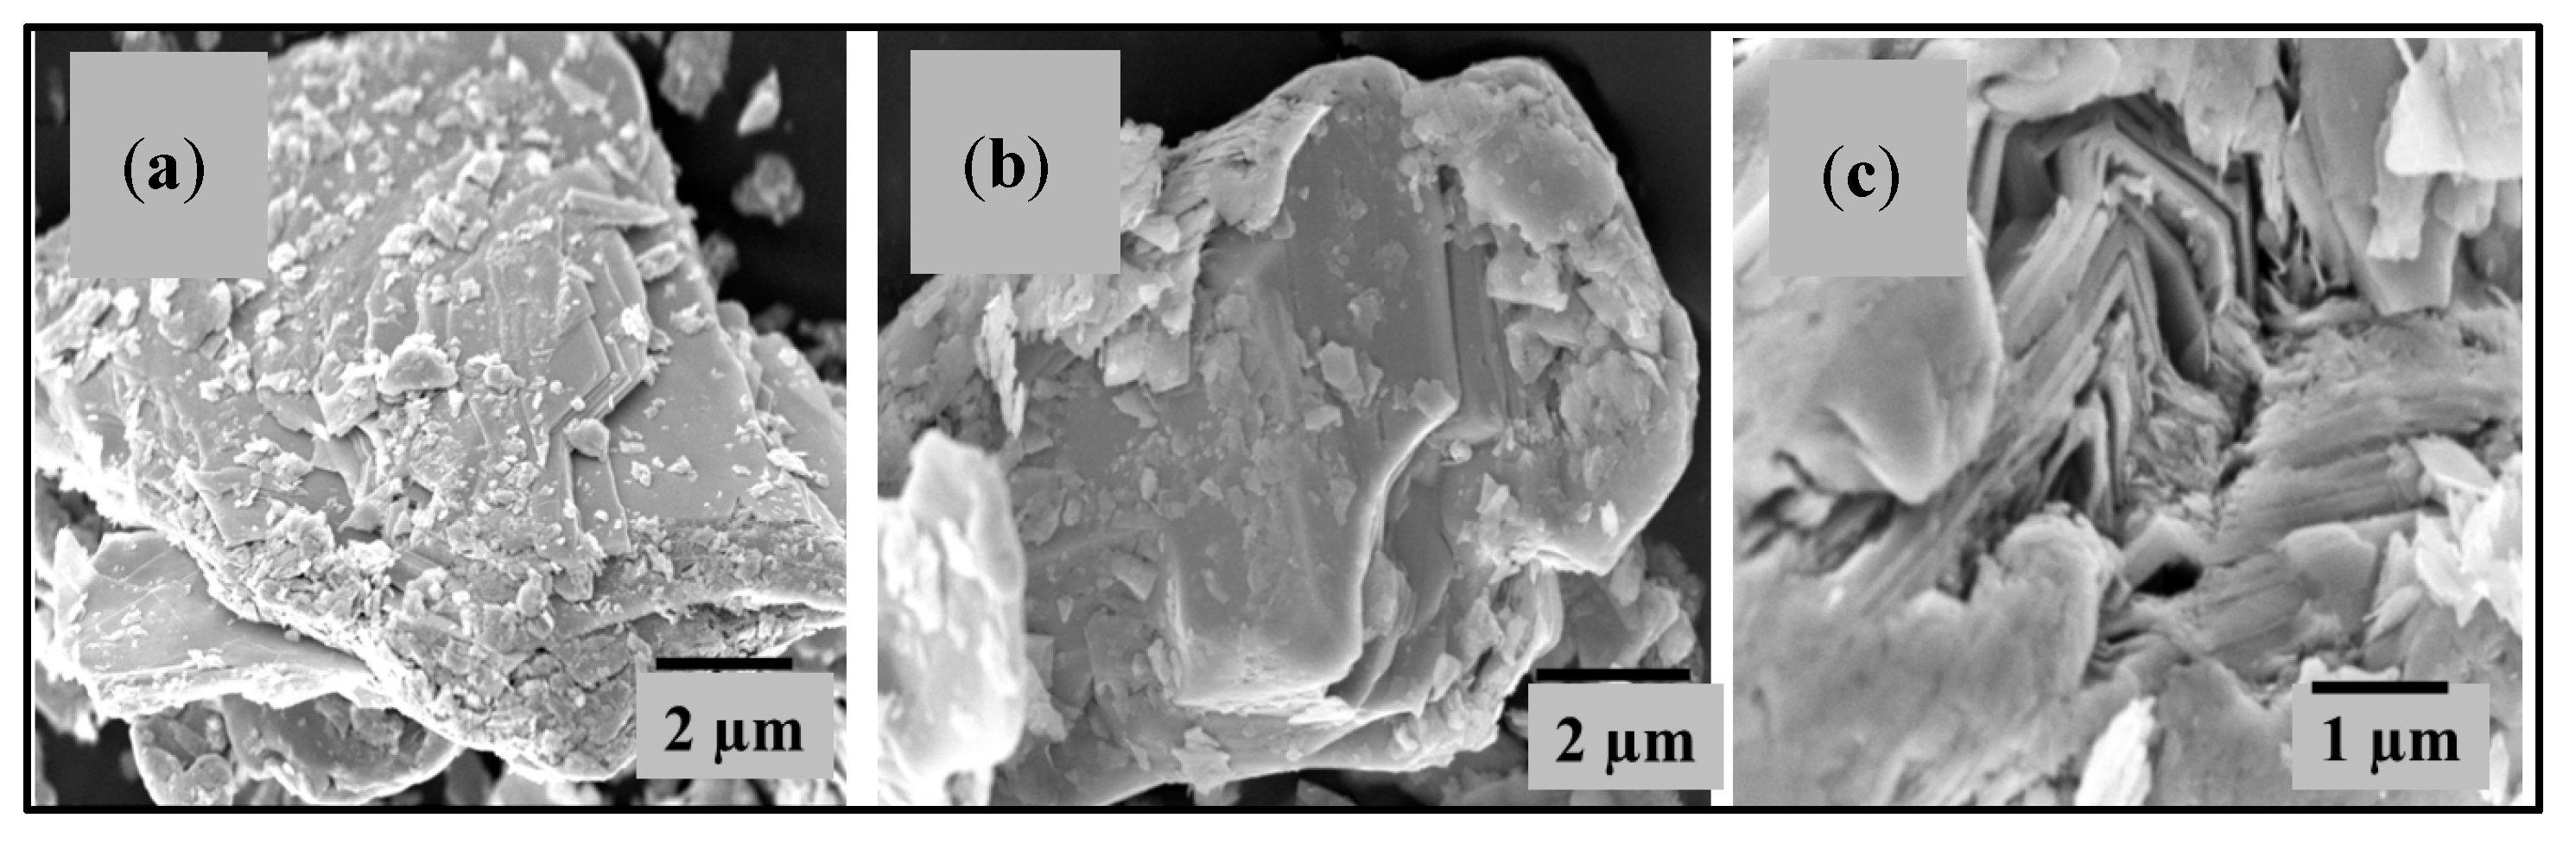
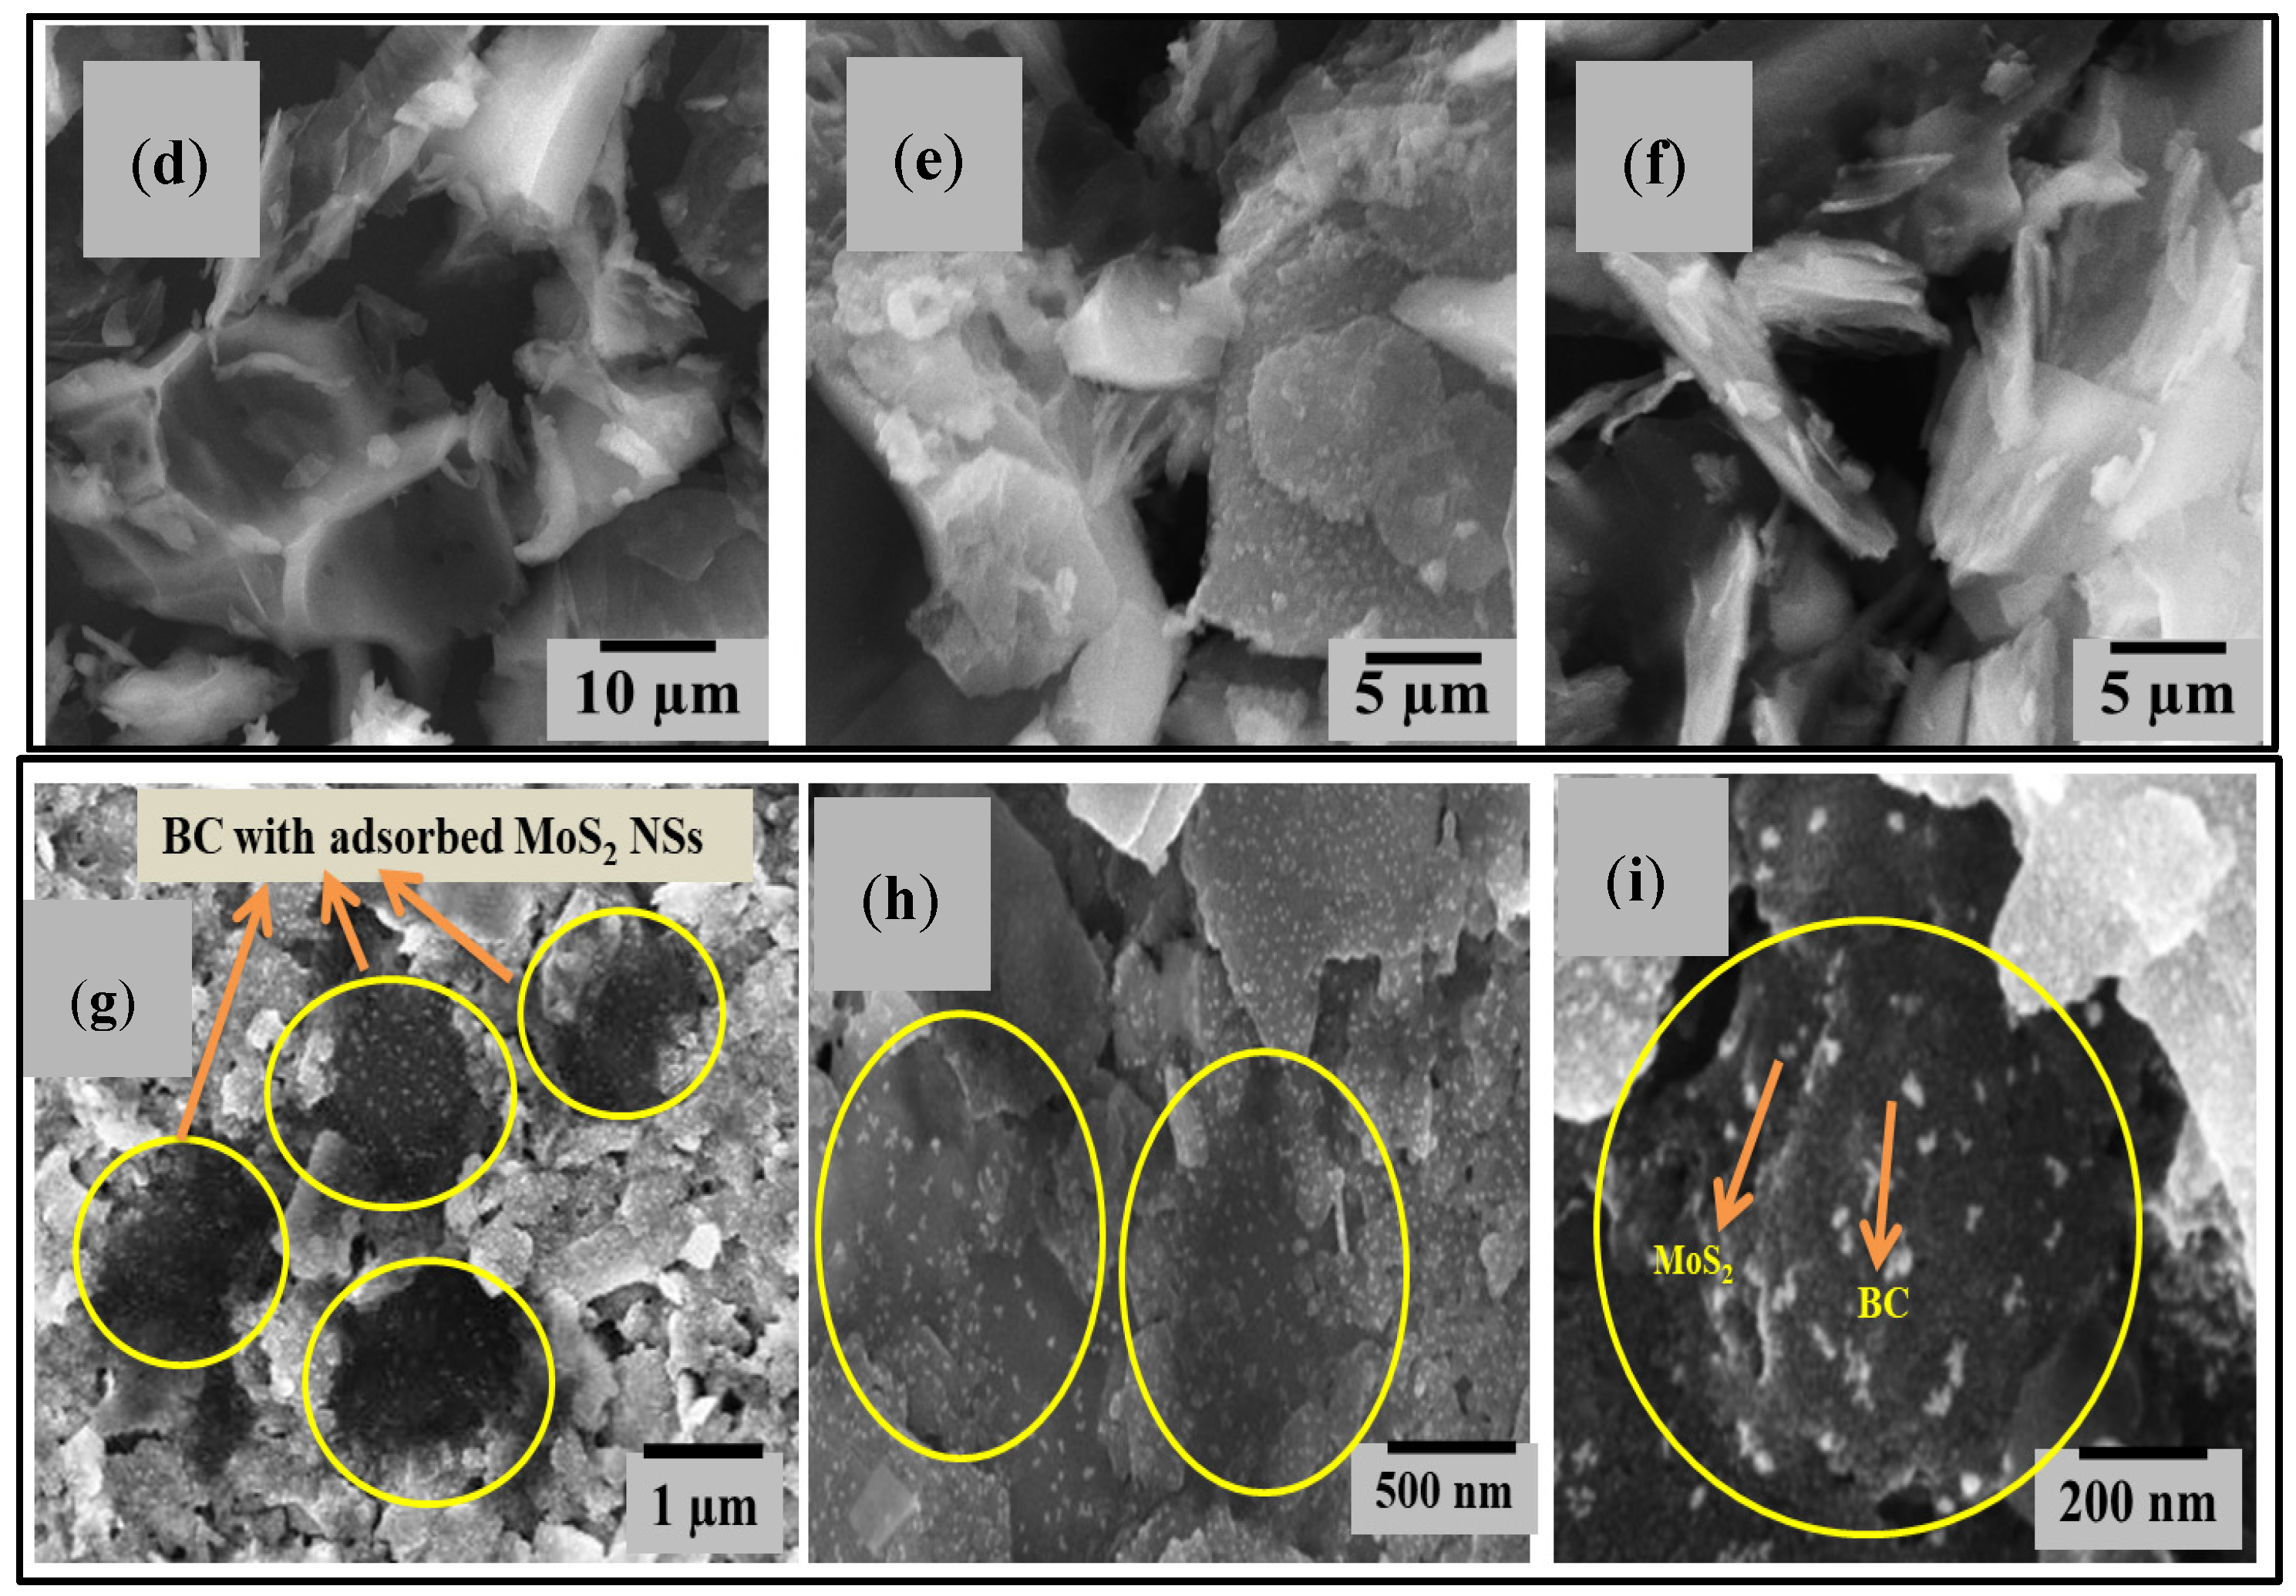
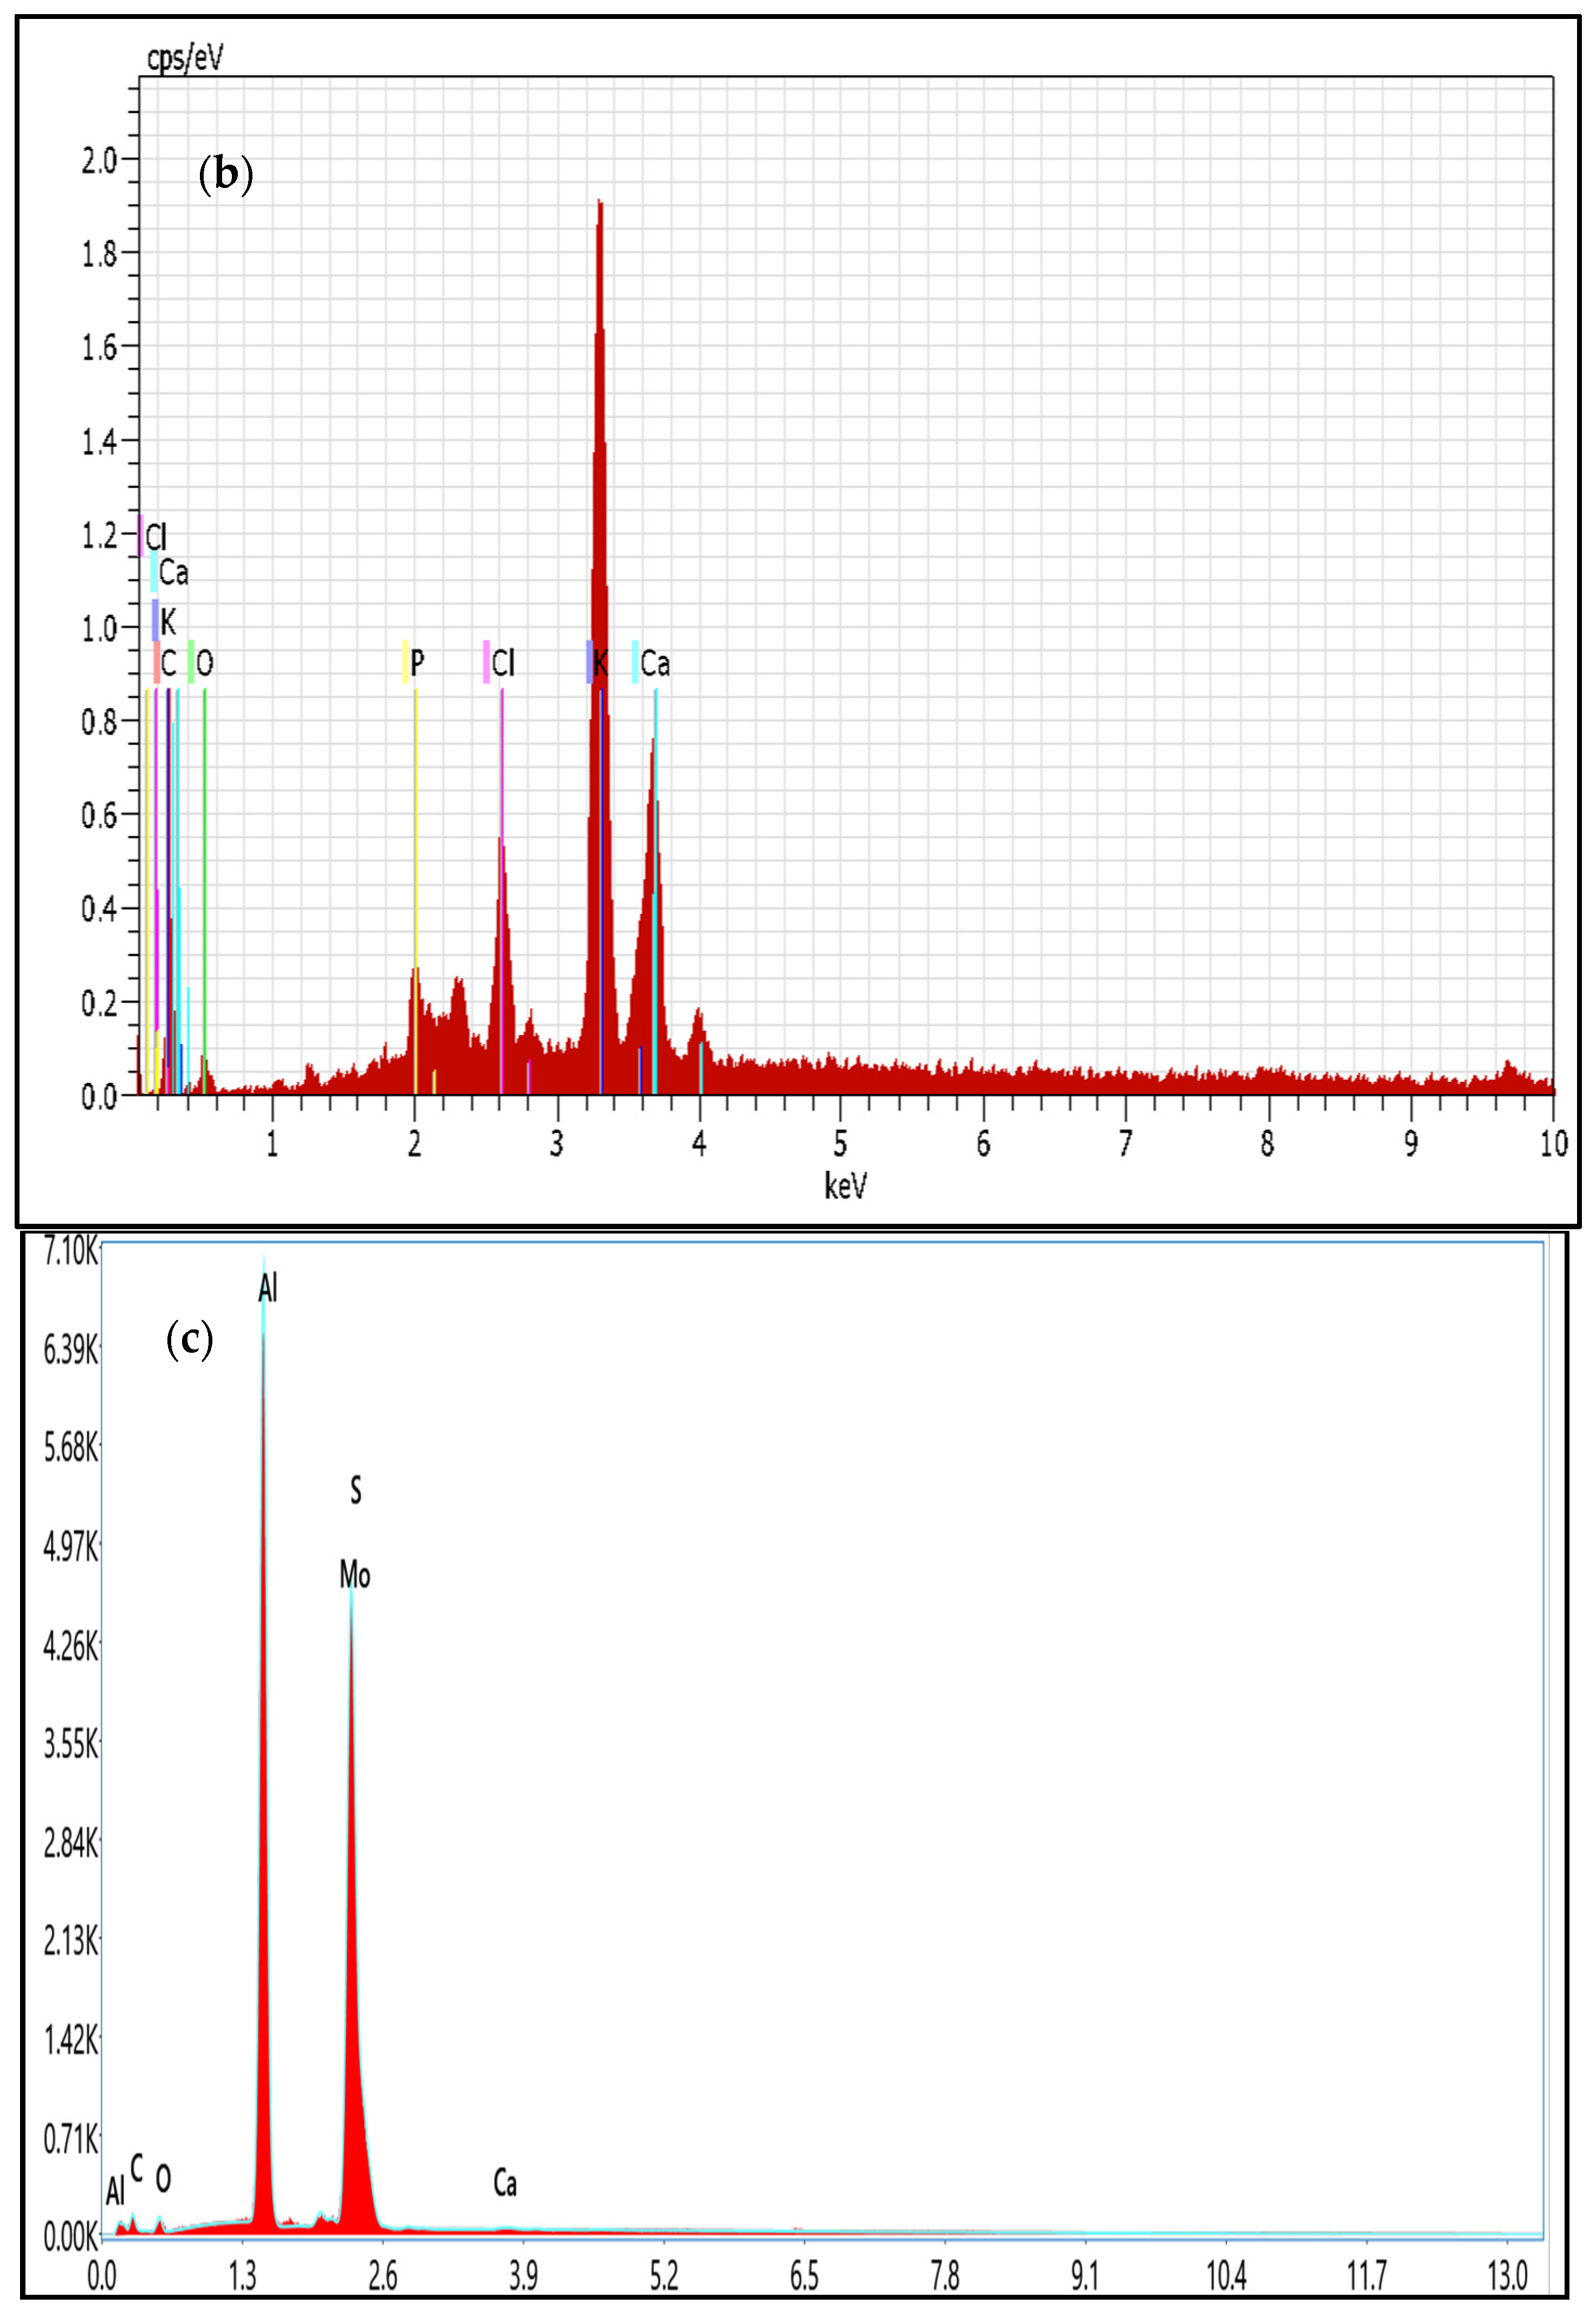
3.6. FESEM and EDX Analysis
3.7. Electrochemical Analysis
3.7.1. EIS Analysis
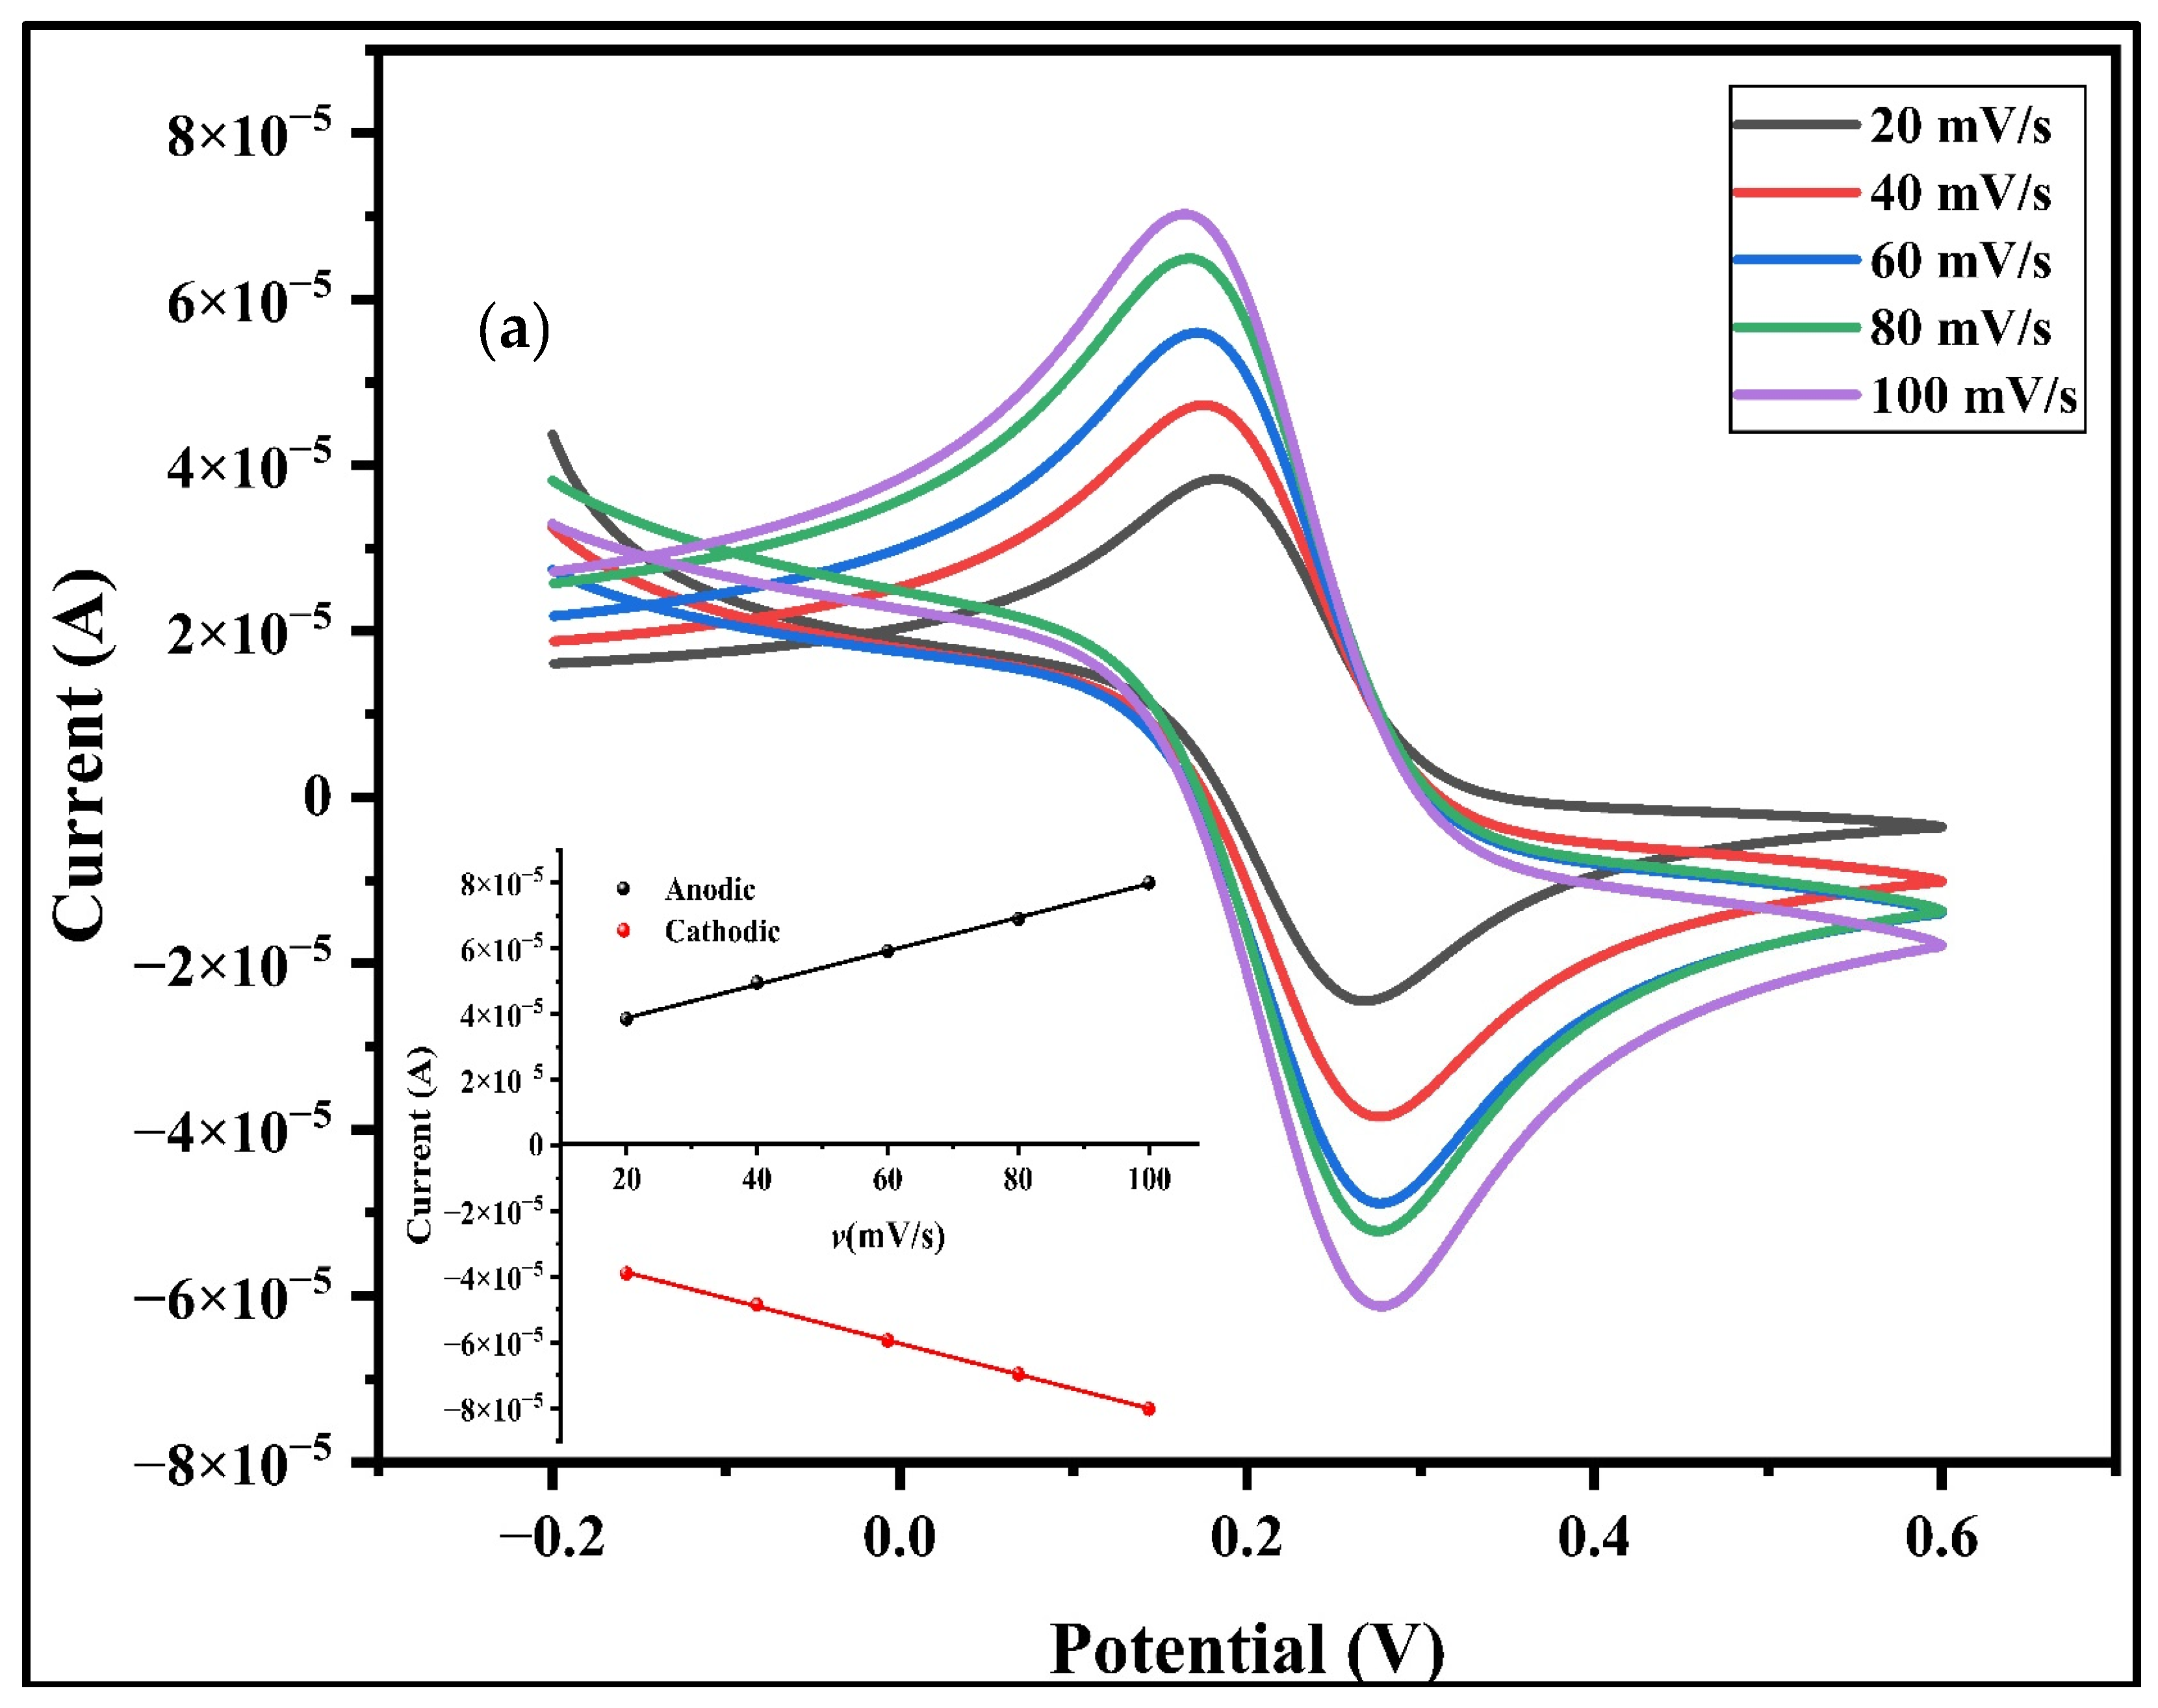
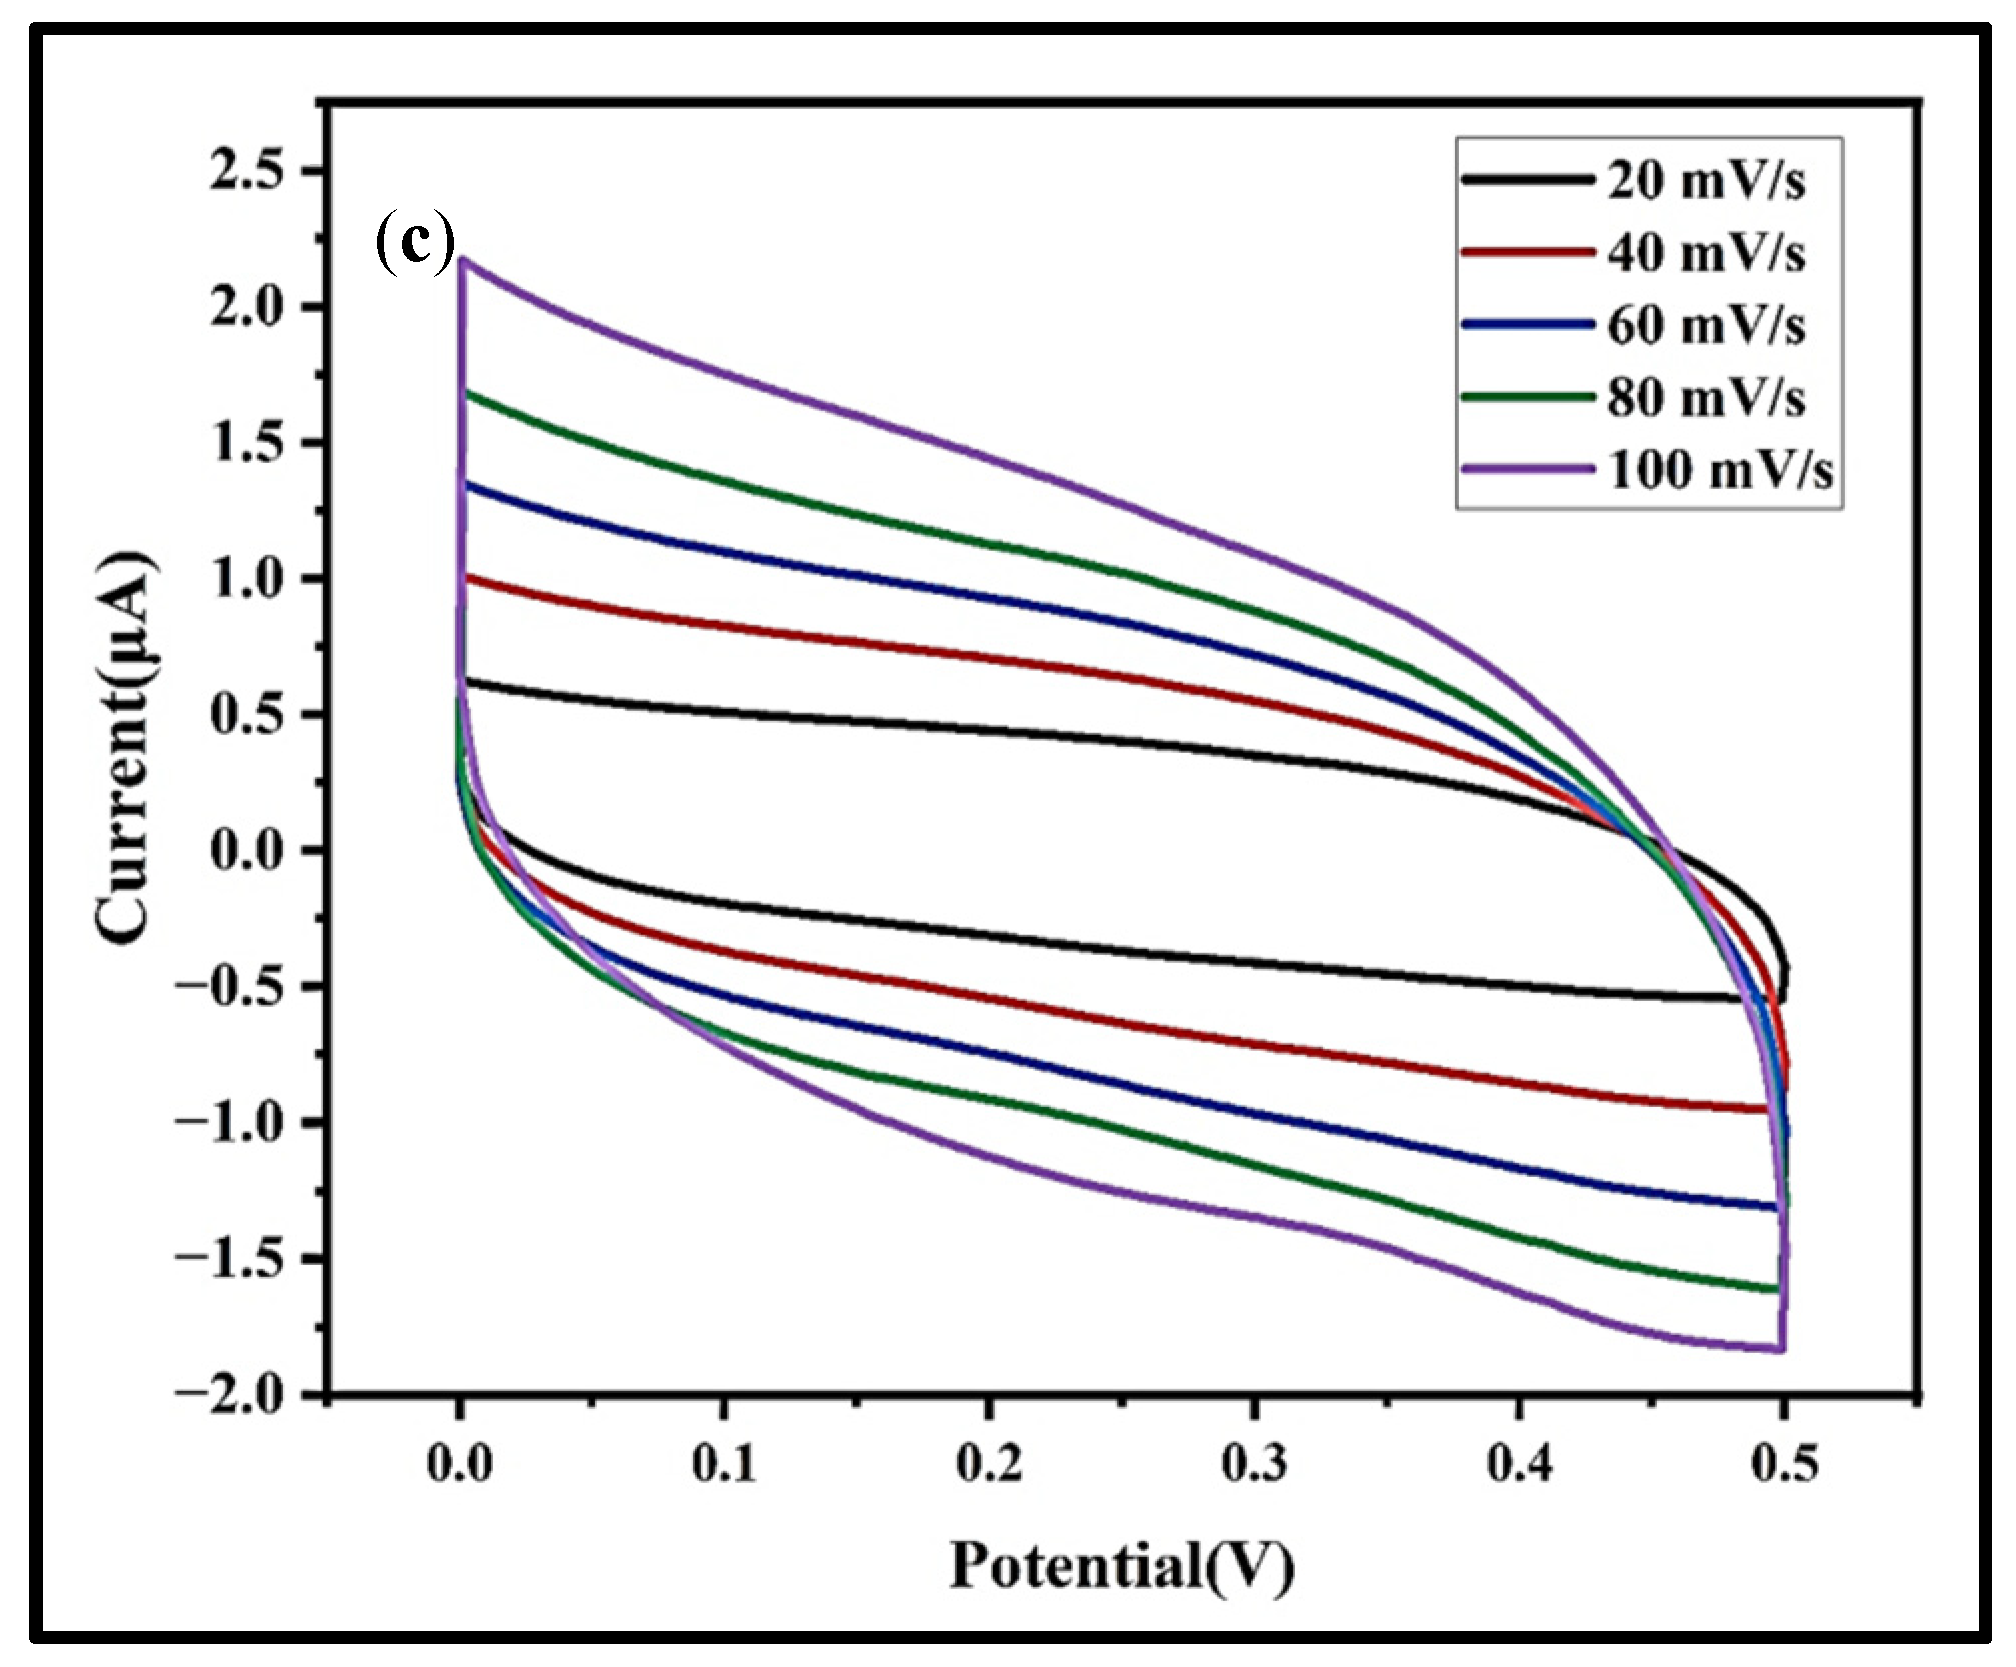
3.7.2. CV Analysis
4. Conclusions
Author Contributions
Funding
Data Availability Statement
Acknowledgments
Conflicts of Interest
References
- Öztürk, O.; Gür, E. Layered transition metal sulfides for supercapacitor applications. ChemElectroChem 2024, 11, e202300575. [Google Scholar] [CrossRef]
- Cook, J.B.; Kim, H.S.; Lin, T.C.; Lai, C.H.; Dunn, B.; Tolbert, S.H. Pseudocapacitive charge storage in thick composite MoS2 nanocrystal-based electrodes. Adv. Energy Mater. 2017, 7, 1601283. [Google Scholar] [CrossRef]
- Li, X.; Wang, J.; Xie, D.; Xu, J.; Xia, Y.; Xiang, L.; Komarneni, S. Reduced graphene oxide/MoS2 hybrid films for room-temperature formaldehyde detection. Mater. Lett. 2017, 189, 42–45. [Google Scholar] [CrossRef]
- Abdel Maksoud, M.I.A.; Bedir, A.G.; Bekhit, M.; Abouelela, M.M.; Fahim, R.A.; Awed, A.S.; Rooney, D.W. MoS2-based nanocomposites: Synthesis, structure, and applications in water remediation and energy storage: A review. Environ. Chem. Lett. 2021, 19, 3645–3681. [Google Scholar] [CrossRef]
- Bello, I.T.; Oladipo, A.O.; Adedokun, O.; Dhlamini, S.M. Recent advances on the preparation and electrochemical analysis of MoS2-based materials for supercapacitor applications: A mini-review. Mater. Today Commun. 2020, 25, 101664. [Google Scholar] [CrossRef]
- Ismail, K.B.M.; Arun Kumar, M.; Mahalingam, S.; Kim, J.; Atchudan, R. Recent advances in molybdenum disulfide and its nanocomposites for energy applications: Challenges and development. Materials 2023, 16, 4471. [Google Scholar] [CrossRef]
- Zheng, L.; Xing, T.; Ouyang, Y.; Wang, Y.; Wang, X. Core-shell structured MoS2@Mesoporous hollow carbon spheres nanocomposite for supercapacitors applications with enhanced capacitance and energy density. Electrochim. Acta 2019, 298, 630–639. [Google Scholar] [CrossRef]
- Wang, L.; Liu, F.; Zhao, B.; Ning, Y.; Zhang, L.; Bradley, R.; Wu, W. Carbon nanobowls filled with MoS2 nanosheets as electrode materials for supercapacitors. ACS Appl. Nano Mater. 2020, 3, 6448–6459. [Google Scholar] [CrossRef]
- da Silveira Firmiano, E.G.; Rabelo, A.C.; Dalmaschio, C.J.; Pinheiro, A.N.; Pereira, E.C.; Schreiner, W.H.; Leite, E.R. Supercapacitor electrodes obtained by directly bonding 2D MoS2 on reduced graphene oxide. Adv. Energy Mater. 2014, 4, 1301380. [Google Scholar] [CrossRef]
- Chen, P.S.; Hu, Y.; Li, S.Y.; Mazurkiewicz-Pawlicka, M.; Małolepszy, A. Preparation of a MoS2/carbon nanotube nanocomposite by hydrothermal method for supercapacitor. Int. J. Electrochem. Sci. 2024, 19, 100523. [Google Scholar] [CrossRef]
- Das, R.; Panda, S.N. Preparation and applications of biocharbased nanocomposite: A review. J. Anal. Appl. Pyrolysis 2022, 167, 105691. [Google Scholar] [CrossRef]
- Zhao, G.; Cheng, Y.; Sun, P.; Ma, W.; Hao, S.; Wang, X.; Liu, M. Biocarbon based template synthesis of uniform lamellar MoS2 nanoflowers with excellent energy storage performance in lithium-ion battery and supercapacitors. Electrochim. Acta 2020, 331, 135262. [Google Scholar] [CrossRef]
- Sangeetha, D.N.; Selvakumar, M. Active-defective activated carbon/MoS2 composites for supercapacitor and hydrogen evolution reactions. Appl. Surf. Sci. 2018, 453, 132–140. [Google Scholar] [CrossRef]
- Khandare, L.N.; Late, D.J.; Chaure, N.B. MoS2 nanobelts-carbon hybrid material for supercapacitor applications. Front. Chem. 2023, 11, 1166544. [Google Scholar] [CrossRef] [PubMed]
- Mahajan, H.; Mohanan, K.U.; Cho, S. Facile synthesis of biocarbon-based MoS2 composite for high-performance supercapacitor application. Nano Lett. 2022, 22, 8161–8167. [Google Scholar] [CrossRef]
- Wang, F.; Ma, J.; Zhou, K.; Li, X. MoS2/corncob-derived activated carbon for supercapacitor application. Mater. Chem. Phys. 2020, 244, 122215. [Google Scholar] [CrossRef]
- Yang, Z.; Xing, R.; Zhou, W.; Zhu, L. Adsorption characteristics of ciprofloxacin onto g-MoS2 coated biochar nanocomposites. Front. Environ. Sci. Eng. 2020, 14, 1–10. [Google Scholar] [CrossRef]
- Zhu, J.; Yan, L.; Li, X.; Song, W.; Yan, T.; Li, Y. Ball-milled MoS2/biochar as peroxymonosulfate activator efficiently removes tetracycline: Multiple active sites-triggered radical/non-radical pathways. Ind. Crops Prod. 2023, 205, 117450. [Google Scholar] [CrossRef]
- Zhu, H.; Tan, X.; Tan, L.; Chen, C.; Alharbi, N.S.; Hayat, T.; Wang, X. Biochar derived from sawdust embedded with molybdenum disulfide for highly selective removal of Pb2+. ACS Appl. Nano Mater. 2018, 1, 2689–2698. [Google Scholar] [CrossRef]
- Khan, Z.H.; Gao, M.; Qiu, W.; Song, Z. Mechanism of novel MoS2-modified biochar composites for removal of cadmium (II) from aqueous solutions. Environ. Sci. Pollut. Res. 2021, 28, 34979–34989. [Google Scholar] [CrossRef]
- Gusain, R.; Kumar, N.; Fosso-Kankeu, E.; Ray, S.S. Efficient removal of Pb (II) and Cd (II) from industrial mine water by a hierarchical MoS2/SH-MWCNT nanocomposite. ACS Omega 2019, 4, 13922–13935. [Google Scholar] [CrossRef] [PubMed]
- Tomy, M.; Anu, M.A.; Xavier, T.S. Effect of chemical exfoliation on the specific capacitance of MoS2 decorated conducting polymer electrodes for supercapacitor applications. Appl. Phys. A 2023, 129, 818. [Google Scholar] [CrossRef]
- Jawaid, A.; Nepal, D.; Park, K.; Jespersen, M.; Qualley, A.; Mirau, P.; Vaia, R.A. Mechanism for liquid phase exfoliation of MoS2. Chem. Mater. 2016, 28, 337–348. [Google Scholar] [CrossRef]
- Gan, X.; Zhao, H.; Wong, K.Y.; Lei, D.Y.; Zhang, Y.; Quan, X. Covalent functionalization of MoS2 nanosheets synthesized by liquid phase exfoliation to construct electrochemical sensors for Cd (II) detection. Talanta 2018, 182, 38–48. [Google Scholar] [CrossRef]
- Ma, H.; Ben, S.; Shen, Z.; Zhang, X.; Wu, C.; Liao, S.; An, F. Investigating the exfoliation behavior of MoS2 and graphite in water: A comparative study. Appl. Surf. Sci. 2020, 512, 145588. [Google Scholar] [CrossRef]
- Eltaweil, A.S.; Abdelfatah, A.M.; Hosny, M.; Fawzy, M. Novel biogenic synthesis of a Ag@ Biochar Nanocomposite as an antimicrobial agent and photocatalyst for methylene blue degradation. ACS Omega 2022, 7, 8046–8059. [Google Scholar] [CrossRef]
- Li, M.; Zhang, A.; Wu, H.; Liu, H.; Lv, J. Predicting potential release of dissolved organic matter from biochars derived from agricultural residues using fluorescence and ultraviolet absorbance. J. Hazard. Mater. 2017, 334, 86–92. [Google Scholar] [CrossRef]
- Al-Mashat, L.; Shin, K.; Kalantar-Zadeh, K.; Plessis, J.D.; Han, S.H.; Kojima, R.W.; Wlodarski, W. Graphene/polyaniline nanocomposite for hydrogen sensing. J. Phys. Chem. C 2010, 114, 16168–16173. [Google Scholar] [CrossRef]
- Lee, C.; Yan, H.; Brus, L.E.; Heinz, T.F.; Hone, J.; Ryu, S. Anomalous lattice vibrations of single-and few-layer MoS2. ACS Nano 2010, 4, 2695–2700. [Google Scholar] [CrossRef]
- Mahdavi, M.; Kimiagar, S.; Abrinaei, F. Preparation of few-layered wide bandgap MoS2 with nanometer lateral dimensions by applying laser irradiation. Crystals 2020, 10, 164. [Google Scholar] [CrossRef]
- Kandhasamy, D.M.; Muthu Mareeswaran, P.; Chellappan, S.; Namasivayam, D.; Aldahish, A.; Chidambaram, K. Synthesis and photoluminescence properties of MoS2/graphene heterostructure by liquid-phase exfoliation. ACS Omega 2021, 7, 629–637. [Google Scholar] [CrossRef] [PubMed]
- Castellanos-Gomez, A.; van der Zant, H.S.; Steele, G.A. Folded MoS2 layers with reduced interlayer coupling. Nano Res. 2014, 7, 572–578. [Google Scholar] [CrossRef]
- Shapira, K.; Zucker, I. Emerging investigator series: Molybdenum disulfide-enabled activated carbon-a multifunctional adsorbent for practical water treatment applications. Environ. Sci. Nano 2022, 9, 477–488. [Google Scholar] [CrossRef]


| Samples | Excitonic Peaks (nm) | |||
|---|---|---|---|---|
| A | B | C | D | |
| Bulk MoS2 | 690 | 632 | 507 (Unresolved single broad peak) | |
| Pristine MoS2 NSs | 681 | 620 | 468 | 405 |
| MoS2/BC1 | 679 | 619 | 466 | 403 |
| MoS2/BC2 | 679 | 619 | 457 | 402 |
| MoS2/BC3 | 674 | 612 | 453 | 393 |
| Samples | Rct (Ω) | Rs (Ω) |
|---|---|---|
| Bulk MoS2 | 2.05 | 14.03 |
| Pristine MoS2 NSs | 1.80 | 13.95 |
| Bulk BC | 1.54 | 11.65 |
| Pristine BC | 1.30 | 11.59 |
| MoS2/BC1 | 1.19 | 11.48 |
| MoS2/BC2 | 1.01 | 10.71 |
| MoS2/BC3 | 0.7 | 8.06 |
| Scan Rate (mVs−1) | Specific Capacitance (F/g) | ||
|---|---|---|---|
| Pristine MoS2 NSs | Pristine BC | MoS2/BC3 NC | |
| 100 | 14.89 | 21.56 | 22.8 |
| 80 | 15.83 | 20.83 | 23.5 |
| 60 | 17.03 | 21.85 | 25.5 |
| 40 | 19.44 | 25.0 | 28.5 |
| 20 | 25.56 | 31.11 | 34 |
Disclaimer/Publisher’s Note: The statements, opinions and data contained in all publications are solely those of the individual author(s) and contributor(s) and not of MDPI and/or the editor(s). MDPI and/or the editor(s) disclaim responsibility for any injury to people or property resulting from any ideas, methods, instructions or products referred to in the content. |
© 2024 by the authors. Licensee MDPI, Basel, Switzerland. This article is an open access article distributed under the terms and conditions of the Creative Commons Attribution (CC BY) license (https://creativecommons.org/licenses/by/4.0/).
Share and Cite
Pandiselvi, T.; Praveena, C.; Sridevi, V.; Venmathi Maran, B.A.; Kimura, M. Synergistic Effect in MoS2 Nanosheets–Biochar Nanocomposites with Enhanced Surface Area and Electrical Conductivity for Energy Storage Applications. J. Compos. Sci. 2024, 8, 357. https://doi.org/10.3390/jcs8090357
Pandiselvi T, Praveena C, Sridevi V, Venmathi Maran BA, Kimura M. Synergistic Effect in MoS2 Nanosheets–Biochar Nanocomposites with Enhanced Surface Area and Electrical Conductivity for Energy Storage Applications. Journal of Composites Science. 2024; 8(9):357. https://doi.org/10.3390/jcs8090357
Chicago/Turabian StylePandiselvi, Thangaraj, Chithiraiselvan Praveena, Venkatachalam Sridevi, Balu Alagar Venmathi Maran, and Masanari Kimura. 2024. "Synergistic Effect in MoS2 Nanosheets–Biochar Nanocomposites with Enhanced Surface Area and Electrical Conductivity for Energy Storage Applications" Journal of Composites Science 8, no. 9: 357. https://doi.org/10.3390/jcs8090357