Article

In Situ Microscopy of Fatigue-Loaded Embedded Transverse Layers of Cross-Ply Laminates: The Role of an Inhomogeneous Fiber Distribution

by
Andreas Baumann
*,
Miro Duhovic
and
Joachim Hausmann
Leibniz-Institut für Verbundwerkstoffe GmbH, 67663 Kaiserslautern, Germany
*
Author to whom correspondence should be addressed.
J. Compos. Sci. 2024, 8(9), 366; https://doi.org/10.3390/jcs8090366
Submission received: 31 July 2024 / Revised: 5 September 2024 / Accepted: 13 September 2024 / Published: 18 September 2024
(This article belongs to the Special Issue Feature Papers in Journal of Composites Science in 2024)

Abstract

:
Composites with continuous fiber reinforcement offer excellent fatigue properties but are tedious to characterize due to anisotropy and the interplay of fatigue properties, processing conditions, and the constituents. The global fiber volume content can affect both monotonic and fatigue strength. This dependence can increase the necessary testing effort even when processing conditions and constituents remain identical. This work presents an in situ edge observation method, enabling light microscopy during loading. As a result, digital image correlation can be employed to study local strains at cracking sites on the scale of fiber bundles. The geometric influence on fatigue damage is examined in non-crimp fabrics of glass and carbon fibers. Two epoxy resins (one modified by irradiation) are investigated to verify the geometric influence under changed polymer properties. The microscopy-based image correlation revealed that damage forms at very low global strains of only 0.2–0.3% in glass fiber-reinforced epoxy laminates. For carbon fiber-reinforced epoxy, laminate cracking was found to emanate mainly from regions containing stitching fibers. Across both reinforcements, irradiation treatment led to delayed cracks, emanating from interfaces. This detailed analysis of the damage formation is used as a basis for proposed applications of the in situ strain information.

Graphical Abstract

1. Introduction

Continuous fiber reinforced materials offer high mechanical potential and can be perfectly tailored to add material and strength where they are needed. The wind energy sector utilizes these materials known for their high specific fatigue strength and durability in harsh conditions, often in the form of non-crimp fabrics (NCFs) with epoxy as matrix polymer. NCF materials are favored for their good permeability during the infusion process, leading to a faster and more cost-effective production [1]. However, a major challenge is that a lot of the fatigue performance of these materials depends on the manufacturing method and the constituents used [1]. An example of this is the use of different polymers leading to differences in damage initiation and propagation, even in fiber-dominated on-axis tension–tension loading [2]. Off-axis loading takes on a special role during damage initiation and is frequently found in cross-ply or multiaxial laminates. Many quasi-static failure criteria employ a ply-by-ply analysis for failure prediction [3,4]. This approach is frequently transferred to fatigue loading as well [5]. The experimental basis is in most cases a transfer from the ply-based experimental database to the component level; however, embedding effects like increased in situ strength [6] and damage interaction pose a problem [5]. In addition, the dependence of composite properties on the manufacturing method often makes it challenging to estimate the validity of this transfer if different manufacturing methods are employed. For example, this is the case when a filament wound component needs to be analyzed but instead coupon specimens prepared by resin transfer molding (RTM) are used for the characterization. As shown by Endruweit et al. [7] and Zaami et al. [8], differences in fiber distributions can arise just from varied processing parameters, even if processing and constituents are unchanged. An example of this is the varying fiber volume fraction (FVF) distribution in RTM manufactured plates as a result of compaction [7]. If the latter is high, the FVF distribution will become more non-uniform throughout the thickness during the process and may stay that way if insufficient time is given for the reinforcement material to relax and if fast-reacting resins are used. Similar effects could also arise if different tape thicknesses are used along the thermoplastic processing route [8]. These factors will affect scattering within a given characterization series but also within the component. Some investigators concentrated on the impact of varying FVFs on the fatigue performance of transversely loaded plies [9,10,11,12,13]. The effect of global variations in FVF depends on the loading case as well as on the loading direction relative to the reinforcement. Mortensen et al. [11] found that the global FVF affects the fatigue performance of on-axis-loaded glass fiber-reinforced (non-crimp fabric) laminate across different loading ratios. Besides the FVF, the authors also suspected the fiber distribution and porosity to be important factors as well. Their analysis of the local fiber distribution found that the globally changed FVF can only partly be attributed to an increasing FVF within the fiber bundles and is also attributed to smaller resin pockets. Other investigations [9,12] found a detrimental effect of low fiber contents on the quasi-static and fatigue strength of transversely loaded carbon fiber-reinforced laminates. To the author’s knowledge, the fiber distribution is currently not explicitly accounted for in most characterization campaigns.
To address this aspect, one strategy could be to prepare experimental data using a series of coupon specimens that adequately capture the scattering within the component. These specimens should reflect the manufactured laminate of the component, representing areas with different fiber–matrix arrangements. This approach acknowledges that even within a single component or material source (e.g., tape of varying thicknesses), multiple laminate properties can arise. Representative sampling thereby accounts for the close relationship between design, manufacturing, and resulting properties and leads to more scattering. This approach is taken by the wind energy sector [1]. The associated values used as design allowable are accordingly lower. However, the transverse isotropy and mean stress sensitivity of the UD-ply already require a substantial amount of fatigue testing, and it is questionable if an extension to additional parameters is still within typical cost and time constraints. Furthermore, all UD properties remain system-specific, and changes are hard to transfer between systems.
An alternative approach would be the determination of knock-down factors specific to a given arrangement and the determination of a system’s (particular combination of constituents) intrinsic strength. Differences in manufacturing can then be accounted for by estimating the local geometric arrangement and subsequently modifying the design allowable used in the failure condition. As process simulation capabilities improve and efforts to generate digital twin information on material properties such as local fiber orientation and FVF distribution advance, this approach is expected to become increasingly accessible.
Currently, material properties such as local fiber orientation and volume fraction distribution are captured using non-destructive testing techniques such as X-ray computed tomography (CT). The analysis is then carried out via digital image processing. This type of analysis is usually performed on volume specimens extracted from the final part. In another approach, and in an attempt to bypass the costly and time consuming CT scans, the material properties of the prepreg material in production can be captured using efficient machine vision-based optical methods [14]. The information captured here provides the correct input data for process simulations, which can then provide structural simulations with more enhanced manufacturing-induced properties. Simulation models nowadays allow for the “mapping” of material and manufacturing-induced properties (such as fiber orientation and FVF distributions) to various levels of detail depending on the computing resources available. Typically, however, it is still common practice today to “homogenize” material properties and ignore many of the material properties, which should perhaps be taken into account.
Different techniques can be used to identify failure locations within transverse plies during the fatigue test. One common approach for transparent laminates is front- and backlight illumination [15,16,17,18]. For carbon fiber-reinforced laminates, X-ray imaging [19] and edged observation [20,21] are alternative methods to identify transverse cracking. A common benefit of the in situ observation of cracks is that it enables fatigue analysis up to the point of final failure, including all phases of fatigue damage growth. The onset of cracking is to some degree also identifiable by a knee-point in the stress–strain response of multiaxial laminates [22,23]. This relationship between cracking and laminate stiffness is a commonly used indicator of fatigue damage [15,17,21,23]. By combining the aforementioned techniques, a clear sequence of damage formation has been established: it begins with transverse cracking, progress to crack saturation up to the characteristic damage state, delamination initiation, and ultimate fracture [18,21,24]. Through a combination of stiffness degradation, observation techniques, and modelling [25,26], the fiber–matrix interface has been identified as the most likely damage initiation zone under transverse loading. Zhuang et al. [27] demonstrated through numerical modelling that a crack likely jumps between neighboring fiber–matrix interfaces, further emphasizing the importance of the fiber–matrix interface in crack propagation within the transverse ply.
The aim of this research is to implement a procedure to identify critical damage sites during the fatigue loading of transversely loaded plies during the early stages of fatigue life. Secondly, the method is employed to identify the geometric effect on the failure initiation. Finally, potential applications of the in situ failure strains are proposed. The primary focus is on pure transverse loading and inter-fiber failure (IFF1) [4].

2. Materials and Methods

2.1. Materials

For this investigation, two types of plates with a nominal thickness of 2 mm were prepared by RTM. The underlying epoxy resin was Epikote RIMR 135, cured with Epicure RIMH 137 sourced from Westlake, Houston, TX, USA. The plates were cured for 4 h at 80 °C. As reinforcement, non-crimp fabrics (NCF) of carbon and glass fibers from HP-Textiles GmbH, Schapen Germany were used. The unidirectional fabrics had an aerial weight of 200 g/m2 for the HT-carbon fibers and 402 g/m2 for the E-glass fibers. In order to ensure similar fiber contents for both types of reinforcement, the glass fiber reinforced plates used a [0/902]s lay-up, while the carbon fiber-reinforced plates used a [0/903]s lay-up. The nominal FVF of both laminates were 48% and 45%, respectively. In addition, plates without reinforcement were prepared with identical processing parameters.

2.2. Specimen Preparation

Rectangular specimens of 250 × 20 × 2 mm3 were prepared from the plates using a water-cooled diamond saw, with the middle plies oriented orthogonal to the specimen axis. After cutting the specimens, one of the edges was ground to P4000 (5 µm) using silicon carbide grinding paper. The relatively thick layer of transversely loaded plies was used to generate transverse cracks spanning the complete width of the specimen, as suggested by the results in [17,18,19]. In this way, edge observation should be representative of the entire specimen’s width. This is because with the increasing thickness of the transverse plies cracks will extend across the full thickness of the ply and the width of the specimen once they begin to form. Pakkam Gabriel et al. [17] argue that this effect might be explained by the relation of necessary crack initiation stresses relative to the necessary energy for crack propagation. In any case, thick transverse plies help to mitigate differences between the crack density observed from the specimen’s edge compared to a full three-dimensional analysis. Of course, it must be acknowledged that this is only valid for typical specimen thicknesses employed in coupon specimen testing (width of 10 to 25 mm) or otherwise a fracture mechanical analysis must be employed to describe extended crack growth phases. No tabs in the load introduction section of the specimens were used because loads were deemed low enough to avoid clamping failure. Furthermore, additional elements within the load path can easily introduce asymmetries, e.g., partially debonded tabs.
To evaluate how much failure locations vary between different polymer properties but identical geometric arrangements, irradiation treatment was employed to modify the matrix polymer. Furthermore, the changes to the matrix polymer were identical across both reinforcements, allowing for a direct comparison between the two reinforcement materials. High-energy radiation mainly affects the matrix polymer rather than any of the other constituents like the fibers or the fiber–matrix interface. Cobalt-60 is used as the irradiation source, with a dose rate of 3–5 kGy/h. Two dose settings per laminate, 0 and 500 kGy, were investigated. In addition, neat polymer specimens were processed identically. Therefore, each reinforcement type and non-reinforced material was characterized in two configurations (irradiated and non-irradiated). The neat polymer specimen preparation is described in an earlier publication [28].

2.3. In Situ Microscopy

Edge observation by a microscope has already proven to be a useful method to study damage onset and propagation in fatigue tests [20,21]. Typically, documentation is intermittently performed by stopping the test to find the earlier documented observation area. Although damage can be observed in this way, it is often not possible to observe the specimen during changing loads because the field of view (FOV) and the depth of view are typically very limited for higher-magnification microscopes. A limited field of view becomes problematic when a single-actuator testing machine is employed because the specimen’s deformation will move the region of interest (ROI) relative to the FOV of the microscope (see Figure 1a). A two-actuator system could solve the problem because the specimen’s elongation can be compensated by moving both actuators in a way that the ROI and FOV keep their relative positions, as depicted in Figure 1b. A downside of the two-actuator system is the complexity of controls and the excessive equipment necessary for a single-axis testing machine. Within this work, the following mechanism shown schematically in Figure 1c was developed, which overcomes the limitations of a fixed camera set-up but avoids a second actuator.
The pantograph-type mechanism is inspired by pre-CNC machines used for engraving. By mounting the microscope to a set of rods with a defined length, the microscope moves relative to the actuator’s movement, mainly in the direction of specimen elongation. However, the mechanism also follows movement transverse to the loading direction (x in Figure 1). The latter movement is typically only encountered when some asymmetries in the load path exist, e.g., angular difference between the specimen axis and the axis of the linear actuator. By choosing the length of the rods (Lrod) accordingly, it is possible to set the microscope’s movement, d 1 for example, to half that of the actuator’s displacement, (specimen elongation) d 2 (point M in Figure 1), for both components of the displacement vector (vertical y and horizontal x). In this way, the in situ observation of the transversely loaded ply via the polished edges of the specimen becomes possible. The final set-up used is shown in Figure 2. The mechanism enables the observation of a significant portion of the specimen’s edge during loading because the ROI and the FOV move in synchronicity. Unfortunately, preliminary tests indicated that slight asymmetries within the specimen or the wedge action clamps led to lateral movement of the specimens in the thickness direction (z in Figure 2). By constraining the specimen’s movement in the z-direction (bracing guide in Figure 2c), this unexpected movement of the ROI relative to the FOV can be suppressed. The constraint in the z-direction had no significant effect on the specimen loading. Furthermore, the pattern of fibers, matrix, and preparation artifacts also allows for the evaluation of local strains by digital image correlation (DIC) in GOM Correlate (vers. 2016). In this way, it becomes possible to investigate the mesoscopic strains within the transverse plies, which were so far only established with SEM imaging systems and in situ loading frames [29]. A high depth of view make SEM imaging systems especially suitable for in situ imaging, with the downsides of miniaturized specimens and long-term use of expensive equipment.
Because the working distance of the developed system is relatively short, slight changes in this distance could introduce errors in the strain readings due to a single-camera set-up. This error can be estimated by the depth of view and the formula provided by Sutton et al. [30]. With a system intrinsic depth of view of 91 µm and a working distance of 34 mm, an apparent strain of up to 0.27% could be measured at the fringes of the sharp image. To compensate for this, the mean strain by DIC is corrected to fit an additional extensometer reading. This assumes that the extensometer reading of the global laminate strain and the average of all local strains measured by the in situ DIC are identical. This aspect is considered despite the capability of the pantograph-type mechanism to follow the actuator’s movement in the x-direction. In a fixed camera set-up (Figure 1a), this would lead to changes in the working distance. Despite this capability of the set-up at hand, slight deviations in the range of micrometers can be expected in the most fundamental way by lateral contraction of the specimen. In addition, small random deviations introduced during the testing sequence are not accounted for because focusing is performed only once before the start of the testing sequence.

2.4. Fatigue Loading

Fatigue tests are carried out on a ElectroForce 3550 Bose Corp., Eden Prairie, MN, USA with a loading frequency of 2 Hz and a load ratio of R = 0.1. The testing frequency is decidedly within the low range (1–25 Hz) recommended by ISO 13003 [31], primarily to protect the apparatus from excessive inertial forces. While slight increases in frequency might be feasible, they are limited by the specimens’ relative compliance, which leads to high displacement amplitudes. During fatigue testing, the stiffness across the observation area is recorded by an extensometer with a measuring length of 50 mm. Although it would be possible to record the specimen’s edge continuously, it was decided to record a quasi-static loading ramp before and after fatigue testing. In addition, the fatigue sequence was intermittently stopped at peak load to record additional frames showing damage progression. In total, 200 images were recorded during the fatigue test, documenting the damage evolution closely. The resulting loading sequence is shown in Figure 3. During the initial loading ramp, images of the specimen’s edge were continuously recorded with 1 fps for in situ strain evaluation. During cyclic loading, a frame at maximum stress was recorded every 500 cycles. The maximum load was chosen for an easier identification of cracks because, as suggested by other researchers, unloaded cracks might close, making it challenging to identify the crack [32,33]. Tests were stopped after 105 cycles because the onset of transverse cracking was the main focus of this investigation. A frame taken before any loading was used as a reference frame (RF in Figure 3) for all DIC evaluations.

2.5. Strain Amplification

An estimation of the strain amplification within the matrix polymer as a function of local stains and FVF can be used to quantify the detrimental effect of an inhomogeneous fiber distribution. Local strain refers to strain resolved on a scale between the ply and the fiber matrix level. These strains are provided by the DIC of the in situ microscopic images. The concept of the inverse rule of mixture (IROM), also known as the Reuss assumption [34], can be used to estimate a strain amplification factor according to Equation (1). Here, the strain amplification factor a ε is given as a function of the polymer’s Em and the fiber’s Ef elastic modulus.
a ε = 1 v f E m E f 1 + 1
Other analytical formulations accounting for the fiber arrangement, instead of analyzing a material stack, yield even higher values for the strain amplification. Equation (2) gives the strain amplification factor for a quadratic fiber arrangement (QFA) [35].
a ε = 1 1 2 π v f   1 E m E f

2.6. Homogenization

With FVF-dependent elastic properties, it also becomes possible to construct an in situ S-N curve based on the observed cracking sites and the local strain. The method of cells formulated by Aboudi [36] was used for this estimation. The fiber properties for E-glass fibers were taken from [35], while the polymer properties are summarized in Table 1 and were measured by quasi-static tensile tests, as detailed in an earlier publication [28]. The in situ S-N curve concept presented in the results, Section 3, was limited by damage initiation within the stitching fibers of the NCF in EP-CF. Because the elastic constant of the polyester stitching fibers was unknown, the in situ S-N curve concept for EP-CF was not attempted.

3. Results

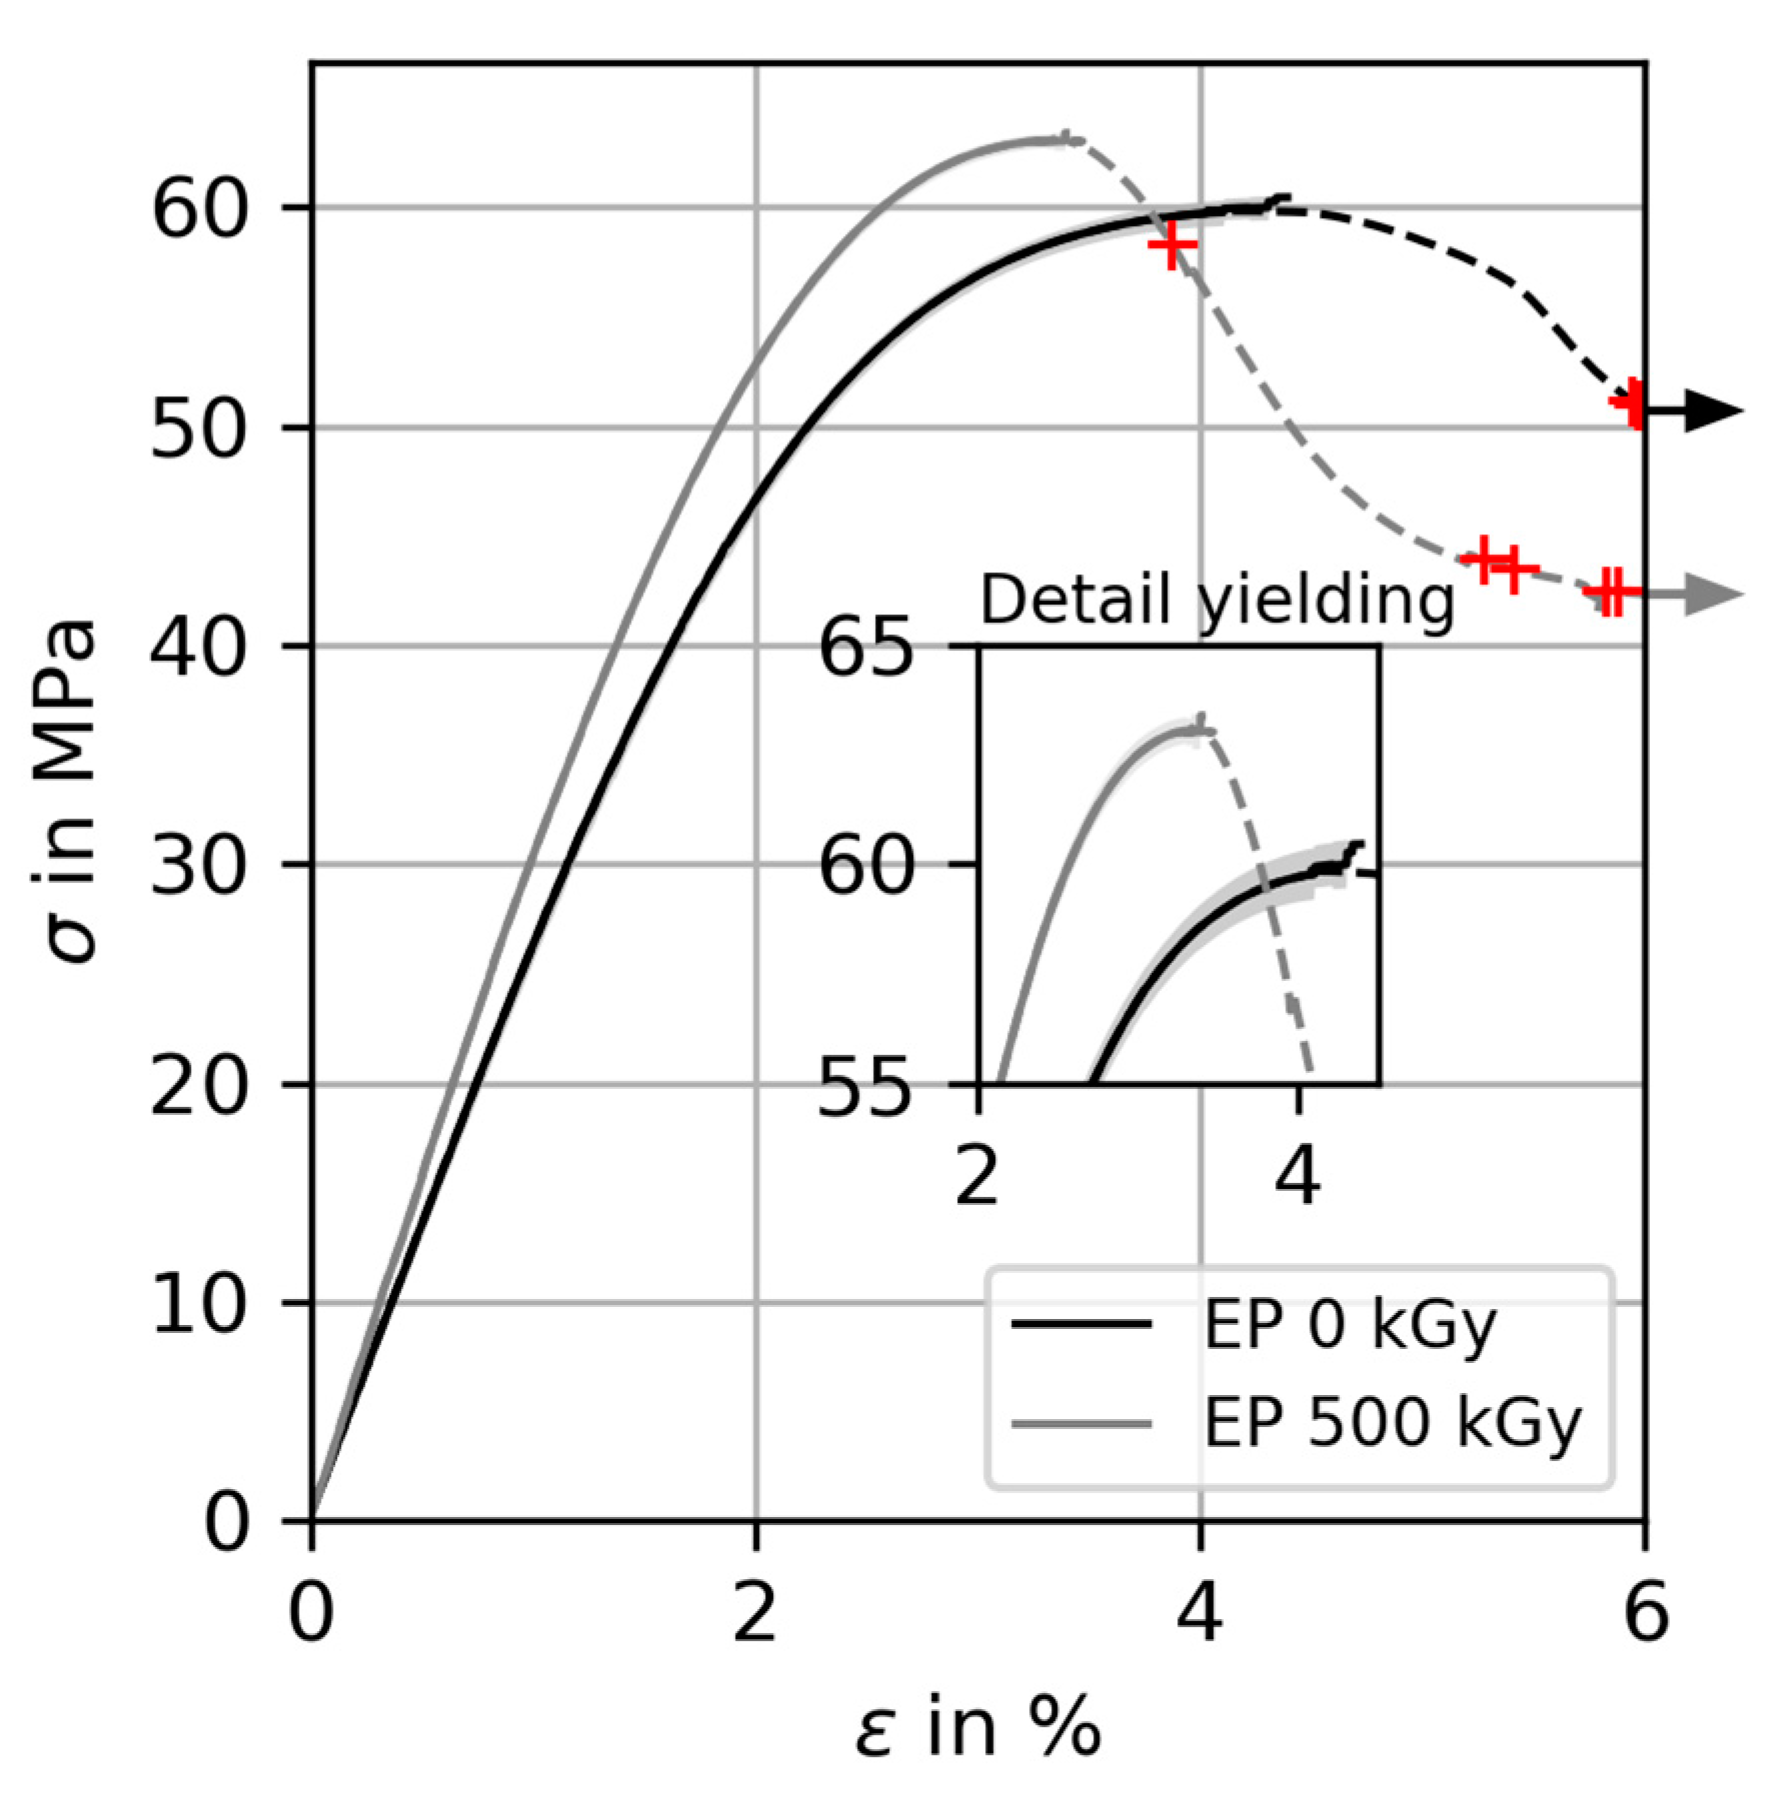
3.1. Neat Epoxy Specimens

Earlier results of the effect of irradiation treatment on the mechanical properties of the particular epoxy resins used within this work revealed that irradiation leads to an increasing elastic modulus and later yielding of the epoxy resin [28]. Figure 4 shows the influence of irradiation treatment on the stress strain response of the neat epoxy resin. Irradiation treatment increases the elastic modulus and yield stress by 17.4% and 5.4%, respectively. Strains are evaluated using DIC up to the yield strength (σmax) and subsequently by cross-head displacement (marked by dashed lines in Figure 4). DIC was used for low strains in order to obtain a high-resolution strain signal up to the yield point. Especially for the irradiated configuration, some of the specimens failed shortly after passing the yield point. These failure points are marked (+) in Figure 4. In addition, it was found that residual stresses decrease due to irradiation treatment [37]. Scattering of the material response is very small, as can be seen from the 99% confidence interval calculated from the stress–strain response up to σmax. Small irregularities at the end of both curves are caused by the different ends (last stress–strain points) of the stress–strain curves used for mean curve calculation.

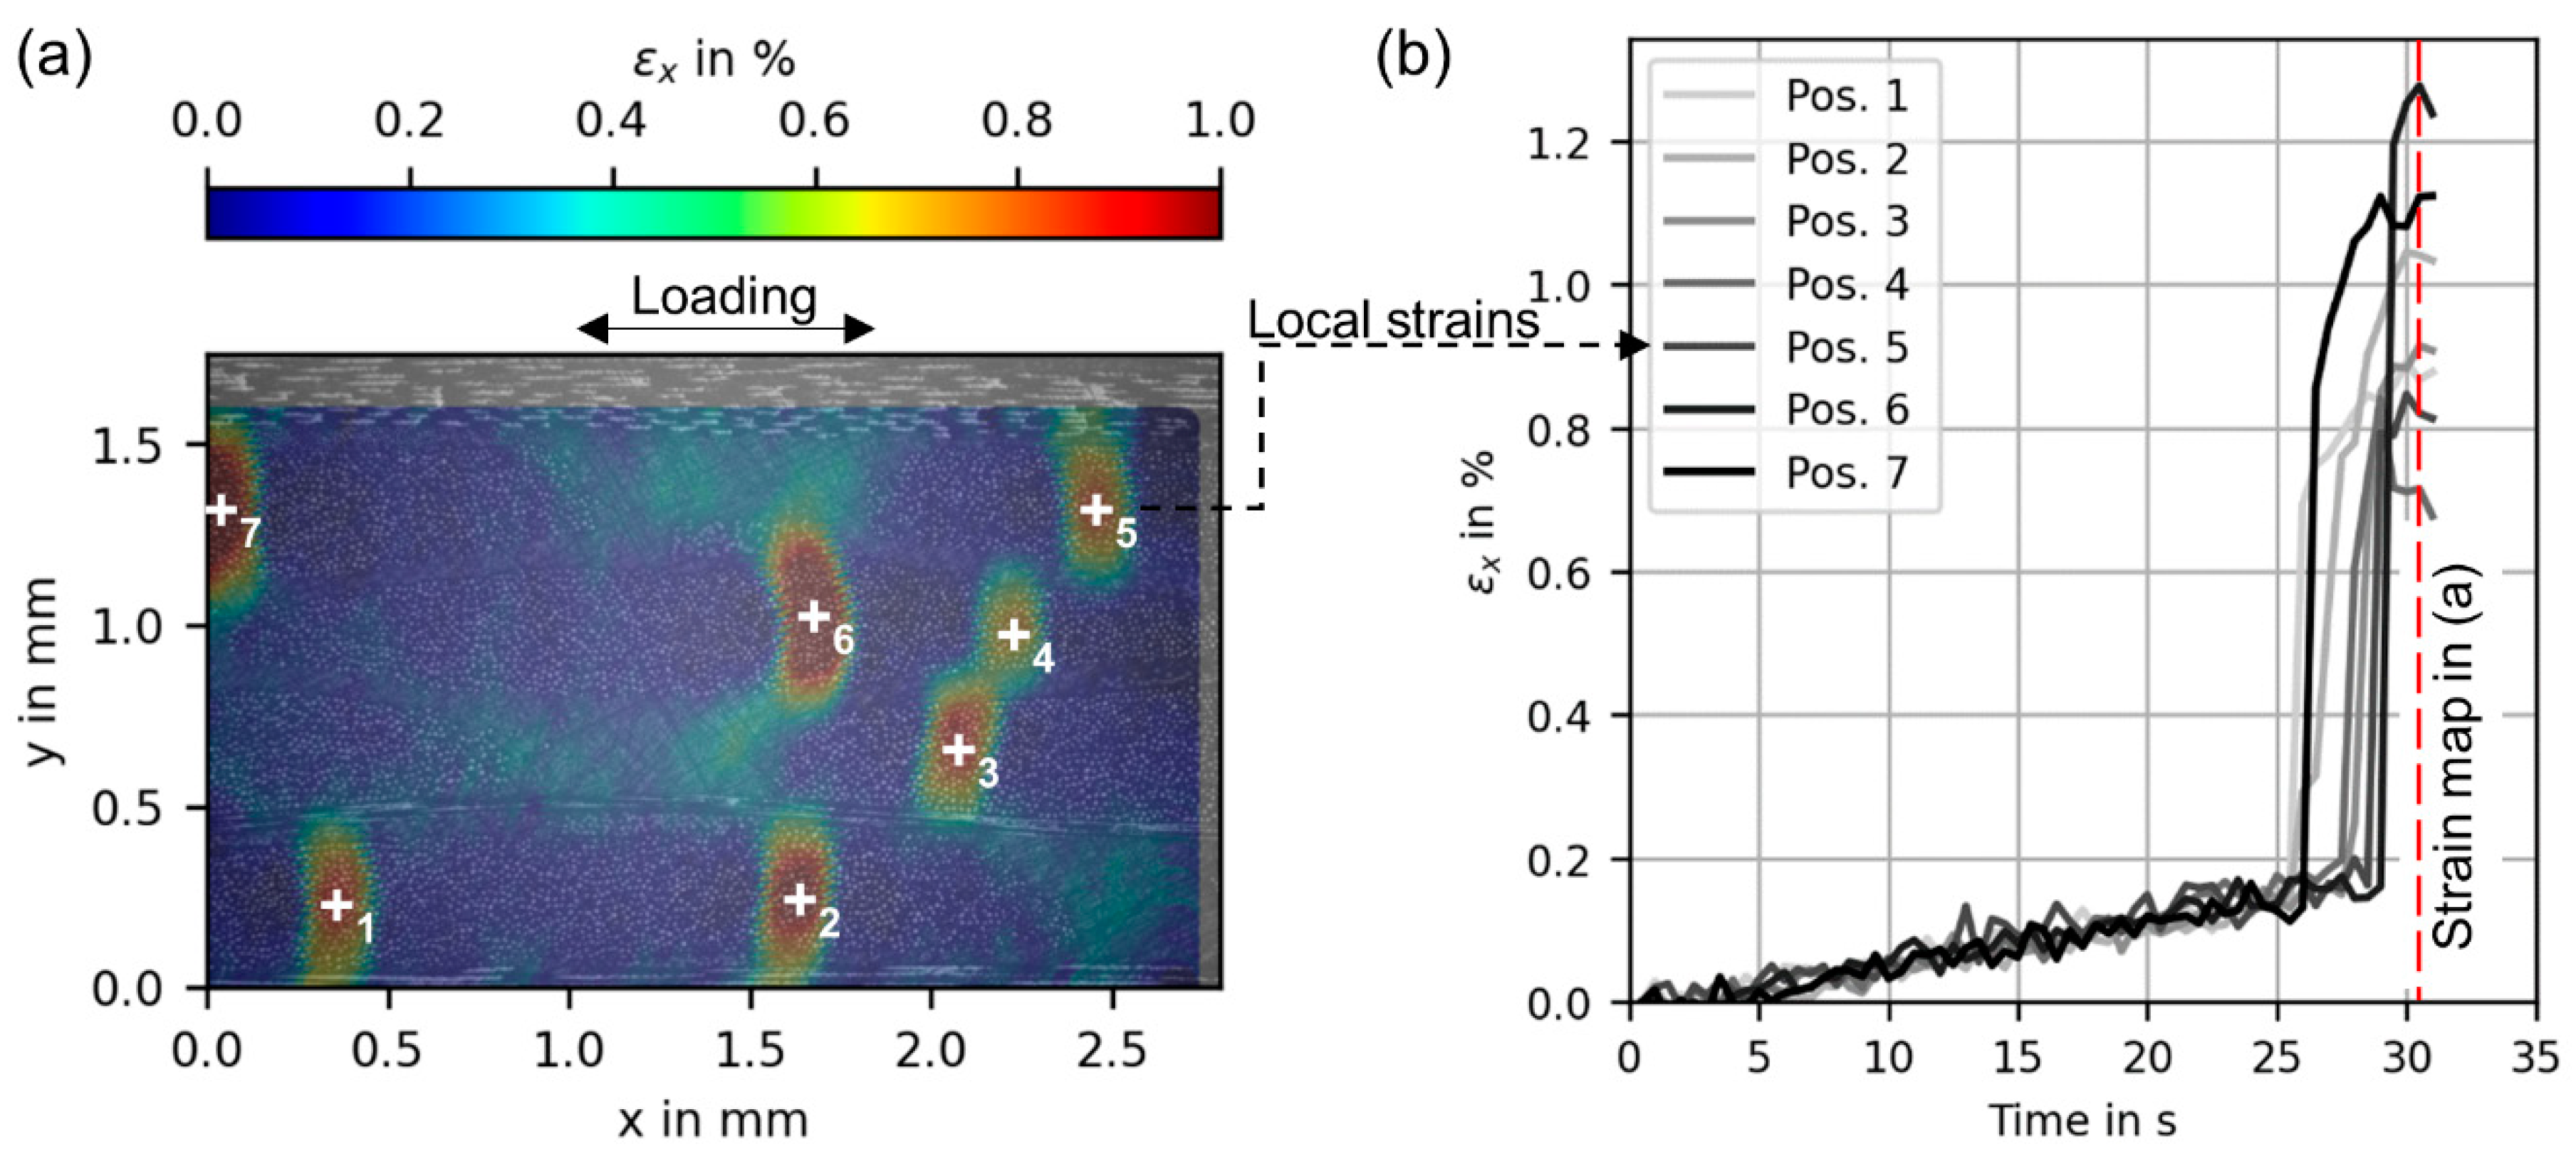
3.2. Glass Fiber-Reinforced Epoxy Laminates

A common load across both irradiation conditions is chosen for a comparative analysis based on three specimens per configuration. The maximum load for EP-GF specimens is 50 MPa, determined from preliminary tests. This load was selected to introduce transverse cracks within 105 cycles but safely avoids preliminary catastrophic failure within the load introduction. This load level results in strains of 0.2–0.3%. A specific feature of EP-GF is that these cracks can only be observed by strain evaluation of the in situ images taken of the transverse plies. This is because cracks form at low laminate strains and, therefore, crack opening displacement is very limited. A detailed analysis of the local strain time signal reveals that the strain hotspots shown in Figure 5a are indeed cracks due to significant strain jumps during first loading (Figure 5b).
In a conventional microscopic analysis of the specimen’s edge after unloading (Figure 6), cracks are only barely visible and only because the strain evaluation of the in situ DIC analysis already suggested cracking sites. Figure 6 shows a highly magnified image of a cracking site in EP-GF taken after the fatigue test. To visualize this crack, additional microsections were prepared. Perfectly matching crack faces indicate low plastic deformation during crack propagation. Instead, cracking mainly takes on the form of coalescing debonds.
It is noteworthy that cracking of this type during the first loading ramp is mainly observable for non-irradiated EP-GF, but not in the irradiated configuration. This is also indicated by a knee-point in the stress strain response recorded by the extensometer ε E x t . shown in Figure 7. As can be seen from Figure 8, no knee-point can be observed for the irradiated configuration. The strains measured by the extensometer are macroscopic strains of the specimens. The onset of cracking evident from the in situ microscopic images is indicated by the symbol ‘×’ in both Figures. The linear regression shows that cracking correlates well with the emergence of non-linear deformation and the knee-point, or the lack of both for irradiated EP-GF. However, a comparison between all three identical specimens in the non-irradiated state (same configuration and stress level) also shows that cracking sometimes starts earlier or is delayed. Here, specimens 1 and 2 especially differ, as depicted in Figure 7.
However, despite nearly no cracks in the first loading cycle of irradiated EP-GF, cracks were delayed and formed during subsequent loading cycles. The cracking sites were consistently within the fiber-rich rovings across both configurations. By selecting a threshold and subsequently binarizing the image, the FVF within the rovings was determined to be 60%, which is locally higher than the global laminate value. This information can be used to evaluate the stresses at the cracking sites from local strains by using the homogenized elastic properties of the UD plies (FVF dependent) of both laminate configurations (irradiated and non-irradiated).
For the case of crack initiation during fatigue loading, a compromise regarding the stress calculation was necessary because errors introduced by significant time differences between the initial reference frame (RF in Figure 3) and subsequent frames were deemed problematic, i.e., 105 cycles (14 h) between the images. Random influences like temperature changes make the DIC strains noisier. Therefore, the strains evaluated by DIC during fatigue loading were used only as an indicator for the onset of cracking. The presence of a crack can be identified by the formation of persistent strain hotspots between the cyclic blocks. The actual strain readings at the cracking sites are then taken from the first loading ramp because random errors are smaller. In this way, the procedure disregards the interaction of closely spaced cracks in terms of strain perturbations extending from an already existing cracking site. By shielding effects and the redistribution of loads, stresses at cracking sites could vary as a result of neighboring cracks. This experience shows that in future investigations, it is necessary to record a video instead of a reference frame after each cyclic block to obtain an individual reference frame per recorded laminate state.
Despite this compromise, it was possible to determine stresses at crack initiation sites during the first loading and, with a resolution of 500 cycles, also during fatigue loading. In this way, it became possible to construct an in situ S-N curve for both configurations of EP-GF. The in situ nature should indicate that the stress leading to transverse cracking is determined from an embedded transversely loaded ply as part of a cross-ply laminate. Figure 9 shows the resulting crack initiation in terms of local maximum stress and lifetime. Because crack initiation is only documented every 500 cycles, it is unknown whether the crack initiates right after the last documentation or just before the next. This is indicated by the error bars in the form of a one-sided uncertainty. The comparison between both configurations (irradiated and non-irradiated) clearly shows a delayed cracking for the irradiated configuration. For the non-irradiated configuration, cracking always occurs during the first load application. However, it must be noted that in both cases the applied loads and local stress intensity are not high enough to propagate the crack through adjacent resin-rich areas.

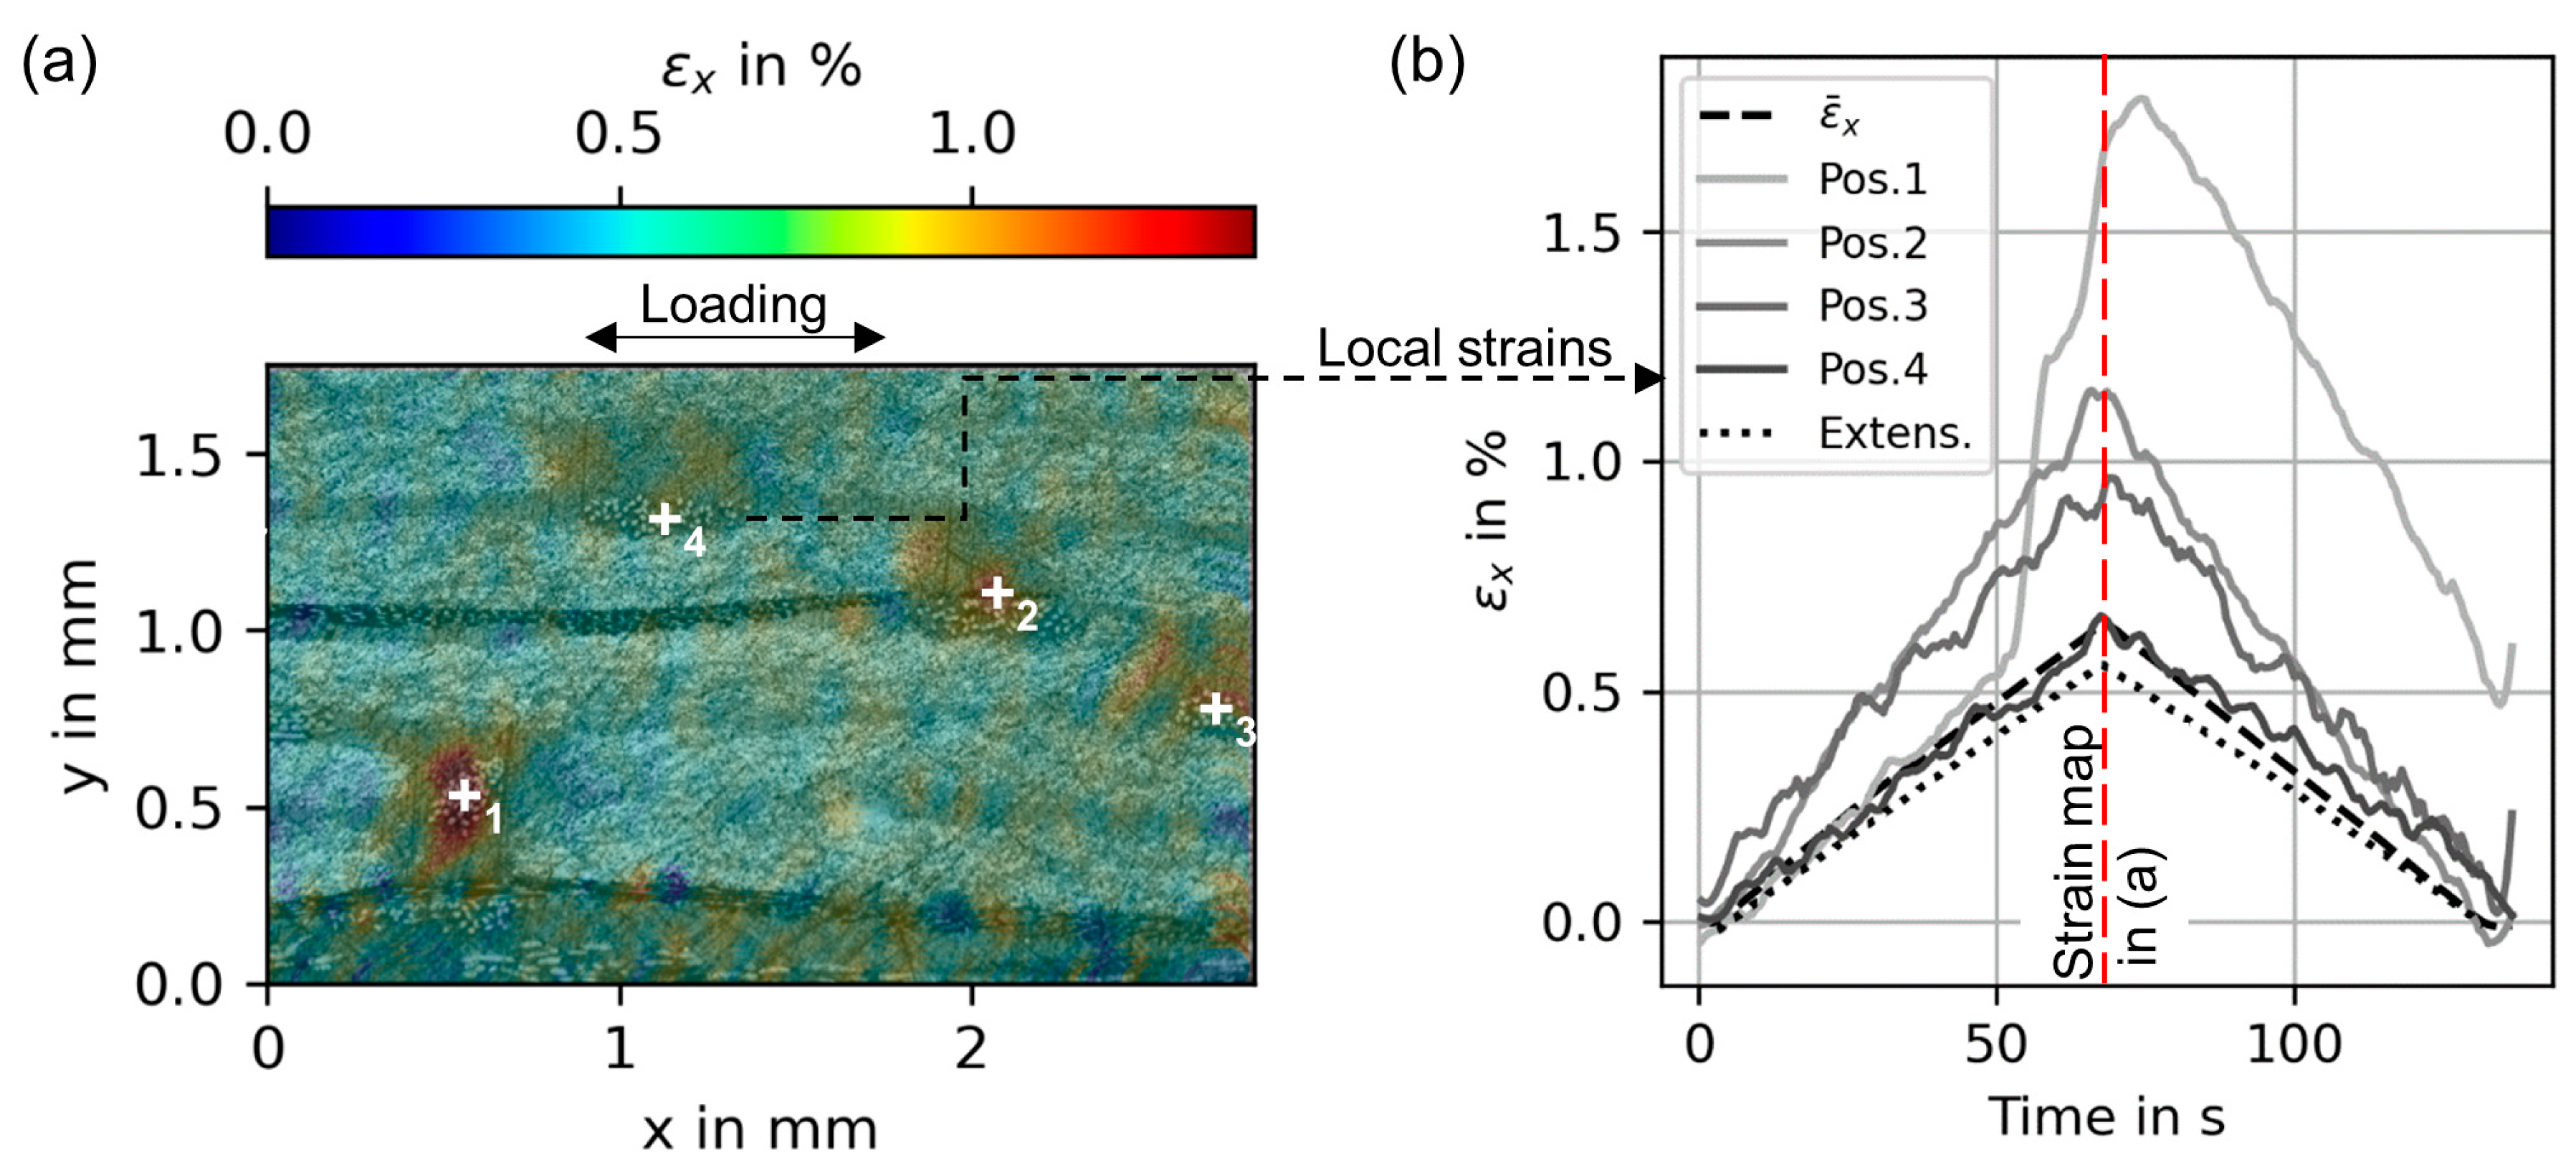
3.3. Carbon Fiber-Reinforced Epoxy Laminates

Similarly to EP-GF, preliminary tests identified a maximum load that introduced transverse cracks while avoiding premature failure. For EP-CF, this was achieved with a load of 180 MPa. The resulting strain was approximately 0.6%. For EP-CF, the results are drastically different because the crack density is much lower compared to EP-GF. Instead of multiple cracks within the observation area, only a single crack is visible in most EP-CF specimens. Another major difference is that cracks mainly initiated within or near stitching fibers in both configurations and rapidly spanned the complete thickness of the transverse ply. Because not much is known about the properties of the polyester stitching fibers of the NCF, it is at first glance unclear if strain peaks in these areas are hinting at a reduced local stiffness (within the transversely loaded plies) or caused by debonding and cracking. A more detailed investigation of the local strains within the areas containing stitching fibers compared to the average global strain shows that some strain peaks also arise during the first loading ramp. However, in contrast to EP-GF, the strain peaks evolve more gradually compared to the jumps in the strain–time signal reported earlier in Figure 5b.
Figure 10a illustrates the strain hotspots (local strains) within the transversely loaded ply for an exemplary specimen in areas containing stitching fibers. From a separately prepared microsection of a cracked specimen, it can be seen that within the stitching there are coalesced debonds, as depicted in Figure 11b. The strain–time signals at these sites are much less clear regarding the onset of debonding, as shown in Figure 10b. The strain at pos. 1 shows a clear jump, whereas pos. 2 and 3 seem to evolve at a higher strain altogether without any sudden change. This phenomenon could be observed across all investigated specimens of both configurations. A detailed study of the NCF reinforcement reveals that interlocking points of the polyester tricot stitching are the most critical locations, especially in this regard. This conclusion is based on the extension of these areas and the shape of the fiber cross-sections found. Figure 11c gives an example of the NCF before impregnation. Additional SEM images of manually fractured specimens reveal that the polyester–epoxy interface indeed shows low adhesion, as seen in Figure 11d. This becomes evident because almost no epoxy resin remains on the surface of the polyester fibers. The strains evaluated by DIC in Figure 10b are not corrected for the influence of the working distance in order to show the magnitude of necessary correction. A comparison of the mean DIC strain (dashed line) and extensometer (dotted line) show that the necessary corrections are far below the prediction calculated by the depth of view and working distance in Section 2.3. For the particular specimen presented in Figure 10b, the strains evaluated by the mean of the in situ DIC are 0.08% above the strain measured by the extensometer. It must be noted that the DIC is limited to an area of 2.8 mm along the specimen’s edge, whereas the extensometer gives the specimen response within a measuring length of 50 mm.
Another difference between EP-CF and the glass fiber-reinforced variants is that cracks are also visible in the unloaded state, which allows for the determination of the crack density after 105 cycles, using stitched microscopic images taken with a Leica DM6 microscope. Crack density is defined as the sum of all crack lengths normalized by the evaluated area (22 mm along the edge × thickness of transverse plies). A second measure of the crack density is the related stiffness degradation. The degradation in the dynamic modulus Eafter after fatigue loading (105 cycles) is normalized to the initial one Einit. The dynamic modulus is calculated from a regression through the extremes within one load cycle. Figure 12 shows the stiffness degradation as a function of the observed crack density. Again, irradiation treatment seems to have a positive effect on transverse cracking. In particular, one specimen (marked “Low” in Figure 12) in the irradiated configuration shows an exceptionally low crack density. This observation is in close agreement with the low stiffness degradation of the particular specimen. Similar results were also found for two additional specimens tested at 160 MPa maximum stress. Here, again, lower crack densities for the irradiated configuration were found with accompanying low stiffness degradation.

4. Discussion

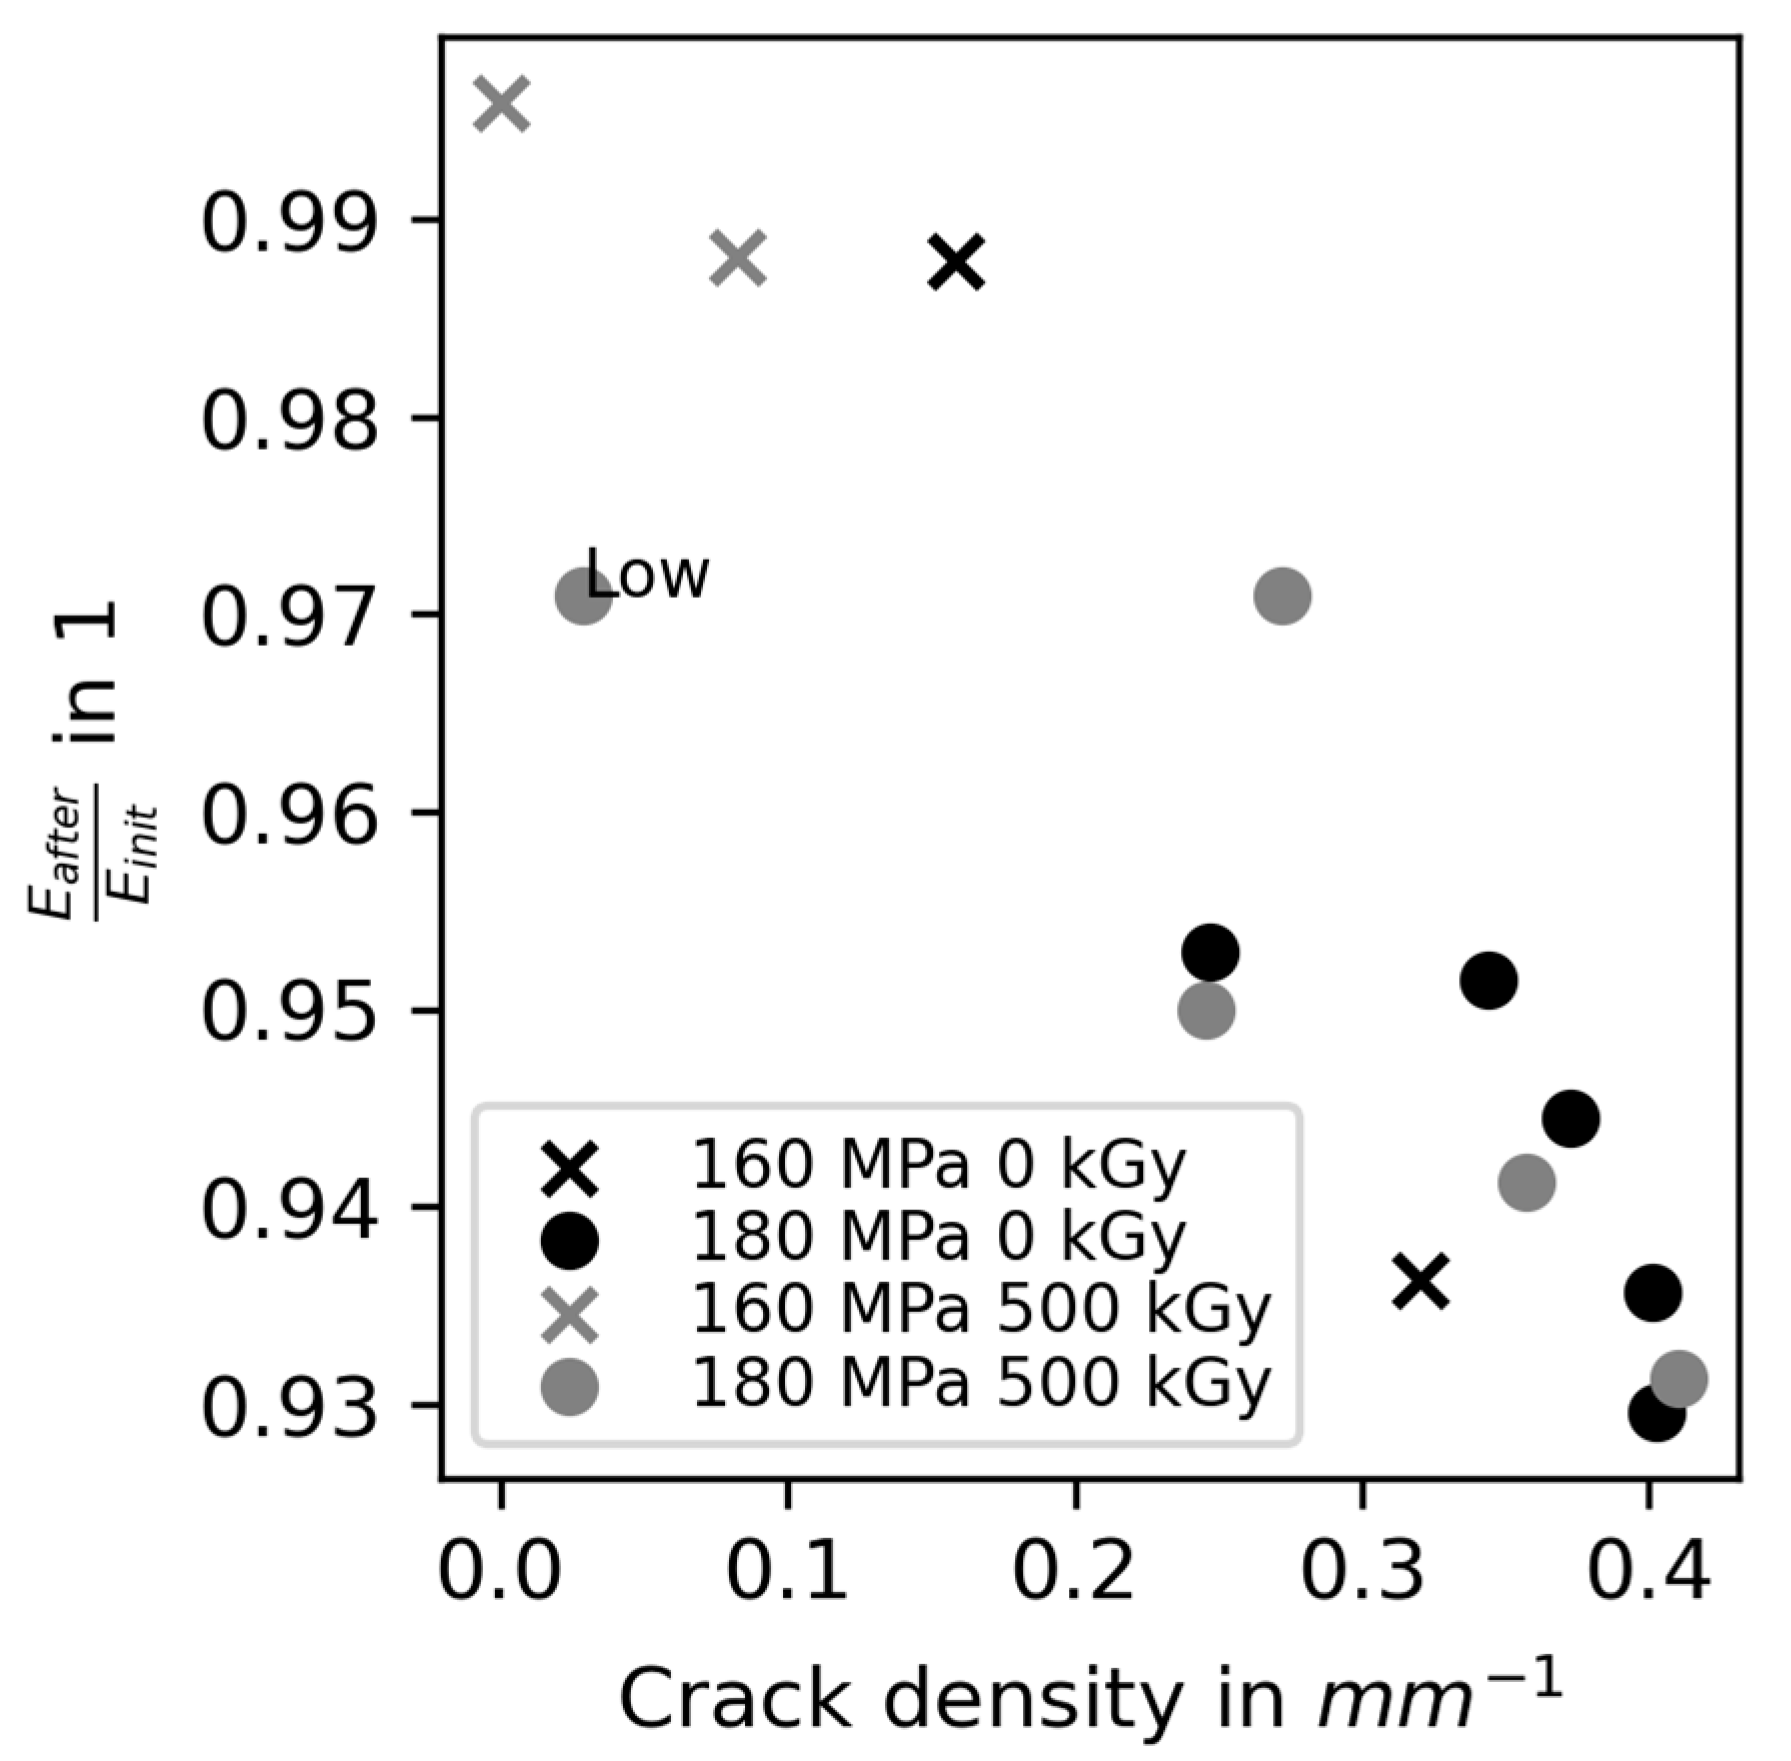
4.1. Damage Evolution

The results for irradiated EP-GF clearly show that cracking is delayed after irradiation treatment. Similarly, some EP-CF specimens showed drastically reduced crack densities. One possible explanation for this could be reduced residual stresses within the laminates after irradiation treatment because it was found that irradiated epoxy can relax by up to 36% due to irradiation treatment. However, the relaxation of residual stresses was also found to scatter more for irradiated epoxy resin [37]. This might explain the extremely low value in terms of crack density for a single EP-CF specimen. Although irradiation treatment also affects the elastic modulus of the resin as well as the yield strength but not the S-N curve of the resin [28], an unaffected S-N curve makes the elastic modulus and the yield stress much less convincing as the explanation for the delayed cracking compared to residual stresses. This is because irradiation treatment increases both the yield strength and the elastic modulus. Higher stiffness and less yielding will most likely increase local stresses within the transverse ply, and stress peaks are unlikely to decrease. Therefore, a delayed cracking within both irradiated laminates (EP-GF and EP-CF) is incompatible with higher stresses within the transverse ply. This makes residual stresses the most likely explanation. A higher crack density and an earlier onset of cracking in terms of strain for the EP-GF compared to the EP-CF can be explained by the higher transverse stiffness of glass fibers compared to carbon fibers (73 and 28 GPa for GF and CF, respectively [35]). This leads to higher strain amplification of the matrix polymer for the glass fiber reinforcement. Furthermore, stitching fibers seem to dictate failure initiation in EP-CF. In this way, crack density might in part be dictated by the spacing of stitching fibers. Therefore, the resulting crack density is a function of two superimposed lifetime distributions. First, the arrangement of epoxy resin and stitching fibers and, second, carbon fibers combined with epoxy resin. Additionally, no difference regarding fiber–matrix adhesion across both laminates and in both states could be found in SEM imaging.
In situ observation of the cracking sites shows that for both reinforcement types failure locations are mostly dictated by the geometric arrangement rather than polymer properties or presumably residual stresses. Evidently, an inhomogeneous fiber distribution as well as auxiliary constituents act as stress concentration factors, leading to cracks in failure-prone fiber-rich areas. Damage concentrated at the interface of the auxiliary stitching fibers in the EP-CF is the most notable difference compared to the EP-GF, where the weakest link is the glass fiber–epoxy interface, despite the presence of stitching fibers. As a consequence, the fiber arrangement and architecture appear to be highly important aspects for the optimized fatigue performance of a laminate. However, all factors comprising the actual system must still be considered, including sources of scattering like the fiber–matrix adhesion and polymer properties. These factors introduce a degree of uncertainty, meaning that while the geometric arrangement can promote potential cracking sites, it does not solely dictate them.

4.2. Strain Evaluation from Microscopic Images

The results show that in situ strain evaluation by DIC based on the intrinsic pattern of fibers and matrix can reveal the true source of early crack onset. An inherent problem when evaluating absolute strains rather than the relative strain concentrations by in situ DIC is that the working distance in a single-camera set-up can influence the strains. Indeed, a deviation between both readings was found across all specimens. The errors, however, were below the estimates considering the depth of view and the working distance. Still, additional improvement in the set-up is necessary to minimize the detrimental influence of different working distances on the DIC reading. The most promising approach is to include a focusing device, which keeps images focused at all times. Here, a usually unwelcome small depth of view would also help, as the changes in working distance leading to rapidly defocused images can be refocused. In general, the occurrence of significant cracking during the first cycle and the limitations of intermittent observation require meticulous data recording during cyclic tests. This ensures that as many aspects of damage formation as possible are captured, minimizing the risk of misinterpretation.

4.3. Potential Application of In Situ Failure Strains

The in situ S-N or strain–life curve appears to be a valuable tool for determining the intrinsic fatigue strength or critical strains of transversely loaded plies. This is because the weakest links can be identified and characterized from an embedded ply, including nesting and other changes in geometric arrangement, which might otherwise be omitted. The combined knowledge of the critical stress or strain at the failure location and the local FVF can be used as a basis to predict critical conditions in other laminates employing identical constituents but in a different geometrical arrangement. Alternatively, it appears possible to define knock-down factors based on the geometric arrangement. In both cases, the stress or strain to initiate transverse failure is sought after, not the fully developed crack in a transverse ply, as the latter is a matter of fracture mechanical crack propagation and necessitates a detailed understanding of the local stress intensity and fatigue crack resistance of the composite at hand. Both proposed use cases are discussed in the following section, beginning with optimization targets.

4.3.1. Optimization Potential by a Homogenous Fiber Distribution

With known critical conditions for fracture, it becomes possible to target the optimal fiber matrix arrangement by optimized processing. To show the benefits more clearly, the case of irradiated EP-GF can be taken. Here, the average critical stress σ c r i t across all cracking sites is found to be 21 MPa at a local FVF ( v f ) of 60%, whereas the global FVF is 48%. If the global FVF could be kept constant and the fibers were distributed perfectly uniformly, the overall response of the laminate to an applied global stress would likely remain largely unchanged. However, critical conditions would be postponed and allow for higher global laminate stress and strain. Under the assumption that the crack initiation stress is unchanged, the laminate stress σ L a m could be increased to 68 MPa in order to produce cracking for the particular laminate. This is because the homogenous transverse modulus   E ( v f ) is lower, allowing for higher global strains to reach the critical stress σ c r i t within the transverse ply. Equation (3) is based on a common laminate stiffness ELam for both arrangements.
σ L a m = E L a m σ c r i t E ( v f )
However, it must be noted that the assumption of a universal value for the crack initiation stress is likely an oversimplification. Universal in a sense that different FVFs in a homogenous arrangement lead to the same failure stress. This is unlikely because closer-spaced fibers will increase the triaxiality with implications for yielding and ductility [38,39,40]. Alternatively, the stress or strain concentration at the fiber matrix level could be accounted for by amplification factors translating the mesoscopic stresses and strains to the equivalents on the fiber matrix level [25,26]. Since homogenized strains are directly available from the in situ DIC measurements, a strain-based criterion might prove especially useful. The strain amplification factors (from meso to micro) can be determined from FE models or simply by representing UD plies by a series of springs representing the fibers and the matrix polymer, as shown in Figure 13, and either by accounting for the arrangement (e.g., the quadratic fiber arrangement QFA) or simply assuming layers (IROM). In the current work, the mean of all strains found at the cracking sites of irradiated EP-GF was 0.22%. With a FVF of 60%, this leads to strain amplification a ε of 2.34 and, hence, a critical strain of the matrix polymer of 0.52%. Assuming a quadratic fiber arrangement (QFA), this value even increases to 6.04, with an inherent matrix strain of 1.33 %. Homogeneously distributed fibers with an FVF of 48% would reduce the strain amplification within the matrix polymer to 1.85 (Equation (1) IROM) and 3.94 (Equation (2) QFA), respectively. Since no strain inhomogeneity exists in the latter case, the global laminate strain can be used as a reference. Under the assumption that the strain of the matrix polymer can be taken as the failure condition, the reduced strain amplification allows for a higher laminate strain. Therefore, the global laminate strain of 0.22% measured across all specimens could be increased to 0.28% (IROM) or 0.34% (QFA). Which of the assumptions is more representative necessitates additional experimental work and a procedure to produce more homogenous fiber distributions.
Figure 13 shows the overall estimation scheme. It should be noted that these results are not in disagreement with results of other researchers. This is because it is likely that besides the global FVF, the fiber distribution was also changed in these investigations, which might explain the results in part.
Aiming for a homogenous fiber distribution disregards the crack-arresting potential of resin-rich planes aligned with the loading direction. Within EP-GF, resin-rich areas adjacent to the fiber bundles could contain a crack once formed; therefore, this point should not be underestimated. Hence, optimization must consider all stages of fatigue damage, first crack incubation, followed by initiation of a crack and finally crack propagation.

4.3.2. Incorporating Inhomogeneity into the Failure Analysis

Besides the formulation of optimization targets, a more practical approach could be to accept inhomogeneity as part of most fabrication techniques and to account for this inhomogeneity by applying an overall amplification factor based on the actual geometric arrangement. This factor could include all stress/strain amplifications across the analysis levels defined in Figure 13, relating homogenized mesoscopic measures of the classical laminate theory (CLT) to the microscopic level. Therefore, the suggested knock-down factors follow the failure criteria of Carraro and Quaresimin [25] and Baar et al. [26] but extend the concept of stress and strain amplification to also include inhomogeneity within plies. With this extension, the analysis includes the local conditions on a scale that lies between the homogenized ply level and the level that resolves individual matrix and fibers.
A less rigorous approach, which becomes accessible with the detailed study of local stresses, could be the assumption of critical stress σ c r i t N , remaining constant within a given range of fiber contents (e.g., 45–55%). This assumes that different S-N curves measured for different global FVFs are mainly caused by a difference in fiber distribution. Hence, the in situ S-N curve could be shifted by the knowledge of overstresses due to local inhomogeneity. Equation (4) indicates how the laminae’s S-N curve σ L a m N could be related to the in situ S-N curve σ c r i t N by a knock-down or correction factor k . The latter should be formulated as a function of the local stiffness variation compared to the laminate or ply stiffness, the roving size distribution (RSD), and potentially other factors like the presence of stitching fibers. RSD could account for the agglomeration of fibers due to differences in processing and is a concept typically found in the analysis of particles. By formulating the knock-down factor system independently, the potential exists for universal application. This would mean that the factors might be transferable between different matrix polymers, varying fiber types, or manufacturing methods.
σ L a m N = k m a x [ E ( v f ) ] E L a m , R S D , × σ c r i t N
The overall idea is similar to the approach in metals, accounting, for example, for surface roughness or segregations by dedicated factors applied to a nominal strength value. Debonding at stitching fibers, however, clearly shows that additional detrimental effects need to be considered separately. An open point at this stage is how to include such knock-down factors into established failure conditions for which a distinction into different failure modes is necessary.

5. Conclusions

From the results, the following can be concluded:
  • The following mechanism can overcome the trade-off between field of view, depth of view, and magnification in edge observation, which enables DIC based on microscopic images of composites.
  • Cracking sites are insensitive to moderate changes in polymer properties (elastic modulus +17.4% and yield stress +5.4%) and are mainly controlled by inhomogeneity induced by spatial fiber volume content variations and stitching fibers.
  • Potential applications of the strains to local onset cracking are proposed either as optimization targets for a more homogenous FVF distribution or as knock-down factors extending to existing failure criteria.
  • Cracking can be present early in the fatigue life and might be introduced during the first loading cycle, emphasizing the importance of fracture mechanical concepts.
  • For both EP-CF and EP-GF laminates, the fiber–matrix interface initiates failure by debonding, although, in the case of EP-CF, it is not the interface of the reinforcement fibers but that of the stitching fibers that initiates failure.

Author Contributions

Conceptualization, methodology, investigation; writing—original draft preparation, A.B.; writing—review and editing M.D.; resources, writing—review and editing, supervision, funding acquisition J.H. All authors have read and agreed to the published version of the manuscript.

Funding

This work was supported by the Deutsche Forschungsgemeinschaft (DFG, German Research Foundation) as part of the project “Correlation of matrix properties to the fatigue behavior of fiber reinforced polymers”—468045930.

Data Availability Statement

Dataset available on request from the authors.

Acknowledgments

The authors would like to thank R. Cuntze for the valuable discussions and insights during the preparation of this work.

Conflicts of Interest

The authors declare that the research was conducted in the absence of any commercial or financial relationships that could be construed as a potential conflict of interest.

References

  1. Vallons, K.; Adolphs, G.; Lucas, P.; Lomov, S.V.; Verpoest, I. Quasi-UD Glass Fibre NCF Composites for Wind Energy Applications: A Review of Requirements and Existing Fatigue Data for Blade Materials. Mech. Ind. 2013, 14, 175–189. [Google Scholar] [CrossRef]
  2. Gamstedt, E.K.; Talreja, R. Fatigue Damage Mechanisms in Unidirectional Carbon-Fibre-Reinforced Plastics. J. Mater. Sci. 1999, 34, 2535–2546. [Google Scholar] [CrossRef]
  3. Soden, P.D.; Kaddour, A.S.; Hinton, M.J. Recommendations for Designers and Researchers Resulting from the World-Wide Failure Exercise. Compos. Sci. Technol. 2004, 64, 589–604. [Google Scholar] [CrossRef]
  4. Cuntze, R.G.; Freund, A. The Predictive Capability of Failure Mode Concept-Based Strength Criteria for Multidirectional Laminates. Compos. Sci. Technol. 2004, 64, 343–377. [Google Scholar] [CrossRef]
  5. Koch, I.; Zscheyge, M.; Tittmann, K.; Gude, M. Numerical Fatigue Analysis of CFRP Components. Compos. Struct. 2017, 168, 392–401. [Google Scholar] [CrossRef]
  6. Camanho, P.P.; Dávila, C.G.; Pinho, S.T.; Iannucci, L.; Robinson, P. Prediction of in Situ Strengths and Matrix Cracking in Composites under Transverse Tension and In-Plane Shear. Compos. Part A Appl. Sci. Manuf. 2006, 37, 165–176. [Google Scholar] [CrossRef]
  7. Endruweit, A.; Gommer, F.; Long, A.C. Stochastic Analysis of Fibre Volume Fraction and Permeability in Fibre Bundles with Random Filament Arrangement. Compos. Part A Appl. Sci. Manuf. 2013, 49, 109–118. [Google Scholar] [CrossRef]
  8. Zaami, A.; Baran, I.; Bor, T.C.; Akkerman, R. Optical Characterization of Fiber-Reinforced Thermoplastic Tapes for Laser-Based Composite Manufacturing. Compos. Part A Appl. Sci. Manuf. 2021, 146, 106402. [Google Scholar] [CrossRef]
  9. Brunbauer, J.; Pinter, G. Effects of Mean Stress and Fibre Volume Content on the Fatigue-Induced Damage Mechanisms in CFRP. Int. J. Fatigue 2015, 75, 28–38. [Google Scholar] [CrossRef]
  10. Zaghloul, M.Y.; Zaghloul, M.M.Y.; Zaghloul, M.M.Y. Influence of Stress Level and Fibre Volume Fraction on Fatigue Performance of Glass Fibre-Reinforced Polyester Composites. Polymers 2022, 14, 2662. [Google Scholar] [CrossRef]
  11. Mortensen, U.A.; Rasmussen, S.; Mikkelsen, L.P.; Fraisse, A.; Andersen, T.L. The Impact of the Fiber Volume Fraction on the Fatigue Performance of Glass Fiber Composites. Compos. Part A Appl. Sci. Manuf. 2023, 169, 107493. [Google Scholar] [CrossRef]
  12. Brunbauer, J.; Pinter, G. (Eds.) Fatigue-Induced Damage Mechanisms in Carbon/Epoxy Laminates Influenced by Mean Stress and Fibre Volume Content. In Proceedings of the ICCM20—20th International Conference on Composite Materials, Copenhagen, Denmark, 19–24 July 2015; ICCM-Central: Belfast, UK, 2015. [Google Scholar]
  13. Dharan, C.K.H. Fatigue Failure in Graphite Fibre and Glass Fibre-Polymer Composites. J. Mater. Sci. 1975, 10, 1665–1670. [Google Scholar] [CrossRef]
  14. Schommer, D.; Duhovic, M.; Hoffmann, T.; Ernst, J.; Schladitz, K.; Moghiseh, A.; Gortner, F.; Hausmann, J.; Mitschang, P.; Steiner, K. Polarization Imaging for Surface Fiber Orientation Measurements of Carbon Fiber Sheet Molding Compounds. Compos. Commun. 2023, 37, 101456. [Google Scholar] [CrossRef]
  15. Drvoderic, M.; Gfrerrer, M.; Wiener, J.; Pinter, G.; Pletz, M.; Schuecker, C. Comparing Crack Density and Dissipated Energy as Measures for Off-Axis Damage in Composite Laminates. Int. J. Fatigue 2023, 169, 107486. [Google Scholar] [CrossRef]
  16. Maragoni, L.; Carraro, P.A.; Peron, M.; Quaresimin, M. Fatigue Behaviour of Glass/Epoxy Laminates in the Presence of Voids. Int. J. Fatigue 2017, 95, 18–28. [Google Scholar] [CrossRef]
  17. Pakkam Gabriel, V.R.; Loukil, M.S.; Varna, J. Analysis of Intralaminar Cracking in 90-Plies of GF/EP Laminates with Distributed Ply Strength. J. Compos. Mater. 2021, 55, 3925–3942. [Google Scholar] [CrossRef]
  18. Shen, H.; Yao, W.; Qi, W.; Zong, J. Experimental Investigation on Damage Evolution in Cross-Ply Laminates Subjected to Quasi-Static and Fatigue Loading. Compos. Part B Eng. 2017, 120, 10–26. [Google Scholar] [CrossRef]
  19. Lafarie-Frenot, M.C.; Hénaff-Gardin, C. Formation and Growth of 90° Ply Fatigue Cracks in Carbon/Epoxy Laminates. Compos. Sci. Technol. 1991, 40, 307–324. [Google Scholar] [CrossRef]
  20. Li, X.; Benedictus, R.; Zarouchas, D. Analysis of Stochastic Matrix Crack Evolution in CFRP Cross-Ply Laminates under Fatigue Loading. Eng. Fail. Anal. 2023, 150, 107277. [Google Scholar] [CrossRef]
  21. Li, X.; Kupski, J.; Teixeira De Freitas, S.; Benedictus, R.; Zarouchas, D. Unfolding the Early Fatigue Damage Process for CFRP Cross-Ply Laminates. Int. J. Fatigue 2020, 140, 105820. [Google Scholar] [CrossRef]
  22. Van Paepegem, W.; De Baere, I.; Lamkanfi, E.; Degrieck, J. Poisson’s Ratio as a Sensitive Indicator of (Fatigue) Damage in Fibre-reinforced Plastics. Fatigue Fract. Eng. Mater. Struct. 2007, 30, 269–276. [Google Scholar] [CrossRef]
  23. Wharmby, A. Observations on Damage Development in Fibre Reinforced Polymer Laminates under Cyclic Loading. Int. J. Fatigue 2003, 25, 437–446. [Google Scholar] [CrossRef]
  24. Reifsnider, K.; Jamison, R. Fracture of Fatigue-Loaded Composite Laminates. Int. J. Fatigue 1982, 4, 187–197. [Google Scholar] [CrossRef]
  25. Carraro, P.A.; Quaresimin, M. A Damage Based Model for Crack Initiation in Unidirectional Composites under Multiaxial Cyclic Loading. Compos. Sci. Technol. 2014, 99, 154–163. [Google Scholar] [CrossRef]
  26. Baar, S.; Pavlov, L.; Kassapoglou, C. Consistent Approach to Onset Theory. J. Compos. Mater. 2022, 56, 3495–3507. [Google Scholar] [CrossRef]
  27. Zhuang, L.; Talreja, R.; Maragoni, L. Crack Deflection Near a Ply Interface in a Composite Laminate. In Proceedings of the ASME 2020 International Mechanical Engineering Congress and Exposition, Online, 16–19 November 2020; American Society of Mechanical Engineers: New York, NY, USA, 2020; Volume 4, p. V004T04A023. [Google Scholar]
  28. Baumann, A.; Hausmann, J. Effect of High Energy Radiation on Technical Polymers; ilmedia: Ilmenau, Germany, 2023. [Google Scholar]
  29. Aratama, S.; Hashizume, R.; Takenaka, K.; Koga, K.; Tsumura, Y.; Miyake, T.; Nishikawa, M.; Hojo, M. Microscopic Observation of Voids and Transverse Crack Initiation in CFRP Laminates. Adv. Compos. Mater. 2016, 25, 115–130. [Google Scholar] [CrossRef]
  30. Sutton, M.A.; Yan, J.H.; Tiwari, V.; Schreier, H.W.; Orteu, J.J. The Effect of Out-of-Plane Motion on 2D and 3D Digital Image Correlation Measurements. Opt. Lasers Eng. 2008, 46, 746–757. [Google Scholar] [CrossRef]
  31. ISO 13003:2003; Fibre-Reinforced Plastics—Determination of Fatigue Properties under Cyclic Loading Conditions. International Organization for Standardization: Geneva, Switzerland, 2003.
  32. Sommer, J.; Hajikazemi, M.; De Baere, I.; Van Paepegem, W. Fatigue Behaviour of Thermoplastic Glass/Polypropylene Composite Cross-Ply Laminates: An Experimental Study with in-Situ Damage Observations and Numerical Validation. Compos. Part B Eng. 2023, 252, 110494. [Google Scholar] [CrossRef]
  33. Sommer, J.; Hajikazemi, M.; De Baere, I.; Van Paepegem, W. Experimental and Numerical Damage Characterization of Glass/Polypropylene Multidirectional Laminates under Quasi-Static Loading Condition. Compos. Sci. Technol. 2022, 227, 109569. [Google Scholar] [CrossRef]
  34. Luo, Y. Improved Voigt and Reuss Formulas with the Poisson Effect. Materials 2022, 15, 5656. [Google Scholar] [CrossRef]
  35. Schürmann, H. Konstruieren Mit Faser-Kunststoff-Verbunden, 2nd ed.; VDI-Buch; Springer: Berlin/Heidelberg, Germany, 2007; ISBN 978-3-540-72189-5. [Google Scholar]
  36. Aboudi, J. Mechanics of Composite Materials: A Unified Micromechanical Approach; Studies in applied mechanics; Elsevier: Amsterdam, The Netherlands; New York, NY, USA, 1991; Volume 29, ISBN 0-444-88452-1. [Google Scholar]
  37. Baumann, A.; Hausmann, J. Effect of High-Energy Radiation on the Relaxation of Residual Stresses in Polycarbonate and Epoxy Resin by Stress Optics. Radiat. Phys. Chem. 2024. accepted. [Google Scholar]
  38. Kody, R.S.; Lesser, A.J. Deformation and Yield of Epoxy Networks in Constrained States of Stress. J. Mater. Sci. 1997, 32, 5637–5643. [Google Scholar] [CrossRef]
  39. Asp, L.E.; Berglund, L.A.; Gudmundson, P. Effects of a Composite-like Stress State on the Fracture of Epoxies. Compos. Sci. Technol. 1995, 53, 27–37. [Google Scholar] [CrossRef]
  40. Asp, L.E.; Berglund, L.A.; Talreja, R. Prediction of Matrix-Initiated Transverse Failure in Polymer Composites. Compos. Sci. Technol. 1996, 56, 1089–1097. [Google Scholar] [CrossRef]
Figure 1. Microscopy on deformed specimens (a) fixed camera set-up (b) two actuator set-up (c) following mechanism used within this work. Marked is the fixed (F) and moveable (M) points in a single-actuator set-up.
Jcs 08 00366 g001
Figure 2. (a) Set-up used for in situ microscopy during fatigue testing (F [fix] and M [moveable] correspond to the schematic in Figure 1). (b) Detailed view of the specimen; (c) FOV of the microscope.
Jcs 08 00366 g002
Figure 3. Description of applied fatigue loading sequence; RF (reference frame).
Jcs 08 00366 g003
Figure 4. Effect of irradiation treatment on the neat epoxy stress–strain response expressed as mean curves of five tested specimens per configuration. Specimen failure is marked by (+). Shaded areas mark the 99% confidence interval. Strains beyond yielding are calculated based on the cross-head displacement (dashed lines).
Jcs 08 00366 g004
Figure 5. (a) Local strain peaks at positions 1–7 within the transverse ply during first loading of non-irradiated EP-GF. (b) Local strain time signal at strain hotspots.
Jcs 08 00366 g005
Figure 6. Coalescence of debonds within a roving of the transverse plies of EP-GF.
Jcs 08 00366 g006
Figure 7. Stress–strain response during the first loading ramp of non-irradiated EP-GF (curves are offset by 0.1% for better visualization); × marks the onset of cracking detected from the in situ edge observation. Regression (Regr.) for ε < 0.1%.
Jcs 08 00366 g007
Figure 8. Stress–strain response during the first loading ramp of irradiated EP-GF (curves are offset by 0.1% for better visualization); × marks the onset of cracking detected from the in situ edge observation. Regression (Regr.) for ε < 0.1%.
Jcs 08 00366 g008
Figure 9. In situ S-N curve for both EP-GF configurations.
Jcs 08 00366 g009
Figure 10. (a) Local strains within stitching fibers of EP-CF at maximum stress during first loading overlaid to microscopic image. (b) Local strain time signal at strain hot spots.
Jcs 08 00366 g010
Figure 11. Detailed investigation of crack formation at the stitching fibers. (a) Exemplary strain hotspot at an interlocking point of the tricot stitching. (b) Separately prepared microsection of a stitched area at higher magnification. (c) Dry carbon NCF material highlighting the interlocking points (viewed from the top). (d) SEM images of a manually fractured specimen.
Jcs 08 00366 g011
Figure 12. Stiffness degradation as a function of observed crack density after 105 cycles for both EP-CF irradiation conditions.
Jcs 08 00366 g012
Figure 13. (a) Inhomogeneous fiber distribution and resulting strains. (b) Ideally homogeneous fiber distribution. Strain concentrations across different dimension scales with the red box indicating the smallest repeating unit (fiber and matrix) in both cases represented by two springs.
Jcs 08 00366 g013
Table 1. Epoxy and fiber properties used for the homogenization.
Material and Irradiation LevelElastic Modulus in GPaPoisson’s Ratio
EP 0 kGy2.700.4
EP 500 kGy3.170.4
E-glass [35]730.22
Disclaimer/Publisher’s Note: The statements, opinions and data contained in all publications are solely those of the individual author(s) and contributor(s) and not of MDPI and/or the editor(s). MDPI and/or the editor(s) disclaim responsibility for any injury to people or property resulting from any ideas, methods, instructions or products referred to in the content.

