
A Numerical Tool for Assessing Random Vibration-Based Fatigue Damage Diagnosability in Thermoplastic Coupons


Abstract
1. Introduction
- Development of a numerical methodology of random vibration-response-only-based fatigue damage diagnosability for thermoplastic coupons;
- Development of an efficient simulation process for random vibration experiments;
- Examination of progressive fatigue damage through numerical random vibration responses in the frequency domain;
- Employment of several damage metrics for fatigue damage diagnosability in thermoplastic coupons using numerical random vibration response data;
- Generation of an integrated numerical model/tool, which can be used to support random vibration-response-only-based SHM systems for composite structures.
2. Conceptual Framework
3. The Numerical Tool for Fatigue Damage Diagnosability
3.1. The Fatigue Delamination Module (FDM)
3.2. The Random Vibration Module (RVM)
4. Numerical Tool Assessment and Experimental Verification
4.1. Material and Coupons
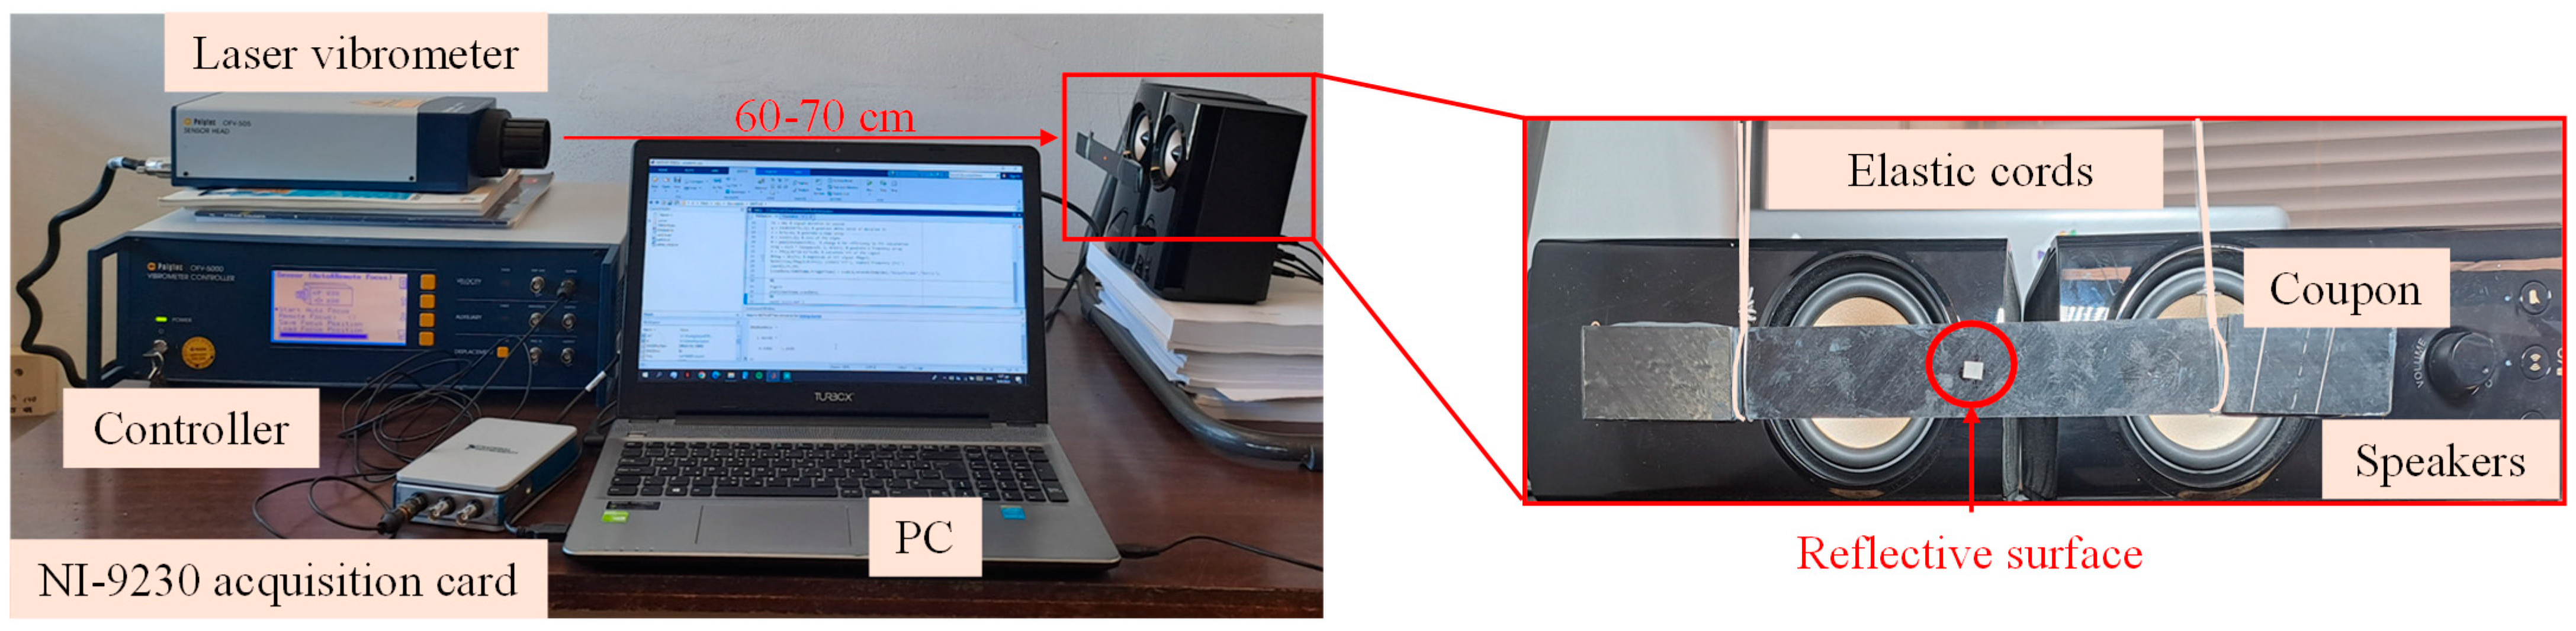
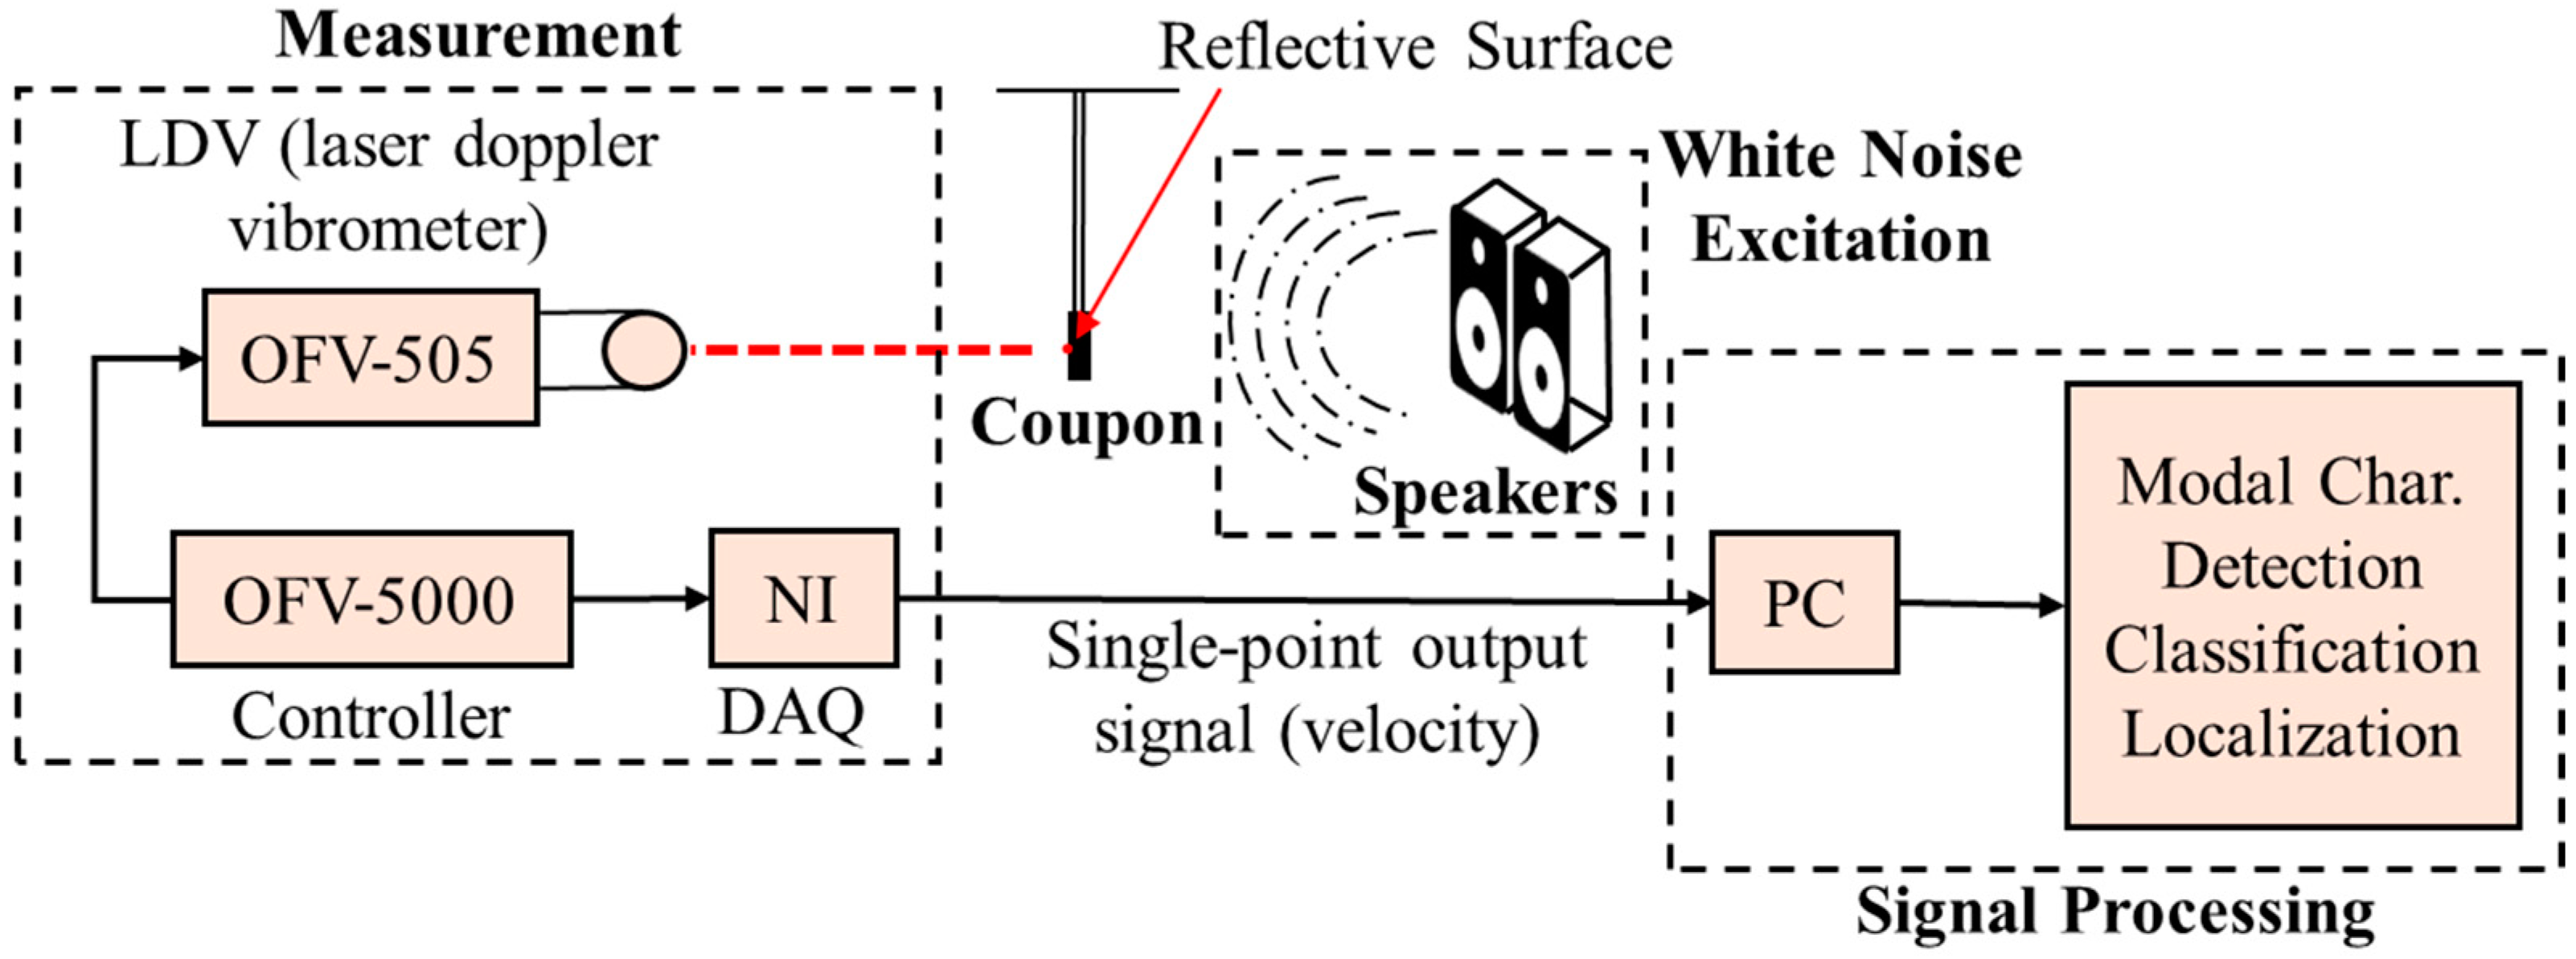
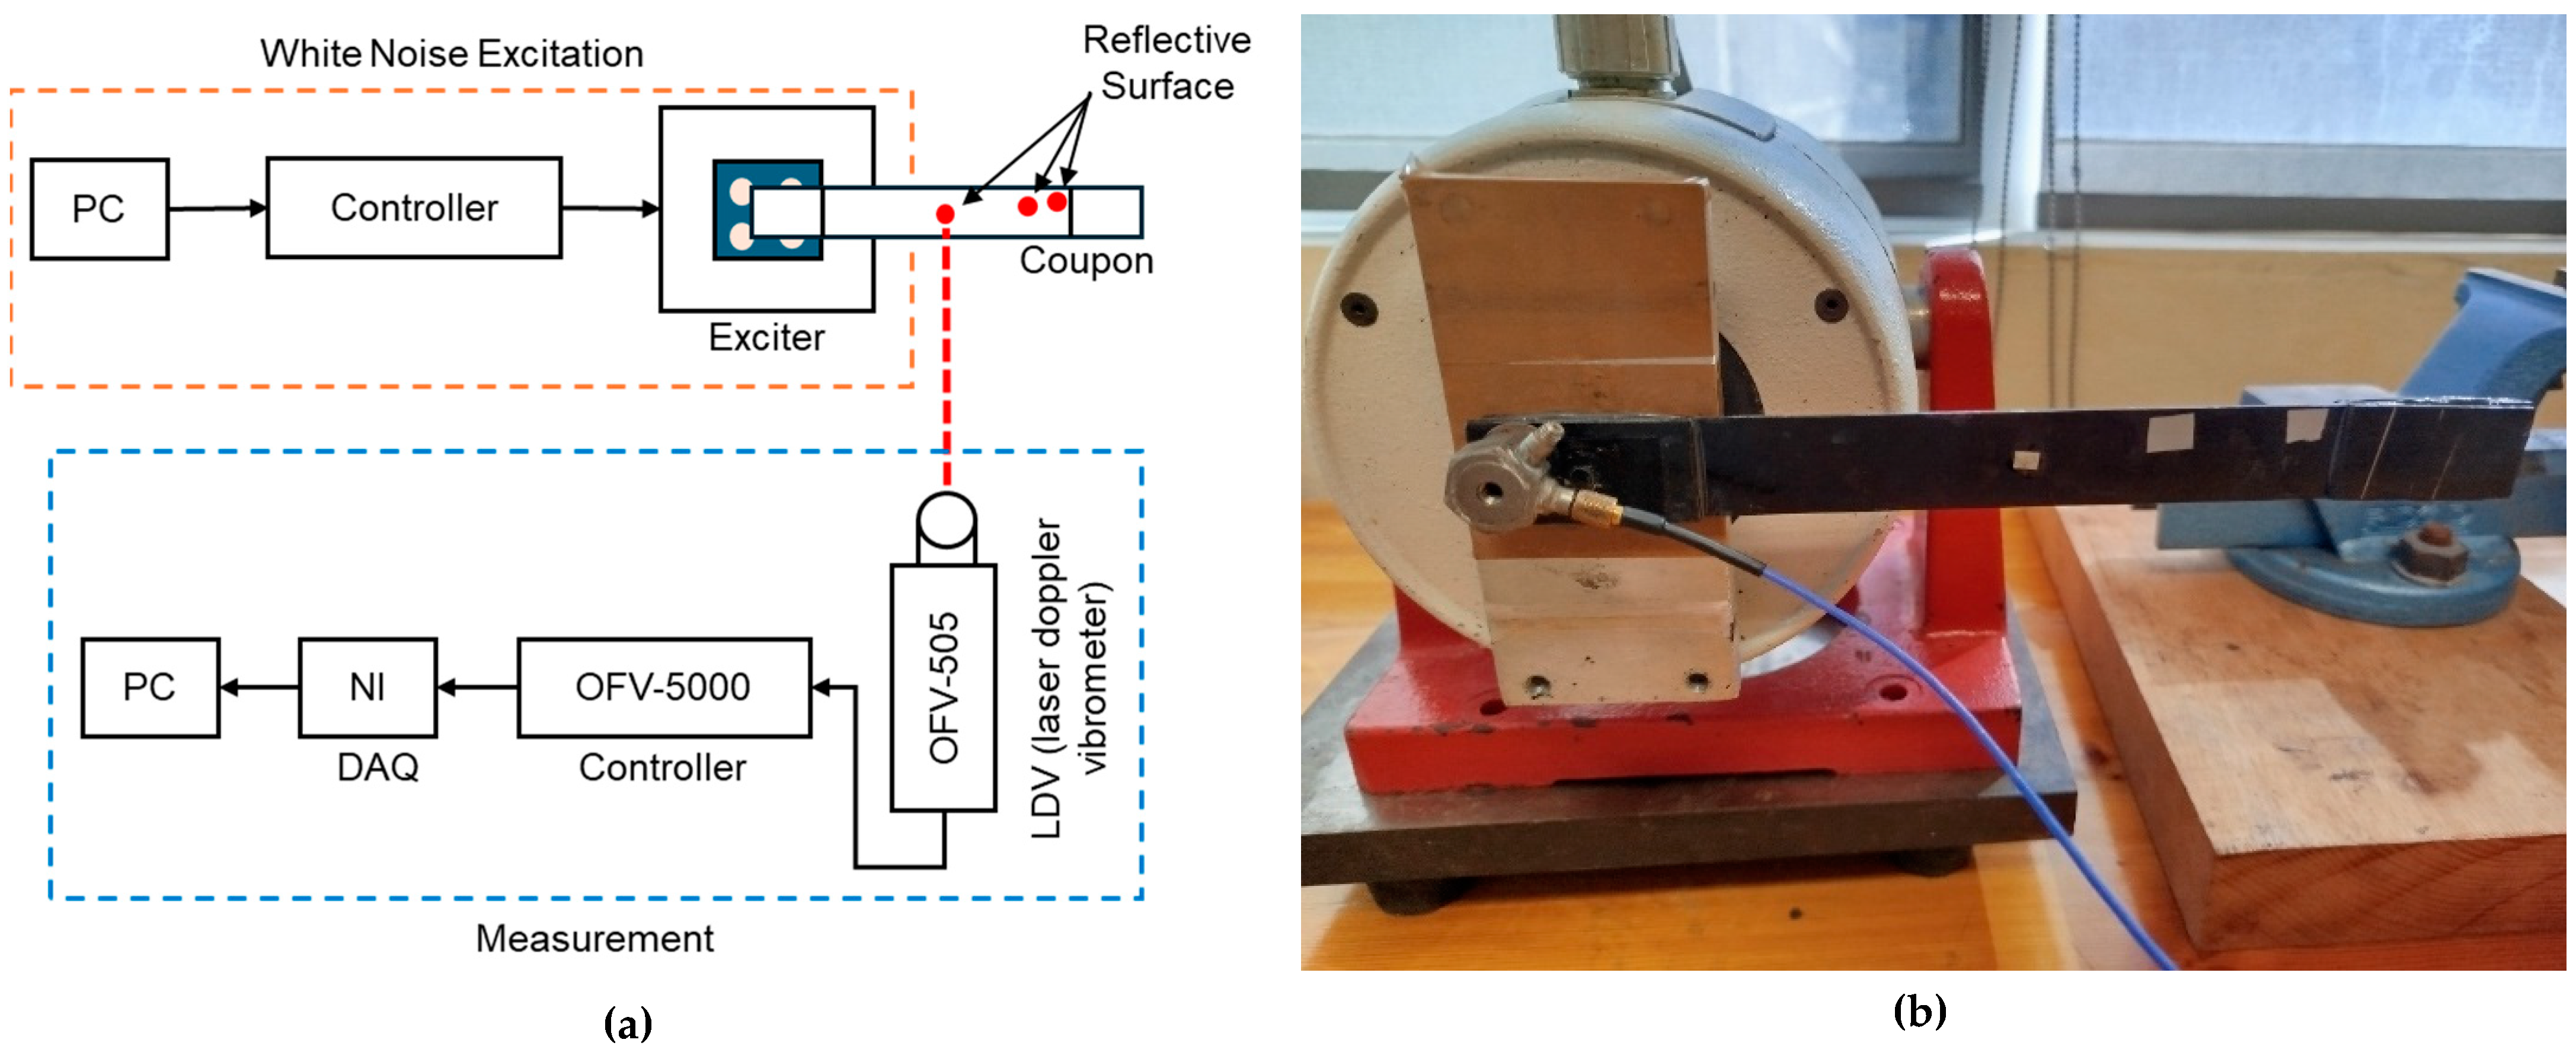
4.2. Brief Overview of the Experimental Procedure
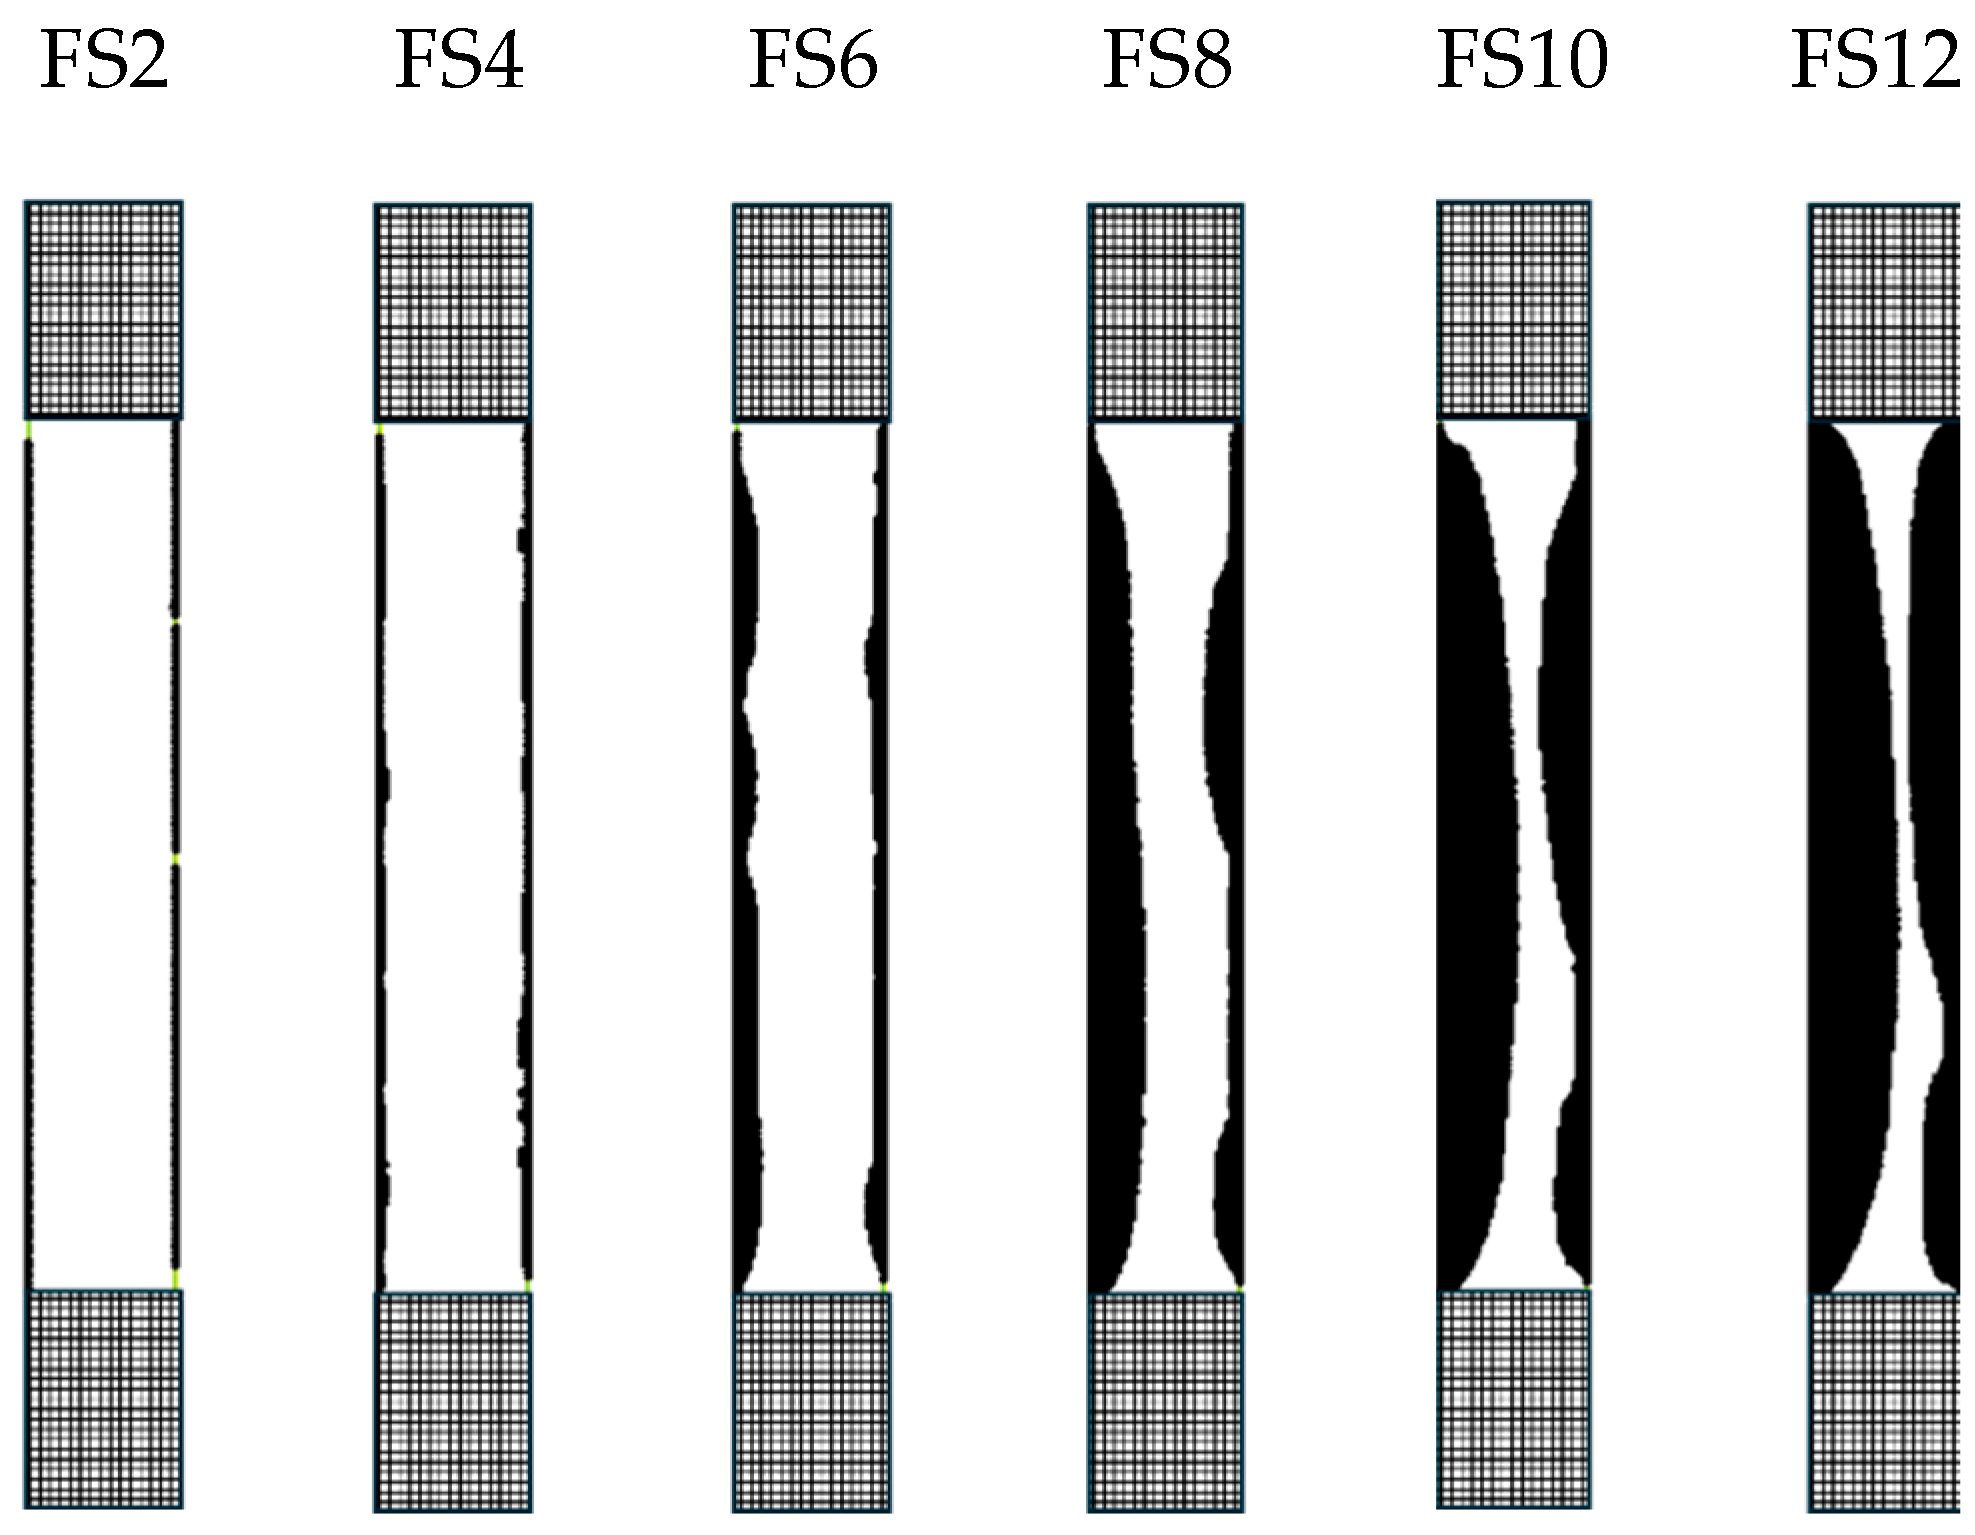
4.3. FDM Results
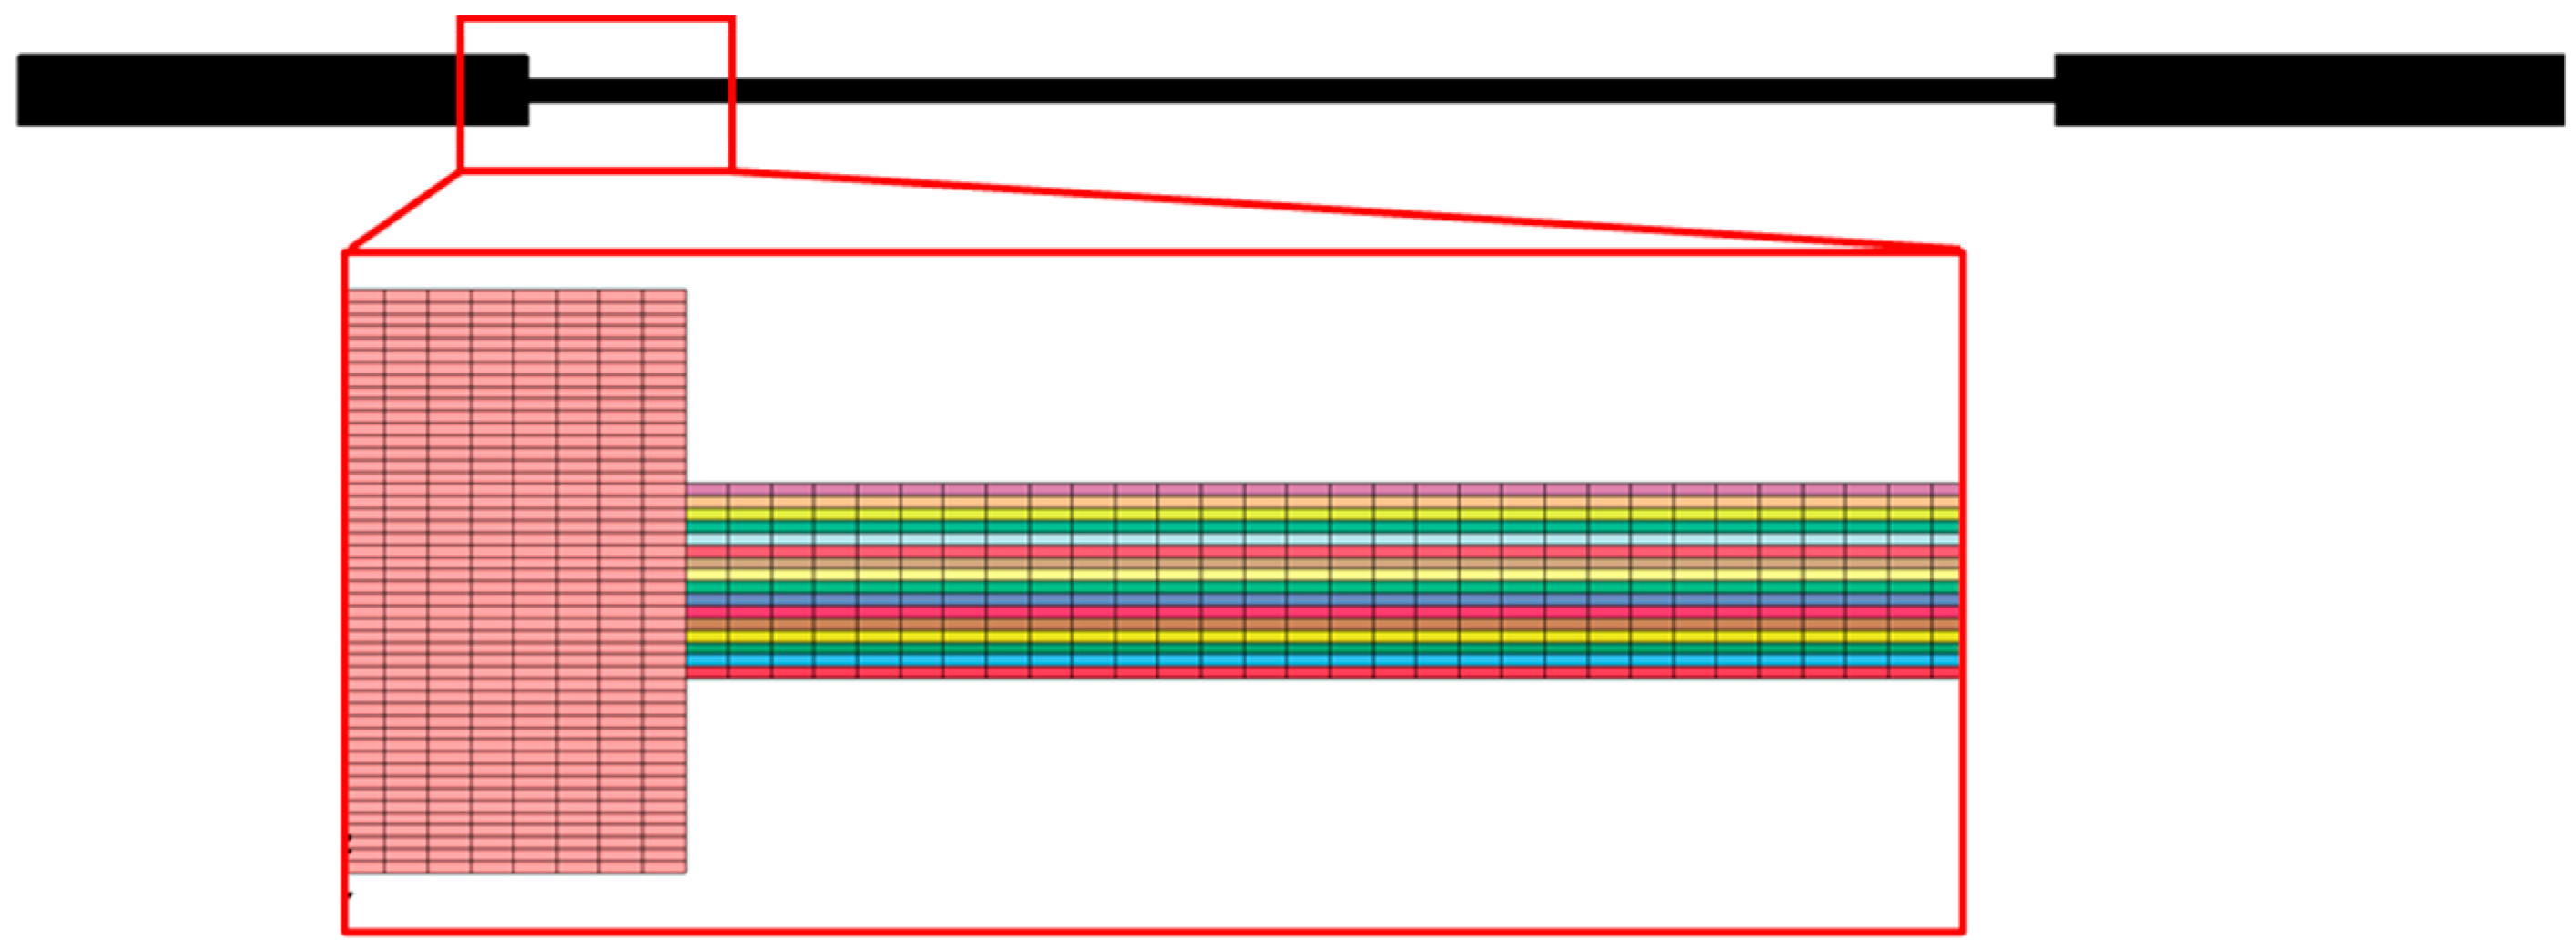
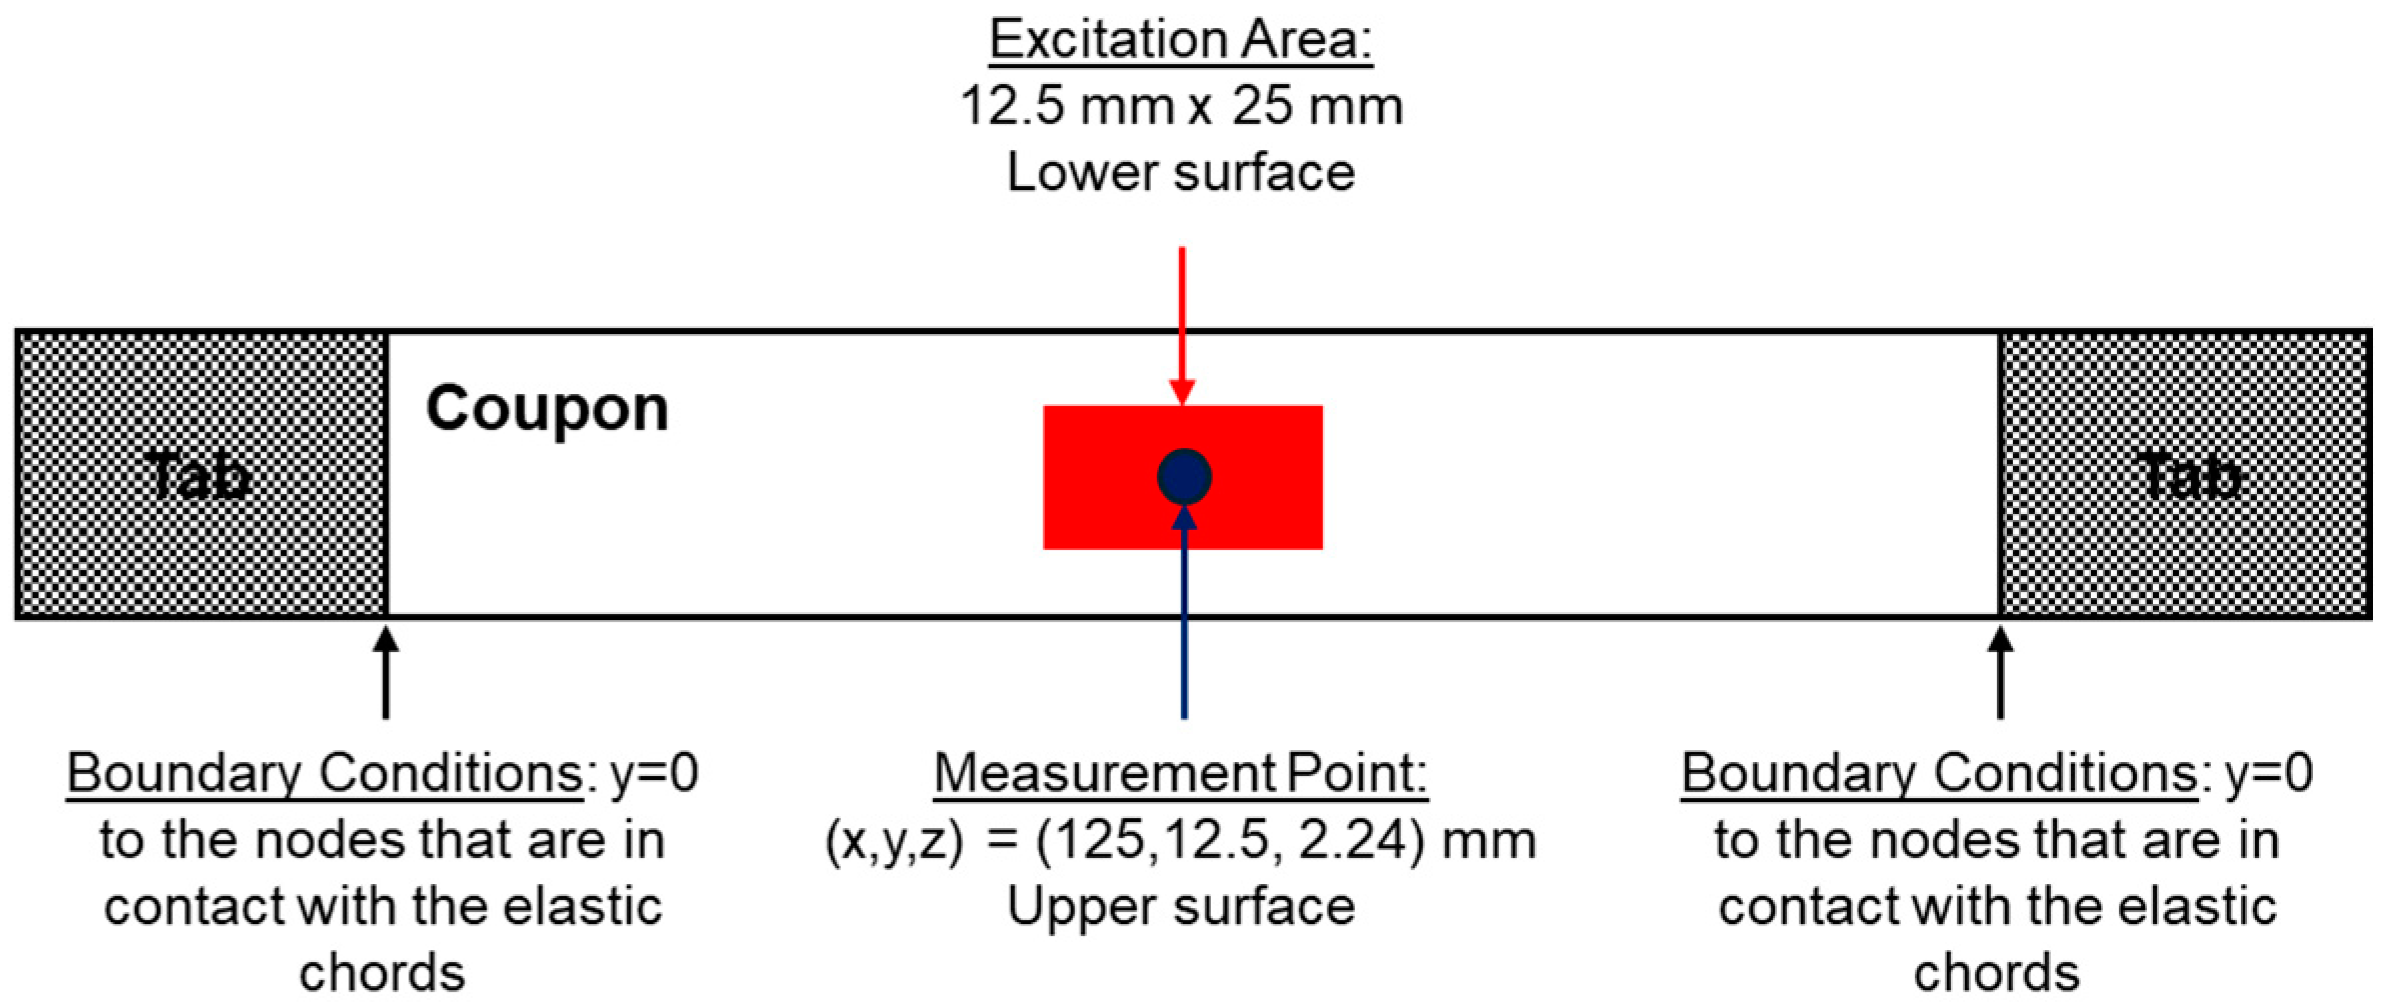
4.4. RVM Modeling
4.5. RVM Results
4.5.1. Calibration of the RVM
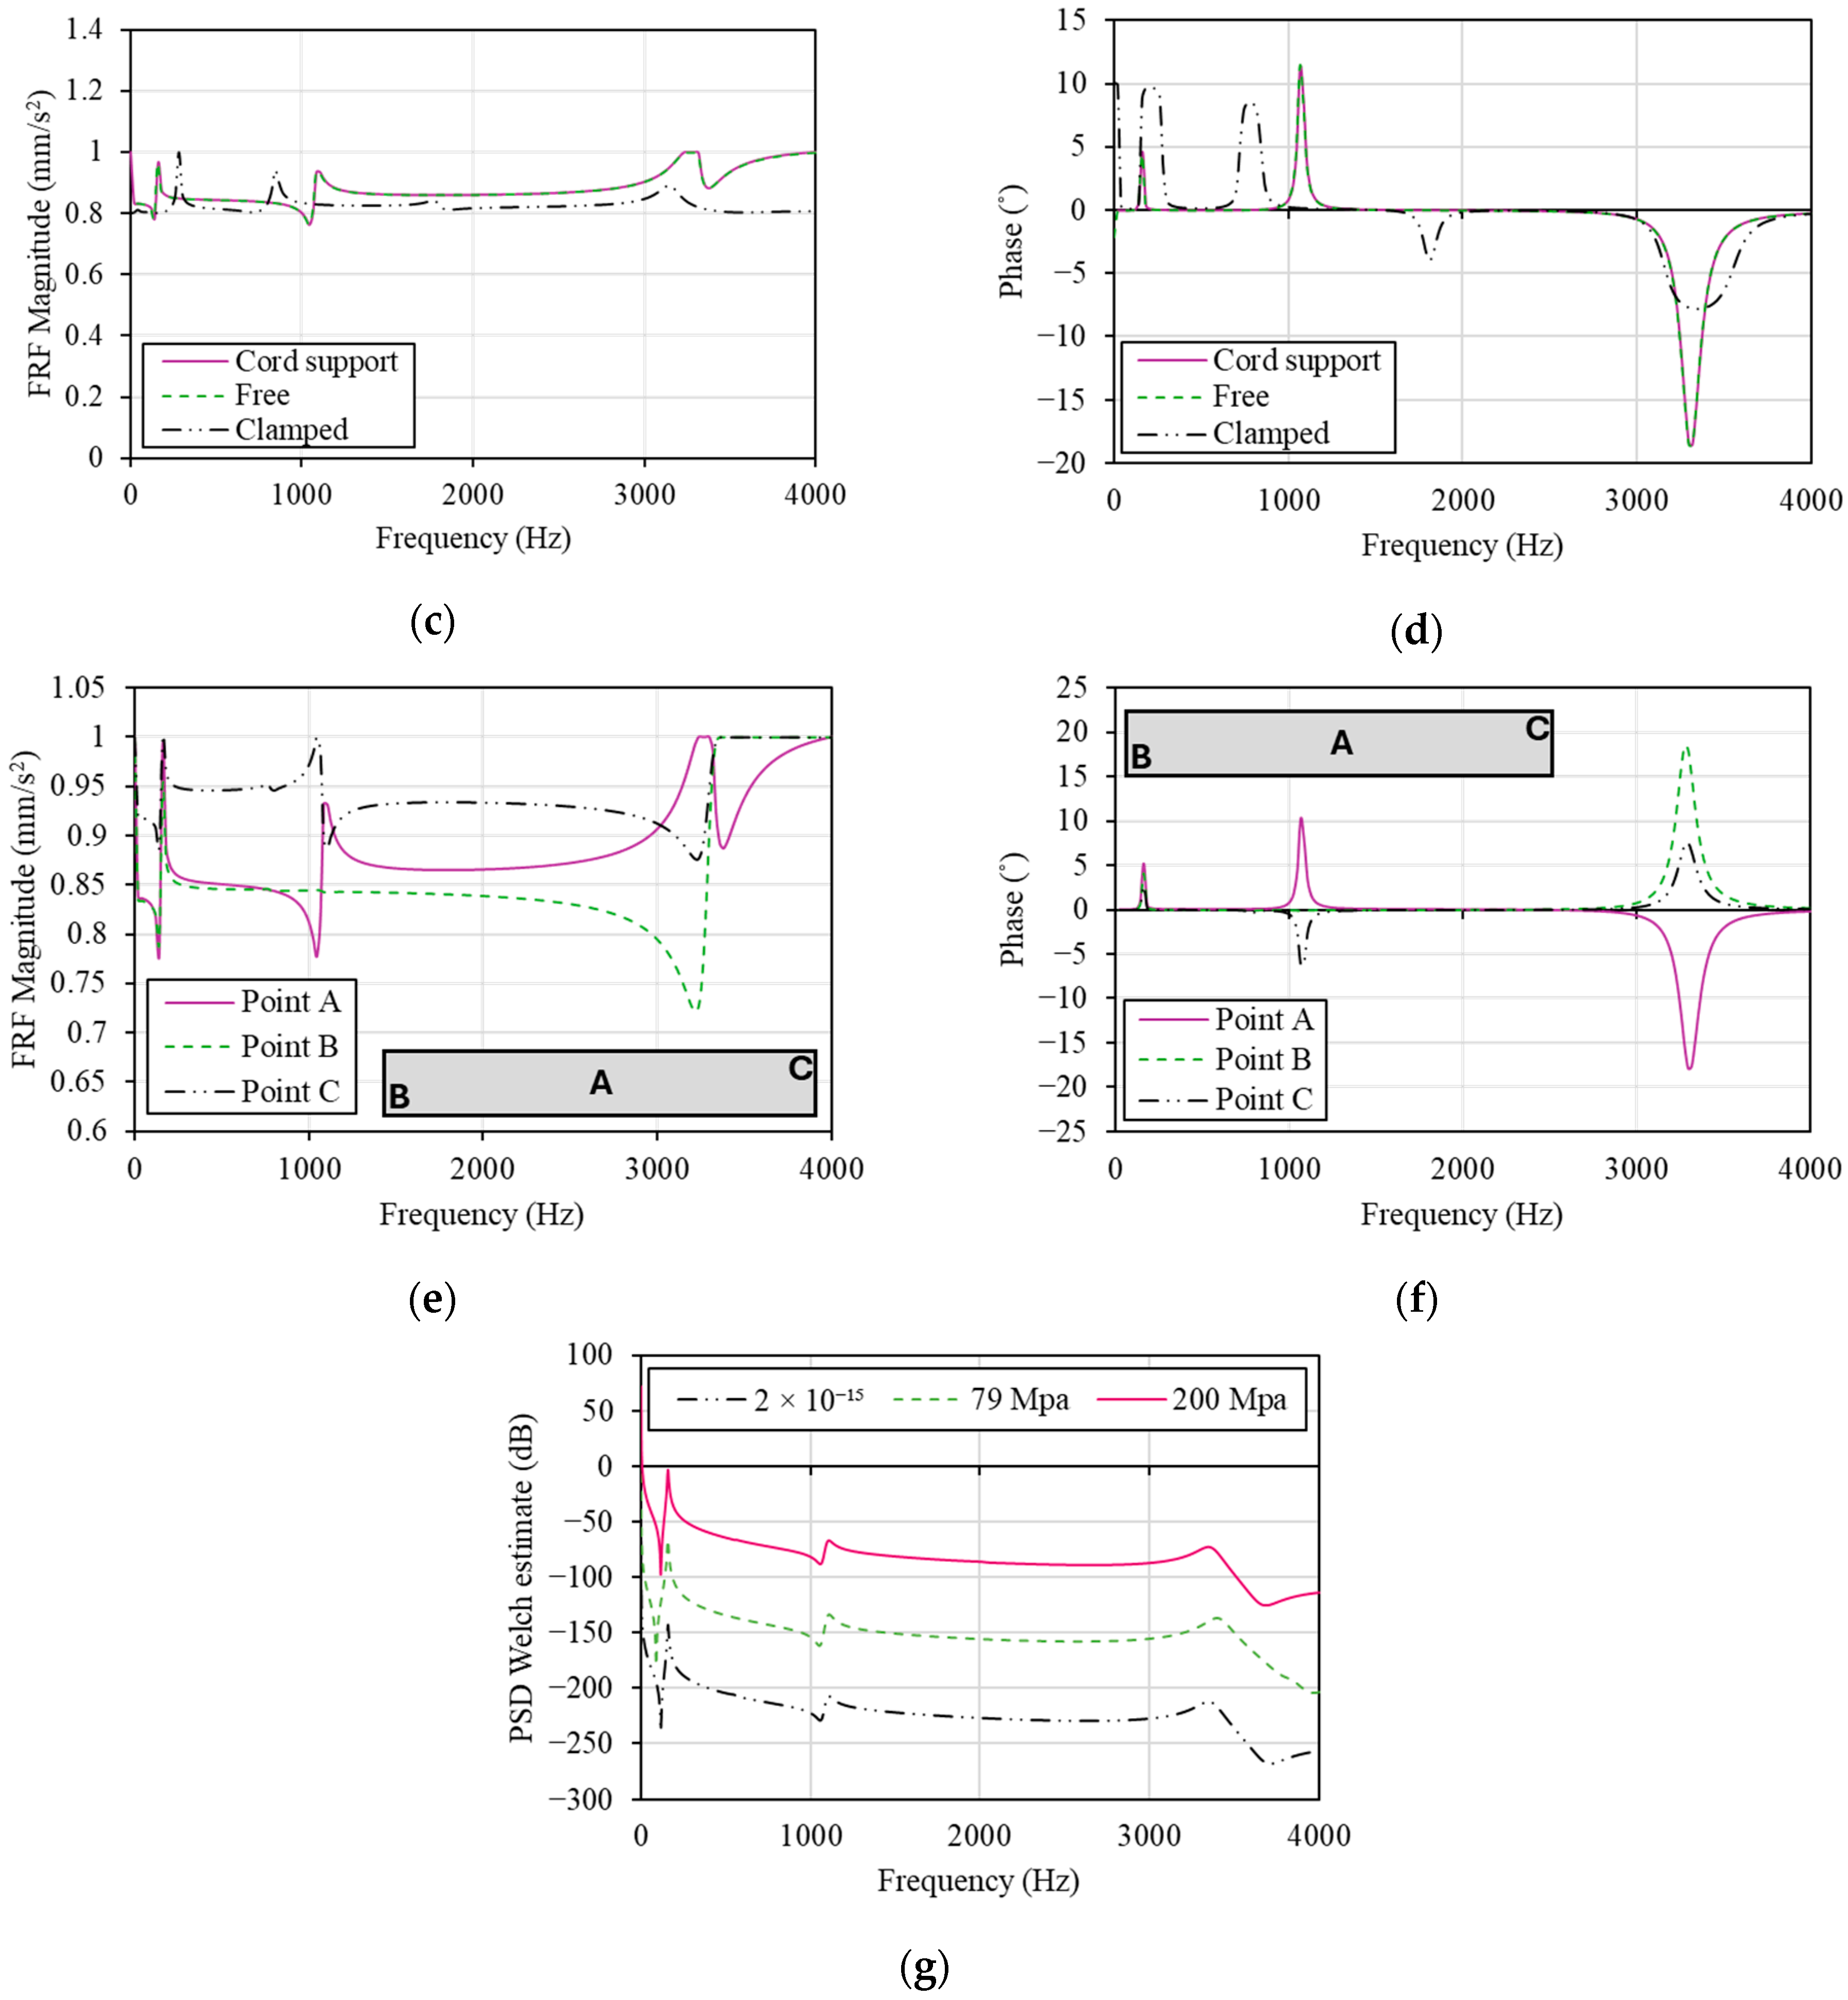
4.5.2. Parametric Frequency Response Function (FRF) Analysis
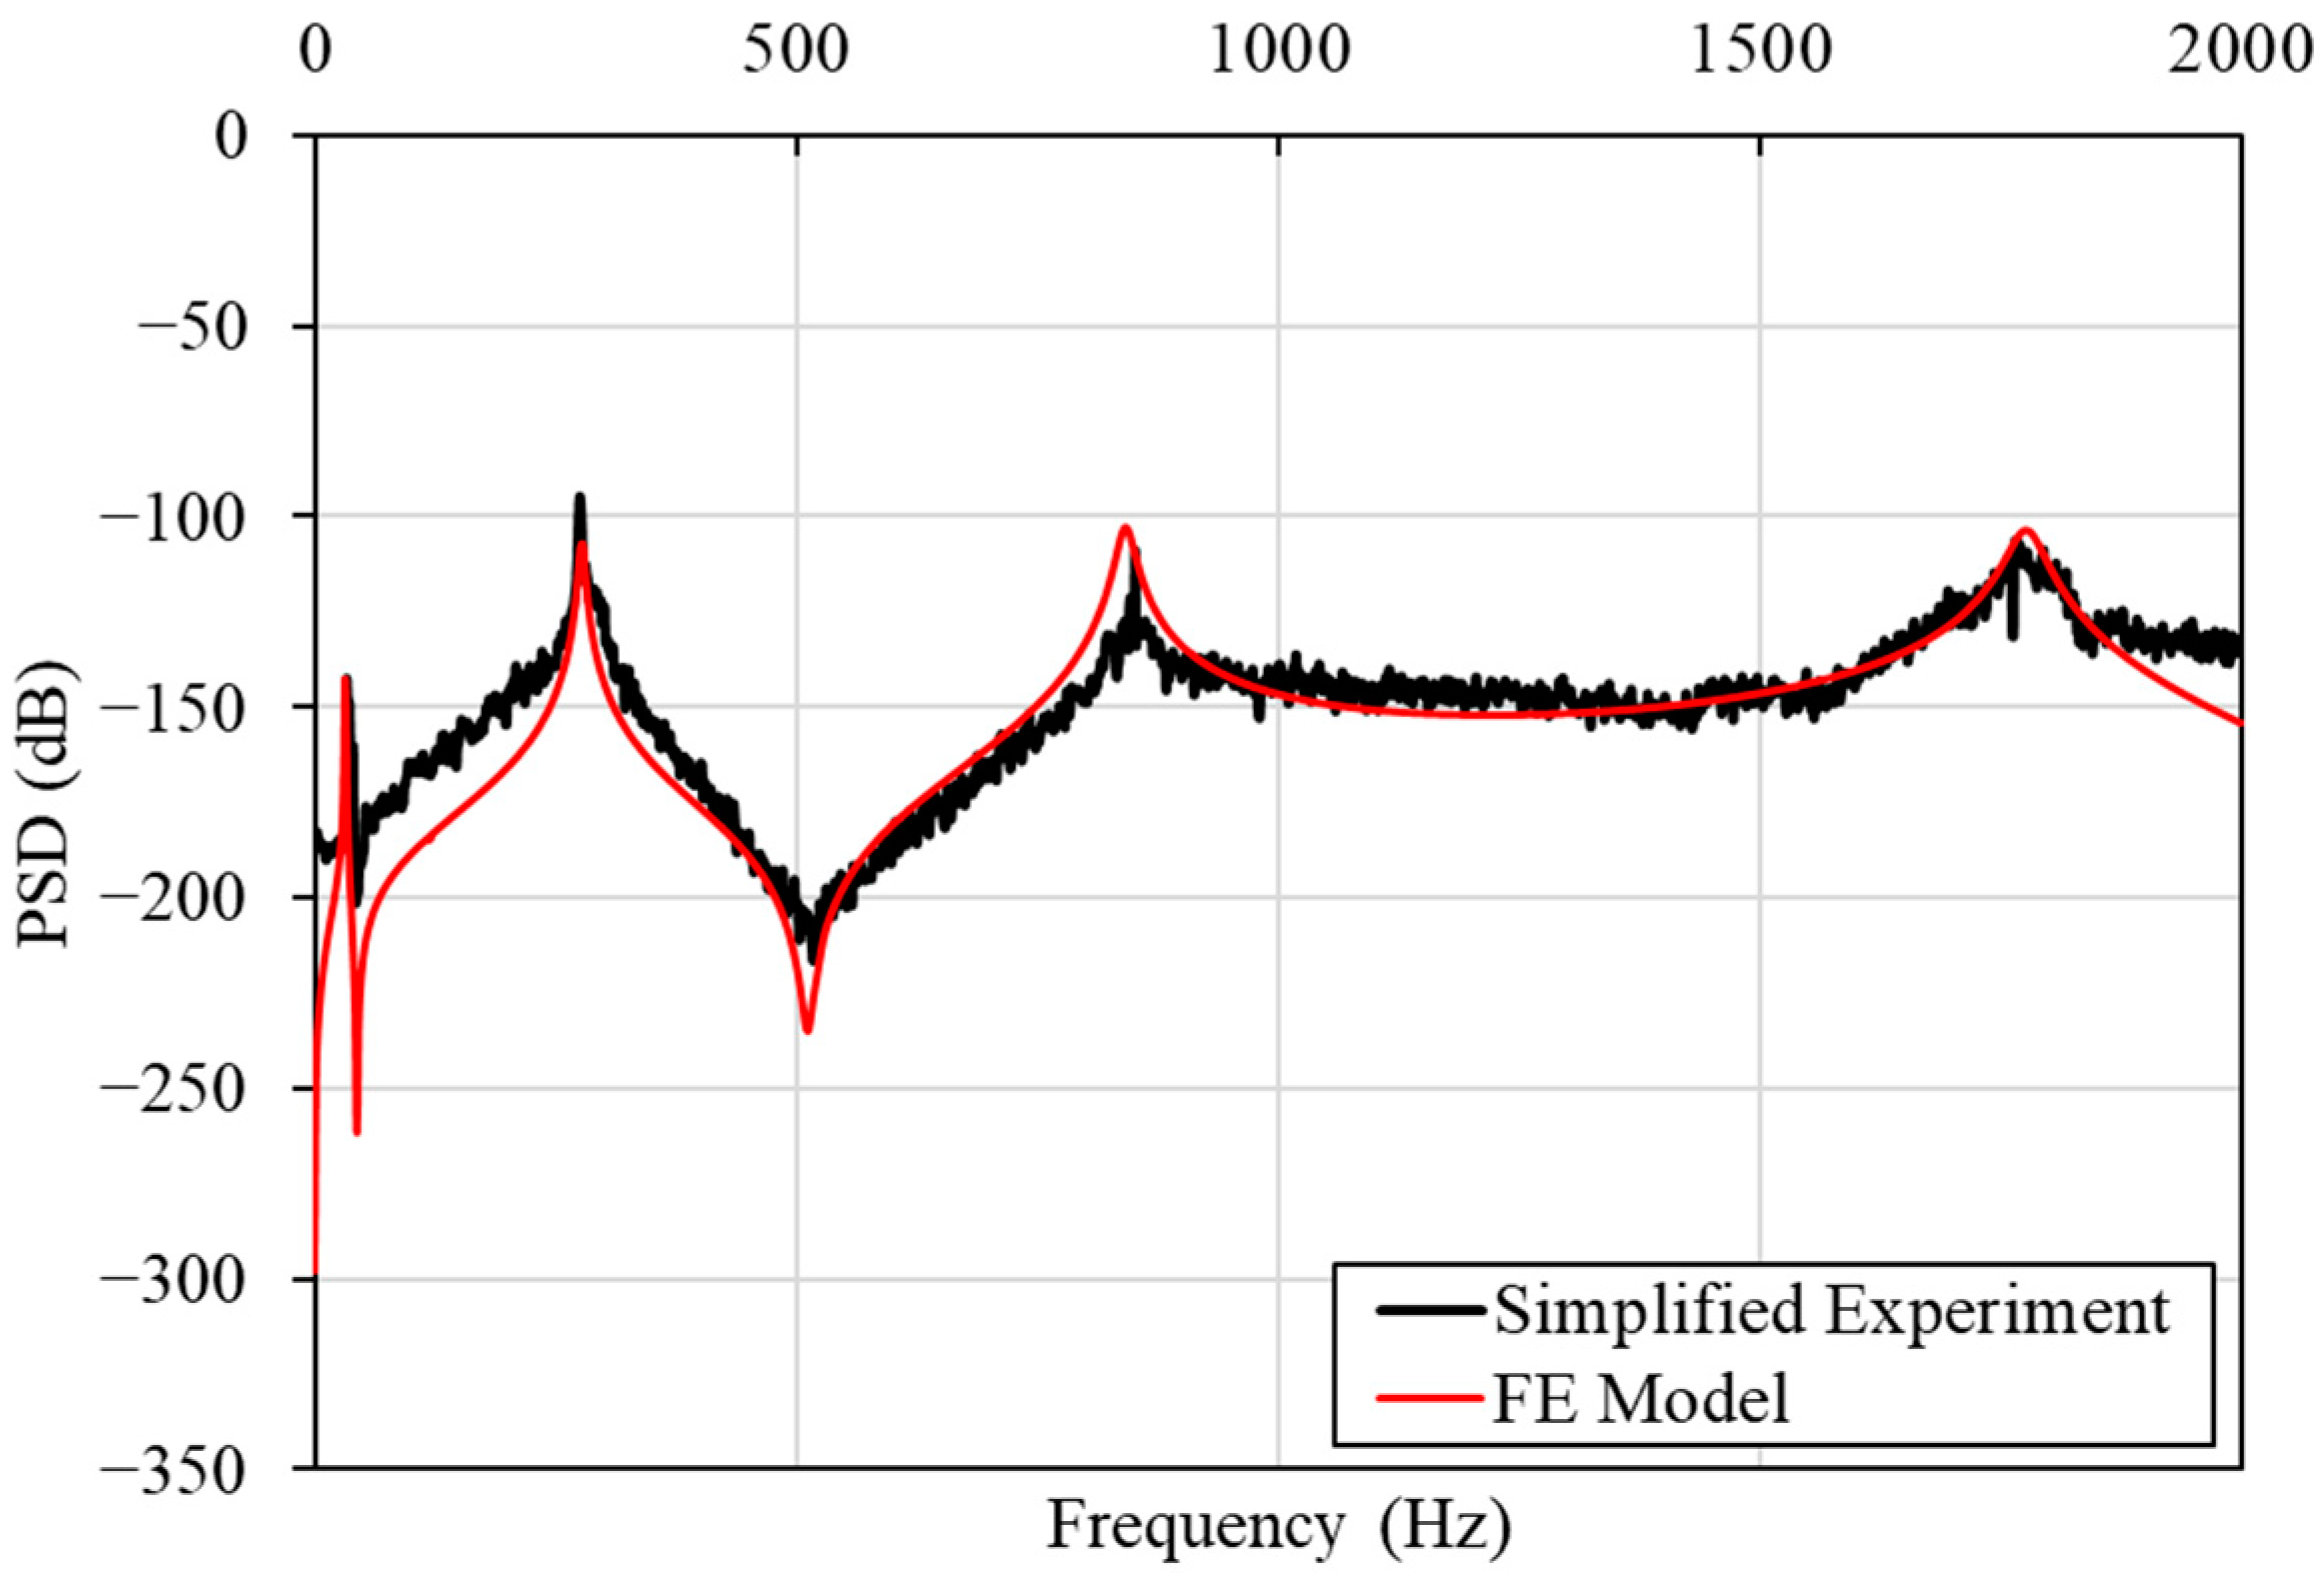
4.5.3. Validation of the RVM (Healthy State)
4.6. Numerical Fatigue Damage Identifiability Assessment
Assessment Results with Experimental Validation
- : FEM-based analytical PSD for the FS;
- : FEM-based analytical PSD for the Healthy State;
- : absolute of the FEM-based analytical PSD for the FS;
- : absolute value of the FEM-based analytical PSD for the Healthy State,
- : a specific frequency;
- : the upper (max) frequency within the range of interest;
- : cosine of the angle between the two FEM-based analytical PSDs;
- : norm of the FEM-based analytical PSD;
- : normalized Mahalanobis distance between two health states;
- : difference between two FEM-based analytical PSDs;
- : estimated covariance matrix of the two FEM-based analytical PSDs (Healthy and corresponding Fatigue State); and
- : inverse of the estimated covariance matrix of the two FEM-based analytical PSDs (Healthy and corresponding Fatigue State).
5. Concluding Remarks
- The Fatigue Delamination Module (FDM) accurately simulates the fatigue delamination initiation and propagation. Furthermore, FDM captures the fatigue behavior of thermoplastic coupons, proving how severe delamination is for the coupon;
- The Random Vibration Model (RVM) accurately simulates the vibration response of both healthy and damaged composite coupons under various excitation conditions. This was validated in two different cases using in-house experimental data. Additionally, the RVM demonstrated similar sensitivity to damage as observed in the experiments, showing a shift in the natural frequencies to the left;
- A parametric study using the FRF model revealed that the Finite Element (FE) mesh density had a minimal effect, while the measurement location, boundary conditions, and excitation intensity significantly influenced the FRF amplitude’s intensity;
- All damage metrics, using the FEM-based Power Spectral Density (PSD) spectrums, achieved highly effective damage detectability, reaching 100% performance. Frequency-related damage metrics also showed a monotonic increase, making them suitable for damage classification;
- The proposed numerical tool supports the design and optimization of a random vibration-based Structural Health Monitoring (SHM) system for composite structures through the following steps:
- Predicting fatigue damage progression and residual strength as functions of the number of cycles.
- Simulating the random vibration response of the healthy structure.
- Introducing fatigue damage into the RVM and simulating the random vibration response of the damaged structure.
- Maximizing detection efficiency by comparing the FEM-based PSD spectrums of the healthy and damaged states.
Author Contributions
Funding
Data Availability Statement
Acknowledgments
Conflicts of Interest
Abbreviations
| CFRP | Carbon Fiber Reinforced Plastics |
| DM | Damage Metric |
| LDV | Laser Doppler Vibrometer |
| FDM | Fatigue Delamination Module |
| FE | Finite Element |
| FEM | Finite Element Model |
| FRF | Frequency Response Function |
| FS | Fatigue State |
| PSD | Power Spectral Density |
| RVM | Random Vibration Module |
| SEM | Scanning Electron Microscopy |
| SHM | Structural Health Monitoring |
References
- Pantelakis, S.; Tserpes, K. (Eds.) Revolutionizing Aircraft Materials and Processes; Springer International Publishing: Cham, Switzerland, 2020; ISBN 978-3-030-35345-2. [Google Scholar]
- Structural Health Monitoring (SHM) in Aerospace Structures; Woodhead Publishing: Cambridge, UK; Elsevier Ltd.: Amsterdam, The Netherlands, 2016; ISBN 978-0-08-100148-6.
- Güemes, A.; Fernandez-Lopez, A.; Pozo, A.R.; Sierra-Pérez, J. Structural Health Monitoring for Advanced Composite Structures: A Review. J. Compos. Sci. 2020, 4, 13. [Google Scholar] [CrossRef]
- Zorman, A.; Slavič, J.; Boltežar, M. Vibration Fatigue by Spectral Methods—A Review with Open-Source Support. Mech. Syst. Signal Process. 2023, 190, 110149. [Google Scholar] [CrossRef]
- Bjørheim, F.; Siriwardane, S.C.; Pavlou, D. A Review of Fatigue Damage Detection and Measurement Techniques. Int. J. Fatigue 2022, 154, 106556. [Google Scholar] [CrossRef]
- Withers, P.J.; Preuss, M. Fatigue and Damage in Structural Materials Studied by X-Ray Tomography. Annu. Rev. Mater. Res. 2012, 42, 81–103. [Google Scholar] [CrossRef]
- Shah, C.; Bosse, S.; Zinn, C.; von Hehl, A. Optimization of Non-Destructive Damage Detection of Hidden Damages in Fiber Metal Laminates Using X-Ray Tomography and Machine Learning Algorithms. In Proceedings of the Advances in System-Integrated Intelligence; Valle, M., Lehmhus, D., Gianoglio, C., Ragusa, E., Seminara, L., Bosse, S., Ibrahim, A., Thoben, K.-D., Eds.; Springer International Publishing: Cham, Switzerland, 2023; pp. 387–402. [Google Scholar]
- Noorsuhada, M.N. An Overview on Fatigue Damage Assessment of Reinforced Concrete Structures with the Aid of Acoustic Emission Technique. Constr. Build. Mater. 2016, 112, 424–439. [Google Scholar] [CrossRef]
- Dia, A.; Dieng, L.; Gaillet, L.; Gning, P.B. Damage Detection of a Hybrid Composite Laminate Aluminum/Glass under Quasi-Static and Fatigue Loadings by Acoustic Emission Technique. Heliyon 2019, 5, e01414. [Google Scholar] [CrossRef] [PubMed]
- Guo, Y.-E.; Shang, D.-G.; Zuo, L.-X.; Qu, L.-F.; Hou, G.; Cai, D.; Jin, T.; Yin, X. Identification of Fatigue Damage Modes for Carbon Fiber/Epoxy Composites Using Acoustic Emission Monitoring under Fully Reversed Loading. Polym. Compos. 2022, 43, 3371–3385. [Google Scholar] [CrossRef]
- Zuluaga-Ramírez, P.; Frövel, M.; Belenguer, T.; Salazar, F. Non Contact Inspection of the Fatigue Damage State of Carbon Fiber Reinforced Polymer by Optical Surface Roughness Measurements. NDT E Int. 2015, 70, 22–28. [Google Scholar] [CrossRef]
- Wong, L.; Chowdhury, N.; Wang, J.; Chiu, W.K.; Kodikara, J. Fatigue Damage Monitoring of a Composite Step Lap Joint Using Distributed Optical Fibre Sensors. Materials 2016, 9, 374. [Google Scholar] [CrossRef]
- Khan, S.U.; Munir, A.; Hussain, R.; Kim, J.-K. Fatigue Damage Behaviors of Carbon Fiber-Reinforced Epoxy Composites Containing Nanoclay. Compos. Sci. Technol. 2010, 70, 2077–2085. [Google Scholar] [CrossRef]
- Ansari, M.T.A.; Singh, K.K.; Azam, M.S. Fatigue Damage Analysis of Fiber-Reinforced Polymer Composites—A Review. J. Reinf. Plast. Compos. 2018, 37, 636–654. [Google Scholar] [CrossRef]
- Limongelli, M.P.; Manoach, E.; Quqa, S.; Giordano, P.F.; Bhowmik, B.; Pakrashi, V.; Cigada, A. Vibration Response-Based Damage Detection. In Structural Health Monitoring Damage Detection Systems for Aerospace; Sause, M.G.R., Jasiūnienė, E., Eds.; Springer Aerospace Technology; Springer International Publishing: Cham, Switzerland, 2021; pp. 133–173. ISBN 978-3-030-72191-6. [Google Scholar]
- Bull, M.K.; Norton, M.P. On the Hydrodynamic and Acoustic Wall Pressure Fluctuations in Turbulent Pipe Flow Due to a 90° Mitred Bend. J. Sound Vib. 1981, 76, 561–586. [Google Scholar] [CrossRef]
- Fan, Z.; Jiang, Y.; Zhang, S.; Chen, X. Experimental Research on Vibration Fatigue of CFRP and Its Influence Factors Based on Vibration Testing. Shock. Vib. 2017, 2017, e1241623. [Google Scholar] [CrossRef]
- Bachoo, R.; Elishakoff, I. Random Vibrations of Laminated Planar Frames. J. Sound Vib. 2023, 562, 117860. [Google Scholar] [CrossRef]
- Proso, U.; Slavič, J.; Boltežar, M. Vibration-Fatigue Damage Accumulation for Structural Dynamics with Non-Linearities. Int. J. Mech. Sci. 2016, 106, 72–77. [Google Scholar] [CrossRef]
- Andreaus, U.; Baragatti, P. Experimental Damage Detection of Cracked Beams by Using Nonlinear Characteristics of Forced Response. Mech. Syst. Signal Process. 2012, 31, 382–404. [Google Scholar] [CrossRef]
- Kim, H.-Y. Vibration-based damage identification using reconstructed frfs in composite structures. J. Sound Vib. 2003, 259, 1131–1146. [Google Scholar] [CrossRef]
- Kessler, S.S.; Spearing, S.M.; Atalla, M.J.; Cesnik, C.E.S.; Soutis, C. Damage Detection in Composite Materials Using Frequency Response Methods. Compos. Part B Eng. 2002, 33, 87–95. [Google Scholar] [CrossRef]
- Mei, H.; Migot, A.; Haider, M.F.; Joseph, R.; Bhuiyan, M.Y.; Giurgiutiu, V. Vibration-Based In-Situ Detection and Quantification of Delamination in Composite Plates. Sensors 2019, 19, 1734. [Google Scholar] [CrossRef]
- Samareh-Mousavi, S.S.; Chen, X.; McGugan, M.; Semenov, S.; Berring, P.; Branner, K.; Ludwig, N. Monitoring Fatigue Delamination Growth in a Wind Turbine Blade Using Passive Thermography and Acoustic Emission. Struct. Health Monit. 2024, 23, 2906–2921. [Google Scholar] [CrossRef]
- Caminero, M.A.; Pavlopoulou, S.; Lopez-Pedrosa, M.; Nicolaisson, B.G.; Pinna, C.; Soutis, C. Analysis of Adhesively Bonded Repairs in Composites: Damage Detection and Prognosis. Compos. Struct. 2013, 95, 500–517. [Google Scholar] [CrossRef]
- Patil, S.; Mallikarjuna Reddy, D. Impact Damage Assessment in Carbon Fiber Reinforced Composite Using Vibration-Based New Damage Index and Ultrasonic C-Scanning Method. Structures 2020, 28, 638–650. [Google Scholar] [CrossRef]
- Tsivouraki, N.; Fassois, S.; Tserpes, K. On the Random Vibration-Based Progressive Fatigue Damage Detection and Classification for Thermoplastic Coupons under Population and Operational Uncertainty. Compos. Struct. 2024, 349, 118524. [Google Scholar] [CrossRef]
- Giagopoulos, D.; Arailopoulos, A.; Dertimanis, V.; Papadimitriou, C.; Chatzi, E.; Grompanopoulos, K. Structural Health Monitoring and Fatigue Damage Estimation Using Vibration Measurements and Finite Element Model Updating. Struct. Health Monit. 2019, 18, 1189–1206. [Google Scholar] [CrossRef]
- Sahu, S.K.; Das, P. Experimental and Numerical Studies on Vibration of Laminated Composite Beam with Transverse Multiple Cracks. Mech. Syst. Signal Process. 2020, 135, 106398. [Google Scholar] [CrossRef]
- Moon, T.-C.; Kim, H.-Y.; Hwang, W. Natural-Frequency Reduction Model for Matrix-Dominated Fatigue Damage of Composite Laminates. Compos. Struct. 2003, 62, 19–26. [Google Scholar] [CrossRef]
- Valašková, V.; Melcer, J. Bridge Natural Frequencies, Numerical Solution versus Experiment. Appl. Sci. 2022, 12, 1765. [Google Scholar] [CrossRef]
- Medeiros, R.; Sartorato, M.; Ribeiro, M.; Vandepitte, D.; Tita, V. Numerical and Experimental Analyses about SHM Metrics Using Piezoelectric Materials. In Proceedings of the International Conference on Noise and Vibration Engineering—ISMA, Leuven, Belgium, 17–19 September 2012; pp. 3285–3300. [Google Scholar]
- Gomes, G.F.; Mendéz, Y.A.D.; da Cunha, S.S.; Ancelotti, A.C. A Numerical–Experimental Study for Structural Damage Detection in CFRP Plates Using Remote Vibration Measurements. J. Civ. Struct. Health Monit. 2018, 8, 33–47. [Google Scholar] [CrossRef]
- de Menezes, V.G.S.; Souza, G.S.C.; Vandepitte, D.; Tita, V.; de Medeiros, R. Defect and Damage Detection in Filament Wound Carbon Composite Cylinders: A New Numerical-Experimental Methodology Based on Vibrational Analyses. Compos. Struct. 2021, 276, 114548. [Google Scholar] [CrossRef]
- Dubey, A.; Denis, V.; Serra, R. Localization and Quantification of Damage by Frequency Based Methods: Numerical and Experimental Applications on Bending Vibration Beams. In Proceedings of the Surveillance, Vishno and AVE Conferences, INSA-Lyon, Université de Lyon, Lyon, France, 8–10 July 2019. [Google Scholar]
- Li, X.; Qu, P.; Kong, H.; Zhu, Y.; Hua, C.; Guo, A.; Wang, S. Multi-Scale Numerical Analysis of Damage Modes in 3D Stitched Composites. Int. J. Mech. Sci. 2024, 266, 108983. [Google Scholar] [CrossRef]
- Sharma, J. Theoretical and Experimental Modal Analysis of Beam. In Engineering Vibration, Communication and Information Processing; Lecture Notes in Electrical Engineering; Springer International Publishing: Cham, Switzerland, 2019; pp. 177–186. ISBN 9789811316418. [Google Scholar]
- Karczub, D.G.; Fagerlund, A.C. Dynamic Stress Predictions of Acoustic-Induced Pipe Vibration Failures. In Proceedings of the ASME 2005 24th International Conference on Offshore Mechanics and Arctic Engineering, Halkidiki, Greece, 12–17 June 2005; American Society of Mechanical Engineers Digital Collection. pp. 637–640. [Google Scholar]
- Sartorato, M.; de Medeiros, R.; Vandepitte, D.; Tita, V. Computational Model for Supporting SHM Systems Design: Damage Identification via Numerical Analyses. Mech. Syst. Signal Process. 2017, 84, 445–461. [Google Scholar] [CrossRef]
- Xia, J.; Li, G.; Li, B.; Cheng, L.; Zhou, B. Fatigue Life Prediction of Package-on-Package Stacking Assembly under Random Vibration Loading. Microelectron. Reliab. 2017, 71, 111–118. [Google Scholar] [CrossRef]
- Barraza-Contreras, J.M.; Piña-Monarrez, M.R.; Molina, A.; Torres-Villaseñor, R.C. Random Vibration Fatigue Analysis Using a Nonlinear Cumulative Damage Model. Appl. Sci. 2022, 12, 4310. [Google Scholar] [CrossRef]
- Liu, F.; Lu, Y.; Wang, Z.; Zhang, Z. Numerical Simulation and Fatigue Life Estimation of BGA Packages under Random Vibration Loading. Microelectron. Reliab. 2015, 55, 2777–2785. [Google Scholar] [CrossRef]
- Gao, D.; Yao, W.; Wen, W.; Huang, J. A Multiaxial Fatigue Life Prediction Method for Metallic Material Under Combined Random Vibration Loading and Mean Stress Loading in the Frequency Domain. Int. J. Fatigue 2021, 148, 106235. [Google Scholar] [CrossRef]
- Yam, L.H.; Yan, Y.J.; Jiang, J.S. Vibration-Based Damage Detection for Composite Structures Using Wavelet Transform and Neural Network Identification. Compos. Struct. 2003, 60, 403–412. [Google Scholar] [CrossRef]
- Bayissa, W.L.; Haritos, N.; Thelandersson, S. Vibration-Based Structural Damage Identification Using Wavelet Transform. Mech. Syst. Signal Process. 2008, 22, 1194–1215. [Google Scholar] [CrossRef]
- Silik, A.; Noori, M.; Altabey, W.A.; Ghiasi, R.; Wu, Z. Comparative Analysis of Wavelet Transform for Time-Frequency Analysis and Transient Localization in Structural Health Monitoring. Struct. Durab. Health Monit. 2021, 15, 1–22. [Google Scholar] [CrossRef]
- Khan, A.; Ko, D.-K.; Lim, S.C.; Kim, H.S. Structural Vibration-Based Classification and Prediction of Delamination in Smart Composite Laminates Using Deep Learning Neural Network. Compos. Part B Eng. 2019, 161, 586–594. [Google Scholar] [CrossRef]
- Jayasundara, N.; Thambiratnam, D.P.; Chan, T.H.T.; Nguyen, A. Damage Detection and Quantification in Deck Type Arch Bridges Using Vibration Based Methods and Artificial Neural Networks. Eng. Fail. Anal. 2020, 109, 104265. [Google Scholar] [CrossRef]
- Liang, Z.; Ramakrishnan, K.R.; Ng, C.-T.; Zhang, Z.; Fu, J. Vibration-Based Prediction of Residual Fatigue Life for Composite Laminates through Frequency Measurements. Compos. Struct. 2024, 329, 117771. [Google Scholar] [CrossRef]
- Capponi, L.; Česnik, M.; Slavič, J.; Cianetti, F.; Boltežar, M. Non-Stationarity Index in Vibration Fatigue: Theoretical and Experimental Research. Int. J. Fatigue 2017, 104, 221–230. [Google Scholar] [CrossRef]
- Palmieri, M.; Česnik, M.; Slavič, J.; Cianetti, F.; Boltežar, M. Non-Gaussianity and Non-Stationarity in Vibration Fatigue. Int. J. Fatigue 2017, 97, 9–19. [Google Scholar] [CrossRef]
- Fassois, S.D.; Sakellariou, J.S. Statistical Time Series Methods for SHM. In Encyclopedia of Structural Health Monitoring; John Wiley & Sons, Ltd.: Hoboken, NJ, USA, 2009; ISBN 978-0-470-06162-6. [Google Scholar]
- Hios, J.D.; Fassois, S.D. Statistical Damage Detection in a Smart Structure under Different Temperatures via Vibration Testing: A Global Model Based Approach. Key Eng. Mater. 2009, 413–414, 261–268. [Google Scholar] [CrossRef]
- Kopsaftopoulos, F.P.; Fassois, S.D. Vibration Based Health Monitoring for a Lightweight Truss Structure: Experimental Assessment of Several Statistical Time Series Methods. Mech. Syst. Signal Process. 2010, 24, 1977–1997. [Google Scholar] [CrossRef]
- Vamvoudakis-Stefanou, K.J.; Sakellariou, J.S.; Fassois, S.D. Vibration-Based Damage Detection for a Population of Nominally Identical Structures: Unsupervised Multiple Model (MM) Statistical Time Series Type Methods. Mech. Syst. Signal Process. 2018, 111, 149–171. [Google Scholar] [CrossRef]
- Panagiotopoulos, A.; Dmitri, T.; Spilios, F.D. Damage Detection on the Blade of an Operating Wind Turbine via a Single Vibration Sensor and Statistical Time Series Methods: Exploring the Performance Limits of Robust Methods. Struct. Health Monit. 2022, 22, 433–448. [Google Scholar] [CrossRef]
- Kakolyris, G.K.; Fassois, S.D.; Kefal, A.; Belur, M.Y. Random vibration based robust structural health monitoring for a composite wing-shaped structure under temperature uncertainty: An exploratory study. In Proceedings of the International Conference on Noise and Vibration Engineering (ISMA 2024), Leuven, Belgium, 9–11 September 2024. [Google Scholar]
- Saramantas, I.E.; Konis, P.E.; Kriatsiotis, I.M.; Ofir, Y.; Kressel, I.; Spiliotopoulos, P.E.; Fera, F.T.; Sakellariou, J.S.; Fassois, S.D.; Giannopoulos, F.; et al. An Exploratory Study on Data-Driven Vibration Based Damage Detection and Characterization for a Population of Composite Aerostructures. J. Phys. Conf. Ser. 2024, 2647, 182029. [Google Scholar] [CrossRef]
- Robinson, P.; Galvanetto, U.; Tumino, D.; Bellucci, G.; Violeau, D. Numerical Simulation of Fatigue-Driven Delamination Using Interface Elements. Int. J. Numer. Meth. Engng. 2005, 63, 1824–1848. [Google Scholar] [CrossRef]
- Sioutis, I.; Tserpes, K. A Mixed-Mode Fatigue Crack Growth Model for Co-Consolidated Thermoplastic Joints. Int. J. Fatigue 2023, 173, 107682. [Google Scholar] [CrossRef]
- Tsivouraki, N.; Tserpes, K.; Sioutis, I. Modelling of Fatigue Delamination Growth and Prediction of Residual Tensile Strength of Thermoplastic Coupons. Materials 2024, 17, 362. [Google Scholar] [CrossRef] [PubMed]
- Wijker, J. Random Vibrations in Spacecraft Structures Design; Solid Mechanics and Its Applications; Springer: Dordrecht, The Netherlands, 2009; Volume 165, ISBN 978-90-481-2727-6. [Google Scholar]
- Russell, A.; Street, K. Predicting Interlaminar Fatigue Crack Growth Rates in Compressively Loaded Laminates. In Composite Materials: Fatigue and Fracture, Second Volume; ASTM International: West Conshohocken, PA, USA, 1989; pp. 162–178. ISBN 978-0-8031-1190-5. [Google Scholar]
- Sound Pressure. Available online: https://www.engineeringtoolbox.com/sound-pressure-d_711.html (accessed on 15 July 2024).
- Vibration Converter. Available online: https://strutt.arup.com/help/Vibration/VibrationConvert.htm (accessed on 15 July 2024).
- Tsivouraki, N.; Tserpes, K.; Fassois, S. Random Vibration-Based Progressive Fatigue Damage Monitoring in Thermoplastic Coupons: A Preliminary Investigation. J. Phys. Conf. Ser. 2024, 2692, 012033. [Google Scholar] [CrossRef]
- Toray Cetex. Datasheet of TC 1225 LM PAEK; Toray Cetex: Morgan Hill, CA, USA, 2023; p. 5. [Google Scholar]
- Luinge, H.; Howell, D.D.; Straetker, J. Low Melt Paek (LM PAEK) Prepreg for Improved Processing of Thermoplastic Composites. In Proceedings of the SAMPE 2019, Charlotte, NC, USA, 11 April 2019. SAMPE. [Google Scholar]
- Miller, S.G.; Heimann, P.J.; Miller, A.J.; Scheiman, D.A.; McCorkle, L.S. Manufacturing and Mechanical Testing of TC1225/LM-PAEK and TC1200/PEEK Thermoplastic Composite Panels; National Aeronautics and Space Administration, Glenn Research Center: Cleveland, OH, USA, 2023.
- Binetruy, C.; Jacquemin, F. Vibration-based progressive fatigue damage detection and classification for thermoplastic coupons under population and operational uncertainty. In Proceedings of the 21st European Conference on Composite Materials, Nantes, France, 2–5 July 2024; Nantes Université: Nantes, France, 2024; Volume 3, pp. 604–611. [Google Scholar]


| Property | Value |
|---|---|
| Density (ton/mm3) | 1.75 × 10⁻⁹ |
| Elastic modulus—a direction (MPa) | 95,000 |
| Elastic modulus—b direction (MPa) | 8500 |
| Elastic modulus—c direction (MPa) | 8500 |
| Shear modulus—ab direction (MPa) | 4300 |
| Shear modulus—bc direction (MPa) | 3571 |
| Shear modulus—ac direction (MPa) | 4300 |
| Poisson’s ratio—νba | 0.027 |
| Poisson’s ratio—νca | 0.024 |
| Poisson’s ratio—νcb | 0.172 |
| Random Vibration Test with Acoustic Excitation | |||
|---|---|---|---|
| Signal Characteristics | Welch Parameters | ||
| 12,800 Hz | Segment length | 25,600 samples | |
| Signal duration | 60 s | Overlap | 90% |
| Signal bandwidth | 0–6400 Hz | 1 Hz | |
| Parameter | Values |
|---|---|
| Measurement location | Center, Upper right corner, Lower left corner |
| Mesh density | 235,000 elements, 432,000 elements, 2,080,000 elements |
| Boundary conditions | Cord-support, Free, Clamped |
| Excitation intensity | 2 × 10⁻¹⁵ MPa, 79 MPa, 200 MPa |
| Simplified Random Vibration Test | |||
|---|---|---|---|
| Signal Characteristics | Welch Parameters | ||
| 2000 Hz | Segment length | 4000 samples | |
| Signal duration | 10 s | Overlap | 90% |
| Signal bandwidth | 0–2000 Hz | 1 Hz | |
Disclaimer/Publisher’s Note: The statements, opinions and data contained in all publications are solely those of the individual author(s) and contributor(s) and not of MDPI and/or the editor(s). MDPI and/or the editor(s) disclaim responsibility for any injury to people or property resulting from any ideas, methods, instructions or products referred to in the content. |
© 2025 by the authors. Licensee MDPI, Basel, Switzerland. This article is an open access article distributed under the terms and conditions of the Creative Commons Attribution (CC BY) license (https://creativecommons.org/licenses/by/4.0/).
Share and Cite
Tsivouraki, N.; Fassois, S.; Tserpes, K. A Numerical Tool for Assessing Random Vibration-Based Fatigue Damage Diagnosability in Thermoplastic Coupons. J. Compos. Sci. 2025, 9, 153. https://doi.org/10.3390/jcs9040153
Tsivouraki N, Fassois S, Tserpes K. A Numerical Tool for Assessing Random Vibration-Based Fatigue Damage Diagnosability in Thermoplastic Coupons. Journal of Composites Science. 2025; 9(4):153. https://doi.org/10.3390/jcs9040153
Chicago/Turabian StyleTsivouraki, Niki, Spilios Fassois, and Konstantinos Tserpes. 2025. "A Numerical Tool for Assessing Random Vibration-Based Fatigue Damage Diagnosability in Thermoplastic Coupons" Journal of Composites Science 9, no. 4: 153. https://doi.org/10.3390/jcs9040153
APA StyleTsivouraki, N., Fassois, S., & Tserpes, K. (2025). A Numerical Tool for Assessing Random Vibration-Based Fatigue Damage Diagnosability in Thermoplastic Coupons. Journal of Composites Science, 9(4), 153. https://doi.org/10.3390/jcs9040153