
Fracture Behavior of Additively Manufactured Carbon Fiber Reinforced Acrylonitrile-Styrene-Acrylate Containing Cracks and Notches

 ,
,  , , and
Abstract
1. Introduction
2. Materials and Methods
3. Results and Discussion
3.1. Tensile Tests
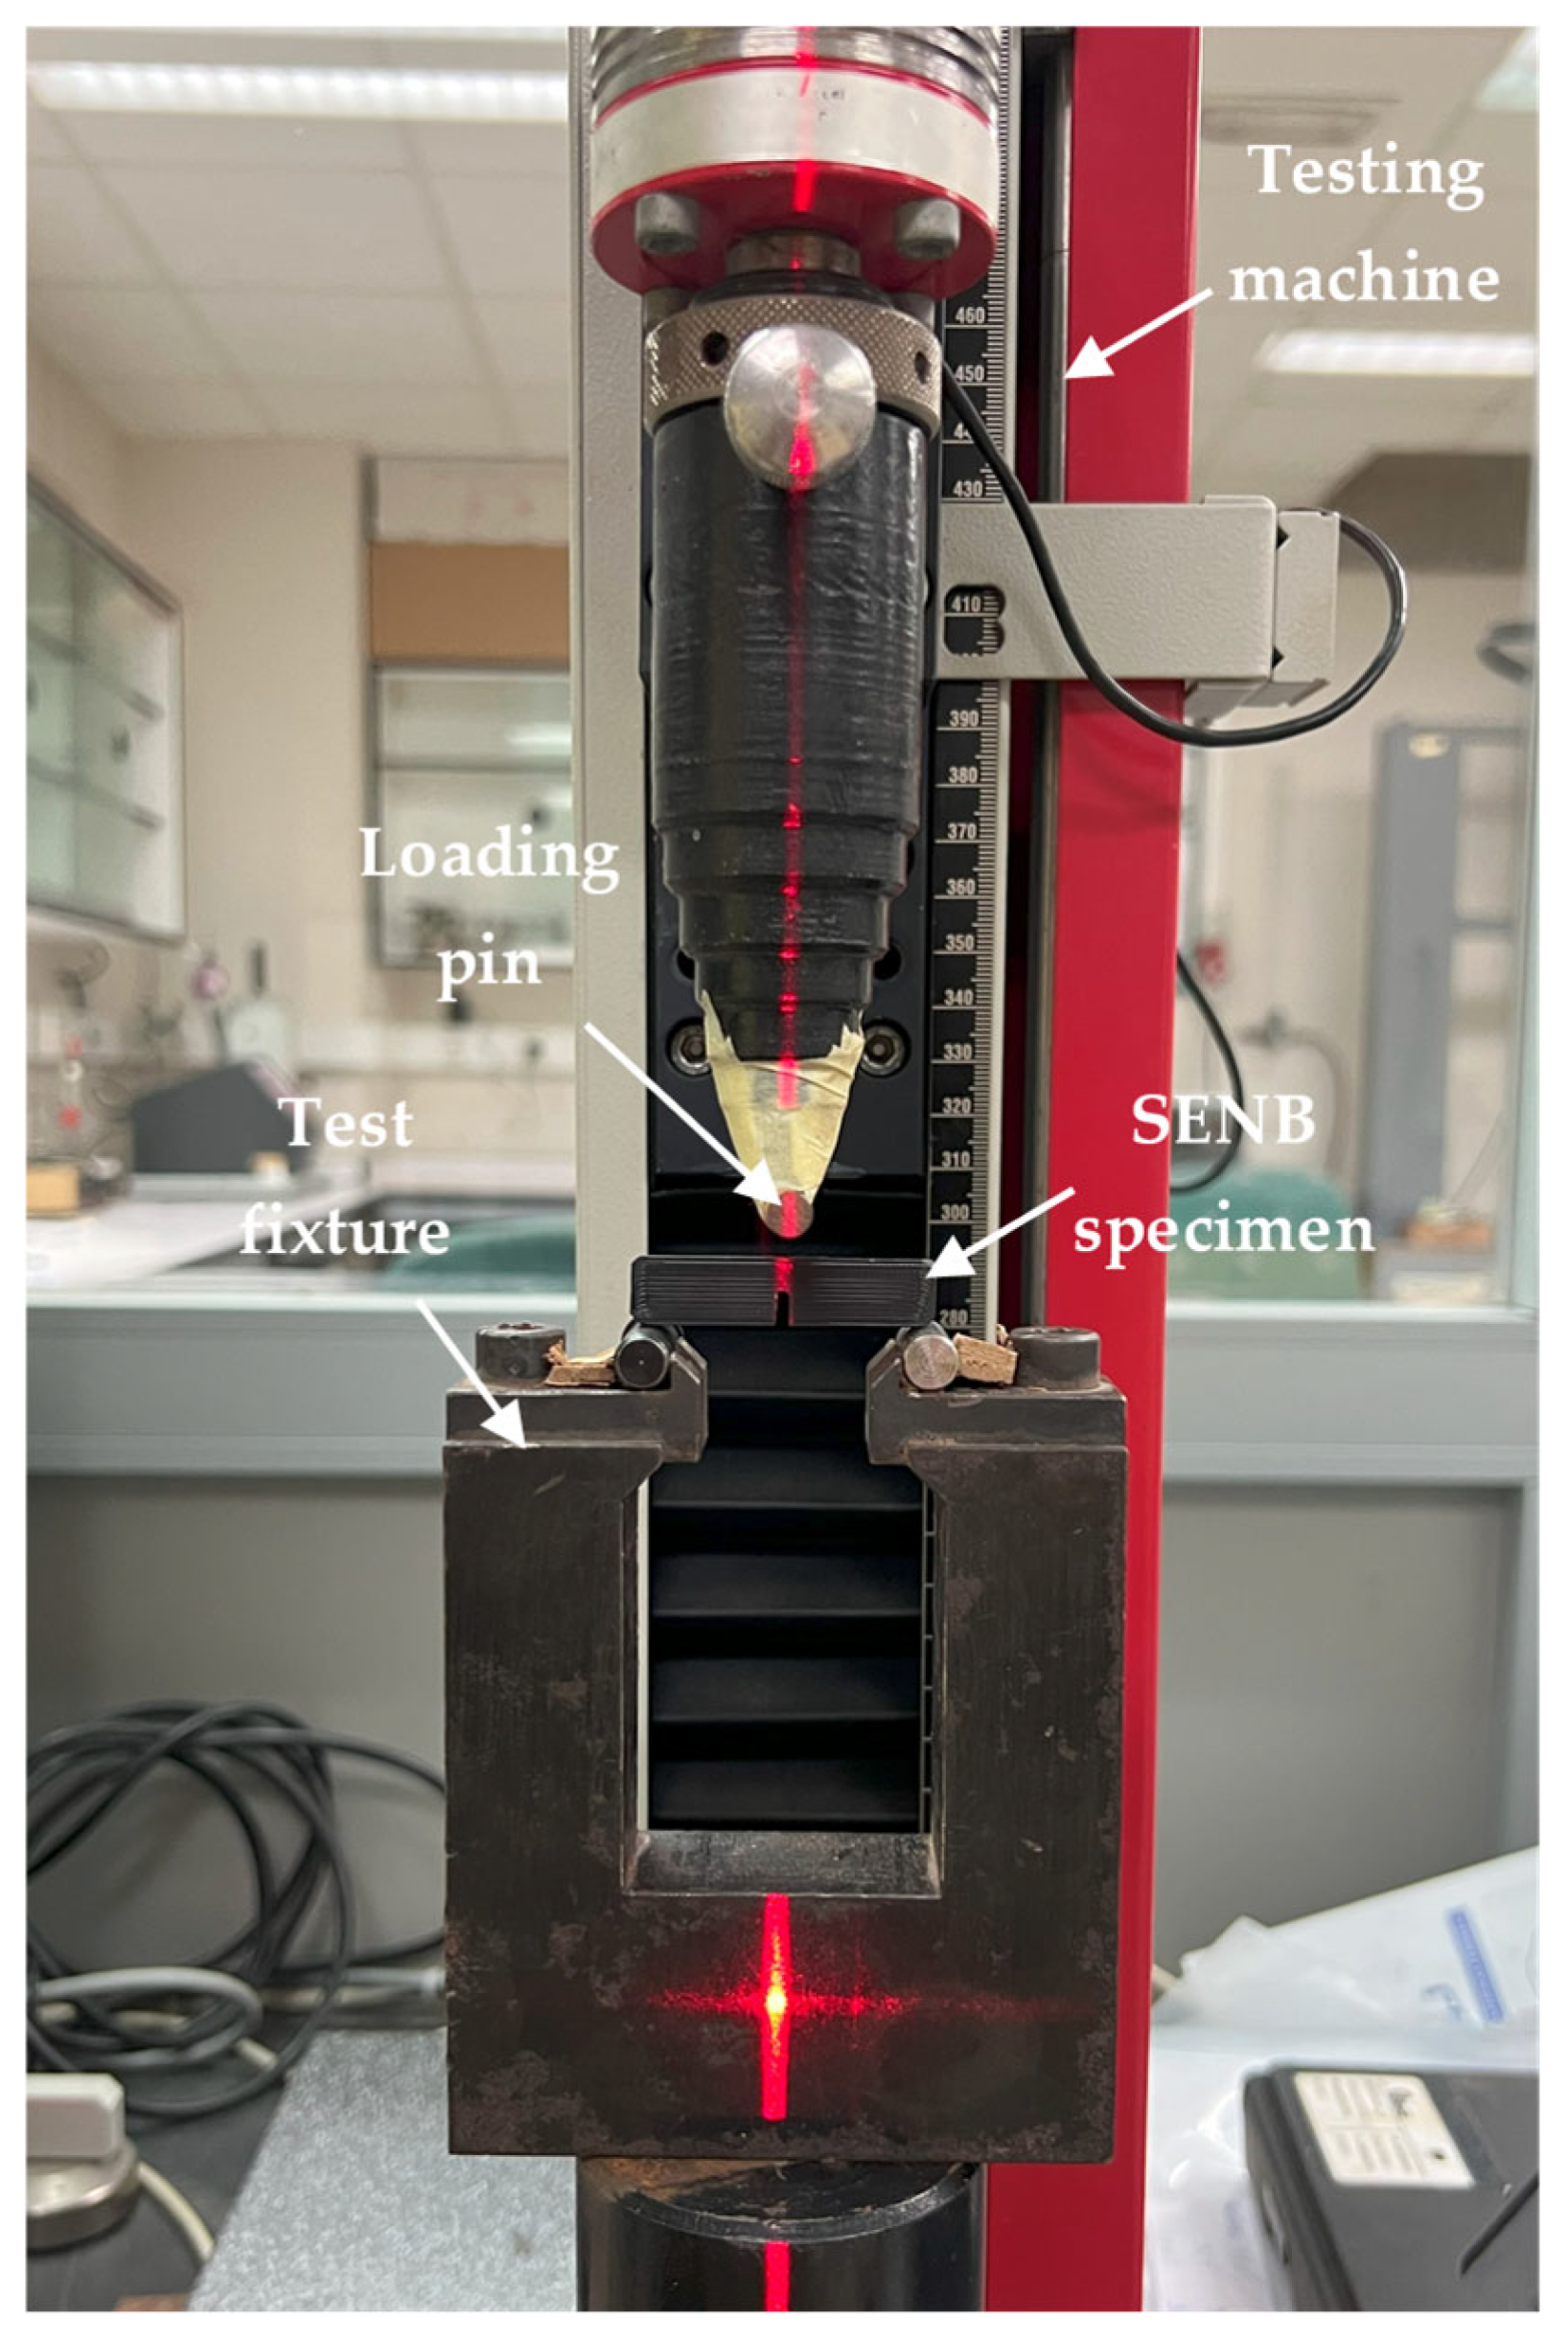
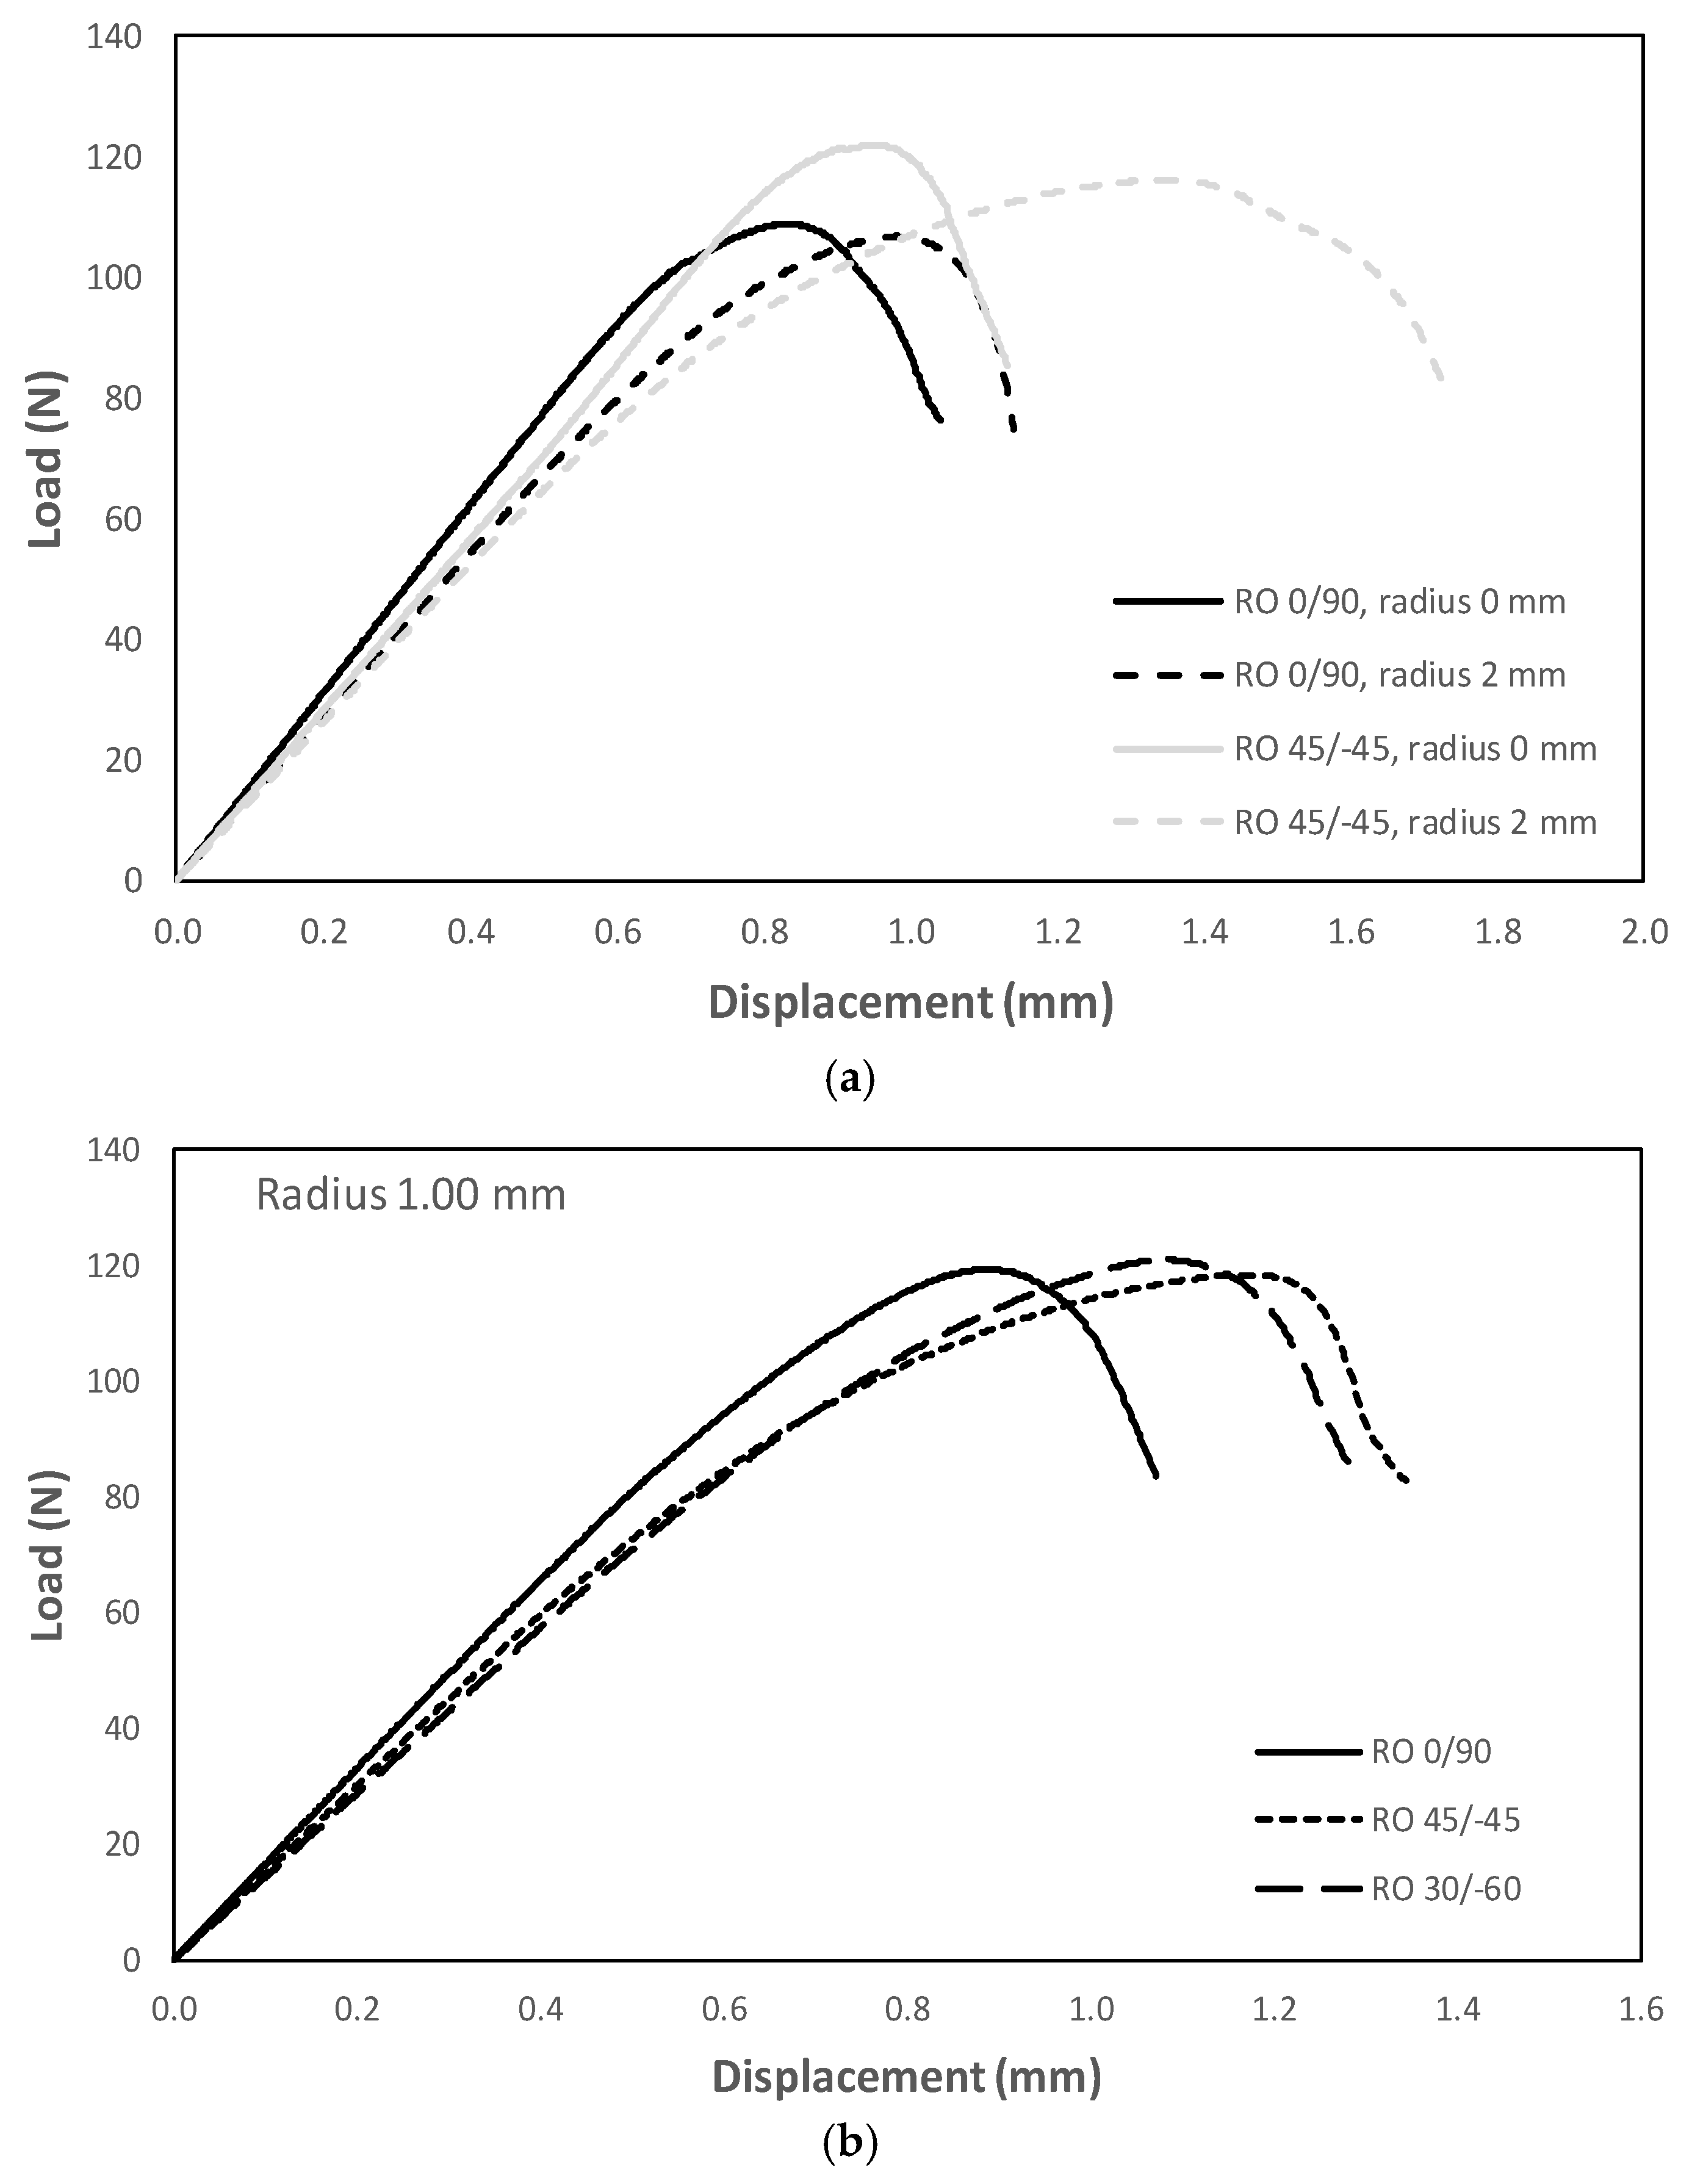
3.2. Fracture Tests
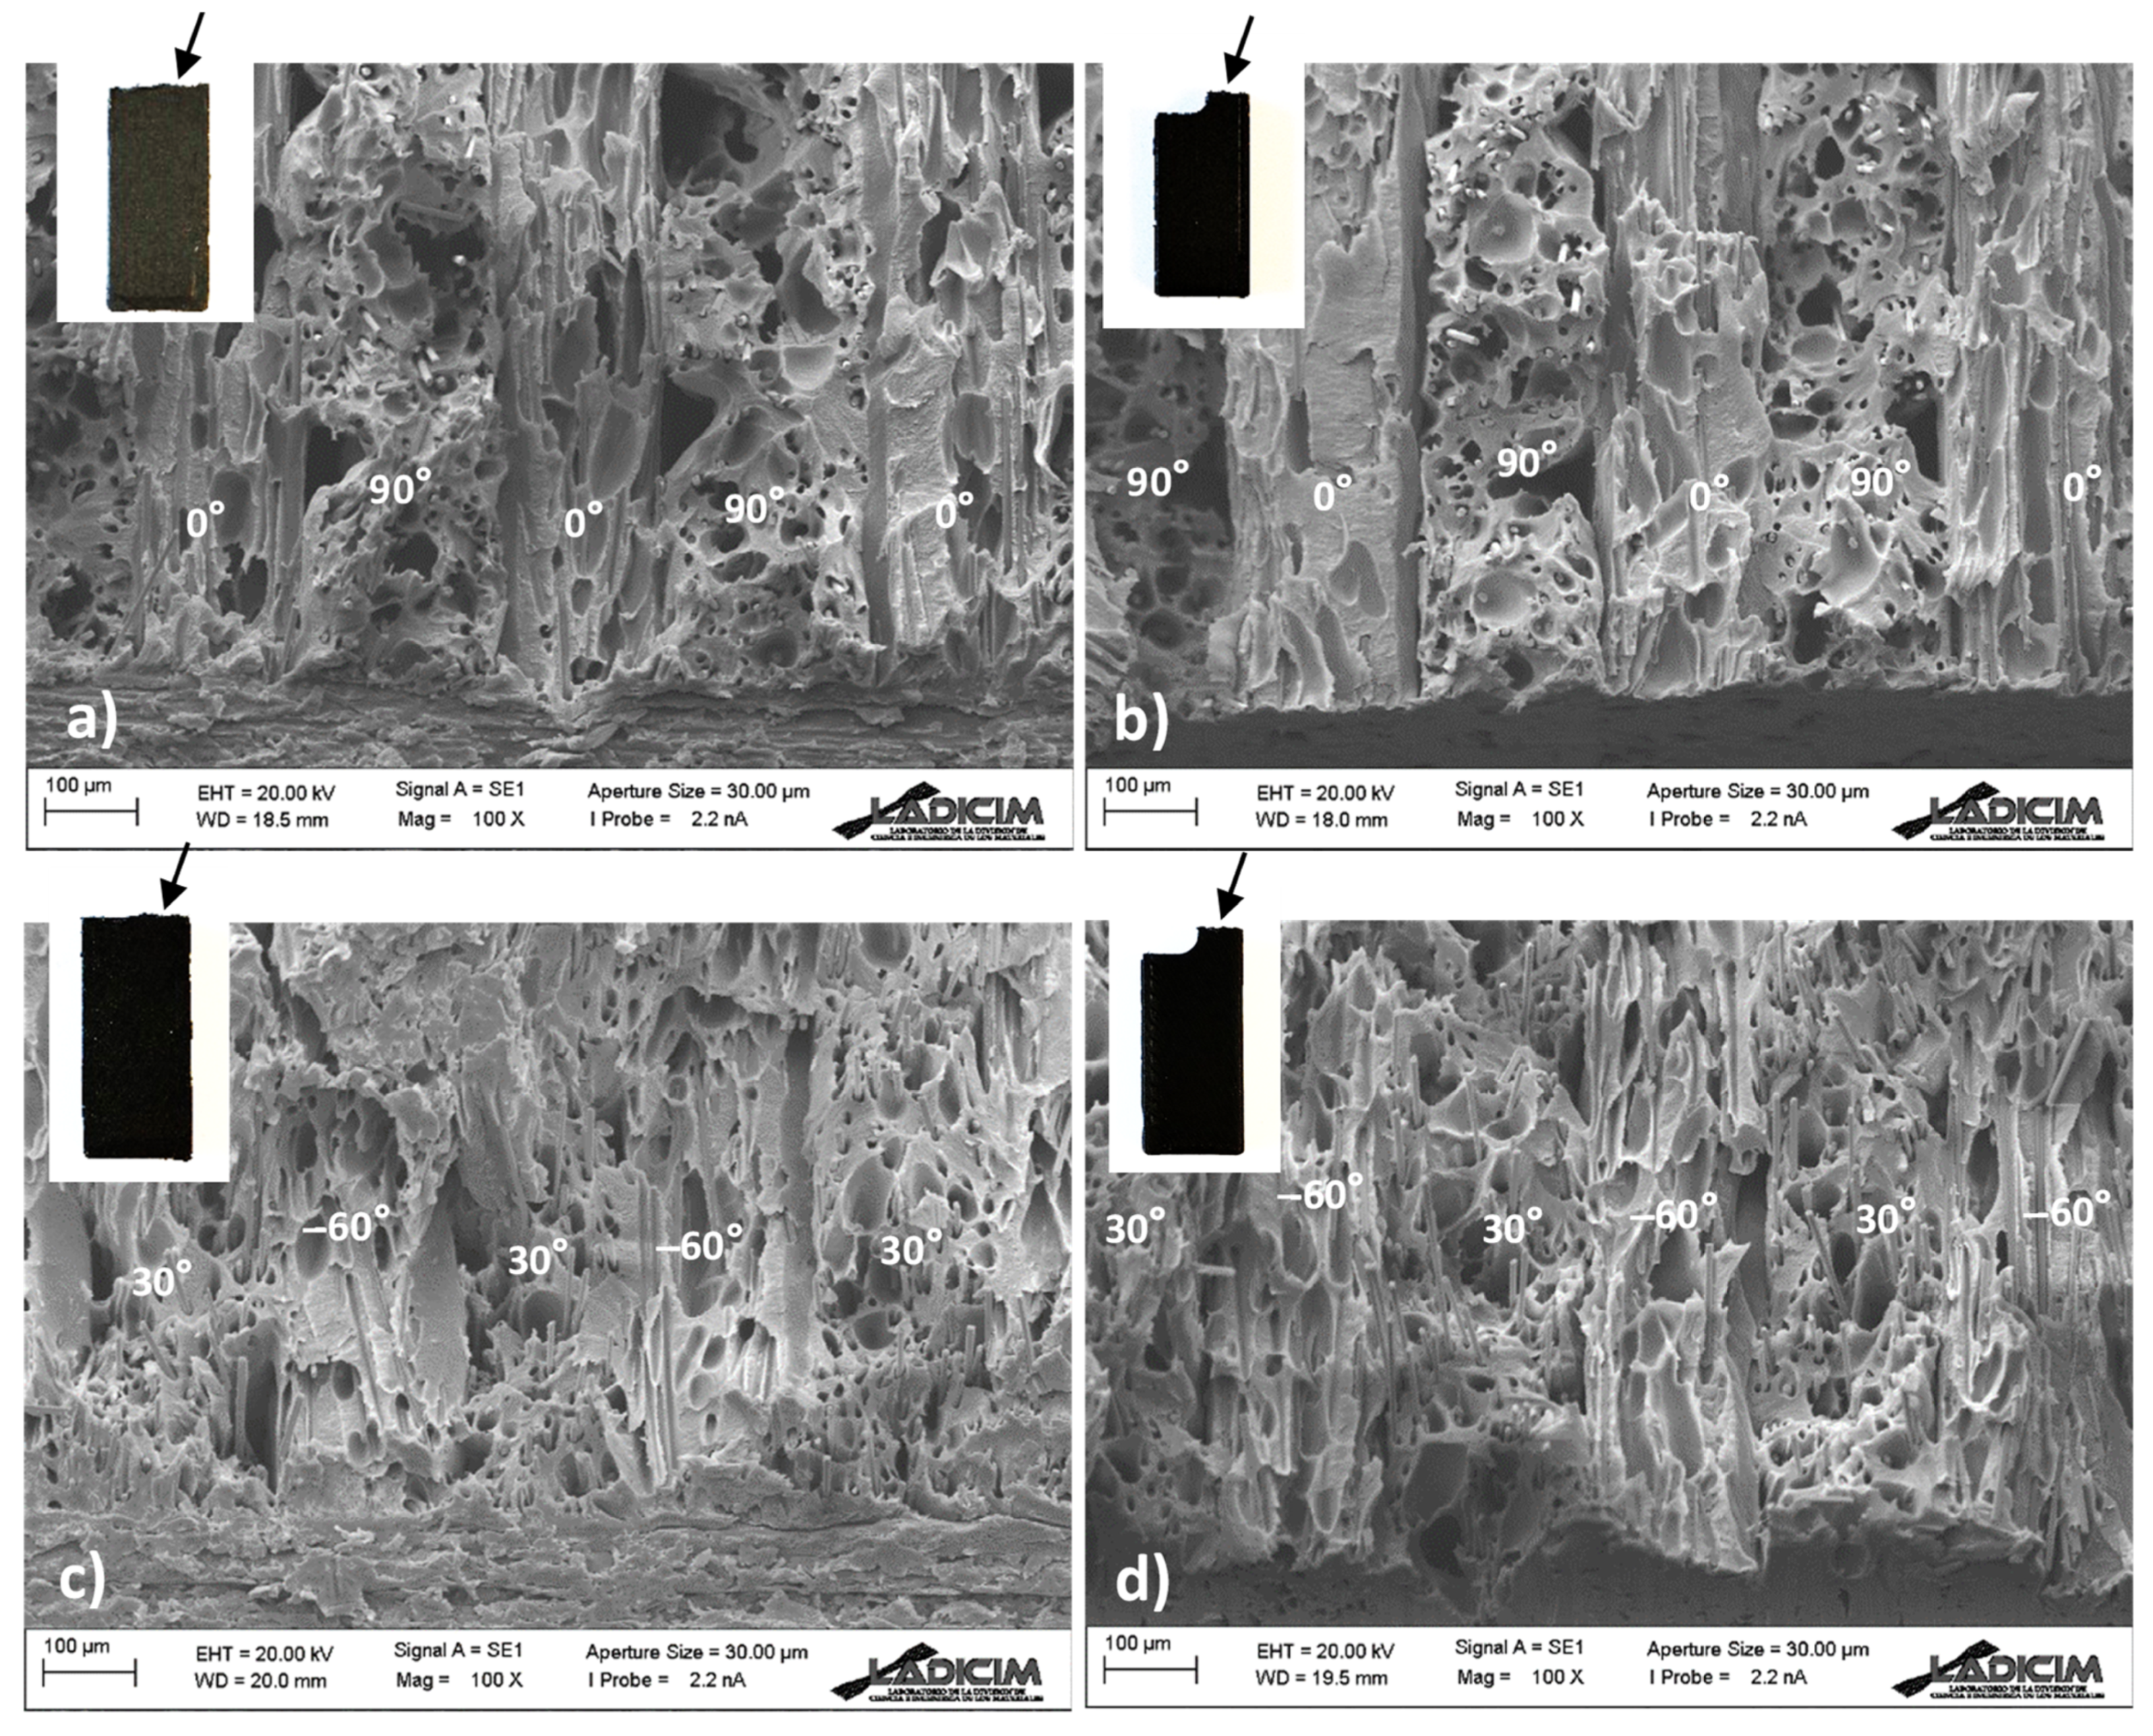
3.3. SEM Analysis
4. Conclusions
- ASA-CF10 material presents, for the three raster orientations analyzed here (0/90, 45/−45 and 30/−60), noticeably higher values of fracture toughness and apparent fracture toughness than the pristine ASA.
- Regarding the notch effect, this is generally higher (lower L) in ASA-CF10 than in ASA.
- Raster orientation 30/−60 provides the best fracture behavior of the three raster orientations (90/0, 45/−45, 30/−60), with a similar fracture toughness (cracked conditions) to raster orientation 0/90, but developing a much higher notch effect.
- SEM observations justify the results obtained in this research.
Author Contributions
Funding
Data Availability Statement
Conflicts of Interest
Abbreviations
| ABS | Acrylonitrile–butadiene–styrene |
| AM | Additive manufacturing |
| ASA | Acrylonitrile-styrene-acrylate |
| ASA-CF | Carbon fiber reinforced ASA |
| ASTM | American Society for Testing and Materials |
| CF | Carbon fiber |
| FFF | Fused Filament Fabrication |
| LM | Line Method |
| PLA | Polylactic acid |
| RO | Raster orientation |
| SENB | Single-edge-notched bending |
| TCD | Theory of Critical Distances |
Appendix A

| RO | Test nº | ρ (mm) | W (mm) | B (mm) | S (mm) | a0 (mm) | Pmax (N) | (MPam1/2) | (MPam1/2) | Std. Dev. (MPam1/2) |
|---|---|---|---|---|---|---|---|---|---|---|
| 0/90 | 1 | 0.00 | 10.04 | 4.94 | 40.00 | 5.37 | 104.9 | 4.72 | 4.47 | 0.17 |
| 2 | 0.00 | 10.11 | 4.97 | 40.00 | 5.77 | 86.1 | 4.47 | |||
| 3 | 0.00 | 10.02 | 4.93 | 40.00 | 5.15 | 108.9 | 4.39 | |||
| 4 | 0.00 | 10.15 | 5.00 | 40.00 | 5.62 | 101.7 | 4.26 | |||
| 5 | 0.00 | 10.12 | 4.93 | 40.00 | 5.00 * | 127.0 | 4.56 | |||
| 6 | 0.00 | 10.14 | 4.95 | 40.00 | 4.63 | - | - | |||
| 1 | 0.65 | 10.03 | 4.97 | 40.00 | 5.43 | 100.9 | 4.47 | 4.53 | 0.12 | |
| 2 | 0.65 | 10.10 | 5.05 | 40.00 | 5.55 | 99.6 | 4.50 | |||
| 3 | 0.64 | 10.10 | 4.90 | 40.00 | 5.50 | 97.9 | 4.36 | |||
| 4 | 0.65 | 10.11 | 4.97 | 40.00 | 5.50 | 101.6 | 4.55 | |||
| 5 | 0.65 | 10.03 | 4.98 | 40.00 | 5.43 | 105.6 | 4.72 | |||
| 6 | 0.66 | 10.20 | 4.98 | 40.00 | 5.64 | 105.5 | 4.61 | |||
| 1 | 1.08 | 10.26 | 4.95 | 40.00 | 5.14 | 116.2 | 4.68 | 4.69 | 0.15 | |
| 2 | 1.09 | 10.12 | 4.98 | 40.00 | 5.32 | 119.4 | 4.76 | |||
| 3 | 1.07 | 10.19 | 4.95 | 40.00 | 5.26 | 108.7 | 4.60 | |||
| 4 | 1.07 | 10.24 | 4.99 | 40.00 | 5.30 | 112.7 | 4.57 | |||
| 5 | 1.00 | 10.09 | 5.00 | 40.00 | 5.17 | 111.6 | 4.57 | |||
| 6 | 1.06 | 10.24 | 4.92 | 40.00 | 5.43 | 120.2 | 4.97 | |||
| 1 | 2.08 | 10.05 | 4.99 | 40.00 | 5.62 | 135.3 | 4.98 | 4.92 | 0.09 | |
| 2 | 2.14 | 10.25 | 4.98 | 40.00 | 5.75 | 103.4 | 4.98 | |||
| 3 | 2.14 | 10.05 | 4.91 | 40.00 | 5.63 | 104.2 | 4.94 | |||
| 4 | 2.14 | 10.03 | 4.94 | 40.00 | 5.59 | 102.0 | 4.84 | |||
| 5 | 2.12 | 10.08 | 4.97 | 40.00 | 5.68 | 103.6 | 4.79 | |||
| 6 | 2.10 | 10.20 | 4.97 | 40.00 | 5.72 | 107.8 | 5.00 | |||
| 45/−45 | 1 | 0.00 | 10.19 | 4.96 | 40.00 | 5.55 | 97.45 | 4.050 | 4.05 | 0.20 |
| 2 | 0.00 | 10.31 | 4.9 | 40.00 | 5.44 | 110.12 | 4.104 | |||
| 3 | 0.00 | 9.99 | 4.78 | 40.00 | 5.12 | 120.51 | 4.000 | |||
| 4 | 0.00 | 10.12 | 4.94 | 40.00 | 5.16 | 114.78 | 3.694 | |||
| 5 | 0.00 | 10.24 | 4.83 | 40.00 | 5.33 | 121.88 | 4.157 | |||
| 6 | 0.00 | 10.24 | 4.87 | 40.00 | 4.80 * | 150.37 | 4.274 | |||
| 1 | 0.66 | 9.97 | 4.83 | 40.00 | 5.48 | 99.95 | 4.314 | 4.43 | 0.12 | |
| 2 | 0.66 | 10.19 | 4.92 | 40.00 | 5.60 | 108.37 | 4.490 | |||
| 3 | 0.65 | 10.15 | 4.95 | 40.00 | 5.51 | 113.48 | 4.539 | |||
| 4 | 0.64 | 10.32 | 4.9 | 40.00 | 5.72 | 108.05 | 4.536 | |||
| 5 | 0.67 | 10.03 | 4.84 | 40.00 | 5.56 | 108.07 | 4.451 | |||
| 6 | 0.64 | 10.06 | 4.87 | 40.00 | 5.47 | 108.15 | 4.239 | |||
| 1 | 1.11 | 10.24 | 5.03 | 40.00 | 5.21 | 128.33 | 4.815 | 4.77 | 0.16 | |
| 2 | 1.15 | 10.21 | 4.96 | 40.00 | 5.37 | 129.45 | 5.016 | |||
| 3 | 1.12 | 9.97 | 4.82 | 40.00 | 5.03 | 118.33 | 4.787 | |||
| 4 | 1.12 | 10.22 | 5.03 | 40.00 | 5.41 | 116.22 | 4.640 | |||
| 5 | 1.13 | 10.07 | 4.88 | 40.00 | 5.23 | 117.03 | 4.548 | |||
| 6 | 1.13 | 10.23 | 4.93 | 40.00 | 5.42 | 123.25 | 4.793 | |||
| 1 | 2.06 | 10.14 | 4.9 | 40.00 | 5.71 | 113.27 | 5.657 | 5.47 | 0.18 | |
| 2 | 2.07 | 10.15 | 4.91 | 40.00 | 5.66 | 116.17 | 5.301 | |||
| 3 | 2.09 | 10.04 | 4.85 | 40.00 | 5.50 | 121.61 | 5.651 | |||
| 4 | 2.07 | 9.99 | 4.68 | 40.00 | 5.81 | 92.42 | 5.472 | |||
| 5 | 2.09 | 10.17 | 3.57 | 40.00 | 5.73 | 81.98 | 5.551 | |||
| 6 | 2.08 | 10.24 | 4.77 | 40.00 | 5.77 | 107.59 | 5.211 | |||
| 30/−60 | 1 | 0.00 | 10.11 | 4.91 | 40.00 | 5.32 | 119.75 | 4.82 | 4.46 | 0.36 |
| 2 | 0.00 | 10.22 | 4.87 | 40.00 | 5.69 | 107.36 | 4.59 | |||
| 3 | 0.00 | 10.23 | 4.87 | 40.00 | 5.24 | 128.85 | 4.83 | |||
| 4 | 0.00 | 10.01 | 4.9 | 40.00 | 4.94 * | 135.00 | 4.40 | |||
| 5 | 0.00 | 9.97 | 4.87 | 40.00 | 5.72 | 83.67 | 3.90 | |||
| 6 | 0.00 | 10.13 | 4.89 | 40.00 | 5.11 | 112.86 | 4.22 | |||
| 1 | 0.70 | 10.09 | 4.94 | 40.00 | 5.29 | 114.4 | 4.79 | 4.61 | 0.26 | |
| 2 | 0.64 | 10.17 | 4.89 | 40.00 | 5.40 | 106.5 | 4.59 | |||
| 3 | 0.66 | 10.30 | 4.90 | 40.00 | 5.59 | 111.7 | 4.75 | |||
| 4 | 0.64 | 9.99 | 4.86 | 40.00 | 5.39 | 96.3 | 4.31 | |||
| 5 | 0.65 | 10.23 | 4.92 | 40.00 | 5.55 | 112.3 | 4.92 | |||
| 6 | 0.66 | 9.99 | 4.89 | 40.00 | 5.20 | 99.6 | 4.30 | |||
| 1 | 1.10 | 10.04 | 4.97 | 40.00 | 5.16 | 120.92 | 4.98 | 5.07 | 0.20 | |
| 2 | 1.10 | 10.19 | 4.90 | 40.00 | 5.40 | 122.94 | 5.18 | |||
| 3 | 1.07 | 10.24 | 4.88 | 40.00 | 5.57 | 121.02 | 5.13 | |||
| 4 | 1.11 | 10.14 | 4.91 | 40.00 | 5.11 | 122.12 | 4.84 | |||
| 5 | 1.15 | 10.07 | 4.88 | 40.00 | 5.09 | 120.72 | 4.91 | |||
| 6 | 1.13 | 10.16 | 4.91 | 40.00 | 5.41 | 125.41 | 5.38 | |||
| 1 | 2.07 | 10.30 | 4.91 | 40.00 | 5.81 | 119.34 | 5.84 | 5.80 | 0.29 | |
| 2 | 2.12 | 10.05 | 4.90 | 40.00 | 5.59 | 109.84 | 5.73 | |||
| 3 | 2.08 | 10.20 | 4.92 | 40.00 | 5.70 | 116.76 | 6.28 | |||
| 4 | 2.09 | 10.13 | 4.92 | 40.00 | 5.62 | 112.43 | 5.39 | |||
| 5 | 2.09 | 10.18 | 4.91 | 40.00 | 5.68 | 113.68 | 5.76 | |||
| 6 | 2.10 | 10.35 | 4.92 | 40.00 | 5.85 | 117.07 | 5.83 |
References
- Moreno Nieto, D.; Casal López, V.; Molina, S.I. Large-format polymeric pellet-based additive manufacturing for the naval industry. Addit. Manuf. 2018, 23, 79–85. [Google Scholar] [CrossRef]
- Kechagias, J.D.; Ninikas, K.; Vakouftsi, F.; Fountas, N.A.; Palanisamy, S.; Vaxevanidis, N.M. Optimization of Laser Beam Parameters during Processing of ASA 3D-Printed Plates. Int. J. Adv. Manuf. Technol. 2024, 130, 527–539. [Google Scholar] [CrossRef]
- Kechagias, J.; Zaoutsos, S. Effects of 3D-Printing Processing Parameters on FFF Parts’ Porosity: Outlook and Trends. Mater. Manuf. Process. 2024, 39, 804–814. [Google Scholar] [CrossRef]
- Cicero, S.; Martínez-Mata, V.; Castanon-Jano, L.; Alonso-Estebanez, A.; Arroyo, B. Analysis of notch effect in the fracture behaviour of additively manufactured PLA and graphene reinforced PLA. Theor. Appl. Fract. Mech. 2021, 114, 103032. [Google Scholar] [CrossRef]
- Cicero, S.; Martínez-Mata, V.; Alonso-Estebanez, A.; Castanon-Jano, L.; Arroyo, B. Analysis of notch effect in 3D-printed ABS fracture specimens containing U-notches. Materials 2020, 13, 4716. [Google Scholar] [CrossRef]
- Love, L.J.; Kunc, V.; Rios, O.; Duty, C.E.; Elliott, A.M.; Post, B.K.; Smith, R.J.; Blue, C.A. The importance of carbon fiber to polymer additive manufacturing. J. Mater. Res. 2014, 29, 1893–1898. [Google Scholar] [CrossRef]
- Dorigato, A.; Moretti, V.; Dul, S.; Unterberger, S.H.; Pegoretti, A. Electrically conductive nanocomposites for fused deposition modelling. Synth. Met. 2017, 226, 7–14. [Google Scholar] [CrossRef]
- Luke, S.S.; Soares, D.; Marshall, J.V.; Sheddden, J.; Keleş, Ö. Effect of fiber content and fiber orientation on mechanical behavior of fused filament fabricated continuous-glass-fiber-reinforced nylon. Rapid Prototyp. J. 2021, 27, 1346–1354. [Google Scholar] [CrossRef]
- Boğa, C. Investigation of mechanical and fracture behavior of pure and carbon fiber reinforced ABS samples processed by fused filament fabrication process. Rapid Prototyp. J. 2021, 27, 1220–1229. [Google Scholar] [CrossRef]
- Seyedzavvar, M.; Boğa, C. Investigation on the effects of printing pattern on the load carrying capacity of 3D printed U-notched samples. Meccanica 2022, 57, 1575–1590. [Google Scholar] [CrossRef]
- Kluczyński, J.; Szachogłuchowicz, I.; Torzewski, J.; Śnieżek, L.; Grzelak, K.; Budzik, G.; Przeszłowski, Ł.; Małek, M.; Łuszczek, J. Fatigue and fracture of additively manufactured polyethylene terephthalate glycol and acrylonitrile butadiene styrene polymers. Int. J. Fatigue 2022, 165, 107212. [Google Scholar] [CrossRef]
- Zhang, Z.; Yavas, D.; Liu, Q.; Wu, D. Effect of build orientation and raster pattern on the fracture behavior of carbon fiber reinforced polymer composites fabricated by additive manufacturing. Addit. Manuf. 2021, 47, 102204. [Google Scholar] [CrossRef]
- Khosravani, M.R.; Sadeghian, H.; Ayatollahi, M.R.; Reinicke, T. Optimization of fracture toughness in 3D-printed parts: Experiments and numerical simulations. Compos. Struct. 2024, 329, 117766. [Google Scholar] [CrossRef]
- Khosravani, M.R.; Rezaei, S.; Ruan, H.; Reinicke, T. Fracture behavior of anisotropic 3D-printed parts: Experiments and numerical simulations. J. Mater. Res. Technol. 2022, 19, 1260–1270. [Google Scholar] [CrossRef]
- Zolfagharian, A.; Khosravani, M.R.; Kaynak, A. Fracture resistance analysis of 3D-printed polymers. Polymers 2020, 12, 302. [Google Scholar] [CrossRef]
- Lorenzo-Bañuelos, M.; Díaz, A.; Cuesta, I.I. Influence of raster orientation on the determination of fracture properties of polypropylene thin components produced by additive manufacturing. Theor. Appl. Fract. Mech. 2020, 107, 102536. [Google Scholar] [CrossRef]
- Gardan, J.; Makke, A.; Recho, N. Improving the fracture toughness of 3D printed thermoplastic polymers by fused deposition modeling. Int. J. Fract. 2018, 210, 1–15. [Google Scholar] [CrossRef]
- Ng, C.T.; Susmel, L. Notch static strength of additively manufactured acrylonitrile butadiene styrene (ABS). Addit. Manuf. 2020, 34, 101212. [Google Scholar] [CrossRef]
- Xiang, B.; Yin, X.; Zhang, J. A novel cool material: ASA (acrylonitrile-styrene-acrylate) matrix composites with solar reflective inorganic particles. Compos. Sci. Technol. 2017, 145, 149–156. [Google Scholar] [CrossRef]
- Rakshit, R.; Kalvettukaran, P.; Acharyya, S.K.; Panja, S.C.; Misra, D. Development of high specific strength acrylonitrile styrene acrylate (ASA) structure using fused filament fabrication. Prog. Addit. Manuf. 2023, 8, 1543–1553. [Google Scholar] [CrossRef]
- Cressall, S.; Phillips, C.O.; Al-Shatty, W.; Deganello, D. The effect of high-intensity gamma radiation on PETG and ASA polymer-based fused deposition modelled 3D printed parts. J. Mater. Sci. 2024, 59, 1768–1782. [Google Scholar] [CrossRef]
- Sanford, L.T.; Jaafar, I.H.; Seibi, A.; Gohn, A. The effect of infill angle, build orientation, and void fraction on the tensile strength and fracture of 3D printed ASA via fused filament fabrication. Manuf. Lett. 2022, 33, 569–573. [Google Scholar] [CrossRef]
- Cicero, S.; Devito, F.; Sánchez, M.; Arrieta, S.; Arroyo, B. Notch effect in acrylonitrile styrene acrylate (ASA) single-edge-notch bending specimens manufactured by Fused Filament Fabrication. Materials 2024, 17, 5207. [Google Scholar] [CrossRef] [PubMed]
- Taylor, D. The Theory of Critical Distances: A New Perspective in Fracture Mechanics; Elsevier: London, UK, 2007. [Google Scholar]
- Huang, T.; Wang, S.; He, K. Quality control for fused deposition modeling based additive manufacturing: Current research and future trends. In Proceedings of the 2015 First International Conference on Reliability Systems Engineering (ICRSE), Beijing, China, 21–23 October 2015; IEEE: Beijing, China, 2015; pp. 1–6. [Google Scholar] [CrossRef]
- Bikas, H.; Stavropoulos, P.; Chryssolouris, G. Additive manufacturing methods and modelling approaches: A critical review. Int. J. Adv. Manuf. Technol. 2016, 83, 389–405. [Google Scholar] [CrossRef]
- Sánchez, D.M.; De La Mata, M.; Delgado, F.J.; Casal, V.; Molina, S.I. Development of carbon fiber acrylonitrile styrene acrylate composite for large format additive manufacturing. Mater. Des. 2020, 191, 108577. [Google Scholar] [CrossRef]
- Song, J.; Liu, X.; Zhang, Y.; Huang, B.; Yang, W. Carbon-fiber-reinforced acrylonitrile–styrene–acrylate composites: Mechanical and rheological properties and electrical resistivity. J. Appl. Polym. Sci. 2016, 133, 43252. [Google Scholar] [CrossRef]
- ASTM D638-14; Standard Test Method for Tensile Properties of Plastics. ASTM International: West Conshohocken, PA, USA, 2014; Volume 08.01.
- ASTM D6068-10(2018); Standard Test Method for Determining J-R Curves of Plastic Materials. ASTM International: West Conshohocken, PA, USA, 2018.
- ASTM D5045-14(2022); Standard Test Methods for Plane-Strain Fracture Toughness and Strain Energy Release Rate of Plastic Materials. ASTM International: West Conshohocken, PA, USA, 2018.
- Cicero, S.; Madrazo, V.; Carrascal, I. Analysis of notch effect in PMMA using the Theory of Critical Distances. Eng. Fract. Mech. 2012, 86, 56–72. [Google Scholar] [CrossRef]
- Pluvinage, G. Fatigue and fracture emanating from notch; the use of the notch stress intensity factor. Nucl. Eng. Des. 1998, 185, 173–184. [Google Scholar] [CrossRef]
- Berto, F.; Lazzarin, P. Recent developments in brittle and quasi-brittle failure assessment of engineering materials by means of local approaches. Mater. Sci. Eng. R Rep. 2014, 75, 1–48. [Google Scholar] [CrossRef]
- Chang, K.Y.; Llu, S.; Chang, F.K. Damage Tolerance of Laminated Composites Containing an Open Hole and Subjected to Tensile Loadings. J. Compos. Mater. 1991, 25, 274–301. [Google Scholar] [CrossRef]
- Lawcokc, G.; Lin, Y.; Mai, Y. Progressive Damage and Residual Strength of a Carbon Fibre Reinforced Metal Laminate. J. Compos. Mater. 1997, 31, 762–787. [Google Scholar] [CrossRef]
- Arrieta, S.; Cicero, S.; Devito, F.; Arroyo, B. Notch Effect in Carbon Fiber Reinforced Acrylonitrile Styrene Acrylate (ASA-CF): Tensile and Fracture Tests—FRADDCO Project. Zenodo 2025. [Google Scholar] [CrossRef]
- Ibáñez-Gutiérrez, F.T.; Cicero, S.; Carrascal, I. On the influence of moisture content on the fracture behaviour of notched short glass fibre reinforced polyamide 6. Compos. Part B Eng. 2019, 159, 62–71. [Google Scholar] [CrossRef]
- Cicero, S.; Madrazo, V.; Garcia, T. Analysis of notch effect in the apparent fracture toughness and the fracture micromechanisms of ferritic-pearlitic steels operating within their lower shelf. Eng. Fail. Anal. 2014, 36, 322–342. [Google Scholar] [CrossRef]
- Cicero, S.; Garcia, T.; Castro, J.; Madrazo, V.; Andrés, D. Analysis of notch effect on the fracture behaviour of granite and limestone: An approach from the Theory of Critical Distances. Eng. Geol. 2014, 177, 1–9. [Google Scholar] [CrossRef]


| Material | RO | E (MPa) | σt (MPa) | ɛu (%) | L (mm) |
|---|---|---|---|---|---|
| ASA-CF10 | 0/90 | 4002 ± 236 | 37.5 ± 0.4 | 1.8 ± 0.2 | 2.45 |
| 45/−45 | 2797 ± 174 | 30.5 ± 1.8 | 2.0 ± 0.1 | 0.61 | |
| 30/−60 | 3496 ± 457 | 39.6 ± 6.2 | 1.9 ± 0.1 | 0.78 | |
| ASA [23] | 0/90 | 1050 ± 66 | 19.4 ± 1.0 | 2.8 ± 0.2 | 1.68 |
| 45/−45 | 1053 ± 22 | 18.5 ± 0.7 | 4.5 ± 0.2 | 1.29 | |
| 30/−60 | 990 ± 28 | 16.5 ± 0.1 | 2.8 ± 0.1 | 1.50 |
Disclaimer/Publisher’s Note: The statements, opinions and data contained in all publications are solely those of the individual author(s) and contributor(s) and not of MDPI and/or the editor(s). MDPI and/or the editor(s) disclaim responsibility for any injury to people or property resulting from any ideas, methods, instructions or products referred to in the content. |
© 2025 by the authors. Licensee MDPI, Basel, Switzerland. This article is an open access article distributed under the terms and conditions of the Creative Commons Attribution (CC BY) license (https://creativecommons.org/licenses/by/4.0/).
Share and Cite
Cicero, S.; Arrieta, S.; Devito, F.; Arroyo, B.; Lavecchia, F. Fracture Behavior of Additively Manufactured Carbon Fiber Reinforced Acrylonitrile-Styrene-Acrylate Containing Cracks and Notches. J. Compos. Sci. 2025, 9, 185. https://doi.org/10.3390/jcs9040185
Cicero S, Arrieta S, Devito F, Arroyo B, Lavecchia F. Fracture Behavior of Additively Manufactured Carbon Fiber Reinforced Acrylonitrile-Styrene-Acrylate Containing Cracks and Notches. Journal of Composites Science. 2025; 9(4):185. https://doi.org/10.3390/jcs9040185
Chicago/Turabian StyleCicero, Sergio, Sergio Arrieta, Fabrizia Devito, Borja Arroyo, and Fulvio Lavecchia. 2025. "Fracture Behavior of Additively Manufactured Carbon Fiber Reinforced Acrylonitrile-Styrene-Acrylate Containing Cracks and Notches" Journal of Composites Science 9, no. 4: 185. https://doi.org/10.3390/jcs9040185
APA StyleCicero, S., Arrieta, S., Devito, F., Arroyo, B., & Lavecchia, F. (2025). Fracture Behavior of Additively Manufactured Carbon Fiber Reinforced Acrylonitrile-Styrene-Acrylate Containing Cracks and Notches. Journal of Composites Science, 9(4), 185. https://doi.org/10.3390/jcs9040185