Article

PIDQA—Question Answering on Piping and Instrumentation Diagrams

School of Sustainable Engineering and the Built Environment, Arizona State University, Tempe, AZ 85287-1404, USA
*
Author to whom correspondence should be addressed.
Mach. Learn. Knowl. Extr. 2025, 7(2), 39; https://doi.org/10.3390/make7020039
Submission received: 24 February 2025 / Revised: 11 April 2025 / Accepted: 15 April 2025 / Published: 21 April 2025
(This article belongs to the Section Visualization)

Abstract

:
This paper introduces a novel framework enabling natural language question answering on Piping and Instrumentation Diagrams (P&IDs), addressing a critical gap between engineering design documentation and intuitive information retrieval. Our approach transforms static P&IDs into queryable knowledge bases through a three-stage pipeline. First, we recognize entities in a P&ID image and organize their relationships to form a base entity graph. Second, this entity graph is converted into a Labeled Property Graph (LPG), enriched with semantic attributes for nodes and edges. Third, a Large Language Model (LLM)-based information retrieval system translates a user query into a graph query language (Cypher) and retrieves the answer by executing it on LPG. For our experiments, we augmented a publicly available P&ID image dataset with our novel PIDQA dataset, which comprises 64,000 question–answer pairs spanning four categories: (I) simple counting, (II) spatial counting, (III) spatial connections, and (IV) value-based questions. Our experiments (using gpt-3.5-turbo) demonstrate that grounding the LLM with dynamic few-shot sampling robustly elevates accuracy by 10.6–43.5% over schema contextualization alone, even under high lexical diversity conditions (e.g., paraphrasing, ambiguity). By reducing barriers in retrieving P&ID data, this work advances human–AI collaboration for industrial workflows in design validation and safety audits.

1. Introduction

Past research suggests that engineers spend 20–30% of their time searching for design information embedded in technical drawings and blueprints [1,2]. This information is largely variable and depends on the objectives of each engineer and discipline, including items such as the materials and surface finishes of components, their spatial layouts, interactions amongst themselves, and quality specifics for regulatory compliance [3,4]. Information retrieval from blueprints and engineering drawings is commonly performed via software solutions such as Bluebeam Revu (v21.5) and PlanGrid. In this type of software, the primary searching mechanisms are limited to keyword matching [5]. This often yields excessive, irrelevant, and/or missing information that reduces the effectiveness of these techniques for engineering drawings [6]. One possible alternative is to digitize drawings into 3D formats using tools such as AutoCAD or Revit. But even then, most current tools do not provide a way to query an implicit design pattern within a drawing [7]. For instance, verifying the spatial location and proper vertical alignment of columns across multi-level building requires cross-referencing coordinates on multiple floors to avoid costly construction misalignments. While digital tools enable dimension extraction and element navigation, the absence of pattern-query capabilities forces engineers to manually inspect coordinate consistency across layers (either in 2D drawings or 3D models) [8]. In the absence of efficient engineering information retrieval tools for drawings, companies often allocate significant human resources to manually retrieve and organize the required data [9]. Compounding this challenge is the aging workforce in industries like construction and process engineering, where retiring experts take with them decades of tacit knowledge about design and interpretation of complex schematics [10]. Hence, there is an urgent need for contextual information retrieval systems that not only parse drawings intelligently but also emulate the nuanced reasoning of domain experts. Such tools can significantly enhance knowledge sharing, design reuse, and support an engineer’s learning process [6]. This paper addresses this gap by introducing a framework that transforms static Piping and Instrumentation Diagrams (P&IDs) into knowledge bases that are queryable using natural language. By enabling engineers to retrieve design patterns, validate connections, and extract values through intuitive questions, our work bridges the divide between human expertise and machine efficiency, ensuring that critical engineering knowledge is preserved, searchable, and actionable for different downstream use-cases.
There is an emerging body of research that combines Large Language Models (LLMs) with knowledge graphs for real-world applications like information extraction [11], question answering [12], semantic parsing [13], named entity disambiguation [14], and recommender systems [15]. A knowledge graph is a multi-relational data structure consisting of nodes and relations (edges) [16]. A node indicates an entity, and an edge indicates how two nodes are connected with one another [16]. For example, the relation ‘contains’ extending from the node ‘cement’ to the node ‘silica’ implies that cement contains silica. Therefore, knowledge graphs serve as a powerful tool for structured knowledge representation. In this paper, we utilize Labeled Property Graphs (LPGs) for information extraction and question answering from drawings and blueprints. LPGs are a subset of knowledge graphs offering flexible data schema and higher ease of use [17]. Specifically, this paper will focus on P&IDs as a testbed for exploring this new proposed method for information retrieval within a real-world engineering context.
A P&ID is a detailed schematic of a process depicting the spatial and connectivity relationships among piping, valves, instrumentation, and equipment [18]. A reference P&ID is shown in Figure 1. These are dense technical drawings showing a multitude of symbols with varying connections and text for human interpretation. They require domain expertise for diagram interpretation to understand the topological relationships among different entities [19]. However, due to contractual reasons, P&IDs are often shared in non-machine-readable formats like PDFs and images [20,21,22]. This common file formatting convention makes automated information extraction challenging [21]. To address this challenge of information retrieval for PDFs and images, extensive literature exists on digitizing P&IDs using artificial intelligence [23]. These prior works focus on P&ID digitization from a computer vision perspective, either on specific aspects like symbol detection [24] or proposing end-to-end methods for identifying symbols, text, and lines [25]. With advancements in multimodal learning and text-to-code generation, there is an opportunity to use multimodal fusion of images, graphs, and text to not only digitize P&IDs but also enable interactions with them through natural language for information retrieval and extraction.
This paper focuses on introducing a framework to make P&IDs queryable with natural language using the Labeled Property Graph representation of P&IDs. A publicly available P&ID dataset known as ‘Dataset-P&ID’ [25] is used for our experiments. The proposed framework starts by identifying entities and their interrelationships within a P&ID image, creating a base entity graph. Thereafter, semantic enrichment transforms the base graph into a labeled property graph. Finally, a question in natural language is translated into a graph query language using an LLM, which is executed on the LPG for information retrieval. We use Cypher as our choice of graph query language. We evaluate information retrieval for four different tasks such as counting, verification of connections among entities, and value-based entity extraction that are commonly performed by P&ID designers [19]. Overall, the contributions of this research are:
  • A detailed framework for digitizing images of P&IDs into machine-readable graph data structures.
  • A novel question–answer pairs dataset, PIDQA, consisting of 64,000 questions for 500 P&ID sheets in Dataset-P&ID covering 4 types of questions: (I) simple counting, (II) spatial counting, (III) spatial connections, and (IV) value-based queries. A representative sample is shown in Table 1. This study makes available the corresponding syntactically correct Cypher query translation for each question in PIDQA. To the best of our knowledge, there exist no publicly available datasets for question–answer pairs and text-to-Cypher queries for P&IDs. This dataset can also be used for training and evaluation of conventional Visual Question Answering (VQA) models like BLIP [26] or GIT [27] (The PIDQA dataset is publicly available at: https://github.com/mgupta70/PIDQA, accessed on 11 April 2025).
  • A comprehensive evaluation of grounding techniques for the LLM to generate accurate and coherent responses while minimizing sensitivity to linguistic variations in user queries.
This paper is arranged as follows: Section 2 reviews existing work on P&ID digitization and highlights emerging multimodal approaches for querying information across diverse data sources. Section 3 details the proposed methodology for P&ID digitization, including dataset creation, model training for detecting entities such as symbols, lines, and text, as well as post-processing algorithms for constructing base graphs. It further describes the conversion of these base graphs into knowledge graphs and outlines the development of an information retrieval system powered by LLMs. Section 4 discusses the performance metric of various stages in our digitization pipeline. Section 5 outlines the assumptions and limitations of this study, and finally, Section 6 presents the conclusions and suggests directions for future work.

2. Literature Review

2.1. P&ID Digitization

Building an information retrieval system requires P&IDs to be in a machine-readable format. But it is a common practice to share P&IDs in rasterized or other non-machine-readable formats such as images or PDFs [20,21,22]. Hence, a vast amount of prior work such as [20,21,24,25,28,29,30] has been aimed at digitizing P&IDs. These prior works involve the detection of different entities on a P&ID—symbols, lines, and texts [31]. For symbols, object detection models like YOLO [32], RCNN [33] and Detectron [34] are commonly used. Text is detected using Optical Character Recognition (OCR)-based libraries like Tesseract [35] and EasyOCR [36]. Since the size of the text relative to the image size can vary greatly, a two-step method is commonly used for efficient detection [28]. In this, text region proposals using CRAFT [37] are first identified, then they are individually processed by OCR libraries to find the underlying text. Most authors have found detecting lines to be the most challenging task during P&ID digitization. In a P&ID, there can be a large variety of lines with different styles and thicknesses. There are two popular methods for line detection in P&IDs. The most common approach for finding lines includes skeletonization followed by pixel-wise searching [28,29]. This approach of pixel-wise traversal can be time-consuming and not always reliable, especially for inclined lines. An alternative approach is to use Hough Transform (HT) on skeletonized images [25]. The challenge with HT lies in the requirement of manual hyperparameter tuning and postprocessing because it often leads to duplicate lines [28]. Once the lines have been identified, a small portion of the image patch around the line is extracted and is classified using an image classifier to differentiate among different styles of lines [30]. After identifying symbols, text, and lines, they are linked with each other using proximity matching (euclidean distance), creating a graph-like structure that can be used for digitization [25,31].
Most existing research has focused on digitizing drawings by identifying objects and mapping their interconnections. While the objective of prior research partly overlaps with our study, we also focus on simplifying the process of information extraction from digitized drawings. Specifically, we leverage recent advancements in natural language processing (NLP) to inform our approach of representing drawings as LPGs. This representation facilitates efficient querying using natural language and LLMs, thereby enhancing the overall utility and accessibility of the extracted information. Such context-aware information retrieval systems can potentially enhance productivity and make the drawing review process faster and easier.

2.2. Visual Question Answering

Visual Question Answering (VQA) is a multimodal vision and language task that involves answering natural language questions about a given image with accurate natural language responses [38]. The questions can be free-form, addressing the general content of the image, or specifically targeted towards objects in different areas, such as foreground or background. The underlying image dataset can contain natural images—TDIUC [39], charts—ChartQA [40], business graphs—BizGraphQA [41], or high school science experiments [42]. Such VQA models find applications in business analytics, education and training, customer support, and accessibility of information.
In the AEC domain, VQA models are finding applications for infrastructure inspection, safety compliance, and report generation. For example, [43] leveraged a VQA model to streamline the creation of bridge inspection reports. They used a dataset of bridge inspection reports containing over 2.9 million question–answer pairs for 420,000 bridge images to train a VQA model. Their results showed that the trained model was able to describe bridge images in terms of structural defects such as corrosion, spalling, or fracture when evaluated on a non-overlapping test set. In another study, [44] detects the violation of 16 different safety rules on a construction site using the same VQA model. Their model showed robustness in being able to understand relationships among objects such as humans and helmets or humans and excavators. This makes VQA a powerful tool for enforcing safety regulations and reducing accident rates via early identification. In another recent study, ref. [45] also explored VQA models to create reports regarding the use of personal protective equipment by construction workers to reduce the chances of accidents.
Even though there have been a few works in the AEC domain exploring the utility of VQA models, there exists no VQA dataset for P&IDs. Part of the reason for this is the absence of public P&ID datasets due to their confidential nature [24]. But the authors of [25] have made their synthetic dataset publicly available, which we are using in this research. We build upon their dataset and supplement it with a question–answer pairs dataset, PIDVQA, to support the training of VQA models.
Even though VQA models perform well, recent studies demonstrate that their responses become unreliable when the underlying image distribution undergoes a distribution shift [46,47]. For instance, ref. [46] reported a 23% decline in the performance of a VQA model, X-VLM [48], when tested on an out-of-distribution dataset within its original domain. This has practical implications while developing real-world applications. Since images of P&IDs vary with industry, contracting company, and geographical location [24], conventionally trained VQA could undergo a significant drop in performance. In this research, current P&ID approaches are expanded by converting images into a uniform graph data structure. The graphs serve as a knowledge base, which is then queried to perform visual questions and answering processes that were not available before for P&ID drawings.

3. Methods

This section provides details about the framework that supports searching information within the image of a P&ID using natural language. Section 3.1 outlines the dataset used in this study, along with the steps taken to generate question–answer pairs that are later used to validate the LLM’s responses during the information retrieval stage, described in Section 3.2. This stage relies on a digital graph representation of the P&ID image, as detailed in Section 3.2.1. The graph is then transformed into a semantically richer knowledge graph using the methods described in Section 3.2.2. Finally, Section 3.2.3 presents the system-level details of the proposed information retrieval framework.

3.1. P&ID Dataset and Generation of Question–Answer Pairs

This study uses a publicly available dataset [25] to build a question-answering system for P&IDs. It is an annotated synthetic dataset of 500 P&ID sheets containing labels for 32 different classes of symbols (as shown in Figure 2), lines connecting symbols, and text representing identifiers for lines or symbols. The dataset was originally developed for training computer vision models for object recognition [25]. To extend its utility and accomplish the objectives of this investigation, we expand this dataset with PIDQA, a dataset consisting of 64k question–answer pairs for four categories of questions: (I) simple counting, (II) spatial counting, (III) multi-hop spatial connections, and (IV) value-based. Custom scripts were developed to programmatically generate question–answer pairs to accomplish this dataset enhancement. These question categories were selected to mimic the different tasks an engineer might perform on the drawings.
I.
Simple counting: This question type is related to counting tasks while generating material takeoffs (MTOs). For instance, [49] highlights that in the absence of digital P&IDs, engineers spend hours manually reviewing documents and generating MTOs.
II.
Spatial counting: This question type focuses on quickly searching spatial relationships for defined design property patterns in large and dense P&ID datasets. For example, in gravity flow systems, pumps are typically provided with strainers on their upstream side to prevent debris from damaging the pump [50]. With access to the proposed information retrieval system, an engineer can simply ask a question like, “Count the number of instances where strainers are not provided upstream of pumps?” for a quick design review.
III.
Spatial connections: This question type centers on determining whether a specific component exists between two other components, often serving as a safety check. For instance, as per OISD-129, in oil refineries, petroleum tanks are typically equipped with an automatic valve followed by a manual valve in succession to ensure fire safety compliance. A query like “Is there an automatic valve between an oil tank and a manual valve?” verifies adherence to this safety standard. This question requires traversing through intermediate nodes in a P&ID graph, making it a multi-hop operation.
IV.
Value-based queries: This question type simplifies the process of locating objects of interest across multiple P&ID drawings. They can also assist in identifying potential CAD drafting errors. For example, a rule such as “All Butterfly Valve tags must start with ’BV’, else provide details of violation” can return a list of drawings and specific locations where this naming policy is violated, ensuring consistency and aiding in error detection.
The approach presented in this study to generate questions was inspired by [51]. The gpt-3.5-turbo language model was prompted to generate 23 linguistically diverse templates for each question type, as shown in Figure 3. Of these, 20 templates were used for generating questions, while the remaining 3 were reserved for constructing a few-shot dataset. For each P&ID image, 32 questions were generated per category by randomly selecting 1 of the 20 templates. Consequently, as shown in Table 2, a total of 128 questions per sheet were generated, resulting in 64,000 questions for the entire dataset of 500 P&ID sheets.

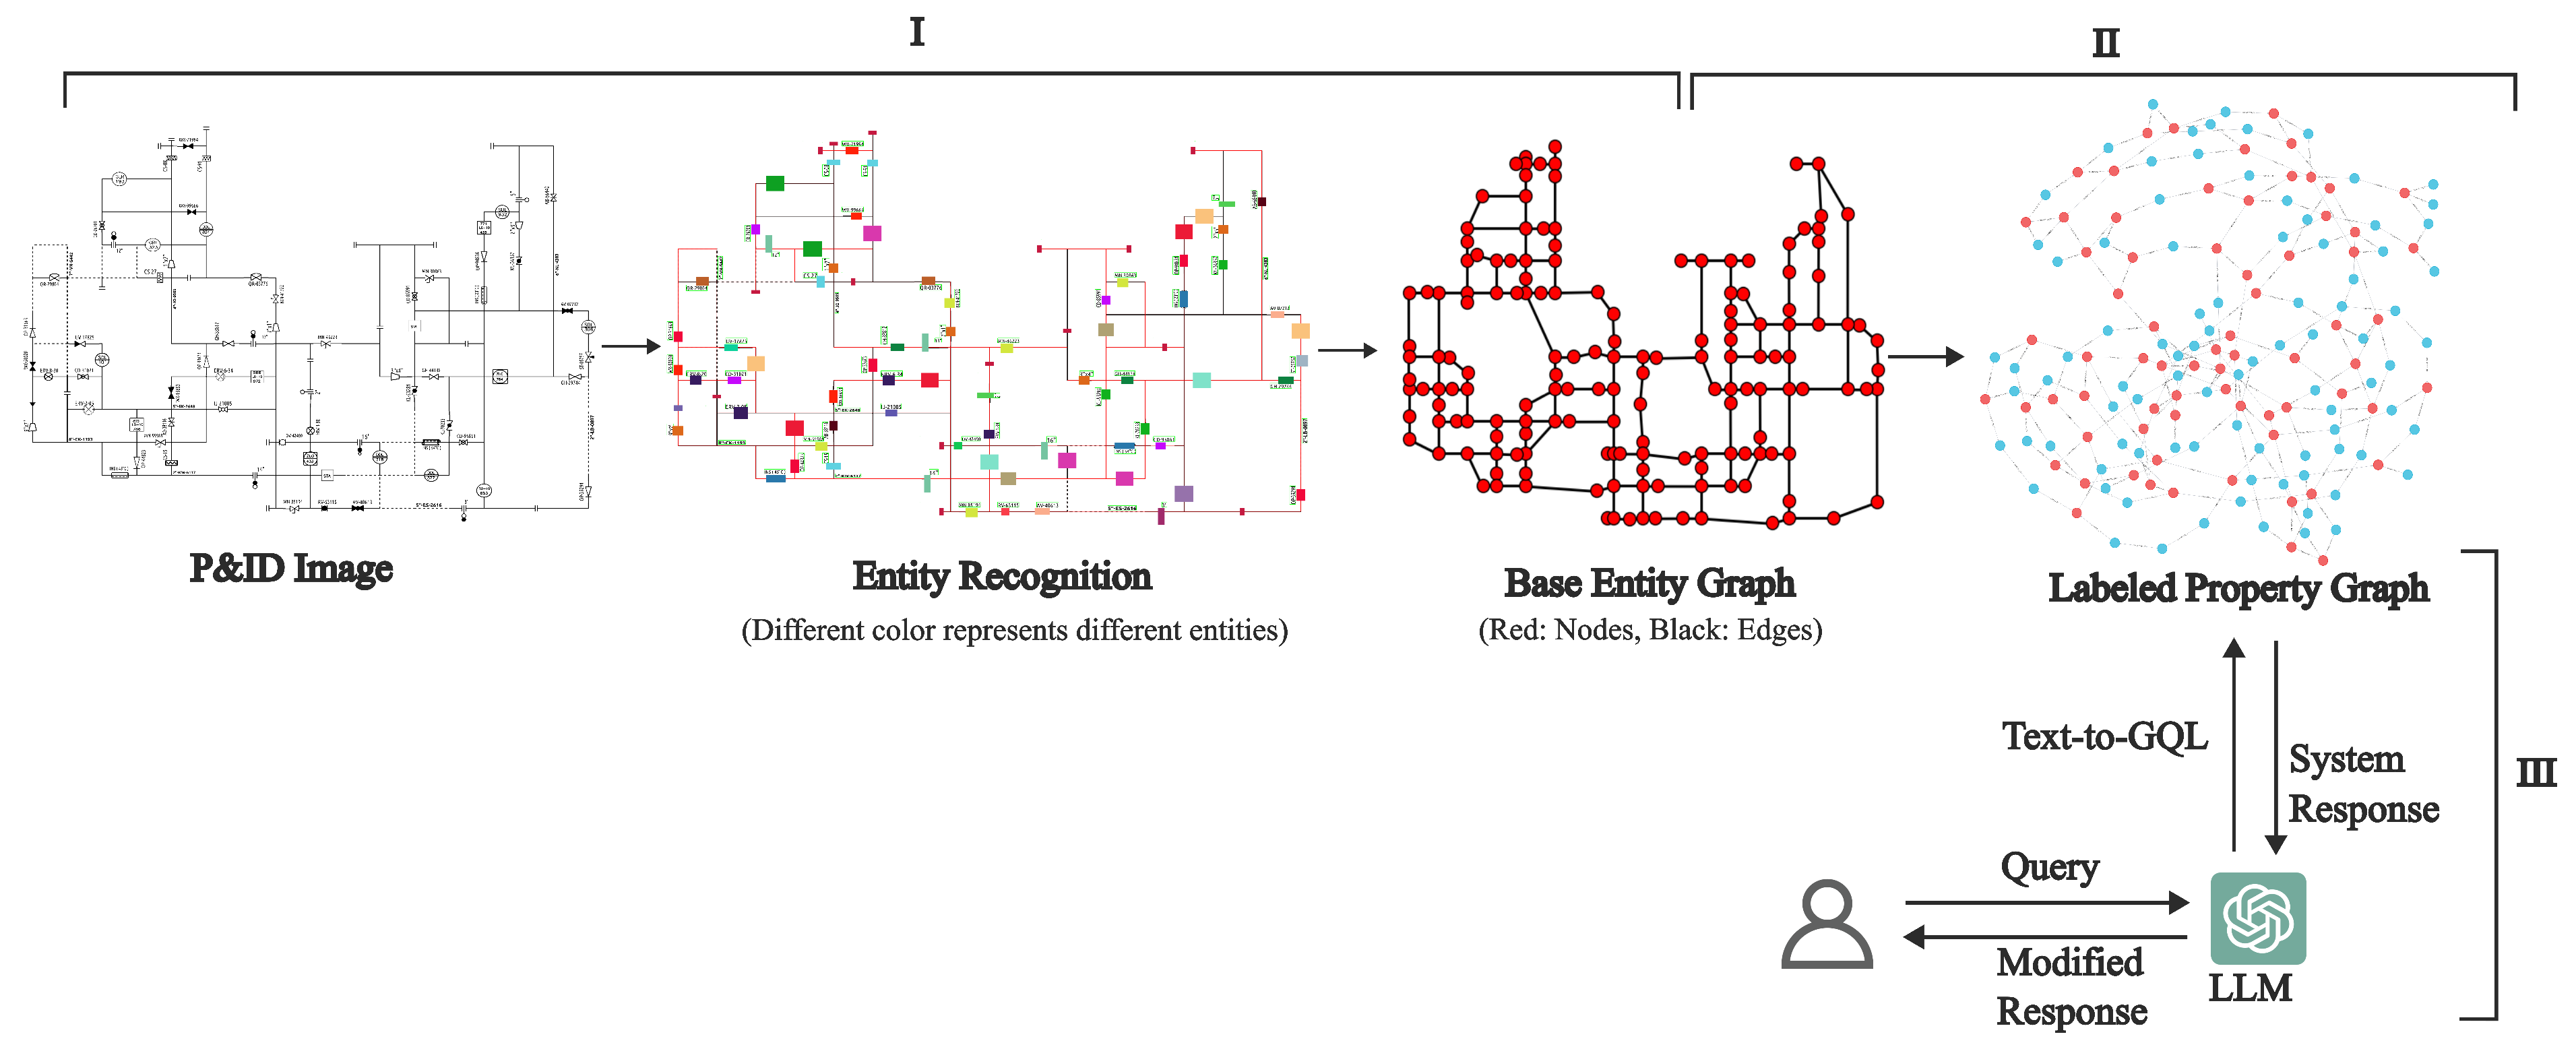
3.2. Making P&ID Queryable with Natural Language

The overall method to make a P&ID queryable via natural language consists of three steps, as shown in Figure 4. First (I), a non-machine-readable P&ID sheet was converted into a computer-readable graph data structure with symbols and line crossings as nodes and pipelines connecting them as edges. Second (II), the basic graph structure was transformed into an LPG, adding a layer of semantic meaning to the nodes and edges. Third (III), an information retrieval system using the LLM was built to extract information from the created LPG based on the question asked by a user. The details of how these steps were completed are described below.

3.2.1. P&ID Sheet to a Base Entity Graph (Step-I)

This first step entails the digitization of the P&ID sheet, where entities are recognized and their linkages are inferred, creating a graph-like structure. This process involves two stages:
Stage 1—Entity recognition: The goal of this stage was to detect symbols, text, and lines on a P&ID sheet. The Dataset-P&ID dataset was divided into three subsets: training (300 sheets), validation (100 sheets), and testing (100 sheets). The recognition of three entities was performed as follows:
  • Symbols: They are detected by training a YOLOv11 [52] object detection model using an image-tiling approach [53], where a P&ID sheet is divided into multiple overlapping 1024 × 1024 tiles for efficient detection.
  • Text: Text in a P&ID is detected using a KerasOCR [54] model fine-tuned on the training set of Dataset-P&ID using the image-tiling approach.
  • Lines: These are recognized with a custom method combining Probabilistic Hough Transform (PHT) and a post-processing, step merging duplicate lines effectively. Moreover, the hyperparameters for PHT are programmatically selected, obviating the need for any manual tuning. The details are shown graphically in Figure 5A–G.
Stage 2—Graph-based linking: The goal of this second stage was to form the nodes and edges connecting any pair of nodes to generate a base entity graph. The models trained in Stage 1 were used to generate predictions for symbols, text, and lines on the test set of P&ID images. The detected symbols comprise the first set of nodes for the graph, as shown in Figure 5H. The line crossings (intersections) are identified using the geometric properties of the line segments forming the second set of nodes, shown in Figure 5F. Then, for each line segment, the two nodes closest to either end are identified, creating a connection (edge) between them in the graph in Figure 5I. The detected text is associated with either a line connection or a symbol using a combination of proximity matching and regular expressions. Finally, this transforms an image of a P&ID into a base entity graph. A Python 3.9.21 package, Networkx [55], was used for building this graph data structure. The generated base entity graph was checked for any errors using a semi-automatic approach comprising graph-based rules and a human-in-the-loop approach before passing it down to the next steps. Any identified errors were manually rectified. This is crucial because an error-free graph would ensure the highest quality of information retrieval.

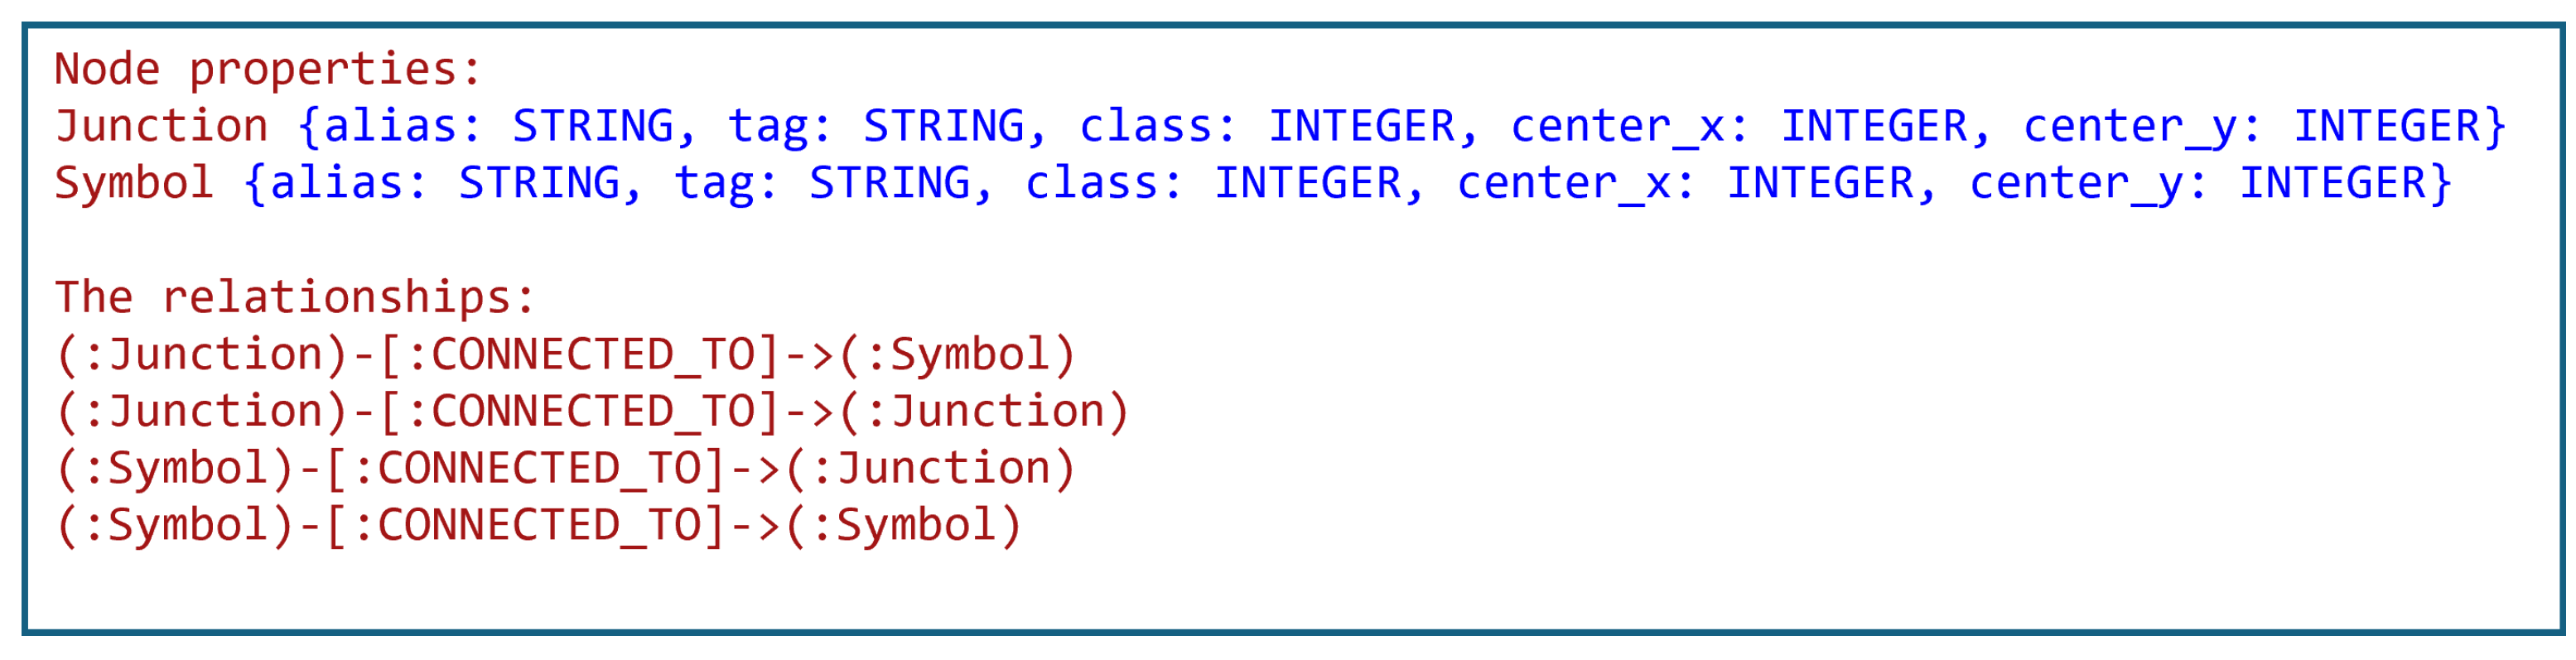
3.2.2. Base Entity Graph to Labeled Property Graph (Step II)

In this second step of the framework process, the nodes and edges of the basic graph were enriched, adding properties providing more semantic information. For example, Figure 6 shows a small section of a P&ID where its base entity graph is transformed into a richer LPG representation. The new set of properties contains location information (center_x, center_y), a reference name from the original dataset (alias), as well as details such as the class and unique text tags. Careful selection and organization of such semantic properties is crucial, making information accessible for retrieval in later steps. These property graphs were implemented using Neo4j [56].
It is worth noting that the text tags in real-world P&IDs often encode additional valuable information that can serve as meaningful properties. For instance, a line tag like 25-10″-ATF-1002-CS conveys multiple details: 25 refers to the unit number, 10″ specifies the line size, ATF denotes the fuel type (aviation turbine fuel), 1002 is the line number, and CS represents the material (carbon steel). However, since the dataset used in this study is synthetic, the text tags lack such supplementary semantic information. In real-world P&IDs, these additional properties could be incorporated into the nodes and edges, significantly enhancing the graph’s information content and extending its range of applications and utility.

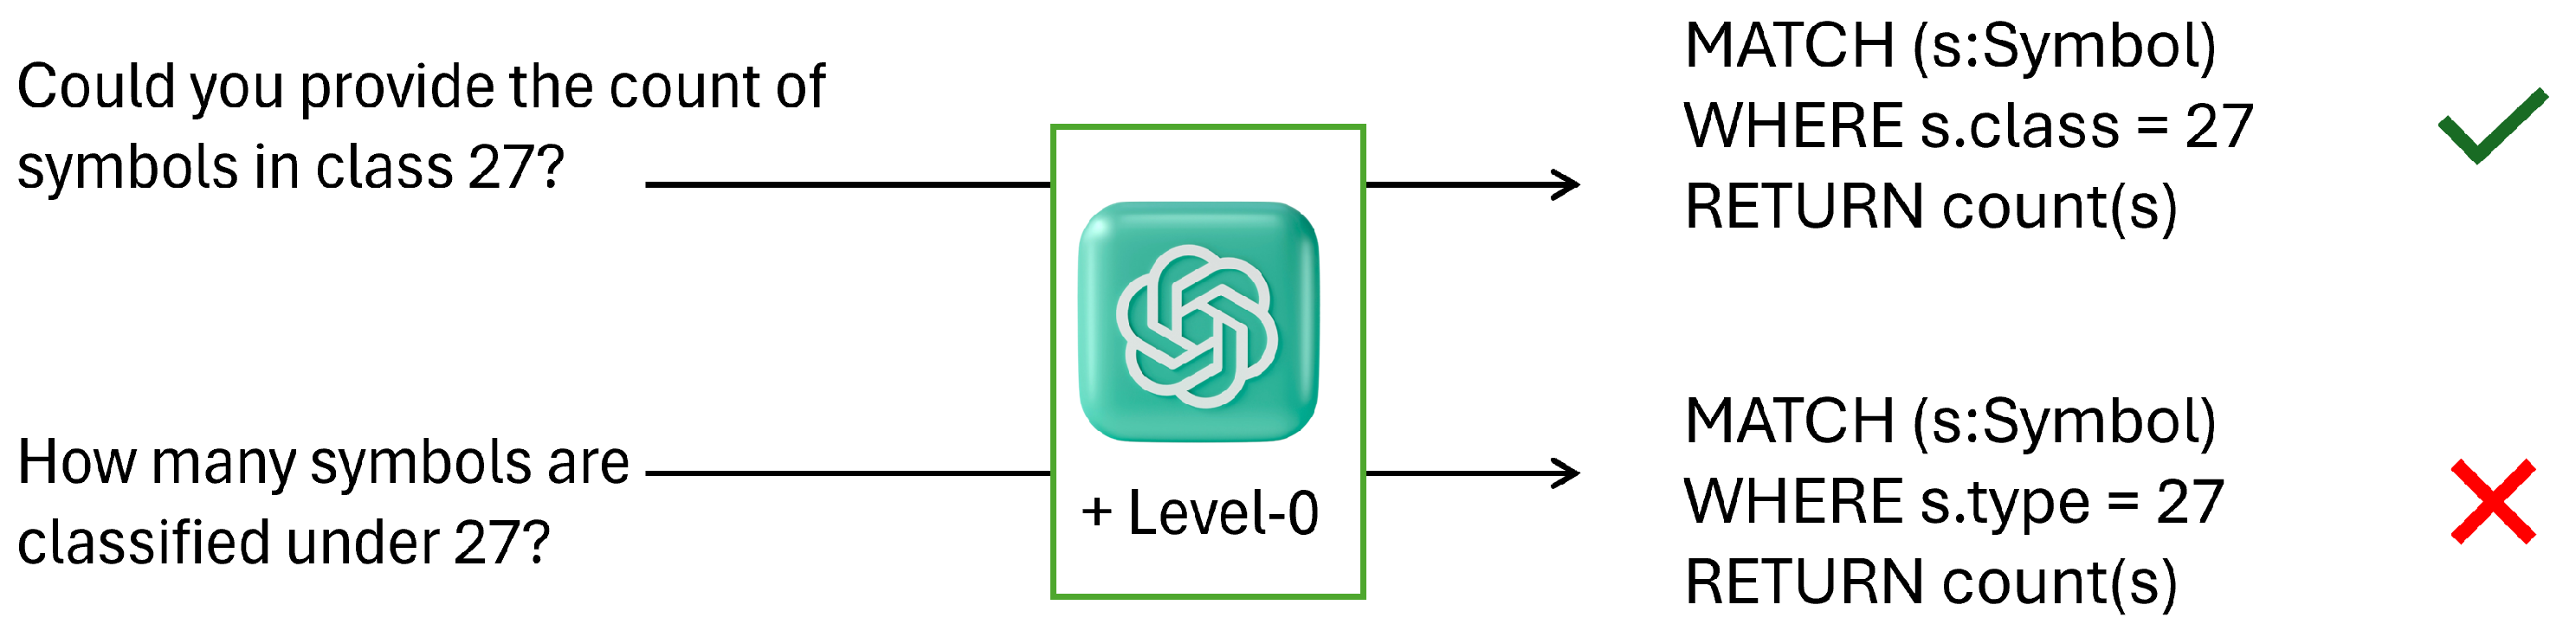
3.2.3. Information Retrieval System (Step III)

In this third and final step, the generated property graph of the previous step served as the knowledge base for information query. Upon receiving a query from a user, an LLM was invoked to translate the query into a graph query language, Cypher. The generated Cypher syntax was executed on the graph database, generating raw results. The raw results were passed again to an LLM to format them into a more human-readable natural language text. Example inputs and outputs of various stages are shown in Figure 7.
The most challenging aspect of this process is the ability of the LLM to synthesize accurate Cypher queries from free-form user prompts. Fine-tuning LLMs on P&ID-specific data could be a potential solution. However, this is currently infeasible due to the lack of high-quality datasets that pair natural language queries with their corresponding Cypher translations [57]. Furthermore, structural heterogeneity in P&ID graph schemas limits the generalizability of fine-tuned models to unseen graph configurations. To circumvent these limitations, we adopt an instruction-tuning paradigm [58], where the LLM is dynamically conditioned on the target graph schema during inference. This approach aligns with recent advances in context-aware code generation [59], where supplementary metadata (e.g., semantic meaning of data variables, user comments, function signatures) guides LLMs to produce domain-specific outputs without task-specific fine-tuning [60]. In our case, we provide the underlying graph schema as the context to the LLM for Cypher generation.
We further augment the context with few-shot examples of natural language questions and corresponding Cypher pairs, drawing parallels to in-context learning techniques that improve semantic parsing robustness [61]. To minimize stochasticity, we set the LLM’s temperature hyperparameter to zero (0) to generate the most deterministic response [62]. Prior work demonstrates that even minor lexical or syntactic variations in input prompts can yield divergent LLM outputs, posing risks for reliable database querying [63]. To quantify the impact of various techniques for supplementing context, we evaluate our method against a linguistically diverse question set under four levels of contextual information, measuring accuracy as the metric: Level 0: When the LLM has no context about the underlying graph schema. Level 1: When the LLM is provided with context via basic graph schema, as shown in Figure 8. The basic schema provide details about the node/edge types, attributes, and data types. Level 2: When the LLM is provided with a richer context via enhanced graph schema, as shown in Figure 9. This provides everything that a basic graph scheme provides, in addition to an example or summary statistic for each attribute. Level 3: When the LLM is supplemented with both a richer context and few-shot examples. In other words, this is the same as Level 2, but with few-shot examples. These four levels defined above were selected because they systematically isolate the impact of progressively richer contextual information—from basic schema knowledge to enhanced attributes with examples and few-shot learning—enabling precise evaluation of how each layer improves semantic parsing accuracy and robustness against linguistic variations

4. Results and Discussion

4.1. Entity Recognition

The evaluation metrics for lines, symbols, and text recognition for the test set of 100 sheets are displayed in Table 3. Our method achieves state-of-the-art results across all entities: F1 score of 0.998 for symbols (vs 0.922 in [25]), recall of 0.997 for text (vs 0.79 in [25]), and precision of 0.996 for lines (vs 0.958 in [25]).
The significant improvement in symbol detection (F1: 0.998 vs. 0.922) can be attributed to our use of a YOLO model for end-to-end localization and classification. In contrast, [21] employed a complex two-stage pipeline that has two distinct models, one for localization and another for classification. This decoupled approach likely introduced error propagation between stages, whereas our unified architecture ensures joint optimization of detection and classification tasks.
For text detection, our recall of 0.997 (vs. 0.79 in [25]) reflects the effectiveness of fine-tuning the KerasOCR model on our training set. The original authors of [25] did not fine-tune their network for text region proposals, leading to suboptimal performance.
Our line detection precision of 0.996 (vs. 0.958 in [25]) demonstrates the superiority of our approach, which combines the PHT with a custom line refinement module. In contrast, ref. [25] relied on a rule-based method that struggled with discontinuous (e.g., dashed) lines.

4.2. Creation of Graph Structure

After detecting the entities (symbols, text, and lines), nodes and edges are created to form multi-relational graphs. Thereafter, the text elements are assigned to either nodes or edges using a combination of euclidean distance and pattern matching. Pattern matching leverages symbol tags as priors; for instance, tags for class 5 symbols begin with ‘IJ’. Each detected text is evaluated based on its proximity to a symbol or a line and the presence of matching tag patterns. Once the text assignment is complete, a base entity graph is generated. Figure 10 (left) illustrates a representative sample of this base entity graph overlaid on the original P&ID. Next, the base graph undergoes semantic enrichment, as described in Section 3, transforming it into a Labeled Property Graph (LPG). This enriched representation captures not only structural relationships but also domain-specific semantics. Figure 10 (middle and right) shows the LPG representation of a small subsection of the same P&ID. The resulting LPGs serve as the knowledge base for natural language querying, enabling intuitive interactions with P&ID data.

4.3. Information Retrieval System

Table 4 summarizes the performance of gpt-3.5 under different levels of context on PIDQA. The results confirm our assumption: increasing context specificity correlates strongly with improved accuracy, with Level 3 (enriched schema + statistics + few-shot examples) achieving the highest performance. Below, we analyze the failure modes and success patterns across context tiers.
Level 0 context: In this case, the model exhibited the lowest performance for all question categories. Success occurred only in cases where the user query directly mapped to the schema elements. Failures arose from minor paraphrasing (e.g., “classified under” vs. “in class”), as shown in Figure 11 below. This schema hallucination is consistent with prior work on semantic parsing without schema grounding [64].
Level 1 context: Introducing coarse-grained schema metadata (node/edge types, attributes) improved performance across all four categories. This boost was even higher for simpler question types—counting and value-based. However, for user prompts with referential ambiguity, as shown in the bottom of Figure 12, the implicit property mapping failed. This highlights the limitations of coarse-grained schema context in mitigating implicit attribute references, necessitating richer contextual signals for robust semantic alignment.
Level 2 context: Augmenting basic schema context with attribute-value distributions (e.g., symbol’s class range), as shown in Figure 9, improved the efficiency in implicit attribute referencing. For instance, the same query as above, “How many 27?” is resolved via attribute-value grounding offered by Level 2 context, as shown in Figure 13. However, statistical priors alone could not resolve alignment in compositionally complex queries and inherent randomness in the LLM, leading to incorrect generation ranging from 12% in spatial counting to 46 % in spatial connections.
Level 3 context: Incorporating dynamic three-shot examples eliminated most of Level 2’s residual errors by enabling retrieval-augmented few-shot learning with a representative example shown in Figure 14. Few-shot learning also reduced generative variance, with exemplars acting as anchors, a common observation similar to prior works such as [65,66] on prompt-guided semantic parsing.
In summary, the experiment highlights the importance of contextualizing LLMs with the underlying graph schema to mitigate schema hallucination. Enriching the schema with summary statistics proves effective for handling underspecified queries, while augmenting the context with few-shot examples improves performance on compositionally complex queries and offers a scalable approach for adapting LLMs to new question categories.

5. Limitations

Although our framework enhances information querying on P&IDs using natural language, it has four limitations: (1) The dataset used for our experiments, Dataset-P&ID, does not indicate arrows in P&IDs to indicate flow directions. Therefore, we treat edges (connections) between any two nodes in the graph data structures as bidirectional. This loss of flow-directional metadata undermines the modeling of system dynamics (e.g., unidirectional valves or pumps), limiting the framework’s ability to infer process causality or validate directional path constraints. (2) Symbol classes in Dataset-P&ID are encoded as integers without human-interpretable nomenclature (e.g., “flange connection” vs. “21”). This semantic annotation gap restricts intuitive querying (e.g., “count all pumps”) and complicates schema-augmented retrieval. (3) Our assumption of uniformly treating all line-crossings in P&IDs as nodes could result in over-segmentation in real-world diagrams where crossings may represent non-junctional overlaps. This could propagate false adjacency relationships during graph construction, necessitating post-processing rules to filter spurious edges in deployment. (4) Because the digitization pipeline is sequential, errors from earlier stages can propagate and amplify in later stages, making human-in-the-loop validation essential for ensuring the accuracy of the base entity graphs.

6. Conclusions and Future Study

This work introduces a framework for making P&IDs queryable with natural language. To develop and test this framework, we first digitized P&IDs detecting different entities (lines, symbols, and text) in them. We trained advanced neural networks outperforming benchmark baselines in [25] across all entities, providing a robust foundation for subsequent stages. For symbols, lines, and text, F1 scores of 0.998, 0.994, and 0.997, respectively, were obtained. This robust detection forms the foundation for accurate graph construction. Following entity recognition, semantic enrichment in graph structure was performed by adding the functional, geometrical, or physical properties of the entities. This structured representation captures both the topological relationships and domain-specific semantics of P&IDs, enabling context-aware querying. Finally, for a given user question, the LLM converts it into a Cypher syntax and executes it on LPG for information retrieval. Our analysis underscores the importance of contextual grounding—through enriched graph schema and a few-shot examples—in ensuring robust query generation. Specifically, contextualization addresses critical challenges such as lexical perturbations (e.g., paraphrastic variations), schema alignment (e.g., mapping natural language terms to implicit schema elements), and referential ambiguity (e.g., resolving underspecified queries). This framework not only advances the state of the art in P&ID digitization but also provides a scalable and generalizable approach for querying complex engineering diagrams using natural language, paving the way for broader applications in industrial knowledge management and decision support systems. In addition to this, we also created PIDQA, a dataset consisting of 64k question–answer pairs for four categories of questions—counting, spatial counting, spatial connections, and value-based retrieval tasks on P&IDs.
A potential future study could involve integrating knowledge graphs derived from safety regulations (e.g., ANSI/ISA 5.1, ASME B31.3) to enable automated compliance checking. This could entail parsing regulatory text into formal logic rules or ontologies, which can then be cross-referenced with the LPG to identify potential violations. Another valuable extension could involve enriching the graph schema with directional metadata to support causal reasoning about process behavior, enabling advanced analyses such as Hazard and Operability Studies (HAZOP). An especially compelling future avenue would be to evaluate the proposed framework on real-world P&IDs and adapt it to related engineering drawings, such as electrical schematics and HVAC diagrams.
Additionally, future work could include establishing comparative baselines for the question-answering component of the system. This may involve developing and evaluating lightweight models, such as fine-tuned sequence-to-sequence networks, to assess trade-offs in performance, interpretability, and computational efficiency. As more annotated datasets for P&ID text-to-Cypher tasks become available, such comparisons will be crucial for identifying practical and scalable alternatives to LLMs.

Author Contributions

Conceptualization, M.G. and C.W.; methodology, M.G. and C.W.; validation, C.W. and R.E.; formal analysis, M.G. and R.E.; investigation, M.G., T.C., and R.E.; resources, M.G. and R.E.; data curation, M.G., T.C., and R.E.; writing—original draft preparation, M.G., C.W., T.C., and R.E.; writing—review and editing, M.G. and R.E.; visualization, M.G.; supervision, T.C. and R.E.; project administration, M.G. and R.E. All authors have read and agreed to the published version of the manuscript.

Funding

This research received no external funding.

Institutional Review Board Statement

Not applicable.

Informed Consent Statement

Not applicable.

Data Availability Statement

Dataset—PIDQA is publicly available at: https://github.com/mgupta70/PIDQA.

Conflicts of Interest

The authors declare no conflicts of interest.

References

  1. Court, A.; Ullman, D.; Culley, S. A Comparison Between the Provision of Information to Engineering Designers in the UK and the USA. Int. J. Inf. Manag. 1998, 18, 409–425. [Google Scholar] [CrossRef]
  2. Kasimov, D.R.; Kuchuganov, A.V.; Kuchuganov, V.N. Individual strategies in the tasks of graphical retrieval of technical drawings. J. Vis. Lang. Comput. 2015, 28, 134–146. [Google Scholar] [CrossRef]
  3. Hofer-Alfeis, J.; Maderlechner, G. Automated Conversion of Mechanical Engineering Drawings to CAD Models: Too many Problems? In Proceedings of the IAPR International Workshop on Machine Vision Applications, Tokyo, Japan,, 12–14 October 1988. [Google Scholar]
  4. Azzam, S.; Mohamed, S.; ELDASH, K. Outsourcing Engineering Tasks by Construction Firms: State-of-the-Art. Eng. Res. J. (Shoubra) 2023, 52, 157–168. [Google Scholar] [CrossRef]
  5. Joy, J.; Mounsef, J. Automation of Material Takeoff using Computer Vision. In Proceedings of the 2021 IEEE International Conference on Industry 4.0, Artificial Intelligence, and Communications Technology (IAICT), Bandung, Indonesia, 27–28 July 2021; pp. 196–200. [Google Scholar] [CrossRef]
  6. Li, Z.; Victor, R.; Karthik, R. A Methodology of Engineering Ontology Development for Information Retrieval. Proceedings of ICED 2007, the 16th International Conference on Engineering Design (ICED), Paris, France, 28–31 July 2007. [Google Scholar]
  7. Aliakbar Heidari, Y.P.; Amanzadegan, M. A systematic review of the BIM in construction: From smart building management to interoperability of BIM & AI. Archit. Sci. Rev. 2024, 67, 237–254. [Google Scholar] [CrossRef]
  8. Li, N.; Li, Q.; Liu, Y.S.; Lu, W.; Wang, W. BIMSeek++: Retrieving BIM components using similarity measurement of attributes. Comput. Ind. 2020, 116, 103186. [Google Scholar] [CrossRef]
  9. Hertzum, M.; Pejtersen, A.M. The information-seeking practices of engineers: Searching for documents as well as for people. Inf. Process. Manag. 2000, 36, 761–778. [Google Scholar] [CrossRef]
  10. Ranasinghe, U.; Tang, L.M.; Harris, C.; Li, W.; Montayre, J.; de Almeida Neto, A.; Antoniou, M. A systematic review on workplace health and safety of ageing construction workers. Saf. Sci. 2023, 167, 106276. [Google Scholar] [CrossRef]
  11. Hoffmann, R.; Zhang, C.; Ling, X.; Zettlemoyer, L.; Weld, D.S. Knowledge-Based Weak Supervision for Information Extraction of Overlapping Relations. In Proceedings of the 49th Annual Meeting of the Association for Computational Linguistics: Human Language Technologies, Portland, OR, USA, 2011; Lin, D., Matsumoto, Y., Mihalcea, R., Eds.; Association for Computational Linguistics: Stroudsburg, PA, USA, 2011; pp. 541–550. [Google Scholar]
  12. Bordes, A.; Weston, J.; Usunier, N. Open Question Answering with Weakly Supervised Embedding Models. In Proceedings of the Machine Learning and Knowledge Discovery in Databases, Nancy, France, 15–19 September 2014; Calders, T., Esposito, F., Hüllermeier, E., Meo, R., Eds.; Springer: Berlin/Heidelberg, Germany, 2014; pp. 165–180. [Google Scholar]
  13. Heck, L.; Hakkani-Tür, D.Z.; Tür, G. Leveraging knowledge graphs for web-scale unsupervised semantic parsing. In Proceedings of the Interspeech, Lyon, France, 25–29 August 2013. [Google Scholar]
  14. Hakimov, S.; Oto, S.A.; Dogdu, E. Named entity recognition and disambiguation using linked data and graph-based centrality scoring. In Proceedings of the 4th International Workshop on Semantic Web Information Management, New York, NY, USA, 20 May 2012. SWIM’12. [Google Scholar] [CrossRef]
  15. Yüksel, K.E.; Üsküdarli, S. Incorporating Knowledge Graph Embeddings into Graph Neural Networks for Sequential Recommender Systems. In Proceedings of the 2024 9th International Conference on Computer Science and Engineering (UBMK), Antalya, Turkiye, 26–28 October 2024; pp. 1–6. [Google Scholar] [CrossRef]
  16. Wang, Q.; Mao, Z.; Wang, B.; Guo, L. Knowledge Graph Embedding: A Survey of Approaches and Applications. IEEE Trans. Knowl. Data Eng. 2017, 29, 2724–2743. [Google Scholar] [CrossRef]
  17. Purohit, S.; Van, N.; Chin, G. Semantic Property Graph for Scalable Knowledge Graph Analytics. In Proceedings of the 2021 IEEE International Conference on Big Data (Big Data), Orlando, FL, USA, 15–18 December 2021; pp. 2672–2677. [Google Scholar] [CrossRef]
  18. Elyan, E.; Garcia, C.M.; Jayne, C. Symbols Classification in Engineering Drawings. In Proceedings of the 2018 International Joint Conference on Neural Networks (IJCNN), Rio de Janeiro, Brazil, 8–13 July 2018; pp. 1–8. [Google Scholar] [CrossRef]
  19. Dzhusupova, R.; Banotra, R.; Bosch, J.; Olsson, H.H. Using artificial intelligence to find design errors in the engineering drawings. J. Software: Evol. Process 2023, 35, e2543. [Google Scholar] [CrossRef]
  20. Kim, H.; Lee, W.; Kim, M.; Moon, Y.; Lee, T.; Cho, M.; Mun, D. Deep-learning-based recognition of symbols and texts at an industrially applicable level from images of high-density piping and instrumentation diagrams. Expert Syst. Appl. 2021, 183, 115337. [Google Scholar] [CrossRef]
  21. Tan, W.C.; Chen, I.M.; Tan, H.K. Automated identification of components in raster piping and instrumentation diagram with minimal pre-processing. In Proceedings of the 2016 IEEE International Conference on Automation Science and Engineering (CASE), Fort Worth, TX, USA, 21–25 August 2016; pp. 1301–1306. [Google Scholar] [CrossRef]
  22. Xie, L.; Lu, Y.; Furuhata, T.; Yamakawa, S.; Zhang, W.; Regmi, A.; Kara, L.; Shimada, K. Graph neural network-enabled manufacturing method classification from engineering drawings. Comput. Ind. 2022, 142, 103697. [Google Scholar] [CrossRef]
  23. Moreno-García, C.F.; Elyan, E.; Jayne, C. New trends on digitisation of complex engineering drawings. Neural Comput. Appl. 2019, 31, 1695–1712. [Google Scholar] [CrossRef]
  24. Gupta, M.; Wei, C.; Czerniawski, T. Semi-supervised symbol detection for piping and instrumentation drawings. Autom. Constr. 2024, 159, 105260. [Google Scholar] [CrossRef]
  25. Paliwal, S.; Jain, A.; Sharma, M.; Vig, L. Digitize-PID: Automatic Digitization of Piping and Instrumentation Diagrams. In Proceedings of the Trends and Applications in Knowledge Discovery and Data Mining; Gupta, M., Ramakrishnan, G., Eds.; Springer: Cham, Switzerland, 2021; pp. 168–180. [Google Scholar]
  26. Li, J.; Li, D.; Xiong, C.; Hoi, S. BLIP: Bootstrapping Language-Image Pre-training for Unified Vision-Language Understanding and Generation. In Proceedings of the ICML, New York, NY, USA, 18–21 February 2022. [Google Scholar]
  27. Wang, J.; Yang, Z.; Hu, X.; Li, L.; Lin, K.; Gan, Z.; Liu, Z.; Liu, C.; Wang, L. GIT: A Generative Image-to-text Transformer for Vision and Language. arXiv 2022, arXiv:2205.14100. [Google Scholar]
  28. Kim, B.C.; Kim, H.; Moon, Y.; Lee, G.; Mun, D. End-to-end digitization of image format piping and instrumentation diagrams at an industrially applicable level. J. Comput. Des. Eng. 2022, 9, 1298–1326. [Google Scholar] [CrossRef]
  29. Yu, E.S.; Cha, J.M.; Lee, T.; Kim, J.; Mun, D. Features Recognition from Piping and Instrumentation Diagrams in Image Format Using a Deep Learning Network. Energies 2019, 12, 4425. [Google Scholar] [CrossRef]
  30. Moon, Y.; Lee, J.; Mun, D.; Lim, S. Deep Learning-Based Method to Recognize Line Objects and Flow Arrows from Image-Format Piping and Instrumentation Diagrams for Digitization. Appl. Sci. 2021, 11, 10054. [Google Scholar] [CrossRef]
  31. Rahul, R.; Paliwal, S.; Sharma, M.; Vig, L. Automatic Information Extraction from Piping and Instrumentation Diagrams. arXiv 2019, arXiv:1901.11383. [Google Scholar]
  32. Bochkovskiy, A.; Wang, C.Y.; Liao, H.Y.M. YOLOv4: Optimal Speed and Accuracy of Object Detection. arXiv 2020, arXiv:2004.10934. [Google Scholar]
  33. Girshick, R.B.; Donahue, J.; Darrell, T.; Malik, J. Rich Feature Hierarchies for Accurate Object Detection and Semantic Segmentation. In Proceedings of the 2014 IEEE Conference on Computer Vision and Pattern Recognition, Columbus, OH, USA, 23–28 June 2014; pp. 580–587. [Google Scholar]
  34. Wu, Y.; Kirillov, A.; Massa, F.; Lo, W.Y.; Girshick, R. Detectron2. 2019. Available online: https://github.com/facebookresearch/detectron2 (accessed on 22 September 2024).
  35. Smith, R. An Overview of the Tesseract OCR Engine. In Proceedings of the Ninth International Conference on Document Analysis and Recognition (ICDAR 2007), Curitiba, Brazil, 23–26 September 2007; Volume 2, pp. 629–633. [Google Scholar] [CrossRef]
  36. Vedhaviyassh, D.; Sudhan, R.; Saranya, G.; Safa, M.; Arun, D. Comparative Analysis of EasyOCR and TesseractOCR for Automatic License Plate Recognition using Deep Learning Algorithm. In Proceedings of the 2022 6th International Conference on Electronics, Communication and Aerospace Technology, Coimbatore, India, 1–3 December 2022; pp. 966–971. [Google Scholar] [CrossRef]
  37. Baek, Y.; Lee, B.; Han, D.; Yun, S.; Lee, H. Character Region Awareness for Text Detection. arXiv 2019, arXiv:1904.01941. [Google Scholar] [CrossRef]
  38. Antol, S.; Agrawal, A.; Lu, J.; Mitchell, M.; Batra, D.; Zitnick, C.L.; Parikh, D. VQA: Visual Question Answering. In Proceedings of the IEEE International Conference on Computer Vision (ICCV), Santiago, Chile, 7–13 December 2015. [Google Scholar]
  39. Kafle, K.; Kanan, C. An Analysis of Visual Question Answering Algorithms. In Proceedings of the 2017 IEEE International Conference on Computer Vision (ICCV), Venice, Italy, 22–29 October 2017; pp. 1983–1991. [Google Scholar] [CrossRef]
  40. Masry, A.; Do, X.L.; Tan, J.Q.; Joty, S.; Hoque, E. ChartQA: A Benchmark for Question Answering about Charts with Visual and Logical Reasoning. In Proceedings of the Findings of the Association for Computational Linguistics: ACL 2022, Dublin, Ireland, 22–27 May 2022; Muresan, S., Nakov, P., Villavicencio, A., Eds.; Association for Computational Linguistics: Stroudsburg, PA, USA, 2022; pp. 2263–2279. [Google Scholar] [CrossRef]
  41. Babkin, P.; Watson, W.; Ma, Z.; Cecchi, L.; Raman, N.; Nourbakhsh, A.; Shah, S. BizGraphQA: A Dataset for Image-based Inference over Graph-structured Diagrams from Business Domains. In Proceedings of the 46th International ACM SIGIR Conference on Research and Development in Information Retrieval, New York, NY, USA, 23–27 July 2023; SIGIR ’23. pp. 2691–2700. [Google Scholar] [CrossRef]
  42. Lu, P.; Mishra, S.; Xia, T.; Qiu, L.; Chang, K.W.; Zhu, S.C.; Tafjord, O.; Clark, P.; Kalyan, A. Learn to explain: Multimodal reasoning via thought chains for science question answering. In Proceedings of the 36th International Conference on Neural Information Processing Systems, New Orleans, LA, USA, 28 November–9 December 2022. NIPS ’22.. [Google Scholar]
  43. Kunlamai, T.; Yamane, T.; Suganuma, M.; Chun, P.J.; Okatani, T. Improving visual question answering for bridge inspection by pre-training with external data of image–text pairs. Comput.-Aided Civ. Infrastruct. Eng. 2024, 39, 345–361. [Google Scholar] [CrossRef]
  44. Ding, Y.; Liu, M.; Luo, X. Safety compliance checking of construction behaviors using visual question answering. Autom. Constr. 2022, 144, 104580. [Google Scholar] [CrossRef]
  45. Wen, S.; Park, M.; Tran, D.Q.; Lee, S.; Park, S. Automated construction safety reporting system integrating deep learning-based real-time advanced detection and visual question answering. Adv. Eng. Softw. 2024, 198, 103779. [Google Scholar] [CrossRef]
  46. Shi, X.; Lee, S. Benchmarking Out-of-Distribution Detection in Visual Question Answering. In Proceedings of the 2024 IEEE/CVF Winter Conference on Applications of Computer Vision (WACV), Waikoloa, HI, USA, 3–8 January 2024; pp. 5473–5483. [Google Scholar] [CrossRef]
  47. Zhang, M.; Maidment, T.; Diab, A.; Kovashka, A.; Hwa, R. Domain-robust VQA with diverse datasets and methods but no target labels. In Proceedings of the 2021 IEEE/CVF Conference on Computer Vision and Pattern Recognition (CVPR), Nashville, TN, USA, 20–25 June 2021; pp. 7042–7052. [Google Scholar] [CrossRef]
  48. Zeng, Y.; Zhang, X.; Li, H. Multi-Grained Vision Language Pre-Training: Aligning Texts with Visual Concepts. In Proceedings of the International Conference on Machine Learning, Shenzhen, China, 26 February–1 March 2021. [Google Scholar]
  49. Artificial Intelligence for the Automatic Generation of Material Take offs from Piping and Instrumentation Diagrams, Vol. Day 3 Wed, 4 October 2023, Abu Dhabi International Petroleum Exhibition and Conference. 2023. Available online: https://onepetro.org/SPEADIP/proceedings-pdf/23ADIP/3-23ADIP/D031S117R002/3281517/spe-216815-ms.pdf (accessed on 3 January 2025). [CrossRef]
  50. Park, Y.C.; Ryu, J.S. Design and Test of ASME Strainer for Primary Cooling System in HANARO. In Proceedings of the Sixth Asian Symposium on Research Reactors, Mito, Japan, 29-31 March 1999; pp. 130–135. [Google Scholar]
  51. Mehta, R.; Singh, B.; Varma, V.; Gupta, M. CircuitVQA: A Visual Question Answering Dataset for Electrical Circuit Images. In Proceedings of the Machine Learning and Knowledge Discovery in Databases. Research Track; Bifet, A., Davis, J., Krilavičius, T., Kull, M., Ntoutsi, E., Žliobaitė, I., Eds.; Springer: Cham, Switzerland, 2024; pp. 440–460. [Google Scholar]
  52. Khanam, R.; Hussain, M. YOLOv11: An Overview of the Key Architectural Enhancements. arXiv 2024, arXiv:2410.17725. [Google Scholar]
  53. Akyon, F.C.; Onur Altinuc, S.; Temizel, A. Slicing Aided Hyper Inference and Fine-Tuning for Small Object Detection. In Proceedings of the 2022 IEEE International Conference on Image Processing (ICIP), Bordeaux, France, 16–19 October 2022; pp. 966–970. [Google Scholar] [CrossRef]
  54. Tarawneh, A.S.; Hassanat, A.B.; Chetverikov, D.; Lendak, I.; Verma, C. Invoice Classification Using Deep Features and Machine Learning Techniques. In Proceedings of the 2019 IEEE Jordan International Joint Conference on Electrical Engineering and Information Technology (JEEIT), Amman, Jordan, 9–11 April 2019; pp. 855–859. [Google Scholar] [CrossRef]
  55. Hagberg, A.; Swart, P.J.; Schult, D.A. Exploring Network Structure, Dynamics, and Function Using NetworkX; Los Alamos National Laboratory (LANL): Los Alamos, NM, USA, 2008. [Google Scholar]
  56. Miller, J.J. Graph Database Applications and Concepts with Neo4j. In Proceedings of the southern association for information systems conference, Atlanta, GA, USA, 8–9 March 2013; Volume 2324, no. 36. pp. 141–147. [Google Scholar]
  57. Özsoy, M.G.; Messallem, L.; Besga, J.; Minneci, G. Text2Cypher: Bridging Natural Language and Graph Databases. arXiv 2024, arXiv:2412.10064. [Google Scholar]
  58. Zhang, S.; Dong, L.; Li, X.; Zhang, S.; Sun, X.; Wang, S.; Li, J.; Hu, R.; Zhang, T.; Wu, F.; et al. Instruction Tuning for Large Language Models: A Survey. arXiv 2023, arXiv:2308.10792. [Google Scholar] [CrossRef]
  59. Yu, X.; Huang, Q.; Wang, Z.; Feng, Y.; Zhao, D. Towards Context-Aware Code Comment Generation. In Proceedings of the Findings of the Association for Computational Linguistics: EMNLP 2020, Online, 16–20 November 2020; Cohn, T., He, Y., Liu, Y., Eds.; Association for Computational Linguistics: Stroudsburg, PA, USA, 2020; pp. 3938–3947. [Google Scholar] [CrossRef]
  60. Brown, T.; Mann, B.; Ryder, N.; Subbiah, M.; Kaplan, J.D.; Dhariwal, P.; Neelakantan, A.; Shyam, P.; Sastry, G.; Askell, A.; et al. Language Models are Few-Shot Learners. In Proceedings of the Advances in Neural Information Processing Systems; Larochelle, H., Ranzato, M., Hadsell, R., Balcan, M., Lin, H., Eds.; Curran Associates, Inc.: New York, NY, USA, 2020; Volume 33, pp. 1877–1901. [Google Scholar]
  61. Dong, Q.; Li, L.; Dai, D.; Zheng, C.; Ma, J.; Li, R.; Xia, H.; Xu, J.; Wu, Z.; Chang, B.; et al. A Survey on In-context Learning. In Proceedings of the 2024 Conference on Empirical Methods in Natural Language Processing, Miami, FL, USA, 12–16 November 2024; Al-Onaizan, Y., Bansal, M., Chen, Y.N., Eds.; Association for Computational Linguistics: Stroudsburg, PA, USA, 2024; pp. 1107–1128. [Google Scholar] [CrossRef]
  62. Paul, D.G.; Zhu, H.; Bayley, I. Benchmarks and Metrics for Evaluations of Code Generation: A Critical Review. In Proceedings of the 2024 IEEE International Conference on Artificial Intelligence Testing (AITest), Shanghai, China, 15–18 July 2024; pp. 87–94. [Google Scholar] [CrossRef]
  63. Gan, Y.; Chen, X.; Huang, Q.; Purver, M.; Woodward, J.R.; Xie, J.; Huang, P. Towards Robustness of Text-to-SQL Models against Synonym Substitution. arXiv 2021, arXiv:2106.01065. [Google Scholar]
  64. Deng, X.; Awadallah, A.H.; Meek, C.; Polozov, O.; Sun, H.; Richardson, M. Structure-Grounded Pretraining for Text-to-SQL. In Proceedings of the 2021 Conference of the North American Chapter of the Association for Computational Linguistics: Human Language Technologies; Toutanova, K., Rumshisky, A., Zettlemoyer, L., Hakkani-Tur, D., Beltagy, I., Bethard, S., Cotterell, R., Chakraborty, T., Zhou, Y., Eds.; Association for Computational Linguistics: Stroudsburg, PA, USA, 2021; pp. 1337–1350. [Google Scholar] [CrossRef]
  65. Gu, Z.; Fan, J.; Tang, N.; Cao, L.; Jia, B.; Madden, S.; Du, X. Few-shot Text-to-SQL Translation using Structure and Content Prompt Learning. Proc. ACM Manag. Data 2023, 1, 1–28. [Google Scholar] [CrossRef]
  66. Liu, P.; Yuan, W.; Fu, J.; Jiang, Z.; Hayashi, H.; Neubig, G. Pre-train, Prompt, and Predict: A Systematic Survey of Prompting Methods in Natural Language Processing. ACM Comput. Surv. 2023, 55, 1–35. [Google Scholar] [CrossRef]
Figure 1. A sample P&ID image in Dataset-P&ID.
Make 07 00039 g001
Figure 2. Symbol classes present in an open-source dataset, Dataset-P&ID.
Make 07 00039 g002
Figure 3. Process for generating question templates.
Make 07 00039 g003
Figure 4. An overview of the process for making P&IDs queryable with natural text. Step I: the creation of a base entity graph; Step II: transformation into a labeled property graph; Step III: information retrieval system interfacing user and knowledge graph.
Make 07 00039 g004
Figure 5. Steps for refining line detection and graph-based linking.
Make 07 00039 g005
Figure 6. Transformation of base entity graph to a richer information representation, Labeled Property Graph (LPG). (Left) a small section of P&ID, (Middle) its representation in a base entity graph containing only node names and text, (Right) reorganization of information with meaningful and supplementary attributes.
Make 07 00039 g006
Figure 7. Information retrieval system. Step 1: User inputs a query; Step 2: LLM transforms the user query into a Graph Query Language (GQL); Step 3: the query is executed on LPG, and the response is received; Step 4:the generated system response is modified to return a response in natural language text. (Blue: Symbol Nodes, Red: Junction/Line-crossing Nodes, Lines: Connections).
Make 07 00039 g007
Figure 8. Basic graph schema.
Make 07 00039 g008
Figure 9. Enhanced graph schema. Includes all elements of the basic graph schema, along with example instances for each object and custom information.
Make 07 00039 g009
Figure 10. (Left) Base entity graph overlaid on the original P&ID, (Middle) LPG for a small subsection in P&ID, (Right) attributes for a sample symbol node.
Make 07 00039 g010
Figure 11. An example of correct and incorrect Cypher query generated by the LLM with Level 0 context. (Top): A well-formed user query with alignment to underlying schema elements (e.g., explicit class reference) enables correct syntax generation (WHERE s.class = 27). (Bottom): A paraphrastic variation introducing lexical perturbation (“classified under” → implicit class semantics) causes schema hallucination (invalid property type).
Make 07 00039 g011
Figure 12. An example of correct and incorrect Cypher query generated by the LLM with Level 1 context. (Top): A slightly ambiguous query (“classified under 27”) is resolved correctly via basic schema grounding, enabling the LLM to infer the class attribute of symbol nodes. (Bottom): A severely underspecified query leading to node-property misassignment (incorrectly targeting junction nodes via tag instead of symbol/class).
Make 07 00039 g012
Figure 13. An example of correct and incorrect Cypher query generated by the LLM with Level 2 context. A severely underspecified query is resolved correctly via attribute-value grounding enabled by enriched schema statistics. Bottom: A compositionally complex query triggers path traversal errors despite Level 2 context.
Make 07 00039 g013
Figure 14. An example of successful compositional generalization for a complex query under Level 3 context.
Make 07 00039 g014
Table 1. Sample question–answer pairs in PIDQA for P&ID shown in Figure 1.
Question TypeQuestionAnswer
Simple countingHow many symbols of class 1 are present?2
Spatial countingHow many symbols with class 28 are linked directly to symbols with class 32?1
Spatial connectionsIs there a symbol in class 17 that is connected to class 21 on one side and class 25 on the other?True
ValueGive me all class 31 symbols whose tag starts with ZLO.[ZLO 433]
Table 2. Details for types and number of questions in PIDQA.
Question TypeNumber of Questions
1 Sheet500 Sheets
Simple counting3216,000
Spatial counting3216,000
Spatial connections3216,000
Value3216,000
Total12864,000
Table 3. Results of entity recognition.
EntityModelRecallPrecisionF1 Score
SymbolsYOLOv110.9990.9970.998
TextKerasOCR0.9970.9920.994
LinesPHT + line refinement0.9990.9960.997
Table 4. Results of information retrieval.
TaskAccuracy with Context
Level 0Level 1Level 2Level 3
Simple counting0.1270.8660.8710.995
Spatial counting0.5710.7130.880.986
Spatial connections0.1350.290.540.975
Value0.1720.5650.7620.97
Disclaimer/Publisher’s Note: The statements, opinions and data contained in all publications are solely those of the individual author(s) and contributor(s) and not of MDPI and/or the editor(s). MDPI and/or the editor(s) disclaim responsibility for any injury to people or property resulting from any ideas, methods, instructions or products referred to in the content.

