Abstract
Fly ash (FA)-based geopolymer was prepared using sodium hydroxide and sodium silicate (in 2.5ratio) as an alkali activator liquid (AL). The condition of FA/AL was optimized for achieving 1.00, 1.25, 1.5, and 1.75 ratios by varying the alkali concentrations, which are referred to as GP1, GP2, GP3, and GP4, respectively. The influence of slight variations in the FA/AL ratio on microstructure, morphology, functional groups, and composition was investigated by X-ray diffraction (XRD), field emission scanning electron microscopy (FESEM), X-ray fluorescence (XRF), and Fourier transform infrared spectroscopy (FTIR). FESEM detected a homogeneous fused matrix of fly ash and alkali activator solution up to 1.5 ratios; GP3 showed a dense morphology. FTIR confirmed that the formation of aluminosilicate gel induced a shift in the T–O (T = Si or Al) asymmetric stretching band, nearing a lower frequency. XRD showed an amorphous structure with phases, including quartz, mullite, hematite, and sodalite. The thermogravimetry and differential thermal analysis (TGA–DTA) indicated that the geopolymer samples were thermally stable. The electrical study concluded that the geopolymer possessed insulating properties.
1. Introduction
Geopolymer is an environmentally friendly material and has recently been applied in various industrial sectors, due to its versatile properties like thermal stability, electric resistance, high strength, fire resistance, corrosion resistance, high mechanical strength, and excellent durability [1]. It can be a feasible alternative to inorganic cement and organic polymers in multiple applications, namely high-tech ceramics, aircraft, fire-proof building materials, thermal insulating foams, protective coatings, hybrid inorganic–organic composites, and refractory adhesives [2]. It contains long chains and networks of inorganic molecules made up of tetrahedral silica (SiO2) and alumina (AlO4) that undergo polycondensation to form a three-dimensional system linked together through shared oxygen atoms by covalent bonds (e.g.,: (—Si—O—Al—O—)n, (—Si—O—Al—O—Si—O—)n, and (—Si—O—Al—O—Si—O—Si—O—)n). The overall formula for the structure of geopolymer can be represented as Mn[—(SiO2)q—AlO2—]n, where M represents an alkali cation, n represents the degree of polycondensation, and q is the silicon-to-aluminum ratio [3]. The predominance of an amorphous structure is attributed to the chaotic spatial arrangement among the sialates [4]. Geopolymers are synthesized by the polymerization of aluminosilicate with an alkaline activator solution, at room or elevated temperature conditions. The aluminosilicates are the key component for geopolymerization, and the sources rich in alumina or silica can be utilized as raw materials. These raw materials occur both in naturally occurring materials and industrial wastes. When scanning through the literature, rice husk [5], metakaolin [6], bentonite [7], fly ash, blast furnace slag red mud [8], etc., are the most commonly used raw materials for geopolymer synthesis. Fly ash has gained the most attention because of its chemical and mineralogical compatibility, finely ground particles, ease of use, and global availability [9,10,11,12]. Fly ash is the fine residue from coal combustion in thermal power plants, containing about 60% silica and 30% alumina. The total fly ash production is 2.8 billion metric tons per year worldwide, yet only about 53% is utilized, mainly in the construction sector to make bricks, ceramic tiles, plaster Portland cement, etc. In addition, it is also used as a filler in paints, adhesives, and metal and plastic composites. The second important ingredient responsible for geopolymerization is alkali activator solution, which is a combination of sodium silicate, sodium hydroxide, and water. The alkali concentration significantly impacts the resulting geopolymer’s reactivity, properties, and structure. A strong alkaline solution is required to facilitate the hydrolysis of the aluminosilicate glassy particles present in fly ash [13,14,15]. It is widely accepted that, in alkaline dissolution processes, the dissolution rates of aluminosilicate phases increase with increasing surface hydroxylation [16]. At lower concentrations of alkali, the insufficient dissolution of fly ash leads to an incomplete reaction. In contrast, at high concentrations, an excess amount of hydroxide ions (OH−) hinder the polycondensation process due to the quick precipitation of dissolved species at the preliminary stage of the reaction [17]. Sodium hydroxide is extensively used for geopolymerization due to its ease of availability and better compressive strength. Sodium silicate promotes polymerization by driving the transformation of mono-silicate chains and cyclic trimers into larger ring polymers in the aqueous phase, forming a three-dimensional network [16,18]. Several other chemical parameters affect geopolymerization, including the concentration and type of alkalis, alkali activator to raw material ratio, water to geopolymer solids ratio, SiO2 to Al2O3 ratio, H2O to Na2O molar ratio, and the Na2O to SiO2 ratio, respectively [19]. Most studies have reported the influence of chemical parameters on the mechanical properties of geopolymers. These parameters, including alkaline concentration (6–14 M), curing time (1–28 days), curing temperature (27–70 °C), and NaOH: Na2SiO3 dosages (0:100, 25:75, 50:50, 75:25, 100:0 were varied; however, the fly ash to alkali activator ratio was fixed at 2.0 [20,21], 3.22 [22], and 3.33 [23]. The properties of geopolymer depend mainly on the microstructure and varying chemical compositions. Very few studies have reported exclusively on the microstructure. Mishra et al. reviewed the microstructure properties of fly ash-based geopolymers. The XRD, SEM, and FTIR results were explored to understand the structure, morphology, and functional groups of geopolymer binder, synthesized using different chemical compositions. The microstructure was mainly affected by the alkali activator, alkali type, concentration, and fly ash/alkali solution ratio. Activators, such as NaOH, Na2SiO3, and combinations of NaOH and Na2SiO3, are commonly used for activating fly ash. Sasui et al. synthesized and investigated geopolymer with NaOH and a combination of NaOH + Na2SiO3, with an alkali-to-solid ratio of 0.4:1 [24]. The geopolymer activated with a combination of NaOH and Na2SiO3 exhibited a higher compressive strength and denser microstructure than the geopolymer activated with only NaOH. Lv et al. used only sodium silicate as an activator, in different dosages ranging between 5, 10, 15, and 20%, with fly ash/activator ratios of 1.5, 2.1, 2.7, and 3.3, respectively, and investigated the compressive strength [25]. From the above discussions, it can be seen that several parameters influencing the microstructure and properties of geopolymer have been varied and widely investigated; however, one of the important chemical parameters, the fly ash to alkali activator ratio, has mostly been kept constant. It has not been explored at different ratios to investigate their influence on the microstructure and properties of geopolymer.
From the literature review, it can be seen that the majority of the studies have primarily addressed the characterization of source materials and the examination of mechanical properties. The compressive strength of geopolymer is vastly reported on, since it is considered as an alternative for cement. In addition, geopolymer, as a ceramic material with high electrical and thermal resistance, is an excellent ceramic electrical insulator [26,27,28,29]. However, limited attention has been given to exploring the electrical properties of geopolymer binders in the context of dielectric materials. It is imperative to note that ceramic materials employed in electrical applications must also exhibit thermal stability. Therefore, concurrently examining thermal stability and electrical properties is pivotal.
The reported literature on the electrical properties of geopolymer have discussed different parameters, based on the interest of the authors. Hanjitsuwan et al. (2014) explored the impact of NaOH concentration on the physical and electrical properties of high-calcium fly ash geopolymer pastes, synthesized at five NaOH concentrations (8, 10, 12, 15, 18 mol) while maintaining a 0.4 liquid to ash ratio, a 0.67 sodium silicate to sodium hydroxide ratio, and a low temperature of 40 °C [29]. Douiri et al. focused on enhancing the dielectric performance of metakaolin-based phosphoric acid geopolymers, using phosphoric acid solution (85 mass%), a molar ratio of Si/P equal to 1.75, and curing times that were fixed at 7 and 28 days [30]. Cai et al. (2020) explored the electrical resistivity behavior of fly ash-based geopolymers, using a mixture of Na2SiO3 and KOH (4 M, 8 M, and 12 M) as alkaline activator. The ratio of Na2SiO3 to KOH was 1.5 by weight, the F.A/A.L ratio was 3.0, and curing was carried out at room temperature (for 24 h) [31]. The ratio of fly ash/alkaline activator plays a crucial role in the geopolymerization process.
The objective of the present study is to optimize the FA/AL ratio to give better thermal stability and electrical resistivity. Fly ash-based geopolymer samples were synthesized from fly ash, sodium hydroxide solution, and Na2SiO3 solution. The ratio of fly ash to alkaline activator varied from 1.0, to 1.25, 1.50, and 1.75. The synthesized geopolymer was studied for its structural and morphological characteristics and functional groups using several techniques, namely FTIR, FESEM, and XRD. The chemical composition of the fly ash and geopolymer samples were studied through XRF. The thermal properties were investigated by TGA-DTA. The electrical properties were investigated by an Impedance analyzer.
2. Experiments and Procedures
2.1. Materials
Dry fly ash, Class F, with a low calcium content, was acquired from the National Thermal Power Corporation Limited (NTPC), Dadri, Uttar Pradesh, India. The results of the XRF analysis of the oxide components present in fly ash are shown in Table 1. Analytical grade NaOH, of 99% purity, and sodium silicate (Na2SiO3) solution, with compositions of 70.5–72.5% for SiO2 and of 27.5–29.5% for Na2O, were employed throughout the experiment as activator solutions for the activation of the fly ash.

Table 1.
Analysis of Class F fly ash elemental composition (weight percentage) using XRF.
2.2. Preparation of Geopolymers
A 12 M strength sodium hydroxide solution was prepared by dissolving pellets of sodium hydroxide in distilled water. A solution of Na2SiO3 and NaOH was made at least 24 h before use, to ensure proper mixing and a homogeneous mixture, and was stored at room temperature for further processing. The ratio of Na2SiO3 to NaOH was set at 2.5 for the activator solution. The amounts of fly ash and alkaline liquid varied during mixing, to maintain 1.0, 1.25, 1.5, and 1.75 ratios, and the required amount of water was added for workability. The mixture proportions of the geopolymer samples are given in Table 2. The mixture was then poured into 50 mm molds, following ASTM C109 standards, and covered with cling film to prevent moisture evaporation. The synthesized geopolymer samples are GP1, GP2, GP3, and GP4.
Table 2.
Mixture details of geopolymer samples for various ratios of FA/AL.
2.3. Characterization
The chemical compositions of the fly ash and the geopolymer were determined by X-ray fluorescence (Rigaku ZSX Primus) with elemental coverage from 4Be to 92U, with core attributes including a 3/4 kW sealed X-ray tube and 48-position autosampler in a vacuum. The X-ray diffraction was performed with a Rigaku-Ultima IV diffractometer using Cu Kα radiation (=0.154 nm), equipped with a variable slit opening (maxim Retained. um width 20 mm) to acquire and analyze the mineralogical characteristics of the fly ash and geopolymer. The sample was spun at a maximum speed of 120 rpm for the diffraction analyses between the 2-theta values of 5° and 70°. The morphology and microstructures of the geopolymer and fly ash were obtained by field emission scanning electron microscopy, using the TESCAN MAGNA GMH instrument, fitted with an energy-dispersive X-ray spectrometer, and geopolymer samples were coated with gold via a sputter coater machine. The FTIR spectra of the geopolymer and fly ash were acquired in attenuated total reflectance mode (ATR) using the NICOLET iS50 FTIR Spectrophotometer over 4000–400 cm−1 at a resolution of 4 cm−1. The thermal analysis of approximately 25 mg of powder, heated from room temperature to 800 °C at a rate of 15 °C/min, was performed using thermogravimetry; differential thermal analysis was carried out using the TGA-DTA instrument (STA 6000 (Perkin Elmer, Waltham, MA, USA) model). Analyses of the electrical properties, such as conductivity, the dissipation factor (D factor), and permittivity (dielectric constant) were carried out as a function of frequency (100 Hz–10 MHz), using the Wayne Kerr 6540A Impedance analyzer at an oscillation voltage of 1 V.
3. Results
3.1. Microstructure Analysis Using Scanning Electron Microscopy
The SEM images give information about the morphologies of fly ash and geopolymer (Figure 1 and Figure 2), respectively. From Figure 1, it can be seen that the fly ash particles are spherical in shape and differ in size. The particle size ranges from 1 μm to 5 μm. The fly ash is obtained from mineral coal combustion in silicon or an aluminum–silicon matrix, indicated by the smooth appearance of the fly ash spheres [32].
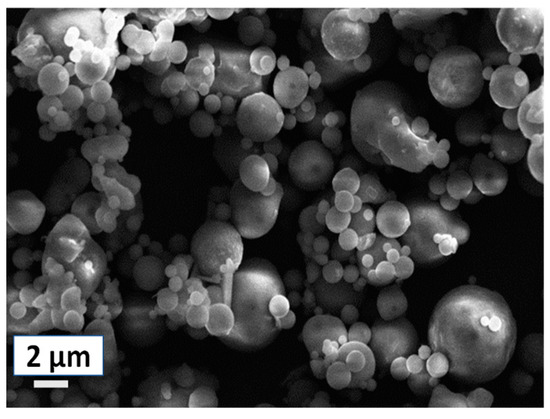
Figure 1.
Surface morphology of fly ash.
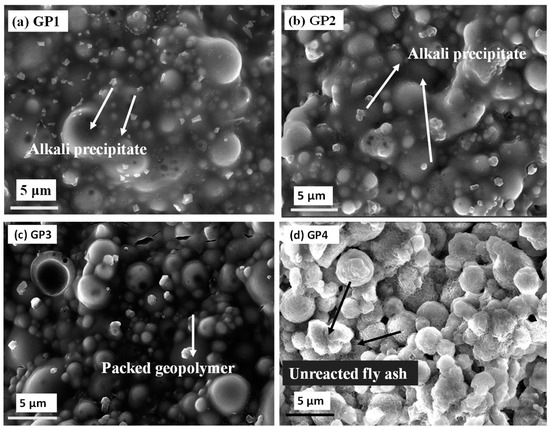
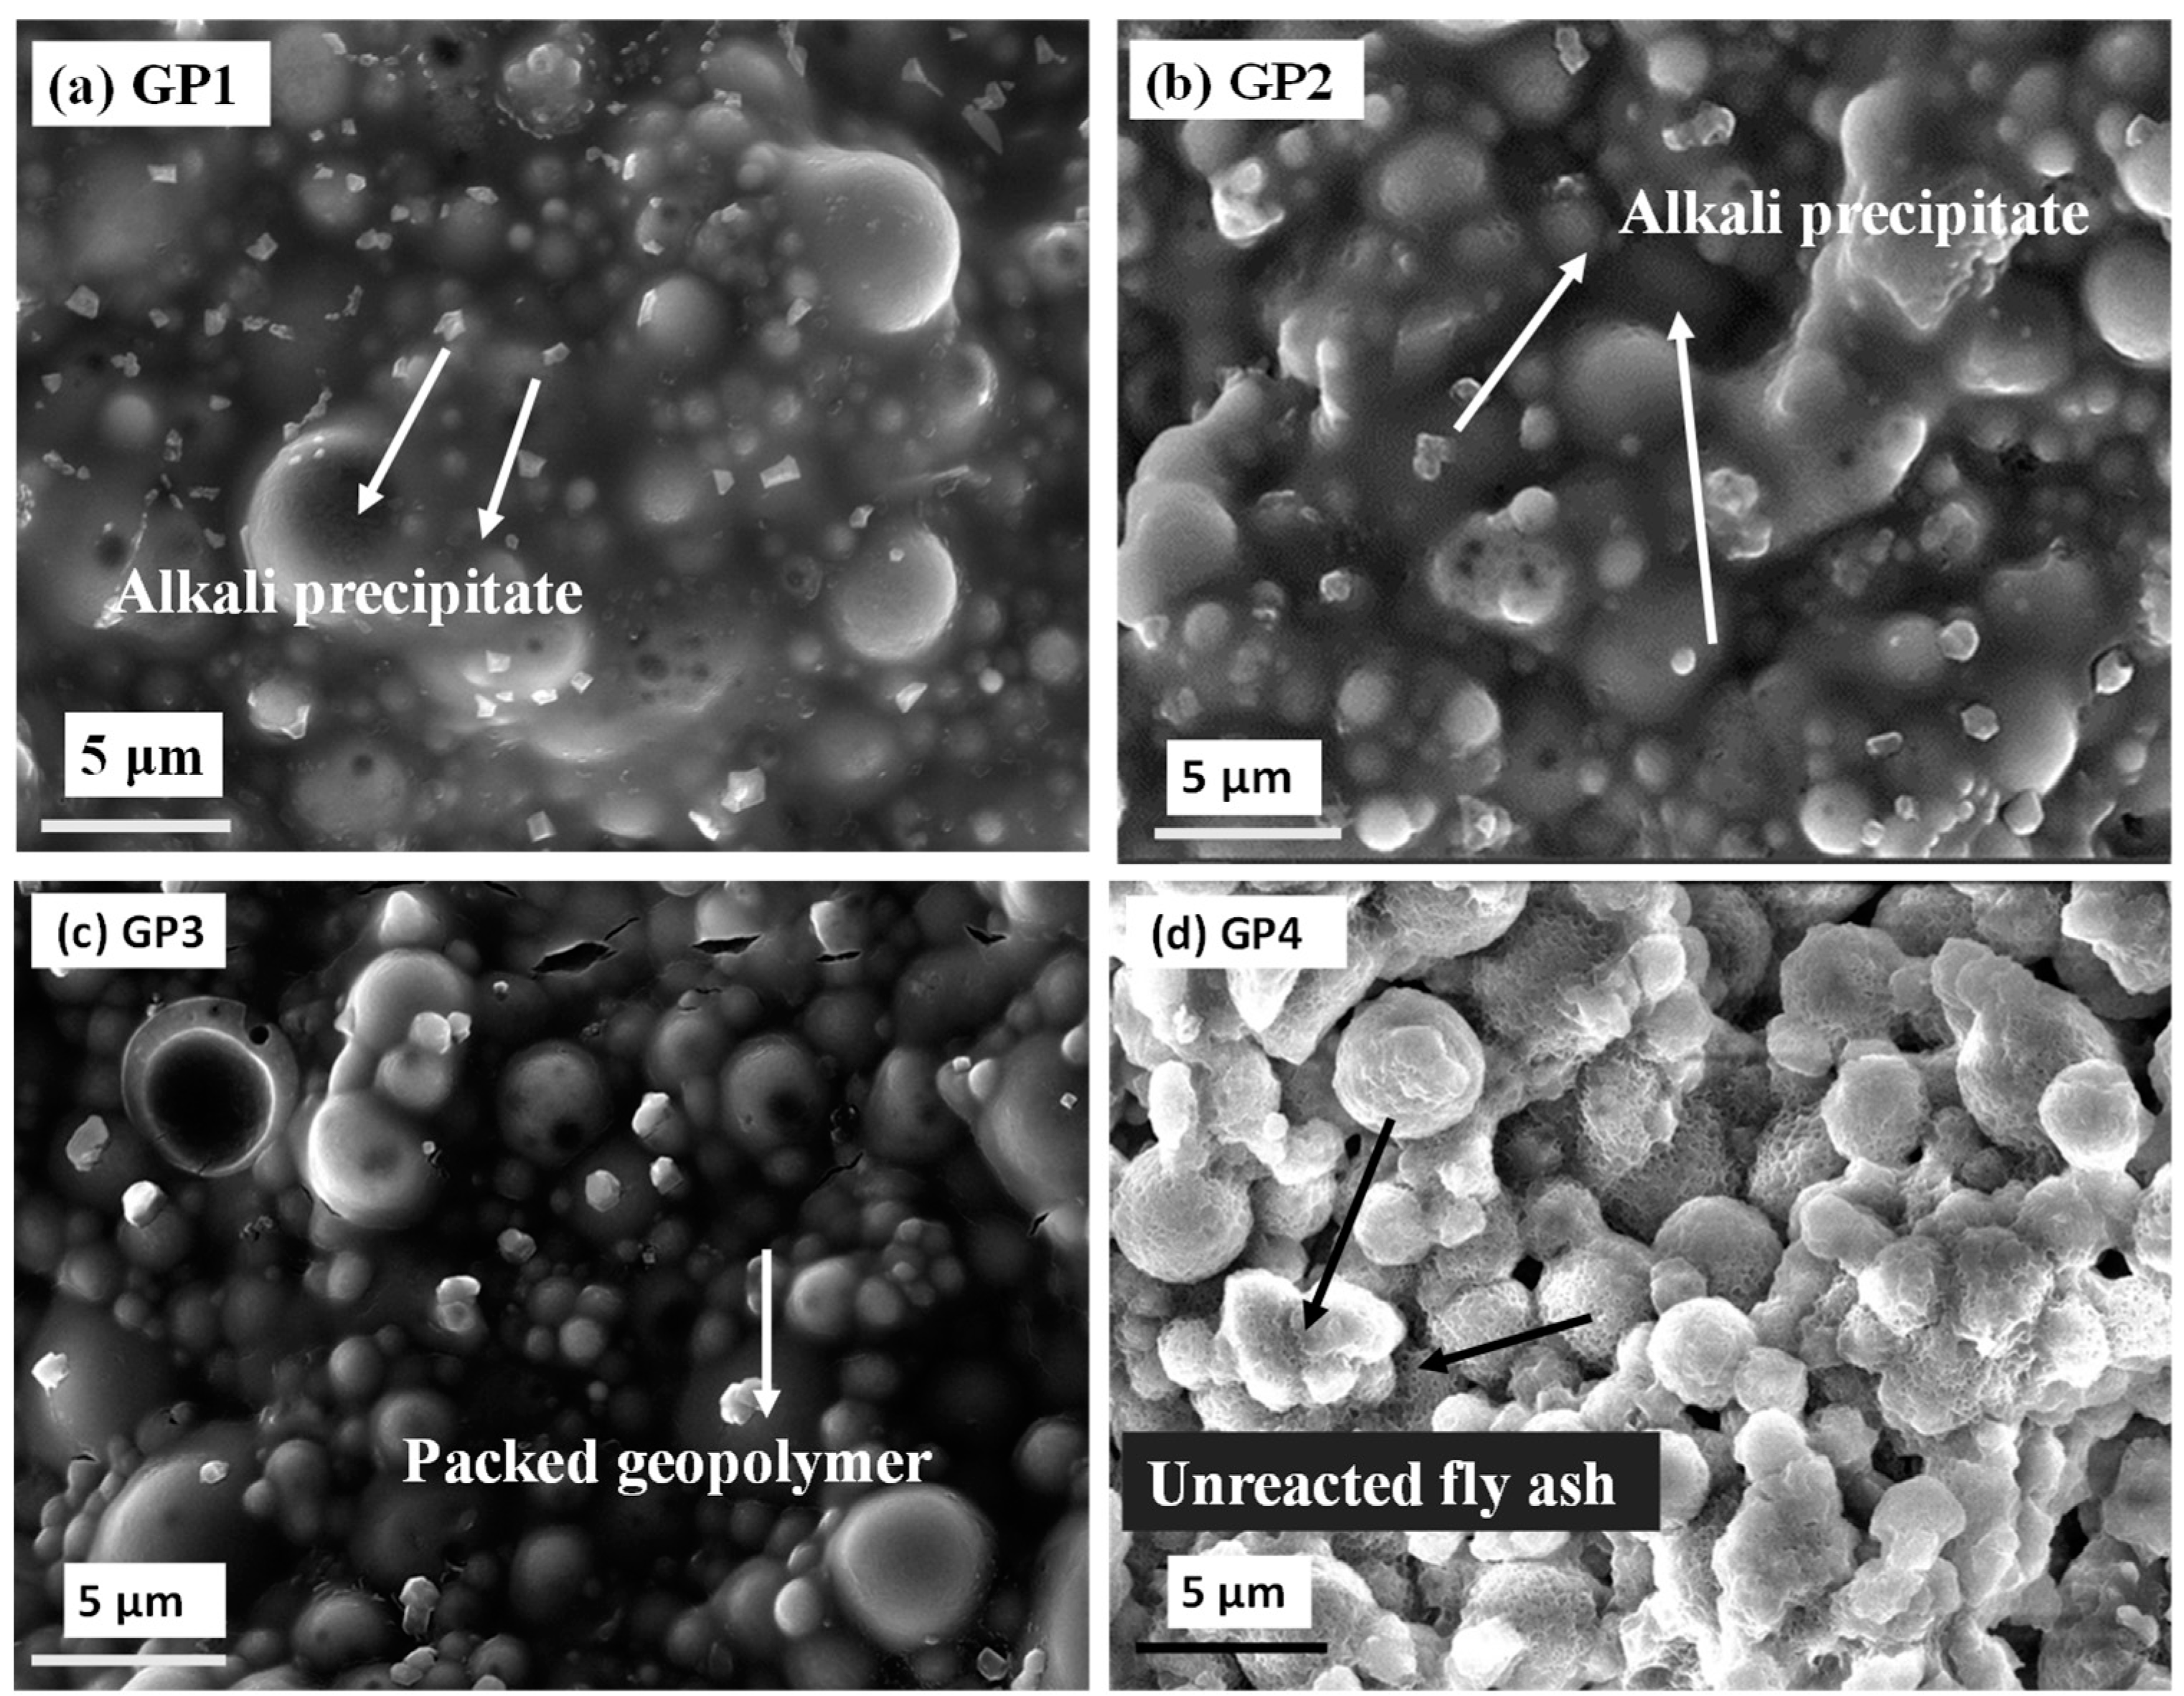
Figure 2.
SEM images of geopolymer prepared at different ratios of FA/AL: (a) 1.00 (GP1), (b) 1.25 (GP2), (c) 1.50 (GP3), and (d) 1.75 (GP4), respectively.
The SEM micrographs of fly ash-based geopolymer samples are given in Figure 2a–d. The figure demonstrates that most particles undergo complete reaction and dissolution, owing to the concentrated alkali activation of aluminosilicate matter. Both aluminium and silicon are released from the fly ash into the solution, forming a uniform and dense geopolymeric matrix. Although most of the particles dissolve, a small number of non-reacted particles of fly ash are visible on the surface of the geopolymer. Such particles lack full coverage by the gel and are accompanied by spherical gel units formed on the powder’s surface. Figure 2a–c shows that samples GP1, GP2, and GP3 are dense with spherical fly ash particles fused with an alkali activator solution, compared to GP4 (Figure 2d). However, GP1 and GP2 (Figure 2a,b) show the undissolved crystal-like particles distributed over the surface. This is due to the excess alkali activator that remains unreacted in the geopolymer samples prepared with a FA/AL ratios of 1.0 and 1.25, respectively. However, GP3 has a dense morphology with very few alkali residues over the surface, indicating the insufficient amount of alkaline solution that led to complete geopolymerization. Further, with an increase in the FA/AL ratio to 1.75, the spherical fly ash morphology is prominent with no crystals of alkaline solution. This is due to the unavailability of a sufficient volume of alkaline solution, which is below the optimum level. This leads to the incomplete polymerization of fly ash, which impedes the formation of aluminosilicate geopolymer gel. Unreacted particles of fly ash are visible in the geopolymer samples, due to low alkali activator content (Figure 2d); Rozek et al. observed similar results with a low NaOH content [33]. From the above observation, it can be seen that GP3 exhibits a dense morphology with a homogeneous gel formation, compared to other samples, indicating that a FA/AL ratio of 1.50 is suitable for complete geopolymerization.
3.2. Elemental Composition of Oxides by X-ray Fluorescence
The results of the XRF analysis carried out on fly ash and geopolymer are shown in Table 3. It can be observed from the table that, for fly ash, the SiO2 content is major (40.5%), followed by Al2O3 (31.1%) and Fe2O3 (17.8%). The sum of SiO2 + Al2O3 + Fe2O3 is about 85%. The content of CaO was around 1.06%. As per ASTM C618, the sum of SiO2 + Al2O3 + Fe2O3 being >70% and the low CaO content confirms it is class F fly ash. Oxides such as SO3, TiO2, and K2O are present in small amounts in fly ash, ranging from 1.2% to 4.0%. Oxides of Na, Ti, Mg, and P are also present in trace amounts in fly ash. In geopolymer GP1, GP2, GP3, and GP4 samples, silica content is higher than fly ash content, due to the addition of sodium silicate. The silica content varies from 49.1 to 57.0%, with the maximum observed for the GP3 sample. Further, an increase in the FA/AL ratio shows a decline in silica content, due to the smaller addition of sodium silicate during the synthesis process. The alumina content of geopolymer samples decreases from 20.2 to 16.3 with an increase in FA/AL ratio up to 1.25. Further, the alumina content increases up to 30.2% for a 1.75 ratio, which is closest to that of fly ash alumina content. This reveals that fly ash is more predominant in the FA/AL ratio of 1.75 because of an incomplete polymerization due to insufficient alkaline solution. This observation is in agreement with the SEM results (Figure 2d), where unreacted particles of fly ash are visible on the surface of the geopolymer. In general, Fe2O3 exists alongside SiO2 and Al2O3 in fly ash. From Table 3, it can be observed that Fe2O3 varies from 3.4 to 4.3%, and Na2O content varies from 26.7 to 6.9% for geopolymer, due to the introduction of sodium silicate and sodium hydroxide for the activation of fly ash. However, the sodium oxide concentration is higher in GP1 and GP2, indicating an excess of alkali activator, which agrees with the SEM results (Figure 2a,b). For GP4, its lowest sodium oxide content (6.9%) was due to the addition of a lower amount of alkali content. Oxides such as K2O and TiO2 are present at around 1.2–2.1 wt.% and do not cause significant changes in the geopolymer samples. As observed in fly ash, Mn, Mg, P, and S oxides are present in trace amounts in the geopolymer samples. The CaO varied from 0.86 to 099, which could be due to the class F fly ash raw material. The XRF analysis indicates that the geopolymer prepared at the FA/AL ratio of 1.50 shows what are considered to be optimum concentrations of alumina (23.0%), silica (57.01%), Fe2O3 (3.50%), and Na2O (11.3%) for the formation of a dense and homogeneous microstructure, in which fly ash and alkali undergo complete polymerization.
Table 3.
Elemental composition of oxides in fly ash and geopolymer prepared at different ratios: (a) 1.00 (GP1), (b) 1.25 (GP2), (c) 1.50 (GP3), and (d) 1.75 (GP4).
3.3. X-ray Diffraction Analysis
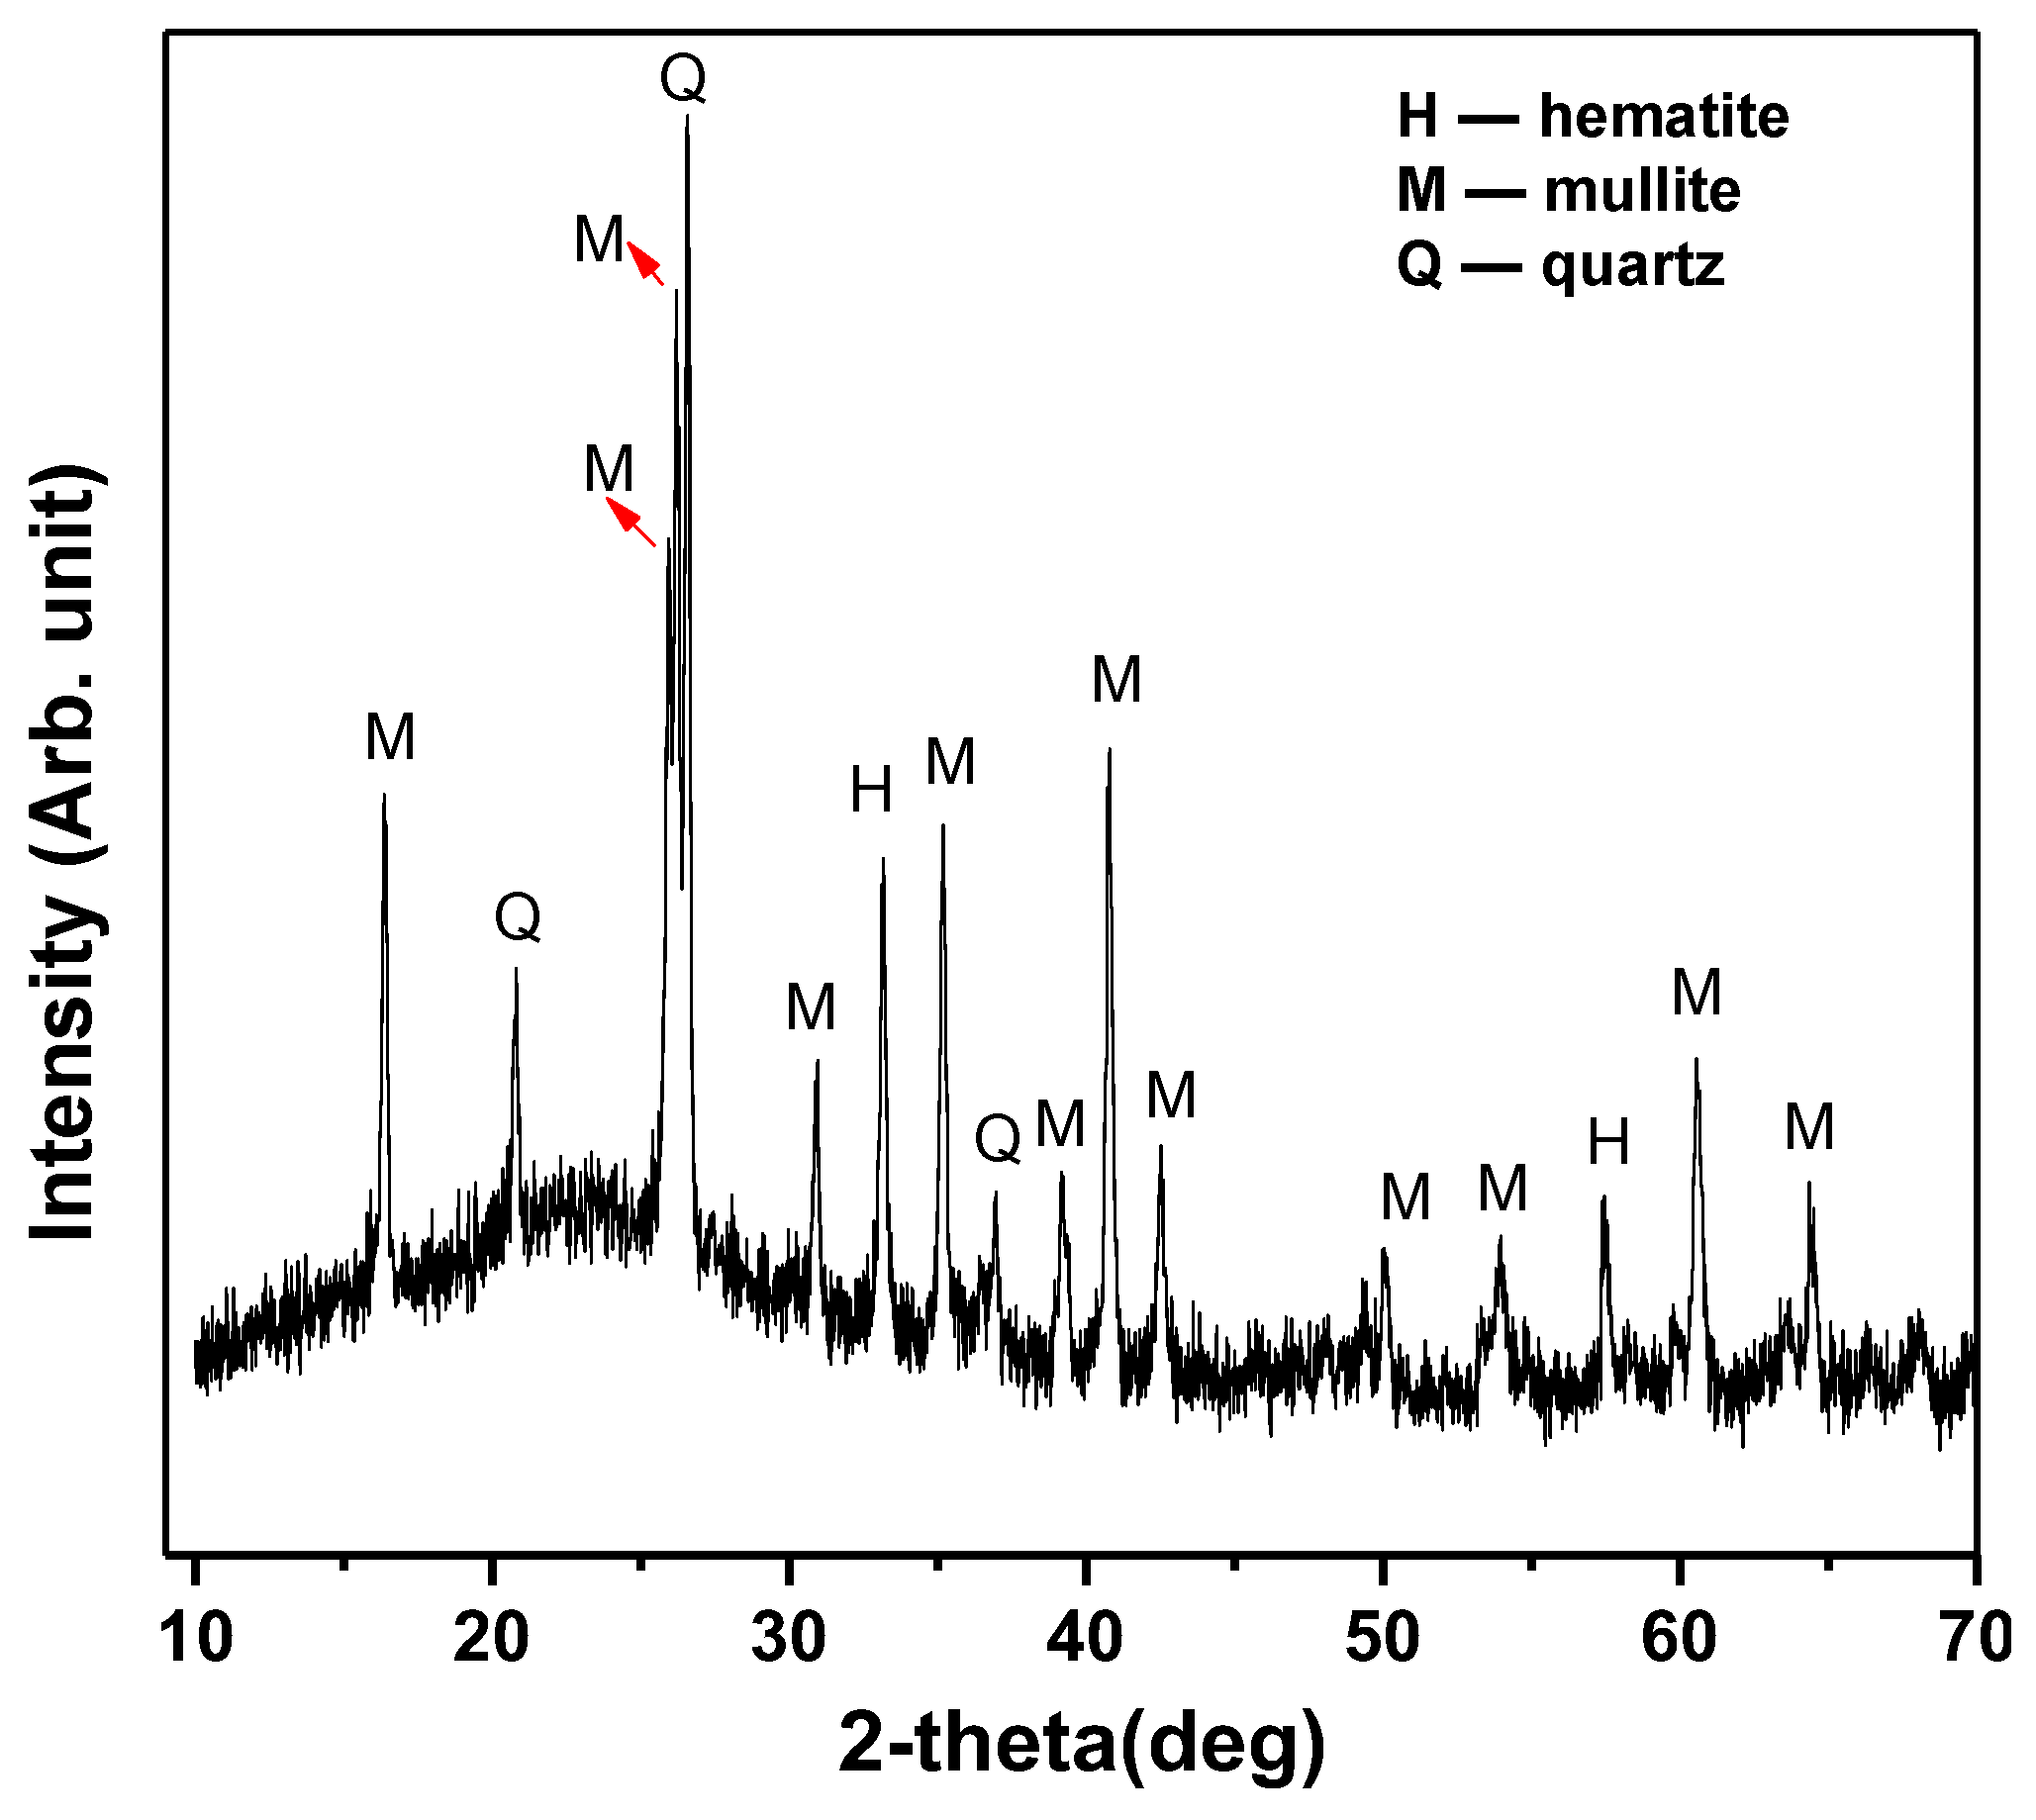
The XRD patterns of fly ash and geopolymer are shown in Figure 3 and Figure 4, respectively. Figure 3 shows dominance in the amorphous phases. The XRD plot for the fly ash sample demonstrates that the main crystalline phases are quartz (JCPDS# 01-074-1811) and mullite (JCPDS# 01-074-4143). The predominant presence of aluminosilicate’s glassy phase (mullite, Al4.44Si1.56O9.78) in fly ash can be attributed mainly to the rapid cooling process employed at elevated temperatures. Besides these crystal phases, the XRD pattern of fly ash shows the presence of other crystalline phases, such as hematite (Fe2O3). The pattern was matched with JCPDS #01-071-5088. A broad hump is observed in the 2-theta range of 10–40°, illustrating the amorphous phases in the ash that contribute more than 50% of the total mass. M, Q, and H represent the crystalline phases of mullite, quartz, and hematite. From the JCPDS data of quartz (JCPDS# 01-074-1811), mullite (JCPDS# 01-074-4143), and JCPDS #01-071-5088, respectively, the major hkl planes (Miller indices) in fly ash with high intensities that are present in quartz (silicon dioxide, SiO2) are 20.84° (100) and 26.63° (011). The major hkl planes with high intensities present in mullite (3Al2O3 2SiO2) are 16.44° (110), 25.98° (120), 26.29° (210), 35.27° (111), 40.86° (121), and 60.56° (340). The major hkl planes with high intensities present in hematite (iron oxide Fe2O3) are 33.20° (104) and 57.41° (122).

Figure 3.
XRD spectra of fly ash.
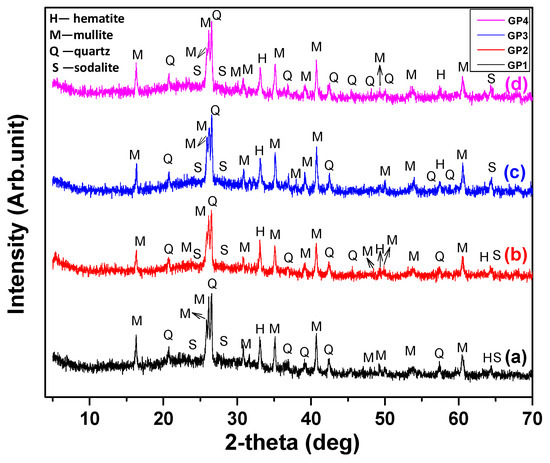
Figure 4.
XRD spectra of geopolymer samples prepared at different ratios of FA/AL: (a) 1.00 (GP1), (b) 1.25 (GP2), (c) 1.50 (GP3), and (d) 1.75 (GP4), respectively.
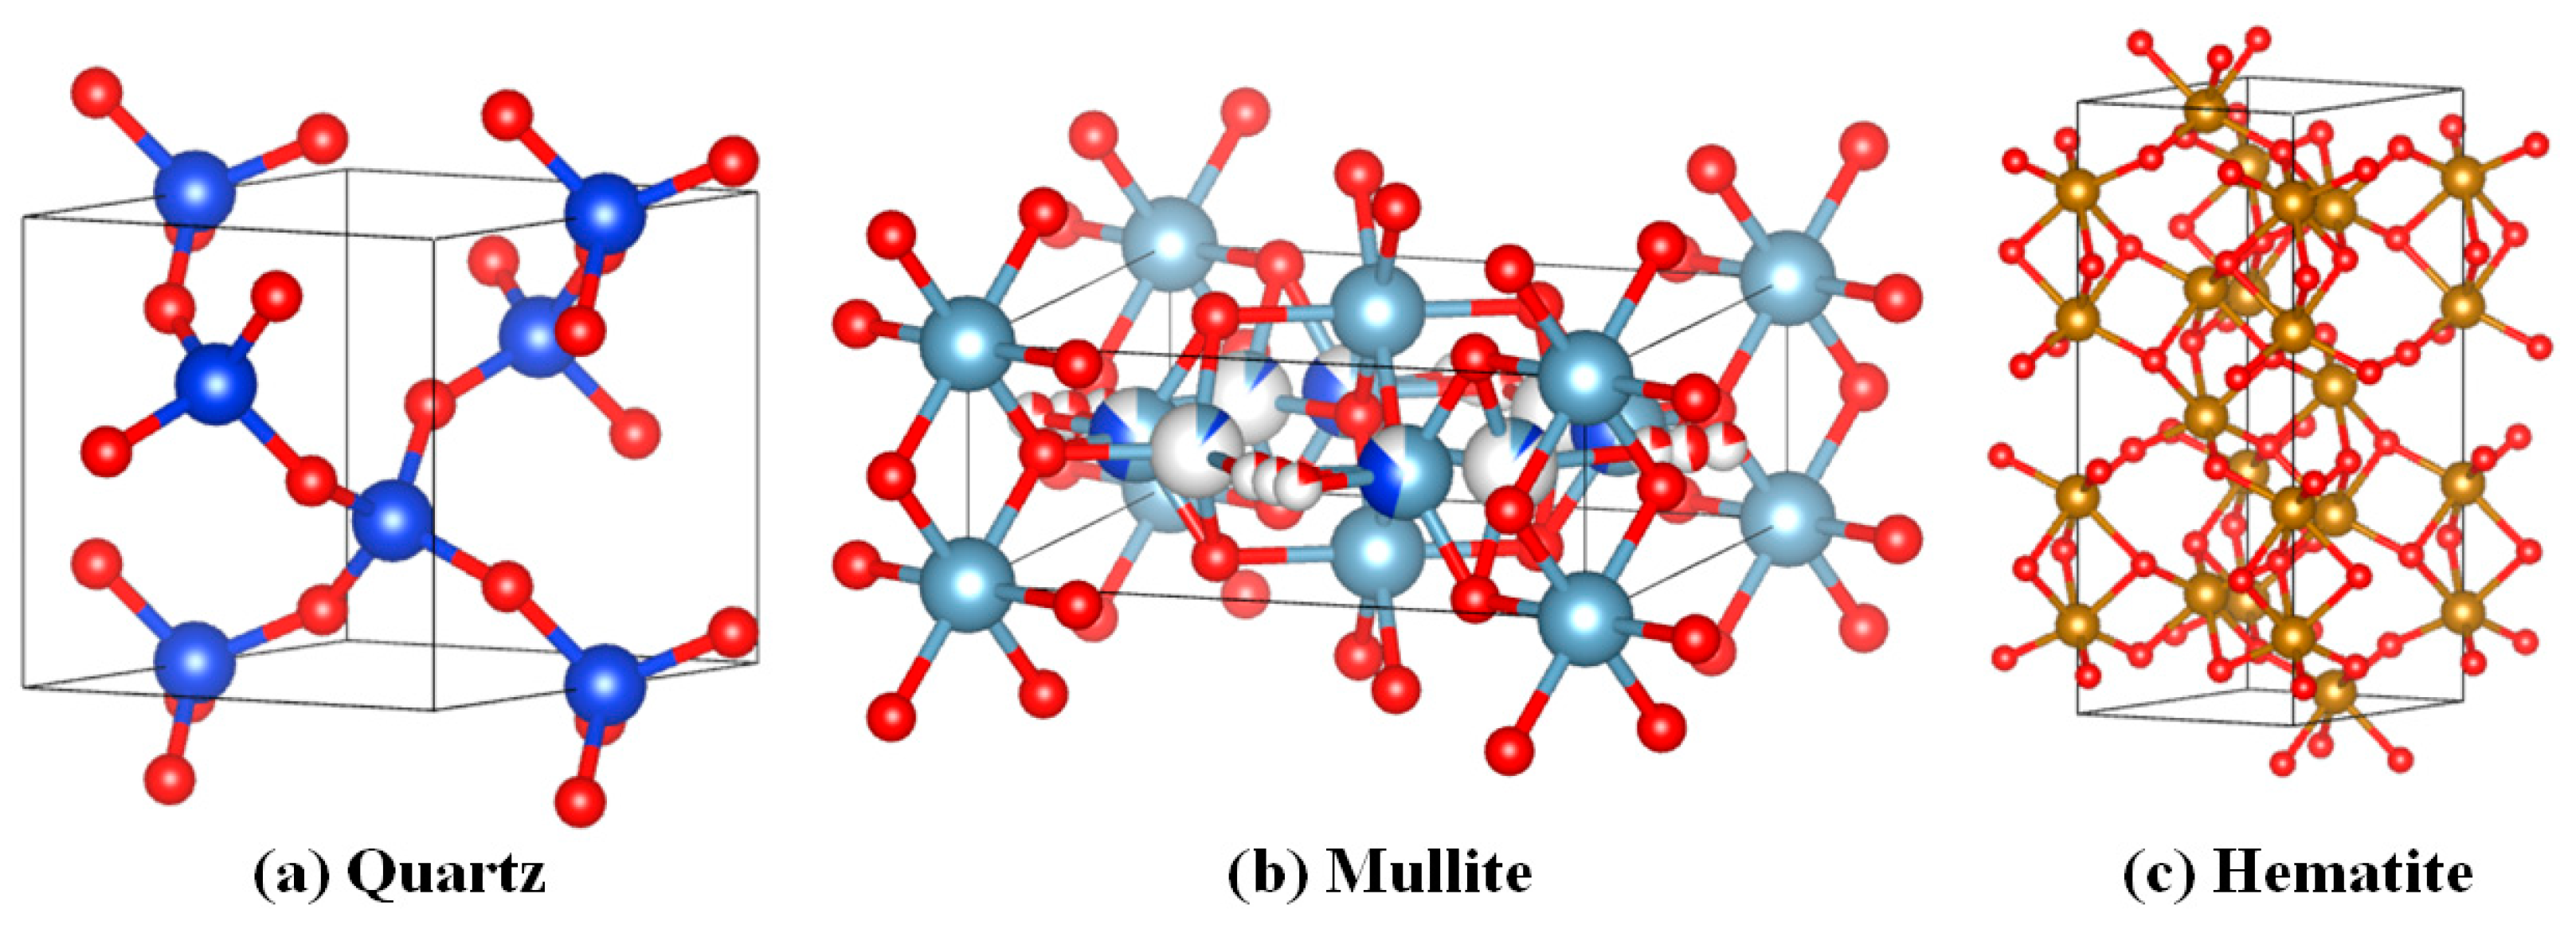
From Figure 4, the XRD results of geopolymer samples prepared at different FA/AL ratios show that an amorphous character prevails, and crystalline peaks in diffraction patterns are retained, due to the raw material fly ash. There are distinct differences in the XRD patterns of geopolymer samples and fly ash. Geopolymer is amorphous, due to glassy materials, indicated by the hump in the diffraction pattern. The crystalline phases of mullite, hematite, sodalite (JCPDS# 04-014-6611), and quartz are detected in the geopolymer samples, as labelled in Figure 4. However, only the sodalite phase is a product of geopolymerization; quartz and mullite are derived from the unreacted fly ash particles. The diffraction patterns of class F fly ash change the geopolymer formation upon activation by the alkaline activator. This can be confirmed by the reduced intensity of the geopolymer diffractogram, compared to that of the source material, as observed in Figure 3 and Figure 4. The planes (hkl) and 2-theta values of the quartz, mullite, hematite, and sodalite phases of geopolymers prepared at different ratios are given in Table 4. The standard orientations of the crystal shapes of the major phases present in the fly ash and geopolymer (quartz, mullite, and hematite) are shown in Figure 5.
Table 4.
Planes (hkl) and 2-theta values of quartz, mullite, and hematite phases of geopolymers prepared at different ratios.

Figure 5.
Structures of (a) quartz, (b) mullite, and (c) hematite (VESTA-Visualization for electronic and structural analysis).
3.4. FTIR Analysis
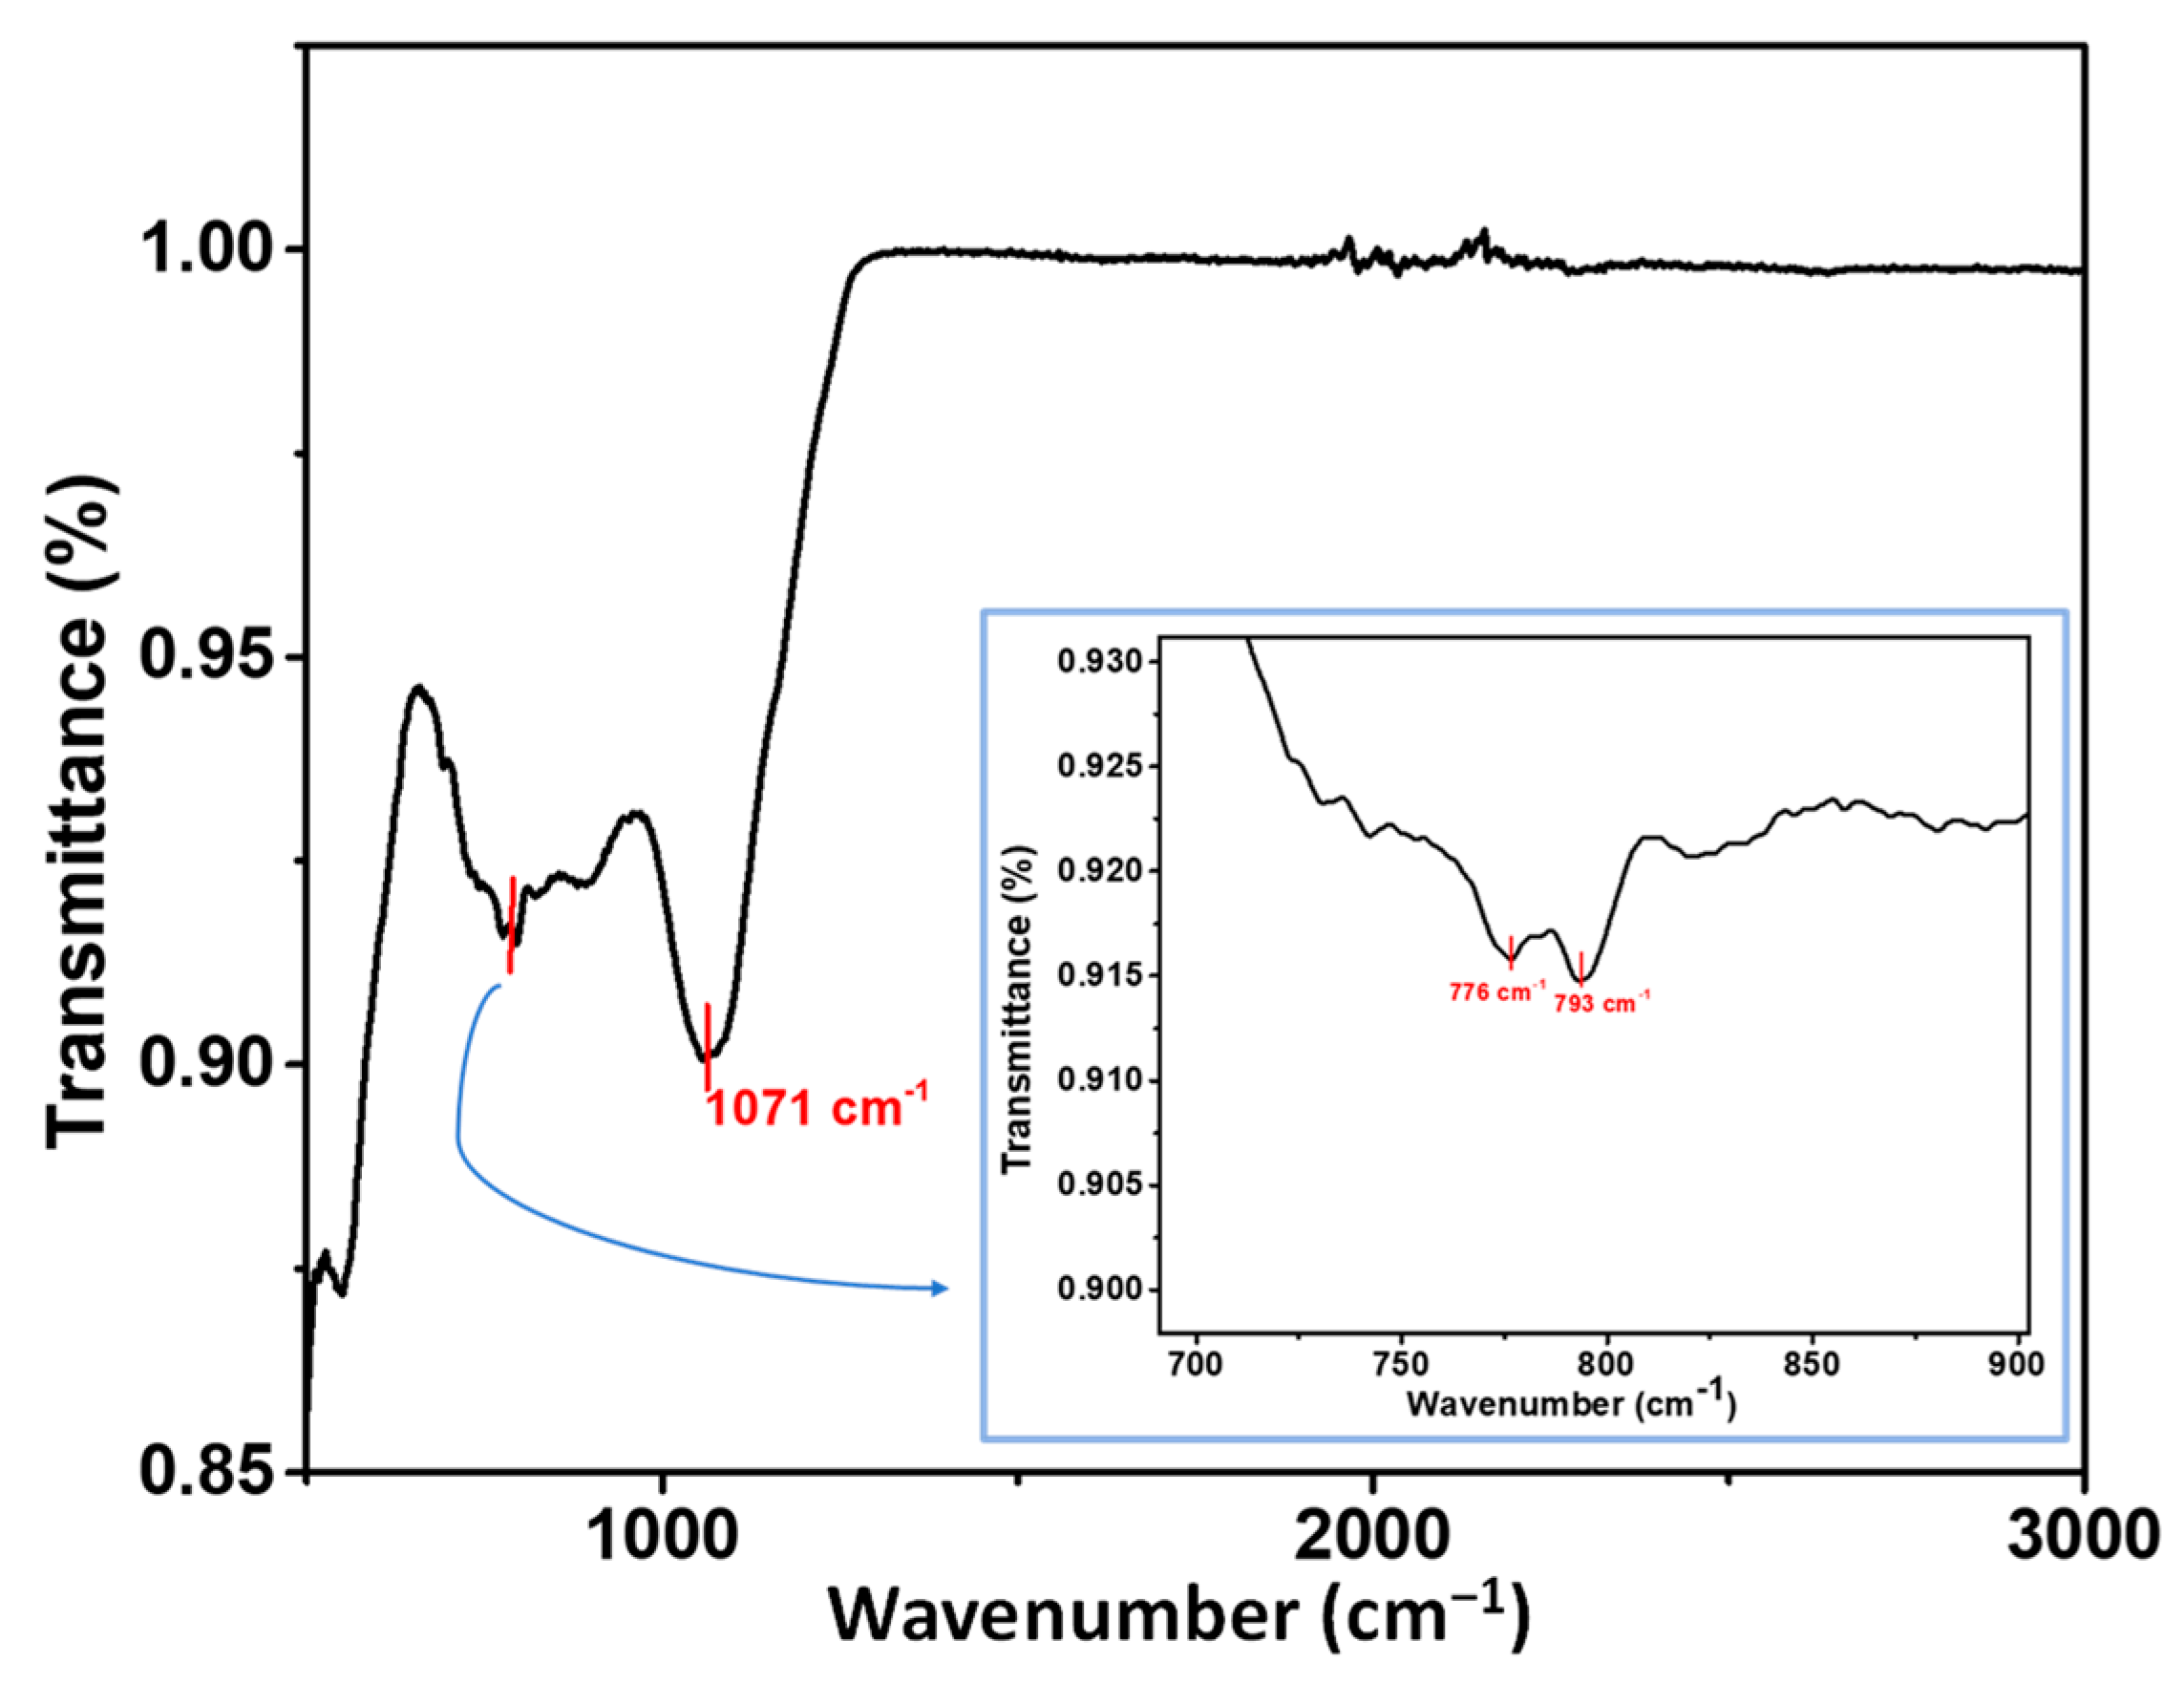
The FTIR spectra of fly ash are given in Figure 6. The major band at 1071 cm−1 is due to the asymmetric stretching vibration modes of the T-O (T = Si, Al) (O = oxygen) bonds in fly ash. The doublet bands seen at 700–800 cm−1 are linked to the symmetric stretching vibrations of T-O (T = Si, Al)(O = oxygen), which correspond to quartz in the starting material fly ash.
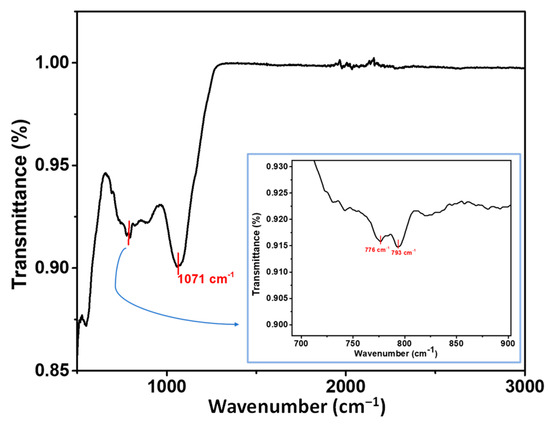
Figure 6.
FTIR spectra of fly ash.
Figure 7 depicts the FTIR spectra acquired for the geopolymer samples GP1, GP2, GP3, and GP4. The FTIR data for the geopolymer samples GP1, GP2, GP3, and GP4 demonstrate a discrete zone between 400 and 1500 cm−1. The absorption bands in the FTIR spectra, around 600–900 cm−1, correspond to the symmetric stretching vibrations of the Si-O-T band (T = Al or Si) (O = oxygen). Bands in the 900–1300 cm−1 range indicate the existence of aluminosilicates, specifically NASH (N is Na2O, A is Al2O3, S is SiO2, and H is H2O) amorphous gel, which correlate to asymmetric stretching vibrations. From Figure 6, it may also be followed that fly ash shows a discrete intensity band at 1071 cm−1 and around 790 cm−1. Fly ash powder is activated by an alkali activator, which causes the distinct intensity band at 1071 cm−1 to move close to a reduced wavelength. The peak for Si-O-T in fly ash at 1071 cm−1 vanishes, and a new peak emerges due to polymerization. This shift implies that a chemical change results in the formation of aluminosilicate products. Catherine et al. used in situFTIR for the study of the initial stages of geopolymer. The absorption peak (Si-O-T) for fly ash at 1050 cm−1 was found to convert into a new peak at 960 cm−1, due to the formation of the Si-O-Al bond [34]. One minor band is visible around 2100 cm−1, because of the HCO3− ion infrared band position. The band around 1660 cm−1 can be assigned to the water molecules entrapped inside the aluminosilicate framework. The absorption bands at 1400 cm−1 are assigned to the stretching vibrations of C-O and indicate the existence of carbonate groups, such as Na2CO3. Sodium carbonate is created when atmospheric CO2 reacts with the dehydrated sodium inside a geopolymer. This band was more prominent in GP1 and GP2, which indicates that unreacted alkali caused more carbonation. This can also be related to the amount of sodium oxide (Na2O) contributed by excess alkali in GP1 and GP2 (Table 3). Therefore, GP3 and GP4 have undergone the least carbonation. However, the shift towards a lower wavelength compared to fly ash is higher for GP3, resulting in a distinct intensity peak (1040 cm−1). Therefore, considering all factors, GP3 is the most suitable geopolymer sample.
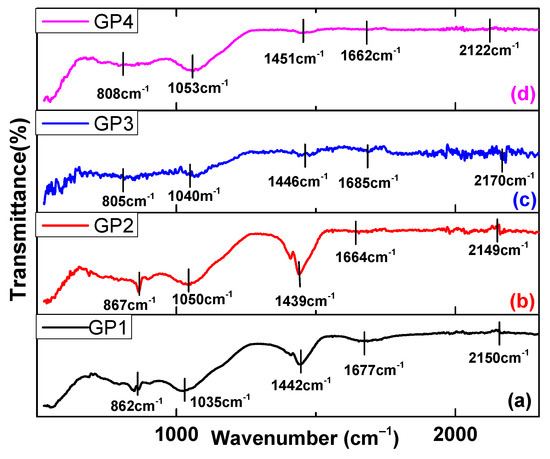
Figure 7.
FTIR spectra of geopolymers prepared at different ratios of FA/AL: (a) 1.00 (GP1), (b) 1.25 (GP2), (c) 1.50 (GP3), and (d) 1.75 (GP4).
3.5. Thermal Stability
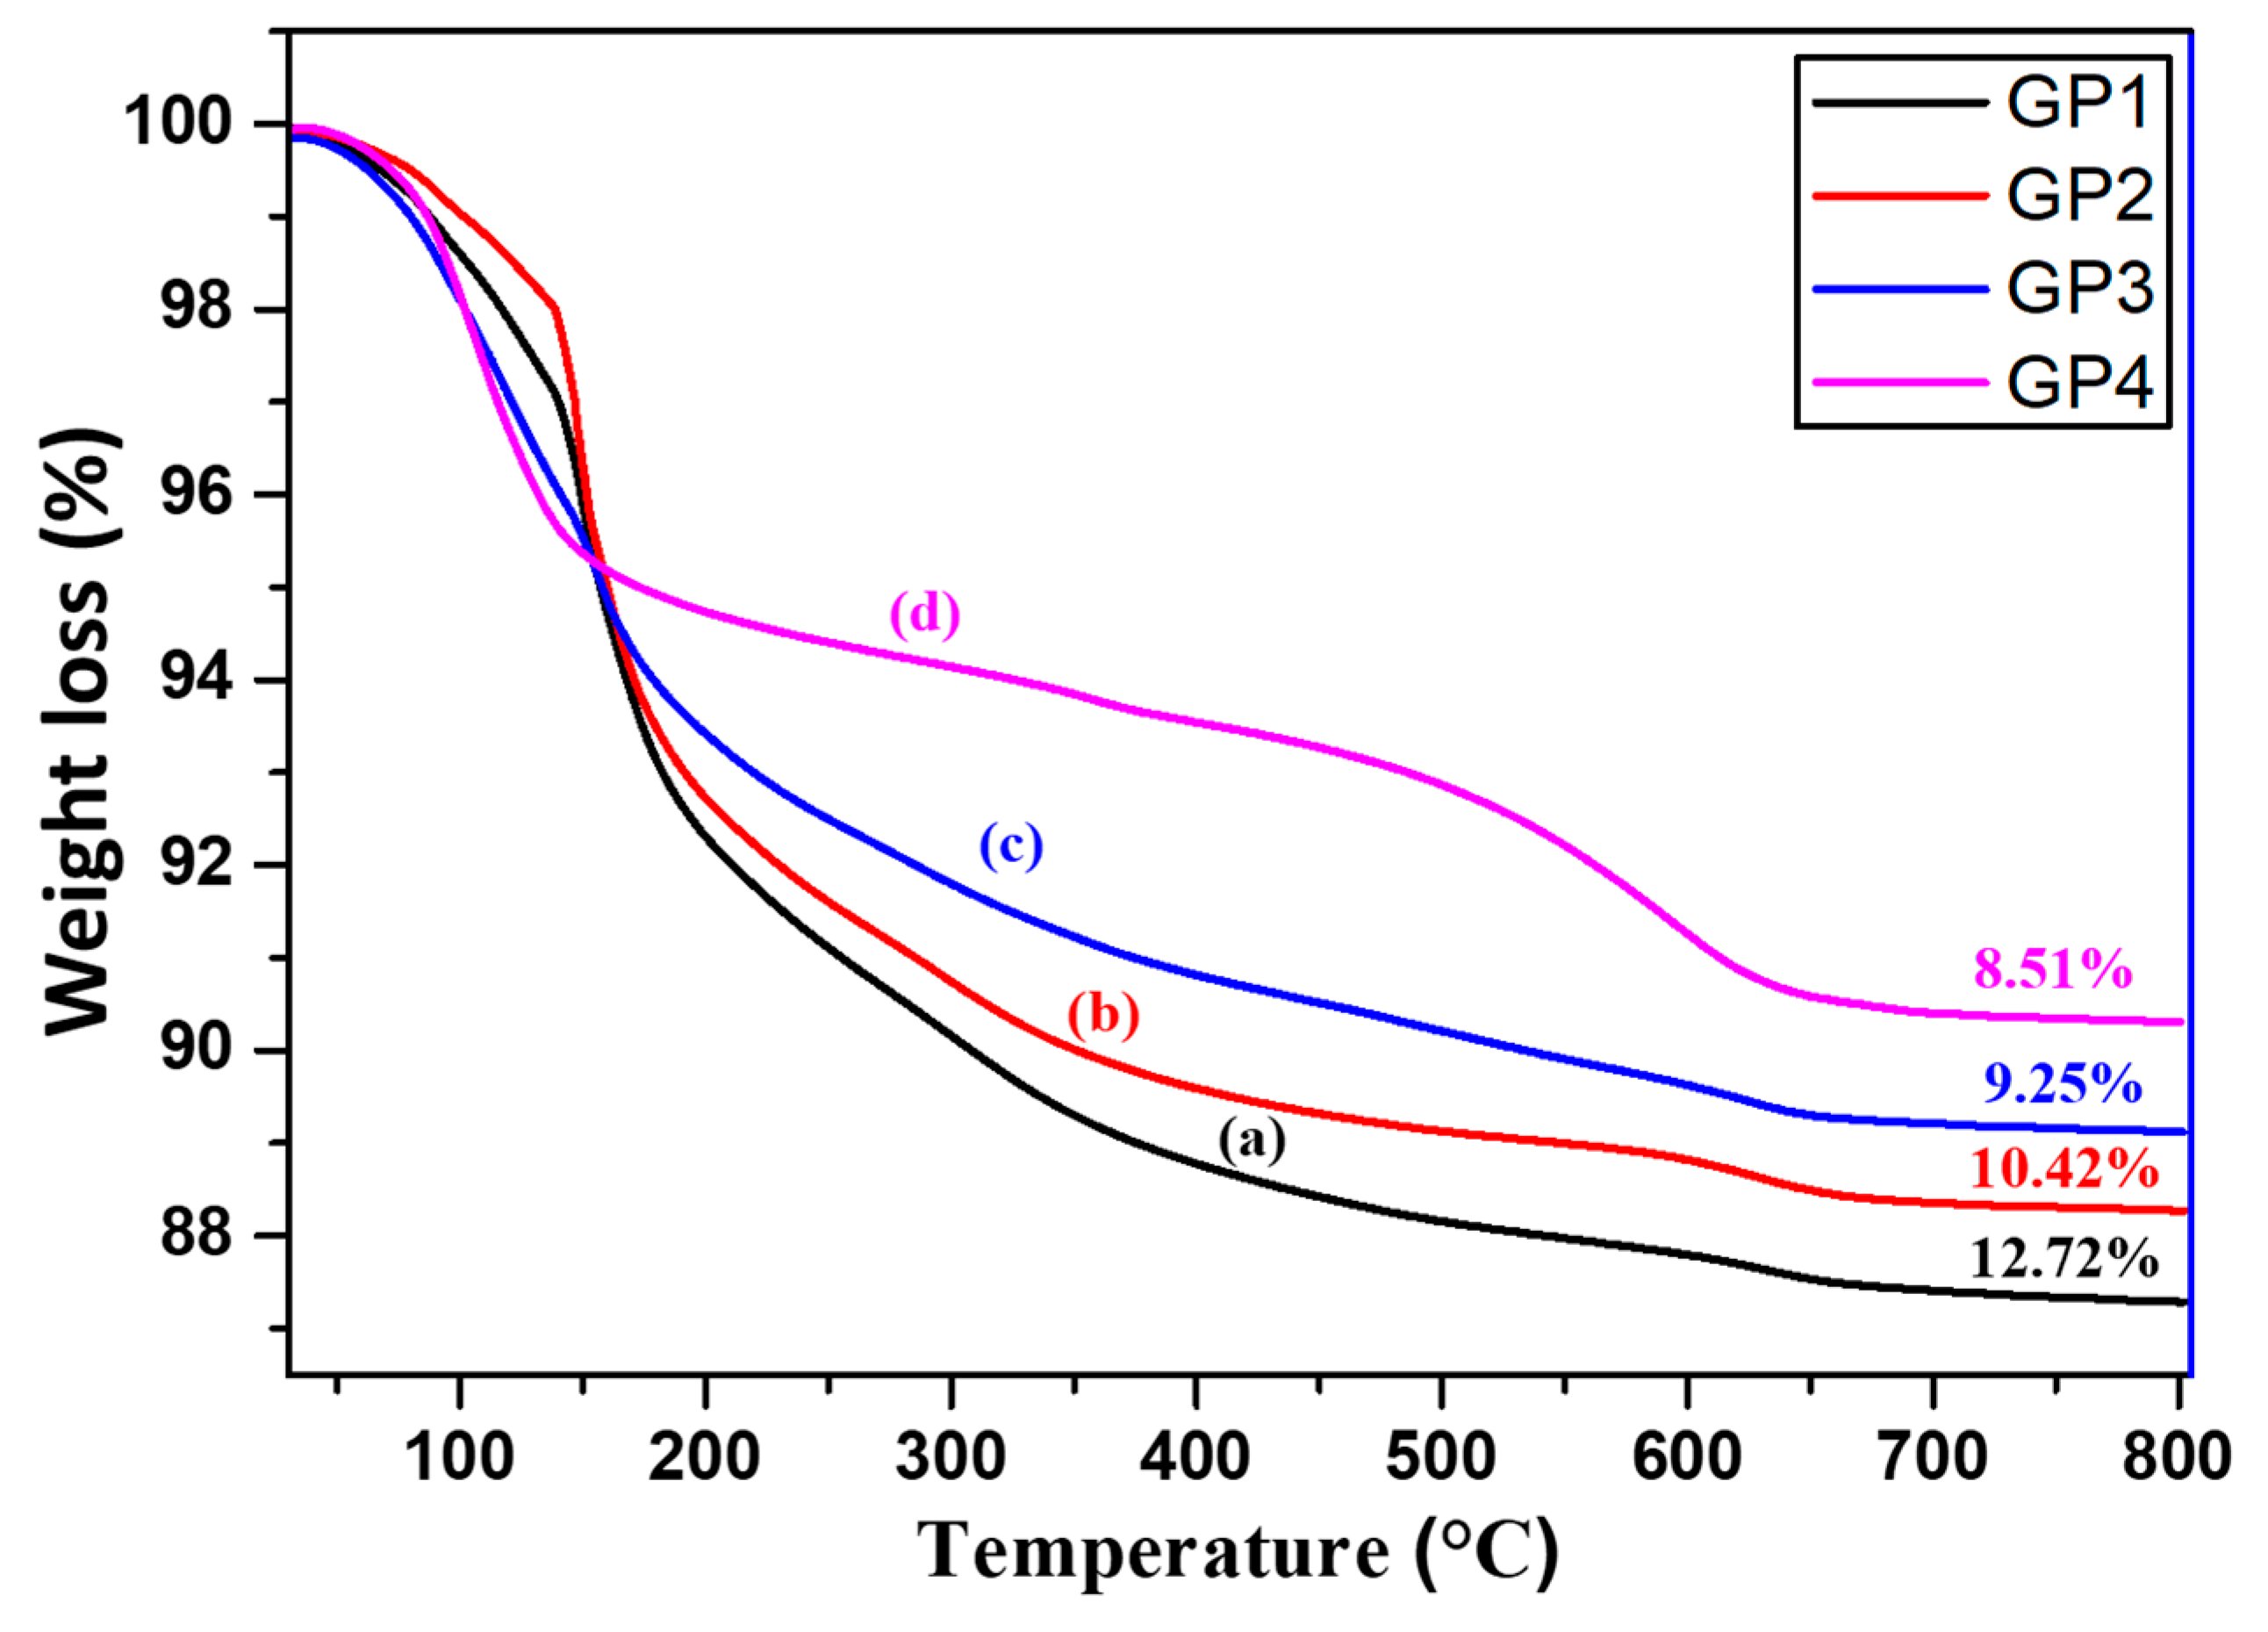
Thermogravimetric analysis (TGA) is an analytical method that measures the heat-induced weight change in a substance, to assess its thermal stability and volatile content. The TGA data from 30 °C to 800 °C for the geopolymer samples are presented in Figure 8. It can be seen from the TGA curve that 12.72%, 10.42%, 9.25%, and 8.51% mass loss occurred over the testing temperature range for GP1, GP2, GP3, and GP4, respectively. Therefore, the material is very stable and can withstand high temperatures. The geopolymer samples exhibit the highest rate of mass loss below 200 °C, accounting for approximately 50–60% of the overall mass reduction. This loss in mass is due to the evaporation of weakly adsorbed free water in the geopolymer cavities and structure, that is released at a temperature of no more than 200 °C. This mass loss has been widely reported [10,28]. After 200 °C, the mass loss constantly decreases, as seen from the TGA curve. The deceleration of the mass loss rate beyond 200 °C can be ascribed to the existence of tightly bound and chemically bonded water and hydroxyl (OH) groups. This observation is in line with the published literature [35,36]. The supporting chemical reaction for the dehydration reaction in geopolymers, involving the OH group that gives free water and Si-O-Si type of structure [37], at higher temperatures is
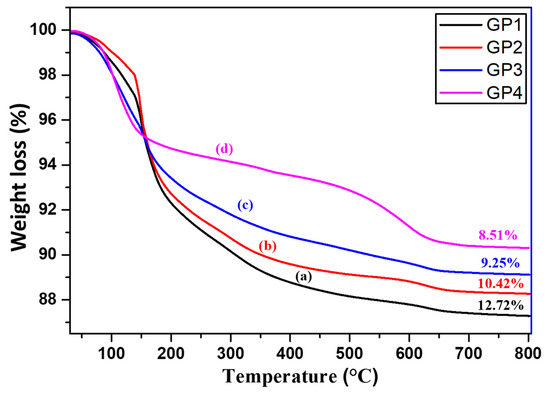
Figure 8.
TGA curves of geopolymers prepared at different ratios of FA/AL: (a) 1.00 (GP1), (b) 1.25 (GP2), (c) 1.50 (GP3), and (d) 1.75 (GP4).
Insignificant mass changes are observed after 600 °C, up to 800 °C.
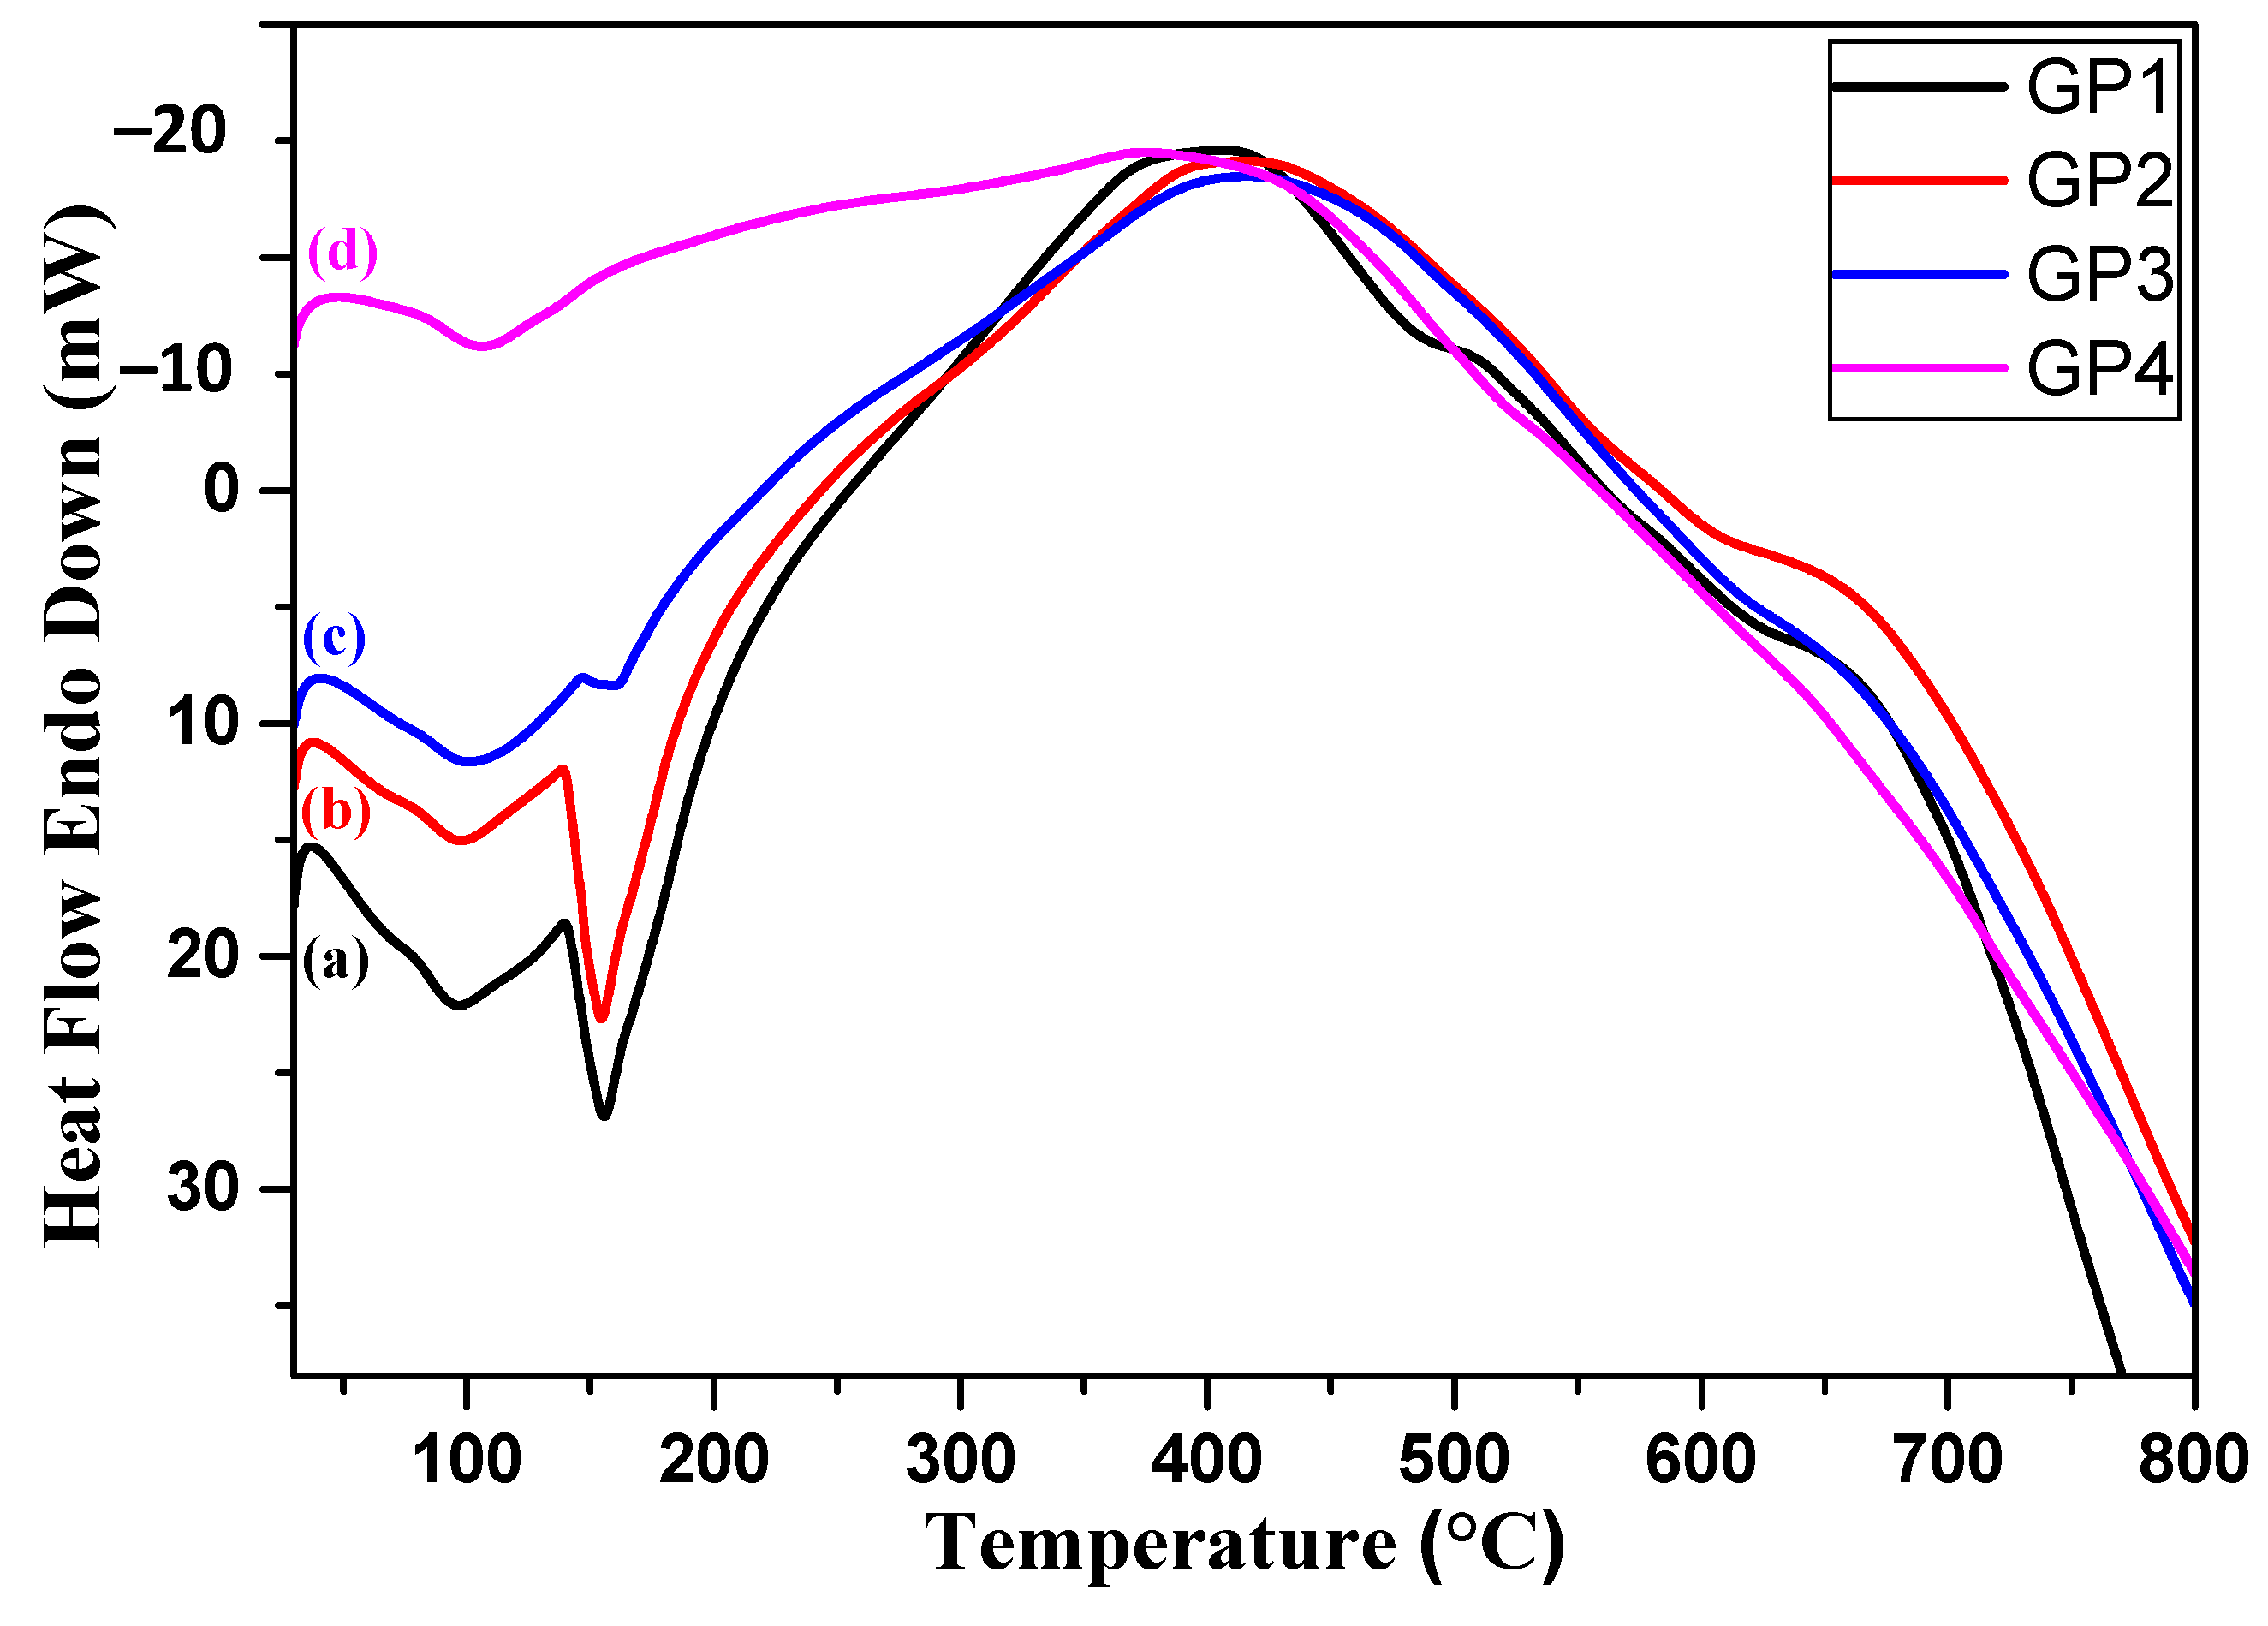
The geopolymer samples exhibit various exothermic and endothermic peaks, as observed in the DTA curve. The mass reduction observed in the temperature range from room temperature to 300 °C, as depicted in Figure 9, can be attributed to the evaporation of both loose water and a portion of chemically bonded water. This evaporation process results in an endothermic peak. By analyzing the DTA curve, it becomes evident that the sharp endothermic peak occurring around 100 °C is primarily caused by the evaporation of free water present in the sodium aluminosilicate hydrate (N-A-S-H) gel of the geopolymer samples, which accounts for approximately 50 to 60% of the entire content of water. The literature contains several reports of this peak, as the significant loss of water around 100 °C is prominent in geopolymer samples. In the temperature span from 500 to 700 °C, the geopolymer samples showed an exothermic hump, due to the unburnt residual carbon present [30]. The mass loss continued up to 800 °C, but the rate declined significantly. Davidovits [38] suggests that the evaporation of free water from the geopolymers does not impose significant stresses on the structure, aside from a slight reduction effect, even though free water constitutes approximately 60% of the entire water content. However, it is worth noting that the remaining water content (40%) that undergoes evaporation contributes to around 90% of the overall shrinkage at elevated temperatures. The relatively minor losses in mass observed in the geopolymer samples demonstrate the exceptional thermal stability of these materials when exposed to high temperatures.

Figure 9.
DTA curves of geopolymers prepared at different ratios of FA/AL: (a) 1.00 (GP1), (b) 1.25 (GP2), (c) 1.50 (GP3), and (d) 1.75 (GP4).
From DTA and TGA, we can see that weight loss is most significant in GP1, when compared to other geopolymer samples. The elevated temperatures induce chemical structure alterations and remove free and chemically bound water. As the external temperature rises, moisture within the sample rapidly migrates towards the surface and evaporates, leading to surface cracks and internal damage in the geopolymer’s overall structure. GP1 exhibits higher moisture content within the geopolymer system, due to a greater amount of liquid/water added during synthesis, as evidenced by Table 2. Consequently, Figure 8 illustrates that GP1 experiences more substantial weight loss than GP2, GP3, and GP4. While GP4 demonstrates the least weight loss, it exhibits characteristics similar to fly ash, as confirmed by SEM analysis (Figure 2d). Thus, among GP1, GP2, and GP3, GP3 emerges as the most suitable geopolymer sample, due to its superior thermal stability and minimal weight loss at high temperatures.
3.6. Electrical Properties
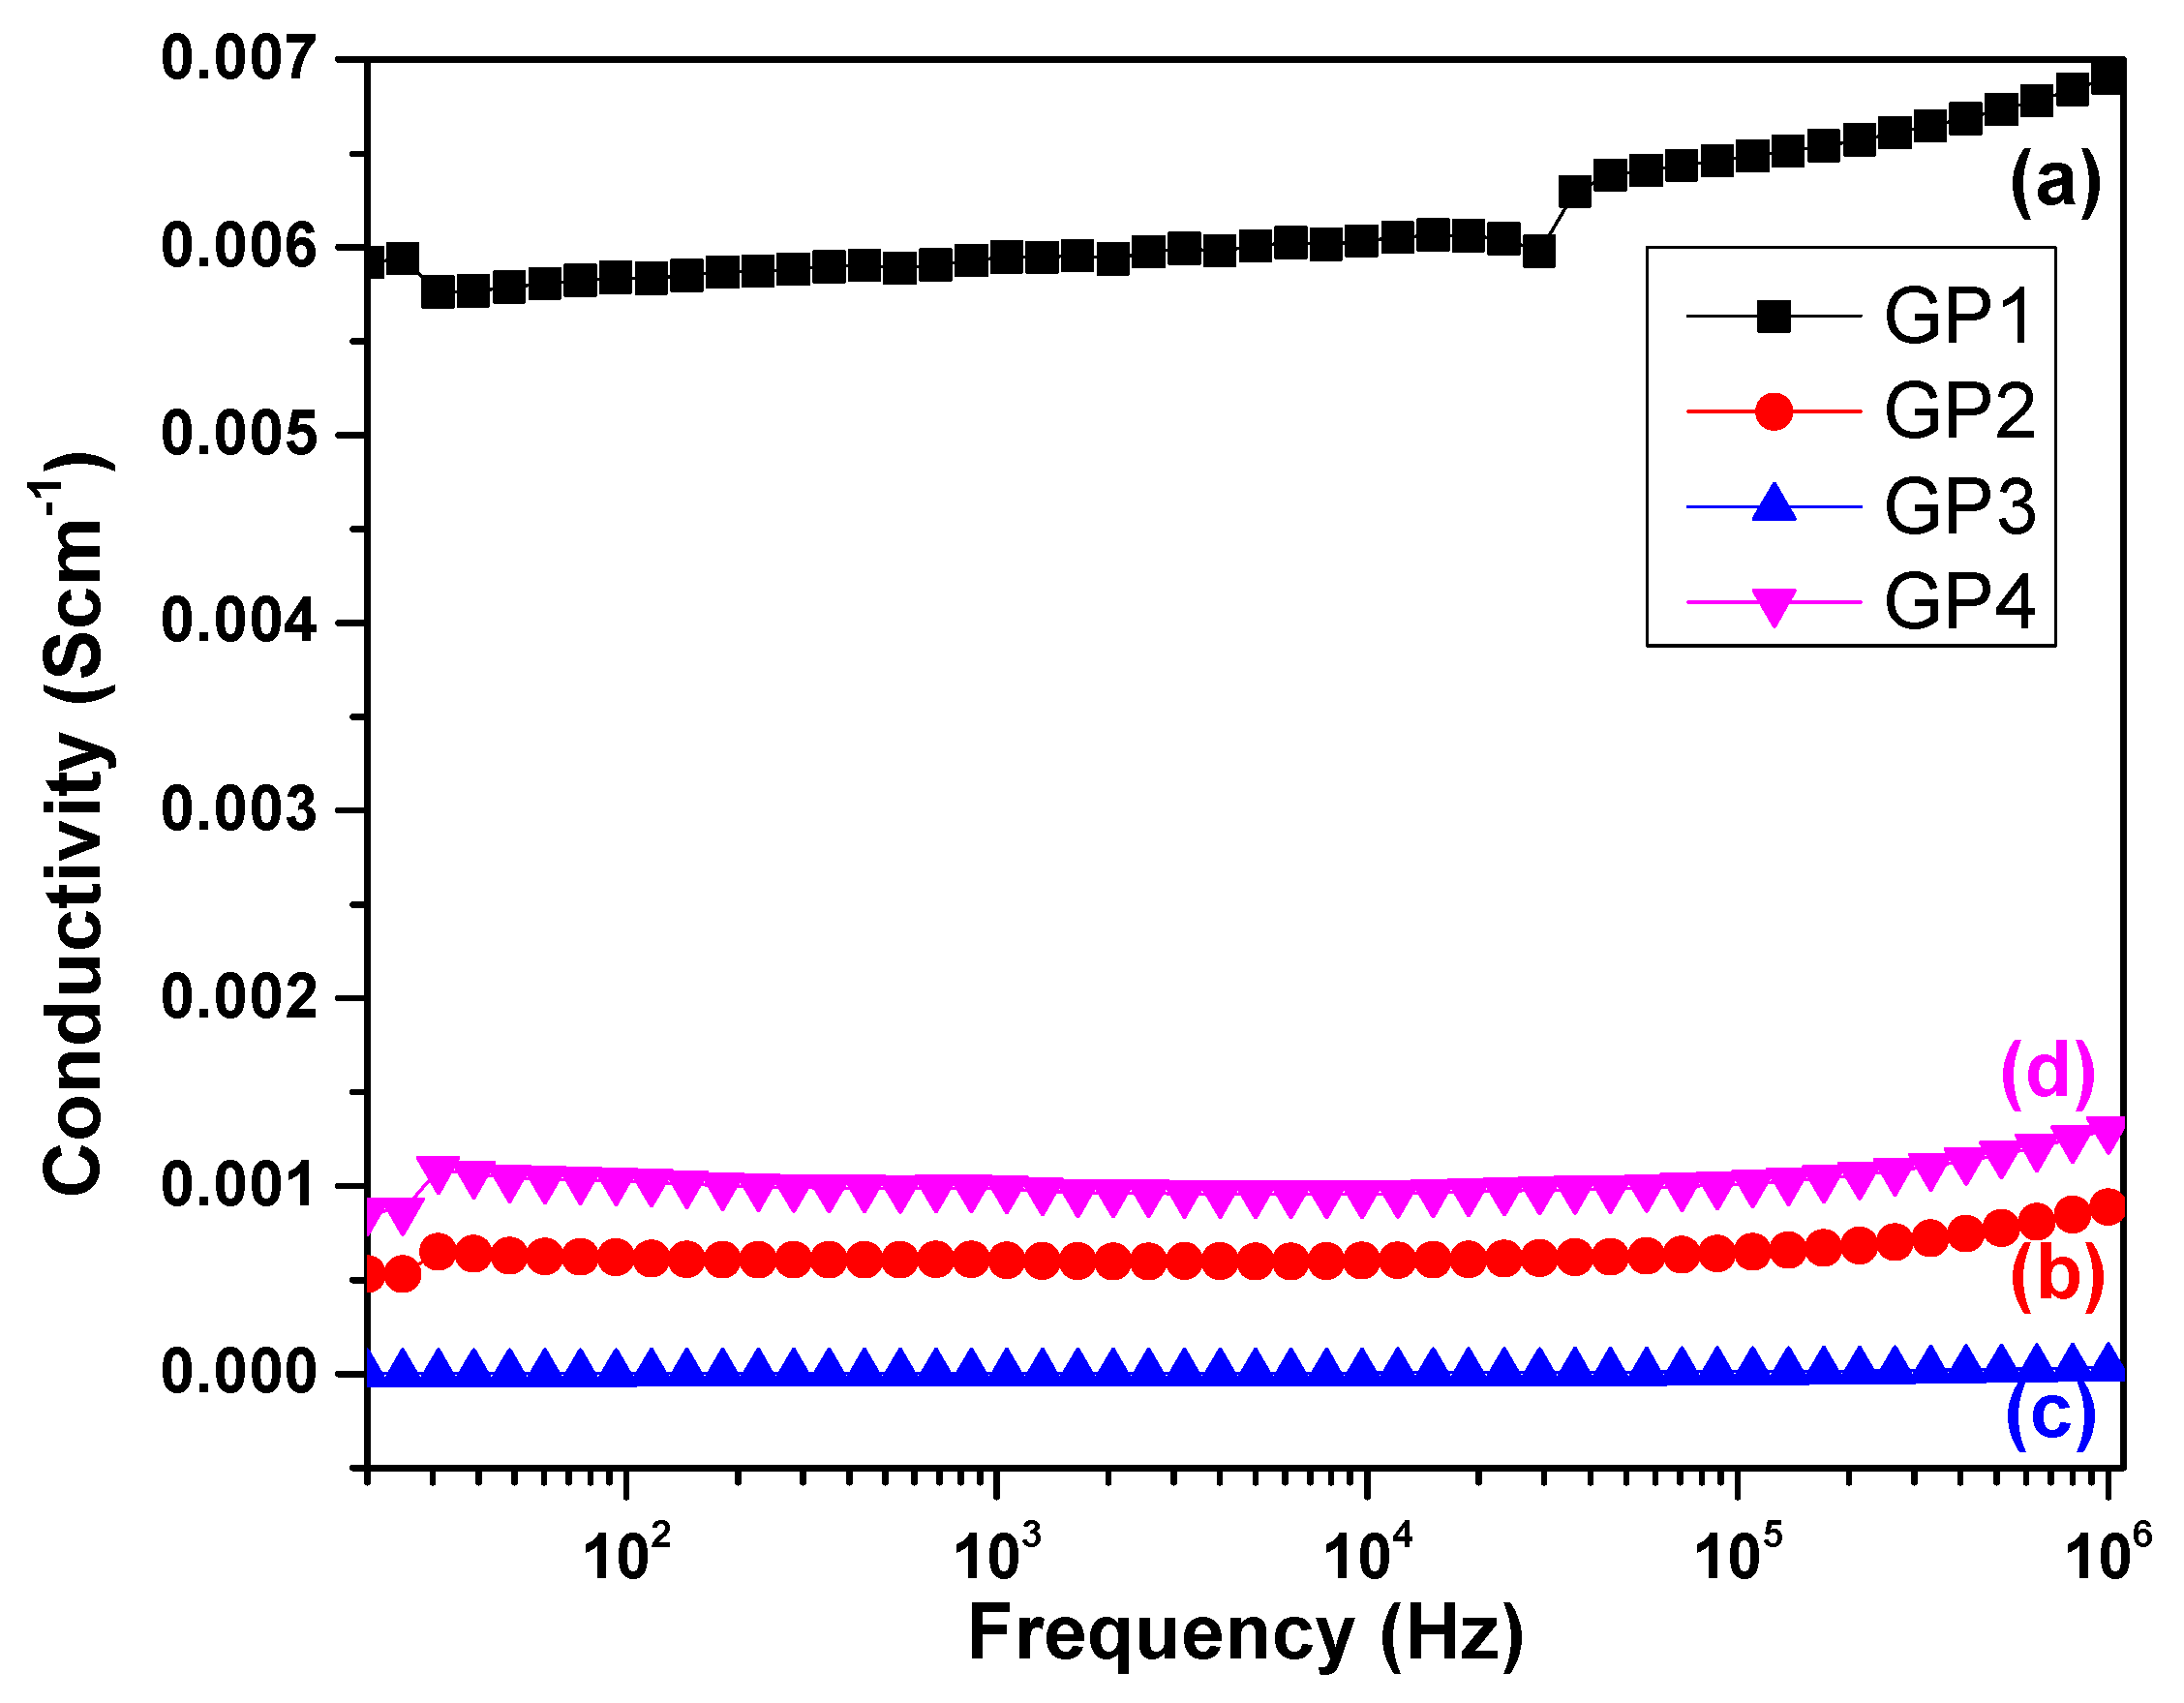
Figure 10 illustrates the relationship between electrical conductivity and varying FA/AL ratios in fly ash geopolymer samples. As the frequency increases, the conductivity values also rise. In the frequency range of 101–104 Hz, the rate of conductivity increase is slightly less pronounced, compared to the range of 105–107 Hz. Notably, the geopolymer with a FA/AL ratio of 1.00 exhibits high conductivity values. Furthermore, at higher frequencies, the geopolymer with a FA/AL ratio of 1.75 demonstrates greater electrical conductivity than the geopolymer paste with a FA/AL ratio of 1.25. Conversely, at a FA/AL ratio of 1.5, the conductivity remains consistently low, nearing zero within the tested frequency range of 101–107 Hz. Consequently, it can be deduced that a fly ash geopolymer with a FA/AL ratio of 1.5, characterized by a highly uniform matrix, yields lower conductivity values compared to geopolymer samples with FA/AL ratios of 1, 1.25, and 1.75.
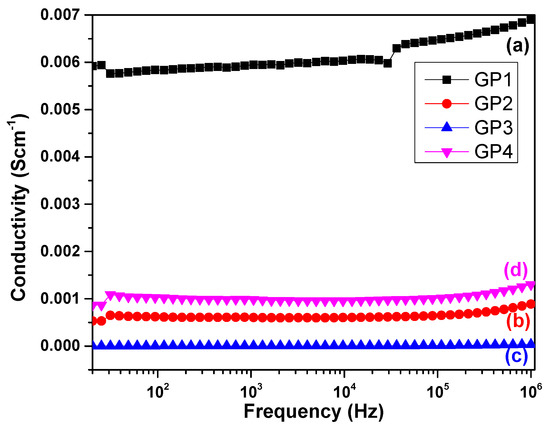
Figure 10.
Conductivity versus frequency plot of geopolymers prepared at different ratios of FA/AL: (a) 1.00 (GP1), (b) 1.25 (GP2), (c) 1.50 (GP3), and (d) 1.75 (GP4).
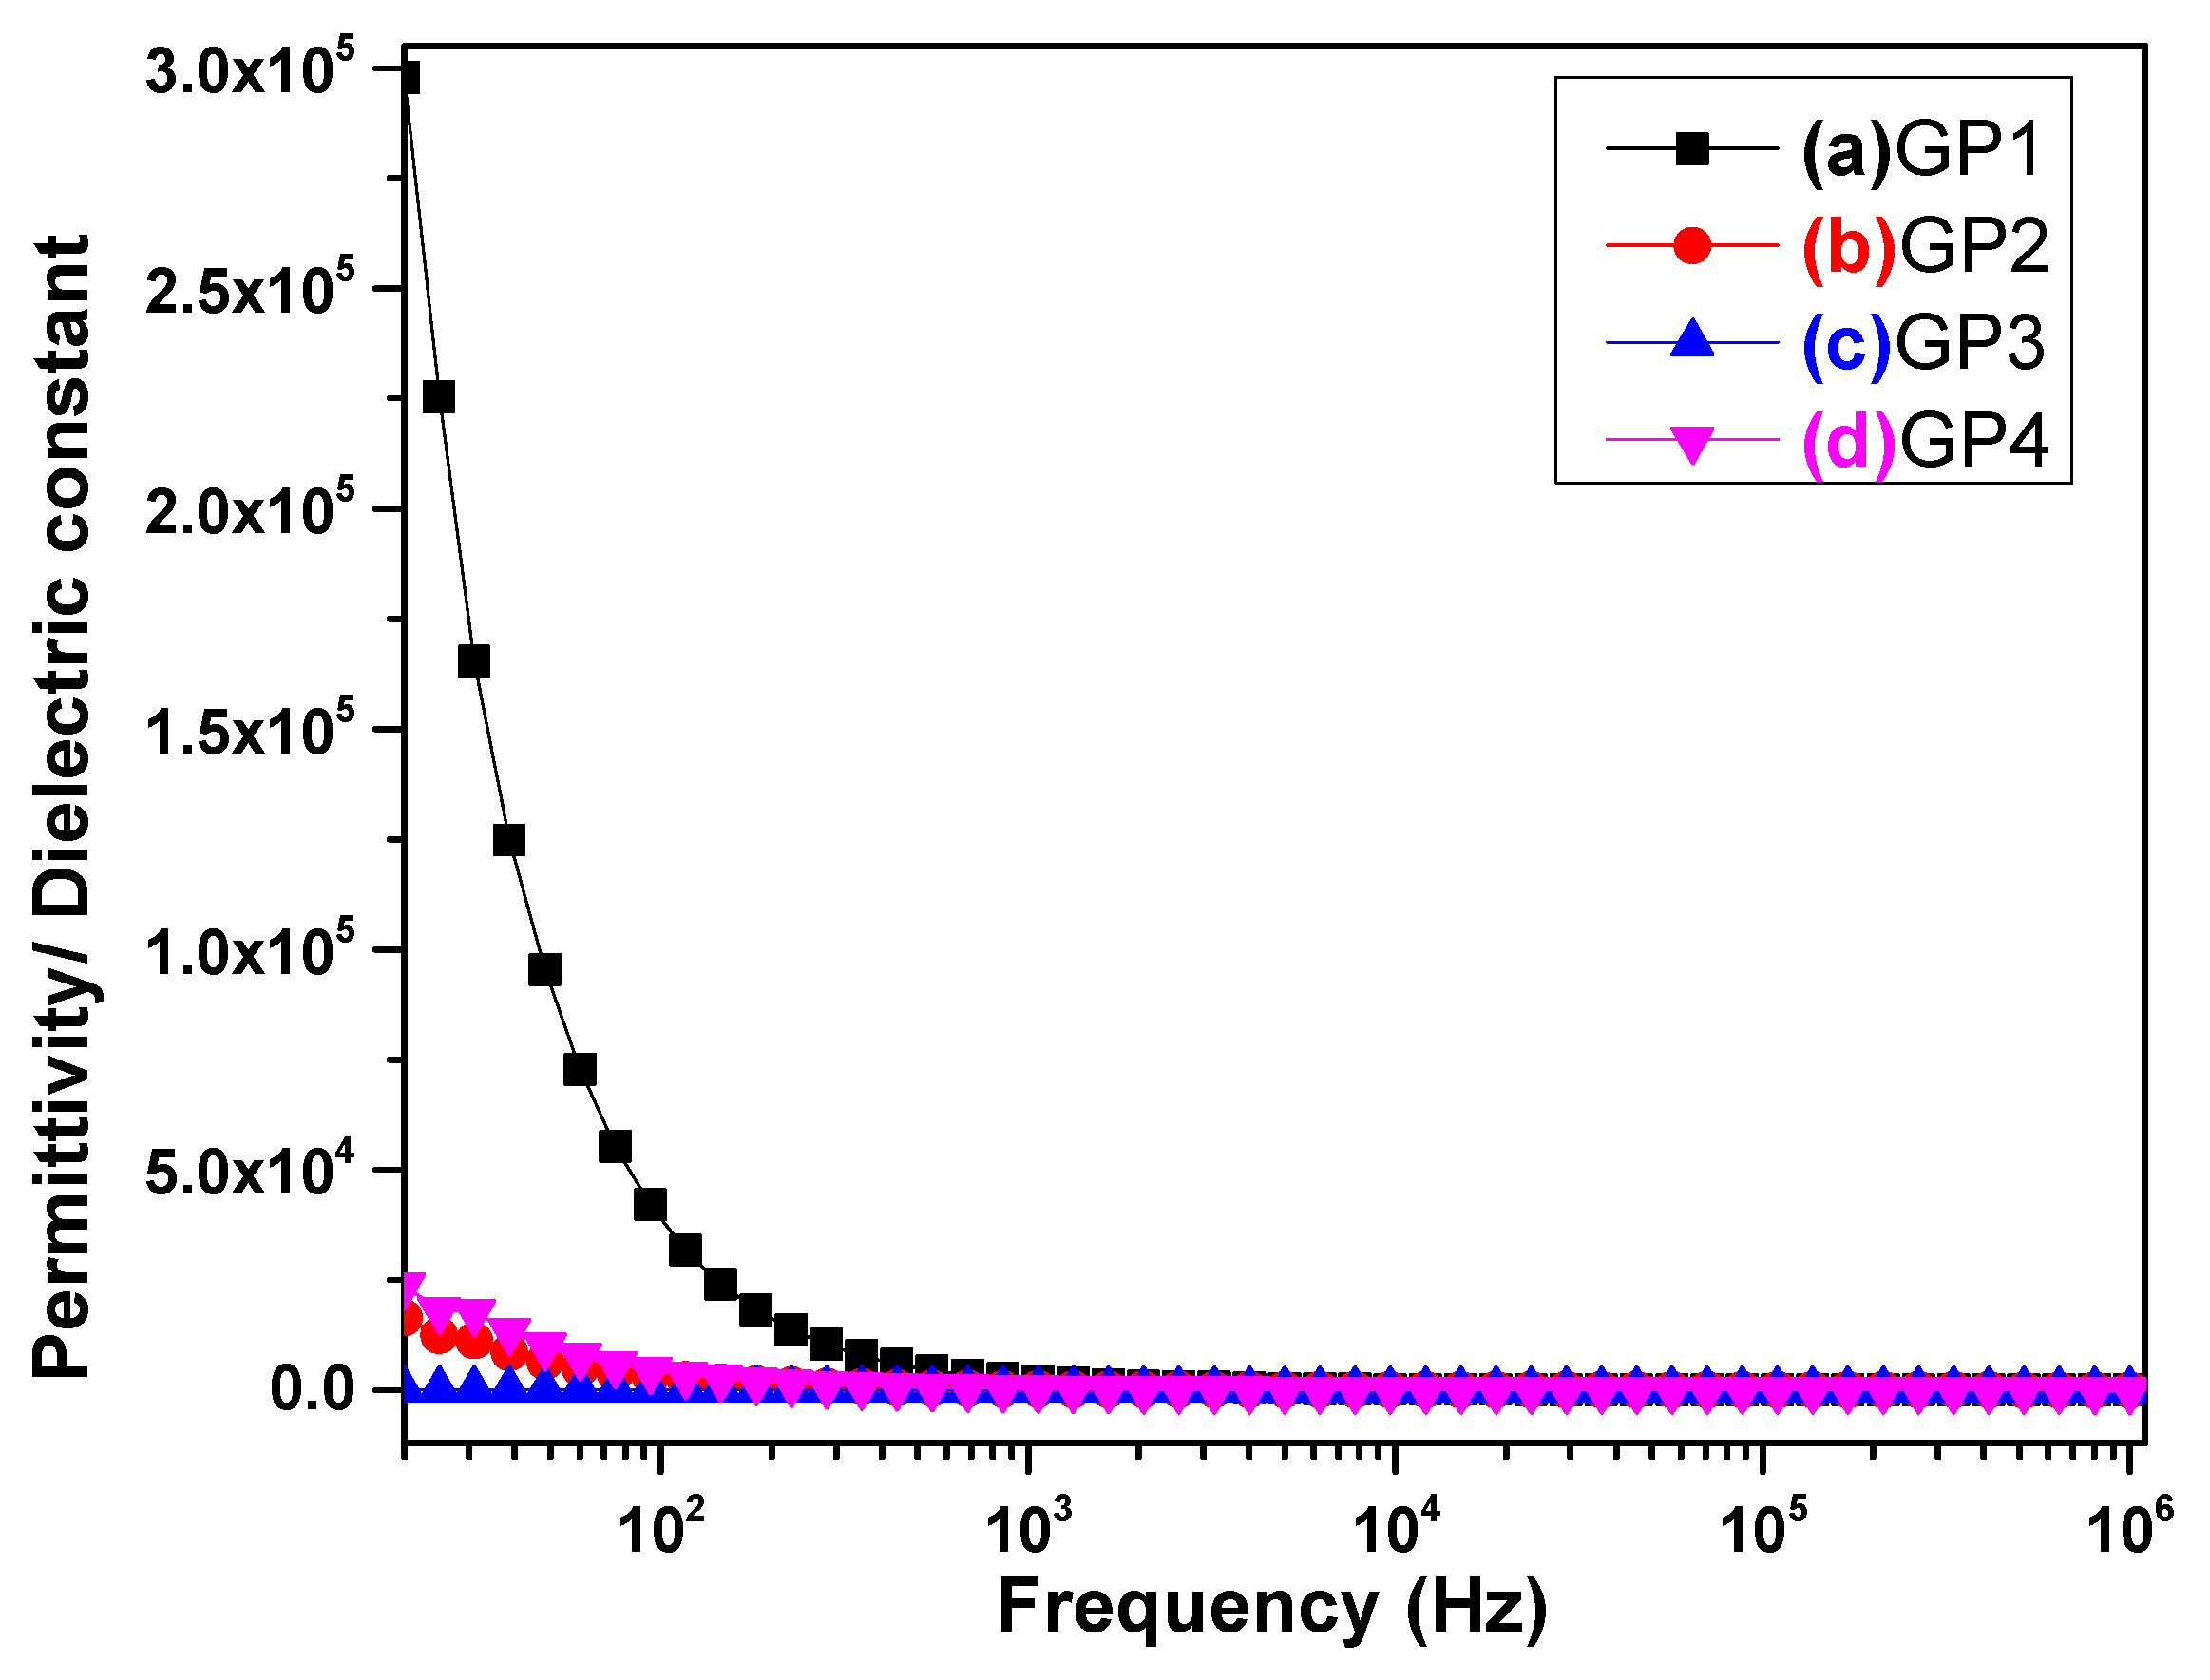
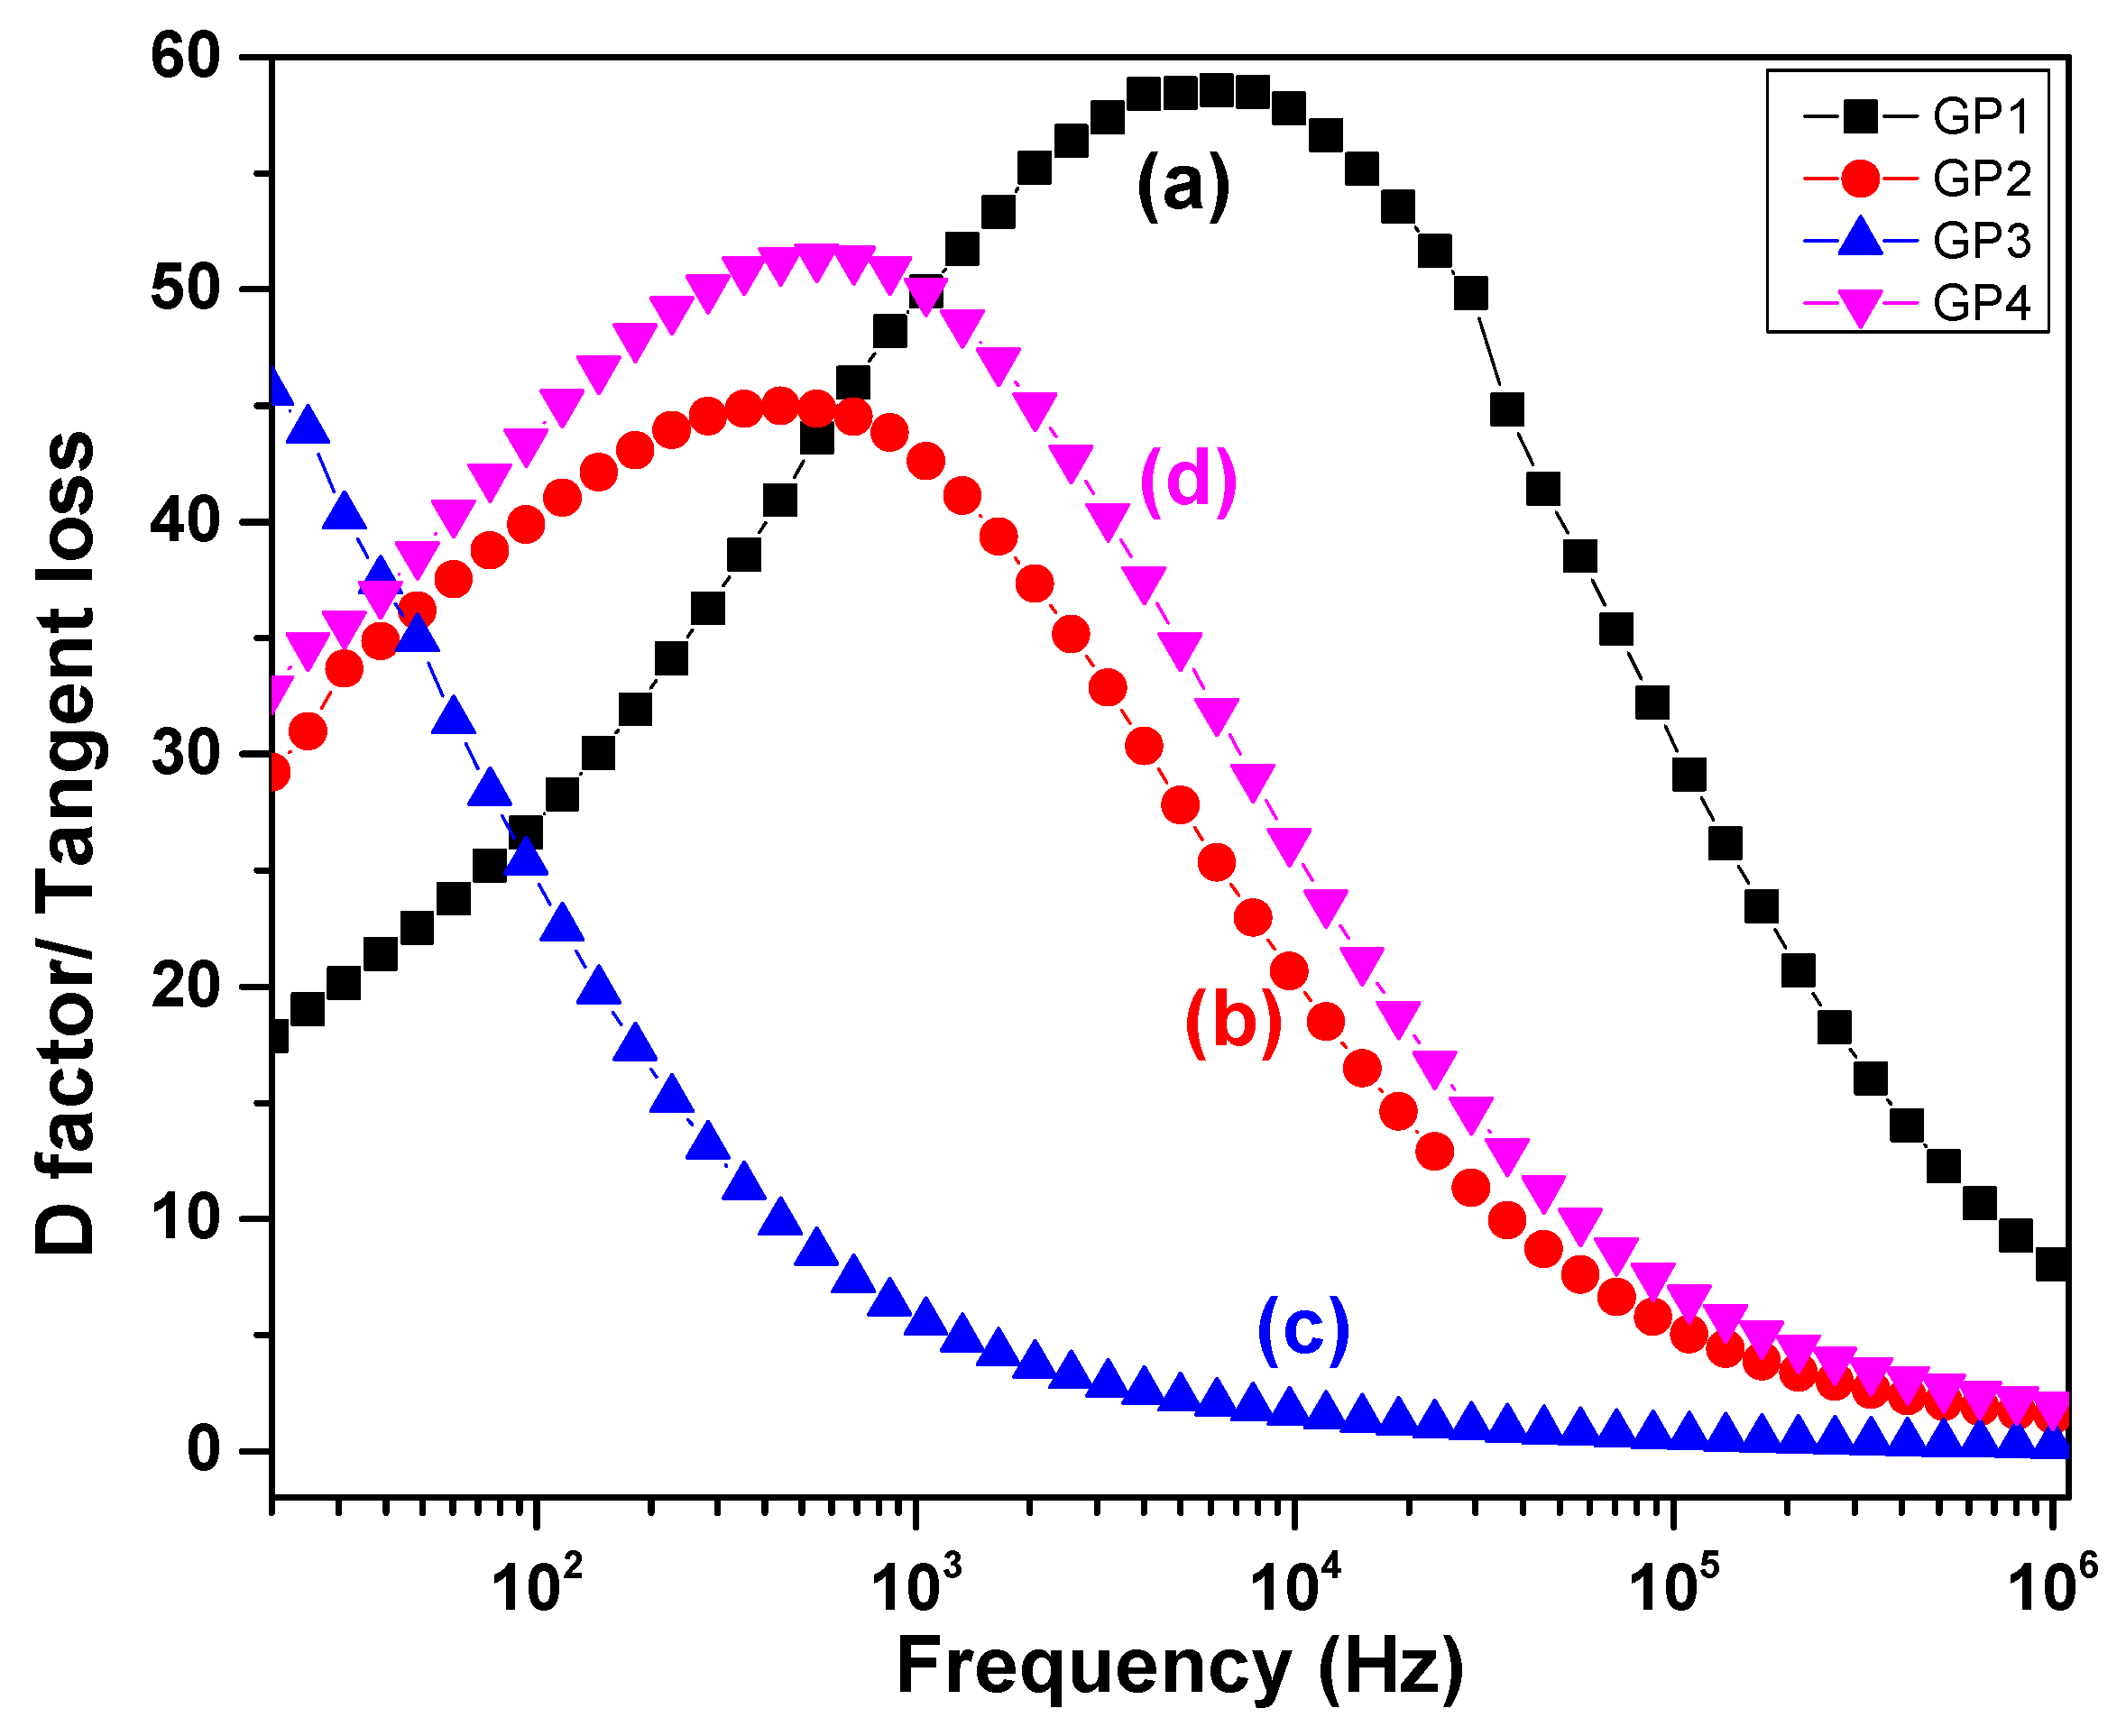
As the frequency increases within the examined range of 101–107 Hz, conductivity rises while permittivity (dielectric constant) decreases. Figure 11 depicts the plot of permittivity (dielectric constant) against frequency for the geopolymer samples. Those samples with elevated permittivity also exhibit high tangent loss (D factor), as illustrated in Figure 12, which shows the tangent loss (D factor) versus frequency graphs for geopolymer samples at various FA/AL ratios.

Figure 11.
Permittivity/dielectric constant versus frequency plot of geopolymers prepared at different ratios of FA/AL: (a) 1.00 (GP1), (b) 1.25 (GP2), (c) 1.50 (GP3), and (d) 1.75 (GP4).
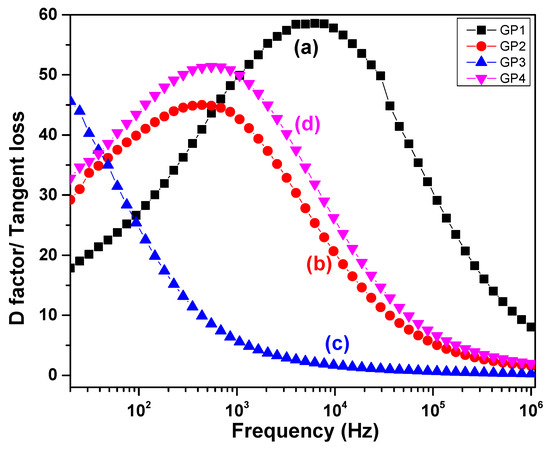
Figure 12.
D factor versus frequency plot of geopolymers prepared at different ratios of FA/AL: (a) 1.00 (GP1), (b) 1.25 (GP2), (c) 1.50 (GP3), and (d) 1.75 (GP4).
Specifically, the geopolymer paste with a FA/AL ratio of 1.00 demonstrates a relatively high dielectric constant and increased tangent loss. Conversely, the geopolymer with a FA/AL ratio of 1.5, characterized by the lowest permittivity, does not exhibit a peak in tangent loss (D factor) within the tested frequency range. This phenomenon is attributed to dipole reorientation in the geopolymer samples. Consequently, the geopolymer sample with a FA/AL ratio of 1.5 possesses superior insulating properties, compared to other ratios. It can be inferred that minimal ion movement or dipole interaction occurs in this geopolymer material (FA/AL = 1.5). In summary, the electrical conductivity, dielectric constant, and tangent loss of fly ash geopolymer samples depend on the frequency range and the ratio of FA/AL, as demonstrated by this study.
4. Conclusions
Geopolymer is prepared using fly ash, which is activated by a mixture of sodium hydroxide/sodium silicate (2.5) solution at different fly ash/alkaline activator ratios. Increasing the FA/AL ratio caused an increase in the geopolymerization process and resulted in a dense morphology for the GP3 sample, whereas GP4 showed a fly ash-like morphology due to insufficient alkali activation. The XRF results confirms the class F nature of the fly ash, with the sum of SiO2 + Al2O3 + Fe2O3 being ~85% and the CaO content being 1.6%, suitable for geopolymerization. The XRF analysis also reveals that the geopolymer synthesized with an FA/AL ratio of 1.50 exhibits an optimal concentration for the formation of a dense and homogeneous microstructure. This concentration corresponds to alumina (23.0%), silica (57.01%), Fe2O3 (3.50%), and Na2O (11.3%). The XRD analyses of the geopolymers showed that the majority of the crystalline phases are quartz, mullite, hematite, and sodalite. The FTIR analysis reveals an asymmetric stretching band (T-O, where T represents Si or Al) that shifts to a lower wavenumber than the original fly ash, indicating geopolymerization. GP3 demonstrates a greater shift towards a lower wavelength than fly ash, particularly in a distinct intensity peak at 1040 cm−1. The TGA curve reveals that GP1, GP2, GP3, and GP4 experience mass loss in the following order: 12.72% > 10.42% > 9.25% > 8.51%, respectively, across the tested temperature range. However, GP3 displays optimum thermal stability at elevated temperatures. The dielectric constant decreases, but the conductivity increases with the change in frequency from 101to 107 Hz. The study of the electrical properties concluded that GP3 holds better potential for possible dielectric applications than GP1, GP2 and GP4. From all studies, it can be concluded that alkaline activator solution(Na2SiO3/NaOH = 2.5) with a FA/AL ratio of 1.50 is the optimized condition for preparing geopolymer pastes with dense morphology, better thermal stability, and better electrical insulating properties.
Author Contributions
M.Y.: conceptualization, methodology, literature survey, and writing—original draft preparation; L.K. and V.Y.: data interpretation and methodology; K.J.: XRD analysis and manuscript review; V.N.S.: manuscript review and data analysis; S.P.S.: electrical properties analysis and interpretation; V.E.: supervision, conceptualization, and manuscript writing—review and editing. All authors have read and agreed to the published version of the manuscript.
Funding
No funding was acquired for this research publication.
Institutional Review Board Statement
Not applicable.
Informed Consent Statement
Not applicable.
Data Availability Statement
All data generated and analyzed during this study are included in this article.
Acknowledgments
The authors thank NPL for permitting them to publish this work. The authors would like to express their appreciation and thanks to the Chemical and Food section (BND) of CSIR National Physical Laboratory. The authors would like to express their appreciation and thanks to N.Vijayan for XRF, Jai S Tawale for FESEM, Sumit Mohan for XRD, Sandeep Singh for FTIR, Ashok M Biradar and Neha Yadav for impedance analyzer and MRC, and MNIT, Jaipur for DTA-TGA. The authors, M.Y., L.K. and V.Y. thank CSIR for providing senior research fellowships.
Conflicts of Interest
The authors declare no conflict of interest.
References
- Cong, P.; Cheng, Y. Advances in geopolymer materials: A comprehensive review. J. Traffic Transp. Eng. 2021, 8, 283–314. [Google Scholar] [CrossRef]
- EL Alouani, M.; Alehyen, S.; EL Achouri, M.; Hajjaji, A.; Ennawaoui, C.; Taibi, M. Influence of the Nature and Rate of Alkaline Activator on the Physicochemical Properties of Fly Ash-Based Geopolymers. Adv. Civ. Eng. 2020, 2020, 8880906. [Google Scholar] [CrossRef]
- Liu, Z.; Cai, C.S.; Liu, F.; Fan, F. Feasibility Study of Loess Stabilization with Fly Ash–Based Geopolymer. J. Mater. Civ. Eng. 2016, 28, 04016003. [Google Scholar] [CrossRef]
- Pereira, M.A.; Vasconcelos, D.C.L.; Vasconcelos, W.L. Synthetic Aluminosilicates for Geopolymer Production. Mater. Res. 2019, 22. [Google Scholar] [CrossRef]
- Ziegler, D.; Formia, A.; Tulliani, J.-M.; Palmero, P. Environmentally-Friendly Dense and Porous Geopolymers Using Fly Ash and Rice Husk Ash as Raw Materials. Materials 2016, 9, 466. [Google Scholar] [CrossRef] [PubMed]
- Albidah, A.; Alghannam, M.; Abbas, H.; Almusallam, T.; Al-Salloum, Y. Characteristics of metakaolin-based geopolymer concrete for different mix design parameters. J. Mater. Res. Technol. 2021, 10, 84–98. [Google Scholar] [CrossRef]
- Taki, K.; Sharma, S. Synthesis of Bentonite Clay-Based Geopolymer and Its Application in the Treatment of Expansive Soil. In Advances in Computer Methods and Geomechanics; Prashant, A., Sachan, A., Desai, C.S., Eds.; In Lecture Notes in Civil Engineering; Springer: Singapore, 2020; Volume 56, pp. 133–143. [Google Scholar] [CrossRef]
- Assi, L.N.; Carter, K.; Deaver, E.; Ziehl, P. Review of availability of source materials for geopolymer/sustainable concrete. J. Clean. Prod. 2020, 263, 121477. [Google Scholar] [CrossRef]
- Nath, S.; Kumar, S. Role of alkali concentration on reaction kinetics of fly ash geopolymerization. J. Non-Cryst. Solids 2019, 505, 241–251. [Google Scholar] [CrossRef]
- Kong, D.L.; Sanjayan, J.G. Effect of elevated temperatures on geopolymer paste, mortar and concrete. Cem. Concr. Res. 2010, 40, 334–339. [Google Scholar] [CrossRef]
- Mucsi, G.; Szenczi, Á.; Nagy, S. Fiber reinforced geopolymer from synergetic utilization of fly ash and waste tire. J. Clean. Prod. 2018, 178, 429–440. [Google Scholar] [CrossRef]
- Alterary, S.S.; Marei, N.H. Fly ash properties, characterization, and applications: A review. J. King Saud Univ.-Sci. 2021, 33, 101536. [Google Scholar] [CrossRef]
- Rattanasak, U.; Chindaprasirt, P. Influence of NaOH solution on the synthesis of fly ash geopolymer. Miner. Eng. 2009, 22, 1073–1078. [Google Scholar] [CrossRef]
- Ma, Y.; Hu, J.; Ye, G. The effect of activating solution on the mechanical strength, reaction rate, mineralogy, and microstructure of alkali-activated fly ash. J. Mater. Sci. 2012, 47, 4568–4578. [Google Scholar] [CrossRef]
- de Vargas, A.S.; Dal Molin, D.C.C.; Vilela, A.C.F.; Silva, F.J.D.; Pavão, B.; Veit, H. The effects of Na2O/SiO2molar ratio, curing temperature and age on compressive strength, morphology and microstructure of alkali-activated fly ash-based geopolymers. Cem. Concr. Compos. 2011, 33, 653–660. [Google Scholar] [CrossRef]
- Panias, D.; Giannopoulou, I.P.; Perraki, T. Effect of synthesis parameters on the mechanical properties of fly ash-based geopolymers. Colloids Surf. A Physicochem. Eng. Asp. 2007, 301, 246–254. [Google Scholar] [CrossRef]
- Görhan, G.; Kürklü, G. The influence of the NaOH solution on the properties of the fly ash-based geopolymer mortar cured at different temperatures. Compos. Part B Eng. 2014, 58, 371–377. [Google Scholar] [CrossRef]
- Falcone, J.S. Soluble Silicates; American Chemical Society: Washington, DC, USA, 1982. [Google Scholar]
- Singh, N.B. Fly Ash-Based Geopolymer Binder: A Future Construction Material. Minerals 2018, 8, 299. [Google Scholar] [CrossRef]
- Nath, S.; Maitra, S.; Mukherjee, S.; Kumar, S. Microstructural and morphological evolution of fly ash based geopolymers. Constr. Build. Mater. 2016, 111, 758–765. [Google Scholar] [CrossRef]
- Ryu, G.S.; Lee, Y.B.; Koh, K.T.; Chung, Y.S. The mechanical properties of fly ash-based geopolymer concrete with alkaline activators. Constr. Build. Mater. 2013, 47, 409–418. [Google Scholar] [CrossRef]
- Nagalia, G.; Park, Y.; Abolmaali, A.; Aswath, P. Asce Compressive Strength and Microstructural Properties of Fly Ash–Based Geopolymer Concrete. J. Mater. Civ. Eng. 2016, 28, 04016144. [Google Scholar] [CrossRef]
- Das, D.; Rout, P.K. Synthesis, Characterization and Properties of Fly Ash Based Geopolymer Materials. J. Mater. Eng. Perform. 2021, 30, 3213–3231. [Google Scholar] [CrossRef]
- Sasui, S.; Kim, G.; Nam, J.; Koyama, T.; Chansomsak, S. Strength and Microstructure of Class-C Fly Ash and GGBS Blend Geopolymer Activated in NaOH & NaOH+ Na2SiO3. Materials 2019, 13, 59. [Google Scholar] [CrossRef] [PubMed]
- Lv, Q.; Yu, J.; Ji, F.; Gu, L.; Chen, Y.; Shan, X. Mechanical Property and Microstructure of Fly Ash-Based Geopolymer Activated by Sodium Silicate. KSCE J. Civ. Eng. 2021, 25, 1765–1777. [Google Scholar] [CrossRef]
- Fan, F.; Liu, Z.; Xu, G.; Peng, H.; Cai, C. Mechanical and thermal properties of fly ash based geopolymers. Constr. Build. Mater. 2018, 160, 66–81. [Google Scholar] [CrossRef]
- Rickard, W.D.A.; van Riessen, A.; Walls, P. Thermal Character of Geopolymers Synthesized from Class F Fly Ash Containing High Concentrations of Iron and α-Quartz. Int. J. Appl. Ceram. Technol. 2010, 7, 81–88. [Google Scholar] [CrossRef]
- Cheng-Yong, H.; Yun-Ming, L.; Abdullah, M.M.A.B.; Hussin, K. Thermal Resistance Variations of Fly Ash Geopolymers: Foaming Responses. Sci. Rep. 2017, 7, srep45355. [Google Scholar] [CrossRef]
- Hanjitsuwan, S.; Hunpratub, S.; Thongbai, P.; Maensiri, S.; Sata, V.; Chindaprasirt, P. Effects of NaOH concentrations on physical and electrical properties of high calcium fly ash geopolymer paste. Cem. Concr. Compos. 2014, 45, 9–14. [Google Scholar] [CrossRef]
- Douiri, H.; Louati, S.; Baklouti, S.; Arous, M.; Fakhfakh, Z. Enhanced dielectric performance of metakaolin–H3PO4 geopolymers. Mater. Lett. 2016, 164, 299–302. [Google Scholar] [CrossRef]
- Cai, J.; Pan, J.; Li, X.; Tan, J.; Li, J. Electrical resistivity of fly ash and metakaolin based geopolymers. Constr. Build. Mater. 2020, 234, 117868. [Google Scholar] [CrossRef]
- Zhang, X.; Wu, G.; Yao, T.; Zhang, C.; Yue, Y. Characterization of individual fly ash particles in surface snow at Urumqi Glacier No. 1, Eastern Tianshan. Chin. Sci. Bull. 2011, 56, 3464–3473. [Google Scholar] [CrossRef]
- Rożek, P.; Król, M.; Mozgawa, W. Spectroscopic studies of fly ash-based geopolymers. Spectrochim. Acta Part A Mol. Biomol. Spectrosc. 2018, 198, 283–289. [Google Scholar] [CrossRef] [PubMed]
- Rees, C.A.; Provis, J.L.; Lukey, G.C.; van Deventer, J.S.J. In Situ ATR-FTIR Study of the Early Stages Geopolymer Gel Formation. Langmuir 2007, 23, 9076–9082. [Google Scholar] [CrossRef] [PubMed]
- da Silva Rocha, T.; Dias, D.P.; França, F.C.C.; de Salles Guerra, R.R.; de Oliveira, L.R.D.C. Metakaolin-based geopolymer mortars with different alkaline activators (Na+ and K+). Constr. Build. Mater. 2018, 178, 453–461. [Google Scholar] [CrossRef]
- Hassan, A.; Arif, M.; Shariq, M. Mechanical Behaviour and Microstructural Investigation of Geopolymer Concrete After Exposure to Elevated Temperatures. Arab. J. Sci. Eng. 2020, 45, 3843–3861. [Google Scholar] [CrossRef]
- Li, Q.; Xu, H.; Li, F.; Li, P.; Shen, L.; Zhai, J. Synthesis of geopolymer composites from blends of CFBC fly and bottom ashes. Fuel 2012, 97, 366–372. [Google Scholar] [CrossRef]
- Davidovits, J. Geopolymer Chemistry e Aplication, 2nd ed.; Geopolymer Institute: Saint-Quentin, France, 2008; Chapter 1; p. 9. Available online: http://www.geopolymer.org/fichiers_pdf/geopolymer-book-chapter1.pdf (accessed on 9 September 2023).


Disclaimer/Publisher’s Note: The statements, opinions and data contained in all publications are solely those of the individual author(s) and contributor(s) and not of MDPI and/or the editor(s). MDPI and/or the editor(s) disclaim responsibility for any injury to people or property resulting from any ideas, methods, instructions or products referred to in the content. |
© 2023 by the authors. Licensee MDPI, Basel, Switzerland. This article is an open access article distributed under the terms and conditions of the Creative Commons Attribution (CC BY) license (https://creativecommons.org/licenses/by/4.0/).