Article

Insights for Precursors Influence on the Solar-Assisted Photocatalysis of Greenly Synthesizing Zinc Oxide NPs towards Fast and Durable Wastewater Detoxification

by
Amr A. Essawy
1,*,
Modather F. Hussein
1,
Tamer H. A. Hasanin
1,
Emam F. El Agammy
2,
Hissah S. Alsaykhan
1,
Rakan F. Alanazyi
1 and
Abd El-Naby I. Essawy
3
1
Chemistry Department, College of Science, Jouf University, Sakaka P.O. Box 72341, Aljouf, Saudi Arabia
2
Physics Department, College of Science, Jouf University, Sakaka P.O. Box 72341, Aljouf, Saudi Arabia
3
Chemistry Department, Faculty of Science, Fayoum University, Fayoum 63514, Egypt
*
Author to whom correspondence should be addressed.
Ceramics 2024, 7(3), 1100-1121; https://doi.org/10.3390/ceramics7030072
Submission received: 24 May 2024 / Revised: 9 August 2024 / Accepted: 12 August 2024 / Published: 19 August 2024

Abstract

:
Herein, this study has examined the influence of Zn2+ sources during a biogenic-mediated pathway to synthesize ZnO nanoparticles with highly desirable solar-responsive catalytic properties. Salts of nitrate, acetate and chloride have been utilized. The ZnO powders underwent characterization using diverse analytical tools, including XRD, FTIR, Raman, BET, SEM, TEM with EDS/elemental mapping and UV-vis absorption/emission spectroscopic analyses. Accordingly, precursors have proved to affect crystallinity, morphology, surface characteristics, optical properties and the photocatalytic degradation of methylene blue (MB) model pollutant. It was observed that ZnO derived from zinc acetate precursor (Z-AC NPs) exhibits very fast photocatalytic degradation of MB at pH 11 with superior kinetic estimates of 0.314 min−1 and t1/2 = 2.2 min over many of recent reports. In contrast, the chloride precursor is not recommended along with the employed biogenic route. The intriguing findings could be directly correlated to the decreased crystal size, augmented surface area, the hexagonal morphology of the crystals, high potency in absorbing visible photons, high efficacy in separating photogenerated charge carriers and producing high amounts of OH radicals. Further testing of Z-AC NPs in photocatalytic remediation of water samples from Dumat Aljandal Lake in Aljouf, Saudi Arabia, contaminated with MB and pyronine Y (PY) dyestuffs, showed high dye photodegradation. Therefore, this work could lead to an extremely fast avenue for decontaminating wastewater from hazmat dyestuff.

1. Introduction

The exponential growth of globalization and industrialization has resulted in notable environmental pollution complexities. The United Nations issued a report regarding global water situation, and it is predicted that through the year 2050, over 5 billion individuals could potentially face water scarcity. The current predicament can be ascribed to a confluence of factors, encompassing shifts in climatic patterns, increased water demand and the pollution of water resources [1,2].
Dyes possess significant economic worth and have found extensive application across various industrial domains. Nevertheless, the extensive prevalence of synthetic dyes in wastewater gives rise to environmental contamination, resulting in a multitude of adverse effects [3]. The prolonged exposure to elevated concentrations of textile dyestuff has been found to be associated with the development of carcinogenic, mutagenic and respiratory toxic effects, as well as other diverse adverse reactions [4]. The endeavor to remove dyes and other pollutants from aquatic environments has become a current challenge. Consequently, a range of approaches has been utilized to tackle these difficulties [5].
The Advanced Oxidation Process (AOP) and the emanating semiconductor-driven photocatalysis represent a viable technological approach for water treatment, in which photocatalysts are constructed to achieve the top remedy in sunlight capturing and the efficient degradation of water pollutants [6,7]. Along with heterogeneous photocatalysis, a semiconducting material generates an electron–hole pair when light with an appropriate wavelength hits its surface, moving valence band electrons to the conduction band. The photogenerated excitons react with the surficial-adsorbed water and oxygen molecules, forming a superoxide radical anion (O2•−) and hydroxyl radical (OH) that have the potency to decompose pollutants [8]. Utilizing photocatalysts such as ZrO2, TiO2, ZnO and SnO2, has garnered significant interest as a potential solution for mitigating environmental pollution [9].
The photocatalyst, ZnO, is a chemically stable, inexpensive, non-toxic and biocompatible semiconductor with physicochemical and antimicrobial properties [10]. It possesses a band gap of 3.37 eV, demonstrating notable sensitivity and luminescent efficiency. Additionally, it possesses a substantial exciton binding energy, rendering it appropriate for diverse applications [11]. Recently, researchers have employed a range of techniques, both physical and chemical, to synthesize ZnO photocatalysts. These methods encompass deposition [12], sol-gel [13], co-precipitation [14], solvothermal [15], wet-chemical co-precipitation [16] and biogenic synthesis [6,17].
The lack of adequate crystal growth control can cause photocatalyst agglomeration. To control the morphological characteristics and photoactivity of the photocatalyst, capping agents have been introduced during the synthetic process [18,19]. A capping agent, as a dispersing medium, provides a significant advantage and prevents nanoparticle aggregation. The final product’s morphology is largely determined by how stable its growth direction and crystal faces were during the manufacturing process [19]. In theory, capping agents can change crystal facets’ growth rates. The capping agent preferentially adsorbs on crystal planes during nanomaterial growth. This phenomenon will change crystal growth and surface durability.
Non-hazardous and eco-friendly biological methods involving plant extracts are used in the green synthesis of ZnO, with a wide range of morphologies and structures, and has garnered significant attention in the field of photocatalysis [20,21,22,23]. Extracts from diverse plants contain phytochemicals that act as stabilizers, caps and reducers [22,23]. However, to our knowledge, no study has examined the influence of Zn2+ sources during a biogenic-mediated pathway to synthesize ZnO nanoparticles with highly desirable solar-responsive catalytic properties. The current research aimed to synthesize ZnO nanoparticles through a biogenic solution combustion method, utilizing three different Zn2+ precursors (zinc nitrate, zinc chloride and zinc acetate). The objective was to investigate the impact of these precursors on the crystallinity, morphological features, surface characteristics, optical properties and photocatalytic properties of ZnO nanoparticles in the context of solar-driven degradation of methylene blue (MB) textile dyestuff. In addition, the ZnO powders underwent characterization using various analytical techniques, including XRD, FTIR, Raman, BET, SEM, TEM with EDS/elemental mapping and UV-Vis absorption/emission spectroscopic analyses.

2. Materials and Methods

2.1. Materials

Local market in Aljouf, City of Sakaka, Saudi Arabia, supplied fresh pomegranate fruits. Zinc acetate dihydrate (CH3COO)2Zn·2H2O, 98%), Zinc chloride anhydrous (ZnCl2), Zinc nitrate hexahydrate (Zn(NO3)2·6H2O), Methylene blue (MB) dyestuff, terephthalic acid, ethanol, sodium hydroxide and hydrochloric acid were provided from Sigma-Aldrich Chemical Co., St. Louis, MO, USA. Deionized (DI) water was utilized for all preparations.

2.2. Methods

2.2.1. Biogenesis-Mediated Synthesis of Zinc Oxide Nanoparticles (ZnO NPs) from Different Precursors

The preparation of pomegranate arils extract (PAE) was conducted according to the method described in the literature [8]. This extract was intended to serve as both the capping agent and to reduce fuel in the biogenic synthesis of zinc oxide nanoparticles (ZnO NPs). In a single vessel, 0.7 g of pomegranate arils extract (PAE) was introduced into cleaned crucibles with a capacity of approximately 45 mL. Subsequently, precisely 35.0 mL of deionized water was added to facilitate the dissolution of the extract. Following the thorough dissolution of the extract, 2.0 g of either Zn(NO3)2·6H2O or (CH3COO)2Zn·2H2O or anhydrous ZnCl2 was introduced and agitated until complete dissolution occurred. This process resulted in a slight darkening in the rosy coloration of the PAE solution, which serves as an indication of the interaction between Zn2+ ions and the PAE solution. The crucible, which held the solution mentioned earlier, was positioned inside a muffle furnace that had been preheated to a temperature of 500 °C. This initiated a combustion reaction of the solution, which lasted for duration of two hours. Upon completion of the combustion process, a notable residue with an intriguing ashy texture and a finely powdered form of ZnO is generated from the acetate and the nitrate precursors that symbolized Z-AC and Z-NIT, respectively. In contrast, utilizing the chloride precursor yields ZnO particulates of bulky texture, symbolized as Z-CL.

2.2.2. Spectrofluorimetric Monitoring of Solar-Driven Productivity of OH Radicals Due to Greenly Synthesized ZnO NPs

The photoluminescence (PL) technique was employed to compare the efficacy of the biogenically synthesized Z-NIT, Z-CL and Z-AC photocatalysts in generating hydroxyl radicals (OH) when exposed to solar illumination. In the standard protocol [24], a quantity of 15.0 mg of the synthesized materials was introduced into a solution containing 40 mL of terephthalic acid, TA (with a concentration of 0.005 mol L−1) and NaOH (0.01 mol L−1). The resulting mixture was then exposed to solar irradiation at intensity of 39 × 103 Lux, as measured by a PeakTech® multi-tester (Hamburg, Germany). After different illumination intervals, ~5 mL of the illuminated suspension is centrifuged and spectrofluorimetrically analyzed. The effectiveness of OH radicals in generating hydroxy terephthalic fluorophore is assessed by observing the distinct fluorescent signal emitted by the fluorophore at a wavelength of 426 nm, with an excitation wavelength of 315 nm.

2.2.3. Photocatalytic Experiments

The evaluation of the photocatalytic efficiency of the greenly synthesized Z-NIT, Z-CL and Z-AC was conducted by observing the degradation of MB dyestuff in an aqueous solution. The experimental solution, consisting of 50 mL, comprises MB at a concentration of 20 mg/L and 15 mg of the photocatalysts under investigation. The mixture was exposed to ultrasonication for duration of 5 min, followed by conducting MB adsorption studies over the developed Z-NIT, Z-CL and Z-AC in a dark environment. In this batch adsorption procedure, the concentration of MB was measured from the left over clear solution using a UV-vis spectrophotometer (Agilent, Santa Clara, CA, USA), where the residual MB absorbance remained constant and the adsorption equilibrium was reached in 45 min [25]. Subsequently, it was exposed to solar irradiation of 39 × 103 Lux. During the period of illumination, approximately 5 mL of the working solution was extracted and subjected to centrifugation in order to eliminate the presence of suspended catalyst nanoparticles, resulting in the formation of a clear solution of MB. Subsequently, the MB residue present in the transparent solution was measured quantitatively using spectrophotometric analysis, specifically by determining its absorption peak at a wavelength of λmax 663 nm. Subsequent investigation into the photodegradability of MB was conducted across various pH conditions (3.0, 5.0, 9.0 and 11.0), which were adjusted using appropriate quantities of 0.1 M HCl or NaOH solutions. Furthermore, a durability test was conducted using the previously outlined conditions. In this study, the ZnO nanoparticles that were used in the photodegradation cycle were collected and utilized in subsequent photodegradation runs.

2.3. Instruments

FTIR spectroscopy was conducted using the Shimadzu IR Tracer-100 FTIR instrument (Tokyo, Japan) within the spectral range of 400 to 4000 cm−1. The investigation of the surface morphology of the developed samples was conducted using a field emission scanning electron microscope (FESEM, Thermo Scientific Quattro ESEM, Thermo Fisher, Waltham, MA, USA). The crystal architecture was determined using X-ray diffraction (XRD) analysis. The XRD instrument used was the D/Max2500VB2 +/Pc model manufactured by Shimadzu Company in Kyoto, Japan. The X-ray radiation employed had a wavelength of 1.54056 Å and was generated at a current of 40 mA and voltage of 40 kV. Raman spectroscopic analysis was performed utilizing the HOUND UNCHAINED LABS spectrometer (Pleasanton, CA, USA). UV-visible absorption spectra were recorded using the Agilent Cary 60 spectrophotometer (Santa Clara, CA, USA). The nitrogen adsorption–desorption isotherms at 77 K were obtained using a NOVA 4200e Surface Area & Pore Size Analyzer manufactured by Quantachrome Instruments (Boynton Beach, FL, USA). The Brunauer–Emmett–Teller (BET) equation was employed for the purpose of estimating the specific surface area. The evaluation of pore size distributions was conducted using the Barrett–Joyner–Halenda (BJH) technique on the isothermic adsorption branch. Photoluminescence measurements were conducted on the Agilent fluorescence spectrophotometer to obtain UV-Vis data.

3. Results and Discussion

3.1. XRD Characteristics

The peaks observed in the spectra of the synthesized ZnO particles, using various zinc ion precursors, have been successfully matched with those of bulk ZnO ((JCPDS) Card No. 36–1451) [26]. This confirms that all the prepared samples exhibit a monocrystalline structure and possess a wurtzite hexagonal configuration [27] (Figure 1A). No additional peaks associated with impurities were observed in the spectra, indicating that the synthesized ZnO samples are of high purity [28,29]. According to Rafaja et al. [30], the presence of distinct and sharp diffraction peaks suggests that the ZnO nanoparticles exhibited a highly crystalline structure. The observed peaks at 2θ = 31.8°, 34.6°, 36.4°, 47.6°, 56.8°, 63°, 66.6°, 68.2°, 69.2°, 72.8° and 77.2° can be attributed to the (100), (002), (101), (102), (110), (103), (200), (112), (201), (202) and (004) (Miller indices) planes, respectively. The Debye–Scherrer equation (Equation (1)) was utilized to assess the average crystallite size of the ZnO powders.
D = 0.89 λ/β cosθ
In this context, the symbol λ represents the X-ray wavelength, specifically denoted as λ = 1.5406 Å. The value 0.89 corresponds to Scherrer’s constant. The symbol β is used to represent the Full Width at Half Maximum (FWHM) of the peak associated with the (101) plane. Lastly, θ denotes Bragg’s angle.
Figure 1. X-ray diffraction patterns (A); Raman spectra (B); and FTIR spectra (C) of the developed Z-AC, Z-CL and Z-NIT.
Ceramics 07 00072 g001
The XRD diffractograms of Z-AC and Z-NIT exhibit no discernible alterations in the peak positions. Nevertheless, it is worth noting that the diffraction peaks associated with Z-CL exhibit a slight downward shift in “θ” by 0.2 degrees. Furthermore, variations in sample intensity diversification can be observed, which may have an impact on the full width at half maximum (FWHM) and subsequently lead to variations in crystallite size. The (101) plane displayed the most pronounced relative intensity across the entire X-ray diffraction (XRD) pattern. This observation indicates the presence of anisotropic growth and the preferred orientation of the crystallites. It is commonly observed that wurtzite structured materials exhibit epitaxial growth along the C-axis of the (001) direction [31]. Based on the findings presented in Table 1, it can be observed that Z-AC exhibits the lowest average crystallite size (15.54 nm) among the generated samples. The peak broadening of Z-AC and Z-NIT compared to Z-CL indicates nano-crystallinity in the ZnO NPs derived from acetate and nitrate precursors rather than the chloride source. Additionally, Z-AC demonstrates the highest level of crystallinity [32].

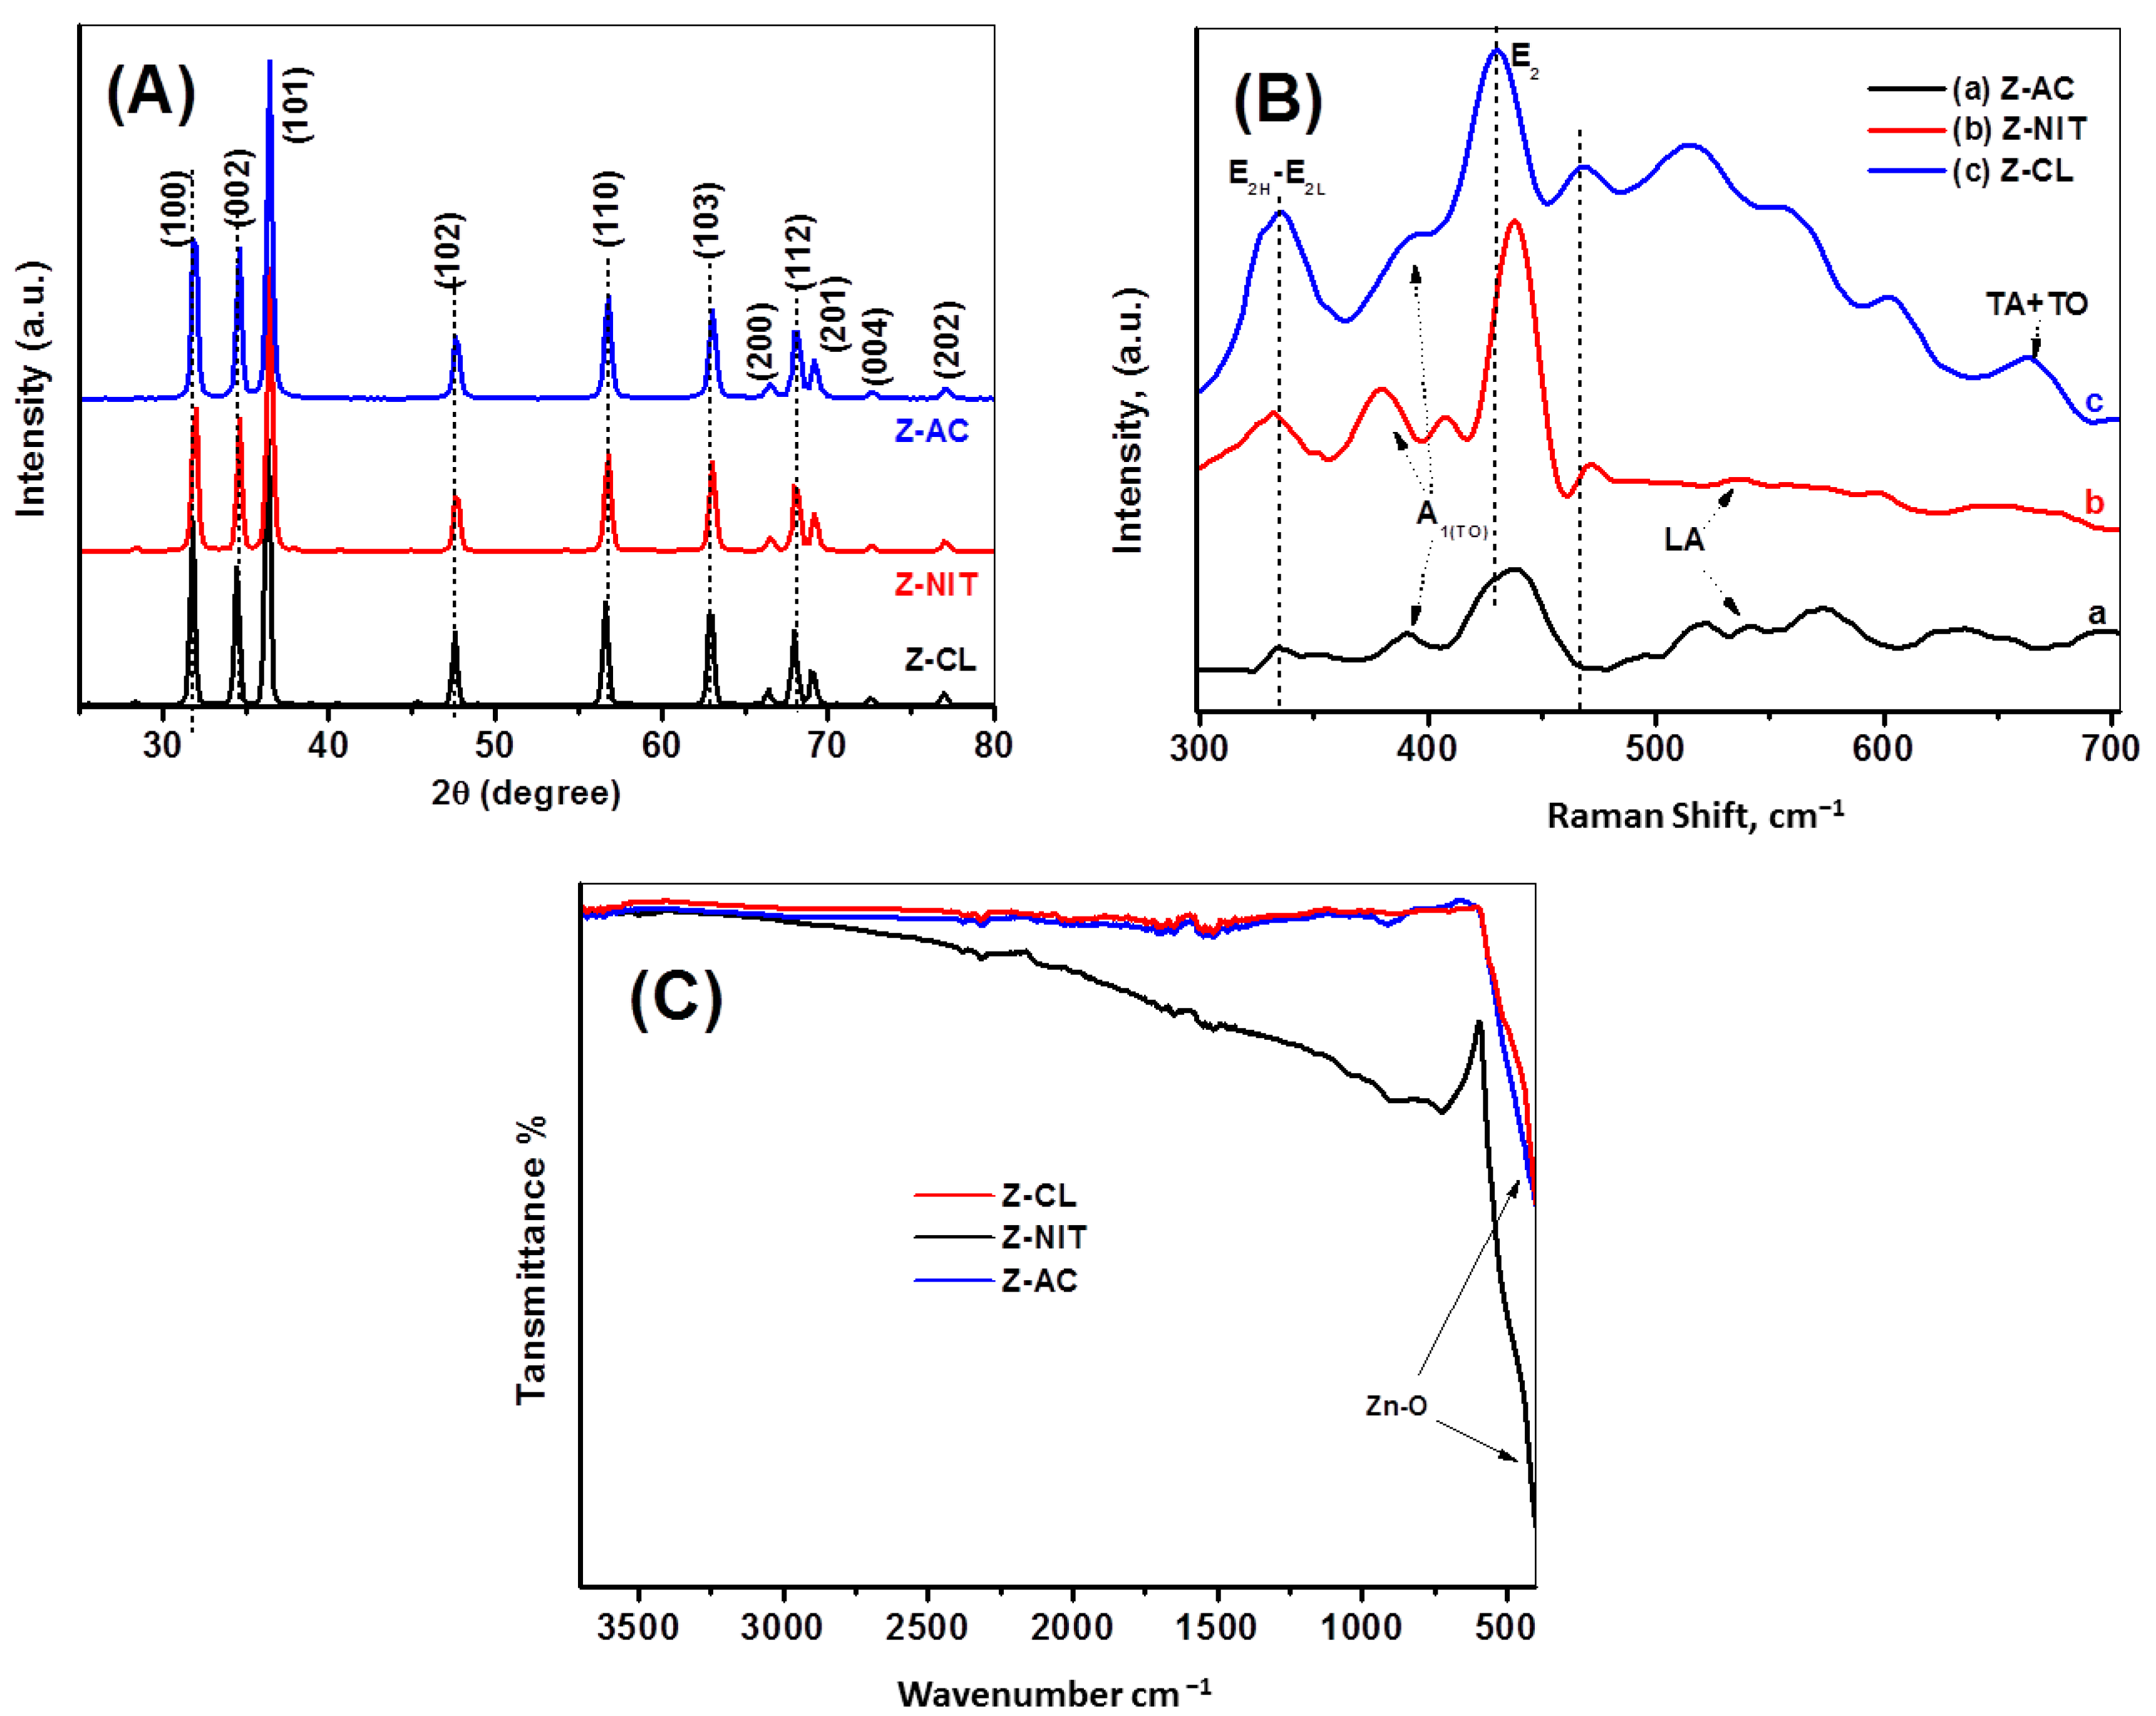
3.2. Raman Spectroscopic Analysis

The Raman spectra acquired from the synthesized ZnO powders are depicted in Figure 1B. The Raman characteristics observed in ZnO powder can be attributed to the Raman active modes present in the ZnO wurtzite crystal [33]. The most prominent peak in the Raman spectrum of ZnO powder is observed at 438 cm−1 (E2H mode), which is attributed to the vibrational motion of oxygen [33]. The pronounced asymmetry of the object is linked to both lattice disorder and anharmonic phonon–phonon interactions [27]. In contrast to E2 phonons, polar phonons A1 and E1 exhibit a splitting phenomenon, resulting in the emergence of both transverse optical (TO) and longitudinal optical (LO) phonons. Therefore, the observed sharp peak can be identified as a distinctive Raman active peak specific to the wurtzite hexagonal phase of ZnO, as stated in reference [34]. It is worth noting that the E1(L) mode observed at a wavenumber of 597 cm−1 exhibits an increase in background intensity, which can be attributed to second-order Raman scattering. The presence of impurities and/or defects has a significant impact on the E1(L) mode [33]. The second-order mode detected in the low-wavenumber range, specifically at 335 cm−1, is attributed to the energy difference between the E2H and E2L states [27]. The Raman modes with A1 symmetry in the intermediate region of the nonactivated ZnO powder spectrum are generally weak and inconspicuous, with the exception of the mode at 538 cm−1. Furthermore, the occurrence of a combination of acoustical and optical modes is observed at a wavenumber of 660 cm−1. In contrast, the peak areas for Z-AC exhibit significant attenuation and displacement. These findings suggest that the presence of oxygen vacancies and the resulting intrinsic defective structure play a role in reducing the vibrational frequency associated with oxygen atoms. In addition, the observed red shifting may be attributed to variations in mass and a potential decrease in the oxygen average atomic mass caused by the identified oxygen defects [8].

3.3. FTIR Analysis

On the FTIR spectral analysis shown in Figure 1C, the Z-AC, Z-CL and Z-NIT depict a signal detected at 438 cm−1 due to the vibration of Zn–O [35]. Otherwise, very weak signals allocated at 724 cm−1, 890 cm−1, 1517 cm−1, 2314 cm−1 and 3674 cm−1, which could be assigned to Zn–OH vibrations [36], C=O stretching [37], carbon dioxide O=C=O stretching, the Inter-hydrogen bond due to water molecules and a hydroxyl group via possible minor humidity, respectively. These findings are in agreement with previous reports focusing on ZnO [38].

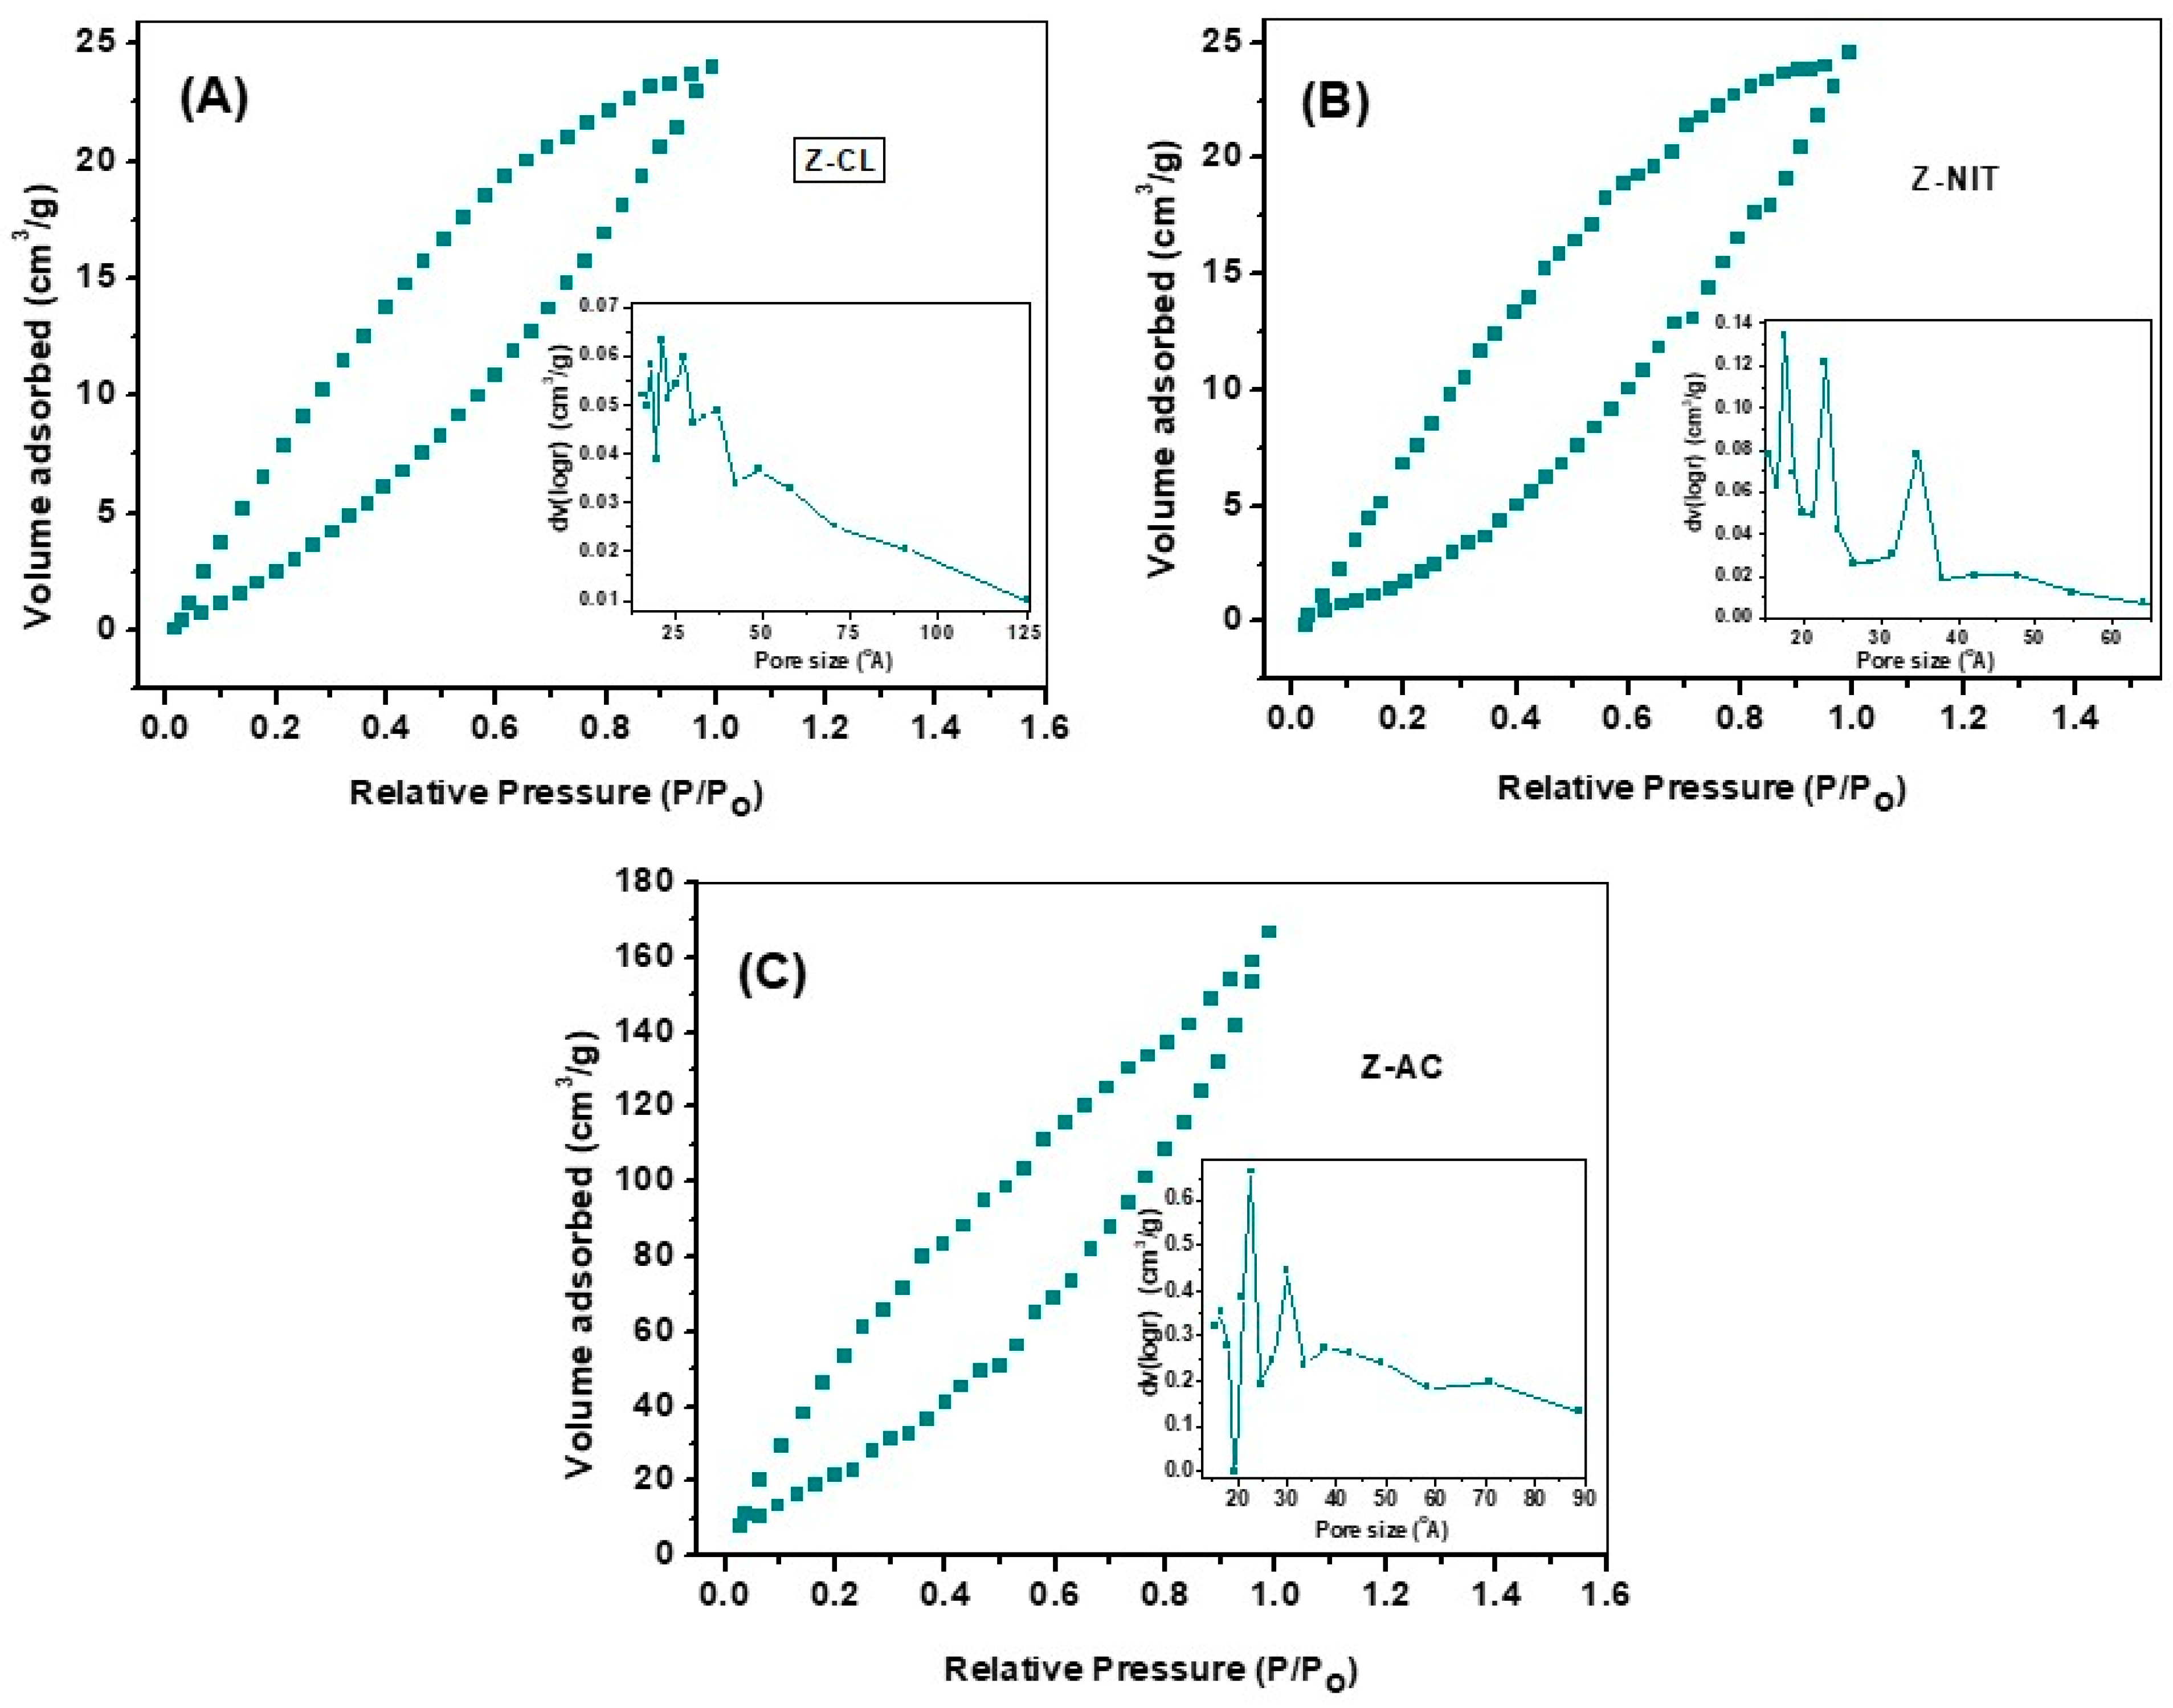
3.4. BET Surface Analysis

To thoroughly investigate the impact of Zn2+ precursors on the structural and surface characteristics of the synthesized materials through a biogenic synthetic route, the N2 adsorption–desorption analysis as well as measurements of pore volume and pore size were employed. Figure 2 shows the isotherm profiles for the developed Z-CL, Z-NIT and Z-AC NPs within an inset depicts the porosity distribution. All samples display Type IV adsorption–desorption isotherms and H4 type hysteresis loops. Table 1 presents the recorded values of surface area, pore size and pore volume for the Z-AC, Z-CL and Z-NIT samples that were developed. As evidenced, it is apparent that all samples exhibit characteristics of mesoporous structures. It is worth noting that the structural parameters are influenced by the choice of the Zn2+ precursor. In comparing results, the surface features of Z-AC show a 1.35 and 8.67 times increase in surface area compared to Z-NIT and Z-CL, respectively. Moreover, the pore size of Z-AC is 1.48 greater than Z-CL catalyst. Accordingly, the acetate and nitrate precursors of Zn2+ is promising over the chloride ones for developing ZnO NPs of high surface area, pore size and pore volume via the proposed biogenic combustion route. The photocatalyst of high surface area implies the allowance of more active sorption sites.

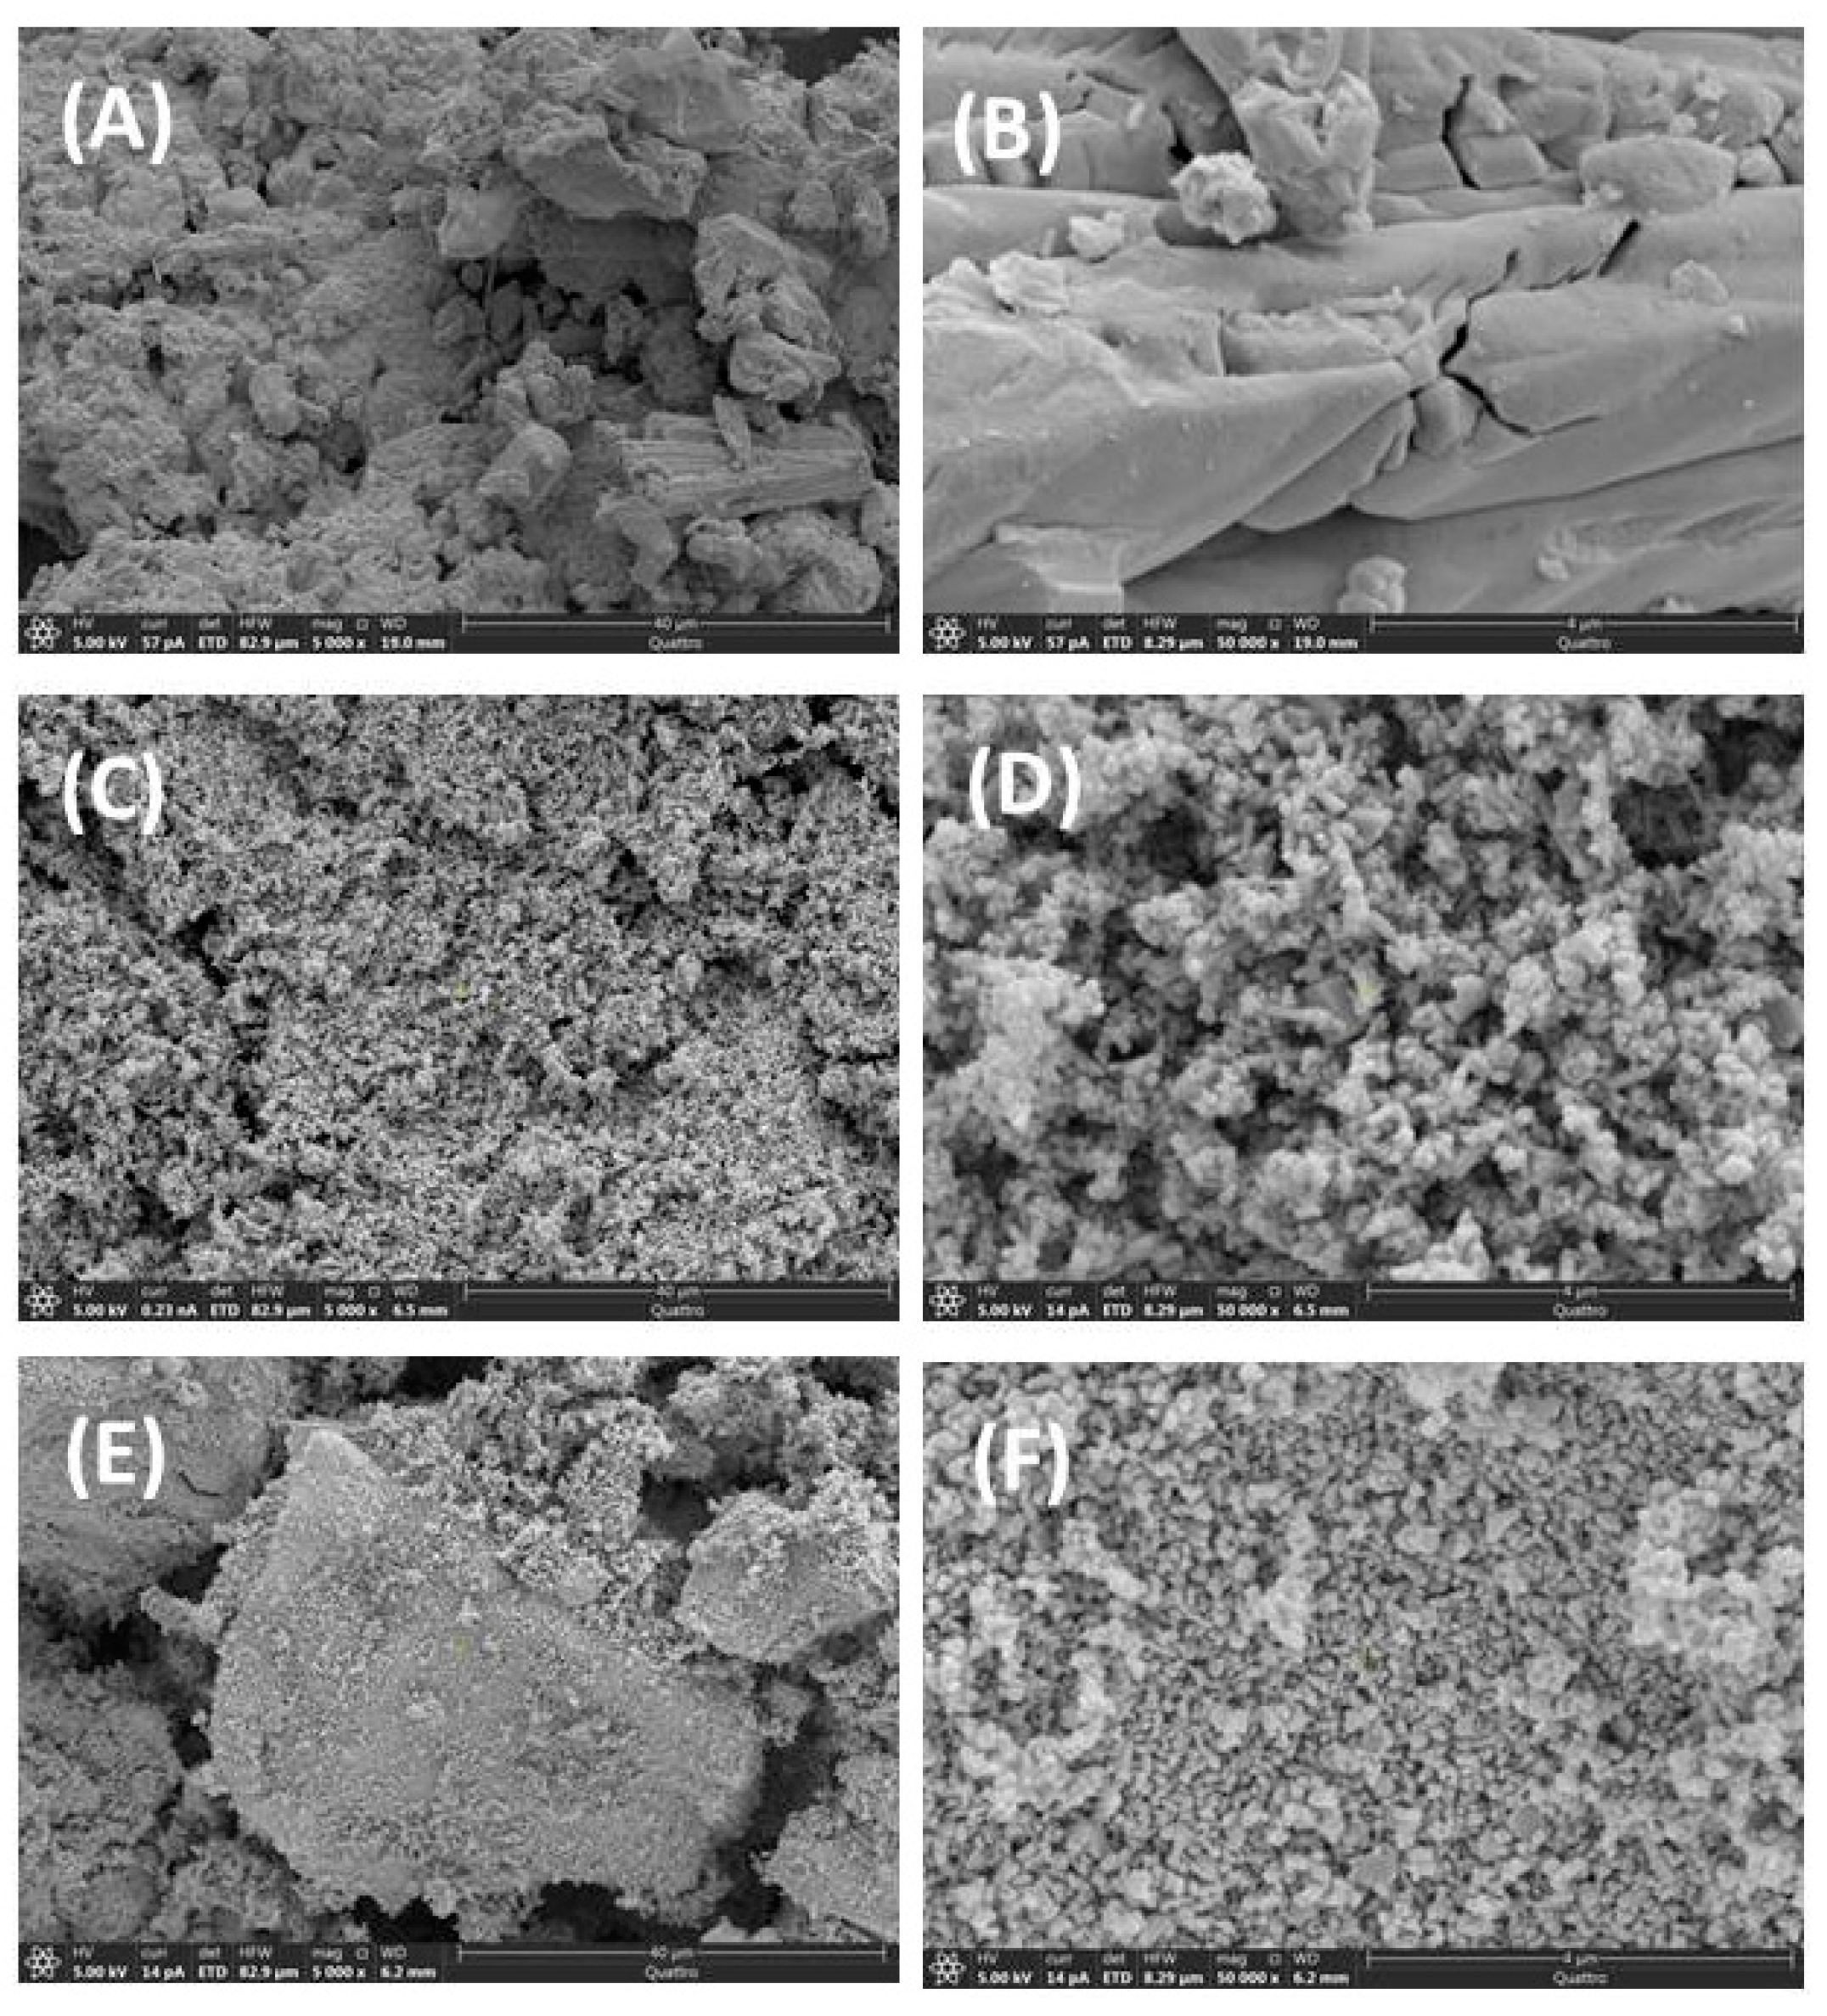
3.5. SEM and TEM Morphological Features

SEM and TEM imaging were used to determine the morphological properties of the developed ZnO NPs. The Z-CL sample exhibits a topographical assemblage to form bulk crystals, as shown in Figure 3A,B. Figure 3C–F show SEM imaging of the Z-AC and Z-NIT, where the morphological topography shows irregular particulates, mostly nanosphere edges that are efficiently distributed with minor agglomeration, with some defective positions. The morphology and size of the prepared photocatalyst were also addressed using TEM. The particle size of the prepared Z-AC was calculated using the photocatalyst TEM image shown in Figure 4A. It is clear that Z-AC formed well-defined, microrod-like structures with hexagonal shapes, confirming the XRD results, as well as irregular-shaped nanoparticles with rounded edges and an average diameter of about 13.2 nm, which is closer to the average crystallite size from XRD analysis. The particle size distribution are illustrated in Figure 4B, while the image of HRTEM in Figure 4C revealed that the reflection from the (100) plane in the ZnO photocatalyst has a spacing of 0.24 nm [39]. Furthermore, the selected area electron diffraction (SAED) pattern (Figure 4D) revealed diffraction rings associated with the polycrystalline nature of the prepared ZnO photocatalyst [40]. Particle homogeneity is shown by the TEM image of the mapping area (Figure 4E,F) and elemental color mapping of the Z-AC sample. This confirms a highly pure ZnO by showing that the zinc and oxygen are both evenly distributed. This is supported by the elemental composition of Z-AC NPs, which was determined using energy-dispersive X-ray spectroscopy (EDX). The Zn and O elements are confirmed by the EDS spectrum of the Z-AC photocatalyst in Figure 4G [41].

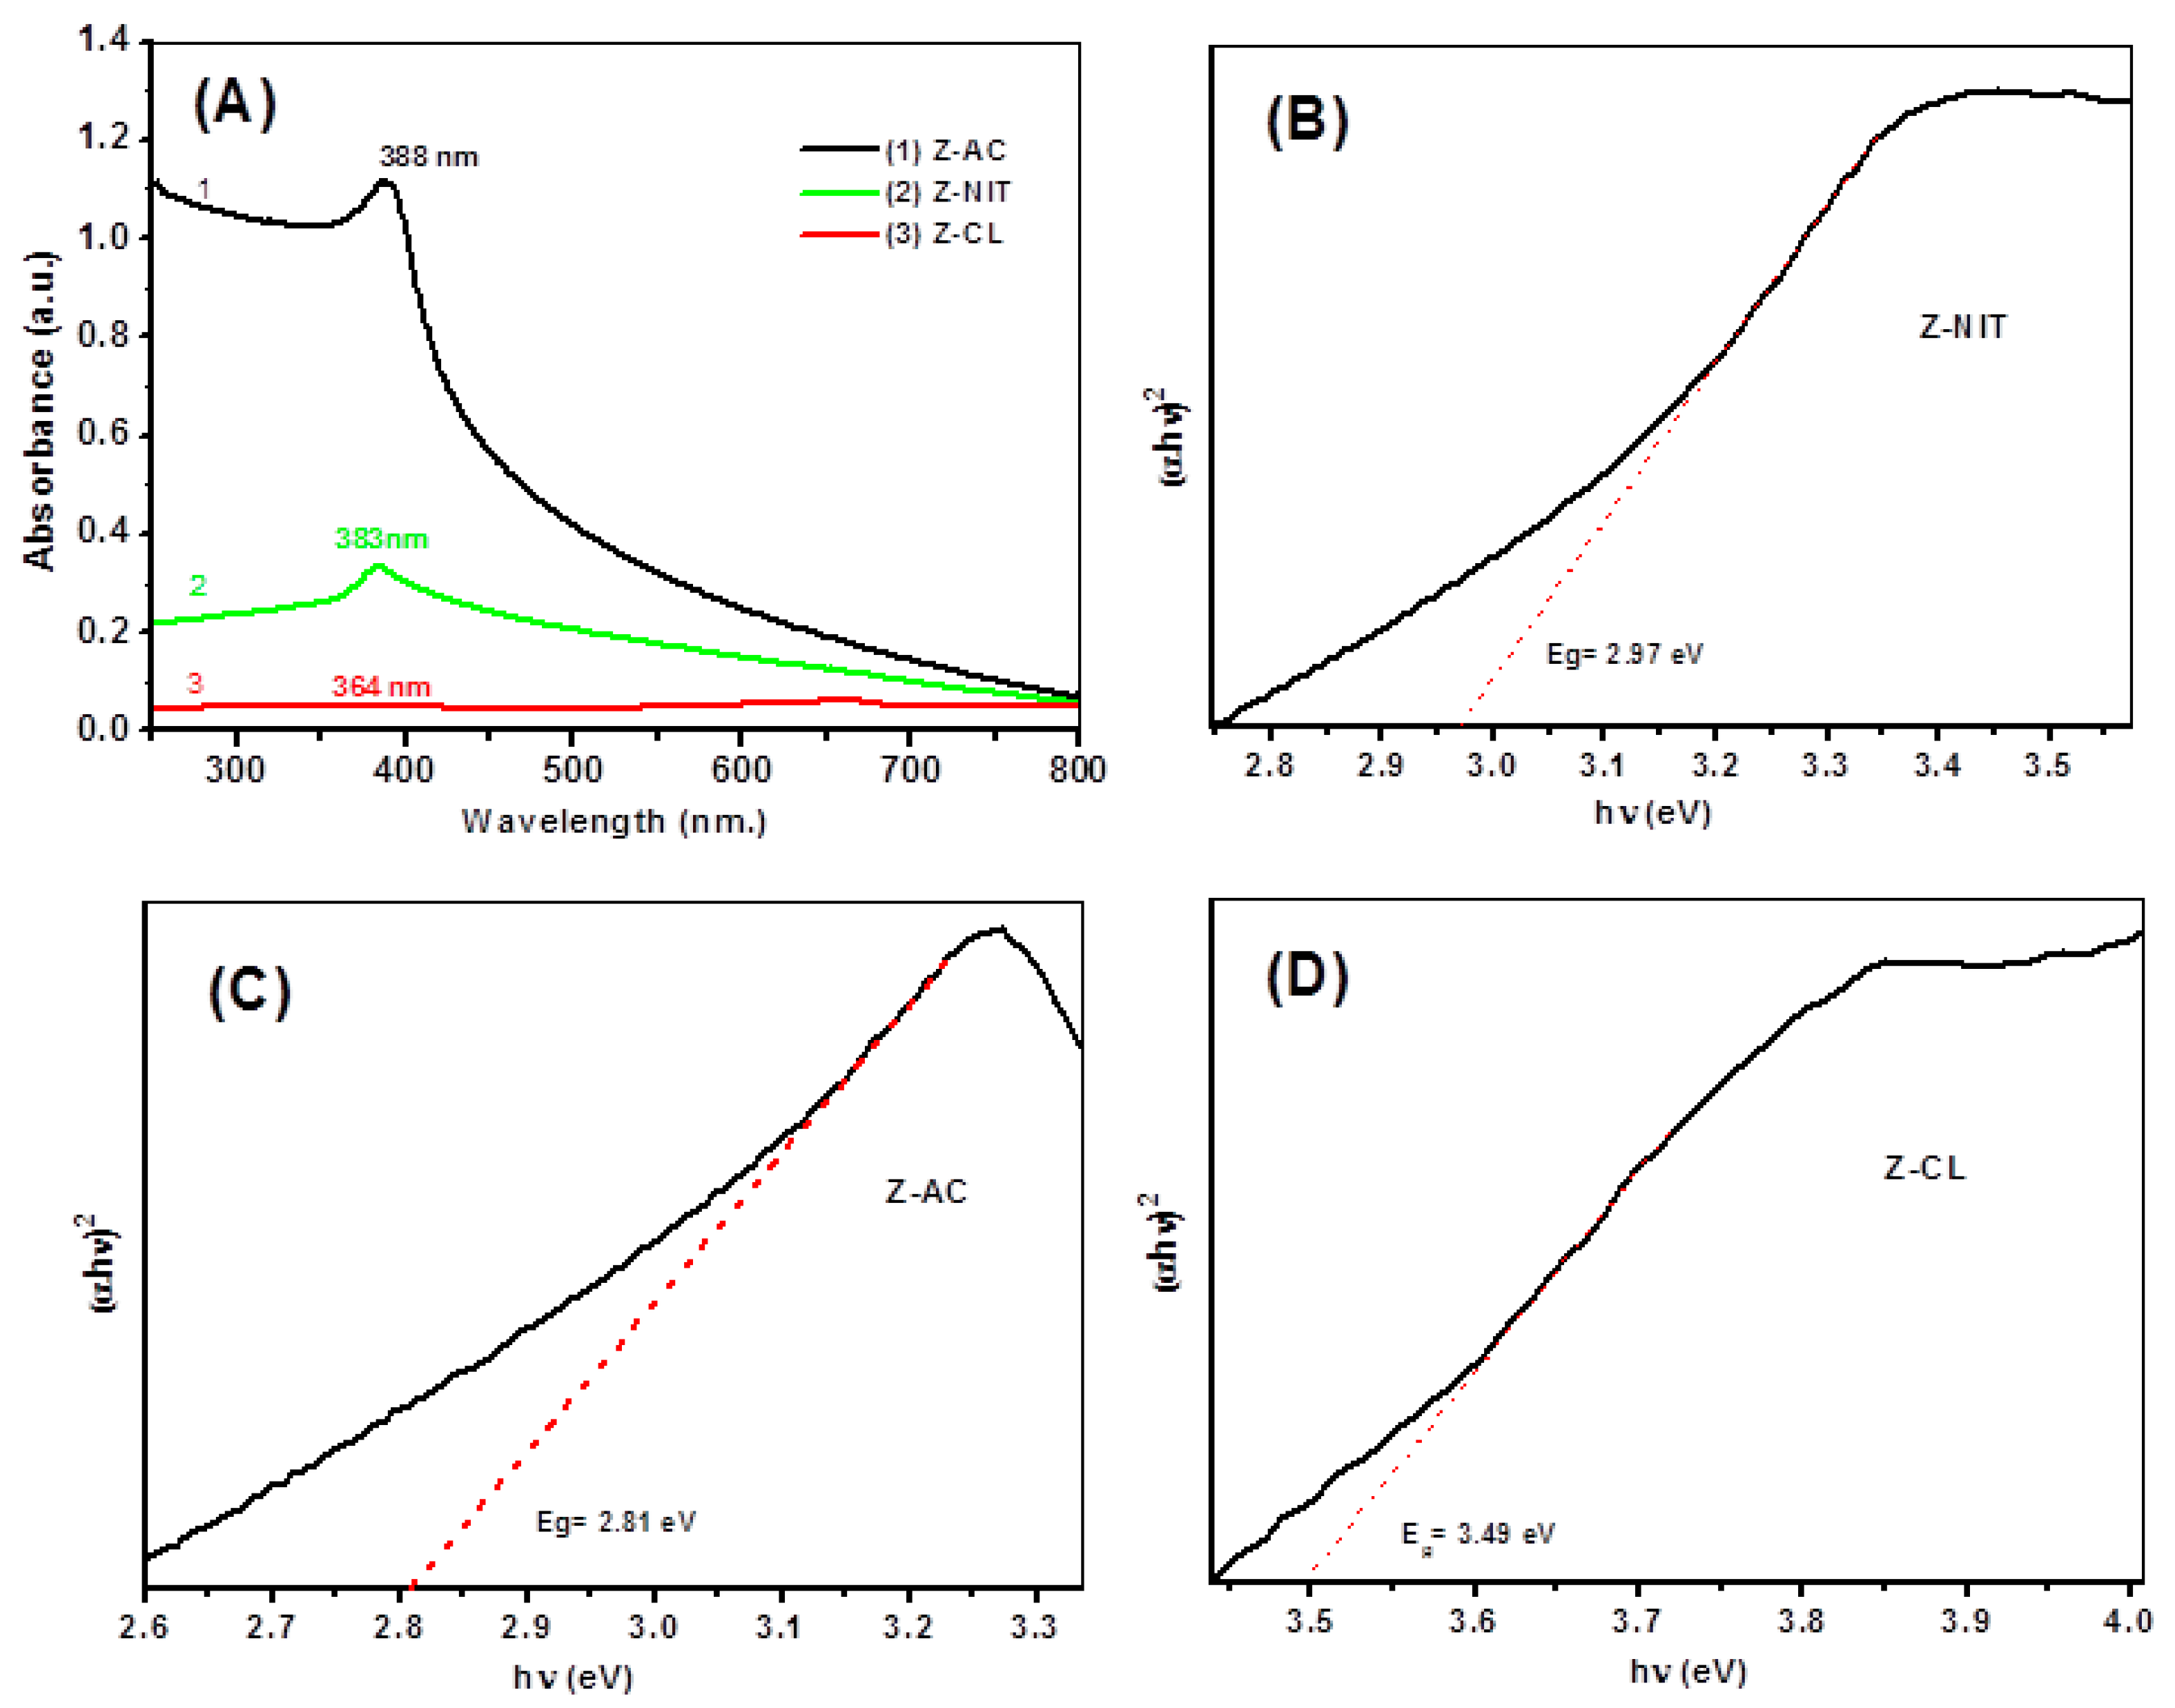
3.6. UV-Vis Absorption Spectroscopy and Band Gap Estimation

In theory, the prepared photocatalysts’ photo-absorption is a major factor in their effectiveness. The optical characteristics of a suspension from the developed ZnO NPs were studied by UV-vis absorption spectrometry, where the electronic spectroscopy could address the wavelength corresponding to the surface Plasmon resonance. The recorded UV-vis spectra in Figure 5A exhibit excitonic absorption peaks ranging from 363 to 388 nm, which are indicative of the wurtzite crystal phase of ZnO. The samples analyzed include Z-AC, Z-NIT and Z-CL. The absorption peak of ZnO can be attributed to the movement of excited electrons from the valence band to the conduction band, which is facilitated by the inherent band gap (O2p → Zn3d) [8]. According to the data presented in Figure 4A, the absorption spectra of both Z-AC and Z-NIT exhibit a red shift in comparison to that of Z-CL. Additionally, there is a notable enhancement in the absorption of visible photons.
Otherwise, Figure 5B–D, shows the plotting of Tauc’s equation to estimate the band gap of the greenly developed samples:
(αhν) = A (hvEg)1/2
where “α” represents the coefficient of extinction, “h” denotes the Planck constant, “v” signifies the frequency of vibration, “A” represents the constant of absorption and Eg denotes the energy gap in eV. The energy band gaps (Eg) for Z-AC, Z-NIT and Z-CL were determined to be 2.81 eV, 2.97 eV and 3.49 eV, respectively. These values were obtained through the linear extrapolation of (αhν)2 versus ().
The lowering of band gap energies of the developed ZnO NPs could be ascribed due to a variety of defect states (donor defects: Zni••, Zni, Znix, Vo•• and Vo; acceptor defects: Zn″ and Zn′); the most common ionic defect types affecting ZnO’s excitation level are oxygen vacancies and Zn interstitials [42]. Furthermore, a variety of reports contend that the band gap values of ZnO nanoparticles were influenced by variables like the precursors, shape of nanoparticles, temperature of calcination and induced defects (the extent of open lattice construction) [43,44,45].

3.7. Photoluminescence Characteristics
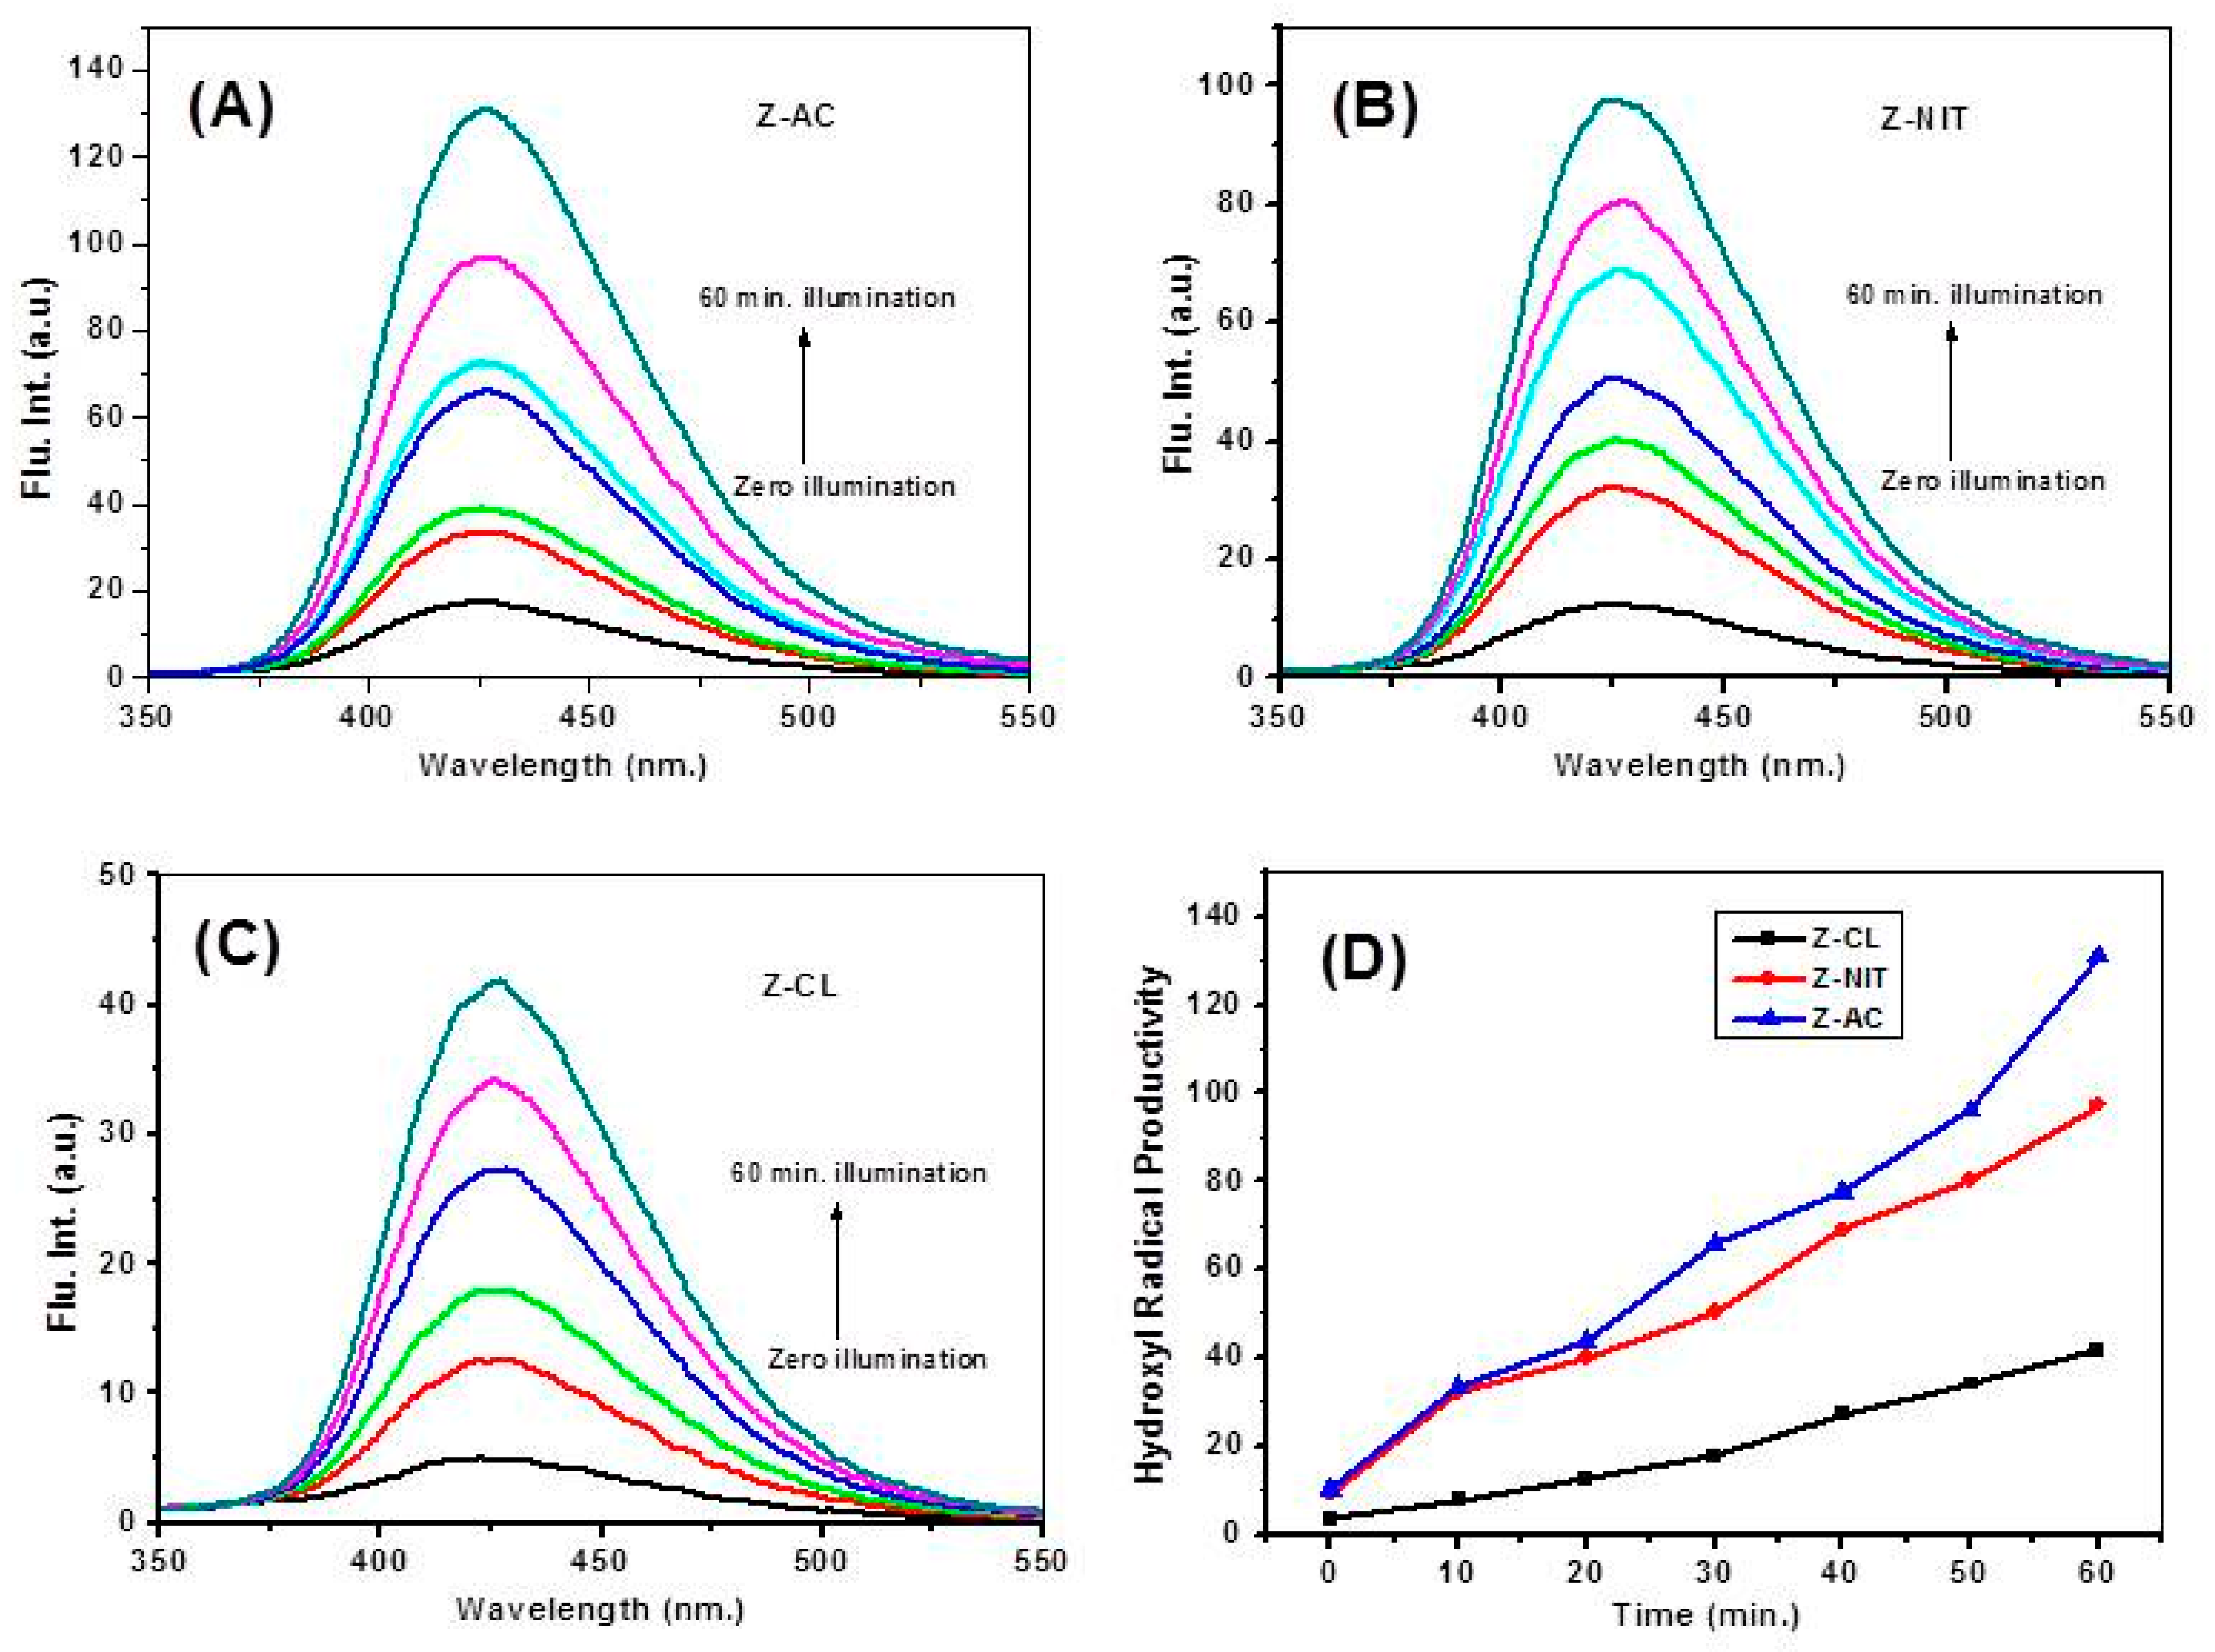
The photoluminescence (PL) method was employed to elucidate the structural properties and defects present in the semiconductors. Typically, the prepared photocatalysts are anticipated to exhibit excitonic and trapped emission [46]. The former exhibits a sharp profile and is detectable in close proximity to the absorption edge, whereas the latter displays a broader profile and can be detected at longer wavelengths. The emissions observed in the visible regions can be attributed to the presence of defects in the developed photocatalysts [19]. Figure 6 displays the photoluminescence (PL) spectra obtained at room temperature using an excitation wavelength of 325 nm for a suspension from the developed Z-AC, Z-CL and Z-NIT samples. When examining Z-CL and Z-NIT, distinct peaks are, respectively, observed at 387 nm and 390 nm in the ultraviolet (UV) region. Additionally, two weaker bands are observed within the wavelength range of 400 to 470 nm. In the Z-CL (spectrum b), an extended emission band is observed in the visible region, specifically at a wavelength of 485 nm. This emission is attributed to the process of radiative recombination, where displaced electrons combine with holes in the oxygen interstitials (Oi) situated beneath the conduction band [47,48]. The broad band signal exhibits significant attenuation in both Z-AC (spectrum a) and Z-NIT (spectrum c) samples. This may pertain to the existence of imperfections observed on the surfaces of Z-CL nanoparticles and the formation of bound electron–hole pairs. Furthermore, it was observed that the Z-CL sample (spectrum b) exhibited the highest intensity of photoluminescence (PL), whereas the Z-AC sample (spectrum a) displayed the lowest intensity of PL. The photoluminescence (PL) intensity serves as a measure of the effectiveness in separating the photogenerated charge carriers [49]. The significant lowering in the peak in the visible region for Z-AC and Z-NIT when compared with Z-CL could be indicative to the presence of higher number of defect sites over Z-AC and Z-NIT, inferring a higher amount of charge carriers than Z-CL [50]. There exists a strong correlation between the lowest photoluminescence (PL) intensity and the highest rate of separation of charge carriers. This suggests that there will likely be a significant increase in the duration of the photogenerated charge carriers in Z-AC and Z-NIT nanoparticles. The expected outcome of these findings is the attainment of the highest expected photodegradation efficiency, as indicated by previous studies [41]. Hence, it is anticipated that the photocatalysts developed will exhibit the highest efficiency in the following order: Z-AC > Z-NIT > Z-CL. This expectation is based on the observed photoluminescence (PL) intensity of the respective samples.

3.8. Comparison of Hydroxyl Radicals (OH) Productivity Using Photoluminescence

In the context of a semiconductor photo-irradiated system, hydroxyl radicals (OH) are recognized as the predominant and highly reactive oxidizing species involved in the photodegradation of pollutants. The samples of Z-AC, Z-CL and Z-NIT, which were synthesized in a green manner, were analyzed to determine their ability to generate hydroxyl radicals (OH) when exposed to solar illumination. In this study, the researchers utilized the highly sensitive photoluminescence (PL) labeling technique to measure the productivity of hydroxyl radicals (OH). The probe terephthalic acid (TA) was employed for this purpose [24]. In the presence of a sodium hydroxide (NaOH) solution, hydroxyl radicals (OH) undergo interaction with TA, resulting in the formation of a hydroxy-TA fluorophore. This fluorophore exhibits a distinct fluorescent signal with a wavelength of approximately 426 nm. There is a positive correlation between the fluorescence intensity and the concentration of OH radicals. Figure 7A–C depicts the fluorescence spectra obtained during temporal solar illumination (up to 60 min) for an alkaline solution containing consistent quantities of TA, as well as the prepared Z-AC, Z-NIT and Z-CL. The observed fluorescence intensity of the hydroxylated-TA resulting from the Z-AC is approximately three times greater than that obtained from the Z-CL sample and 1.4 times greater than the corresponding Z-NIT. This observation strongly suggests that the order of higher productivity of OH radicals upon solar irradiation is Z-AC > Z-NIT > Z-CL, as shown in Figure 6D. Accordingly, Z-AC and Z-NIT with lower extent seem to be the best in OH productivity, revealing that the acetate precursor is the best to biogenically synthesize efficient ZnO photocatalysts when engaged in photodegrading hazmat followed by the nitrate precursor. On the other hand, the chloride precursor is not recommended to synthesize ZnO for photocatalyic purposes.
The aforementioned results concluded from analyses of Raman, XRD, BET, SEM, TEM and UV-vis spectrophotometry/fluorometry provide insights into the following aspects: (i) The ZnO nanoparticles synthesized using green methods from acetate and nitrate precursors exhibit defects, resulting in smaller particle size, larger pore size and increased surface area. These nanoparticles show high sensitivity to visible light. (ii) The observed decrease in band gap is likely caused by the presence of oxygen vacancies as defect sites. (iii) The oxygen vacancies effectively capture and transport the charge carriers generated by light, preventing their recombination. (iv) Consequently, the production of highly active oxidative species, like OH radicals, is enhanced, enabling efficient degradation of environmental pollutants under solar illumination.

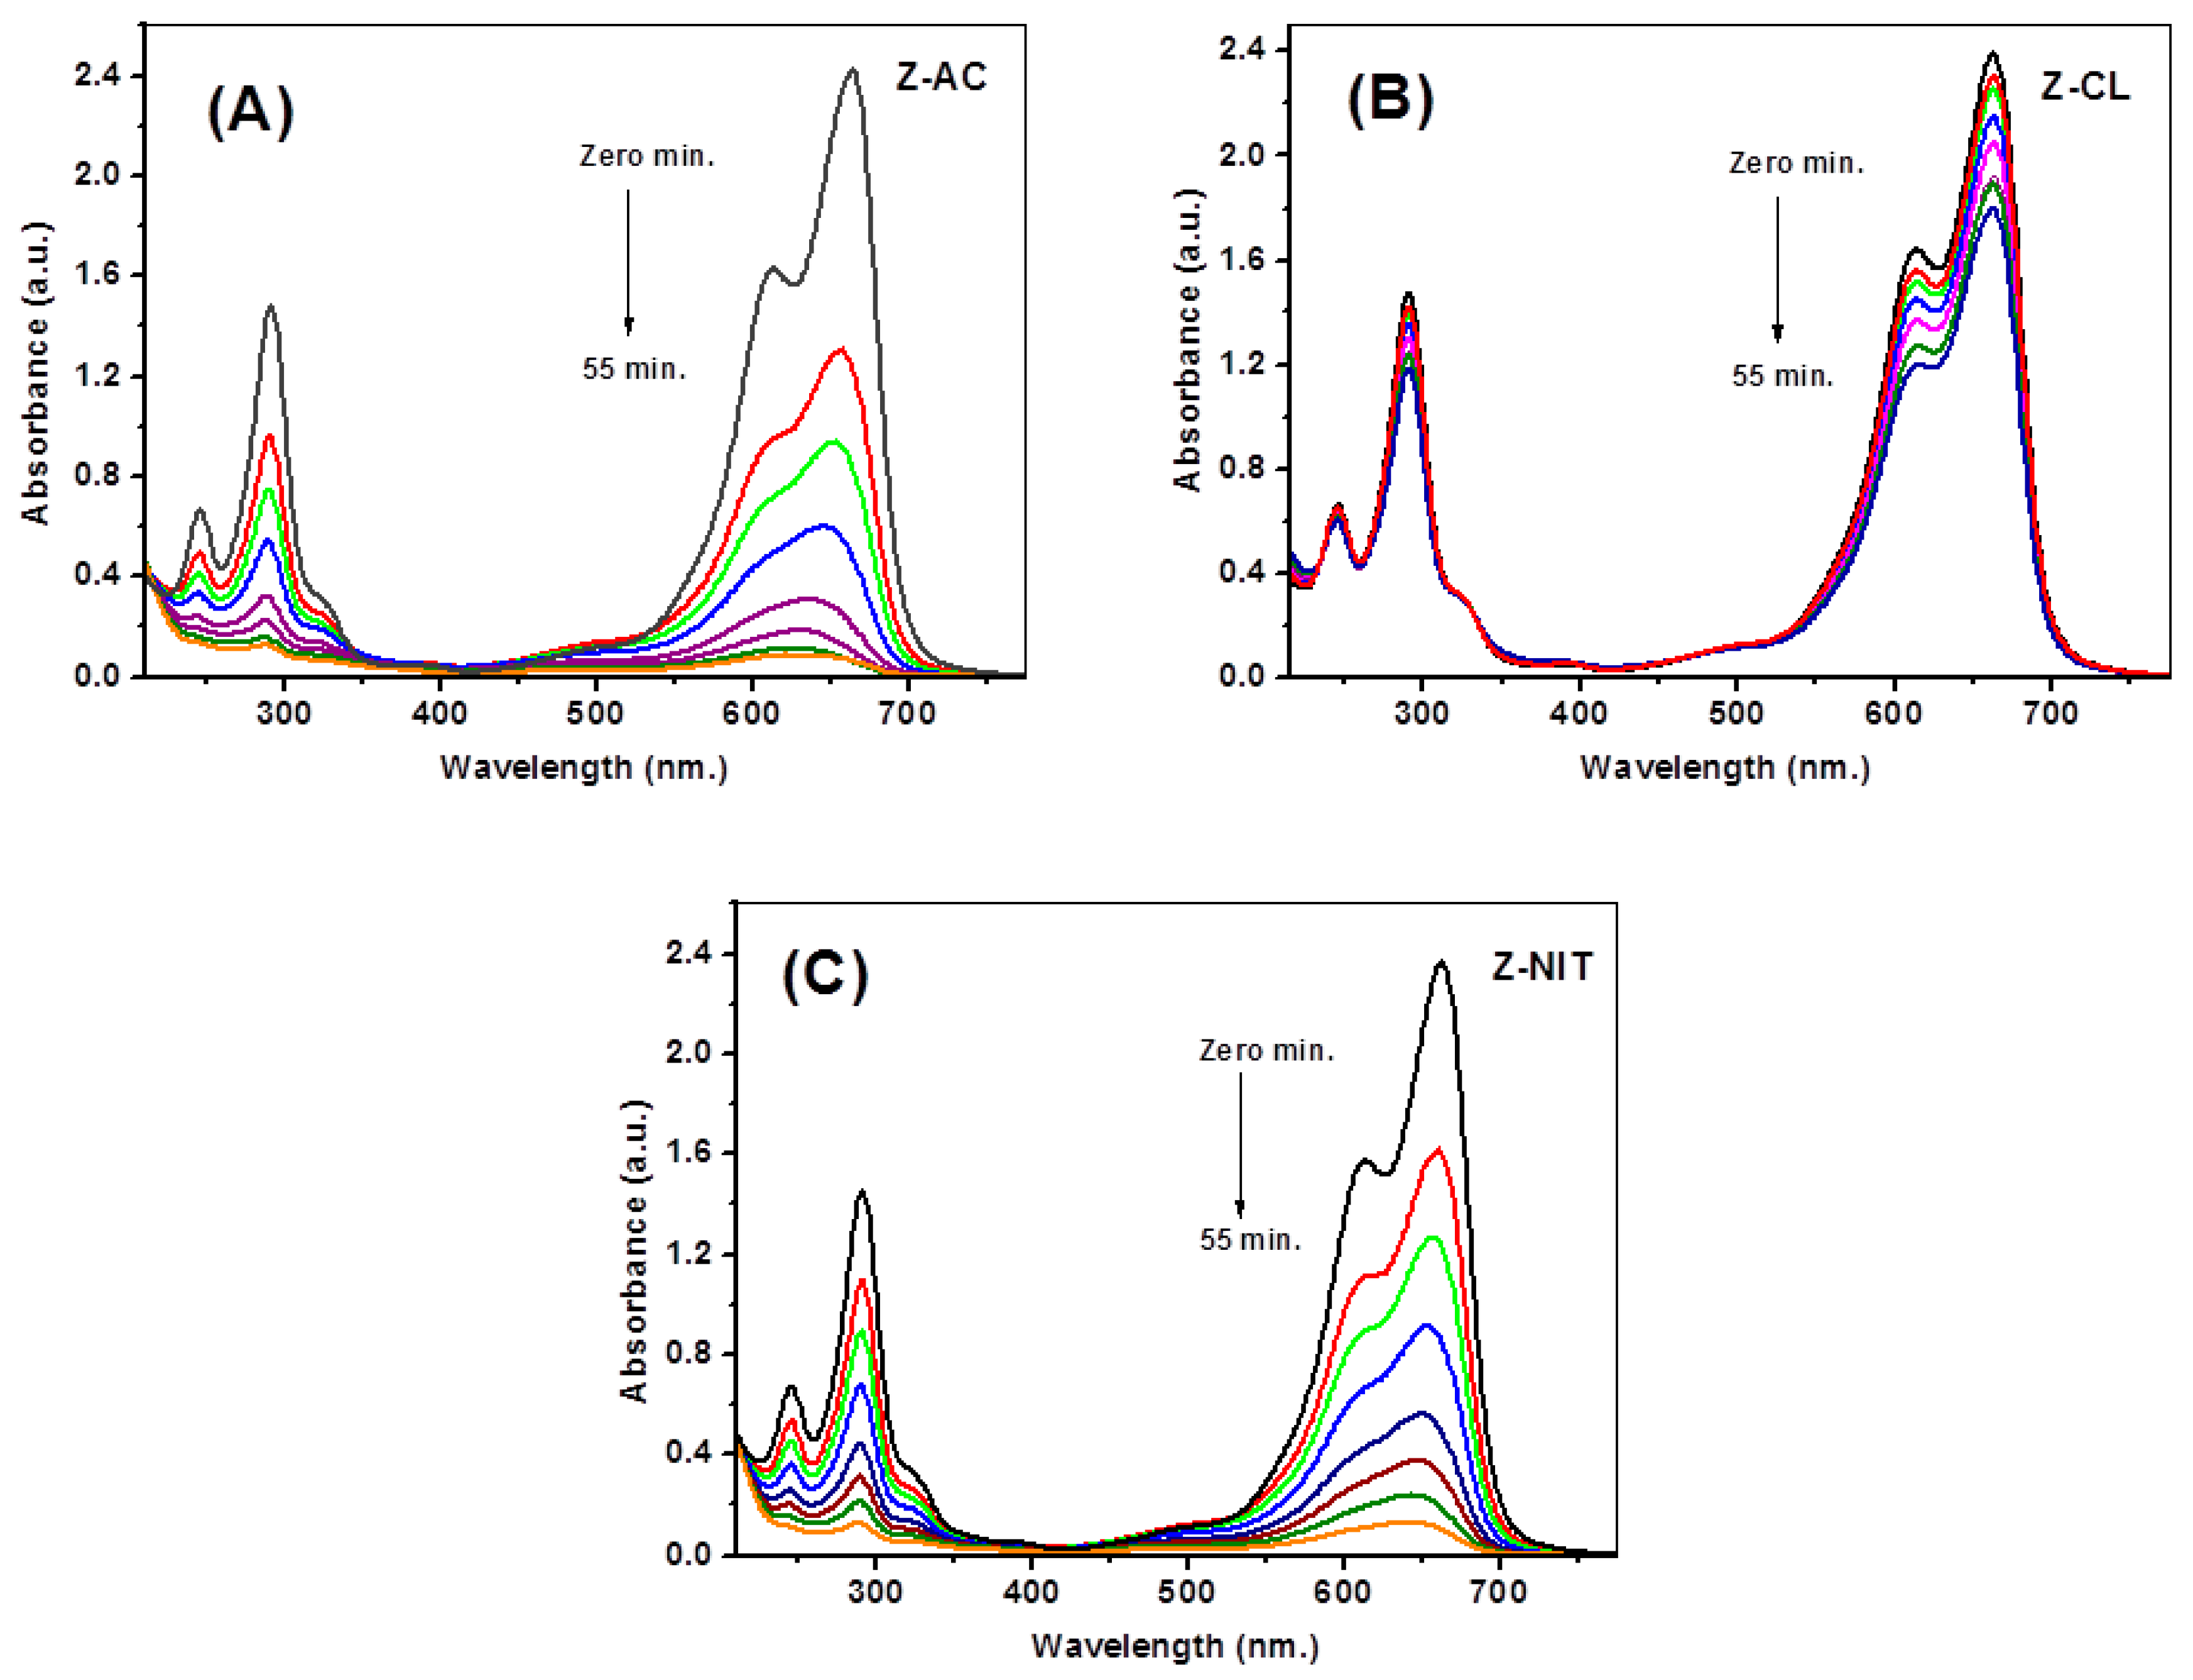
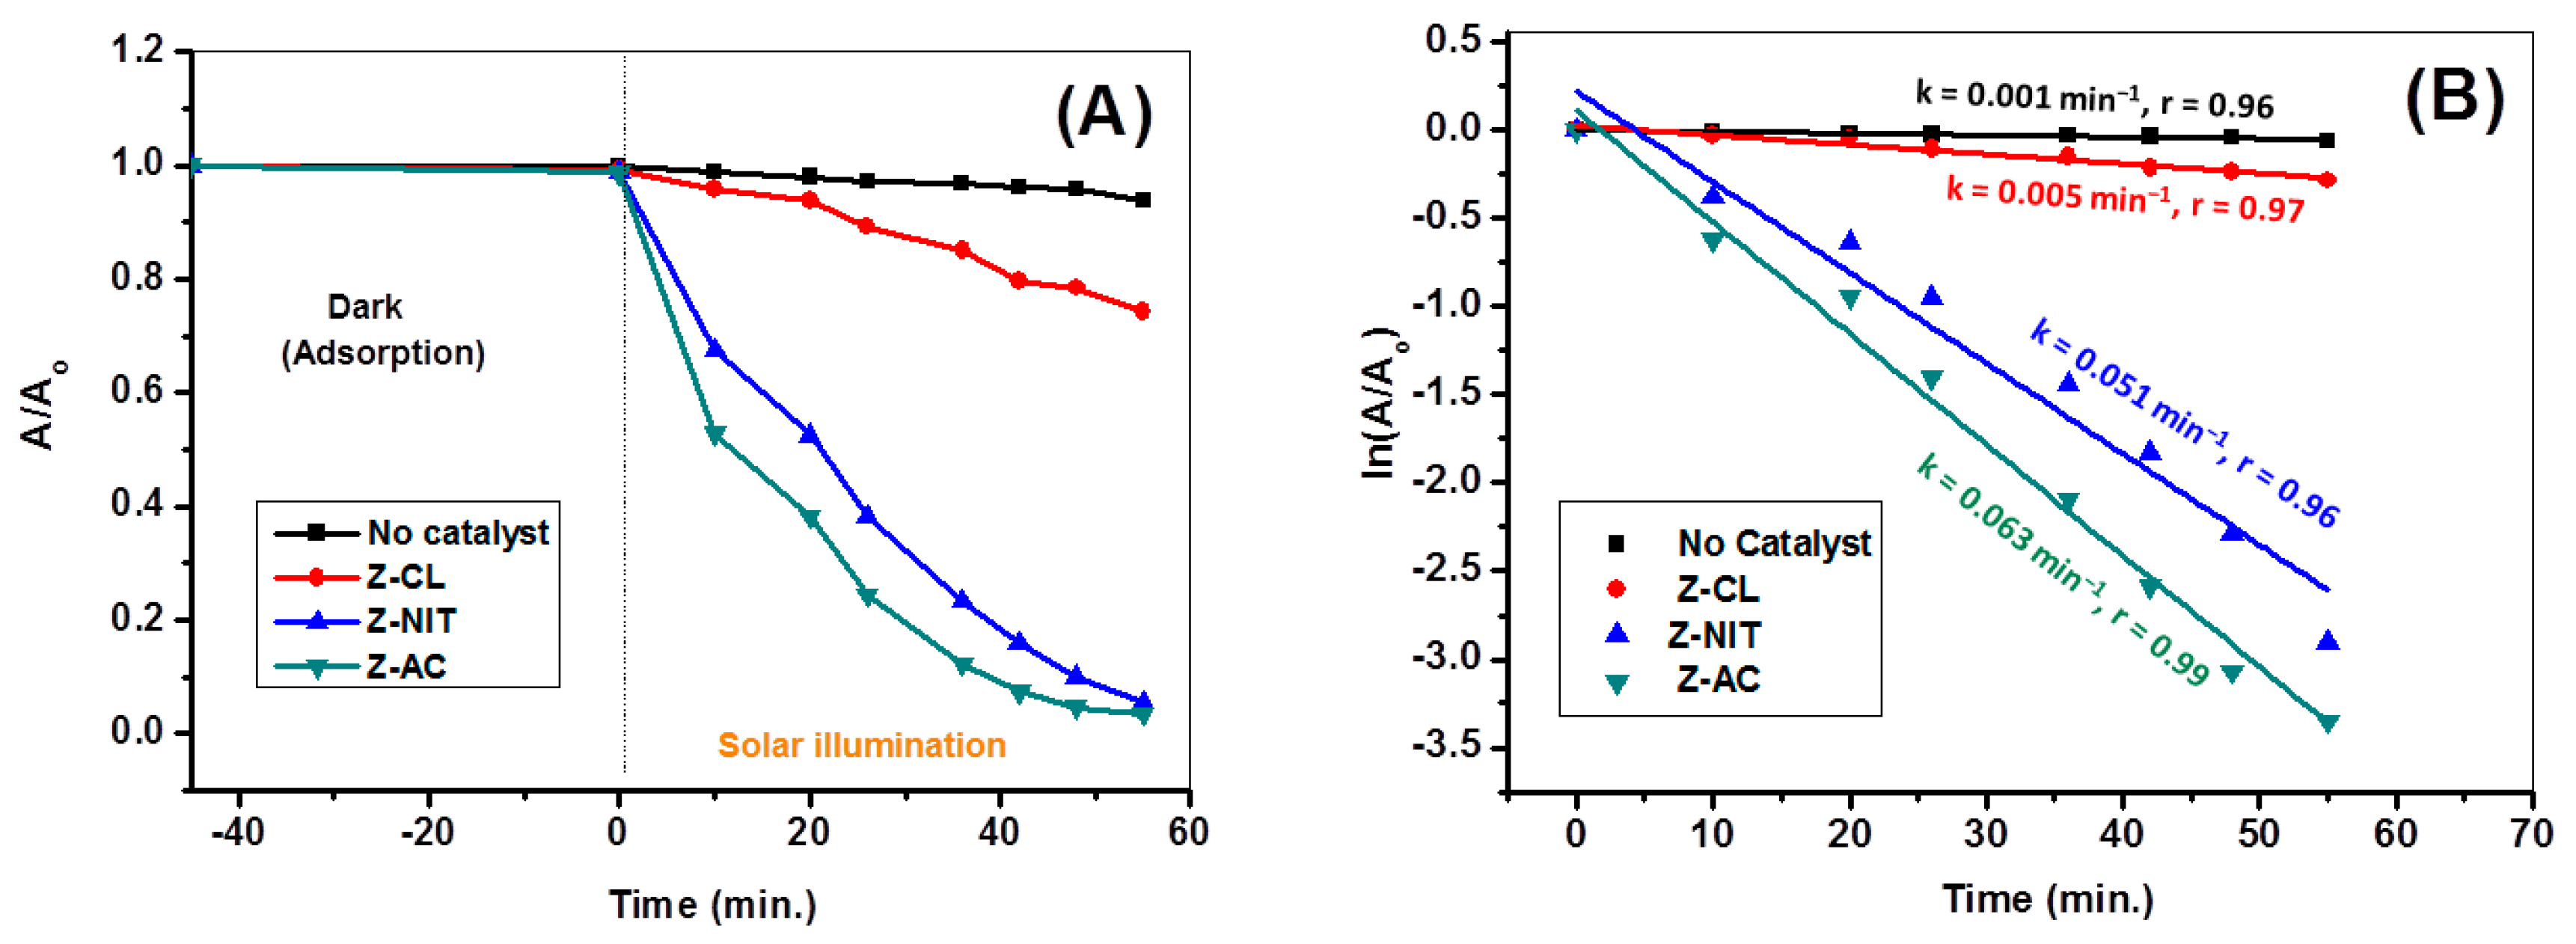
3.9. Evaluation of the Photocatalytic Activity

3.9.1. Comparison of Photocatalytic Activities of ZnO Particles

The photocatalytic efficiency of the synthesized Z-Ac, Z-CL and Z-NIT NPs was assessed by measuring the degradation of MB under solar illumination. Furthermore, temporal ultraviolet–vis spectra were obtained for the solar-driven photocatalytic reactions and are illustrated in Figure 8A–C. Under dark conditions for 45 min., the contact of MB and the developed ZnO NPs derived from the three precursors results in MB removal with ~2%. After 55 min. of conducting the solar-driven photocatalytic degradation reactions, a marked degradation of MB with comparable degradation efficacies of 96.4% and 94.4% for Z-AC and Z-NIT, respectively, is achieved. Otherwise, the Z-CL catalyst revealed weak photodegradation efficiency with 25.1%. The solar-driven photocatalytic activity of either Z-AC or Z-CL could be referred to the oxygen vacancies in the ZnO lattice, resulting in trapping more photons [51]. The linear correlation of the plot of Ln (At/A0) versus time suggested a first-order reaction for all samples (Figure 9A,B). As illustrated in Table 2, Z-AC photocatalyst achieved MB degradation with the fastest rate constant 0.063 min−1 compared to 0.051 min−1 and 0.005 min−1 for Z-NIT and Z-CL, respectively. Accordingly, Z-AC photodegraded MB with 1.24 times and 12.6 times over Z-NIT and Z-CL, respectively. Therefore, the order of catalysts efficacies for degrading MB is Z-AC > Z-NIT >>> Z-CL. This is again revealing the insight that the acetate and nitrate precursors are the most proper to biogenically synthesize efficient ZnO photocatalysts that utilize the chloride precursor.
These findings can be ascribed to several factors. Firstly, the relatively smaller average crystallite size, which was determined through XRD analysis, likely contributes to the findings. Additionally, the higher surface area, smaller particle size and larger pore size, as evidenced by BET measurements, are also likely influential factors. Lastly, the hexagonal morphology, as revealed by SEM/TEM micrographs, may also play a role in the observed outcomes. It has been established that there is a positive correlation between surface area and both light harvesting capacity and interfacial charge transfer rates. This is due to the fact that a larger surface area allows for a greater contact area between catalysts and dye molecules, resulting in a more pronounced adsorbent effect. The usage of this approach potentially facilitate the promotion of a significant multitude of active sites, thereby enhancing the efficacy of the interaction between Z-AC or Z-NIT catalysts and MB molecules [36,52]. The aforementioned characteristics represent the primary distinguishing factors of the developed ZnO nanoparticles.

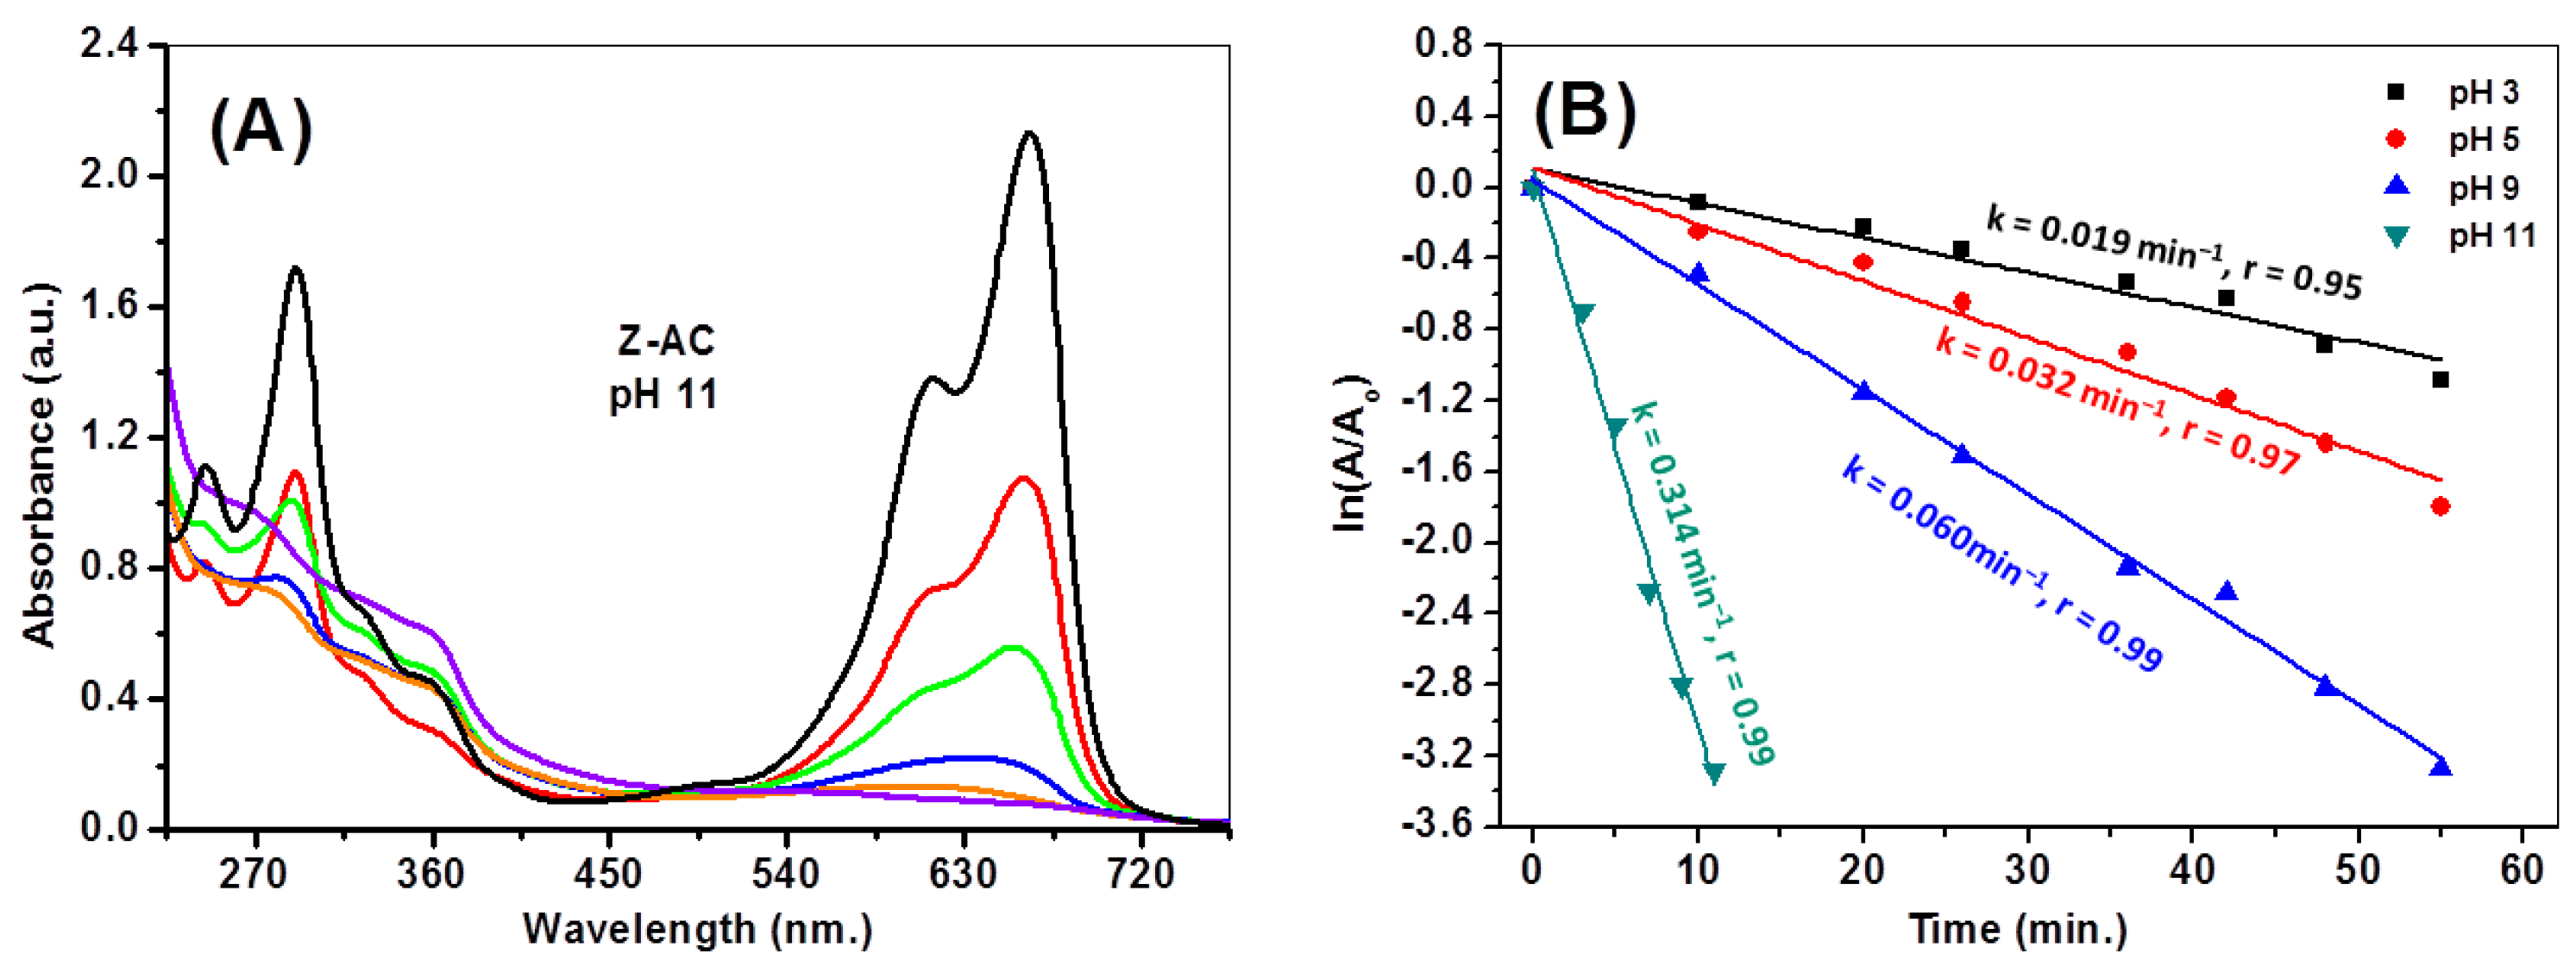
3.9.2. pH Influence on Photocatalytic Degradation Performance

The influence of working pH on the efficiency of photocatalytic degradation reactions is widely acknowledged due to its impact on the surface charge of the catalyst. Metal oxides undergo hydrolysis in aqueous solutions, resulting in the formation of surface hydroxides (M–OH). In an acidic environment, the surface of an oxide or hydroxide may acquire a positive charge. In an alkaline medium, the production of negatively charged species occurs. Additionally, the influence of pH on the photocatalytic efficacy can be elucidated through the interplay of electrostatic forces between the catalyst and dye. In the photocatalytic system, an aqueous solution of MB (20 ppm, 50 mL) is combined with 15 mg of Z-AC, which is known for its superior catalytic properties. Prior to initiating the solar illumination process, the pH of the system was initially adjusted to four different values (3.0, 5.0, 9.0 and 11.0).
Figure 10A illustrates the decline in MB absorbance within the ultraviolet–visible range as solar illumination time increases up to 11 min. This phenomenon occurs in the presence of the Z-AC catalyst and at a pH of 11.0. Furthermore, Figure 10B illustrates the plotted data of the first-order kinetics of photodegradation, which is associated with the aforementioned observations. It is worth noting that the lowest efficiency of photodegradation, characterized by a rate constant of 0.019 min−1, is observed at a pH value of 3.0. This particular pH level may induce the dissolution of ZnO [6]. In contrast, a significantly elevated degradation rate of approximately 0.314 min−1 and a degradation efficiency of 96.3% are achieved under alkaline conditions with a pH of 11. The photodegradation efficiency was found to be approximately five times higher when comparing the degradation rate at pH 11.0 to that achieved under natural pH conditions. At highly acidic pH, the photocatalyst ZnO’s positive surface and the positively charged MB molecules are electrostatically repelled, which causes a dramatic slowdown in the degradation rate. On the contrary, at highly alkaline pH, the negative charges carried by ZnO photocatalyst results in an electrostatic attraction with the cationic MB molecules, thereby it is the contact of MB and ZnO surfaces that led to the highest photodegradation rate [6,53]. Other studies have also reported a similar trend in the photocatalytic degradation of wastewater containing a high concentration of dye. In an alkaline environment with a pH of 11.0, the presence of a significant quantity of OH ions, either in bulk or adsorbed on the Z-AC catalyst, leads to the effective removal of holes and the generation of a higher concentration of OH radicals, which is advantageous. Additional studies have shown that the photodegradation rate increases in an alkaline environment. In an alkaline environment, hydroxyl anions typically act as hole scavengers on the surface of the developed photocatalyst before transforming into hydroxyl radicals with strong oxidation capabilities upon electron loss. As a result, the concentration of OH species increases, which improves photodegradation efficiency. This has the potential to enhance the photodegradation performance by achieving higher rates. The confirmation of the suitability of the developed Z-AC catalyst, which demonstrates optimal performance at high pH values similar to those found in actual effluent from textile industries, is an intriguing aspect to consider. Table 3 illustrates the enhanced performance of the greenly synthesized Z-AC catalyst, as developed in this study, compared to other reported catalysts [38,49,54,55,56,57,58]. This superiority is observed specifically when the Z-AC catalyst is optimally utilized in the photodegradation reactions of MB.

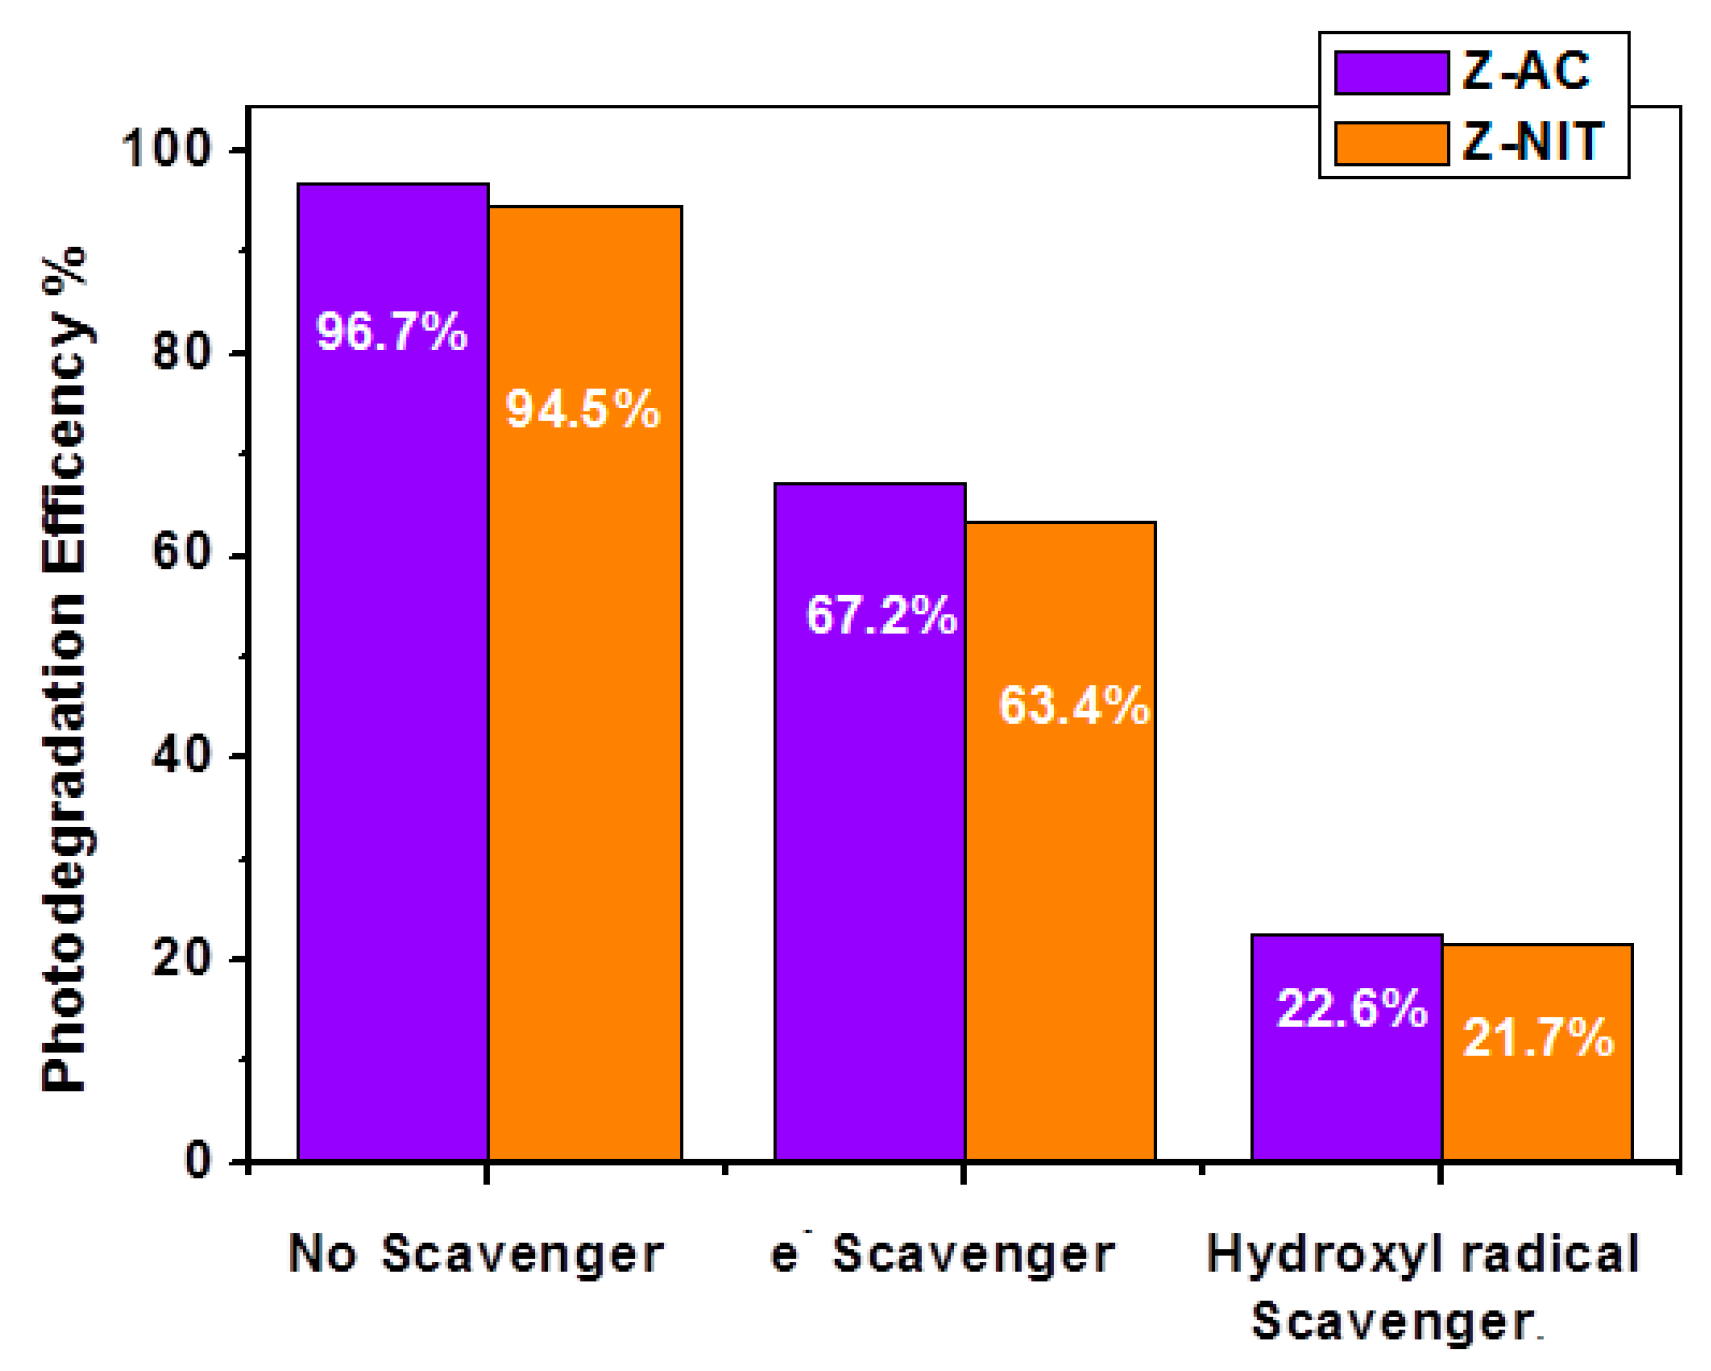
3.10. Study for Trapping of Charge Carriers and Oxidizing Species

Moreover, the scavenger studies were performed to investigate the role of significant species in the process of MB removal (Figure 11). Various quenchers, specifically silver nitrate (a scavenger for electrons), (a scavenger for superoxide radicals) and t-butyl alcohol (a scavenger for hydroxyl radicals), were employed in the study [59]. Following an 11 min period of photo-irradiation, the photodegradation efficiency of MB was approximately 96.7% and 94.5% when utilizing Z-AC and Z-NIT photocatalysts, respectively, in the absence of any scavenger. The efficiency of Z-AC was observed to decrease to 67.2% with the addition of silver nitrate and to 22.6% with the addition of t-butanol. The utilization of Z-NIT exhibits a consistent pattern. This finding substantiates the significant involvement of OH more than e- as reactive entities in the degradation process of MB.

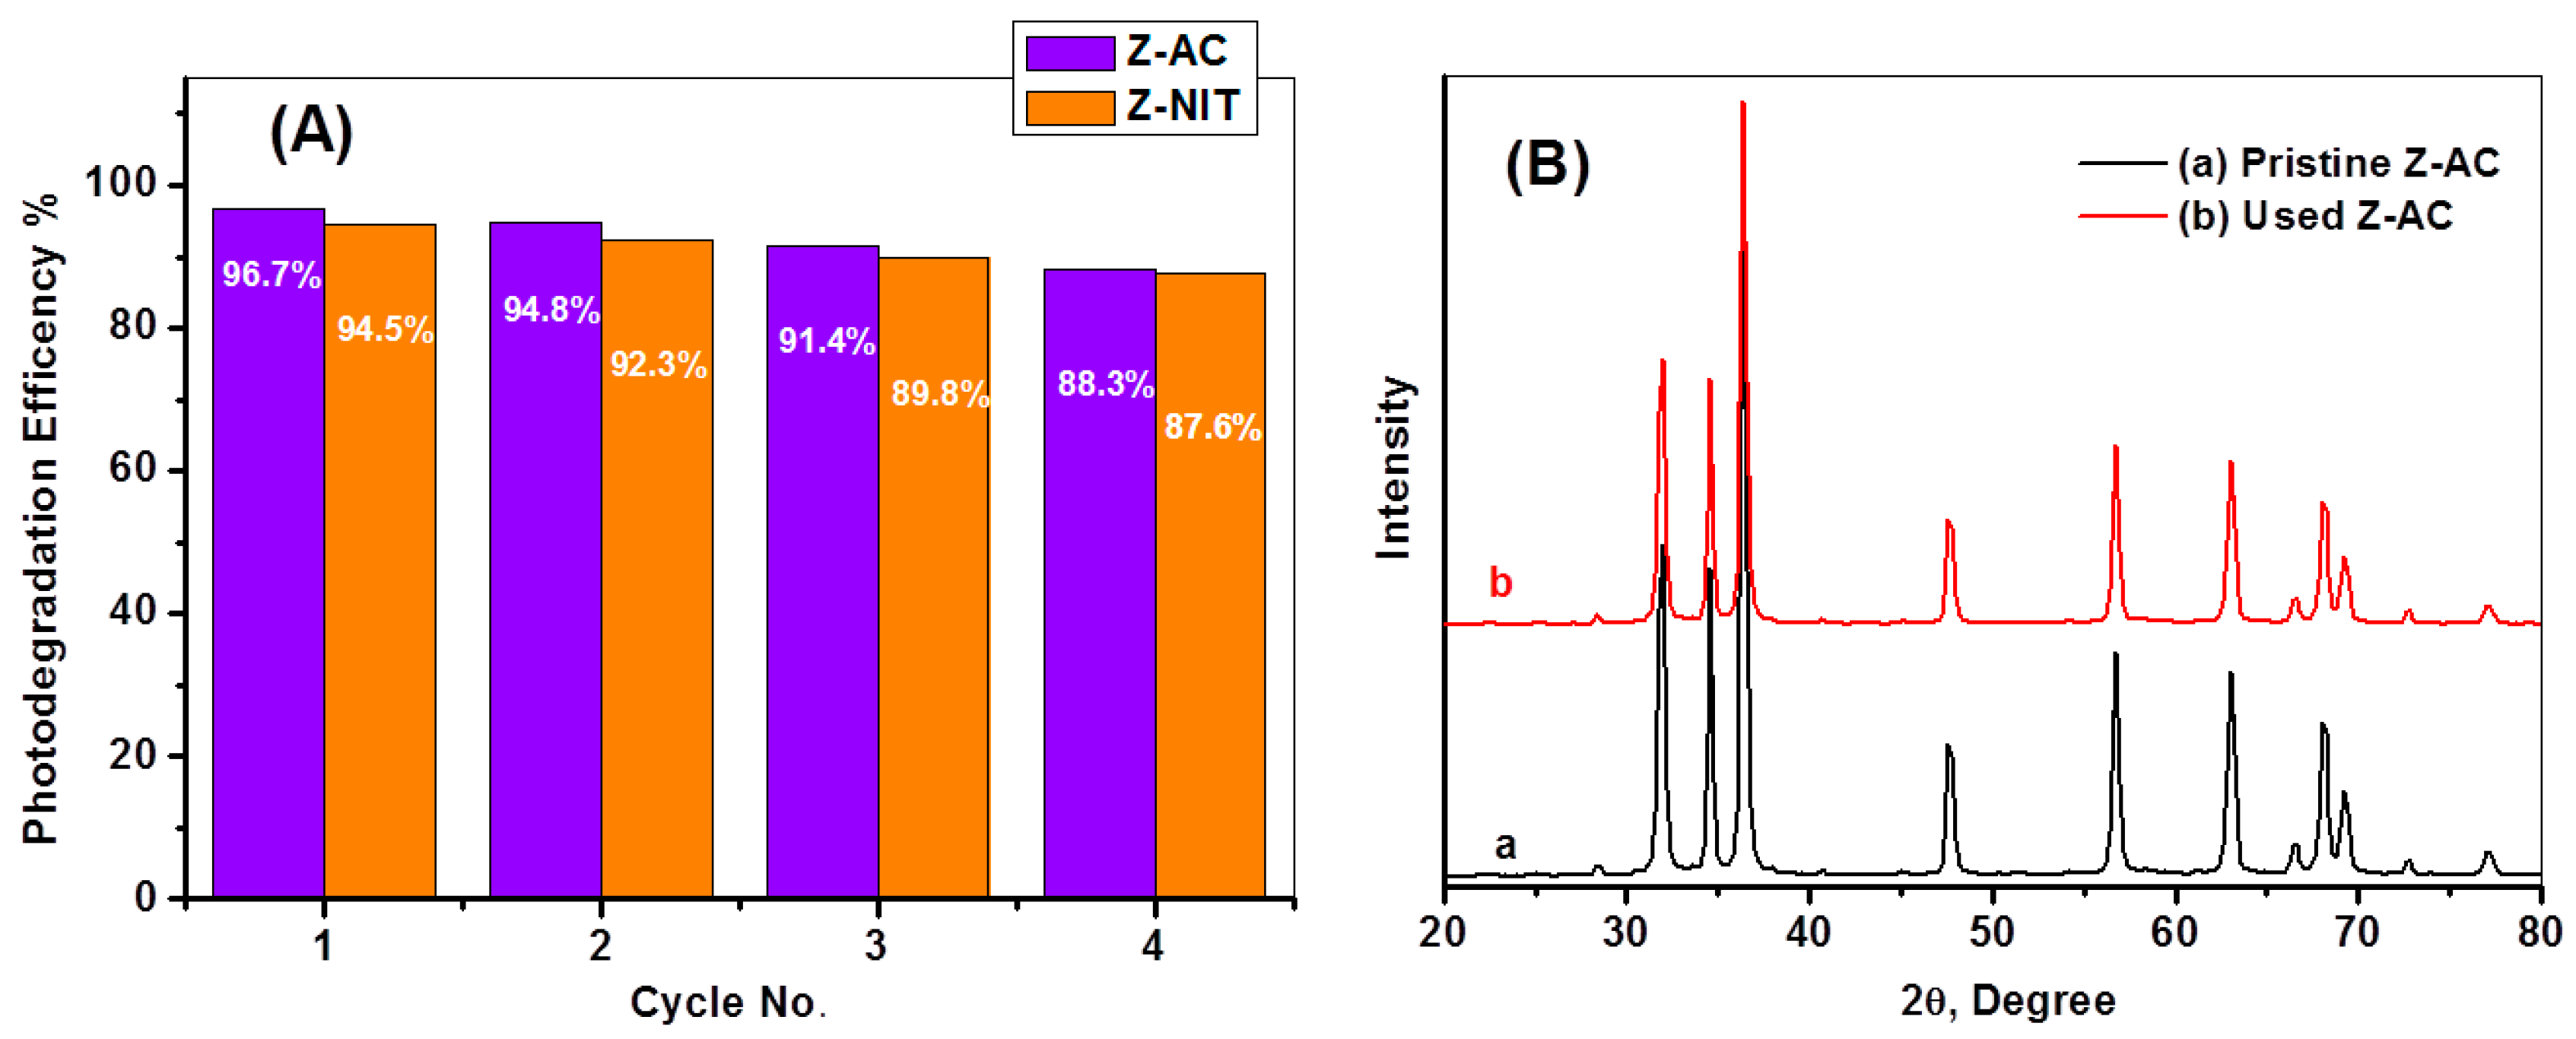
3.11. Stability and Life Span of Z-NIT and Z-AC Photocatalysts

The assessment of the photocatalyst’s reusability and structural stability necessitates the examination of its recycling capability. The measurement of MB (20 mg/L, pH 11.0) removal was conducted over four consecutive cycles. Following the initial trial, the photocatalyst was retrieved and subsequently employed in the subsequent trial. Figure 12A illustrates a simplified chart that presents a comparison of the photocatalytic degradation efficiencies of Z-NIT and Z-AC in the removal of MB over the course of four experimental runs. The rate of photodegradation slowed slightly after each cycle of the reaction, probably due to a small loss or aggregation of the spent photocatalyst. The findings demonstrate a high degree of cycling stability exhibited by the photocatalyst. Furthermore, Figure 12B demonstrates the verification of the ZnO photocatalyst’s structural stability subsequent to the photodegradation of MB. The patterns of X-ray diffraction for both pristine and utilized Z-AC photocatalyst exhibited identical characteristics. The findings of the study demonstrated the exceptional structural integrity of the synthesized ZnO photocatalyst, exhibiting a notable level of efficacy.

3.12. Application in Photodegrading Dye Enriched Lake Water

The study of the photocatalytic degradation of two dyestuffs, MB and Pyronine Y (PY), enriched in samples from the water of Dumat Aljandal Lake, a lake located in the Aljouf region of Saudi Arabia, provides more realism and highlights the viability of the developed Z-AC NPs [60]. The photocatalytic system was 50 mL of lake water, containing a mixture of MB (20 ppm) and PY (18 ppm), in which 15 mg of Z-AC NPs was ultrasonicated and subjected to adsorption equilibrium in the dark. After that, the photocatalytic reaction was conducted under solar illumination, where the residual concentration of the dyes was measured spectrophotometrically at λmax 546 nm and 663 nm for PY and MB, respectively.
Figure 13A illustrates the decline in PY and MB absorbance within the ultraviolet–visible range as the solar illumination time increases up to 24 min. Moreover, Figure 13B illustrates the plotted data of the first-order kinetics of photodegradation reaction where the rate constants of 0.134 and 0.116 min−1 were estimated for MB and PY, respectively. Furthermore, Figure 13C illustrates that MB and PY were photocatalytically degraded with efficiencies 97.1% and 95.4%, respectively. These interesting findings indicate the good applicability and high capability of the developed photocatalysts in photodegrading dye enriched natural water sources.
It is noteworthy that ZnO, until now, notably attracts a lot of interest as an impressive photocatalyst, where the challenge remains in developing proper synthesis processes [61]. Table 4 compares between the features and efficiencies of ZnO photocatalysts prepared by different methods [8,36,62,63,64,65,66,67]. It is evident that the developed work addresses new findings in providing the simplest, purely green and cost-effective eco-design of a precursory optimized ZnO photocatalyst with a narrowly proper band gab, much higher surface area, higher productivity of oxidizing species, low particle size and desired structure defects. These novel insights greatly improved the response to visible photons, enabling our optimized ZnO NPs to exhibit the superior degradation rate of MB and PY pollutants at the least t1/2 with high durability, which has an interesting applicability to immaculate wasted lake water.

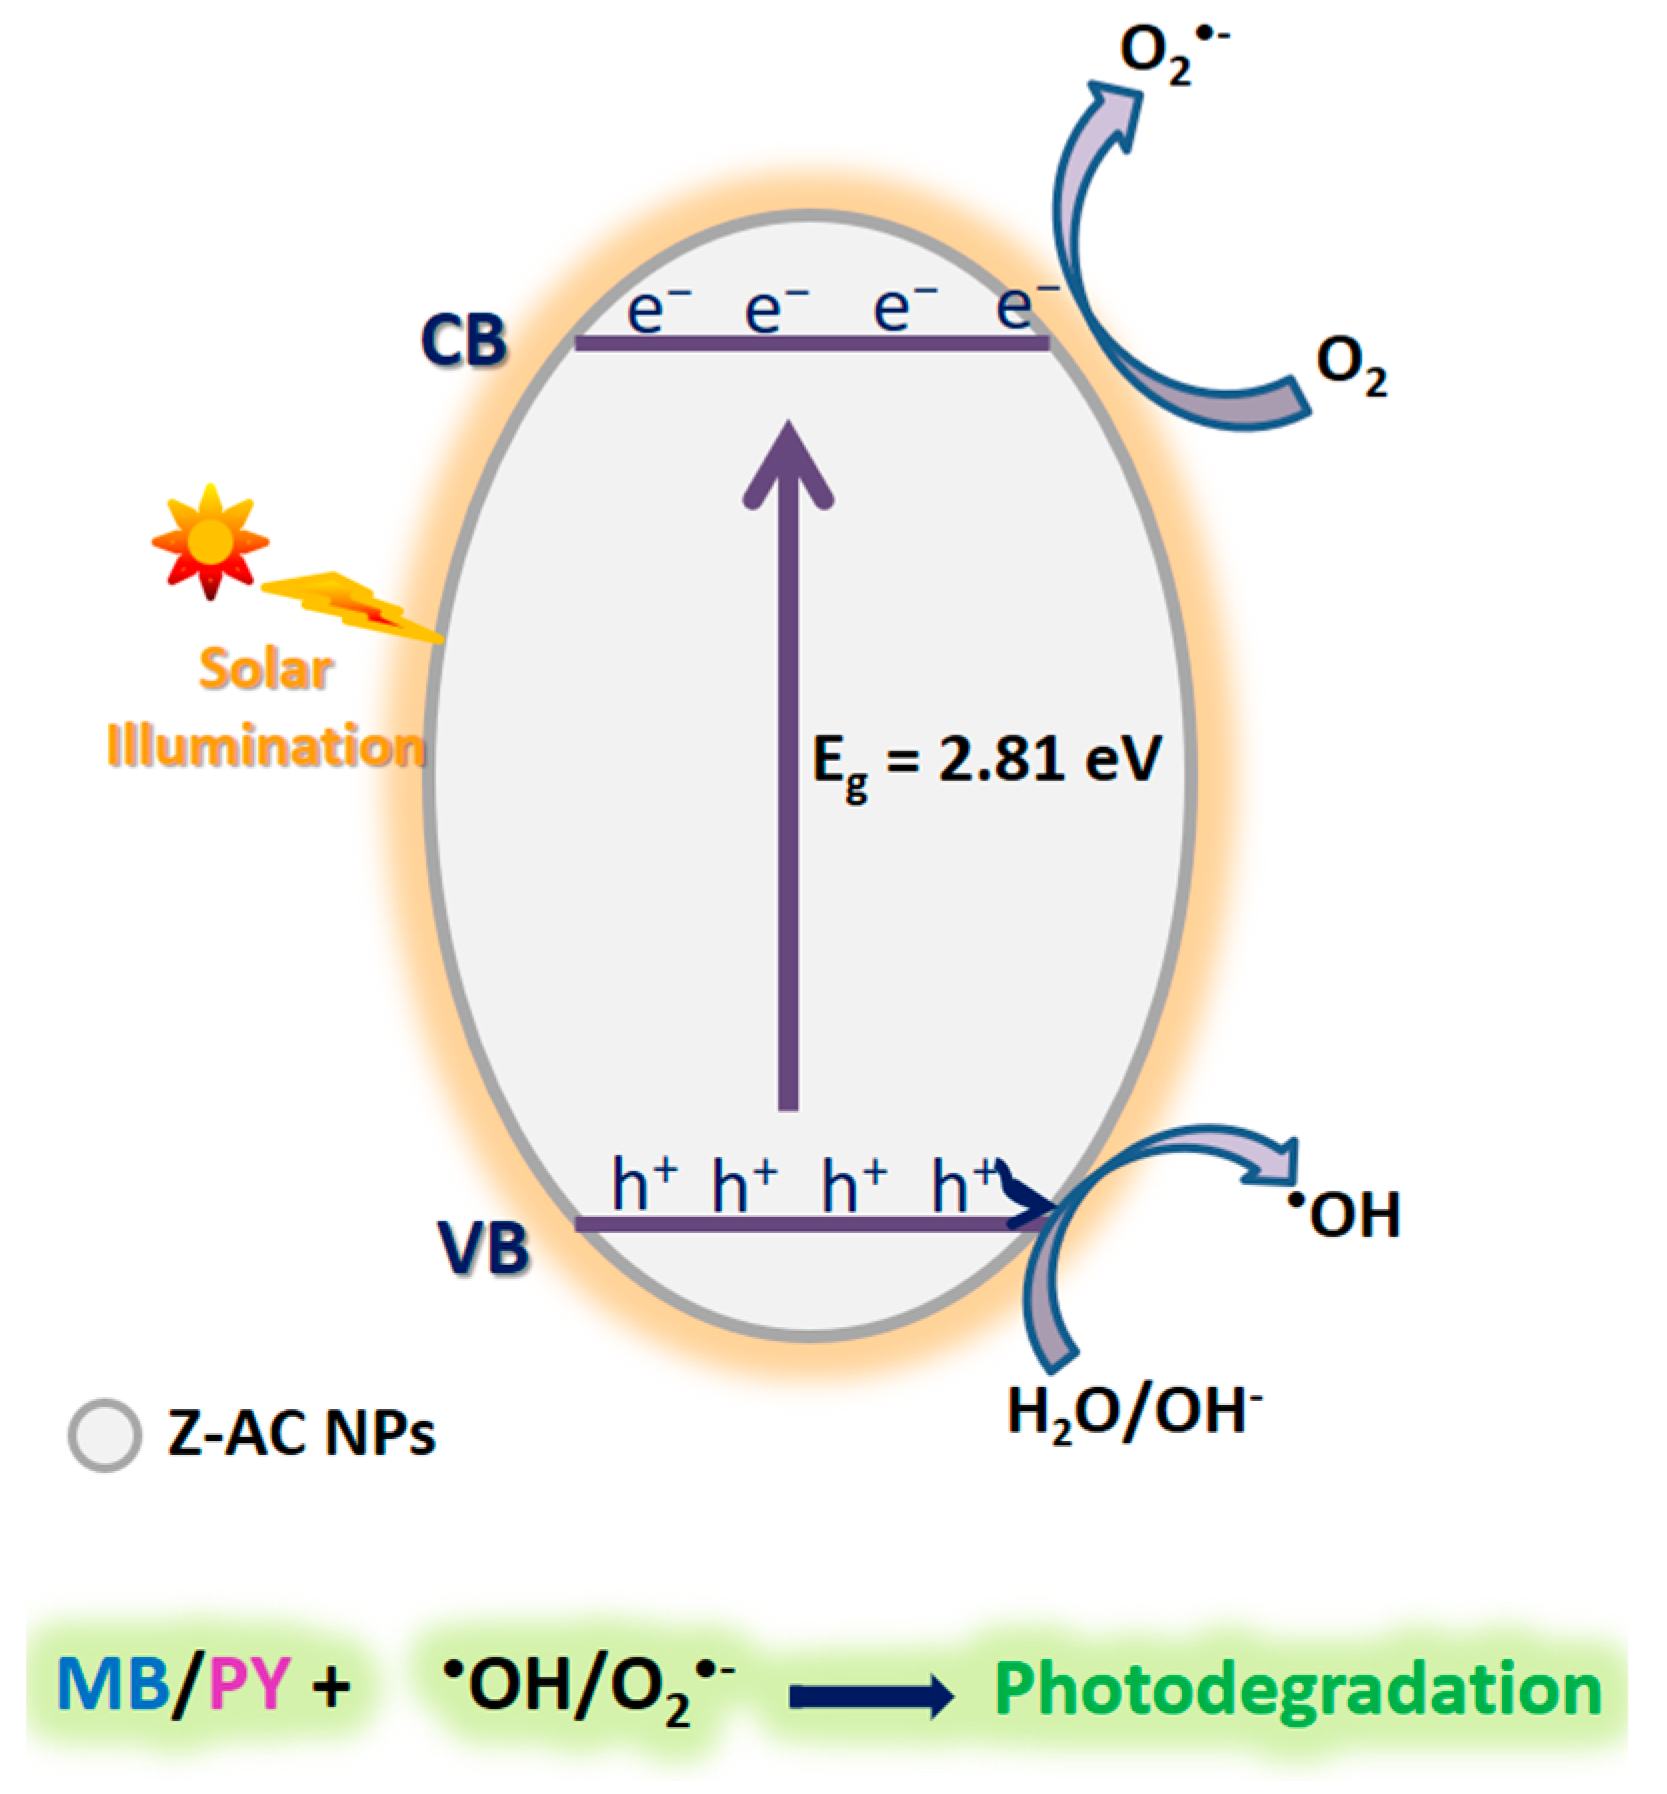
3.13. Plausible Mechanism for the Photocatalytic Degradation Process

Figure 14 illustrates how solar photons activate biogenic synthesized Z-AC defective NPs, resulting in the generation of charge carriers holes (h+) and electrons (e) (Equation (3)). The photogenerated electron–hole pairs will then move closer to the surface and be utilized in the following photodegradation reaction. The excited electrons in the conduction band can diffuse to crystal defects, facilitating their separation from holes [8]. These electrons exert their influence by effectively reducing dissolved oxygen, which may be adsorbed in Z-AC’s porous structure, resulting in highly reactive superoxide ions ((O2) (Equation (4)). Meanwhile, h+ has a remarkable oxidizing capacity and actively participates in oxidizing water molecules, resulting in the formation of hydroxyl radicals (OH) (Equation (5)).
ZnO + hυ → ZnO(eCB + hVB)
eCB + O2O2 (Reduction reaction)
H2O/OH + h+OH (Oxidation reaction)
MB/PY + OH/O2 → Degradation products
These reactive oxidizing species, as well as the abundant holes in the VB of biogenically synthesized ZnO, were effectively involved in the photodegradation of dye molecules (Equation (6)).
Figure 14. A plausible mechanism for the solar-assisted photodegradation of MB in presence of biosynthesized Z-AC photocatalyst.
Ceramics 07 00072 g014

4. Conclusions

This study examined the effect of Zn2+ sources on the biogenic-mediated synthesis of ZnO nanoparticles with desirable solar-responsive catalytic properties. Nitrate, acetate and chloride salts are used. ZnO powders were characterized using XRD, FTIR, Raman, BET, SEM, TEM with EDS/elemental mapping and UV-vis absorption/emission spectroscopy. The analysis revealed that precursors affect the crystallinity, morphology, surface properties, optical properties and photocatalytic degradation of MB. ZnO from zinc acetate precursors shows the smallest crystal size (15.54 nm), highest surface area (43.04 m2/g), hexagonal morphology, as well as the best absorptivity for visible photons (Eg 2.8 eV), efficiency in separating photogenerated charge carrier and potency in producing OH radicals. These merits resulted in superiority in photodegrading MB with kinetic estimates of 0.314 min−1 and t1/2 = 2.2 min, compared to recent reports. Further examination of Z-AC NPs in the photocatalytic remediation of water samples from Dumat Aljandal Lake present in Aljouf region Saudi Arabia that were contaminated with a mixture from MB and PY dyestuffs revealed high potency in dye photodegradation. Thus, the work provides new findings in addressing the simplest, purely green and cost-effective eco-design of precursory optimized ZnO NPs with highly desirable optical properties, surface characteristics and morphological features and an efficient solar-driven catalytic potentiality for an interesting applicability to immaculate wasted lake water with a superior rate and high durability. This paves the way towards more insights on precursory optimized biogenesis in producing photocatalysts that can be viably utilized in hazmat removal.
It is evident that the developed work addresses new findings in providing the simplest, purely green and cost effective eco-design of precursory optimized ZnO photocatalyst with a narrowly proper band gab, much higher surface area, higher productivity of oxidizing species, low particle size and desired structure defects. These novel insights greatly improved the response to visible photons, enabling our optimized ZnO NPs to exhibit the superior degradation rate of MB and PY pollutants at the least t1/2 with high durability and interesting applicability to immaculate wasted lake water.

Author Contributions

Conceptualization, A.A.E. and A.E.-N.I.E.; methodology, A.A.E.; software, T.H.A.H., M.F.H. and E.F.E.A.; validation, A.E.-N.I.E., H.S.A., E.F.E.A. and M.F.H.; formal analysis, A.A.E.; investigation, T.H.A.H., R.F.A. and A.E.-N.I.E.; resources, A.A.E., T.H.A.H. and H.S.A.; data curation, A.A.E., R.F.A., E.F.E.A. and M.F.H.; writing—original draft preparation, A.A.E.; writing—review and editing, A.A.E. and A.E.-N.I.E.; visualization, T.H.A.H., H.S.A., R.F.A., M.F.H. and E.F.E.A. supervision, A.A.E. and A.E.-N.I.E.; project administration, A.A.E.; funding acquisition, A.A.E. All authors have read and agreed to the published version of the manuscript.

Funding

This work was funded by the Deanship of Scientific Research at Jouf University under grant number (DSR2022-RG-0133).

Institutional Review Board Statement

Not applicable.

Informed Consent Statement

Not applicable.

Data Availability Statement

The data presented in this study are available in this article.

Conflicts of Interest

The authors declare no conflicts of interest.

References

  1. Kumar, N.; Gusain, R.; Pandey, S.; Ray, S.S. Hydrogel Nanocomposite Adsorbents and Photocatalysts for Sustainable Water Purification. Adv. Mater. Interfaces 2023, 10, 2201375. [Google Scholar] [CrossRef]
  2. Pandey, S.; Son, N.; Kang, M. Synergistic Sorption Performance of Karaya Gum Crosslink Poly(Acrylamide-Co-Acrylonitrile)@Metal Nanoparticle for Organic Pollutants. Int. J. Biol. Macromol. 2022, 210, 300–314. [Google Scholar] [CrossRef] [PubMed]
  3. Chankhanittha, T.; Nanan, S. Visible-light-driven photocatalytic degradation of ofloxacin (OFL) antibiotic and Rhodamine B (RhB) dye by solvothermally grown ZnO/Bi2MoO6 heterojunction. J. Colloid Interface Sci. 2020, 582, 412–427. [Google Scholar] [CrossRef] [PubMed]
  4. Senasu, T.; Hemavibool, K.; Nanan, S. Hydrothermally grown CdS nanoparticles for photodegradation of anionic azo dyes under UV-visible light irradiation. RSC Adv. 2018, 8, 22592–22605. [Google Scholar] [CrossRef] [PubMed]
  5. Elfeky, A.S.; Salem, S.S.; Elzaref, A.S.; Owda, M.E.; Eladawy, H.A.; Saeed, A.M.; Awad, M.A.; Abou-Zeid, R.E.; Fouda, A. Multifunctional Cellulose Nanocrystal/Metal Oxide Hybrid, Photo-Degradation, Antibacterial and Larvicidal Activities. Carbohydr. Polym. 2020, 230, 115711. [Google Scholar] [CrossRef] [PubMed]
  6. Essawy, A.A. Silver imprinted zinc oxide nanoparticles: Green synthetic approach, characterization and efficient sunlight-induced photocatalytic water detoxification. J. Clean. Prod. 2018, 183, 1011–1020. [Google Scholar] [CrossRef]
  7. Pandit, V.U.; Arbuj, S.S.; Pandit, Y.B.; Naik, S.D.; Rane, S.B.; Mulik, U.P.; Gosavi, S.W.; Kale, B.B. Solar Light Driven Dye Degradation Using Novel Organo-Inorganic (6,13-Pentacenequinone/TiO2) Nanocomposite. RSC Adv. 2015, 5, 10326–10331. [Google Scholar] [CrossRef]
  8. Essawy, A.A.; Alsohaimi, I.H.; Alhumaimess, M.S.; Hassan, H.M.A.; Kamel, M.M. Green synthesis of spongy Nano-ZnO productive of hydroxyl radicals for unconventional solar-driven photocatalytic remediation of antibiotic enriched wastewater. J. Environ. Manag. 2020, 271, 110961. [Google Scholar] [CrossRef] [PubMed]
  9. Mdlovu, N.V.; Yang, N.-C.; Lin, K.-S.; Chang, C.-J.; Dinh, K.T.; Lin, Y.-G. Formulation and characterization of W-doped titania nanotubes for adsorption/photodegradation of methylene blue and basic violet 3 dyes. Catal. Today 2022, 388–389, 36–46. [Google Scholar] [CrossRef]
  10. Xu, J.; Cui, Z.; Liu, Z.; Xu, F.; Chen, Y. Organic-inorganic nanohybrid electrochemical sensors from multi-walled carbon nanotubes decorated with zinc oxide nanoparticles and insitu wrapped with poly(2-methacryloyloxyethyl-ferrocenecarboxylate) for detection of food additives. Nanomaterials 2019, 9, 1388. [Google Scholar] [CrossRef]
  11. Lam, S.M.; Sin, J.C.; Abdullah, A.Z.; Mohamed, A.R. Investigation on visible-light photocatalytic degradation of 2,4- dichlorophenoxyacetic acid in the presence of MoO3/ZnO nanorod composites. J. Mol. Catal. A Chem. 2013, 370, 123–131. [Google Scholar] [CrossRef]
  12. Liu, C.; Li, Z.; Gao, Y.; Zhang, Q. Microstructral evolution of well-aligned ZnO nanorods array films in aqueous solution. J. Wuhan Univ. Technol. 2007, 22, 603–606. [Google Scholar] [CrossRef]
  13. Gupta, M.; Sharma, V.; Shrivastava, J.; Solanki, A. Preparation and characterization of nanostructured ZnO thin films for photoelectrochemical splitting of water. Bull. Mater. Sci. 2009, 32, 23–30. [Google Scholar] [CrossRef]
  14. Singh, O.; Kohli, N.; Singh, R.C. Precursor controlled morphology of zinc oxide and its sensing behaviour. Sens. Actuators B Chem. 2013, 178, 149–154. [Google Scholar] [CrossRef]
  15. Essawy, A.A.; Abdel-Farid, I.B. Hybrid solvothermal/sonochemical-mediated synthesis of ZnO NPs generative of OH radicals: Photoluminescent approach to evaluate OH scavenging activity of Egyptian and Yemeni Punica granatum arils extract. Ultrason. Sonochem. 2022, 89, 106152. [Google Scholar] [CrossRef] [PubMed]
  16. Koutu, V.; Shastri, L.; Malik, M.M. Effect of NaOH concentration on optical properties of zinc oxide nanoparticles. Mater. Sci. Pol. 2016, 34, 819–827. [Google Scholar] [CrossRef]
  17. Varadavenkatesan, T.; Lyubchik, E.; Pai, S.; Pugazhendhi, A.; Vinayagam, R.; Selvaraj, R. Photocatalytic degradation of Rhodamine B by zinc oxide nanoparticles synthesized using the leaf extract of Cyanometra ramiflora. J. Photochem. Photobiol. B Biol. 2019, 199, 111621. [Google Scholar] [CrossRef]
  18. Chankhanittha, T.; Watcharakitti, J.; Nanan, S. PVP-assisted synthesis of rod-like ZnO photocatalyst for photodegradation of reactive red (RR141) and Congo red (CR) azo dyes. J. Mater. Sci. Mater. Electron. 2019, 30, 17804–17819. [Google Scholar] [CrossRef]
  19. Kakarndee, S.; Nanan, S. SDS capped and PVA capped ZnO nanostructures with high photocatalytic performance toward photodegradation of reactive red (RR141) azo dye. J. Environ. Chem. Eng. 2018, 6, 74–94. [Google Scholar] [CrossRef]
  20. Ahmed, S.; Annu; Chaudhry, S.A.; Ikram, S. A review on biogenic synthesis of ZnO nanoparticles using plant extracts and microbes: A prospect towards green chemistry. J. Photochem. Photobiol. B Biol. 2017, 166, 272–284. [Google Scholar] [CrossRef]
  21. Mydeen, S.S.; Kumar, R.R.; Kottaisamy, M.; Vasantha, V.S. Biosynthesis of ZnO nanoparticles through extract from Prosopis juliflora plant leaf: Antibacterial activities and a new approach by rust-induced photocatalysis. J. Saudi Chem. Soc. 2020, 24, 393–406. [Google Scholar] [CrossRef]
  22. Begum, J.P.S.; Manjunath, K.; Pratibha, S.; Dhananjaya, N.; Sahu, P.; Kashaw, S. Bioreduction synthesis of zinc oxide nanoparticles using Delonix regia leaf extract (Gul Mohar) and its agromedicinal applications. J. Sci. Adv. Mater. Devices 2020, 5, 468–475. [Google Scholar] [CrossRef]
  23. Kaliraj, L.; Ahn, J.C.; Rupa, E.J.; Abid, S.; Lu, J.; Yang, D.C. Synthesis of panos extract mediated ZnO nano-flowers as photocatalyst for industrial dye degradation by UV illumination. J. Photochem. Photobiol. B Biol. 2019, 199, 111588. [Google Scholar] [CrossRef]
  24. Essawy, A.A.; Sayyah, S.M.; El-Nggar, A.M. Ultrasonic-mediated synthesis and characterization of TiO2-loaded chitosan-grafted-polymethylaniline nanoparticles of potent efficiency in dye uptake and sunlight driven self-cleaning applications. RSC Adv. 2016, 6, 2279–2294. [Google Scholar] [CrossRef]
  25. Payra, S.; Reddy, K.L.; Sharma, R.S.; Singh, S.; Roy, S. A trade-off between adsorption and photocatalysis over ZIF-derived Composite. J. Hazard. Mater. 2020, 393, 122491. [Google Scholar] [CrossRef]
  26. JCPDS. Powder Diffraction File, Alphabetical Index, Inorganic Compounds; International Centre for Diffraction Data: Newtown Square, PA, USA, 1977. [Google Scholar]
  27. Al-Ariki, S.; Yahya, N.A.A.; Al-A’nsi, S.A.; Jumali, M.H.H.; Jannah, A.N.; Abd Shukor, R. Synthesis and comparative study on the structural and optical properties of ZnO doped with Ni and Ag nanopowders fabricated by sol gel technique. Sci. Rep. 2021, 11, 11948. [Google Scholar] [CrossRef]
  28. LBVS, G.; Dhiman, T.K.; Kumar, R.; Singh, A.K.; Solanki, P.R. One-Step Synthesized ZnO np-Based Optical Sensors for Detection of Aldicarb via a Photoinduced Electron Transfer Route. ACS Omega 2020, 5, 2552–2560. [Google Scholar]
  29. Aljabali, A.A.A.; Obeid, M.A.; Bakshi, H.A.; Alshaer, W.; Ennab, R.M.; Al-Trad, B.; Al Khateeb, W.; Al-Batayneh, K.M.; Al-Kadash, A.; Alsotari, S.; et al. Synthesis, Characterization, and Assessment of Anti-Cancer Potential of ZnO Nanoparticles in an In Vitro Model of Breast Cancer. Molecules 2022, 27, 1827. [Google Scholar] [CrossRef]
  30. Rafaja, D.; Wüstefeld, C.; Dopita, M.; Motylenko, M.; Baehtz, C. Capability of X ray diffraction for the study of microstructure of metastable thin films. IUCrJ 2014, 1 Pt 6, 446–456. [Google Scholar] [CrossRef]
  31. Uribe-López, M.C.; Hidalgo-López, M.C.; López-González, R.; Frías-Márquez, D.M.; Núñez-Nogueira, G.; Hernández-Castillo, D.; Alvarez-Lemus, M.A. Photocatalytic activity of ZnO nanoparticles and the role of the synthesis method on their physical and chemical properties. J. Photochem. Photobiol. A Chem. 2021, 404, 112866. [Google Scholar] [CrossRef]
  32. Payra, S.; Challagulla, S.; Bobde, Y.; Chakraborty, C.; Ghosh, B.; Roy, S. Probing the photo- and electro-catalytic degradation mechanism of methylene blue dye over ZIF-derived ZnO. J. Hazard. Mater. 2019, 373, 377–388. [Google Scholar] [CrossRef]
  33. Cusco, R.; Alarcón-Lladó, E.; Ib’añez, J.; Artús, L.; Jiménez, J.; Wang, B.; Callahan, M.J. Temperature Dependence of Raman Scattering in ZnO. Phys. Rev. B 2007, 75, 165202. [Google Scholar] [CrossRef]
  34. Kahouli, M.; Tounsi, N.; Mzabi, N.; Guermazi, H.; Guermazi, S. Enhanced structural and optical properties of ZnO nano-powder with tailored visible luminescence as a function of sodium hydroxide to zinc sulfate mass ratio. Adv. Powder Technol. 2018, 29, 325–332. [Google Scholar] [CrossRef]
  35. Moungsrijun, S.; Wongrerkdee, S. Investigation of structural, optical, and electrical properties of ZnO thin films for electrooptical devices. Suranaree J. Sci. Technol. 2022, 29, 030085. [Google Scholar]
  36. Gatou, M.-A.; Lagopati, N.; Vagena, I.-A.; Gazouli, M.; Pavlatou, E.A. ZnO Nanoparticles from Different Precursors and Their Photocatalytic Potential for Biomedical Use. Nanomaterials 2023, 13, 122. [Google Scholar] [CrossRef] [PubMed]
  37. Wongrerkdee, S.; Wongrerkdee, S.; Boonruang, C.; Sujinnapram, S. Enhanced Photocatalytic Degradation of Methylene Blue Using Ti-Doped ZnO Nanoparticles Synthesized by Rapid Combustion. Toxics 2023, 11, 33. [Google Scholar] [CrossRef]
  38. Krobthong, S.; Rungsawang, T.; Wongrerkdee, S. Comparison of ZnO Nanoparticles Prepared by Precipitation and Combustion for UV and Sunlight-Driven Photocatalytic Degradation of Methylene Blue. Toxics 2023, 11, 266. [Google Scholar] [CrossRef] [PubMed]
  39. Chen, W.; Liu, Q.; Tian, S.; Zhao, X. Exposed facet dependent stability of ZnO micro/nano crystals as a photocatalyst. Appl. Surf. Sci. 2019, 470, 807–816. [Google Scholar] [CrossRef]
  40. De Corrado, J.M.; Fernando, J.F.S.; Shortell, M.P.; Poad, B.L.J.; Blanksby, S.J.; Waclawik, E.R. ZnO colloid crystal facet-type determines both Au photodeposition and photocatalytic activity. ACS Appl. Nano Mater. 2019, 2, 7856–7869. [Google Scholar] [CrossRef]
  41. Chankhanittha, T.; Yenjai, C.; Nanan, S. Utilization of formononetin and pinocembrin from stem extract of Dalbergia parviflora as capping agents for preparation of ZnO photocatalysts for degradation of RR141 azo dye and ofloxacin antibiotic. Catal. Today 2022, 384–386, 279–293. [Google Scholar] [CrossRef]
  42. Zeng, B.H.; Duan, G.; Li, Y.; Yang, S.; Xu, X. Blue Luminescence of ZnO nanoparticles based on non-equilibrium processes: Defect origins and emission controls. J. Adv. Funct. Mater. 2010, 20, 561–572. [Google Scholar] [CrossRef]
  43. Alwan, R.M.; Kadhim, Q.A.; Sahan, K.M.; Ali, R.A.; Roaa, J.; Mahdi, N.A.K.; Jassim, A.N. Synthesis of Zinc oxide nanoparticles via Sol—Gel route and their characterization. Nanosci. Nanotechnol. 2015, 5, 1–6. [Google Scholar]
  44. Peter, I.J.; Praveen, E.; Vignesh, G.; Nithiananthi, P. ZnO nanostructures with different morphology for enhanced photocatalytic activity. Mater. Res. Express 2017, 4, 124003. [Google Scholar] [CrossRef]
  45. Bhatia, S.; Verma, N. Photocatalytic Activity of ZnO Nanoparticles with Optimization of Defects. Mater. Res. Bull. 2017, 95, 468–476. [Google Scholar] [CrossRef]
  46. Chankhanittha, T.; Nanan, S. Hydrothermal synthesis, characterization and enhanced photocatalytic performance of ZnO toward degradation of organic azo dye. Mater. Lett. 2018, 226, 79–82. [Google Scholar] [CrossRef]
  47. Ozgur, U.; Alivov, Y.I.; Liu, C.; Teke, A.; Reshchikov, M.A.; Dogan, S.; Avrutin, V.; Cho, S.-J.; Morkoc, H. A Comprehensive Review of ZnO Materials and Devices. J. Appl. Phys. 2005, 98, 041301. [Google Scholar] [CrossRef]
  48. Studenikin, S.A.; Golego, N.; Cocivera, M. Fabrication of Green and Orange Photoluminescent, Undoped ZnO Films Using Spray Pyrolysis. J. Appl. Phys. 1998, 84, 2287–2294. [Google Scholar] [CrossRef]
  49. Wagh, S.S.; Kadam, V.S.; Jagtap, C.V.; Salunkhe, D.B.; Patil, R.S.; Pathan, H.M.; Patole, S.P. Comparative Studies on Synthesis, Characterization and Photocatalytic Activity of Ag Doped ZnO Nanoparticles. ACS Omega 2023, 8, 7779–7790. [Google Scholar] [CrossRef]
  50. Payra, S.; Ganeshan, S.K.; Challagulla, S.; Roy, S. A correlation story of syntheses of ZnO and their influence on photocatalysis. Adv. Powder Technol. 2020, 31, 510–520. [Google Scholar] [CrossRef]
  51. Chen, L.-L.; Zhai, B.-g.; Huang, Y.M. Rendering Visible-Light Photocatalytic Activity to Undoped ZnO via Intrinsic Defects Engineering. Catalysts 2020, 10, 1163. [Google Scholar] [CrossRef]
  52. Abu-Dief, A.M.; Essawy, A.A.; Diab, A.K.; Mohamed, W.S. Facile synthesis and characterization of novel Gd2O3–CdO binary mixed oxide nanocomposites of highly photocatalytic activity for wastewater remediation under solar illumination. J. Phys. Chem. Solids 2021, 148, 109666. [Google Scholar] [CrossRef]
  53. Degen, A.; Kosec, M. Effect of pH and impurities on the surface charge of zinc oxide in aqueous solution. J. Eur. Ceram. Soc. 2000, 20, 667–673. [Google Scholar] [CrossRef]
  54. Basit, R.A.; Abbasi, Z.; Hafeez, M.; Ahmad, P.; Khan, J.; Khandaker, M.U.; Al-Mugren, K.S.; Khalid, A. Successive Photocatalytic Degradation of Methylene Blue by ZnO, CuO and ZnO/CuO Synthesized from Coriandrum sativum Plant Extract via Green Synthesis Technique. Crystals 2023, 13, 281. [Google Scholar] [CrossRef]
  55. Dhananjay, P.; Abhilash, M.R.; Shilpa, N.; NK, H.K.; Gowtham, H.G.; Aiyaz, M.; Singh, B.; Malik, A.; Akhtar, S.; Murali, M. Solar irradiation driven catalytic dye degradation by novel biosynthesized zinc oxide nanoparticles (ZnO–NPs) from Barleria mysorensis: Kinetics, reusability and mineralization studies. J. Mol. Struct. 2024, 1303, 137549. [Google Scholar]
  56. Rajalakshmi, P.; Vijayan, S.; Amirtharaj, M. A study on microwave synthesis of unique Zn1-3xCuxCexCrxO nanoparticles with efficient photocatalytic reactivity under visible sunlight irradiation. J. Mol. Struct. 2024, 1307, 137992. [Google Scholar] [CrossRef]
  57. Al-Zahrani, S.A.; Khedr, A.M.; Alturki, A.M.; El-Yazeed, W.S.A. Integration of 2D graphene oxide/zinc oxide nanohybrid for enhancement adsorption and photodegradation of organic pollutants. J. Mol. Liq. 2024, 395, 123956. [Google Scholar] [CrossRef]
  58. Chiu, Y.H.; Chang, T.F.M.; Chen, C.Y.; Sone, M.; Hsu, Y.J. Mechanistic insights into photodegradation of organic dyes using heterostructure photocatalysts. Catalysts 2019, 9, 430. [Google Scholar] [CrossRef]
  59. Li, Z.; Jin, D.; Wang, Z. ZnO/CdSe-diethylenetriamine nanocomposite as a stepscheme photocatalyst for photocatalytic hydrogen evolution. Appl. Surf. Sci. 2020, 529, 147071. [Google Scholar] [CrossRef]
  60. Motelica, L.; Oprea, O.-C.; Vasile, B.-S.; Ficai, A.; Ficai, D.; Andronescu, E.; Holban, A.M. Antibacterial Activity of Solvothermal Obtained ZnO Nanoparticles with Different Morphology and Photocatalytic Activity against a Dye Mixture: Methylene Blue, Rhodamine B and Methyl Orange. Int. J. Mol. Sci. 2023, 24, 5677. [Google Scholar] [CrossRef] [PubMed]
  61. Popa, M.L.; Preda, M.D.; Neacşu, I.A.; Grumezescu, A.M.; Ginghina, O. Traditional vs. Microfluidic Synthesis of ZnO Nanoparticles. Int. J. Mol. Sci. 2023, 24, 1875. [Google Scholar] [CrossRef]
  62. Limón-Rocha, I.; Guzmán-González, C.A.; Anaya-Esparza, L.M.; Romero-Toledo, R.; Rico, J.L.; González-Vargas, O.A.; Pérez-Larios, A. Effect of the Precursor on the Synthesis of ZnO and Its Photocatalytic Activity. Inorganics 2022, 10, 16. [Google Scholar] [CrossRef]
  63. Flores, N.M.; Pal, U.; Galeazzi, R.; Sandoval, A. Effects of morphology, surface area, and defect content on the photocatalytic dye degradation performance of ZnO nanostructures. RSC Adv. 2014, 4, 41099. [Google Scholar] [CrossRef]
  64. Pawar, R.C.; Kim, H.; Lee, C.S. Defect-controlled growth of ZnO nanostructures using its different zinc precursors and their application for effective photodegradation. Curr. Appl. Phys. 2014, 14, 621–629. [Google Scholar] [CrossRef]
  65. El Golli, A.; Fendrich, M.; Bazzanella, N.; Dridi, C.; Miotello, A.; Orlandi, M. Wastewater remediation with ZnO photocatalysts: Green synthesis and solar concentration as an economically and environmentally viable route to application. J. Environ. Manag. 2021, 286, 112226. [Google Scholar] [CrossRef] [PubMed]
  66. Aliannezhadi, M.; Mirsanaee, S.Z.; Jamali, M.; Tehrani, F.S. The physical properties and photocatalytic activities of green synthesized ZnO nanostructures using different ginger extract concentrations. Sci. Rep. 2024, 14, 2035. [Google Scholar] [CrossRef]
  67. El Golli, A.; Contreras, S.; Dridi, C. Bio-synthesized ZnO nanoparticles and sunlight-driven photocatalysis for environmentally-friendly and sustainable route of synthetic petroleum refinery wastewater treatment. Sci. Rep. 2023, 13, 20809. [Google Scholar] [CrossRef]
Figure 2. N2 adsorption–desorption isotherm of Z-CL (A); Z-NIT (B); and Z-AC (C) [insets: the pore size distribution curves].
Ceramics 07 00072 g002
Figure 3. Images of SEM for the developed catalysts at different magnifications: Z-CL (A,B); Z-NIT (C,D); and Z-AC (E,F).
Ceramics 07 00072 g003
Figure 4. TEM micrograph (A); particle size distribution (B); high-resolution TEM micrograph (C); SEAD pattern (D); elemental mapping (E,F); and EDX pattern (G) of the Z-AC.
Ceramics 07 00072 g004
Figure 5. UV-Vis electronic spectra of Z-NIT (spectrum 1), Z-AC (spectrum 2), Z-CL (spectrum 3) (AD) are the plots of (αhυ)2 versus hυ Z-NIT, Z-AC and Z-CL, respectively.
Ceramics 07 00072 g005
Figure 6. PL spectra of Z-AC (spectrum a), Z-CL (spectrum b) and Z-NIT (spectrum c) [λex = 325 nm, slit width 5:5].
Ceramics 07 00072 g006
Figure 7. Fluorescence spectra of the formed hydroxy terephthalate fluorophore (λex = 315 nm) in presence of Z-AC (A); Z-NIT (B); Z-CL (C); and the comparison of OH-trapping revealed fluorescence intensities during 60 min of sunlight-irradiation of Z-AC, Z-CL and Z-NIT (D).
Ceramics 07 00072 g007
Figure 8. Time-dependent variations in absorption spectrum of MB during the solar-driven photocatalytic degradation in presence of (A) Z-AC, (B) Z-CL and (C) Z-NIT.
Ceramics 07 00072 g008
Figure 9. Comparing the photodegradation of MB (A) and the applied first-order kinetics (B) under solar illumination in absence of catalyst and in presence of Z-CL, Z-NIT and Z-AC.
Ceramics 07 00072 g009
Figure 10. Temporal variations in the absorption spectrum of MB during the solar-driven photocatalytic degradation in presence of Z-AC at pH11 (A) and the applied first order kinetics (lnA/Ao vs. time) at pHs 3.0, 5.0, 9.0 and 11 (B).
Ceramics 07 00072 g010
Figure 11. Trapping experiment of holes/electrons and the photodegradation performance of Z-AC in degradation of MB in presence of the OH radical scavenger tert-butyl alcohol (750 μL) and the electron scavenger silver nitrate (200 mg).
Ceramics 07 00072 g011
Figure 12. (A) Recyclability of Z-AC and Z-NIT in photodegrading MB up to four runs under solar illumination for 11 min. (B) XRD of pristine and four times used Z-AC photocatalyst.
Ceramics 07 00072 g012
Figure 13. Temporal variations in the absorption spectrum of Dumat Aljandal Lake wastewater with MB and PY during the solar-driven photocatalytic degradation in presence of Z-AC (A). The comparison between MB and PY photodegradation with respect to first order kinetics (lnA/Ao vs. time) (B) and the photodegradation % (C).
Ceramics 07 00072 g013
Table 1. The structural parameters (crystallite size, surface area, pore size and volume) of the greenly synthesized ZnO NPs derived from different precursors.
SampleCrystallite Particle Size, (nm.)Surface Area
(m2/g)
Pore Size
(Å)
Pore Volume
(m3/g)
Z-CL17.554.9651.541 × 1011.076 × 10−3
Z-NIT15.9731.811.838 × 1011.136 × 10−2
Z-AC15.5443.042.276 × 1011.67 × 10−2
Table 2. kapp, t1/2, R2 and degradation efficiency (%) of MB after 55 min of sunlight irradiation.
Photocatalystkapp, (min−1)t1/2 (min.)
(min)
R2Degradation (%)
Z-CL0.005138.60.9725.12
Z-AC0.06311.000.9996.46
Z-NIT0.05113.580.9694.47
Table 3. Comparison of photodegradation rate and constant and degradation efficiency % of MB using different reported photocatalysts with the developed ZnO NPs nanoparticles.
Catalyst[MB]Irradiation SourceRate Constant
(min−1)
Degradation Efficiency %Reference
ZnO (combustion method)5 mg/LSunlight0.00856--[38]
ZnO (Precipitation method) 0.03531--
Reflux chemical method10 mg/LNatural sunlight [49]
ZnO (chloride precursor) 0.0251.0
Ag (7 wt.%)/ZnO 0.0888.0
ZnO (nitrate precursor) 0.0354.0
Ag (10 wt.%)/ZnO 0.1384.0
ZnO (Acetate precursor) 0.0364.0
Ag (7 wt.%)/ZnO 0.1396.0
ZnO4.8 mg/LNatural sunlight0.0036--[54]
ZnO/CuO 0.0148--
Biosynthesizing ZnO100 mg/LNatural sunlight0.0183491.3[55]
ZnO,50 mg/LNatural sunlight--56.65%[56]
Zn0.91Cu0.03Ce0.03Cr0.03O --63.22%
Zn0.85Cu0.05Ce0.05Cr0.05O --67.28
ZnO5 mg/LPhilips 100 W Mercury Vapor Lamp (420 nm)--76.2%[57]
ZnO@GO 0.134398.4%
ZnO50 mg/LNatural sunlight0.007553%[58]
Zn0.95Co0.05O --87%
Zn0.99Co0.01O 0.03797%
Greenly synthesized ZnO “Z-AC”20 mg/LNatural sunlight0.314 at pH 1196.4This work
Table 4. Comparison between the features and efficiencies of ZnO photocatalysts prepared by different methods.
Preparation RouteApplicationCharacterization FindingsEfficiencyReference
Precipitation method using either NaOH or KOH and the sulfate, chloride, nitrates and acetates of Zn2+ followed by separation, drying and finally annealingPhotocatalytic degradation of Rhodamine B (10 ppm) under UV or visible lightEg: 3.37–3.4 eV; BET: 6–11 m2 g−1; wurtzite structure with flak, spherical and hexagonal morphology; mean size distribution (25–41.3 nm) on DLS basis. Rate constant: 0.006–0.017 min−1; t1/2 = 115.5–40.7 min.[36]
Two steps sol-gel method using zinc acetate and zinc nitrate in presence of polyethylene glycol and NH4OHPhotocatalytic degradation of 2,4-Dichlorophenoxyacetic acid and 2,4-Dichlorophenol under UV light irradiationWurtzite hexagonal
phase of
near-spherical (99.28 nm) and elongated rod-like morphology (40.94 nm); BET: 0.85–2.24 m2 g−1
Rate constant: 0.0004–0.002 min−1; t1/2 = 18.2–181.6 min.[62]
Ultrasound-assisted hydrolysis of
zinc acetate in presence of EDTA and NH4OH at different pHs.
Photocatalytic degradation of methylene blue (10 ppm) under UV lightEg: 3.24–3.3 eV; BET: 2.20–5.16 m2 g−1; wurtzite structure with hexagonal disk morphologyRate constant: 0.0159 min−1; t1/2 = 43.58 min.; 91.4%[63]
Refluxing zinc chloride, nitrate, acetate, or sulfate with hexamethylenetetramine at 95 °C for 5 hPhotocatalytic degradation of methylene blue (3.2 ppm) under UV lightEg: No data; BET: 4.83 m2 g−1; hexagonal wurtzite structure with flakes, nanowalls, nanopetals and nanodisks morphologyRate constant: 0.027 min−1; t1/2 = 25.6 min.; 94%[64]
Multistep synthetic route starting with heating zinc nitrate with garlic extract followed by drying, washing, calcination at 550 °CPhotocatalytic degradation of methylene blue (10 ppm) under solar lightEg: 2.9–3.0 eV; BET: No data; wurtzite structure with alterations in diffraction positions with rod-like hexagonal facets diameter ~30–40 nm and length
of ~100–200 nm
Rate constant: 0.009–0.0183 min−1; t1/2 = 77–37.8 min.; 94%[65]
Multistep sol-gel green synthetic route starting with precipitation of mixture from zinc acetate ethanolic solution and ginger aqueous extract using NaOH followed by steps of long sonication, overnight heating, washing and finally drying.Photocatalytic degradation of methylene blue (10 ppm) under UV lightEg: 3.09–3.2eV; BET: 6.1–27.7 m2 g−1; Either pure hexagonal or orthorhombic phases; Nanoflakes and flower-like structure with average particle size of ~66–120 nmRate constant: No data; t1/2 = No data; Efficiency: 44–83% after 150 min of UV illumination[66]
Multistep green synthetic route starting with mixing zinc nitrate with hot solution of Moringa oleifera leaves extract, then boiling until paste formation followed by calcination at 500 °C for 2 h.Photocatalytic degradation of phenol, Toluene, xylene (10 ppm), cresol (20 ppm) under illumination of Xenon lamp (1500 W)Eg: 3.16 eV; BET: 19.7 m2 g−1; hexagonal wurtzite phase phases; nearly spherical shaped particles with average size of ~9–18 nmRate constant: No data; t1/2 = No data; Efficiency: 51–93% after 180 min of Xenon lamp illumination[67]
One-pot biogenic combustion route (450 °C, 2 h) using zinc nitrate mixed with different concentrations from bio-capping agent.Photocatalytic degradation of flumequine antibiotic (15 ppm) under solar lightEg: 3.07 eV; BET: 31.81 m2 g−1; Defective hexagonal wurtzite structure;
Morphology is mostly spherical/hemispherical, some hexagonal and square shapes with particle sizes (6.3 to 26.4 nm)
Rate constant: 0.0397 min−1; t1/2 = 17.45 min.; 97.6%[8]
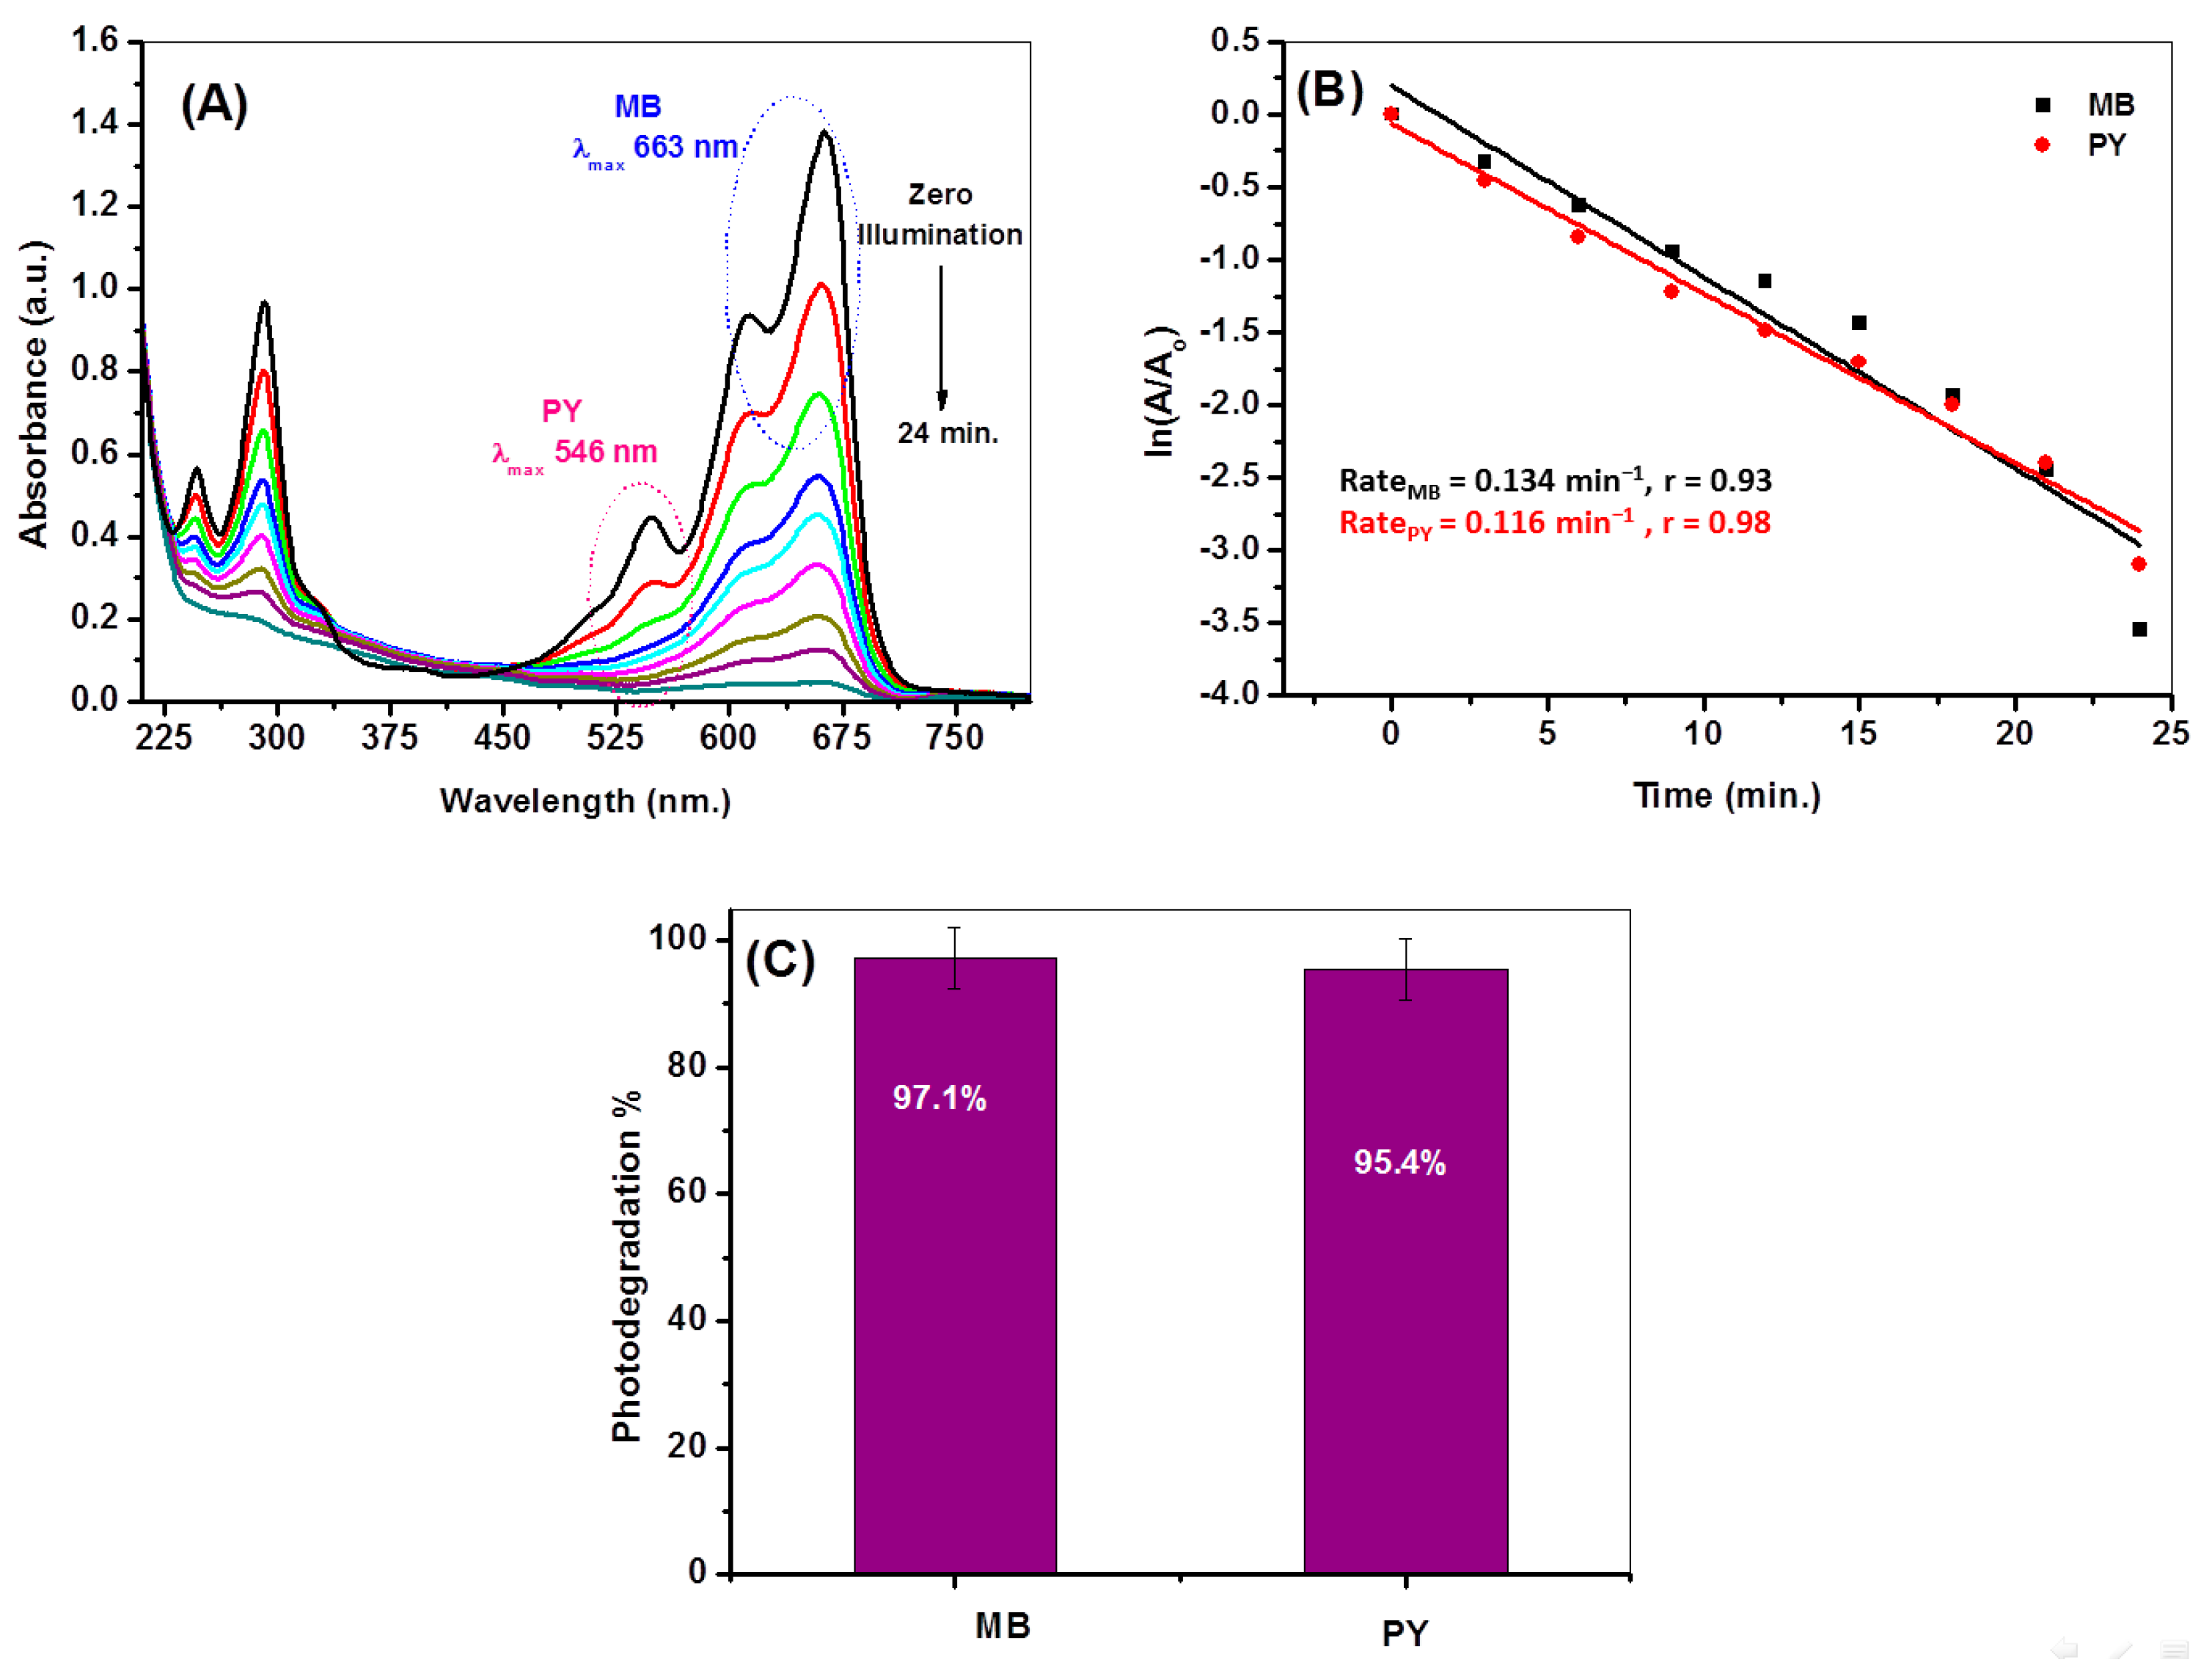
One-pot biogenic combustion route using chloride, acetate and nitrate zinc precursorsPhotocatalytic degradation of methylene blue (MB, 20 ppm) at pH 11 and pyronine Y (PY, 18 ppm)
under solar light
(Photodegradation also examined on dyes spiked in natural lake water)
Eg: 2.81–3.49 eV; BET: 4.96–43.04 m2 g−1; monocrystalline wurtzite structure with alterations in diffraction positions with microrod-like hexagonal morphology, particle size 15.4 nm.(MB)
Rate constant: 0.314 min−1; t1/2 = 2.2 min.; 96.46%
(PY)
Rate constant: 0.116 min−1; t1/2 = 5.9 min.; 95.4%
This work
Disclaimer/Publisher’s Note: The statements, opinions and data contained in all publications are solely those of the individual author(s) and contributor(s) and not of MDPI and/or the editor(s). MDPI and/or the editor(s) disclaim responsibility for any injury to people or property resulting from any ideas, methods, instructions or products referred to in the content.

