

A New Perspective on Hydrogen Chloride Scavenging at High Temperatures for Reducing the Smoke Acidity of PVC Cables in Fires. II: Some Examples of Acid Scavengers at High Temperatures in the Condensed Phase


Abstract
:1. Introduction
- -
- the increase in the temperature severely affects their scavenging performance.
- -
- at 950 °C, they go into crisis due to the too fast evolution of HCl in the gas phase.
2. Materials and Methods
2.1. Materials
2.2. Test Apparatus
2.3. Sample Preparation
2.4. Internal Tests and International Technical Standards Used
3. Results
3.1. First Series of Formulations
3.2. Second Series of Formulations
3.3. Third Series of Formulations
3.4. The Efficiency of Scavenging
4. Discussion
4.1. Description of Used Acid Scavengers and Why They Have Been Selected
- -
- GCC and PCC highlight the impacts of particle size on scavenging efficiency.
- -
- AS-1B and AS-6B are mixtures of basic substances (different kinds and concentrations), comparing their performances with PCC, the standard acid scavenger for PVC.
- -
- Al(OH)3 shows the behavior of an inert and scarcely reactive acid scavenger.
- -
- Mg(OH)2 shows what happens when the reaction product with HCl decomposes.
4.2. Effect of Chemical Properties of a Substance on Efficiency
4.3. Effect of Particle Size on Efficiency
4.4. Effect of Dispersion on Efficiency
4.5. Effect of Temperature on Efficiency
4.6. Effect of Decomposition of Reaction Products on Efficiency
4.7. Focus on the Single Acid Scavenger
4.7.1. Single-Step Reaction: GCC
4.7.2. No Reaction: Al(OH)3
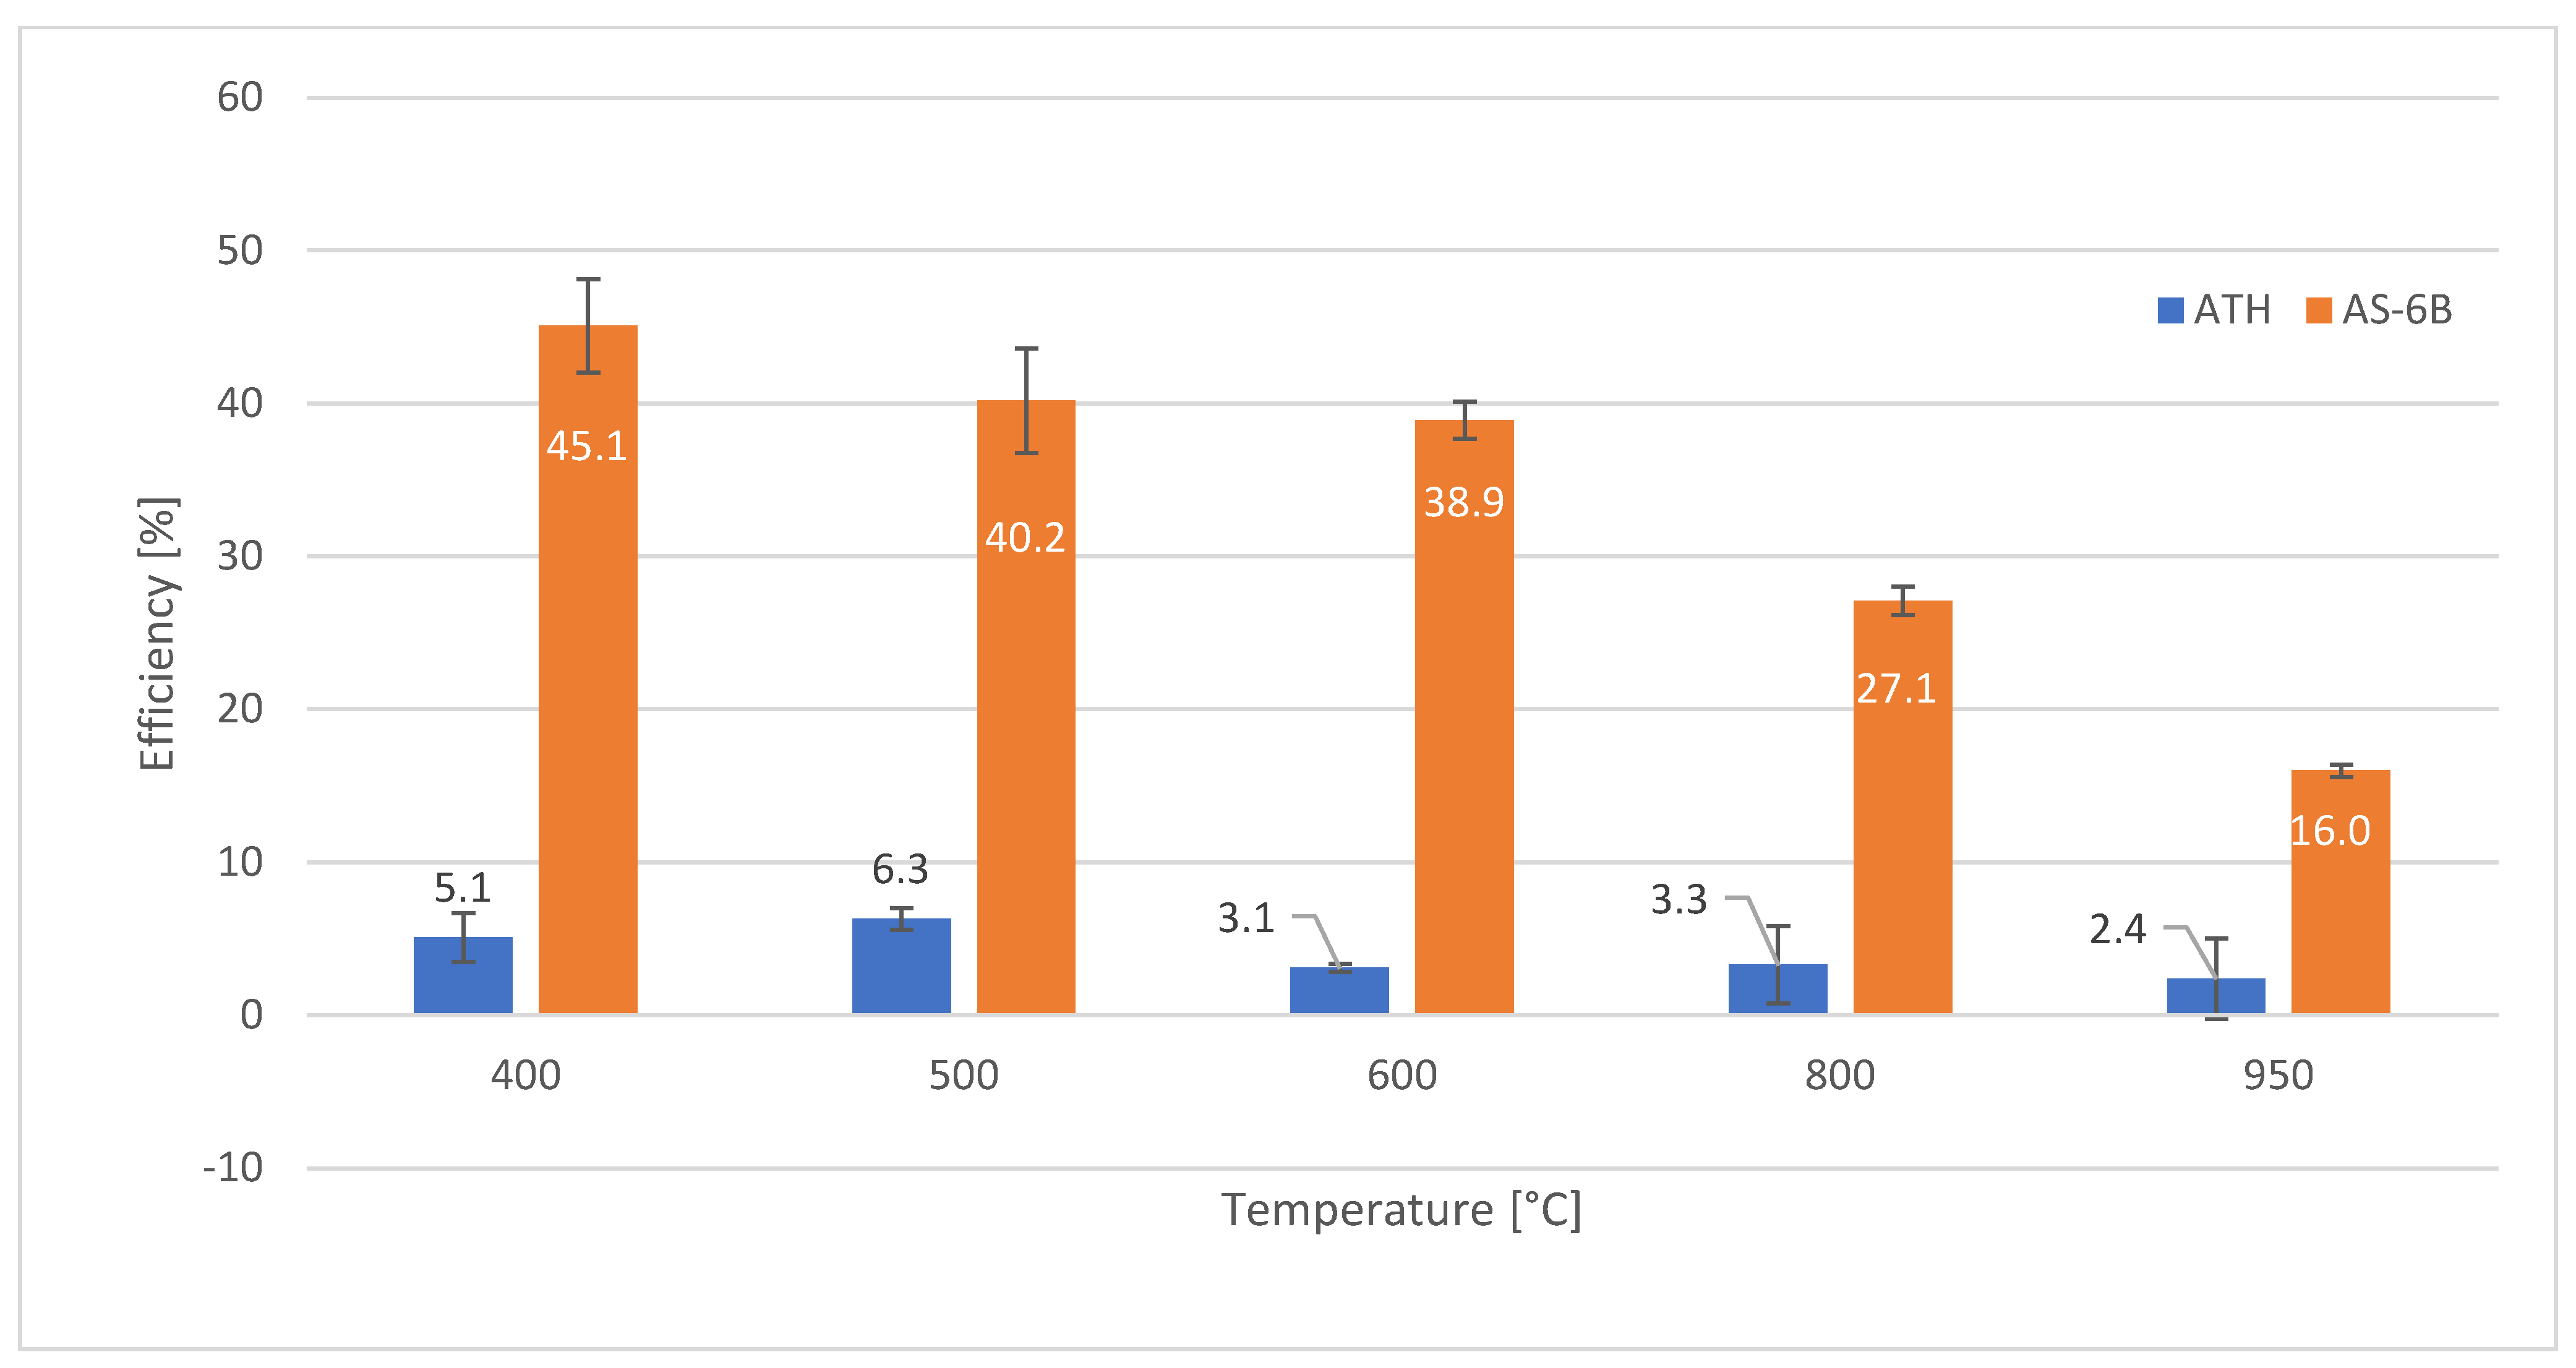
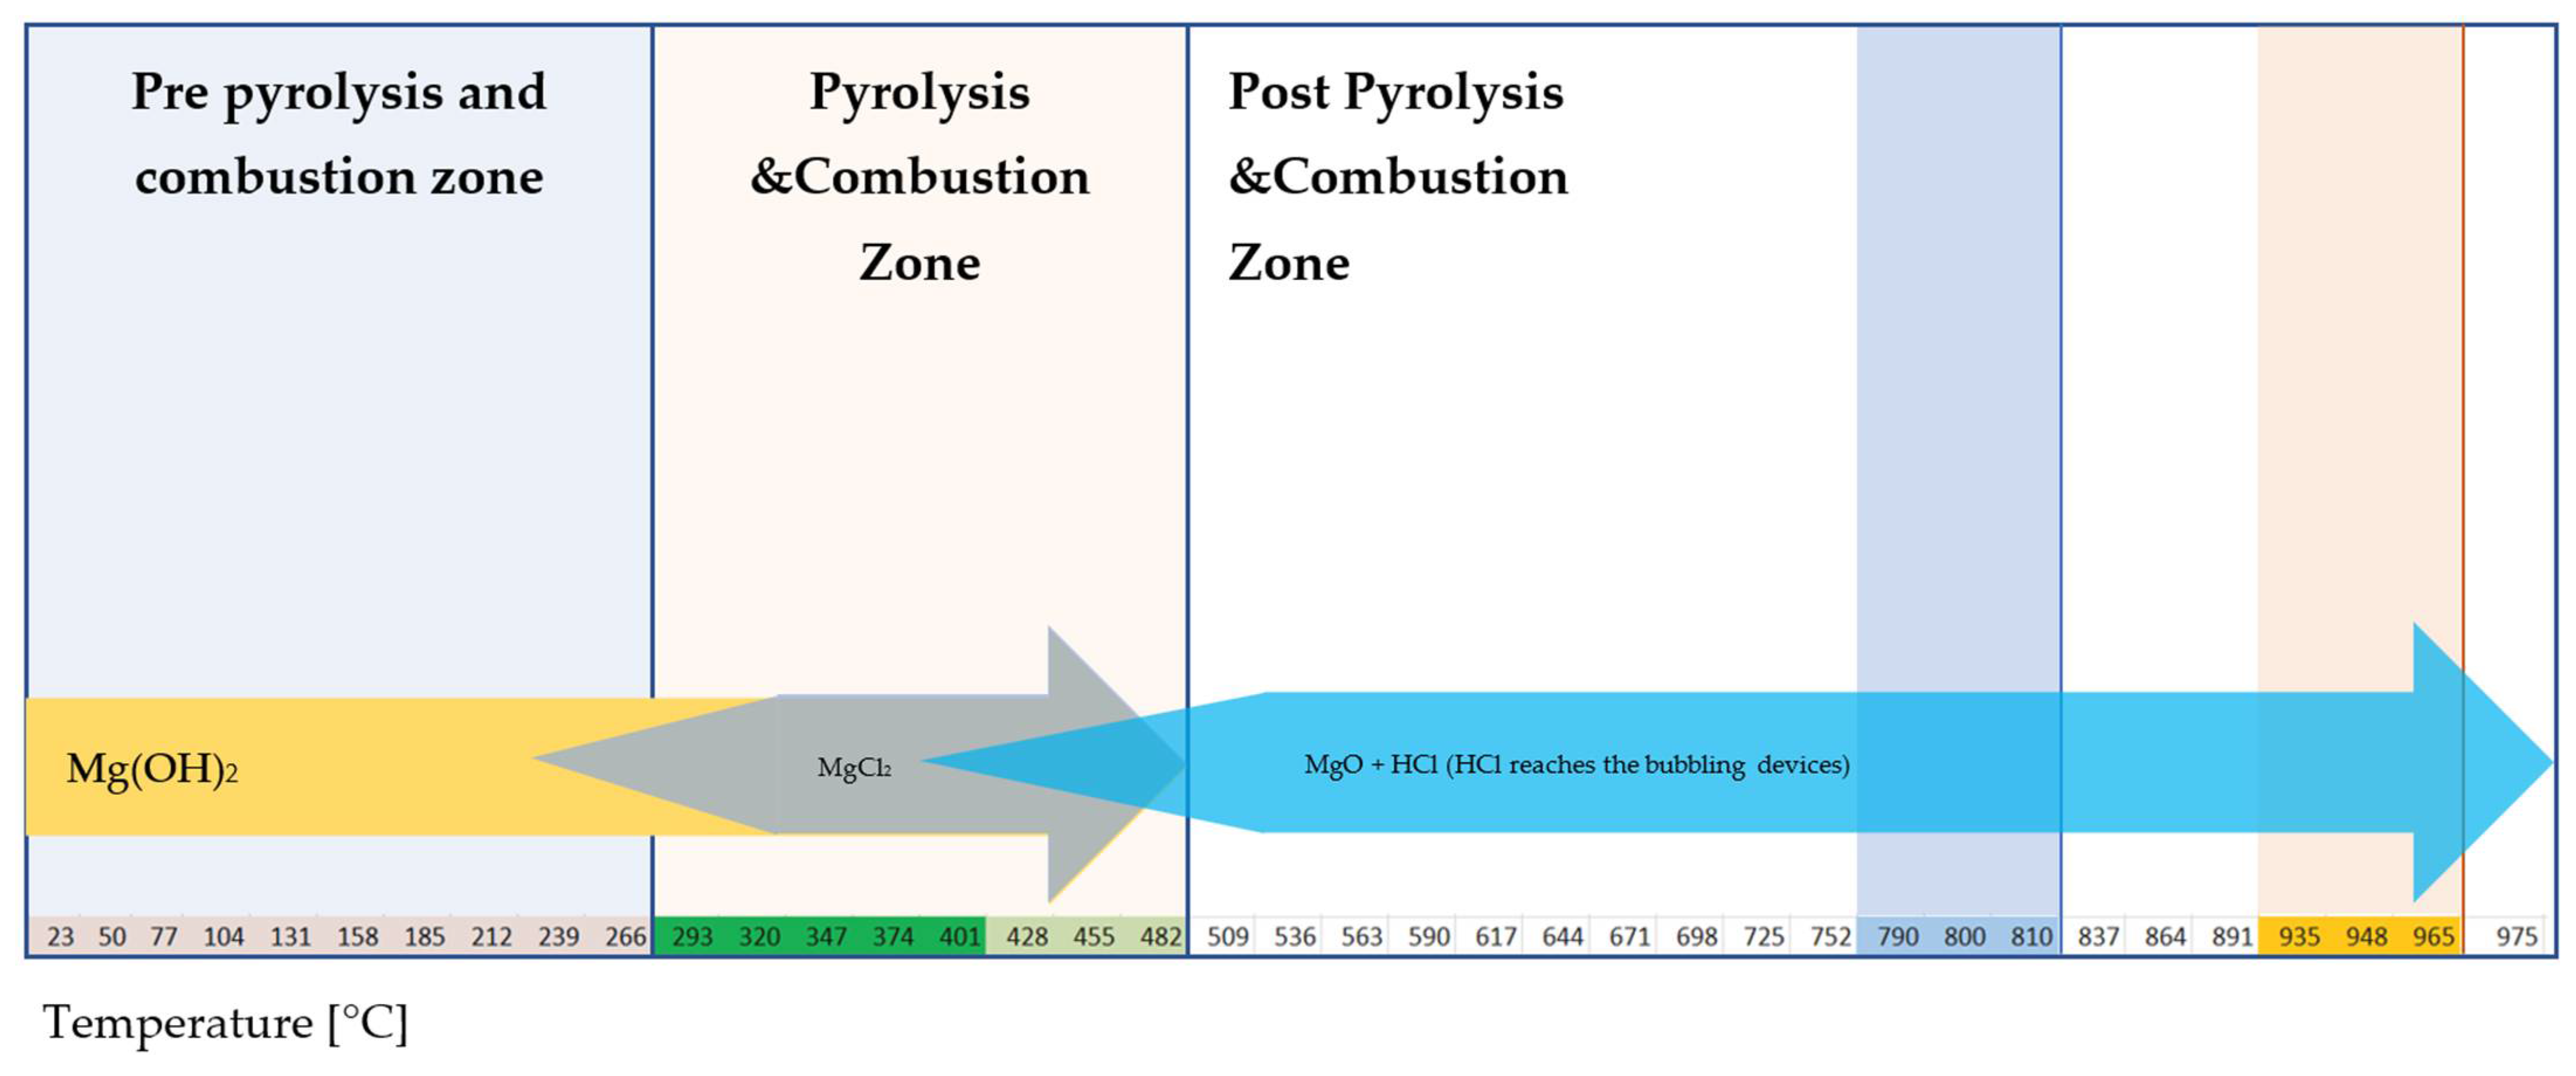
4.7.3. Single-Step Reaction: Mg(OH)2
4.7.4. Single-Step Reaction: PCC
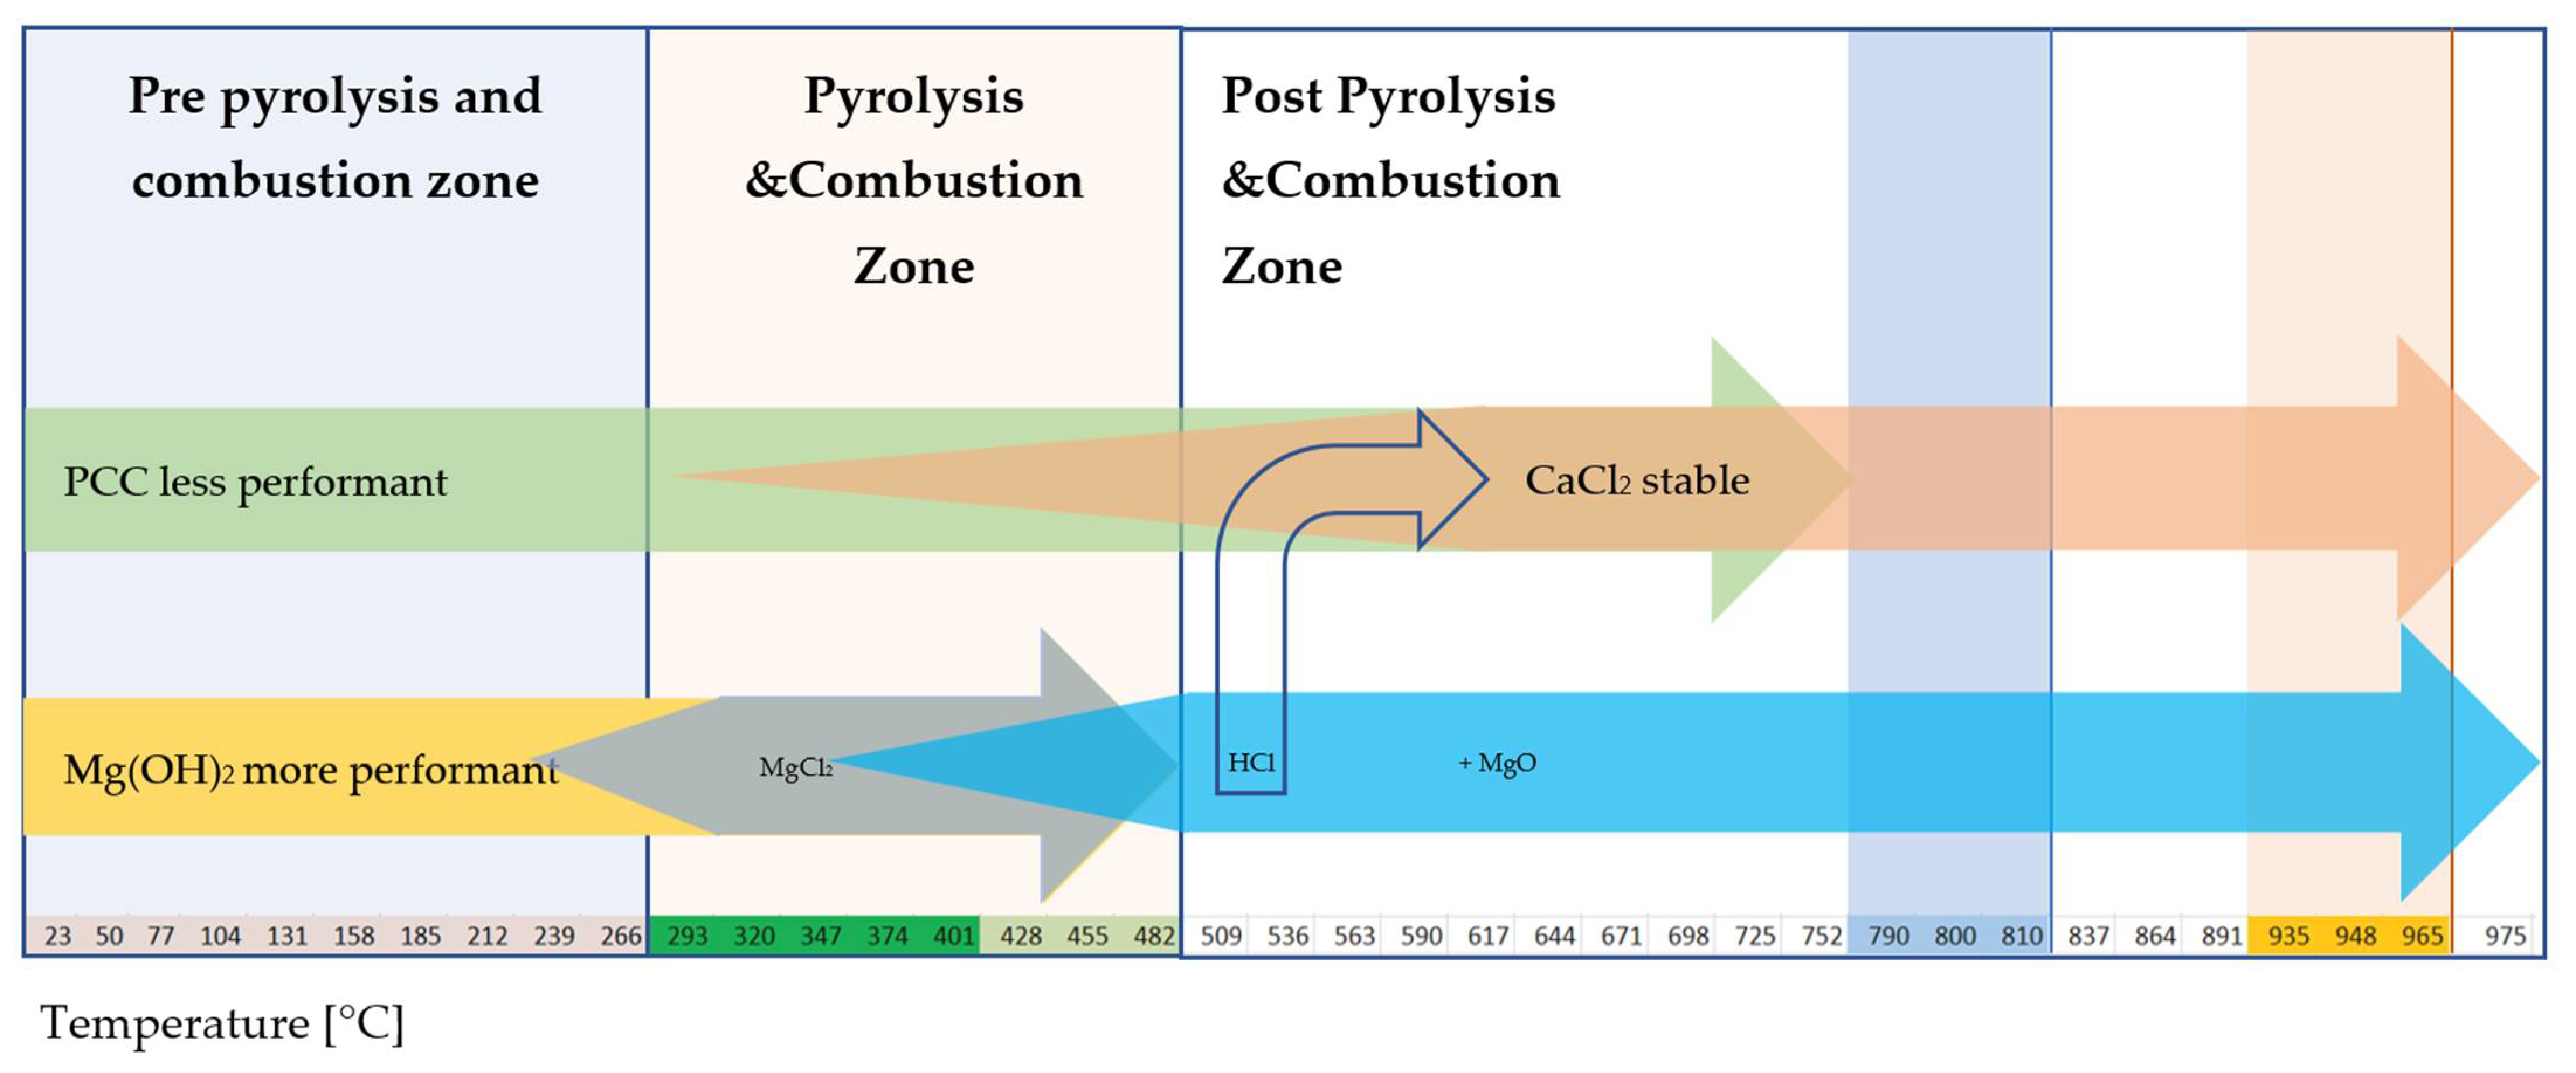
4.7.5. Multiple-Step Reaction: PCC and Mg(OH)2
5. Conclusions
Supplementary Materials
Funding
Institutional Review Board Statement
Data Availability Statement
Acknowledgments
Conflicts of Interest
Glossary/Nomenclature/Abbreviations
| PVC | poly(vinyl chloride); |
| HCl | hydrogen chloride; |
| EU | European Union; |
| CPD | Construction Product Directive; |
| CPR | Construction Product Regulation; |
| PCC | Precipitated Calcium Carbonate; |
| CCC | Ground Calcium Carbonate; |
| Phr | Part per Hundred Resin; |
| DINP | Di Iso Nonyl Phthalate; |
| ESBO | Epoxidized Soy Bean Oil; |
| COS | Calcium Organic Stabilizer; |
| DDW | Double Deionized Water; |
| μ | Mean |
| SD | Standard Deviation; |
| CV | Coefficient of variation; |
| MAE | Molar Absorption Efficiency |
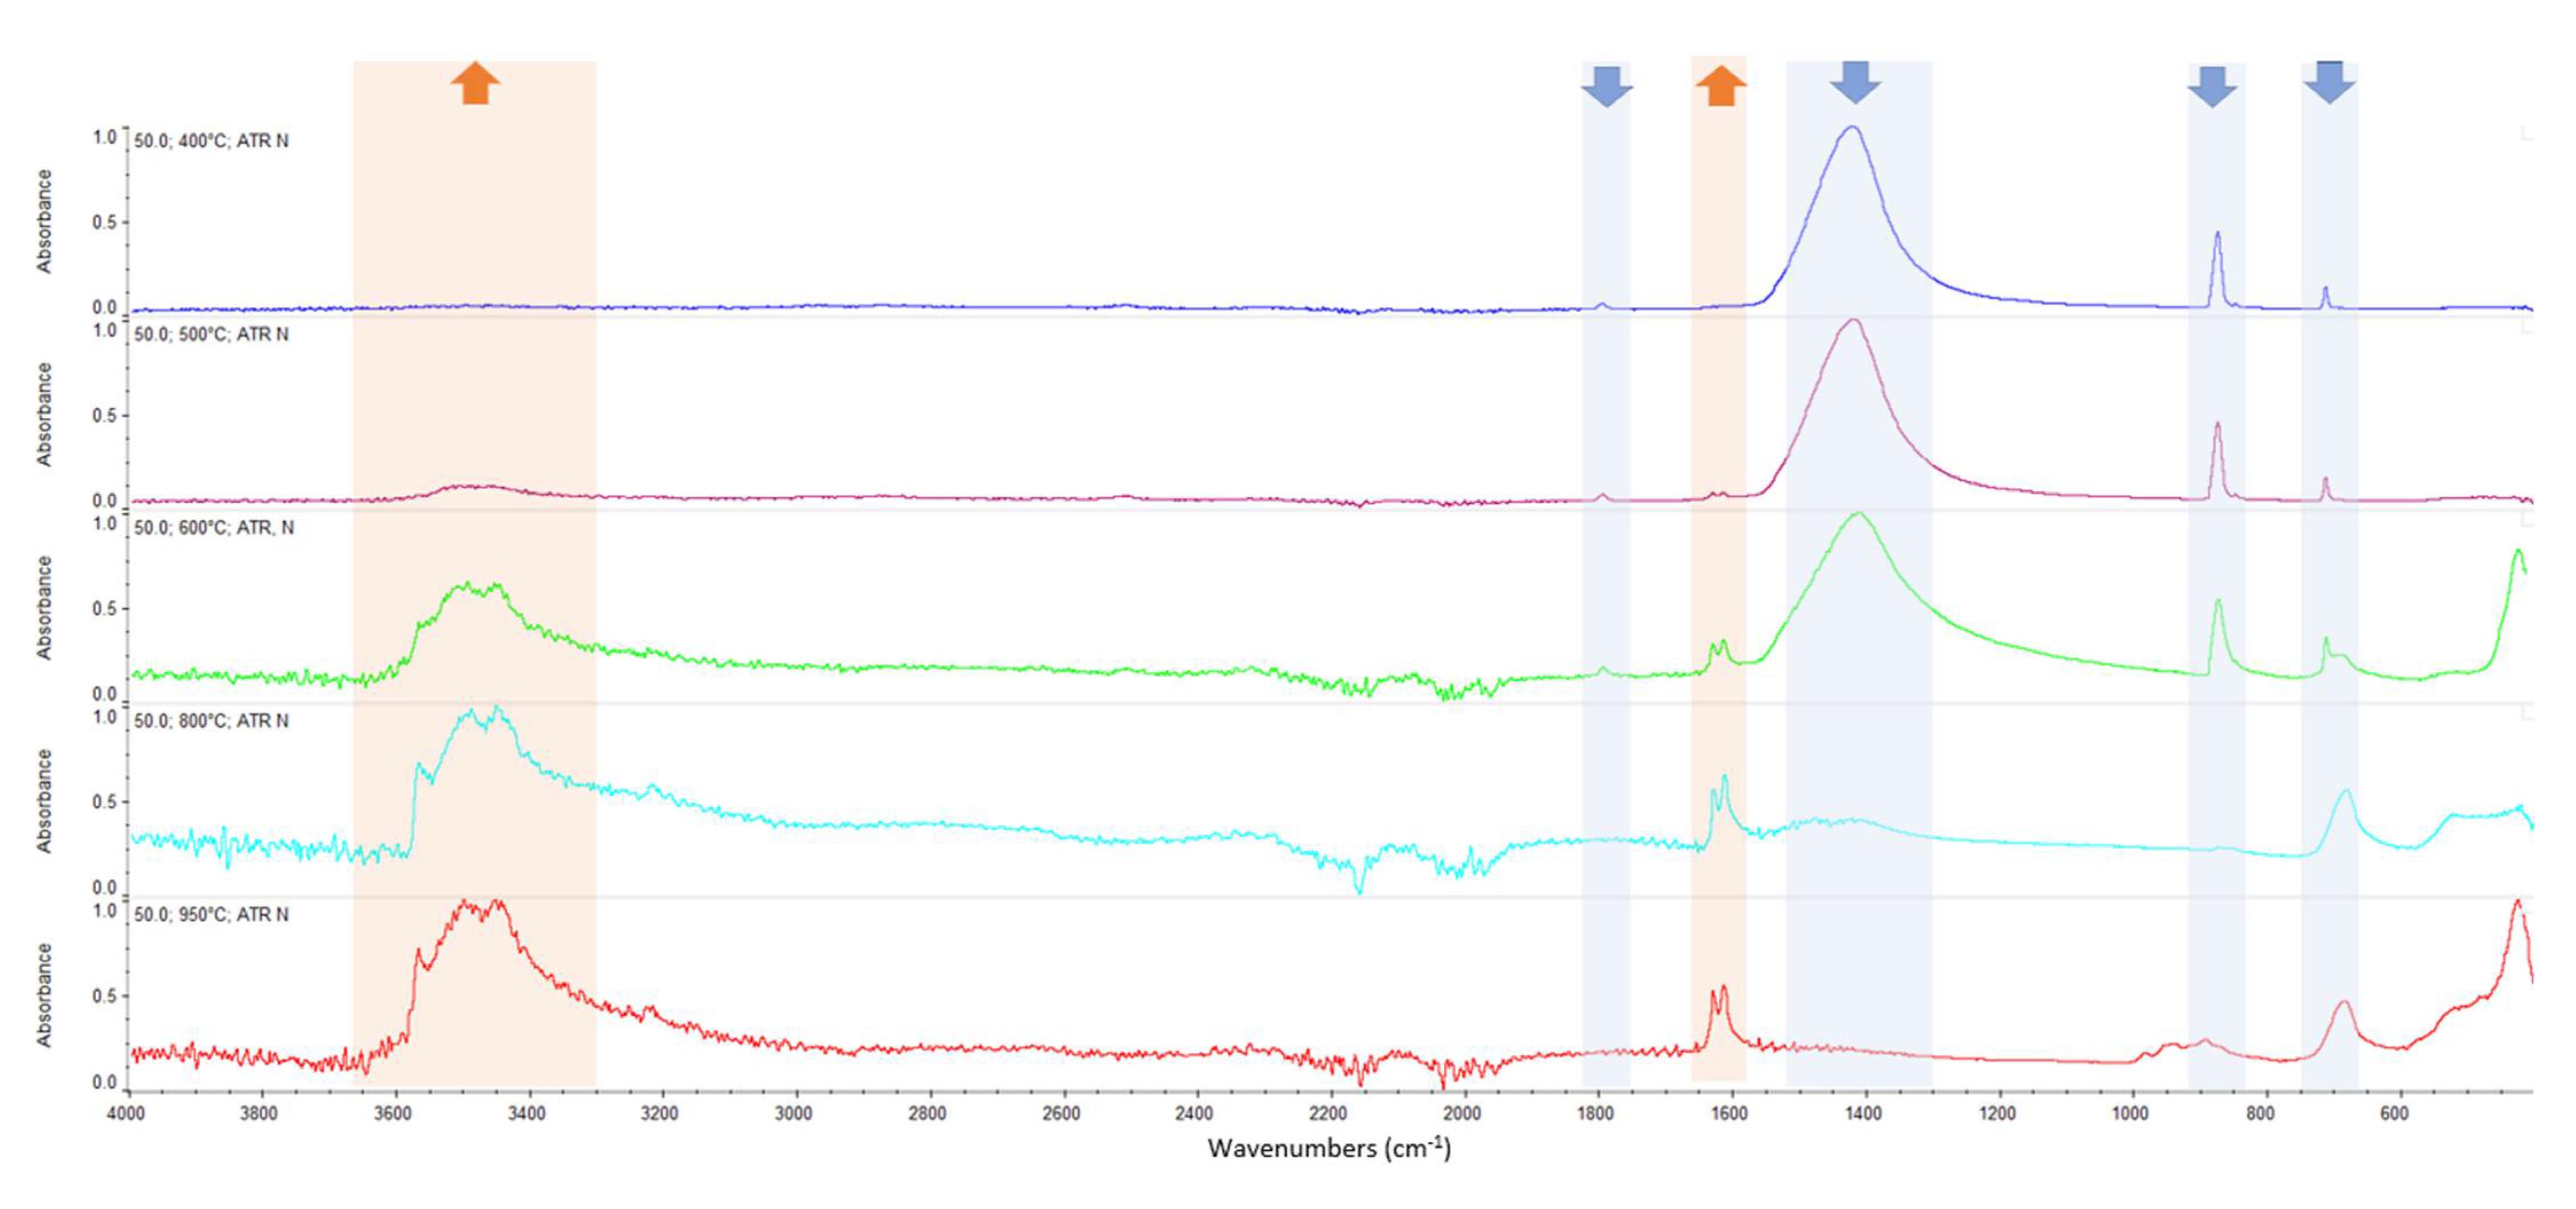
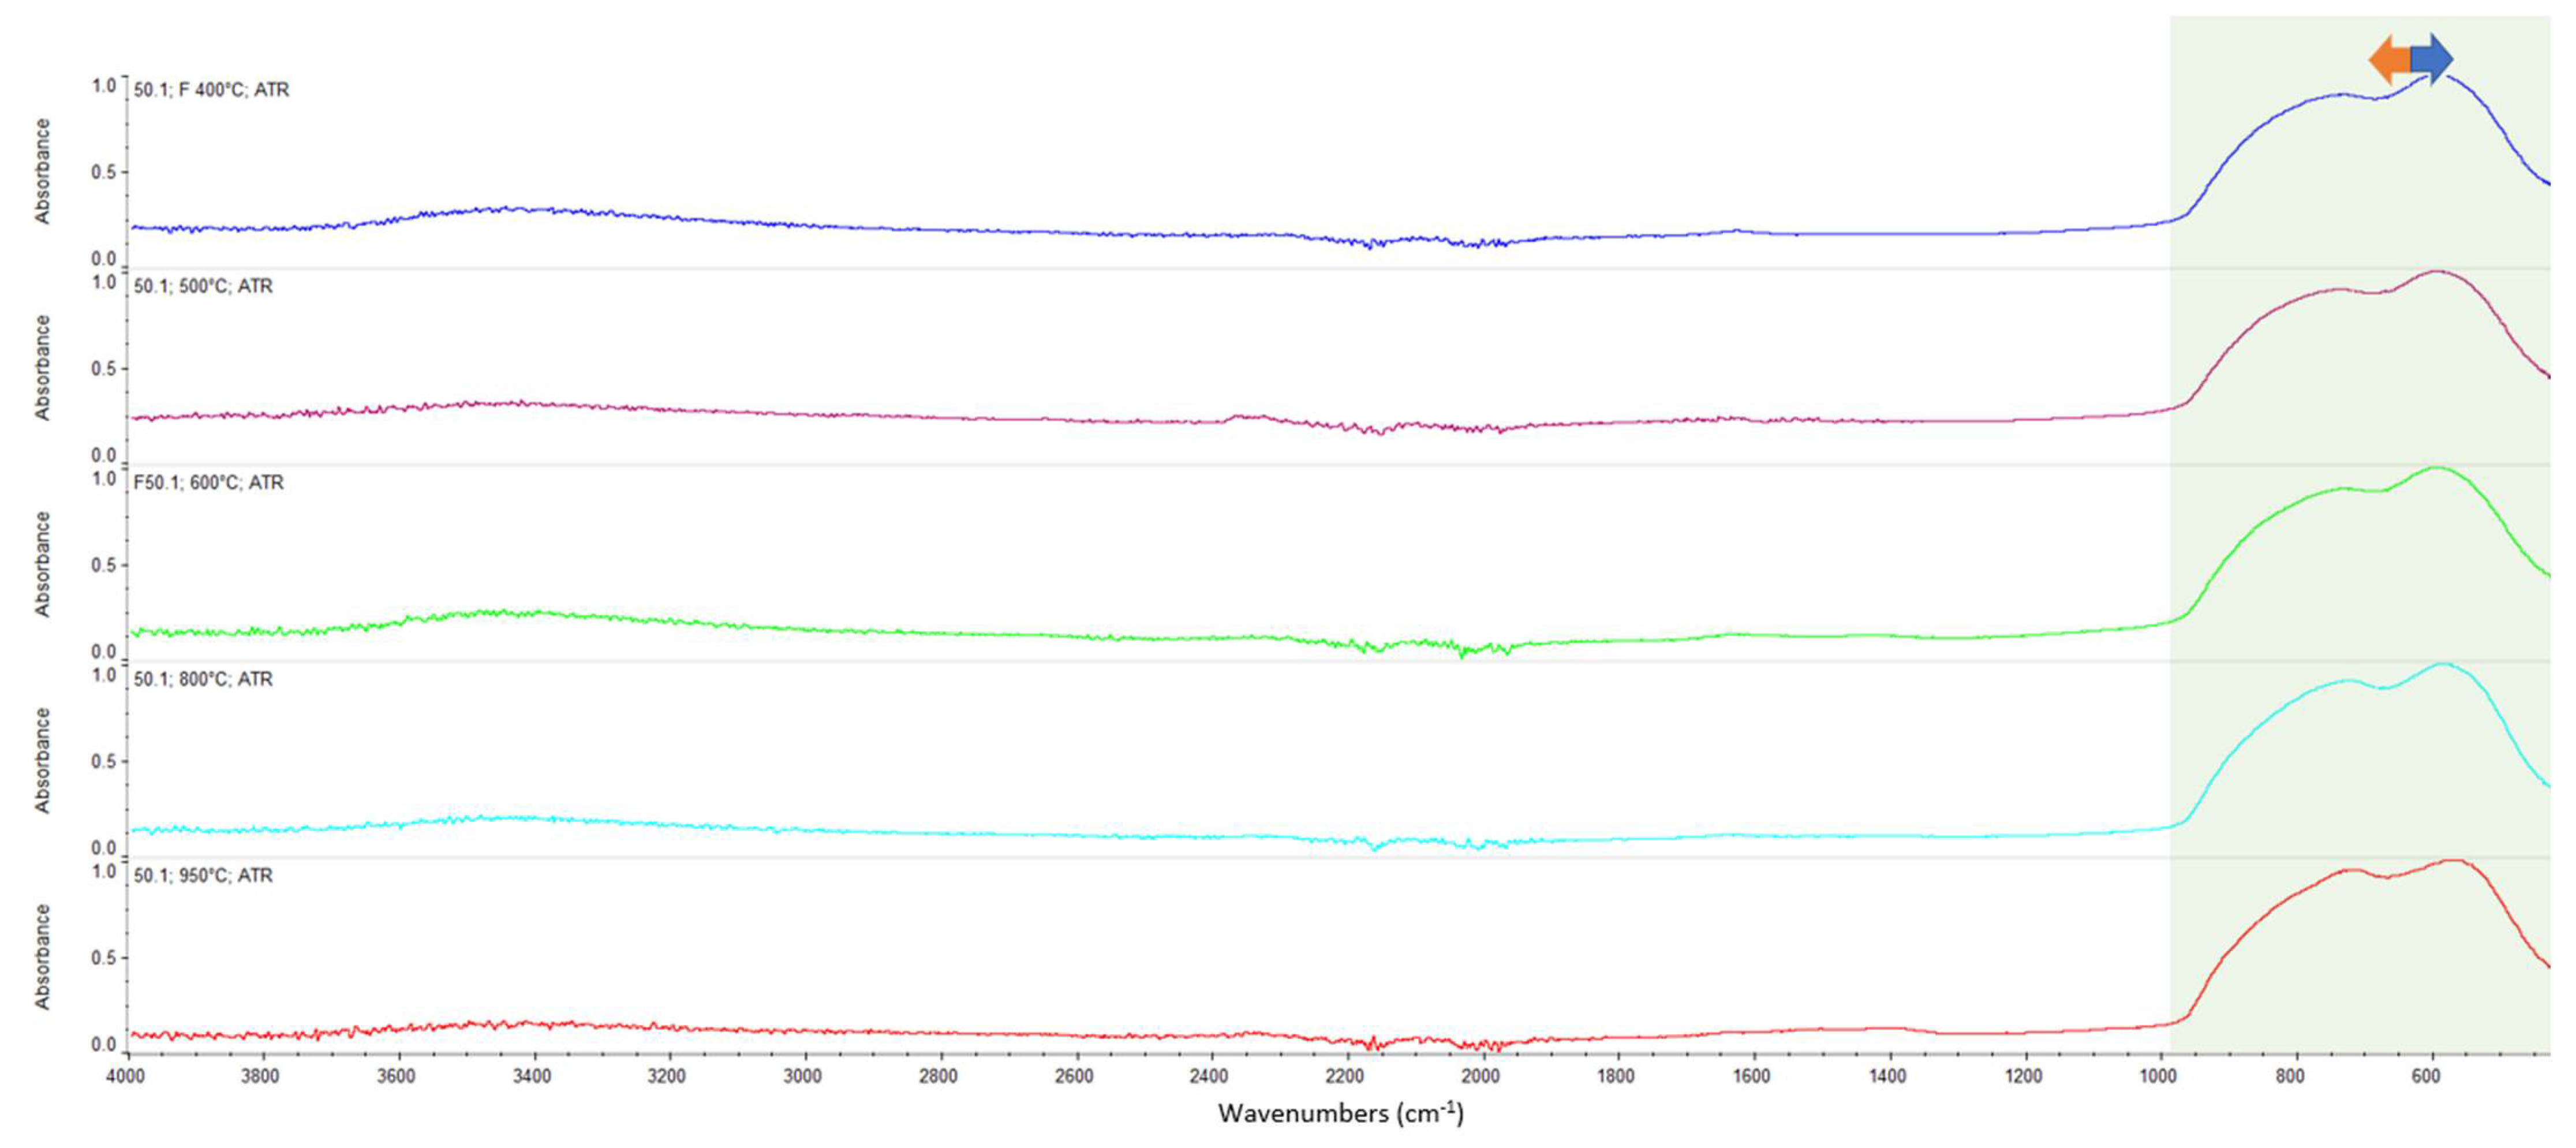
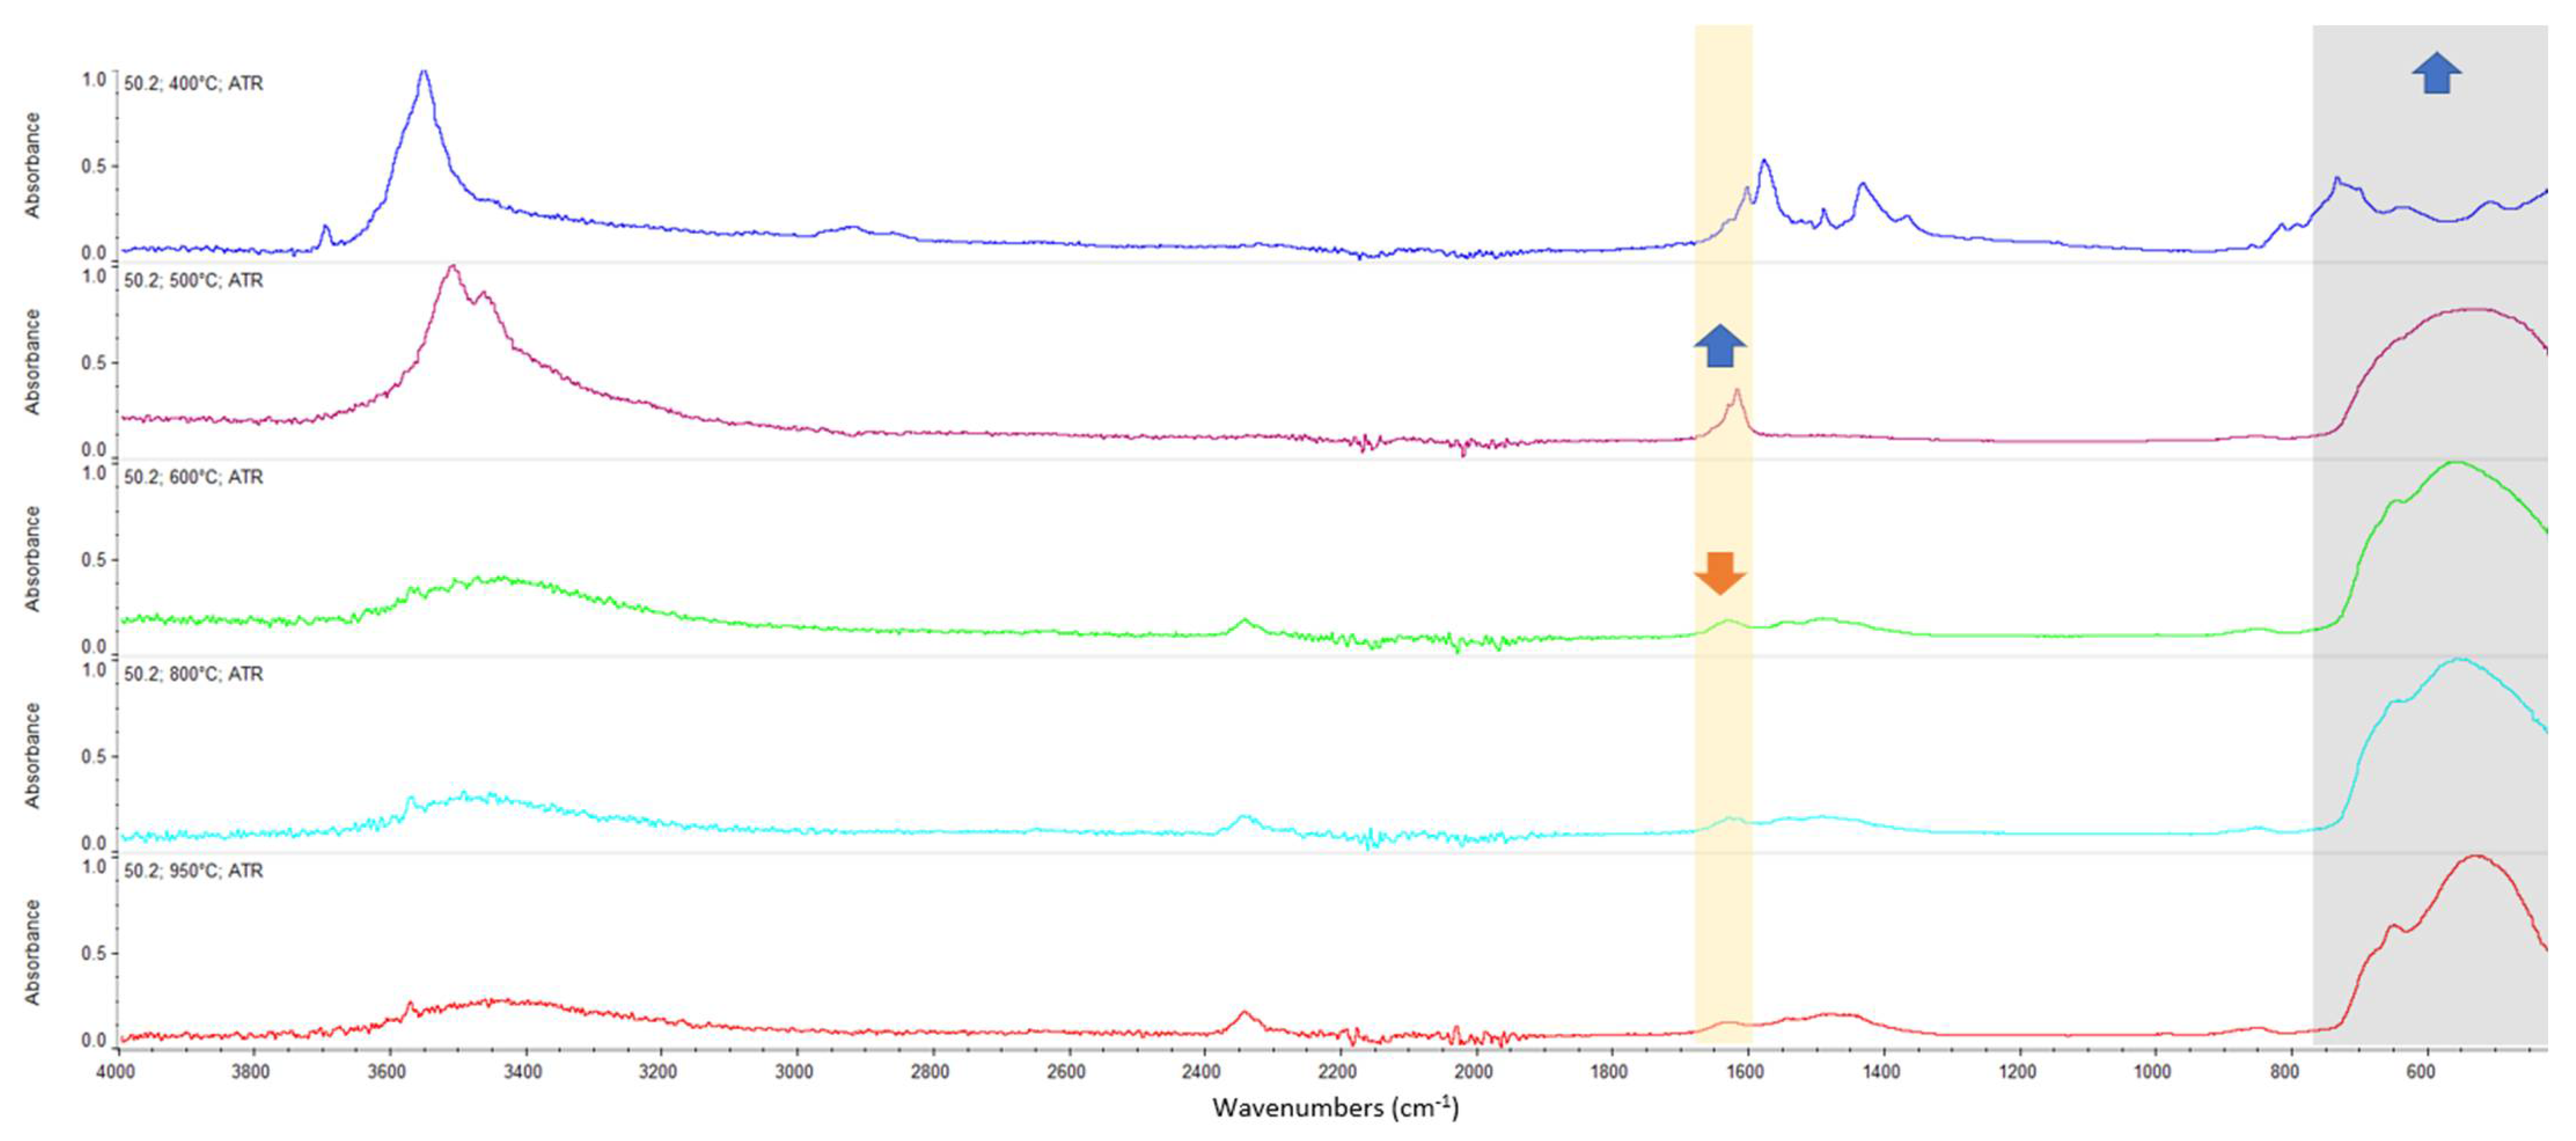
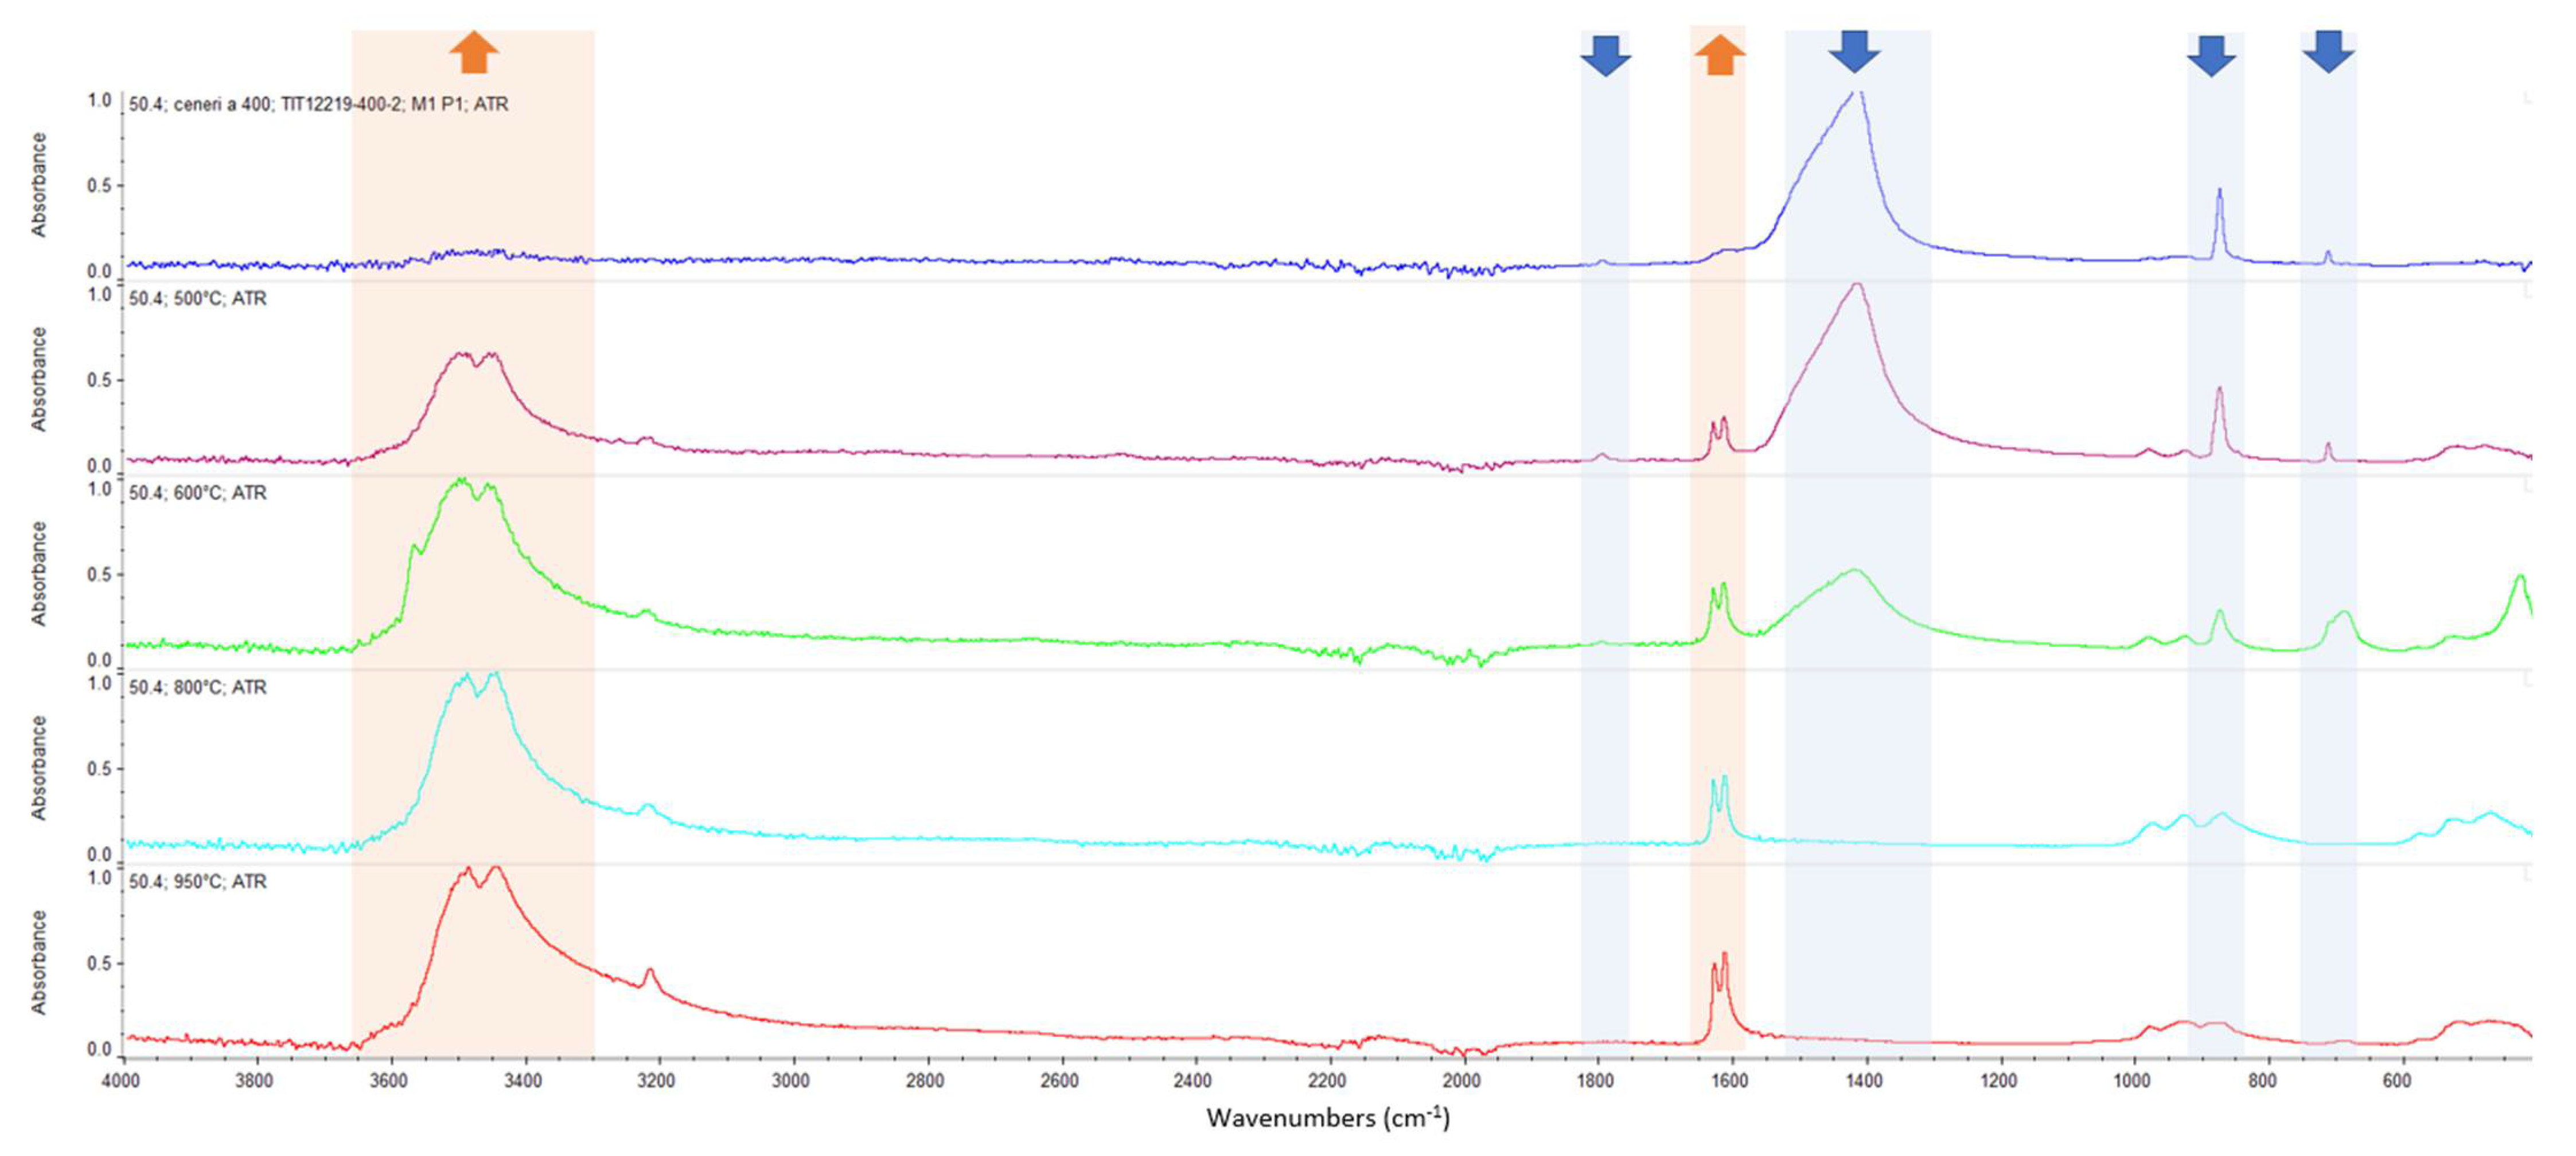
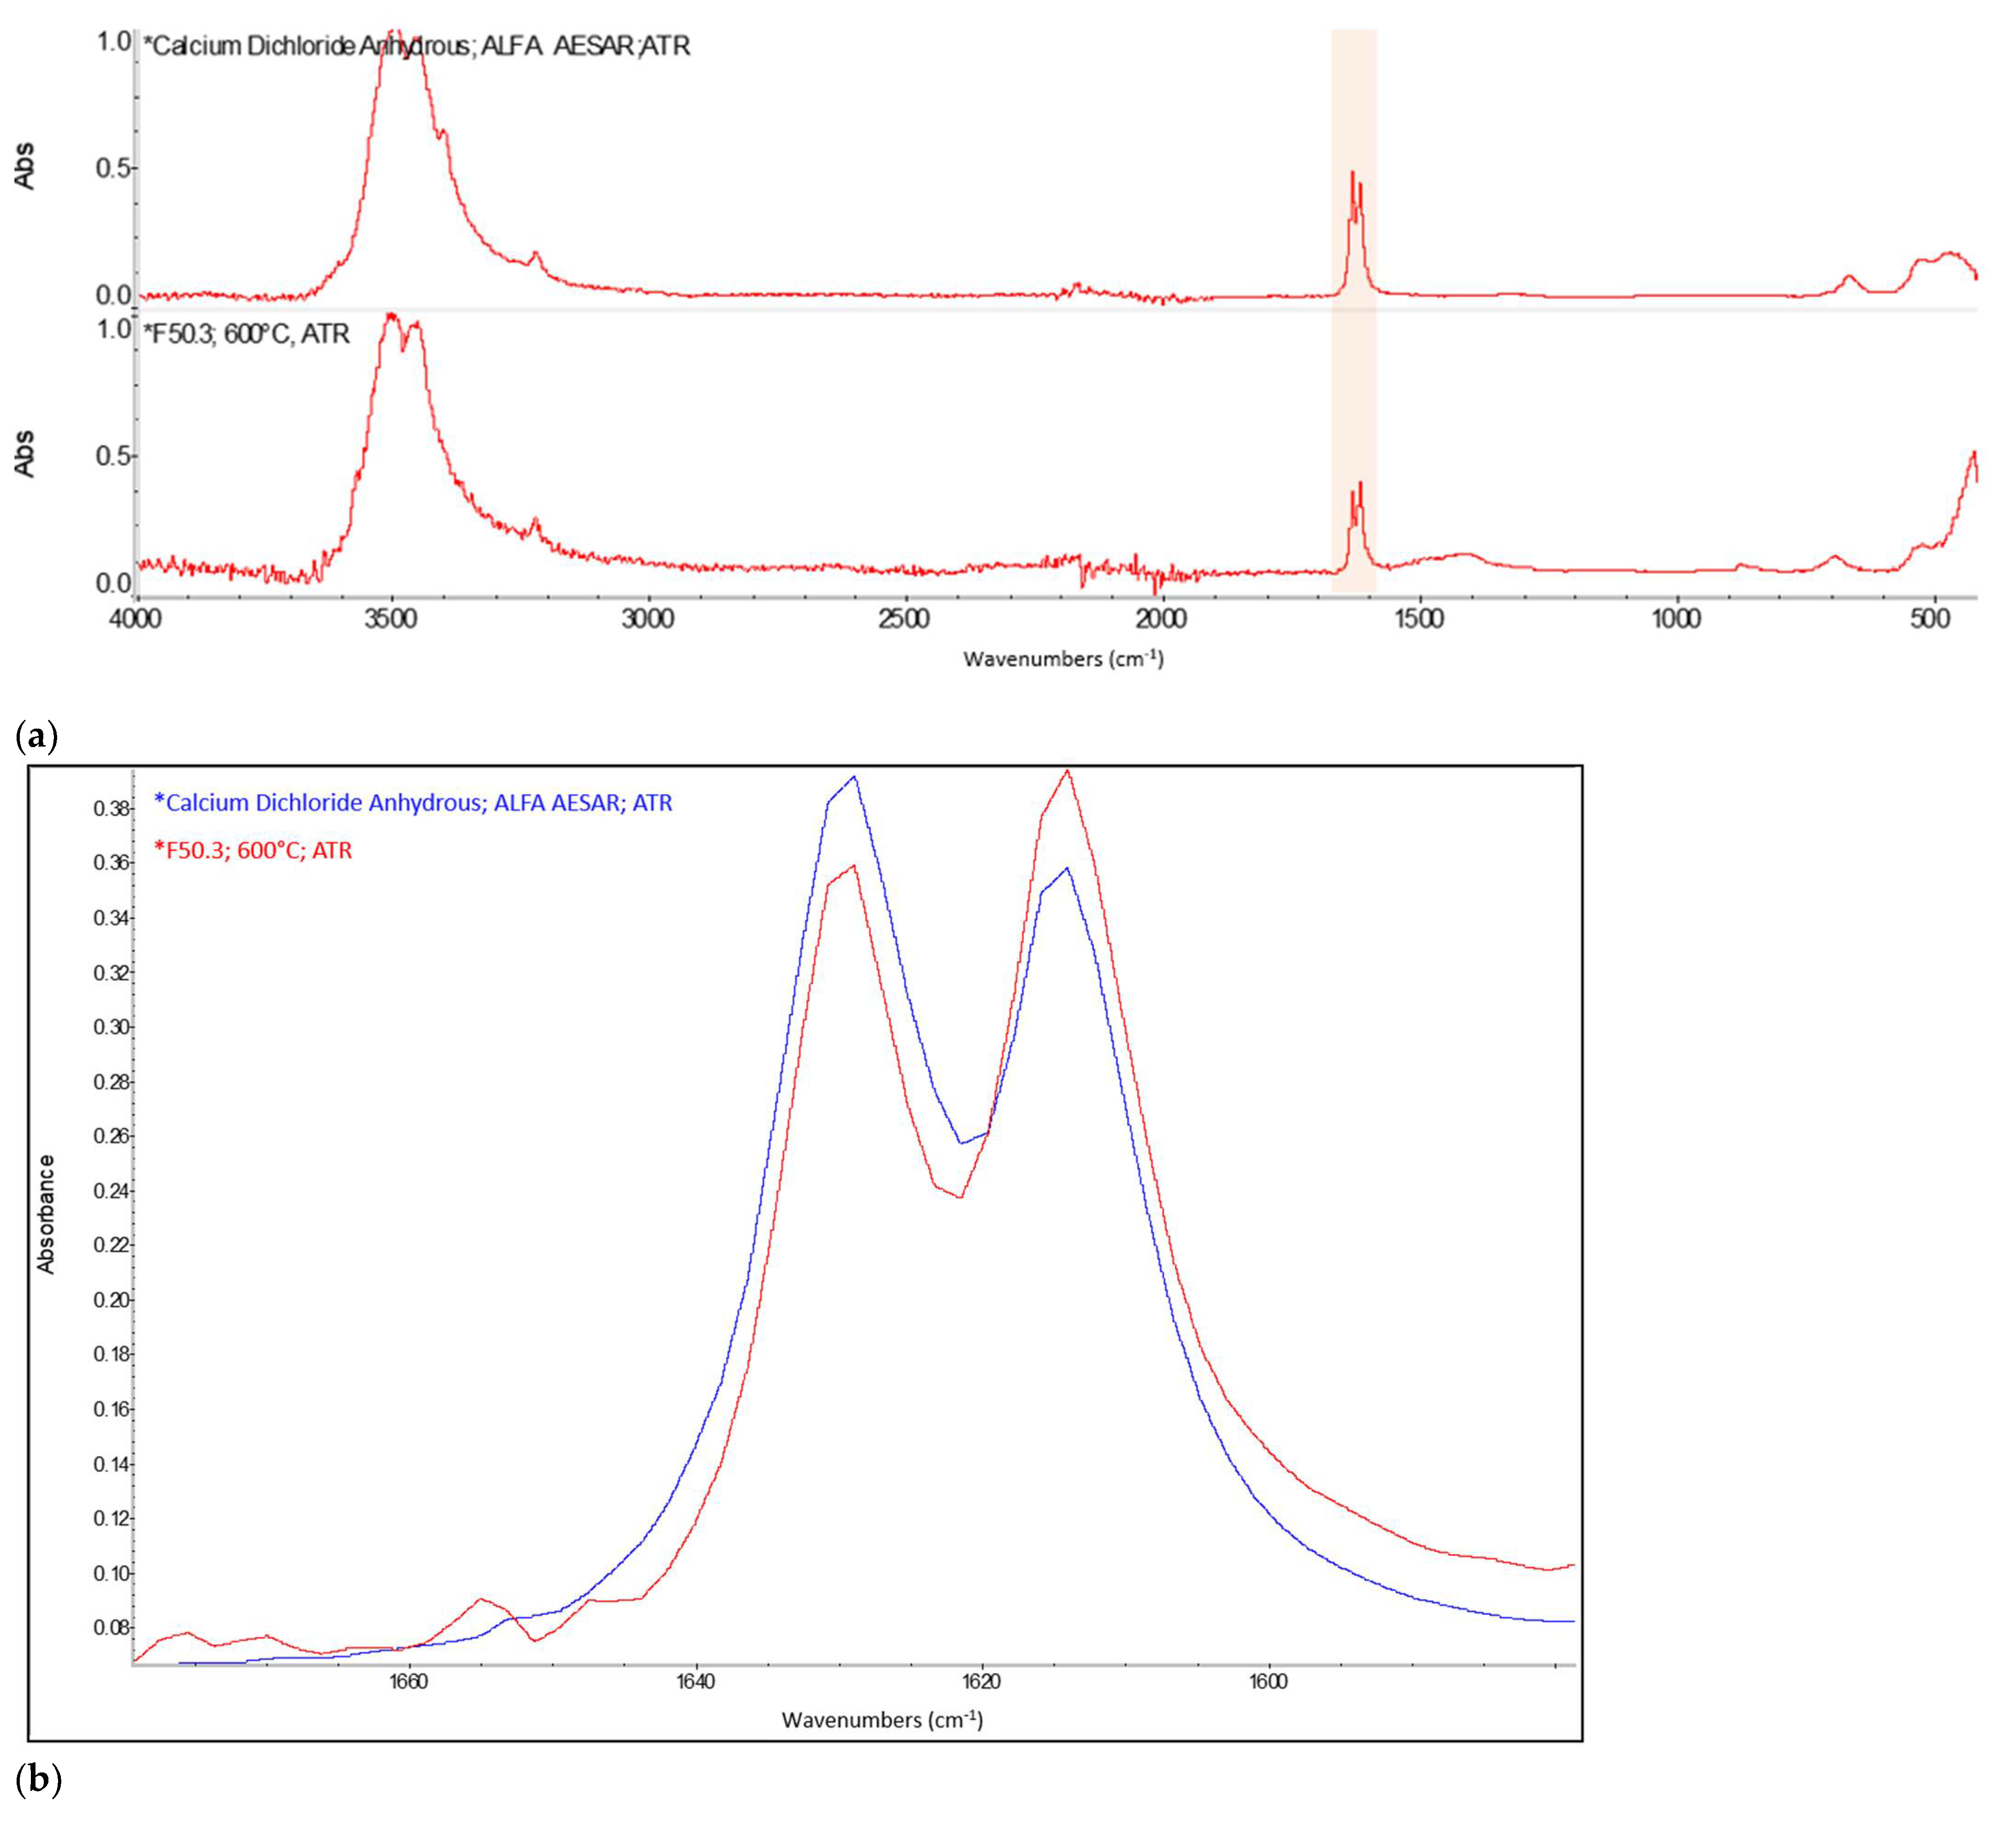
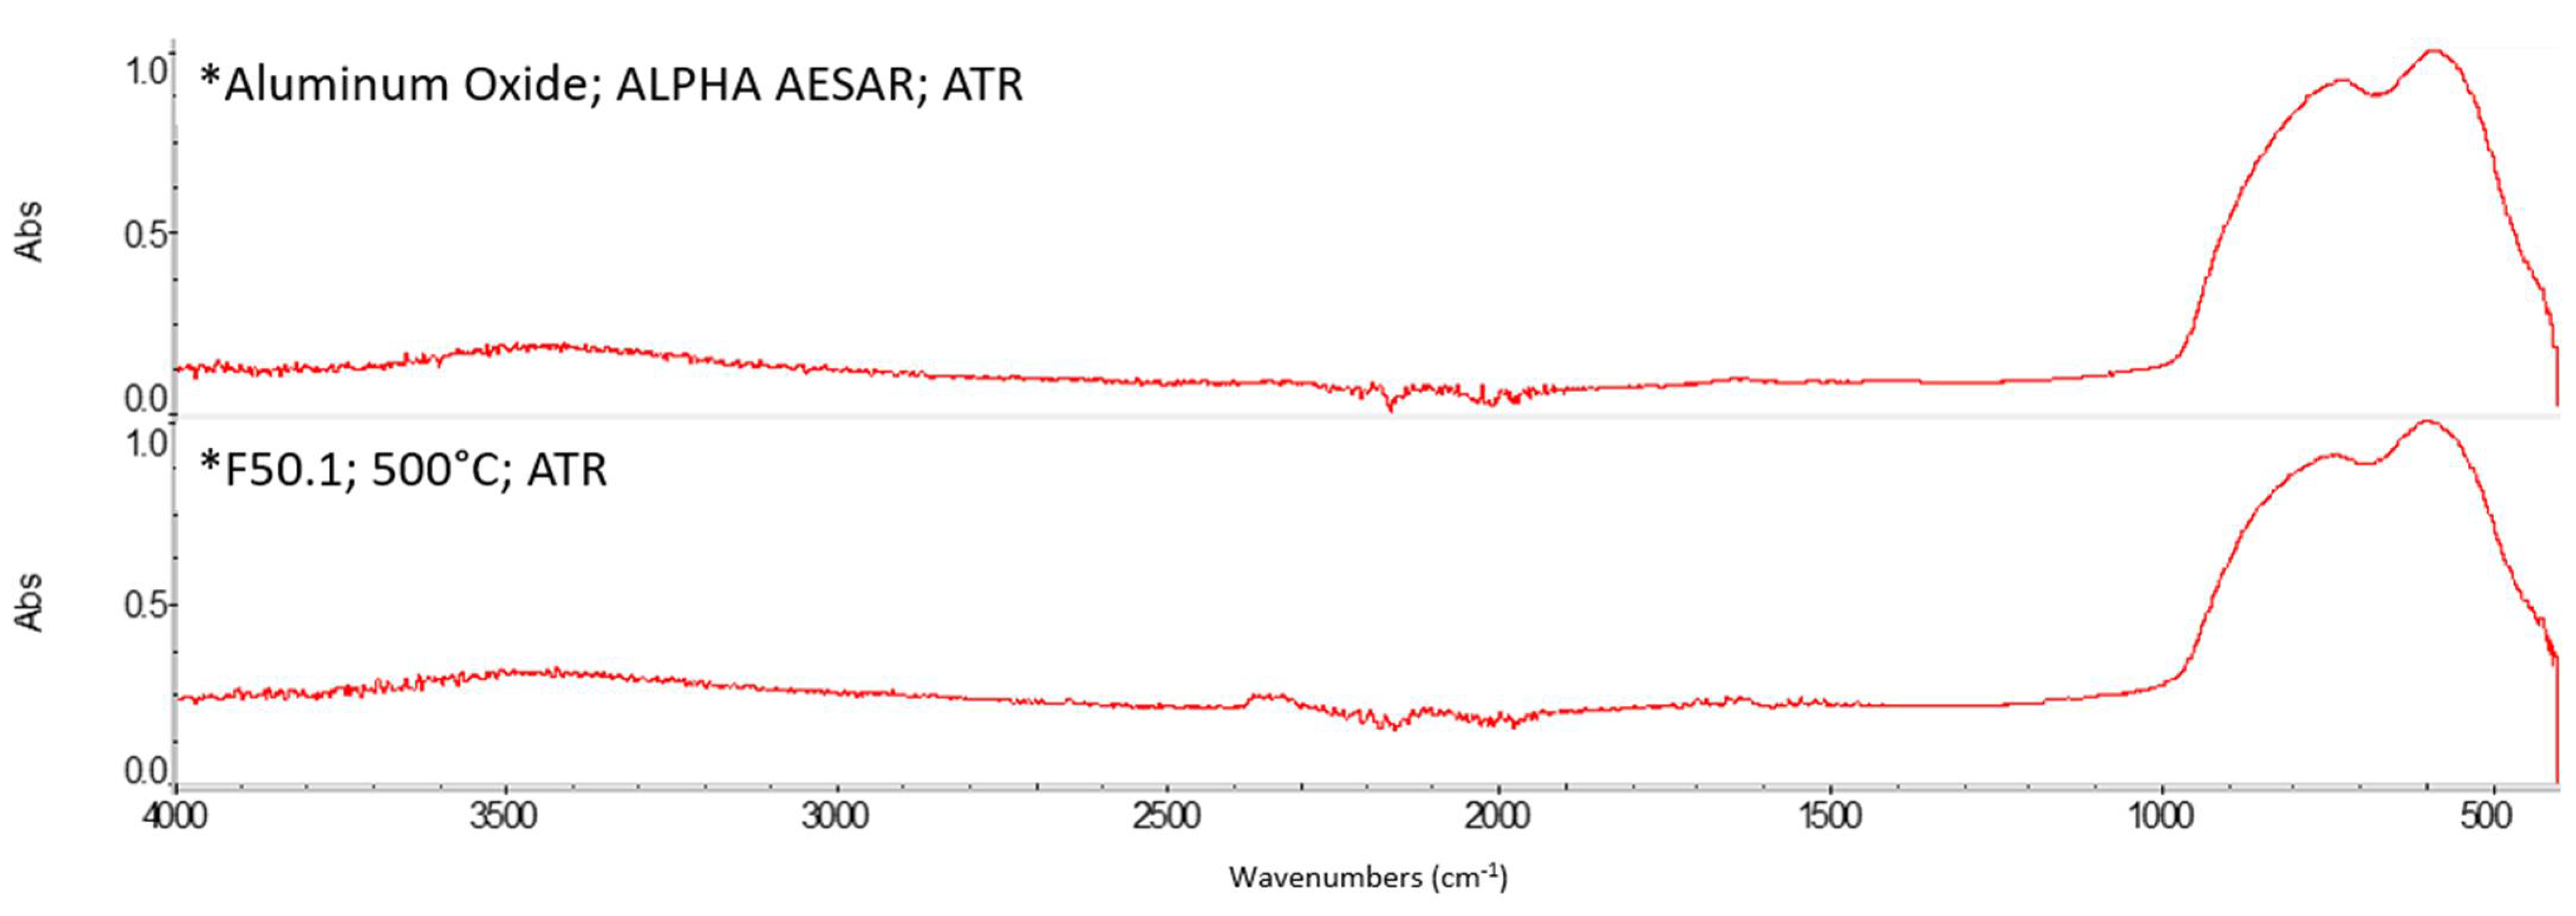
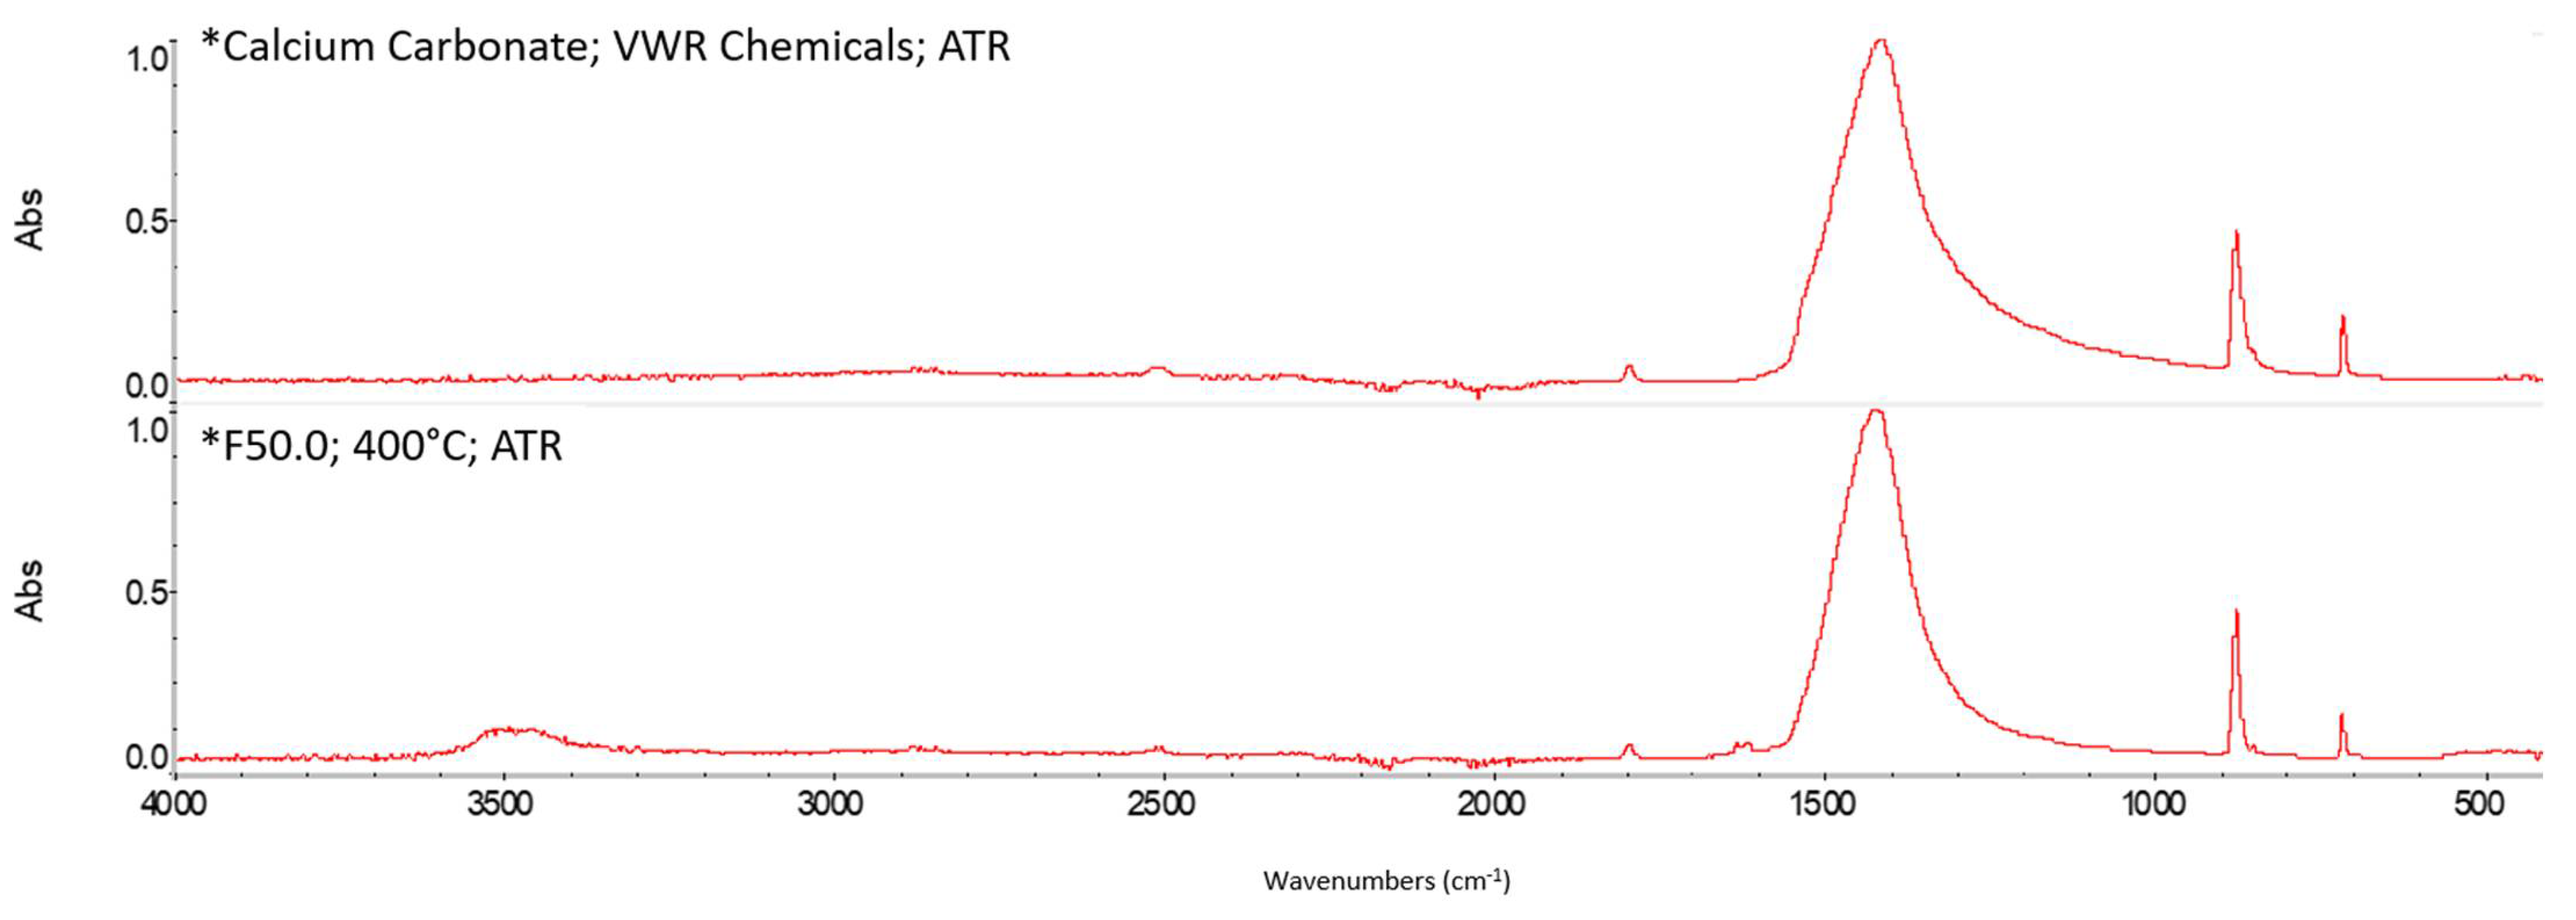
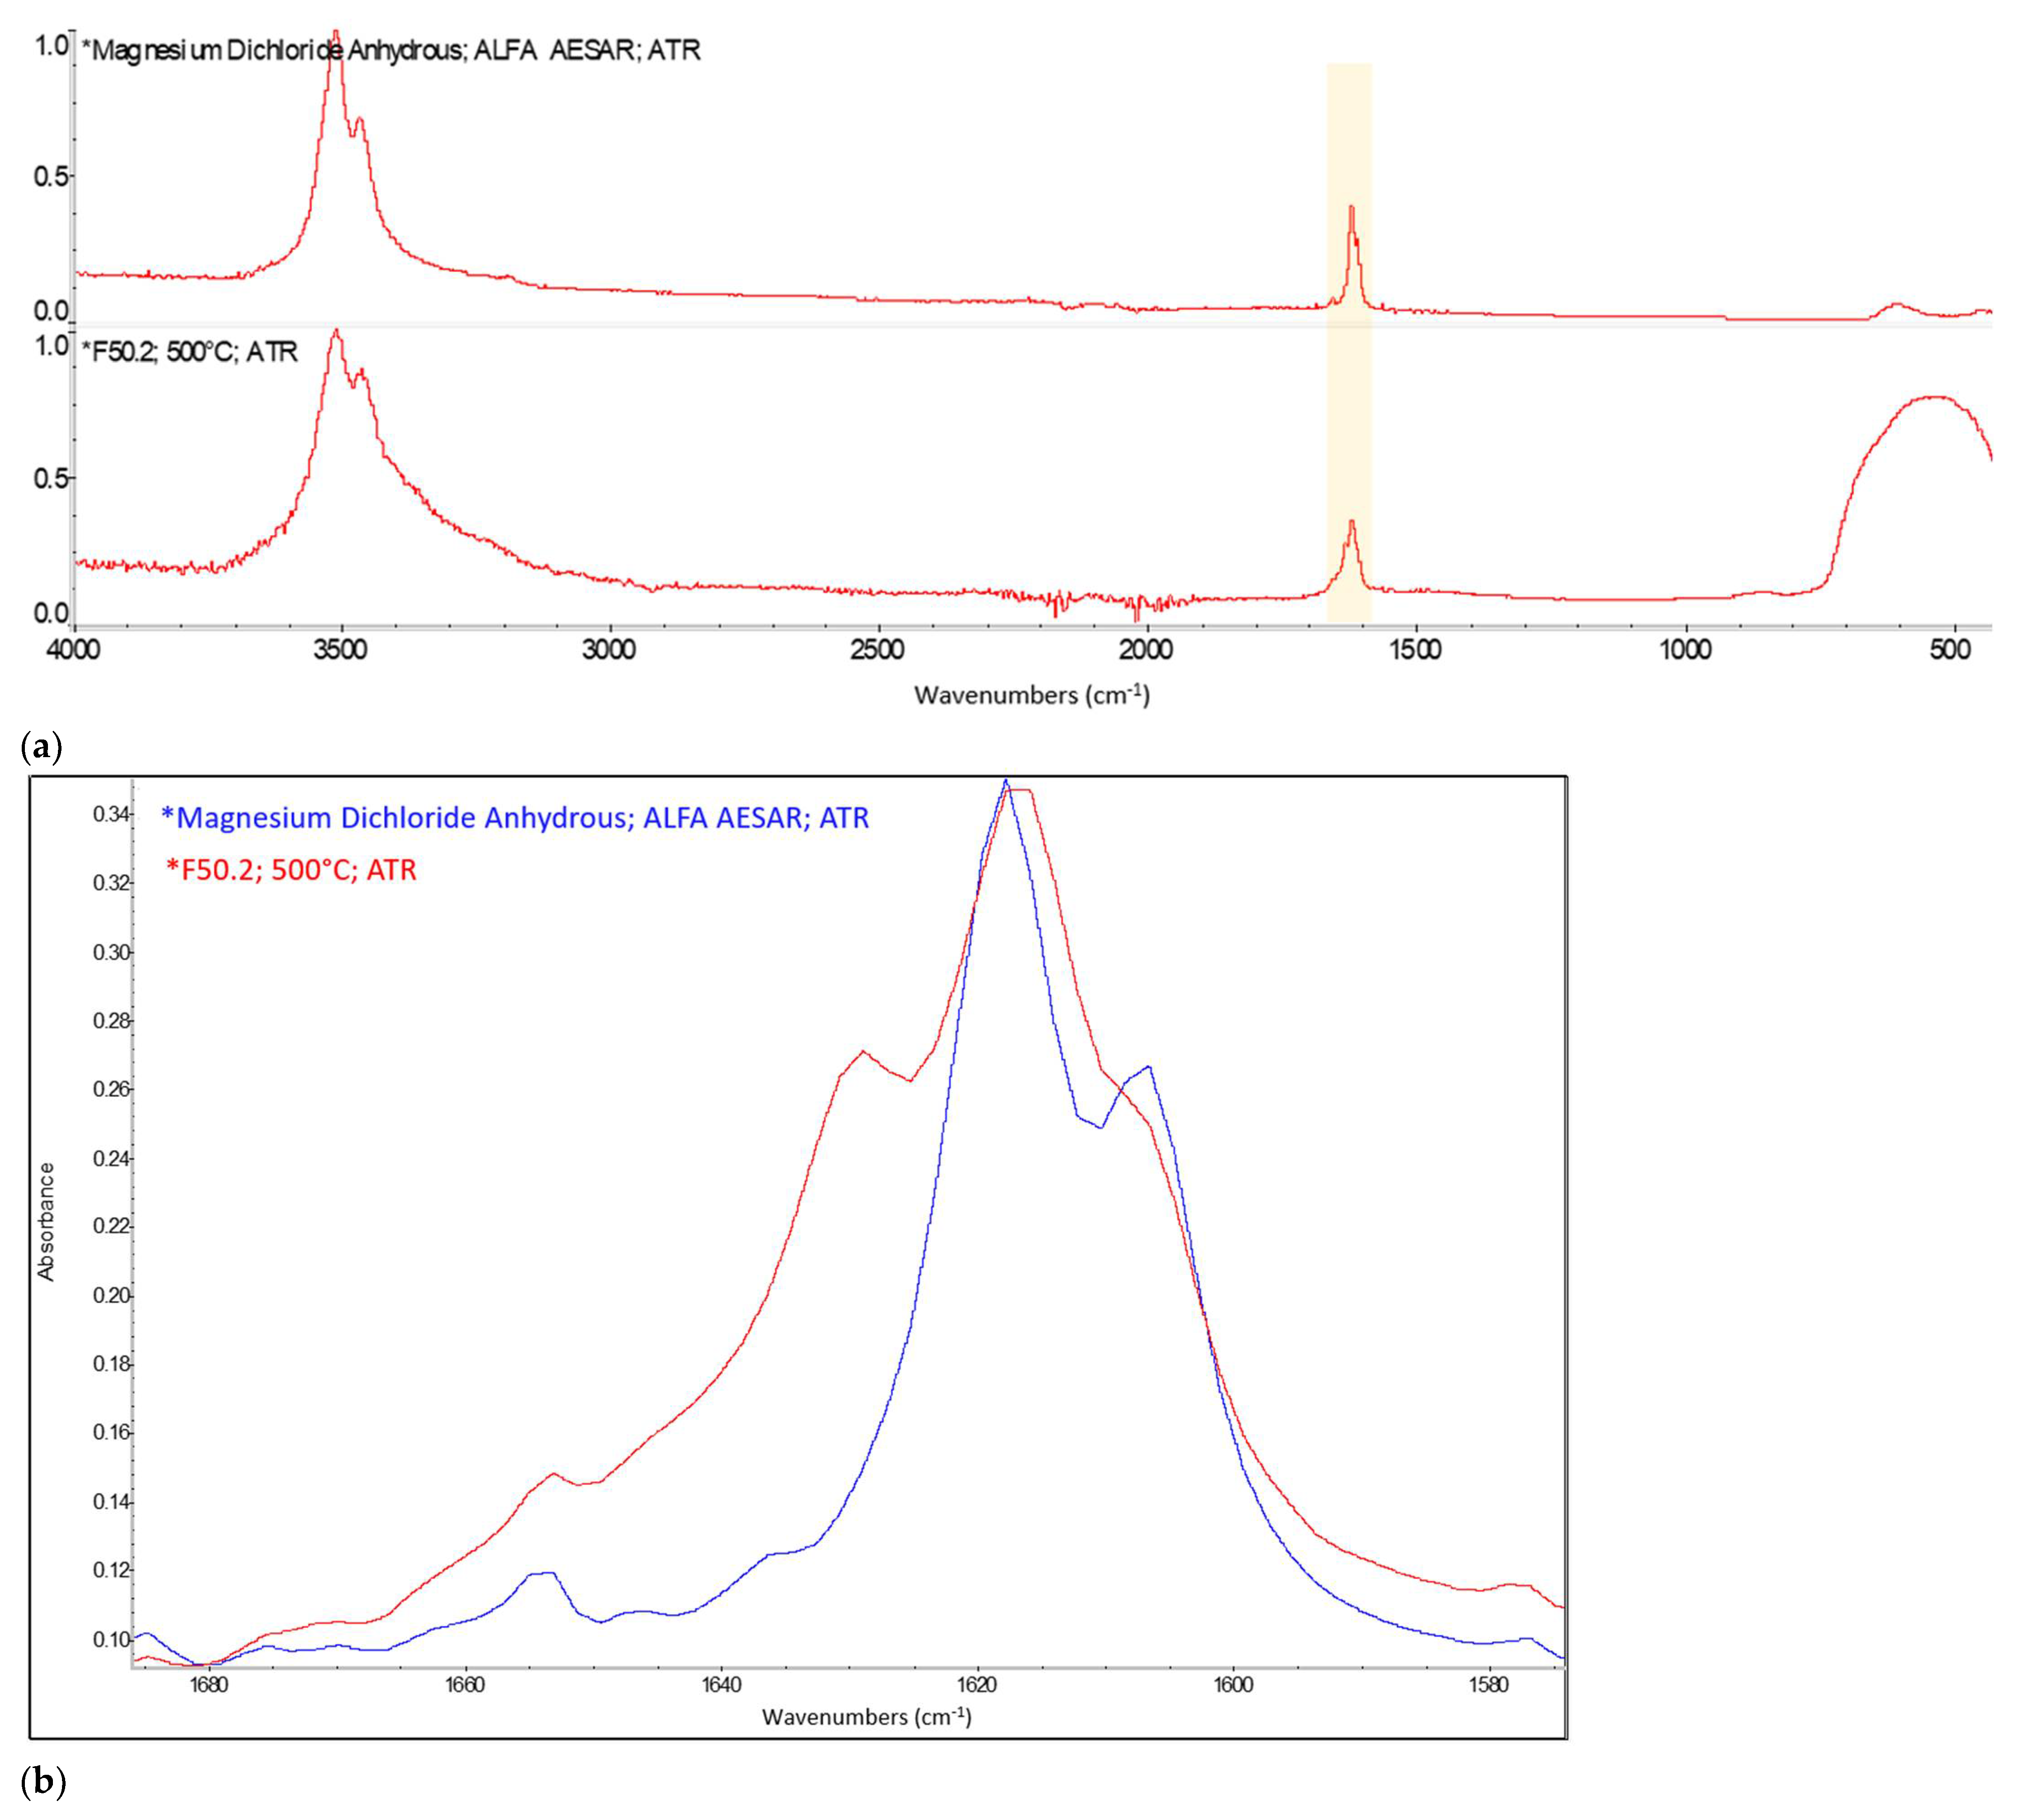
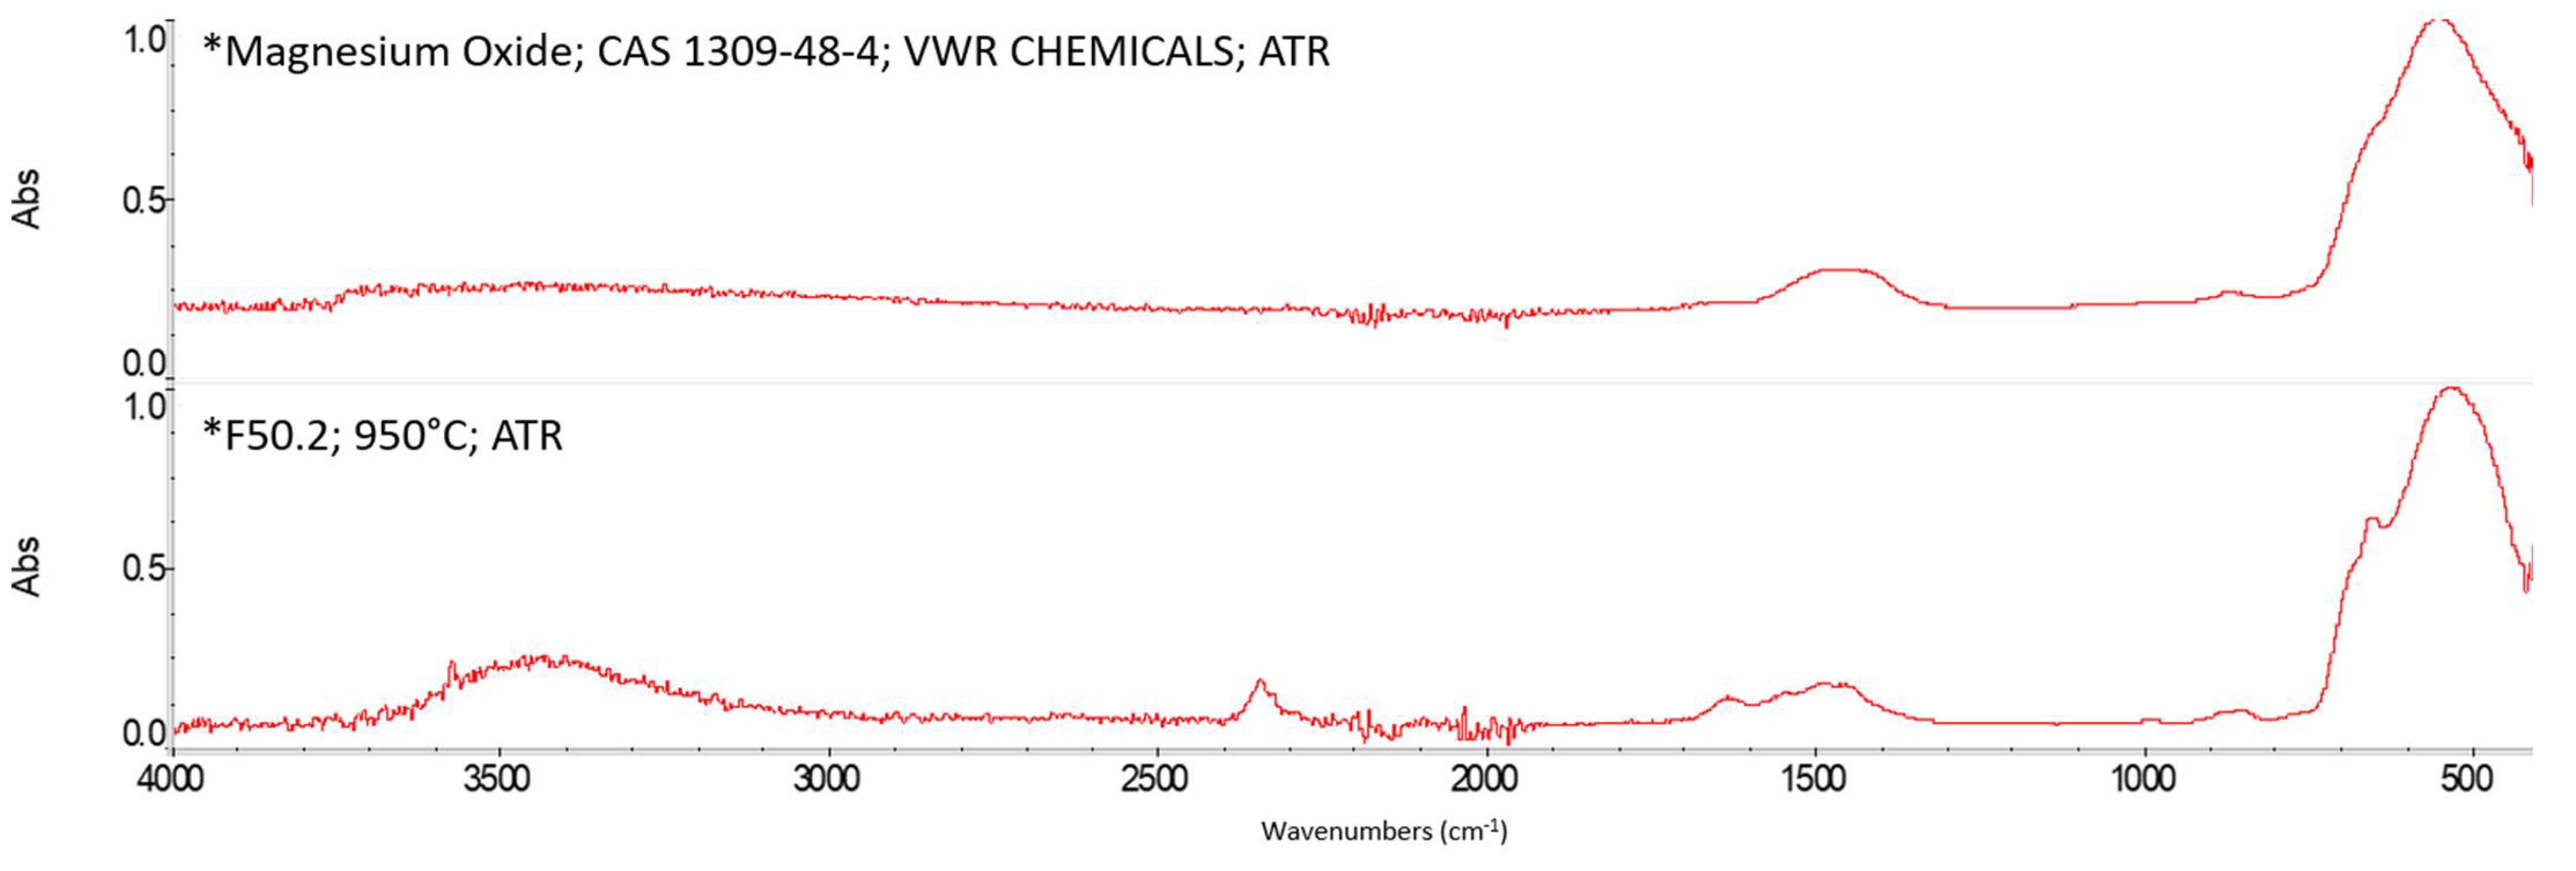
Appendix A. FTIR Spectra of the Acid Scavengers at Different Temperatures and Some Substances Used to Confirm the Chemical Nature of the Substances in Ashes


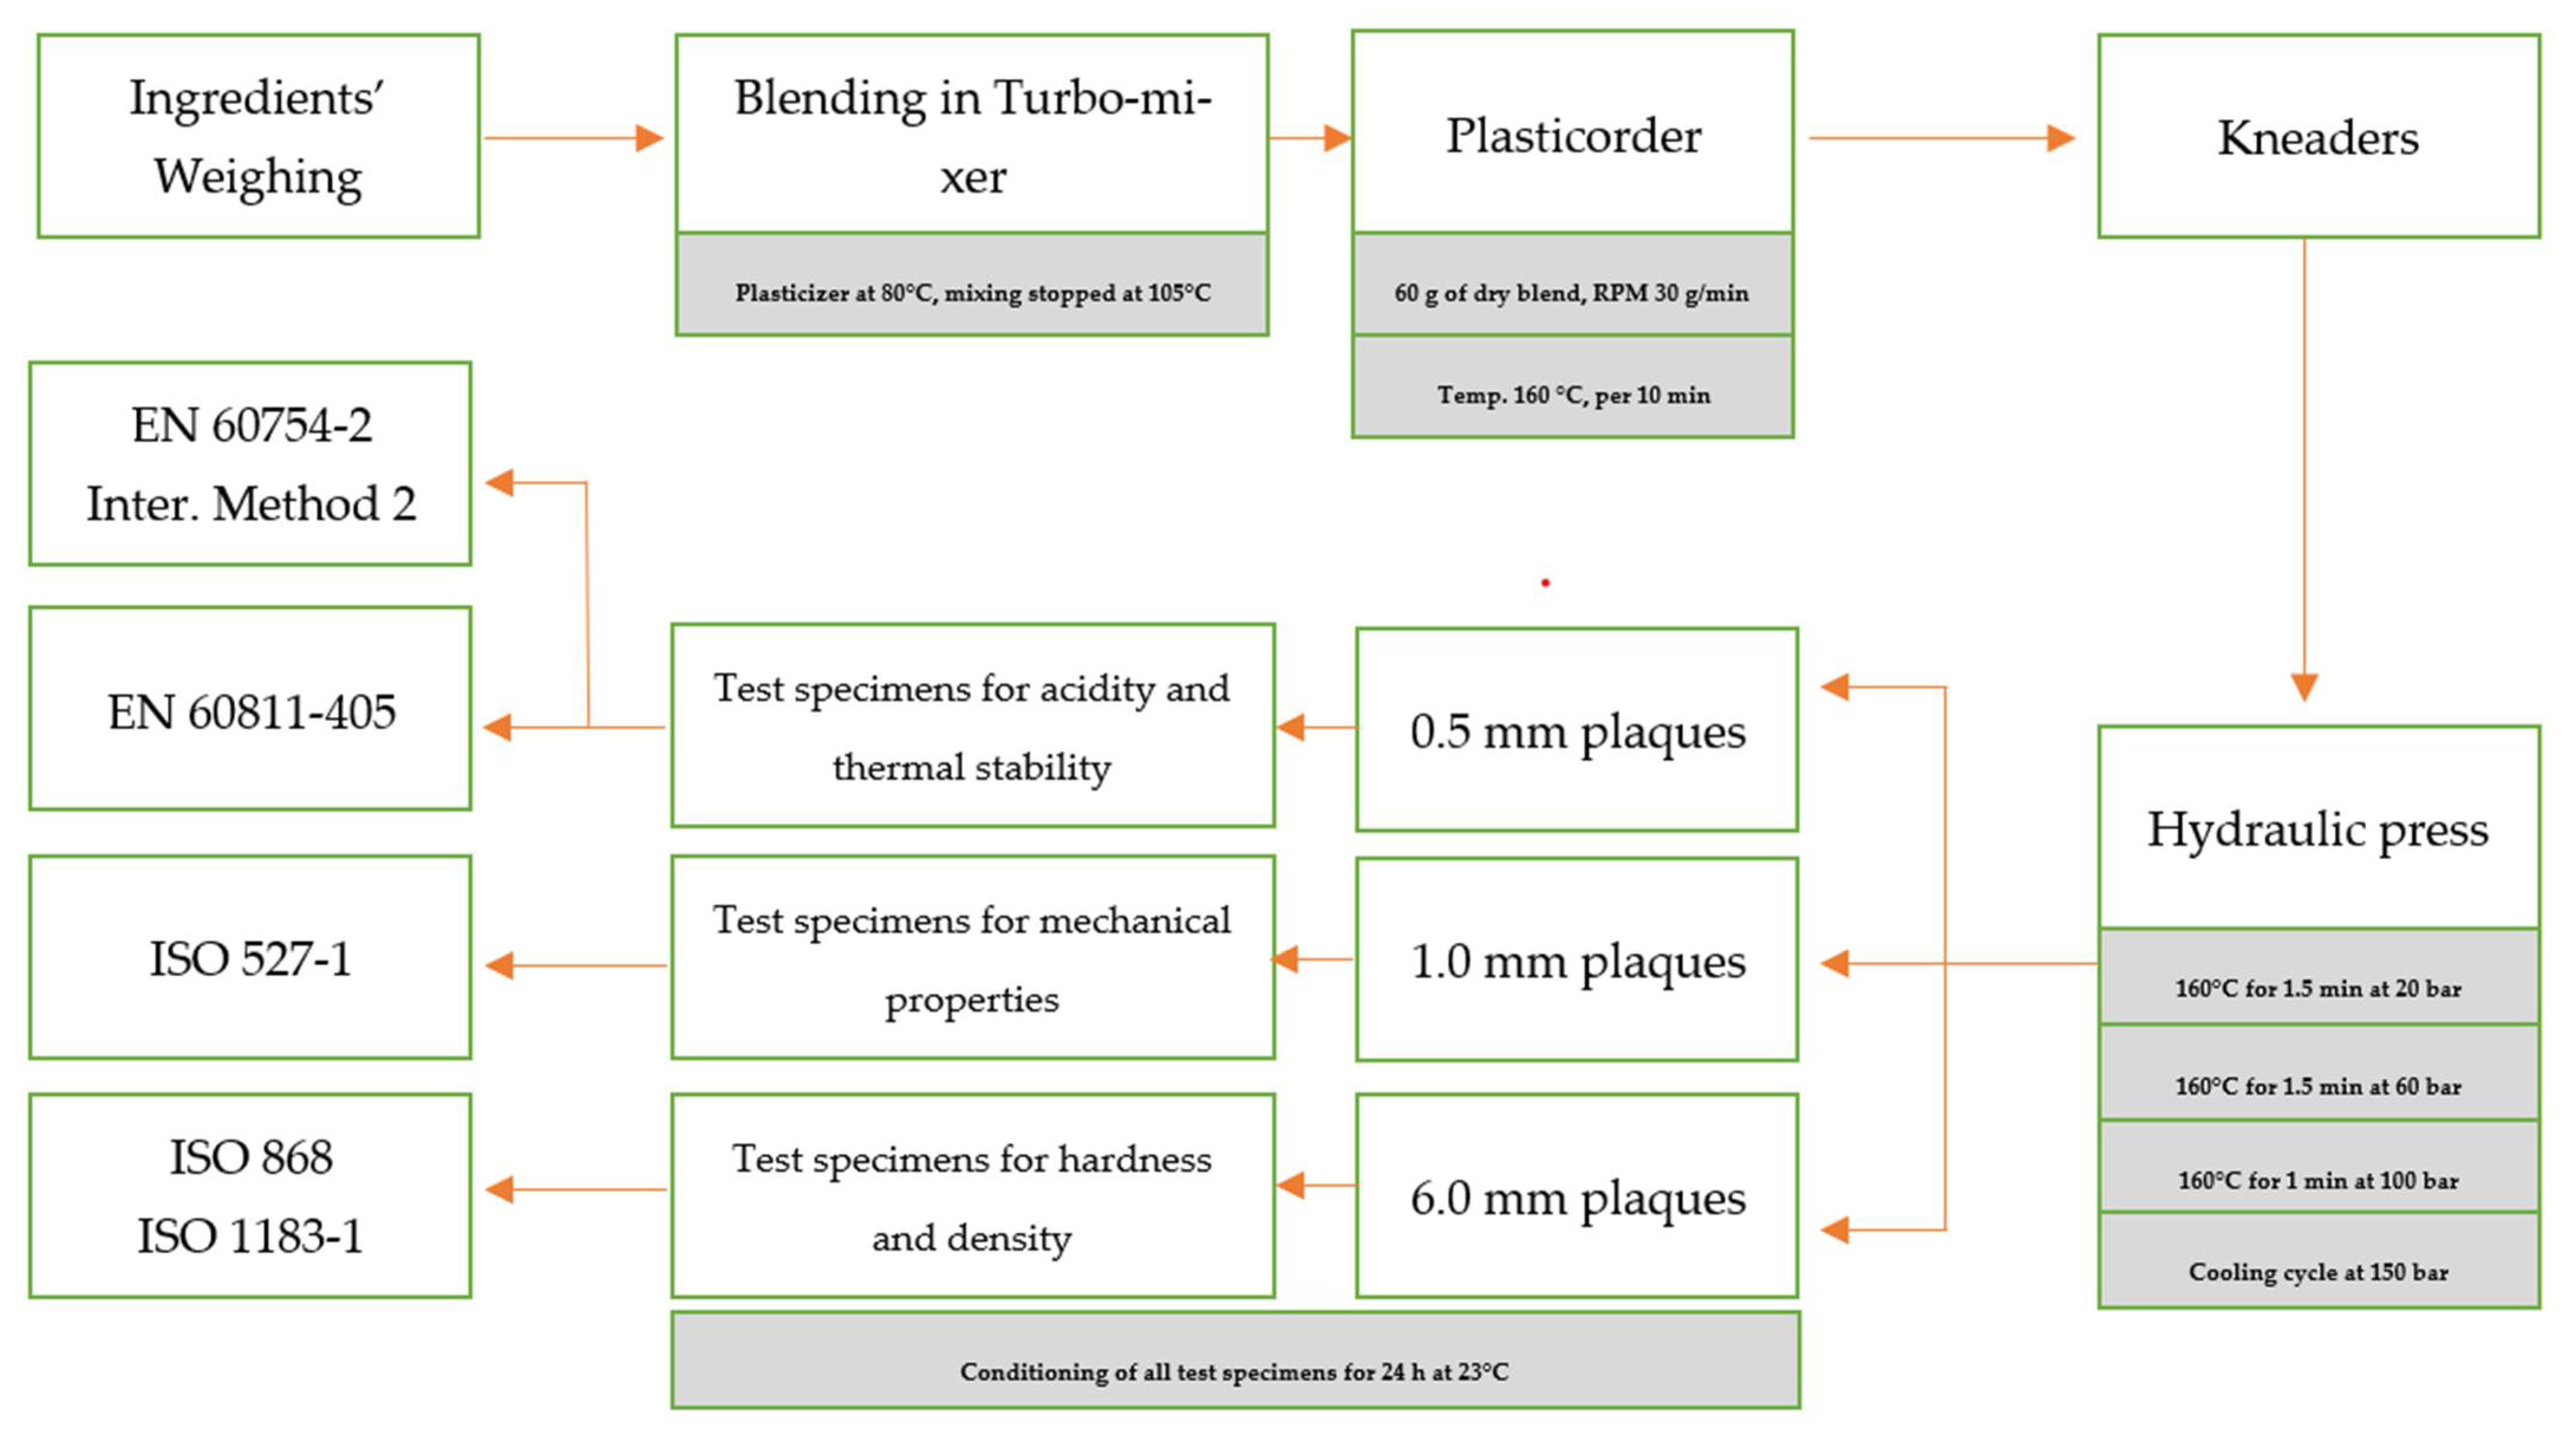
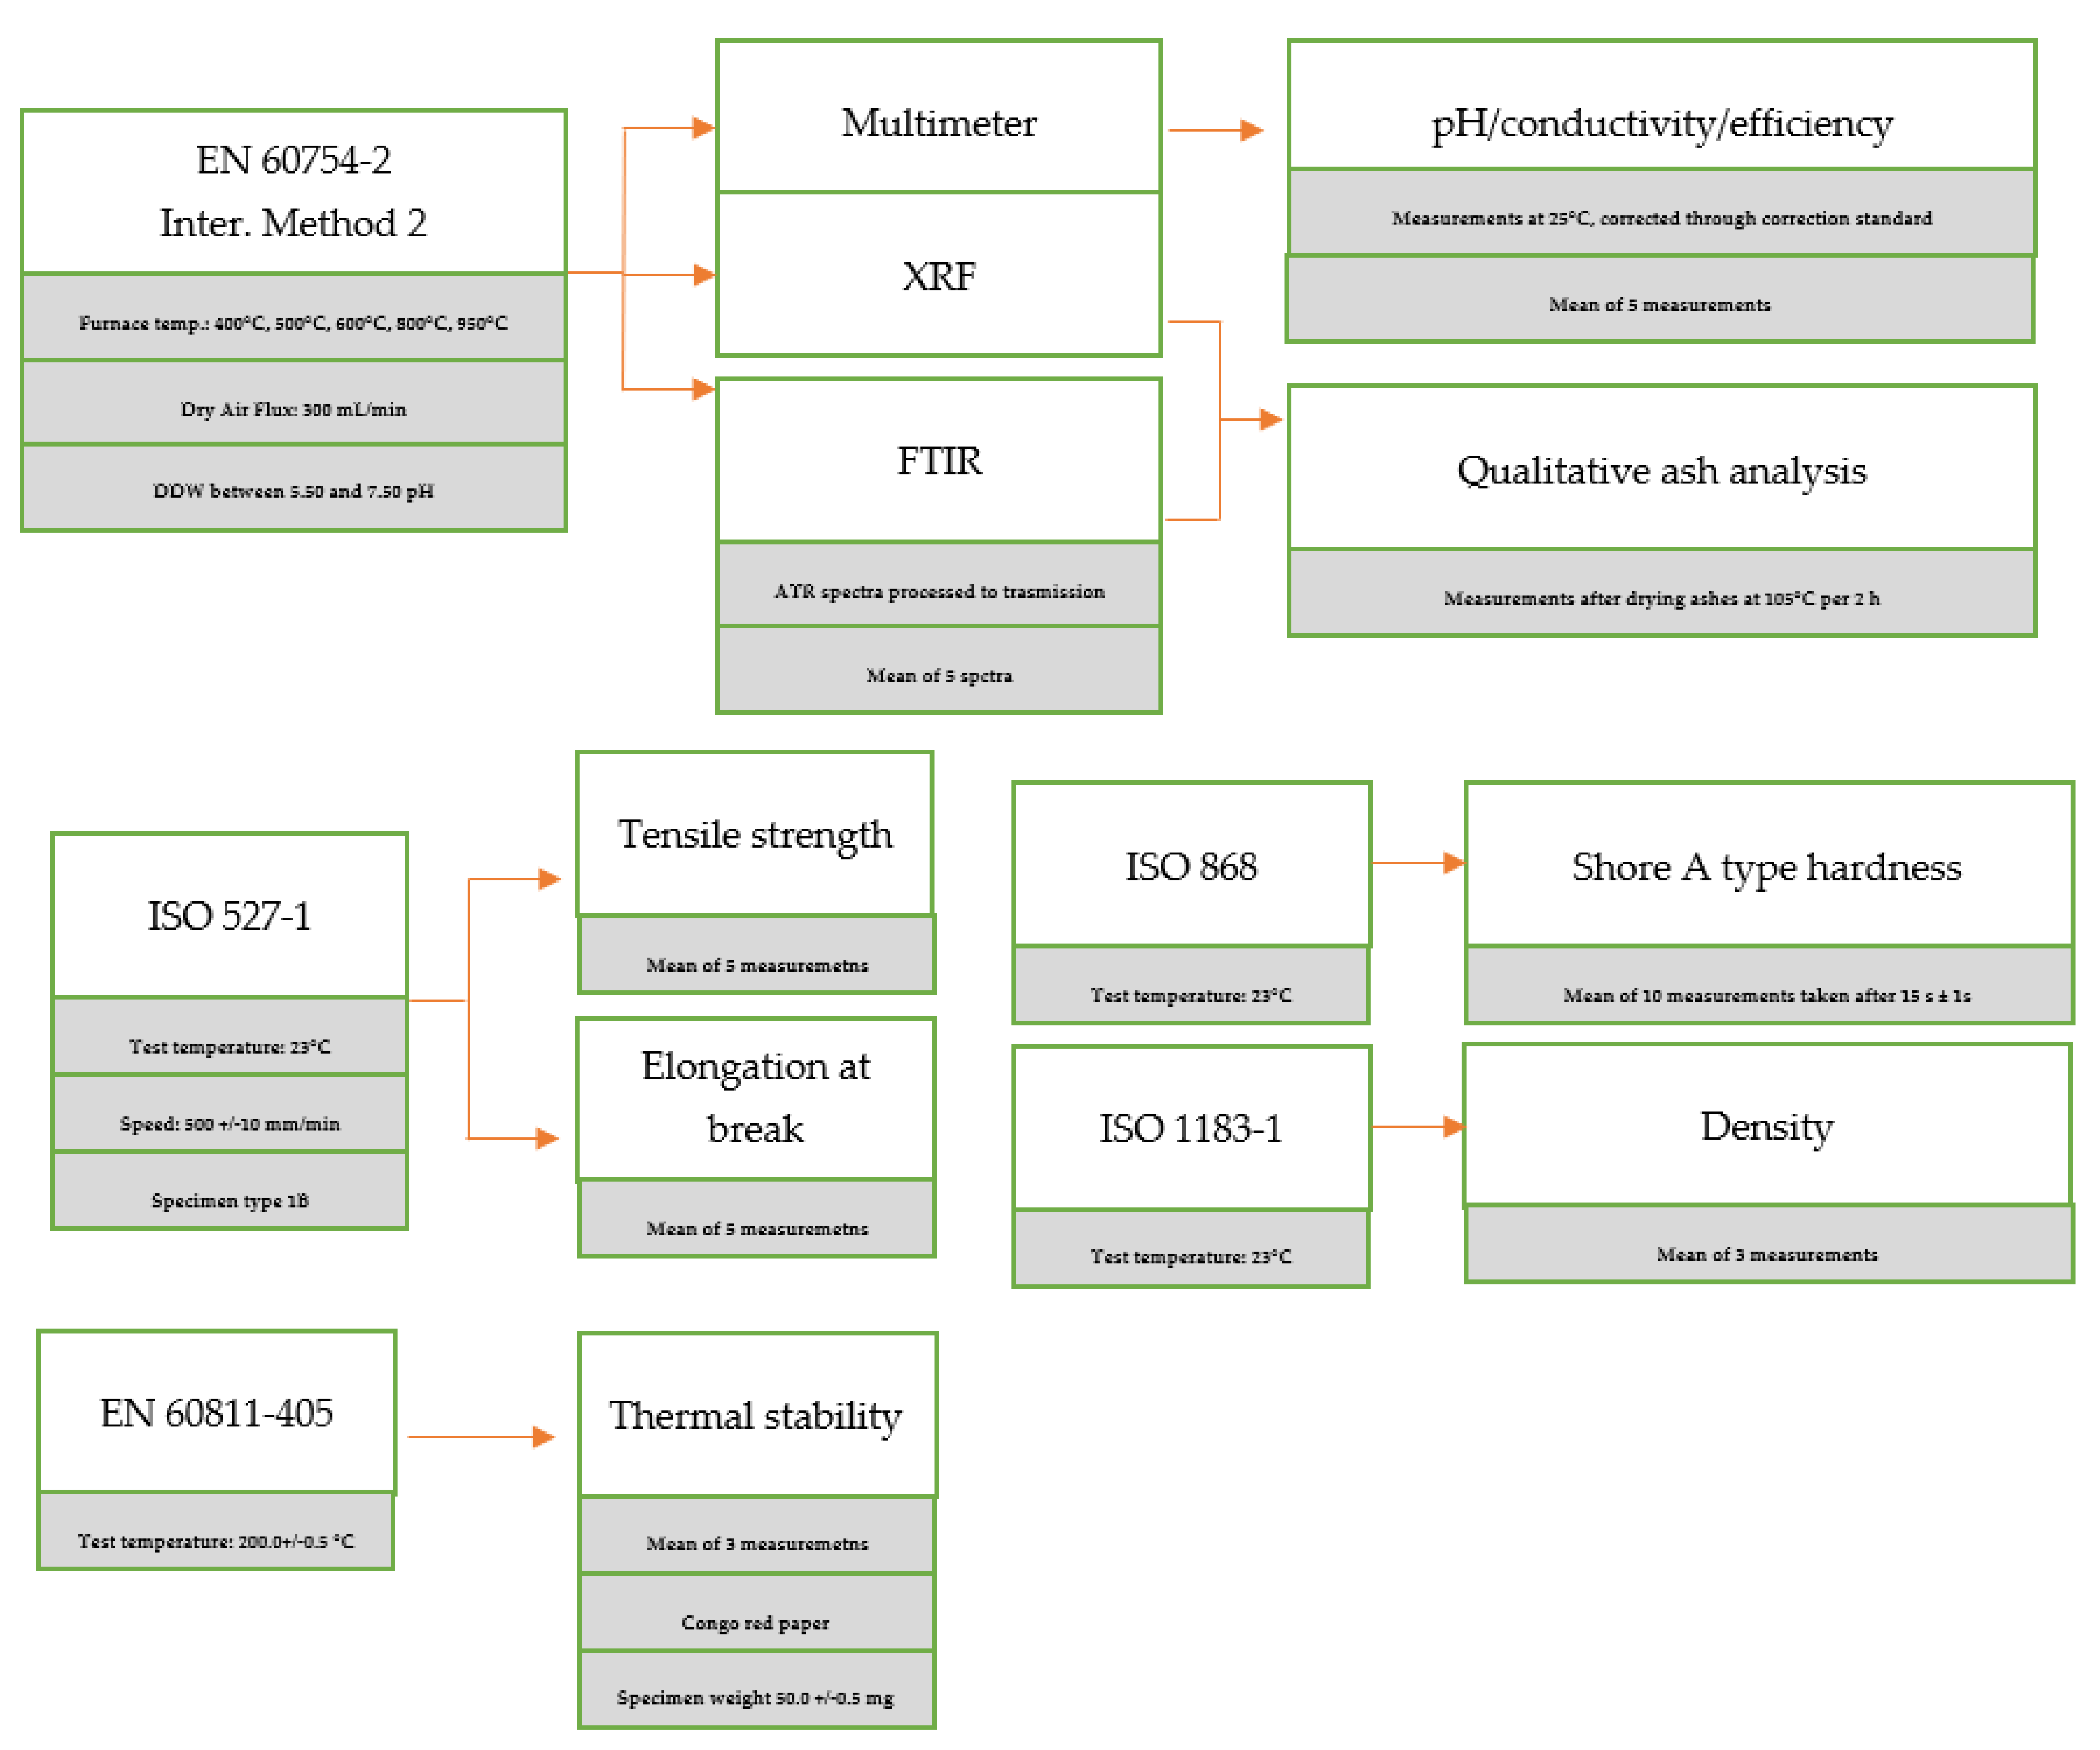
Appendix B. A Schematic Diagram of the Sample Preparation and Testing Process
References
- EN 50267-2-3; Common Test Methods for Cables Under Fire Conditions—Tests on Gases Evolved during Combustion of Materials from Cables—Part 2–3: Procedures—Determination of Degree of Acidity of Gases for Cables by Determination of the Weighted Average of pH and Conductivity. CENELEC: Brussels, Belgium, 1998. Available online: https://my.ceinorme.it/home.html (accessed on 1 August 2022).
- EN 60754-2; Test on Gases Evolved during Combustion of Materials From Cables—Part 2: Determination of Acidity (by pH Measurement) and Conductivity. CENELEC: Brussels, Belgium, 2014. Available online: https://my.ceinorme.it/home.html (accessed on 1 August 2022).
- EN 60754-1; Test on Gases Evolved during Combustion of Materials from Cables—Part 1: Determination of the Halogen Acid Gas Content. CENELEC: Brussels, Belgium, 2014. Available online: https://my.ceinorme.it/home.html (accessed on 1 August 2022).
- EN 50267-2-2; Common Test Methods for Cables under Fire Conditions—Tests on Gases Evolved during Combustion of Materials from Cables—Part 2-2: Procedures—Determination of Degree of Acidity of Gases for Materials by Measuring pH and Conductivity. CENELEC: Brussels, Belgium, 1998. Available online: https://my.ceinorme.it/home.html (accessed on 1 August 2022).
- EN 50267-2-1; Common Test Methods for Cables under Fire Conditions—Tests on Gases Evolved during Combustion of Materials from Cables—Part 2-1: Procedures—Determination of the Amount of Halogen Acid Gas. CENELEC: Brussels, Belgium, 1998. Available online: https://my.ceinorme.it/home.html (accessed on 1 August 2022).
- EN 50525-1; Electric Cables—Low Voltage Energy Cables of Rated Voltages up to and Including 450/750 V (U0/U)—Part 1: General Requirements. CENELEC: Brussels, Belgium, 2011. Available online: https://my.ceinorme.it/home.html (accessed on 1 August 2022).
- Matthews, G.; Plumper, G.S. Effects of calcium carbonate fillers on the behaviour of PVC in fires. Br. Polym. J. 1981, 13, 17–21. [Google Scholar] [CrossRef]
- Matthews, G.; Plumper, G.S. Effects of fillers on and the role of hydrogen chloride in the behaviour of PVC in fires. Br. Polym. J. 1984, 16, 34–38. [Google Scholar] [CrossRef]
- Smith, G. Quick method for determining the acid gas evolution from PVC formulations. J. Vinyl Technol. 1997, 9, 18–21. [Google Scholar] [CrossRef]
- Sze On Chan, H. Measurement of hydrochloric acid emission from burning PVC compounds. J. Fire Sci. 1984, 2, 106–122. [Google Scholar] [CrossRef]
- Sumi, K.; Morwick, D.W. Acid Gas Evolution from PVC Using DBR/NRC Method, Internal Report (National Research Council of Canada. Division of Building Research), No. DBR-IR-425; National Research Council of Canada: Ottawa, ON, Canada, 1976. [Google Scholar] [CrossRef]
- Chandler, L.A.; Hirschler, M.M.; Smith, G.F. A heated tube furnace test for the emission of acid gas from PVC wire coating materials: Effects of experimental procedures and mechanistic considerations. Eur. Polym. J. 1987, 23, 51–61. [Google Scholar] [CrossRef]
- Sarti, G. A New Perspective on Hydrogen Chloride Scavenging at High Temperatures for Reducing the Smoke Acidity of PVC Cables in Fires. I: An Overview of the Theory, Test Methods, and the European Union Regulatory Status. Fire 2022, 5, 127. [Google Scholar] [CrossRef]
- ISO 527-1; Plastics—Determination of Tensile Properties—Part 1: General Principles. ISO: Geneva, Switzerland, 2019. Available online: https://www.iso.org/standard/67071.html (accessed on 1 August 2022).
- ISO 1183-1; Plastics—Methods for Determining the Density of Non-Cellular Plastics—Part 1: Immersion Method, Liquid Pycnometer Method and Titration Method. ISO: Geneva, Switzerland, 2019. Available online: https://www.iso.org/standard/34804.html (accessed on 1 August 2022).
- ISO 868; Plastics and Ebonite—Determination of Indentation Hardness by Means of a Durometer (Shore Hardness). ISO: Geneva, Switzerland, 2003. Available online: https://www.iso.org/standard/34804.html (accessed on 1 August 2022).
- IEC 60811-405; Electric and Optical Fiber Cables—Test Methods for Non-Metallic Materials—Part 405: Miscellaneous Tests—Thermal Stability Test for PVC Insulations and PVC Sheaths. IEC: Geneva, Switzerland, 2012. Available online: https://webstore.iec.ch/publication/3543 (accessed on 1 August 2022).
- EN 60754-2:2014/A1:2020; Test on Gases Evolved during Combustion of Materials from Cables—Part 2: Determination of Acidity (by pH Measurement) and Conductivity. CENELEC: Brussels, Belgium, 2020. Available online: https://my.ceinorme.it/home.html (accessed on 1 August 2022).
- O’Mara, M.M. Pyrolysis–gas chromatographic analysis of poly(vinyl chloride). II. In situ absorption of HCl during pyrolysis and combustion of PVC. J. Polym. Sci. Part A-1 Polym. Chem. 1971, 9, 1387–1400. [Google Scholar] [CrossRef]
- Brown, S.K.; Martin, K.G. Toxic gas and smoke measurement with the British Fire Propagation test. III: UPTV formulations with reduced HCl evolution. Fire Mater. 1985, 9, 95–102. [Google Scholar] [CrossRef]
- Commercial PCC Purchased by Imerys. Available online: https://www.imerys-performance-minerals.com/system/files/2021-02/DATPCC_Winnofil_S_LSK_EN_2019-07.pdf (accessed on 12 August 2022).
- Bassi, I. Characterization of PVC Compounds and Evaluation of Their Fire Performance, Focusing on the Comparison between EN 60754-1 and EN 60754-2 in the Assessment of the Smoke Acidity. Master’s Thesis, University of Bologna, Bologna, Italy, October 2021. Available online: https://www.pvc4cables.org/images/assessment_of_the_smoke_acidity.pdf (accessed on 1 September 2022).
- Kipouros, G.J.; Sadoway, D.R. A thermochemical analysis of the production of anhydrous MgCl2. J. Light Met. 2001, 1, 111–117. [Google Scholar] [CrossRef]
- Galwey, A.K.; Laverty, G.M. The thermal decomposition of magnesium chloride dihydrate. Thermochim. Acta 1989, 138, 115–127. [Google Scholar] [CrossRef]
- Laoutid, F.; Bonnaud, L.; Alexandre, M.; Lopez-Cuesta, J.-M.; Dubois, P. New prospects in flame retardant polymer materials: From fundamentals to nanocomposites. Mater. Sci. Eng. Rep. 2009, 63, 100–125. [Google Scholar] [CrossRef]
- Hirschler, M. Fire Safety, Smoke Toxicity, and Acidity. In Proceedings of the Flame Retardants 2006, London, UK, 14–15 February 2006. [Google Scholar]
- ISO/TR 20118:2019; Plastics—Guidance on Fire Characteristics and Fire Performance of PVC Materials Used in Building Applications. ISO: Geneva, Switzerland, 2019. Available online: https://www.iso.org/standard/67071.html (accessed on 1 August 2022).
- Beitel, J.J.; Bertelo, C.A.; Carroll, W.F.; Gardner, R.O.; Grand, A.F.; Hirschler, M.M.; Smith, G.F. Hydrogen chloride transport and decay in a large apparatus I. Decomposition of poly(vinyl chloride) wire insulation in a plenum by current overload. J. Fire Sci. 1986, 4, 15–41. [Google Scholar] [CrossRef]


| Raw Materials | Trade Name | F50.0 [phr] | F50.1 [phr] | F50.2 [phr] | F50.3 [phr] | F50.4 [phr] | F50.5 [phr] |
|---|---|---|---|---|---|---|---|
| PVC | Inovyn 271 PC | 100 | 100 | 100 | 100 | 100 | 100 |
| DINP | Diplast N | 50 | 50 | 50 | 50 | 50 | 50 |
| ESBO | Reaflex EP/6 | 2 | 2 | 2 | 2 | 2 | 2 |
| Antioxidant | Arenox A10 | 0.1 | 0.1 | 0.1 | 0.1 | 0.1 | 0.1 |
| COS | RPK B-CV/3037 | 3 | 3 | 3 | 3 | 3 | 3 |
| CaCO3 | Riochim | 90 | 0 | 0 | 0 | 0 | 0 |
| Al(OH)3 | Apyral 40 CD | 0 | 90 | 0 | 0 | 0 | 0 |
| Mg(OH)2 | Ecopyren 3.5 | 0 | 0 | 90 | 0 | 0 | 0 |
| PCC | Winnofil S | 0 | 0 | 0 | 90 | 0 | 0 |
| HTAS 1 | AS-1B | 0 | 0 | 0 | 0 | 90 | 0 |
| HTAS 2 | AS-6B | 0 | 0 | 0 | 0 | 0 | 90 |
| Raw Materials | Trade Name | F50.6 [phr] | F50.7 [phr] | F50.8 [phr] | F50.9 [phr] | F50.10 [phr] |
|---|---|---|---|---|---|---|
| PVC | Inovyn 271 PC | 100 | 100 | 100 | 100 | 100 |
| DINP | Diplast N | 50 | 50 | 50 | 50 | 50 |
| ESBO | Reaflex EP/6 | 2 | 2 | 2 | 2 | 2 |
| Antioxidant | Arenox A10 | 0.1 | 0.1 | 0.1 | 0.1 | 0.1 |
| COS | RPK B-CV/3037 | 3 | 3 | 3 | 3 | 3 |
| CaCO3 | Riochim | 0 | 0 | 0 | 0 | 0 |
| Al(OH)3 | Apyral 40 CD | 0 | 0 | 0 | 0 | 0 |
| Mg(OH)2 | Ecopyren 3.5 | 0 | 130 | 40 | 80 | 104 |
| PCC | Winnofil S | 130 | 0 | 90 | 180 | 234 |
| Raw Materials | Trade Name | 50.6 [phr] | 50.7 [phr] | 50.18 [phr] | 50.8 [phr] | 50.19 [phr] | 50.20 [phr] | 50.21 [phr] | 50.22 [phr] | 50.23 [phr] |
|---|---|---|---|---|---|---|---|---|---|---|
| PVC | Inovyn 271 PC | 100 | 100 | 100 | 100 | 100 | 100 | 100 | 100 | 100 |
| DINP | Diplast N | 50 | 50 | 50 | 50 | 50 | 50 | 50 | 50 | 50 |
| ESBO | Reaflex EP6 | 2 | 2 | 2 | 2 | 2 | 2 | 2 | 2 | 2 |
| Antioxidant | Arenox A10 | 0.1 | 0.1 | 0.1 | 0.1 | 0.1 | 0.1 | 0.1 | 0.1 | 0.1 |
| COS | RPK B-CV/3037 | 3 | 3 | 3 | 3 | 3 | 3 | 3 | 3 | 3 |
| Mg(OH)2 | Ecopyren 3.5 | 0 | 130 | 30 | 40 | 90 | 100 | 0 | 0 | 0 |
| PCC | Winnofil S | 130 | 0 | 100 | 90 | 40 | 30 | 100 | 90 | 40 |
| Test Apparatus | Producer | Model | Additional information |
|---|---|---|---|
| Plasticorder | Brabender | Palatograph EC | 50 cm3 chamber |
| Thermostat | Liebisch Labortechnik | LT-PVC-210-36-5 | Test at 200 °C +/− 0.5 °C |
| Halogen Acid Gas test apparatus | SA Associates | Standard model | Porcelain combustion boats |
| Multimeter | Mettler Toledo | S213 standard kit | |
| Conductivity electrode | Mettler Toledo | S213 standard kit | |
| pH electrode | Mettler Toledo | S213 standard kit | |
| FTIR-ATR | Thermo Fisher Scientific | IS20 | ATR correction to transmission |
| WD-XRF | Thermo Fisher Scientific | PERFORM’X | Borate Beads |
| Tensile testing machine | Hounsfield | H10KS | Specimen type 1A, 500 mm/min |
| Standard | Measurement | Temperature | Note |
|---|---|---|---|
| ISO 527-1 [14] | Elongation at break | 23 °C | Test specimens conditioned for 24 h at 23 °C |
| ISO 527-1 [14] | Tensile strength | 23 °C | Test specimens conditioned for 24 h at 23 °C |
| ISO 1183 [15] | Specific Gravity | 23 °C | After 24 h of conditioning at 23 °C |
| ISO 868 [16] | Hardness | 23 °C | Shore A at 15, test specimens conditioned for 24 h at 23 °C |
| IEC 60811-405 [17] | Thermal Stability | 200 °C | Test specimens conditioned for 24 h at 23 °C |
| Technical Standard | Measurement | Temperature [°C] | Note |
|---|---|---|---|
| EN 60754-2 | Smoke acidity | 950 | DDW, pH, and conductivity. The general method, according to the 2014 version. |
| Internal Method 2 | Smoke acidity | 400, 500, 600, 800 | DDW, pH, and conductivity. The general method is according to the 2014 version. |
| Formulation | F50.0 | F50.1 | F50.2 | F50.3 | F50.4 | F50.5 |
|---|---|---|---|---|---|---|
| Specific Gravity [g/cm3] | 1.542 +/− 0.012 | 1.505 +/− 0.021 | 1.503 +/− 0.004 | 1.542 +/− 0.007 | 1.445 +/− 0.014 | 1.446 +/− 0.009 |
| Shore Hardness [type A, 15”] | 88 +/− 1 | 89 +/− 1 | 89 +/− 1 | 88 +/− 1 | 90 +/− 1 | 90 +/− 1 |
| Tensile strength [N/mm2] | 13.0 +/− 0.8 | 11.8 +/− 0.5 | 11.7 +/− 0.8 | 13.4 +/− 1.1 | 13.0 +/− 1.0 | 13.1 +/− 0.7 |
| Elongation at break [%] | 246.4 +/− 3.8 | 236.1 +/− 4.9 | 233.1 +/− 2.5 | 240.1 +/− 2.4 | 221.5 +/− 1.7 | 225.5 +/− 1.5 |
| Thermal Stability [min] | 104 +/− 3 | 79 +/− 2 | 73 +/− 4 | 76 +/− 5 | 291 +/− 11 | 299 +/− 12 |
| Method 2 at 400 °C | F50.0 | F50.1 | F50.2 | F50.3 | F50.4 | F50.5 |
| pH | 2.48 +/− 0.06 | 2.37 +/− 0.06 | 2.81 +/− 0.07 | 3.71 +/− 0.03 | 4.03 +/− 0.19 | 3.88 +/− 0.12 |
| Conductivity [μS/mm] | 142.9 +/− 3.6 | 179.4 +/− 1.5 | 88.7 +/− 3.5 | 8.1 +/− 0.3 | 4.0 +/− 0.1 | 5.3 +/− 0.1 |
| Method 2 at 500 °C | F50.0 | F50.1 | F50.2 | F50.3 | F50.4 | F50.5 |
| pH | 2.48 +/− 0.04 | 2.41 +/− 0.03 | 2.41 +/− 0.09 | 3.73 +/− 0.10 | 3.70 +/− 0.15 | 3.69 +/− 0.13 |
| Conductivity [μS/mm] | 139.1 +/− 1.2 | 177.2 +/− 2.5 | 177.3 +/− 6.2 | 7.7 +/− 0.3 | 8.2 +/− 0.4 | 8.6 +/− 0.3 |
| Method 2 at 600 °C | F50.0 | F50.1 | F50.2 | F50.3 | F50.4 | F50.5 |
| pH | 2.51 +/− 0.02 | 2.30 +/− 0.01 | 2.31 +/− 0.03 | 3.69 +/− 0.07 | 3.70 +/− 0.10 | 3.65 +/− 0.05 |
| Conductivity [μS/mm] | 132.6 +/− 3.7 | 201.7 +/− 4.1 | 195.7 +/− 5.0 | 9.2 +/− 0.4 | 7.8 +/− 0.3 | 9.5 +/− 0.2 |
| Method 2 at 800 °C | F50.0 | F50.1 | F50.2 | F50.3 | F50.4 | F50.5 |
| pH | 2.63 +/− 0.13 | 2.30 +/− 0.09 | 2.29 +/− 0.09 | 3.26 +/− 0.11 | 3.52 +/− 0.02 | 3.20 +/− 0.03 |
| Conductivity [μS/mm] | 100.4 +/− 4.4 | 206.4 +/− 2.5 | 208.9 +/− 7.8 | 23.7 +/− 0.6 | 13.5 +/− 0.2 | 25.7 +/− 0.6 |
| Method 2 at 950 °C | F50.0 | F50.1 | F50.2 | F50.3 | F50.4 | F50.5 |
| pH | 2.62 +/− 0.03 | 2.27 +/− 0.10 | 2.27 +/− 0.02 | 2.74 +/− 0.06 | 2.89 +/− 0.08 | 2.79 +/− 0.02 |
| Conductivity [μS/mm] | 97.3 +/− 3.7 | 221.5 +/− 8.4 | 224.3 +/− 3.1 | 74.0 +/− 1.6 | 70.1 +/− 0.7 | 70.1 +/− 2.0 |
| Formulation | F50.0 | F50.1 | F50.2 | F50.3 | F50.4 | F50.5 |
|---|---|---|---|---|---|---|
| 400 °C | Ca, Cl | Mg, Cl | Al, Cl | Ca, Cl | n.a. | n.a. |
| 500 °C | Ca, Cl | Mg, Cl | Al, Cl | Ca, Cl | n.a. | n.a. |
| 600 °C | Ca, Cl | Mg, Cl | Al, Cl | Ca, Cl | n.a. | n.a. |
| 800 °C | Ca, Cl | Mg, Cl | Al, Cl | Ca, Cl | n.a. | n.a. |
| 950 °C | n.a. | n.a. | n.a. | n.a. | n.a. | n.a. |
| 1 [cm−1] | 2 [cm−1] | 3 [cm−1] | 4 [cm−1] | 5 [cm−1] | 6 [cm−1] | |
|---|---|---|---|---|---|---|
| CaCO3 | 2509.64 | 1794.92 | 1417.26 | 873.10 | 846.70 | 710.66 |
| MgCl2 | 1616.43 | 1606.44 | ||||
| CaCl2 | 1628.43 | 1614.21 | ||||
| MgO | Broadband centered at 548 cm−1 | |||||
| Al2O3 | Broadband between 400 and 900 cm−1 | |||||
| Formulation | F50.6 | F50.7 | F50.18 | F50.9 | F50.19 | F50.20 | F50.21 | F50.22 | F50.23 |
|---|---|---|---|---|---|---|---|---|---|
| pH | 2.93 +/− 0.06 | 2.34 +/− 0.04 | 3.19 +/− 0.11 | 3.75 +/− 0.08 | 2.65 +/− 0.02 | 2.51 +/− 0.04 | 2.90 +/− 0.01 | 2.89 +/− 0.00 | 2.33 +/− 0.02 |
| Conductivity [μS/mm] | 49.4 +/− 1.4 | 183.8 +/− 9.0 | 28.8 +/− 0.3 | 8.4 +/− 0.3 | 106.2 +/− 4.2 | 133.5 +/− 6.2 | 56.9 +/− 2.3 | 51.6 +/− 1.8 | 193.0 +/− 3.0 |
| Formulation | F50.6 | F50.7 | F50.8 | F50.9 | F50.10 |
|---|---|---|---|---|---|
| pH | 2.93 +/− 0.06 | 2.34 +/− 0.02 | 3.32 +/− 0.06 | 3.75 +/− 0.08 | 3.75 +/− 0.09 |
| Conductivity [μS/mm] | 49.4 +/− 6.1 | 183.8 +/− 9.0 | 20.7 +/− 2.6 | 8.4 +/− 1.0 | 8.4 +/− 1.0 |
| Specific Gravity [g/cm3] | 1.644 +/− 0.011 | 1.590 +/− 0.014 | 1.627 +/− 0.002 | 1.853 +/− 0.007 | 1.946 +/− 0.007 |
| Hardness [SHA 15″] | 91 +/− 1 | 92 +/− 1 | 91 +/− 1 | 97 +/− 1 | 98 +/− 1 |
| Tensile strength [N/mm2] | 8.2 +/− 0.5 | 5.8 +/− 0.3 | 7.5 +/− 0.7 | 2.3 +/− 1.3 | 1.2 +/− 1.3 |
| Elongation at break [%] | 210.3 +/− 3.2 | 195.1 +/− 5.2 | 205.0 +/− 1.1 | 177.0 +/− 7.5 | 172.0 +/− 8.5 |
| Thermal Stability [min] | 76 +/− 5 | 71 +/− 3 | 61 +/− 2 | 57 +/− 4 | 38 +/− 3 |
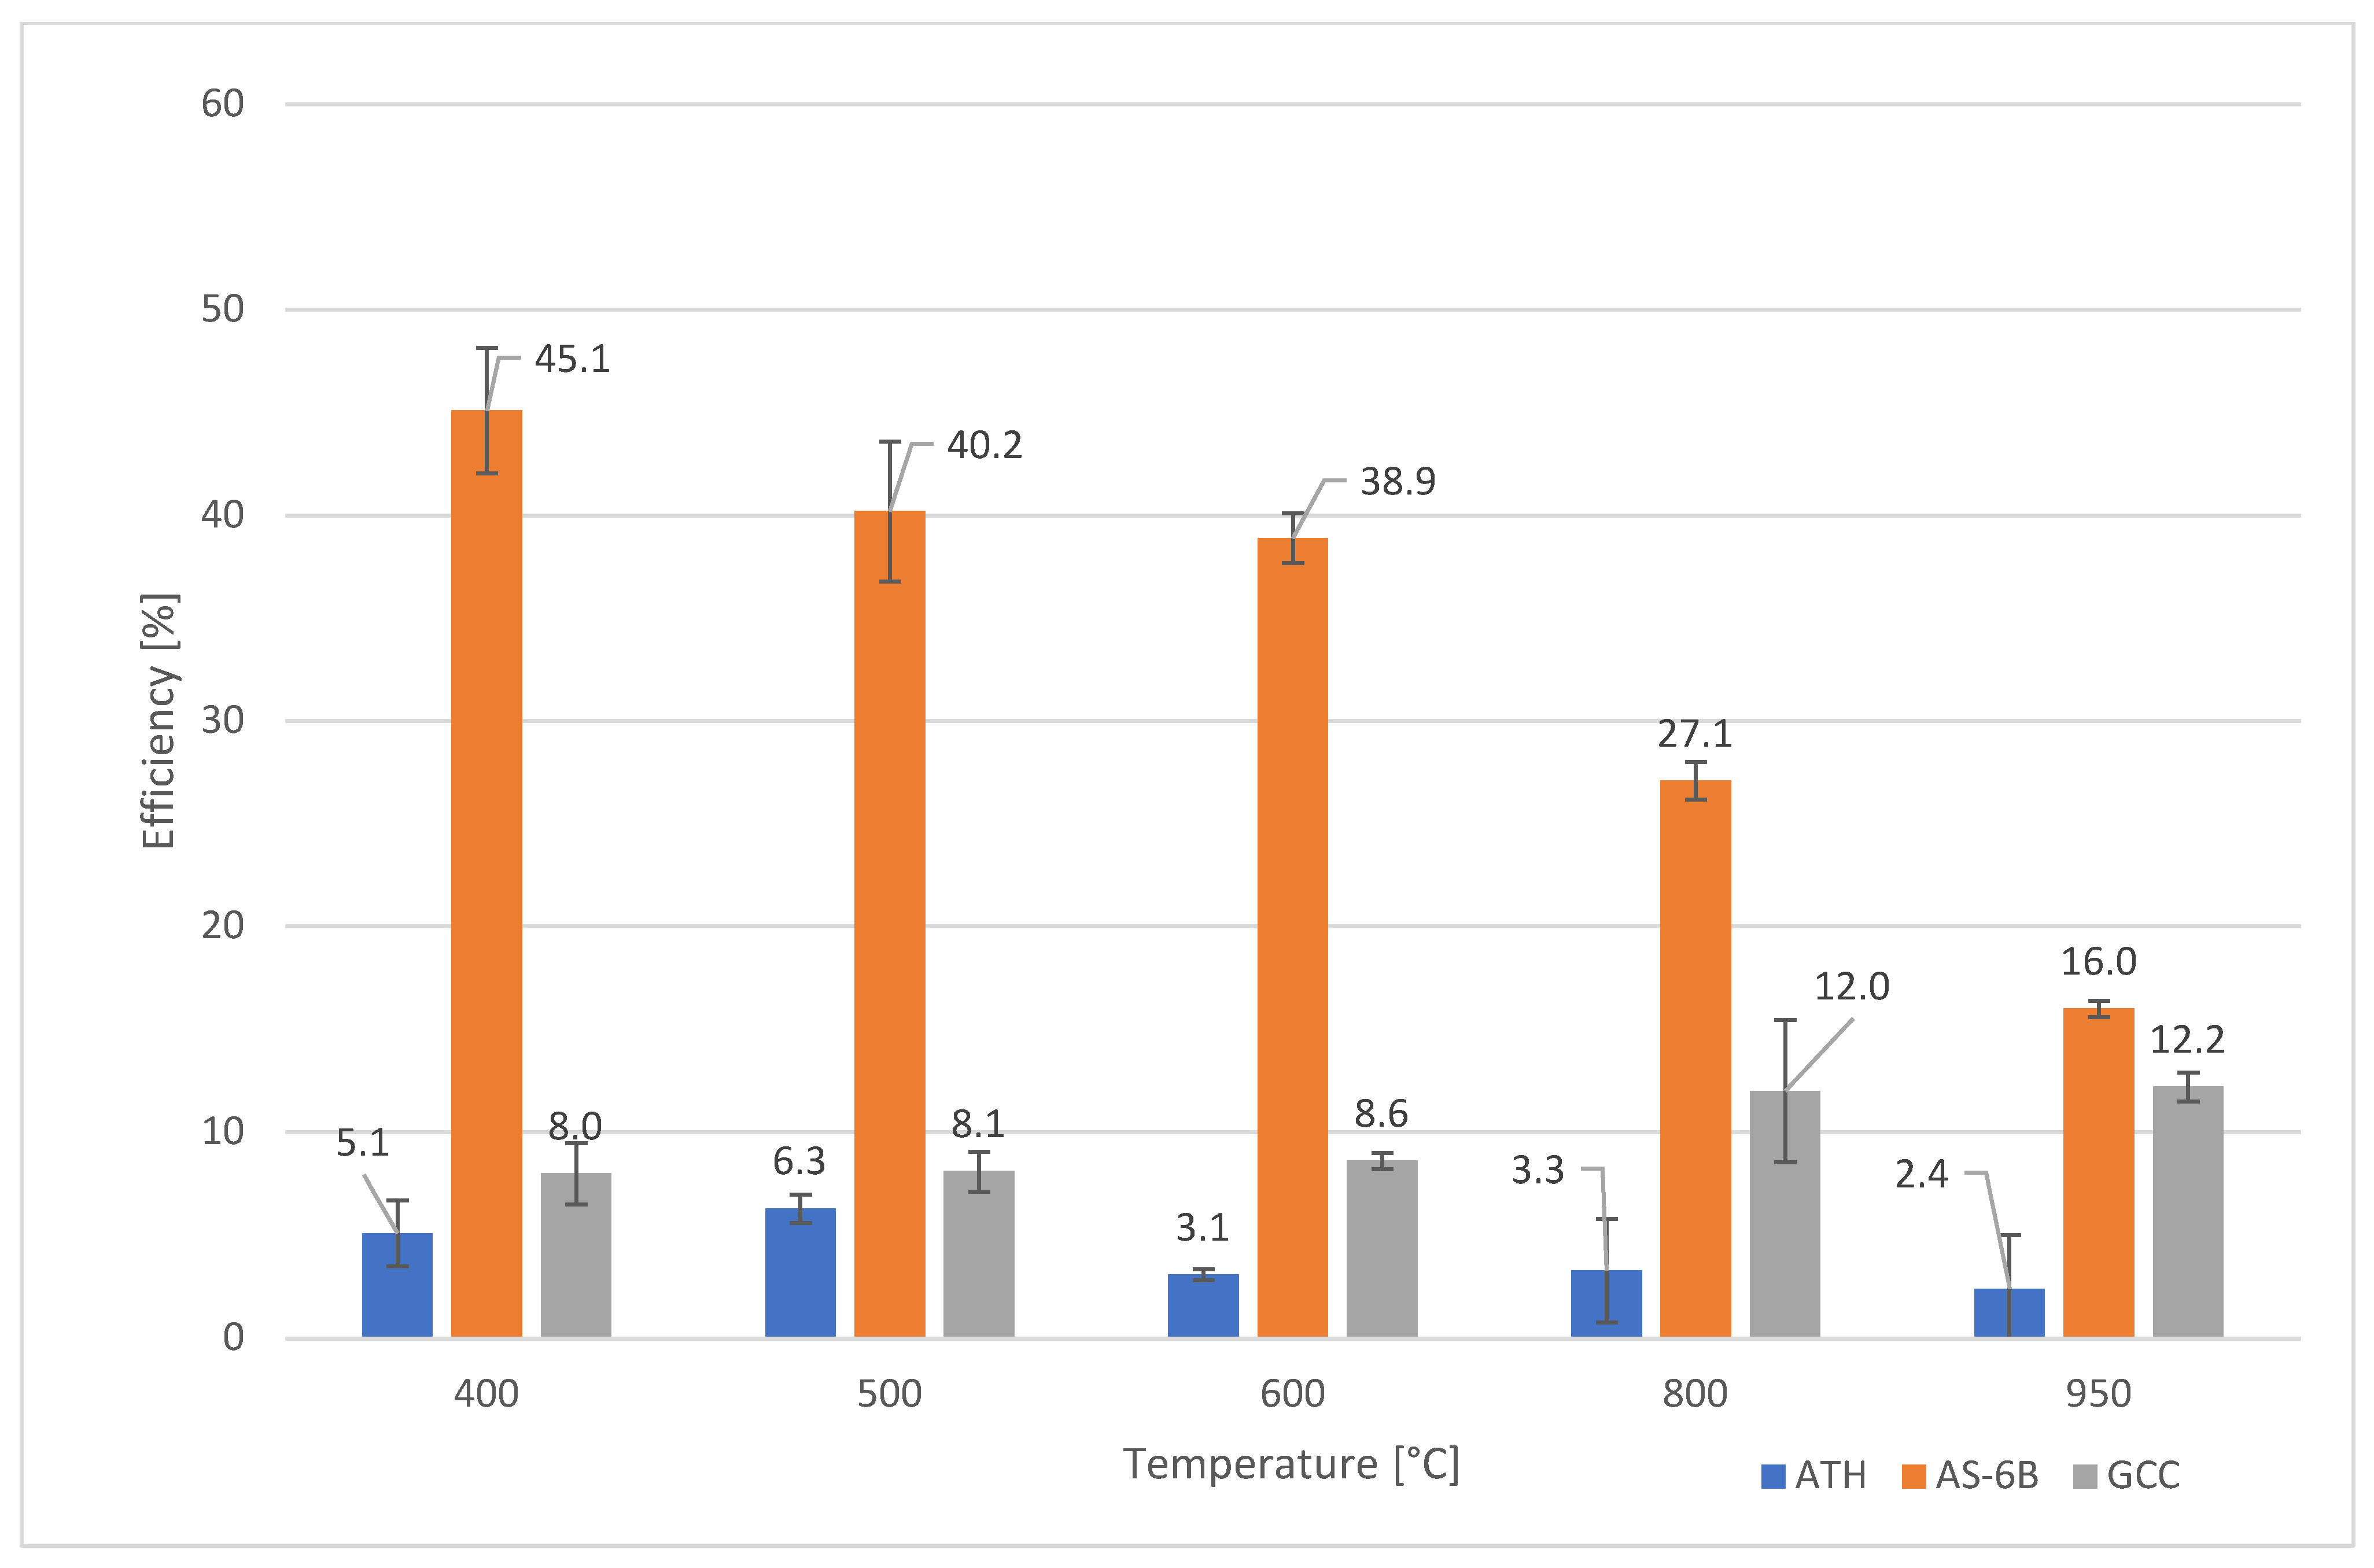
| Temperature [°C] | F50.0 | F50.1 | F50.2 | F50.3 | F50.4 | F50.5 |
|---|---|---|---|---|---|---|
| 400 | 8.0 +/− 1.5 | 5.1 +/− 1.6 | 16.9 +/− 1.9 | 40.0 +/− 0.8 | 50.8 +/− 5.1 | 45.1 +/− 3.1 |
| 500 | 8.1 +/− 1.0 | 6.3 +/− 0.7 | 6.3 +/− 2.4 | 40.6 +/− 2.6 | 41.8 +/− 4.1 | 40.2 +/− 3.4 |
| 600 | 8.6 +/− 0.4 | 3.1 +/− 0.3 | 3.4 +/− 0.7 | 39.7 +/− 1.8 | 40.9 +/− 2.7 | 38.9 +/− 1.2 |
| 800 | 12.0 +/− 3.5 | 3.3 +/− 2.5 | 3.1 +/− 2.3 | 28.2 +/− 2.8 | 36.9 +/− 0.7 | 27.1 +/− 0.9 |
| 950 | 12.2 +/− 0.7 | 2.4 +/− 2.6 | 2.3 +/− 0.4 | 14.7 +/− 1.5 | 18.7 +/− 2.2 | 16.0 +/− 0.4 |
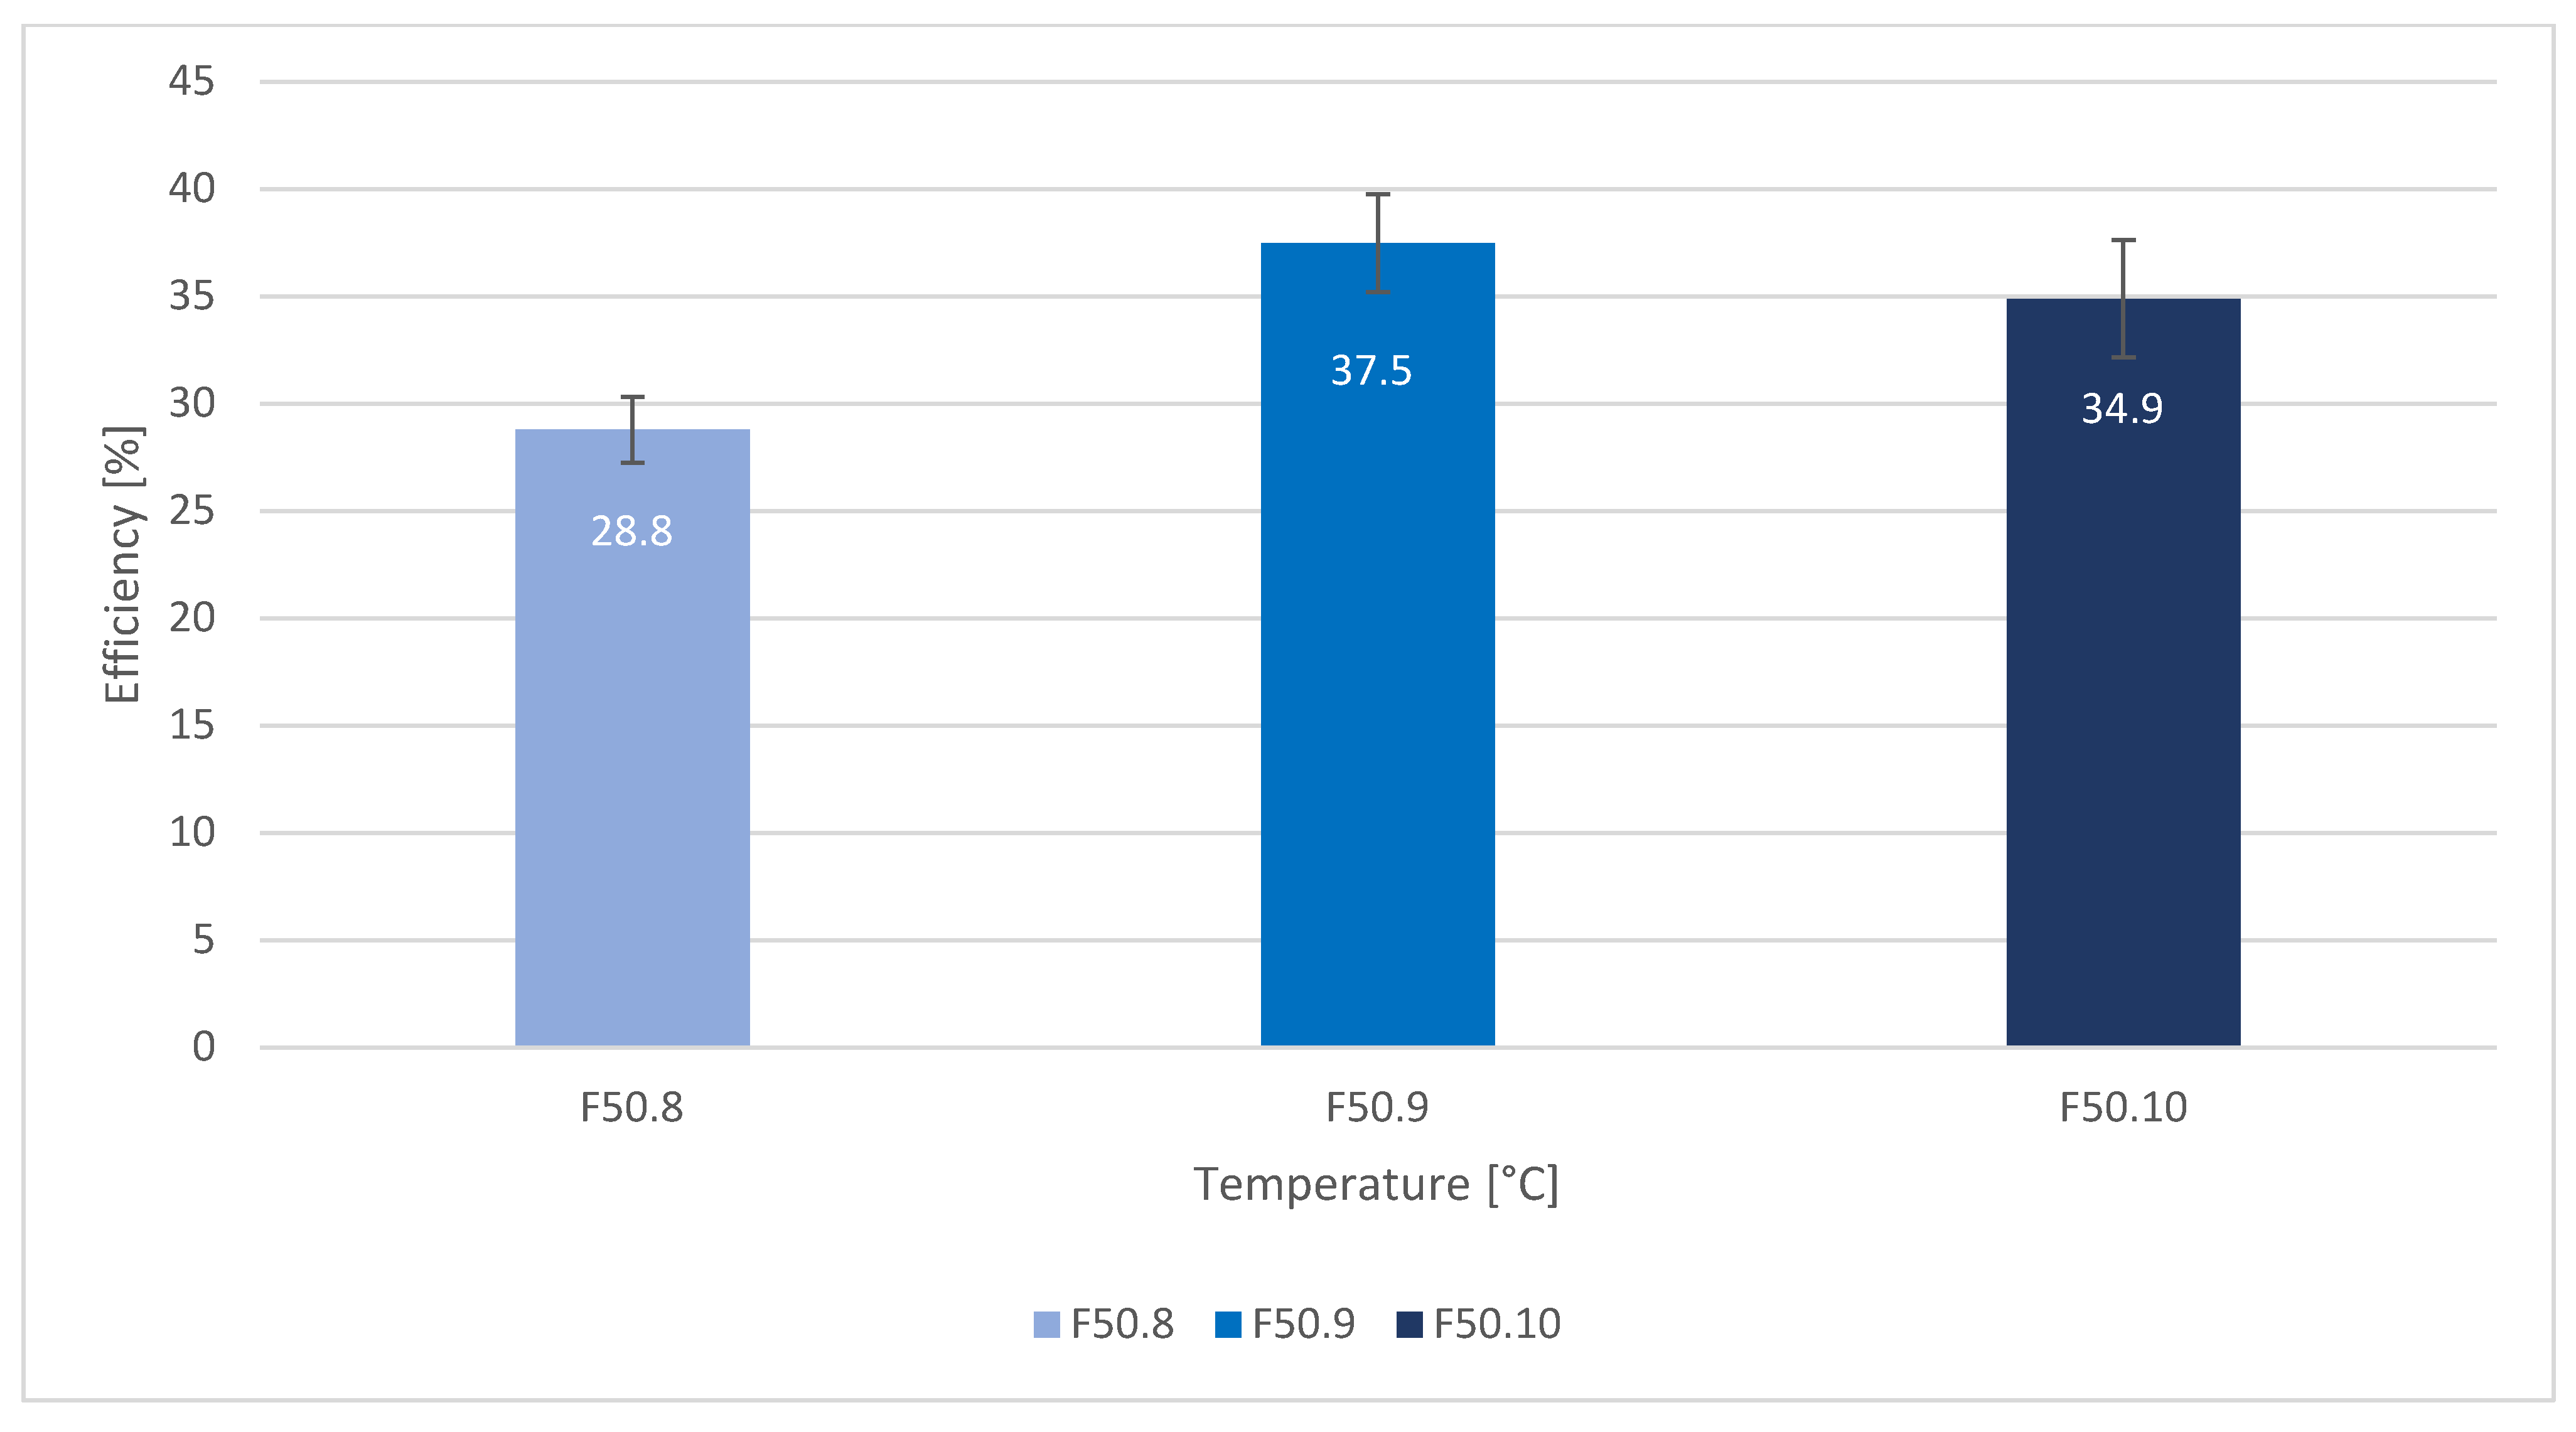
| F50.6 | F50.7 | F50.8 | F50.9 | F50.10 | |
|---|---|---|---|---|---|
| 950 °C | 18.4 +/− 1.6 | 2.4 +/− 0.5 | 28.8 +/− 1.5 | 37.5 +/− 2.3 | 34.9 +/− 2.7 |
| F50.18 | F50.19 | F50.20 | F50.21 | F50.22 | F50.23 | |
|---|---|---|---|---|---|---|
| 950 °C | 25.2 +/− 2.8 | 10.8 +/− 0.4 | 7.0 +/− 0.9 | 18.5 +/− 0.3 | 18.6 +/− 00 | 6.3 +/− 0.5 |
Publisher’s Note: MDPI stays neutral with regard to jurisdictional claims in published maps and institutional affiliations. |
© 2022 by the author. Licensee MDPI, Basel, Switzerland. This article is an open access article distributed under the terms and conditions of the Creative Commons Attribution (CC BY) license (https://creativecommons.org/licenses/by/4.0/).
Share and Cite
Sarti, G. A New Perspective on Hydrogen Chloride Scavenging at High Temperatures for Reducing the Smoke Acidity of PVC Cables in Fires. II: Some Examples of Acid Scavengers at High Temperatures in the Condensed Phase. Fire 2022, 5, 142. https://doi.org/10.3390/fire5050142
Sarti G. A New Perspective on Hydrogen Chloride Scavenging at High Temperatures for Reducing the Smoke Acidity of PVC Cables in Fires. II: Some Examples of Acid Scavengers at High Temperatures in the Condensed Phase. Fire. 2022; 5(5):142. https://doi.org/10.3390/fire5050142
Chicago/Turabian StyleSarti, Gianluca. 2022. "A New Perspective on Hydrogen Chloride Scavenging at High Temperatures for Reducing the Smoke Acidity of PVC Cables in Fires. II: Some Examples of Acid Scavengers at High Temperatures in the Condensed Phase" Fire 5, no. 5: 142. https://doi.org/10.3390/fire5050142