Article

Influence of Oxygen Concentration on Combustion Kinetics and Gas Products of a Polyurethane–Coal Mixture

School of Emergency Management and Safety Engineering, China University of Mining and Technology-Beijing, Beijing 100083, China
*
Author to whom correspondence should be addressed.
Fire 2022, 5(6), 181; https://doi.org/10.3390/fire5060181
Submission received: 30 September 2022 / Revised: 27 October 2022 / Accepted: 28 October 2022 / Published: 2 November 2022
(This article belongs to the Special Issue Mine Fires and Explosions)

Abstract

:
Polyurethane materials are often used in mines to fill the geological structural areas for pretreatment and plugging. These areas are primarily high-incidence areas of coal spontaneous combustion (CSC). Polyurethane will promote the spontaneous combustion of the remaining coal because of its superior thermal insulation performance. Previous studies have focused on the effect of polyurethane on the spontaneous combustion of coal in air atmosphere, without considering the variation of oxygen concentration in the mining area. The paper investigates the effect of polyurethane on the spontaneous combustion of coal in the mining area under different oxygen concentration conditions according to the variation law of oxygen concentration in the mining area. Herein, thermogravimetry-Fourier transform infrared spectroscopy (TG-FTIR) coupled methods were used to study the kinetics and gas release laws of a polyurethane–coal mixture. The critical temperature of coal increases with the decrease of oxygen concentration. When the oxygen concentration exceeds 10%, the shift of the thermogravimetric curve to the right is smaller, indicating that the oxygen concentration has less influence on the combustion of a polyurethane–coal mixture. When the oxygen concentration is less than 10%, the shift of the thermogravimetric curve toward a higher temperature is more prominent, indicating that the oxygen concentration has a greater influence on the thermogravimetric curve. Simultaneously, the maximum value of DTG increases with the increasing oxygen concentration. The main gas products of coal pyrolysis are CO2, CH4, and H2O, while those of polyurethane pyrolysis are mainly CO2, CO, CH4, and H2O during the pyrolysis process. The amount of CO2 during the pyrolysis of various proportions of coal and polyurethane is the main difference in the gas products. Coal can promote the pyrolysis of polyurethane to some extent. The characteristic temperature rises and falls as the proportion of polyurethane in the polyurethane–coal mixture changes. In the actual monitoring, small amounts of H2O, CO2, and CO gases appear in the starting phase, then a large increase in the amount of gases can be considered that polyurethane is involved in the relevant combustion reactions, which can avoid misjudgment of the spontaneous combustion of coal in the mining area.

1. Introduction

Polymeric materials such as filled polyurethanes are commonly used in coal mines to plug leaks in preset trap columns and geological anomalies to increase the bearing capacity of the remaining coal in the mining areas, prevent air leakage, and reduce the risk of spontaneous coal combustion [1,2]. Polyurethane materials are used in large quantities in coal mines, owing to their strength and excellent plugging effect, reaching approximately 100,000 tons. The use of polyurethane materials in plugging leaks can cause fire accidents, such as those in a coal mine in Sichuan South, while filling a fall zone, and in a coal mine in Shanxi while reinforcing a fault [3,4]. Because polyurethane material can flow along the fissure, it results in an increased area of contact with the coal. When polyurethane is used to reinforce and repair a fractured area, different proportions of coal coexisting with polyurethane can occur in the fractured area. The presence of polyurethane can affect CSC in the mining areas. Studying the effect of polyurethane on coal combustion kinetics and gaseous products can contribute to the theoretical development of spontaneous combustion of coal in polyurethane-containing mined voids. It can also provide a theoretical basis for preventing and controlling spontaneous coal combustion in coal mining areas containing polyurethane.
The study of the mechanism of spontaneous combustion of coal is the basis for the study of the effect of polyurethane on spontaneous combustion of coal. The mechanism of spontaneous combustion of coal has been studied by many scholars. Moshood Onifade [5] et al. used the TG and Wits-Ehac tests to characterize coal and coal shale samples to investigate the propensity for spontaneous combustion between coal seams and in coal shale, concluding that coal has a higher spontaneous combustibility index than coal shale. A “high temperature coal spontaneous combustion” device has been designed to investigate the entire process of coal spontaneous combustion. The effect of oxygen concentration on indicators of coal spontaneous combustion characteristics varied with the range of the temperature [6]. With long-flame coal in the Tangjiahui mine as the study object, Zhang [7] conducted the temperature-programed coal spontaneous combustion experiment and the coal spontaneous combustion experiment. The oxygen concentration and gas production were measured during the spontaneous combustion of coal under different oxygen supply conditions. The coal exothermic reaction process under different oxygen concentrations was analyzed with the use of a synchronous thermal analyzer, and it is concluded that the three reaction mechanisms of oxidative decomposition, gas-phase combustion, and solid-phase combustion are all inhibited in the absence of oxygen [8].
The combustion kinetics of polyurethane and coal are currently being studied more often. Li [9] studied the variation in mass and critical temperature of six coals using thermogravimetric methods in the process of coal spontaneous combustion (CSC) under lean-oxygen conditions. Moreover, Yang studied the oxidation kinetics of coals with different metamorphism degrees [10,11] using TG-FTIR coupling methods. JIA [12] found that the higher the oxygen concentration, the more violent the coal-oxygen complex reaction and the higher the concentration of gas products with the CSC experiments under six oxygen concentrations. QI [13] studied the thermodynamic properties of three coals under low oxygen conditions, and the effects of oxygen concentration on the characteristic temperature were analyzed in a study. The research on polyurethane mainly uses a three-step reaction to explain its pyrolysis reaction [14,15].
LEI [16] revealed the pyrolysis kinetics and gas release patterns of flexible foam polyurethane using TG-FTIR experiments under nitrogen and air conditions. Furthermore, Singh [17] summarized the mechanism of the ignition and combustion of polyurethane foam. Studies on mixed polyurethane–coal combustion have focused on the kinetics of their mixed combustion under air conditions. Guo [18] examined the effect of polyurethane on CSC using two kinetic models by thermogravimetric experiments but did not consider the effect of the amount of polyurethane or the oxygen concentration. When the ratio of polyurethane to coal was less than 1:5, Tian [19,20] studied the kinetics of their mixed combustion and their thermal cracking products using thermal cracking gas chromatography-mass spectrometry (Py-GC/MS) at different temperature conditions to derive the synergistic effect of both in mixed combustion simultaneously. The process of CSC produces many toxic and harmful gases, which can easily cause casualties [12,21]. During the combustion of polyurethane, the gas production is mainly CO, CO2, C2H2, CH4, and multicarbon alkanes. Hydrogen cyanide gas is produced during the massive injection of polyurethane [22].
The oxygen concentration can significantly affect CSC and is also an essential basis for the division of the “spontaneous combustion three zones” in the mining area [23,24]. Previous studies have focused on the effect of polyurethane on the spontaneous combustion of coal in air atmosphere, without considering the variation of oxygen concentration in the mining area. The paper investigates the effect of polyurethane on the spontaneous combustion of coal in the mining area under different oxygen concentration conditions, according to the variation law of oxygen concentration in the mining area. In order to comprehensively consider the effect of polyurethane on coal spontaneous combustion in the mining area, the thermogravimetric-infrared coupling technique is used to explore the kinetic characteristics, gas products, and release patterns of a polyurethane–coal mixture combustion under different temperature conditions, as well as to provide some theoretical basis for accident monitoring of CSC in the mining area from the perspective of gas detection

2. Experimental Design and Methods

2.1. Experimental Samples

The experimental coal samples were collected from the Wenzhuang coal mine in Changzhi, Shanxi, China. Polyurethane is the reinforcement material used in the mine. Material A is a polyether polyol, and material B is diphenylmethane diisocyanate. The mixing ratio of material A to B for coal mines is 1:1, and polyurethane samples are made in a 1:1 ratio. Industrial and elemental analyses of the coal and polyurethane samples are used in the experiments, along with proximate and elemental investigations, as shown in Table 1.

2.2. Experimental Equipment and Conditions

The experimental equipment is a thermogravimetric-infrared coupled system, as shown in Figure 1, comprising a synchronous thermal analyzer (TG) and an infrared spectrometer (FTIR) from Netzsch, Germany, STA449F3.
Prior to the experiment, the coal samples and polyurethane were crushed and sieved into 200 mesh particles. After drying, 10 mg of the sample were weighed on an electronic balance and placed in the crucible. The total flow rate of the incoming gas was 50 mL/min. The oxygen concentration was selected according to the “spontaneous combustion three zones” in the mining area—the air leakage, oxidation zone, and asphyxiation zones, while two oxygen concentrations were selected considering the wide range of oxidation zones. The oxygen concentrations were selected as 20%, 14%, 10%, and 4% [23,24], and the oxygen concentration was controlled by the proportional introduction of oxygen and nitrogen, with a purge flow rate of 50 mL/min. The range of the programmed temperature rise was chosen to be 30 °C–800 °C based on the combustion temperature of the coal and polyurethane. The specific experimental conditions are shown in Table 2. The ratio of polyurethane to coal is expressed as PU:C.

3. Results and Discussion
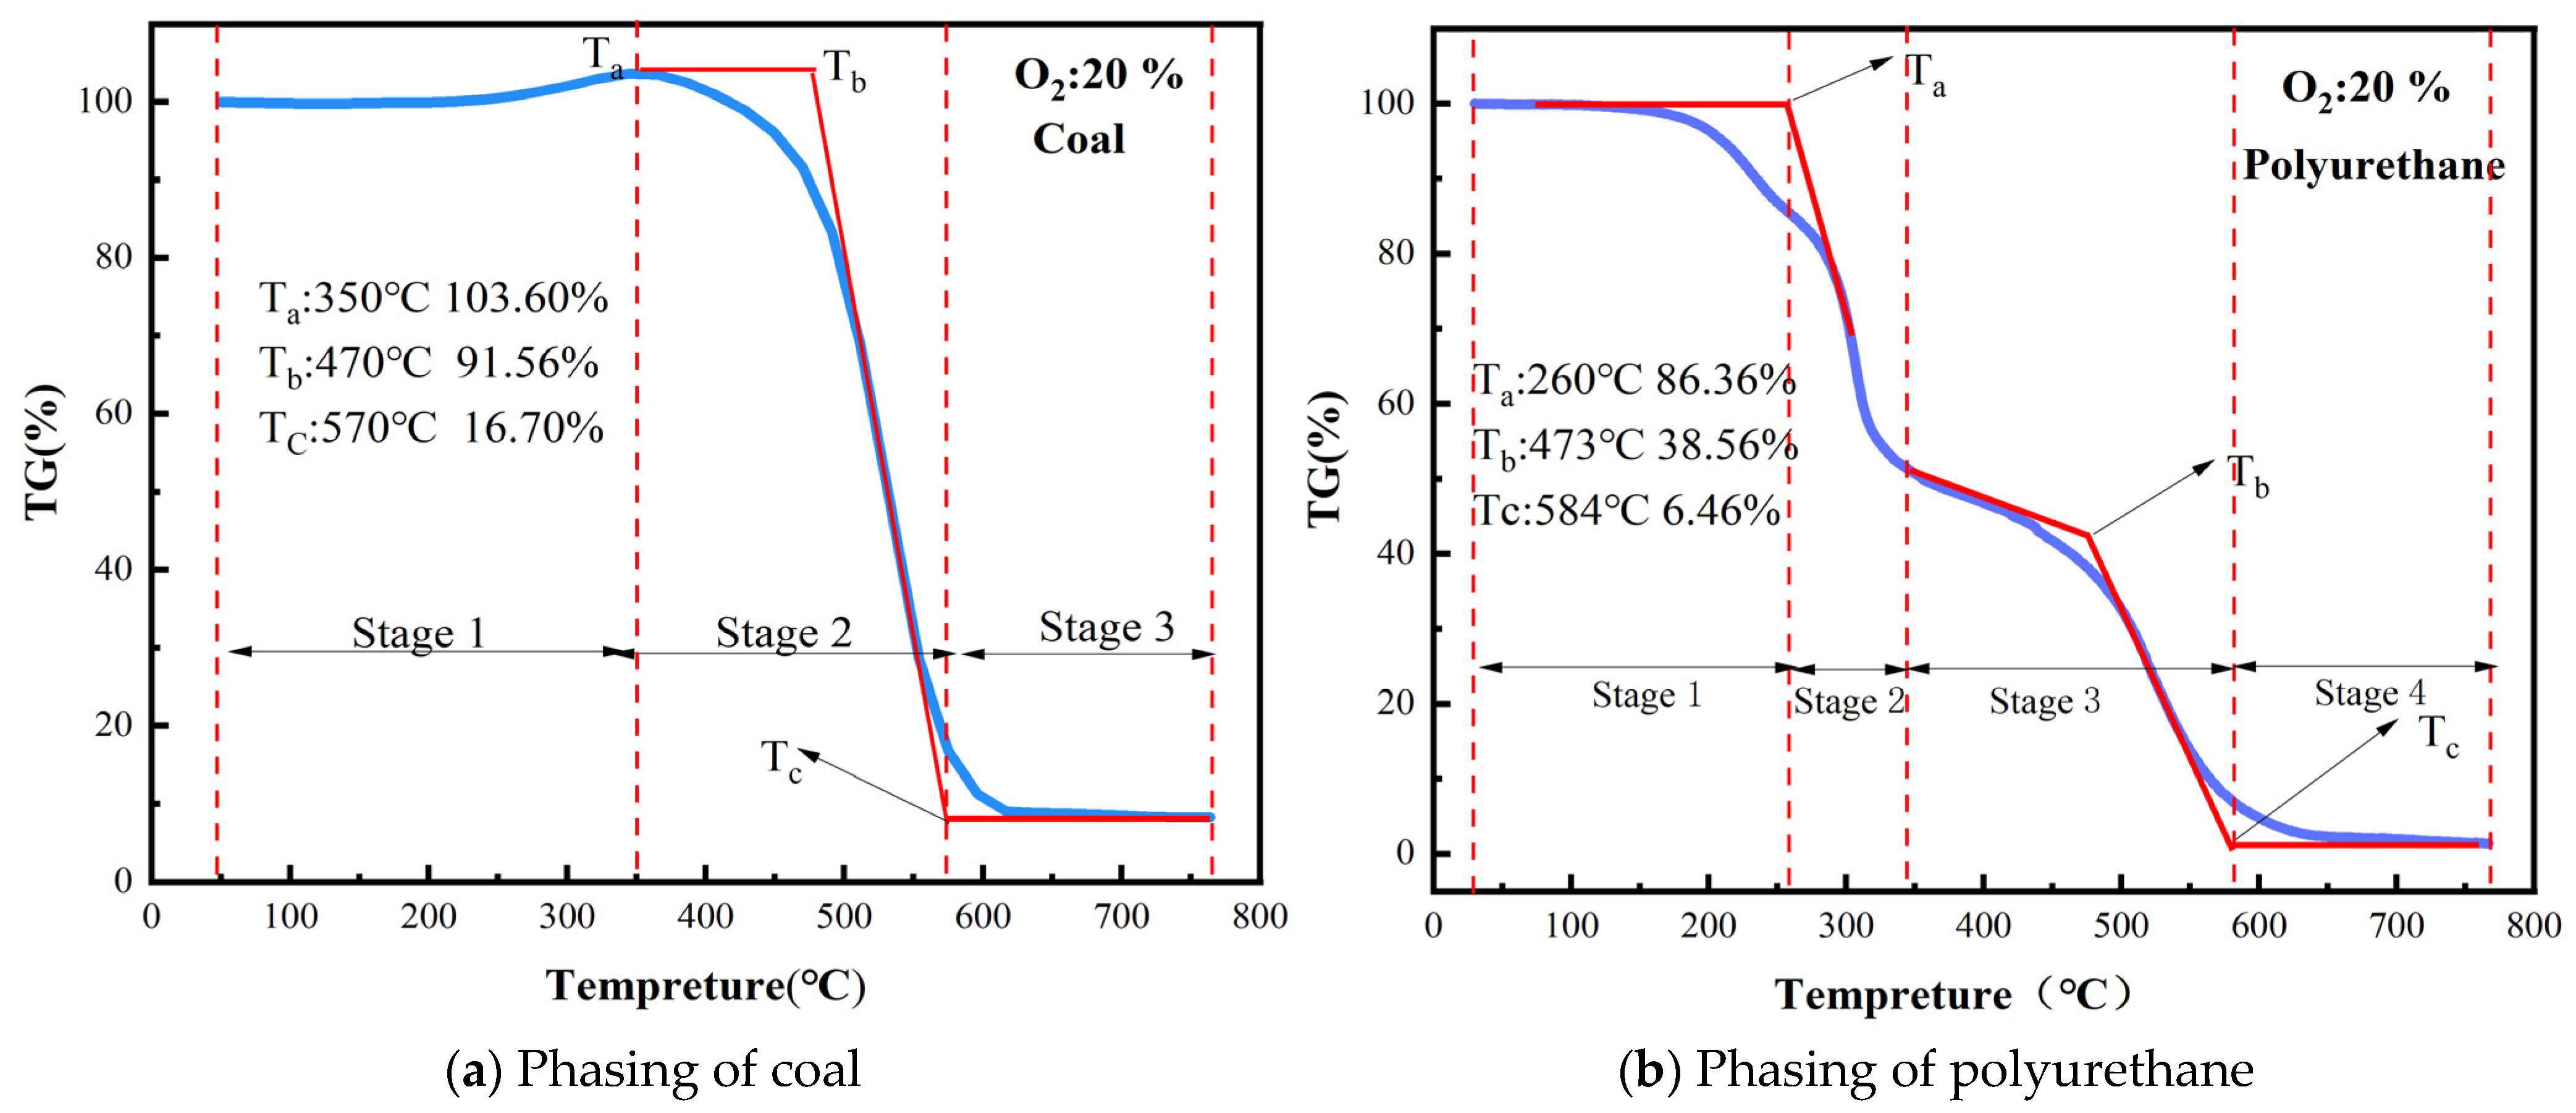
3.1. Staging

The chemical structure of coal is extremely complex, with different forms, such as free radicals and reactivation functional groups [25]. Polyurethanes are mainly composed of urethane chain segments. Due to the difference in composition and structure between coal and polyurethane, the pyrolysis process is also quite different. The thermogravimetric curve is obtained and divided into stages under the experimental conditions of a 20% oxygen concentration and a 10 k/min heating rate. The results are shown in Figure 2.
According to Figure 2a, the pyrolysis of coal is roughly divided into three stages [26]. The first stage is the evaporation of water, oxygen absorption, and weight gain; the second stage is mainly the pyrolysis stage. This stage mainly entails the thermal decomposition and combustion stages. Pyrolysis is primarily the start of pyrolytic oxidation of the aromatic structures in the coal. With exothermic oxidation and increasing temperature, the coal reaches the ignition temperature and begins to combust. During this process, large amounts of gas are produced, the mass rapidly reduces, and the thermogravimetric curve quickly falls. The third stage is the burnout stage. In this stage, the coal sample is burned out, and the residual mass no longer changes. Mass equilibrium is reached because the chemical reaction no longer occurs even if the temperature increases.
Unlike coal, the pyrolysis of polyurethane is divided into four main stages [27]. The first stage is mostly evaporating water molecules and some small molecule products. Compared with the first stage of coal, the stage of polyurethane has less weight loss. The second stage is the pyrolysis stage, where the first weight loss peak occurs. The third stage is the carbonization stage, where the dehydrogenation and condensation reactions mainly occur, forming a carbon residue dominated by carbon. The carbide produced during pyrolysis reacts with oxygen, causing a decrease in the mass of the polyurethane sample.

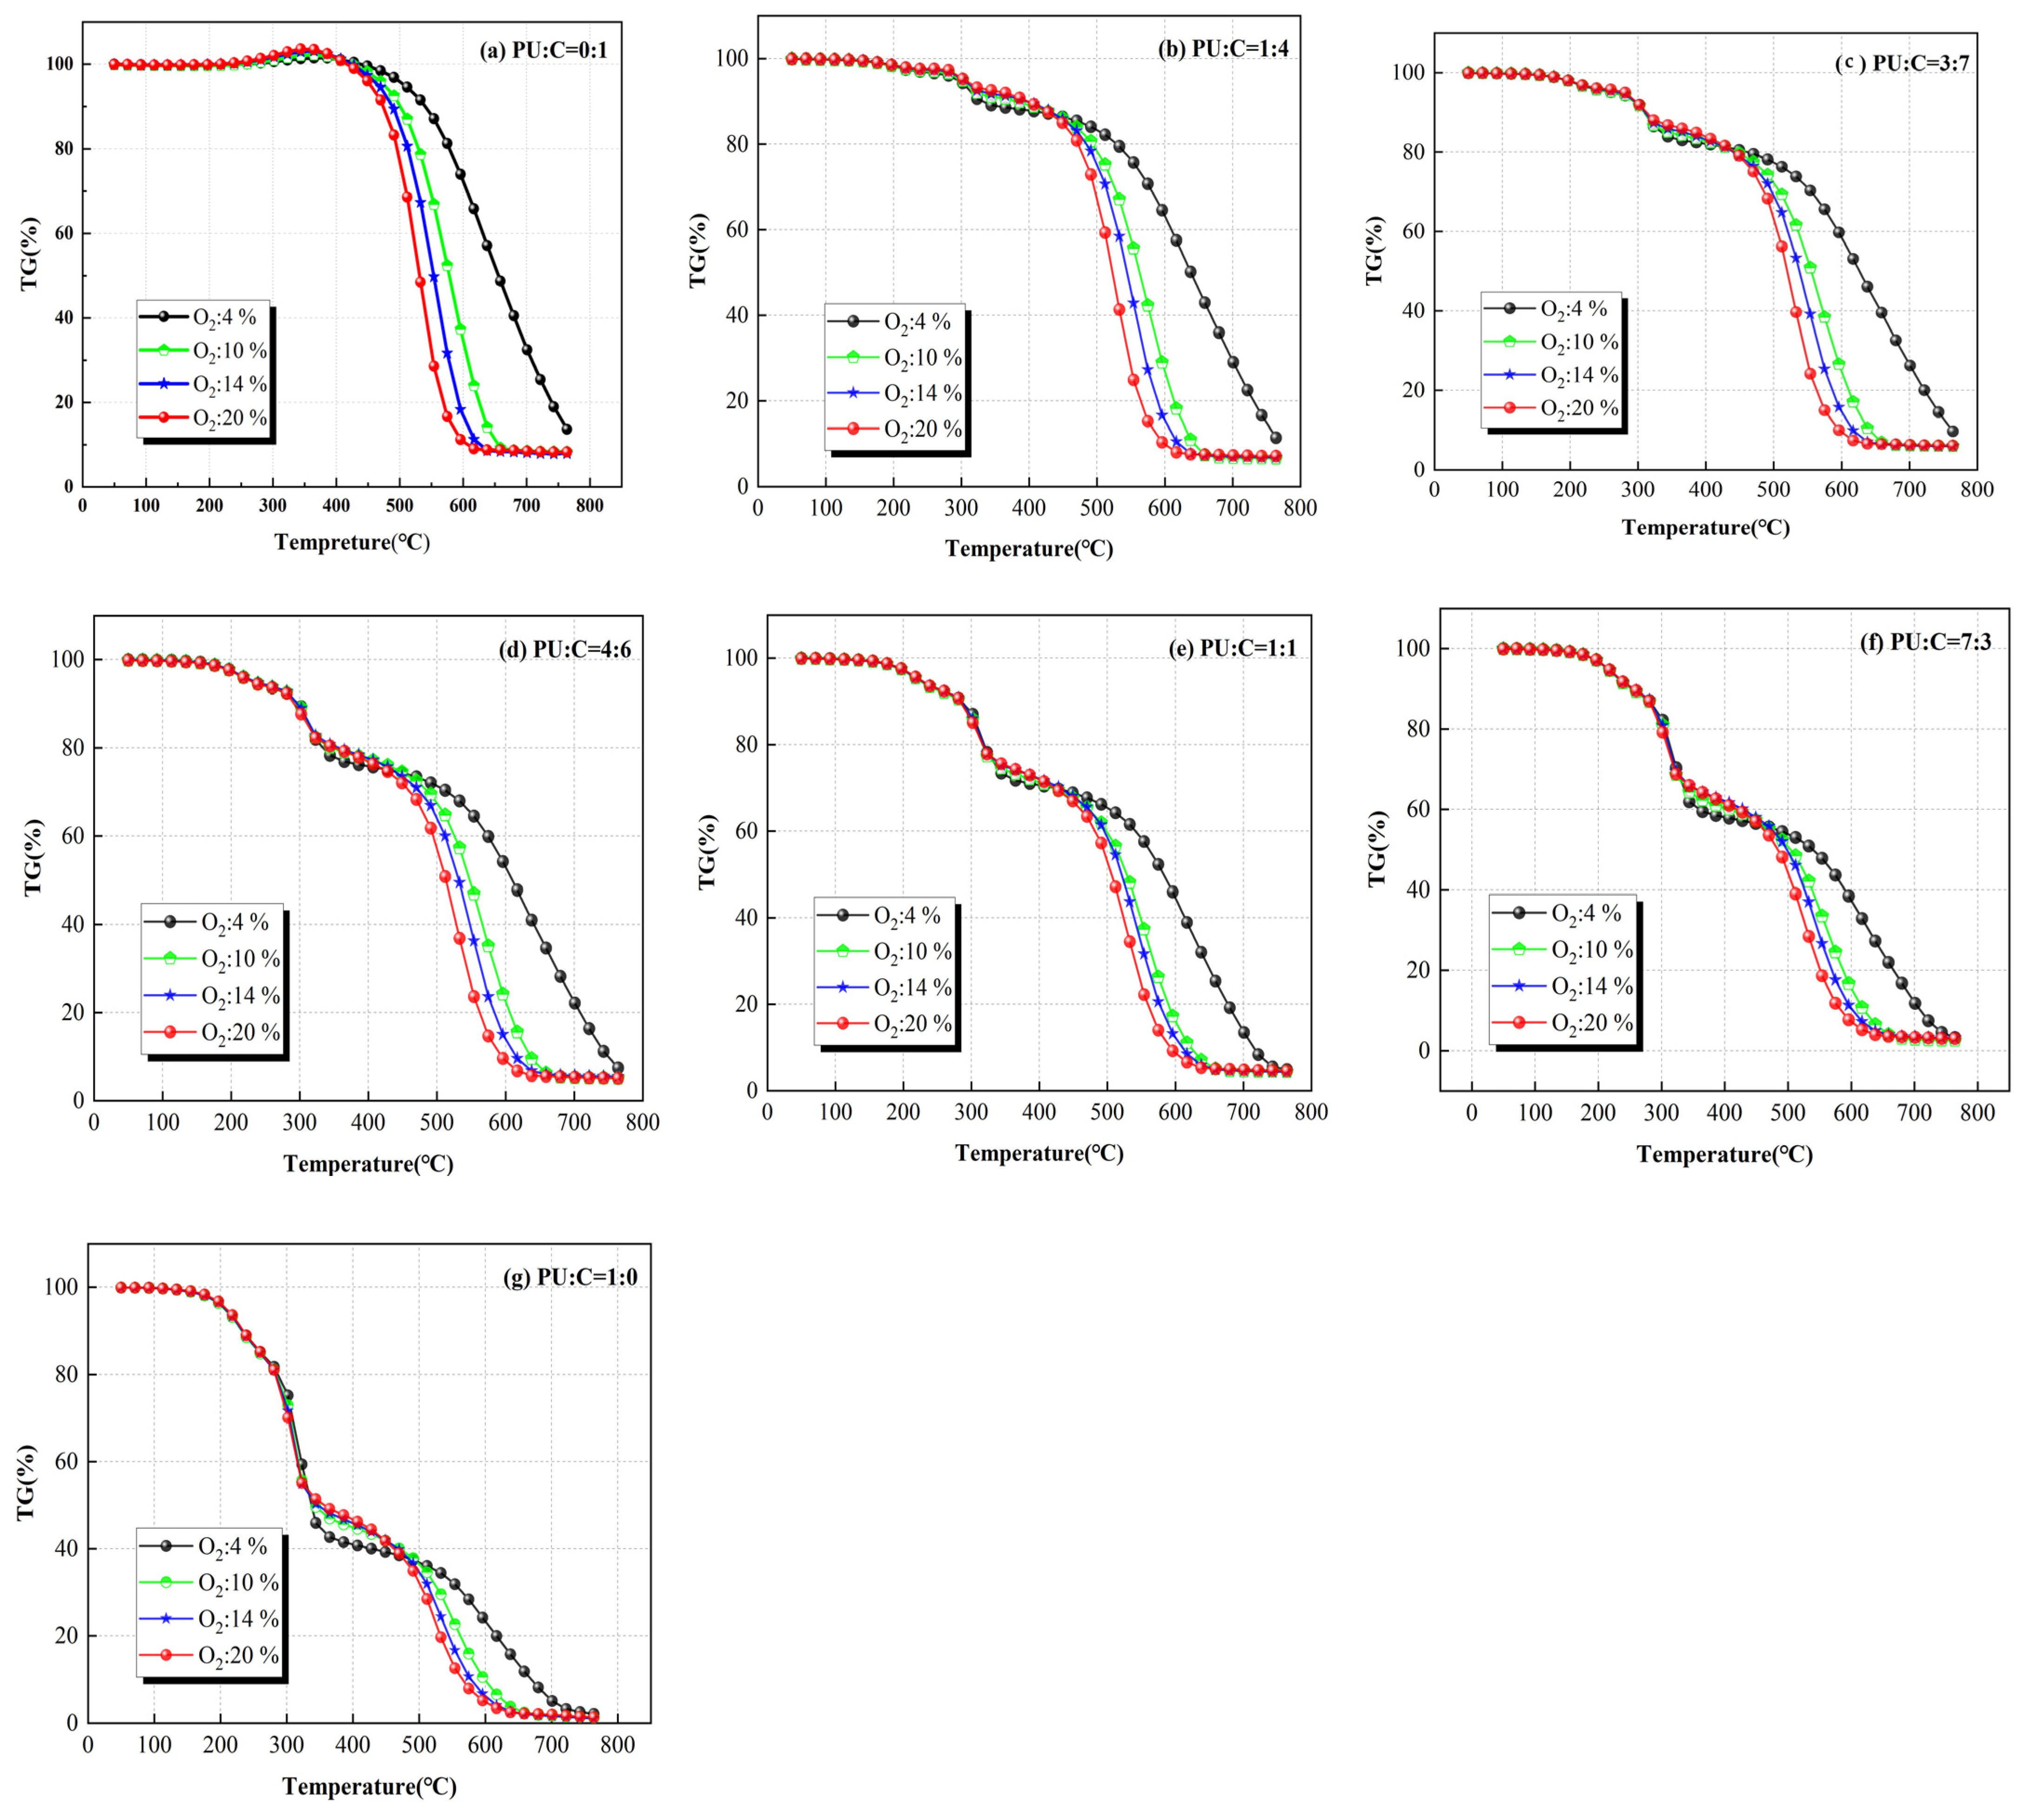
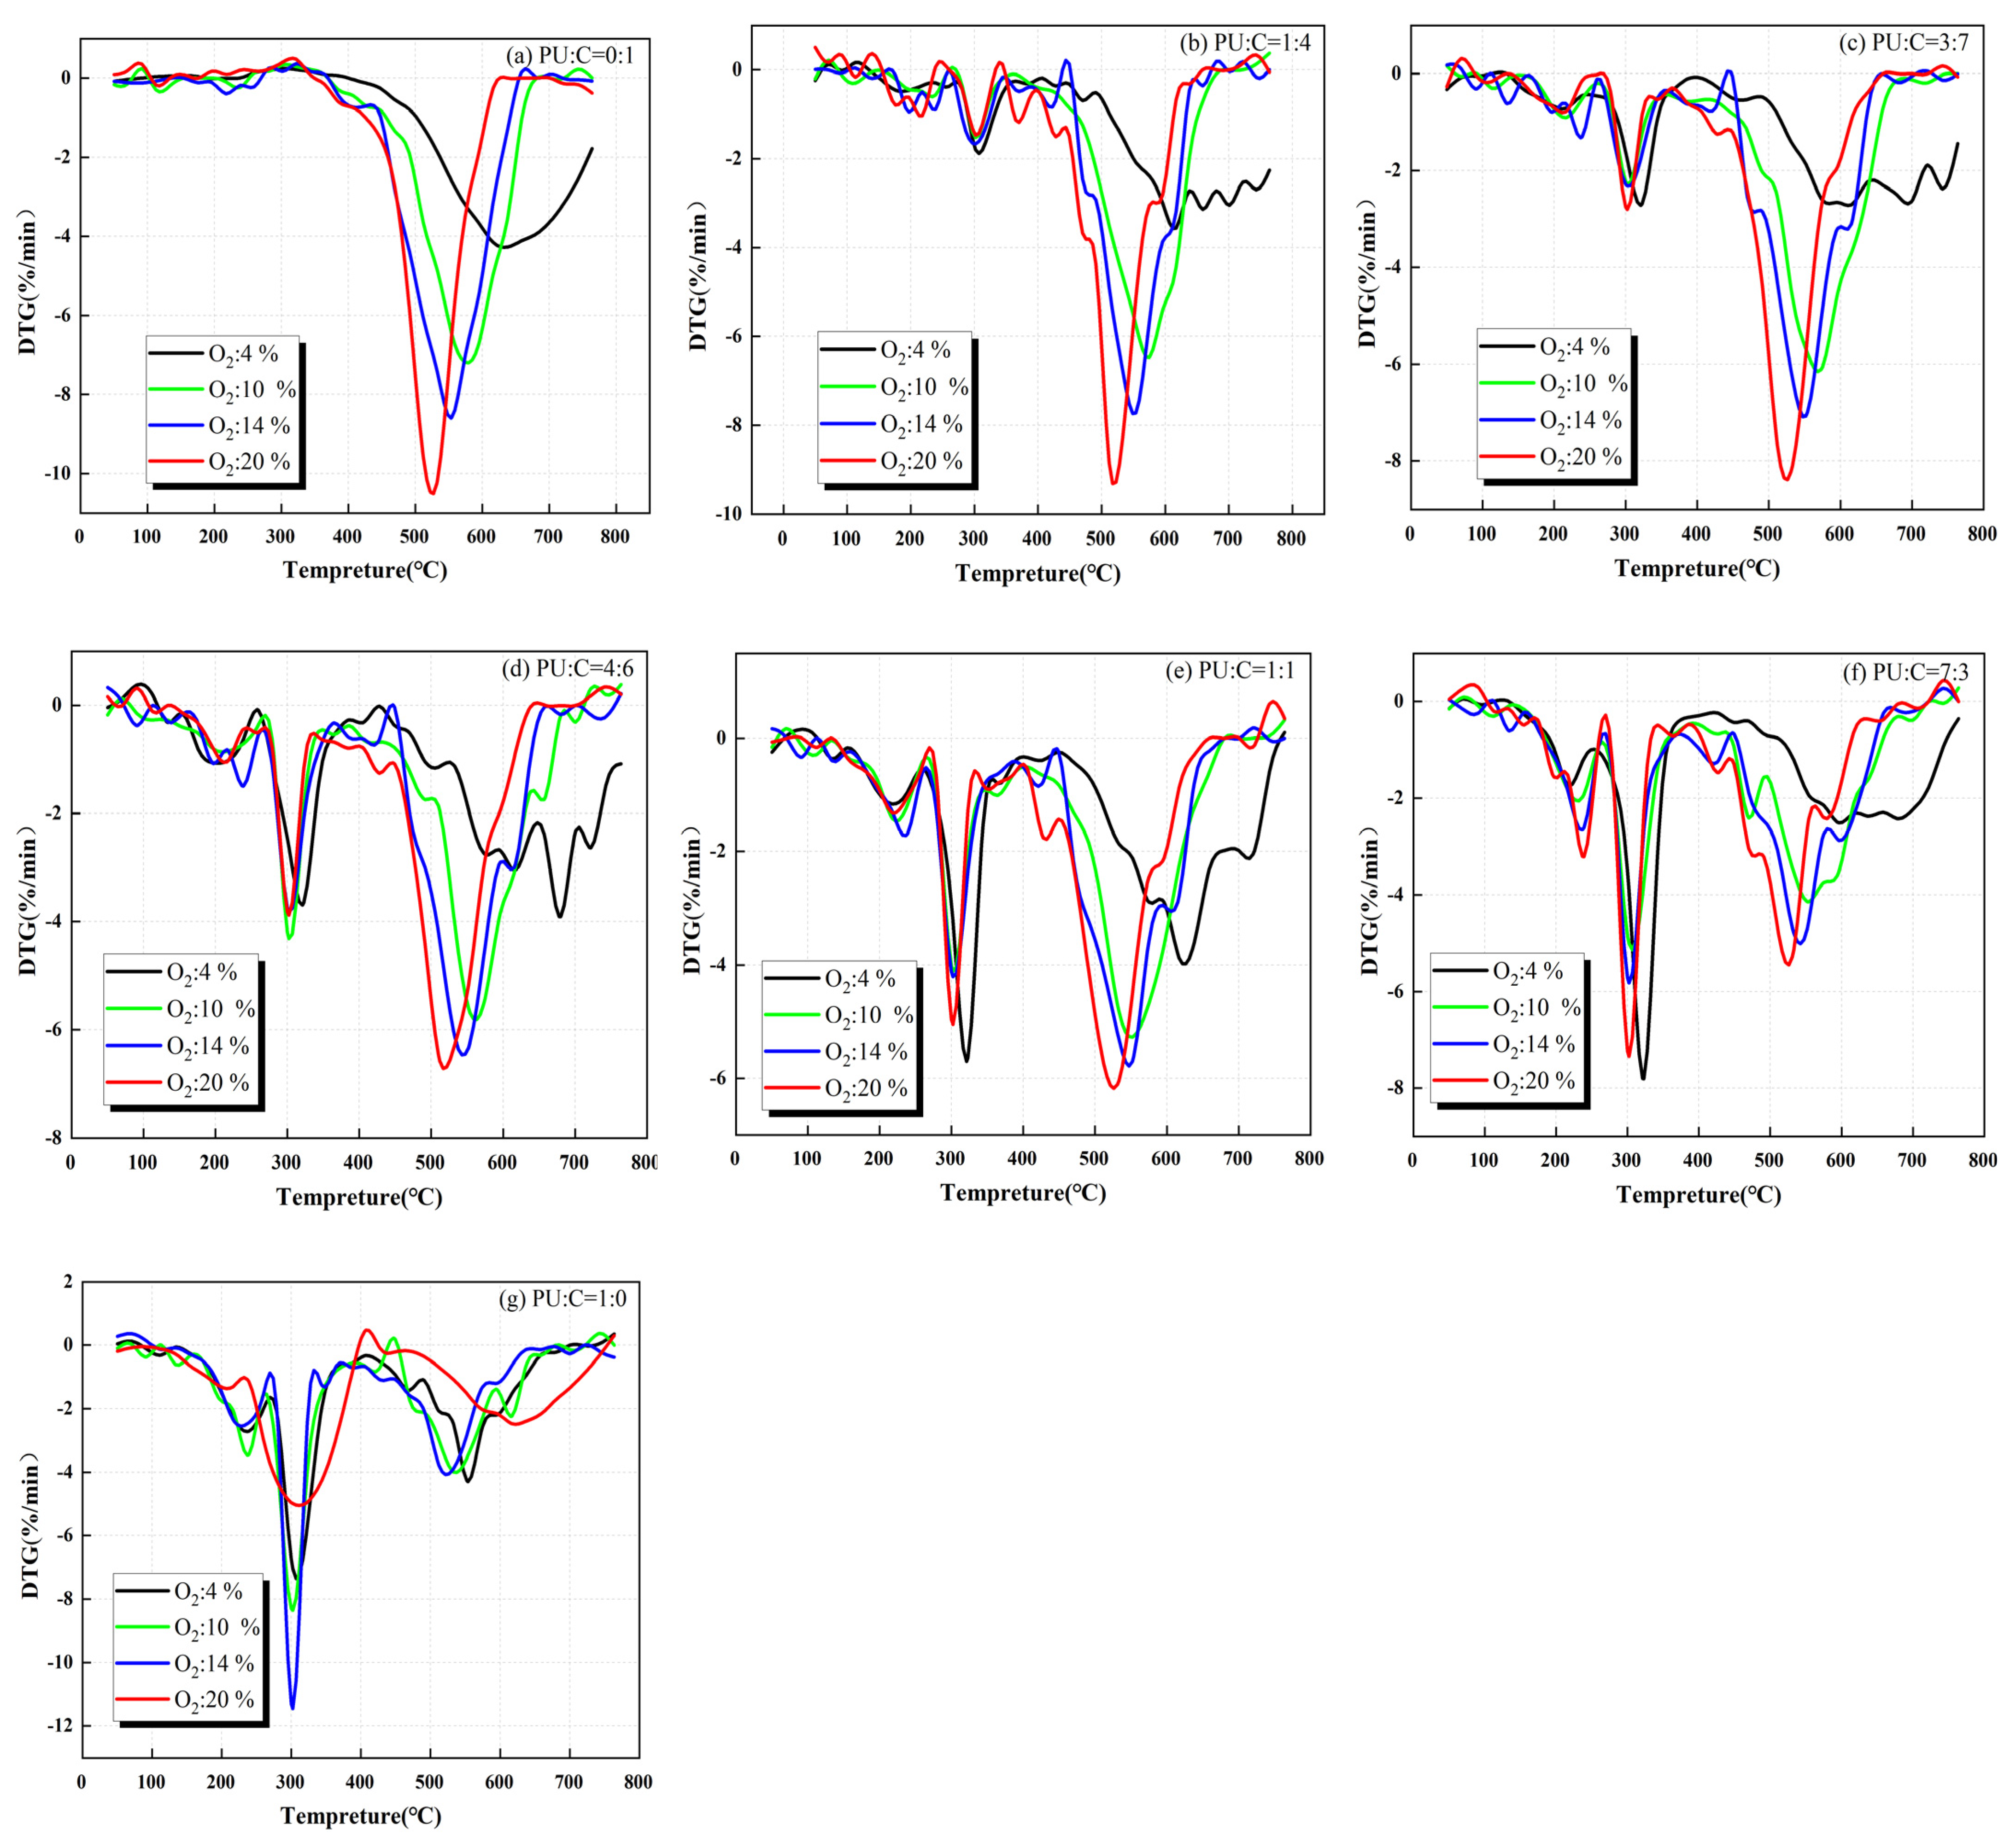
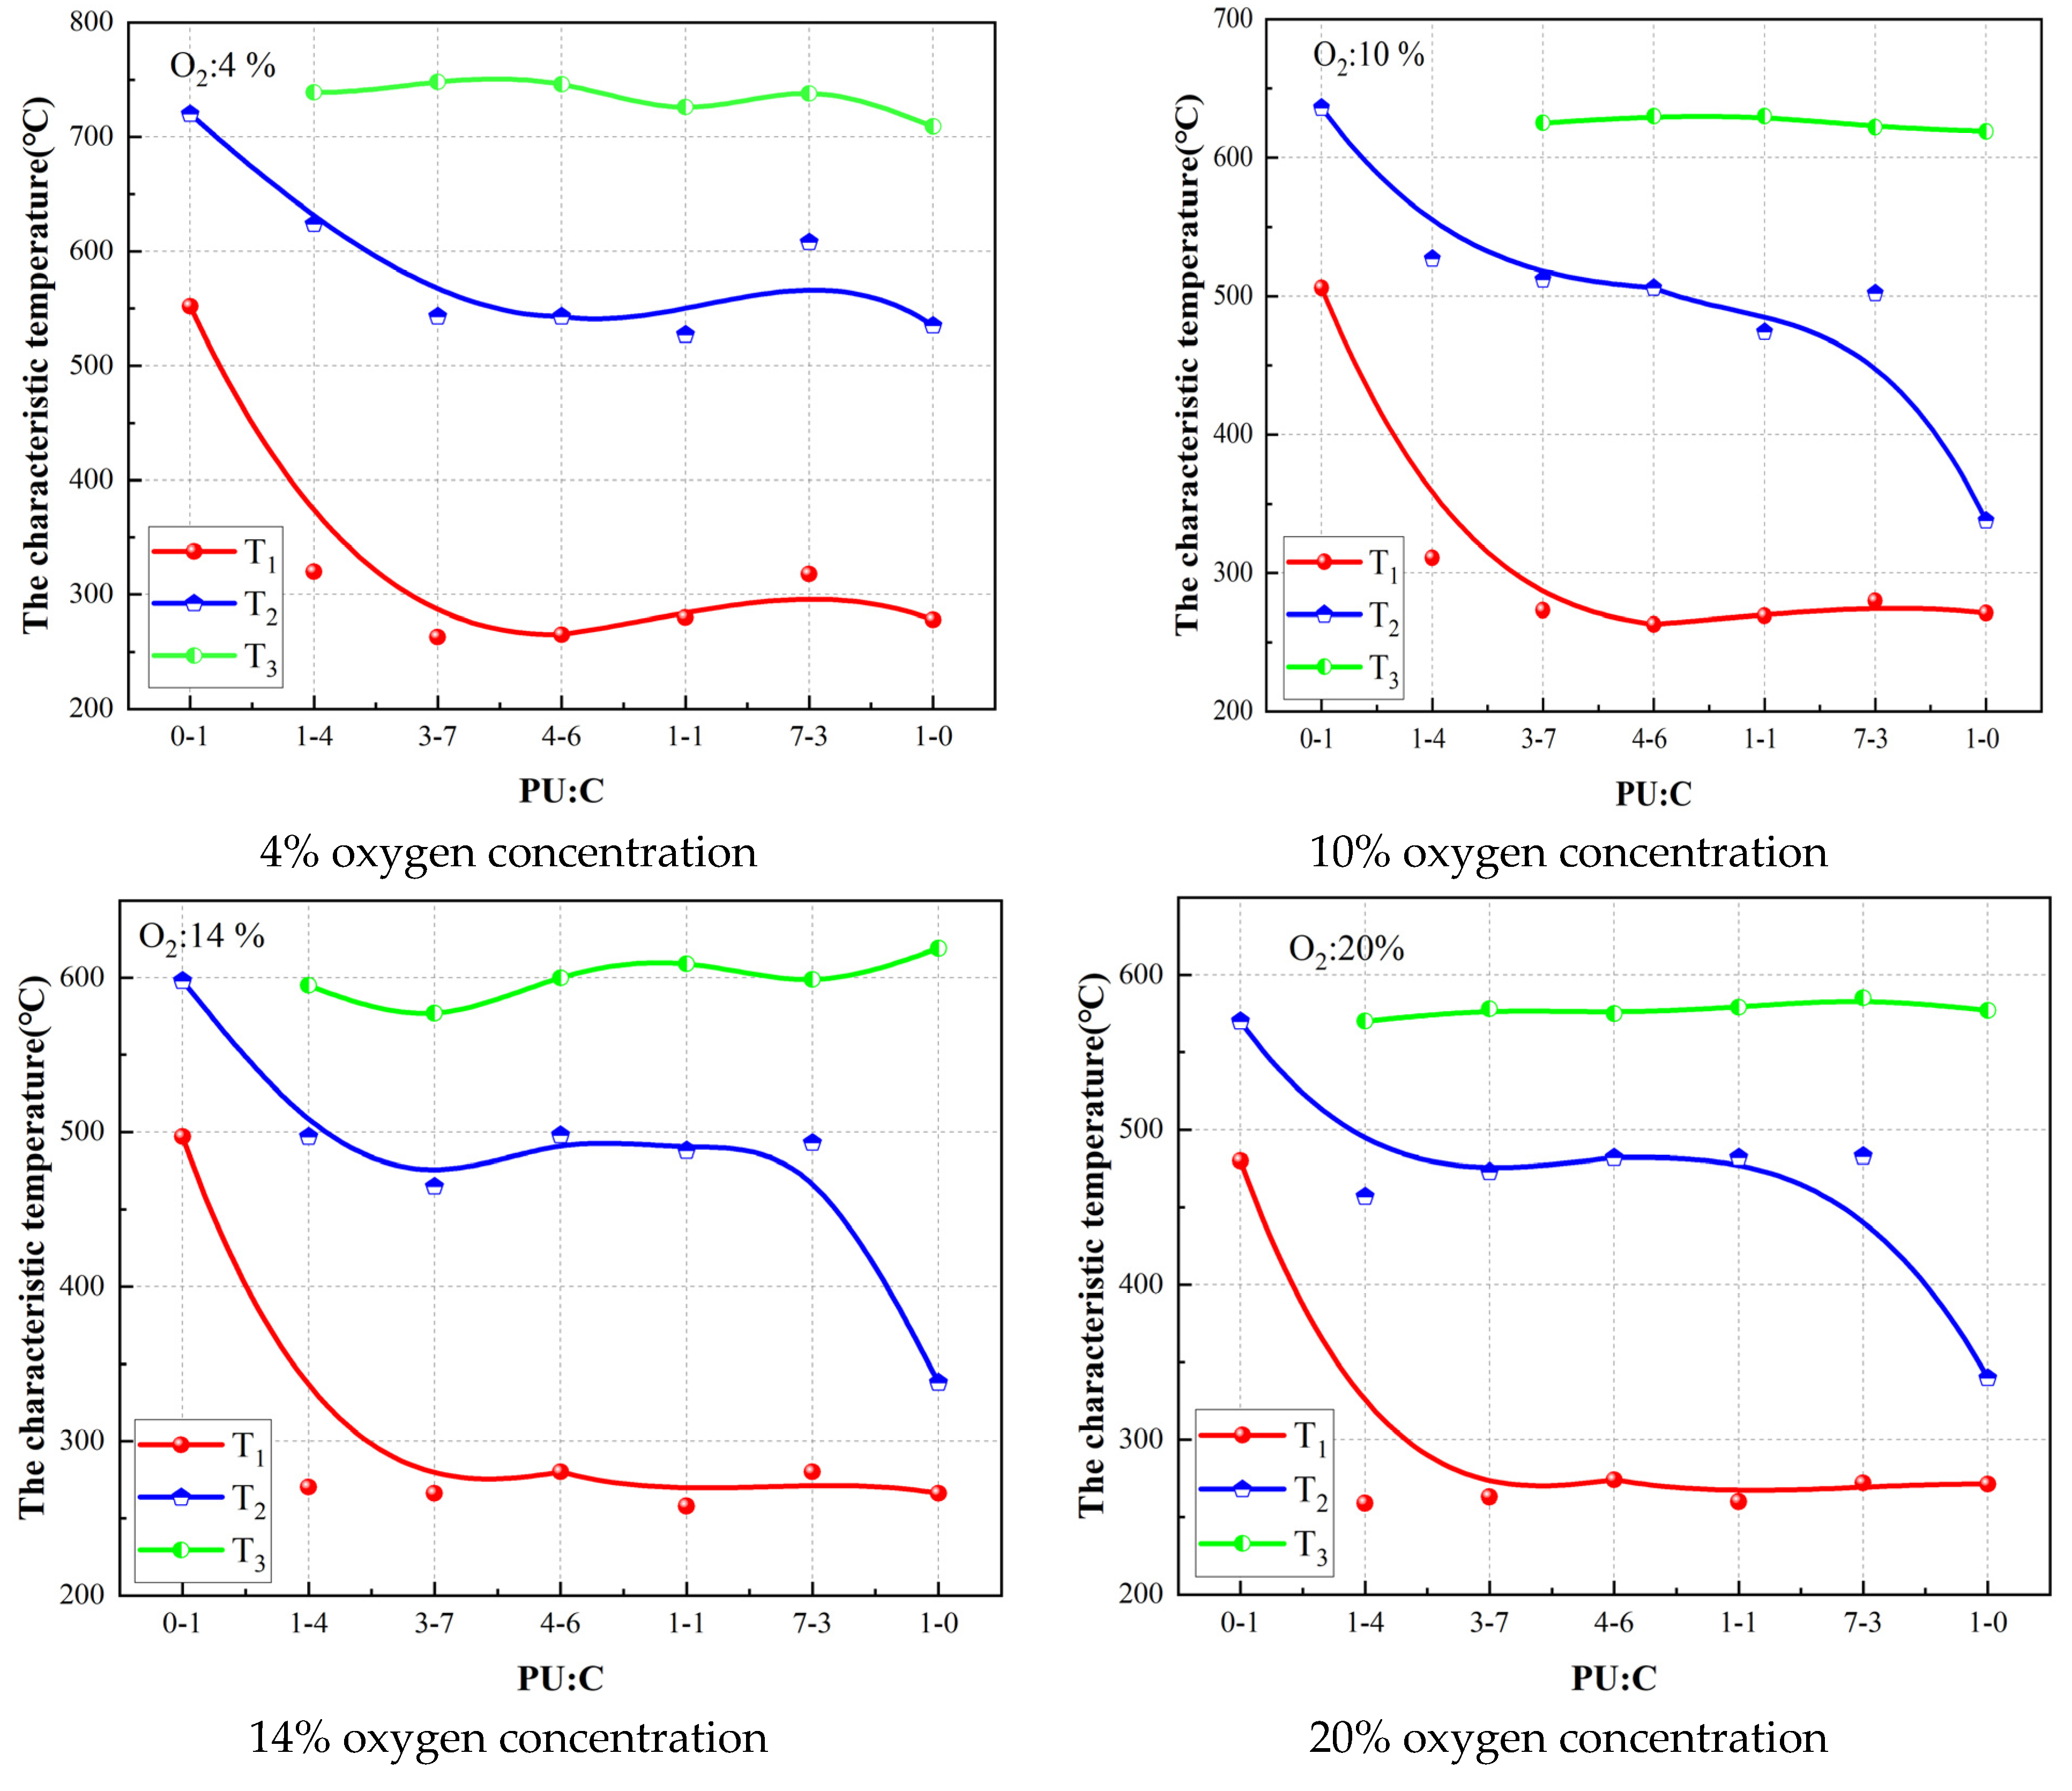
3.2. Effect of Oxygen Concentration on Mixed Combustion of Coal and Polyurethane

Seven samples of polyurethane mixed with coal at ratios of 0:1, 1:4, 3:7, 4:6, 1:1, 7:3, and 1:0 were subjected to experiments at oxygen concentrations of 20%, 14%, 10%, and 4% to produce TG and DTG curves.
According to Figure 3, the critical temperature of the coal increases as the oxygen concentration decreases, because the reduction in oxygen concentration reduces the opportunity for the coal sample to come into contact with oxygen. Additionally, the oxygen molecules exhibit irregular activity, and the contact between the oxygen molecules and coal is achieved via collision. The decrease in oxygen concentration reduces the opportunity for the reactivation groups exposed to the atmosphere to come into contact with the oxygen molecules that can undergo adsorption. This reduces the probability of a reaction occurring and thus causes the critical temperature point to rise. The oxygen concentrations chosen for this experiment were 20%, 14%, 10%, and 4%, respectively, based on the simulated oxygen concentration in the mining area and the actual conditions of the instrument. As the oxygen concentration increases, the characteristic temperature moves toward higher temperatures. As the amount of polyurethane increases, the weight gain phase of the TG curve gradually disappears, because the weight gain from the oxygen absorption of coal is less than the evaporation of small molecules and some small molecules during the heating of polyurethane. The presence of coal lowers the temperature in the pyrolysis phase of the polyurethane (i.e., the first weight loss peak). Under the conditions of 20%, 14%, 10%, and 4% oxygen concentrations, when the oxygen concentration is less than 10%, the shift of the thermogravimetric curve toward the high temperature is more considerable, demonstrating that the oxygen concentration has a greater influence on the thermogravimetric curve. At oxygen concentrations of more than 10%, the shift to the right of the thermogravimetric curve is greater, signifying that the oxygen concentration substantially affects the combustion of polyurethane with coal.
When the temperature reaches its maximum in the experiment (−800 °C), the combustion equilibrium phase cannot reach 4% oxygen concentration, because an oxygen concentration of 4% at 800 °C does not achieve the minimum oxygen concentration required for burnout. There is an oxygen concentration inflection point between 4% and 10%, which is the minimum oxygen concentration required to achieve the burnout condition. Overall, the oxygen concentration has almost no effect on the adsorption and pyrolysis phases of coal, polyurethane, and polyurethane–coal mixtures due to the low consumption of oxygen in these two phases. The amount of oxygen in the experiment can support the oxygen consumption of the physical and chemical reactions in the adsorption and pyrolysis phases. Under oxygen-poor conditions, the oxygen concentration has the most significant effect on the combustion phase, which requires a large amount of oxygen to participate in the chemical reactions. The lower oxygen concentration slows down the rate of the chemical reaction in the oxidation phase to some extent, which is the reason for the rightward shift of the TG curve.
According to Figure 4, when the ratio of PU:C is 0:1, the maximum value of DTG increases with the increased oxygen concentration, while the temperature corresponding to the DTG maximum continues to rise with the increasing oxygen concentration.
As the oxygen concentration increases, the contact between the coal molecules and oxygen rises. After reaching the ignition point, with the increased oxygen concentration, the coal burns more vigorously, the rate of weight loss increases, and the combustion becomes complete. Furthermore, the final residual mass decreases. The DTG curve of polyurethane shows three weight loss peaks during the weight loss of polyurethane. The oxygen concentration has a more negligible effect on the first weight loss peak and a larger effect on the second weight loss peak. The maximum value of the second weight loss peak DTG increases with a growing oxygen concentration. Furthermore, the oxygen concentration has the most significant effect on the third weight loss peak. The higher the oxygen concentration, the greater the shift of the third weight loss peak to the left. When PU:C was 1:4, 3:7, and 4:6, two weight loss peaks appeared in the DTG curve. Three weight loss peaks emerged when PU:C was 1:1 and 7:3. Moreover, when PU:C is greater than or equal to 1:1, three weight loss peaks appear in the DTG curve, because the influence of polyurethane on the overall combustion process expands as the ratio of polyurethane increases. Meanwhile, the free radicals in the polyurethane promote the oxidation reaction of coal, and the heat generated from the coal pyrolysis provides energy support for the pyrolysis reaction of polyurethane.

3.3. Kinetic Calculations

3.3.1. Kinetic Methods

As polyurethane foam is injected into the extraction area, the proportion and form of coal mixed with polyurethane vary at different locations within the extraction area. Both CSC and polyurethane combustion are highly complex processes, and research on their kinetics is constantly developing and advancing. The International Commission on Kinetics (ICTAC) [28,29] provides a reference method for calculating the activation energy.
The Arrhenius equation provides the basic formula for calculating the activation energy, and the critical reaction equation for the pyrolysis of coal and polyurethane is as follows [30]:
k = A exp ( E R T )
d a d t = k f ( α )
where A is the apparent prefinger factor, E is the apparent activation energy, R is the molar gas constant (generally taken as 8.314 J/(mol.K)), and α is the loss fraction (%). The change in temperature during the experiment can be expressed as T = T0 + βt, where T is the temperature at time t, K, T0 is the temperature at the initial time t0, K, and β is the rate of temperature increase, K/min. The apparent activation energy is an important parameter for studying the mechanism of chemical reactions. In this paper, the Malek method and the most probable mechanism functions are used to solve the kinetic parameters of coal, polyurethane, and their mixed samples in different proportions.
The Malek method [26,31] was used in the paper, which, according to the reaction rate equation and the Goats–Redfern method, is as follows:
d a d t = A exp ( E R T ) f ( a )
0 a d a f ( a ) = G ( a ) = A R T 2 E β exp ( E R T )
From Equations (3) and (4), we can deduce that:
y ( a ) = ( T T 0.5 ) 2 ( d a d t ) ( d a d t ) 0.5 = f ( a ) · G ( a ) f ( 0.5 ) · G ( 0.5 )
where α is the loss fraction, a = m 0 m m 0 m is the mass of the reactants at a given moment, m 0 is the mass of the reactants at the initial moment, and m is the mass of the reactants at the end of the reaction. Here, y(a) is the defined function, T0.5 and ( d a d t )0.5 are the temperature and reaction rate at a = 0.5, respectively. Additionally, y ( α ) = f ( a ) · G ( a ) f ( 0.5 ) · G ( 0.5 ) is determined using the mechanism function and is considered the standard curve. y ( α ) = ( T T 0.5 ) 2 ( d a d t ) ( d a d t ) 0.5 is calculated from the experimentally measured data and considered the experimental curve. Y(a)-α is calculated from the experimentally measured data and considered the experimental curve. The standard curve and the experimental curve are compared to find the most consistent curve, and the corresponding mechanism function is the most probable, and there are primarily nine mechanism functions chosen in this paper [30]
According to the Goats–Redfern integral equation,
ln [ G ( a ) T 2 ] = ln [ A R β E ( 1 2 R T E ) ] E R T
where G(a) is the corresponding differential form of the mechanism function, T is the thermodynamic temperature, A is the prefactor, E is the activation energy, β is the rate of warming, and R refers to the gas constant.
For a general reaction temperature region and most values of E, E R T > > 1 , ( 1 2 R T E ) 1
Equation (4) can be simplified as ln [ G ( a ) T 2 ] = ln ( A R β E ) E R T
x = 1 T , y = ln [ G ( a ) T 2 ] , a = E R , b = ln ( A R β E )
Subsequently, y = ax + b, according to the linear relationship between y and x; the apparent activation energy of each stage refers to the former factor.

3.3.2. Calculation of Activation Energy

Calculation of Activation Energy Using the Malek Method

At a temperature rise of 10 °C/min, its characteristic temperature (where T1 is the temperature at the highest mass percentage, T2 is the ignition temperature, and T3 is the combustion temperature) was identified according to the TG curve. The TG curve is divided into stages according to the characteristic temperature, and the activation energy is calculated using the Malek method. The results of the calculations are summarized in Table 3.
The activation energy of the coal changes with the oxygen concentration in stages. In the first stage, the activation energy decreases and increases as the oxygen concentration increases. In the second stage, the activation energy increases with the oxygen concentration, and the activation energy decreases with the oxygen concentration in the third stage. If the activation energy of PU:C is 1:4, the oxygen concentration varies, and the stages are divided differently. The activation energy rises and then falls with the increase of the oxygen concentration. When PU:C is greater than 3:7, the TG curve is divided into four stages. In the first two stages, the effect of oxygen concentration on the activation energy is small, and the activation energy changes less with the oxygen concentration. In the third stage, the activation energy increases with the oxygen concentration, and when PU:C is 3:7 and 4:6, the activation energy increases with the oxygen concentration and decreases with the increasing amount of polyurethane. The analysis of the activation energy obtained by the Malek method revealed that the activation energy in the first stage decreased and then increased with the increasing amount of polyurethane. With the increase in the oxygen concentration, the activation energy had a smaller gap in the first stage; in the second stage, the activation energy gradually increased with the rise in the oxygen concentration, while in the third stage, the activation energy increased with the increased oxygen concentration. The lower activation energy indicates a lower energy barrier for combustion reactions and that combustion reactions are more likely to occur. The oxygen concentration mainly affects the combustion phase.
The characteristic temperatures of different proportions of coal and polyurethane at various oxygen concentrations are summarized in Figure 5. At 4% oxygen concentration, the characteristic temperatures of T1 and T2 increase and decrease with the increasing proportion of polyurethane. Meanwhile, T1 and T2 reach their lowest value when PU:C is 3–7. The characteristic temperature of pure polyurethane is the lowest of all, because polyurethane is more combustible compared to coal. When PU:C is 3:7, both T1 and T2 are minimum values under these four oxygen concentration conditions. At 10% oxygen concentration, the oxygen concentration has the most significant effect on the characteristic temperature T2 of the polyurethane–coal mixture. At 20% oxygen concentration, T3 is approximately the same, because the oxygen concentration is high, oxygen is relatively sufficient, and the oxidation reaction is adequate [31].
When polyurethane is mixed with coal, there is an interaction between polyurethane and coal during the mixture combustion with the increasing amount of polyurethane. The free radicals for coal pyrolysis are provided during the decomposition of the polyurethane. Energy for the pyrolysis of polyurethane is supplied to the coal pyrolysis process, which facilitates the pyrolysis of polyurethane. Oxygen promotes the pyrolysis of coal and polyurethane to some extent, and higher oxygen concentrations can promote the pyrolysis of both polyurethane and coal.

3.4. Gas Product Analysis

The physical and chemical reactions that occur during the pyrolysis of coal and polyurethane mixtures are detected in real time, and the resulting gases are detected by infrared spectroscopy. TG-FTIR can be used to collect infrared spectral data of the gases released throughout the heating process in real time. The FTIR data generated during the pyrolysis of seven samples at 20% oxygen concentration and a temperature rise rate of 10 °C/min are shown in Figure 6.
During pyrolysis, coal produces absorption peaks at wave numbers of 750–650 cm−1, attributed to C–H bonds based on the FTIR spectrum [11,32,33,34]. The wave number of the absorption peaks belonging to alkynes is 1400–1300 cm−1. Furthermore, the absorption peaks at wave numbers of 2500–2000 cm−1 are attributed to the CO absorption spectrum. Absorption peaks at wave numbers of 2350–2250 cm−1 are ascribed to the CO2 absorption spectrum. The absorption peak at wave numbers of 3750–3500 cm−1 is accredited to the O–H stretching peak, indicating the presence of H2O. The absorption peak at wave numbers of 3750–3500 cm−1 is attributed to the O–H stretching peak, demonstrating that H2O is produced here. The leading gases produced during coal pyrolysis are H2, CO2, H2O, CH4, and SO2. H2O is one of the main products of the spontaneous combustion of coal. It is mainly derived from the evaporation of water from coal, the oxidation of reactivation groups, and the dehydration and condensation of oxygen-containing functional groups (mainly the decomposition of ROOH groups).
The pyrolysis process of polyurethane generates large amounts of gas. According to the infrared spectrograms during the pyrolysis of polyurethane, an absorption peak is generated at a wave number of 750-600 cm−1. The stretching vibration of C-CL is near this wave number. At wave numbers of 2100–2000 cm−1, the infrared spectral peaks of olefins are produced, and at 2400–2250 cm−1, the infrared spectral regions of CO and CO2 are dominant. The spectra here suggest that two peaks for CO2 and CO are produced during the pyrolysis of polyurethane, with these two absorption peaks corresponding to temperatures of 538 °C and 337 °C. These two temperatures are associated with the pyrolysis and combustion phases of the polyurethane, with the gas phase products H2O and CO2 in the entire pyrolysis process. The temperature at which the maximum position of the absorption peak occurs is 538 °C. The main gaseous products from the pyrolysis of polyurethane and coal in different proportions are CO2, CO, CH4, and H2O. The absorption peaks for CO2 are at wave numbers of 669 and 2358 cm−1 when PU:C is 3:7. A wide temperature range of CO2 can be found in the FTIR spectrogram. Moreover, strong absorption peaks appear at 538 °C and 547 °C. The presence of H2O is evidenced by an absorption peak at a wave number of 3630 cm−1. When PU:C is 4:6, wave numbers of 669 cm−1 correspond to temperatures of 332 °C and 534 °C, suggesting that more CO2 gas is produced here. A strong absorption peak of CO2 occurs at a wave number of 2358 cm−1. An absorption peak at 3649 cm−1 indicates that water vapor is produced during pyrolysis. The variety of gaseous products increases with the growing amount of polyurethane. When PU:C is 1:1, wave numbers of 669 cm−1 relate to temperatures of 332 °C and 547 °C, representing that CO gas is produced here. The absorption peak at a wave number of 1180 cm−1 is attributed to CH4. The presence of H2O was evidenced by an absorption peak at a wave number of 1647 cm−1 at 364 °C. At PU:C of 7:3, the influence of polyurethane on the overall combustion gradually increases so that a greater variety of gaseous products are produced. The main gases produced are CO2 with absorption peaks at wave numbers of 669 and 2358 cm−1 and CH4 with absorption peaks from 1100 to 1400 cm−1. The FTIR shows that the gas product CH4 is produced at 254 °C, 332 °C, and 350 °C. The presence of H2O is evidenced by an absorption peak at a wave number of 1429 cm−1.
Based on the infrared spectrum, CO2 is the main gas product, and the infrared comparison of the other gases is not apparent due to its spectral influence. When PU:C is 4:6, CH4 is produced at 222 °C. A wide range of gases is produced at 332 °C, mainly, CO2, H2O, and CO. During the pyrolysis of the coal, the absorption peaks of CO were not significant, demonstrating that at 20% oxygen concentration, which is relatively sufficient for the pyrolysis of coal, the amount of CO gas produced is low, and no absorption peaks for CO were found in FTIR. Polyurethanes produce a wide range of gases at 20% oxygen concentration. Coal combustion differs from the polyurethane–coal mixture, mainly in the type of gas products and the temperature of the gas produced. According to Figure 6, the moisture generated at the initial stage is not easily detected due to the low evaporation of moisture and the instrument’s sensitivity. Therefore, no absorption peak is formed. The pyrolysis of polyurethane begins at a lower temperature, and the starting temperature at which gaseous products appear is also lower.

4. Conclusions

In this paper, the combustion kinetics of the polyurethane–coal mixture were investigated, and the following conclusions are obtained from TG-FTIR coupling experiments:
(1) Coal is divided into three stages when considering an oxygen concentration of 20% and a temperature rise rate of 10 k/min. The first stage is water evaporation and oxygen uptake in the weight gain stage, the second stage is mainly the pyrolysis stage, and the third stage is the combustion stage. Polyurethane is divided into four stages. The first stage is mainly the evaporation of water molecules and some small molecule products, the second stage is the pyrolysis stage, the third stage is the carbonization stage, and the fourth stage is the combustion stage.
(2) The critical temperature of coal increases with a decreasing oxygen concentration. When the oxygen concentration exceeds 10%, the shift of the thermogravimetric curve to the right is smaller, indicating that the oxygen concentration has less influence on the combustion of polyurethane mixed with coal. When the oxygen concentration is less than 10%, the shift of the thermogravimetric curve toward the high temperature is more prominent, signifying that the oxygen concentration has a more significant influence on the TG curve. At the same time, the maximum value of DTG increases with the oxygen concentration.
(3) As the amount of polyurethane increases, the characteristic temperature rises and then decreases as the proportion of polyurethane rises. The characteristic temperature is lowest when PU:C is 4:6.
(4) Based on infrared spectroscopy, the main gas products of coal pyrolysis are CO2, CH4, and H2O. The gases produced by polyurethane during pyrolysis are primarily CO2, CO, CH4, and H2O. The main difference between the gas products of polyurethane and coal pyrolysis in different proportions is the amount of CO2. Additionally, the presence of coal promotes the pyrolysis of polyurethane. In the actual monitoring, small amounts of H2O, CO2, and CO gases appearing in the starting phase, then a large increase in the amount of gases, can be considered that polyurethane is involved in the relevant combustion reactions, which can avoid misjudgment of the spontaneous combustion of coal in the mining area.
The paper investigates the effect of polyurethane on the spontaneous combustion of coal, but the paper does not consider whether the selection of coal samples will have an effect on the results. The selection of different types of coal samples to investigate the effect of polyurethane on different coal types in the mined area could be considered in subsequent work. Also in the follow-up study, it could be considered to quantify the release of combustion gases from the mixture of polyurethane and coal under different oxygen concentration conditions.

Author Contributions

H.W. designed the research and reviewed the manuscript; X.C. wrote the original draft and analyzed the results; Z.W. and L.X. contributed to the editing of the graphs in the paper. All authors have read and agreed to the published version of the manuscript.

Funding

This work was supported by the National Natural Science Foundation of China (No. 51874313).

Data Availability Statement

Not applicable.

Conflicts of Interest

The authors declare no conflict of interest.

References

  1. Xu, M.; He, X.; Li, J.; Lv, D.; Huang, H.; Cao, X. Research on Application of Polyurethane Grouting Materials for Mining. Mater. Rep. 2014, 28, 96–100. [Google Scholar]
  2. Hou, K.; Wang, S.; Yao, S.; Niu, X.H.; Li, Z.; Wu, C.Q.; Feng, G.R. Research progress of modification for polyurethane grouting materials in coal mine. Coal Sci. Technol. 2022. Available online: http://kns.cnki.net/kcms/detail/11.2402.TD.20220816.1427.002.html (accessed on 29 September 2022).
  3. Xu, Y. Causes and Control of Disaster by the Heat from Polyurethane Materials Used in Mine; Graduate School of China, Coal Research Institute: Beijing, China, 2019. [Google Scholar]
  4. Xu, Y.; Du, Y.F.; Du, B. Experiment to Research the Mechanism of Underground Fire due to Polyurethane for Mine. Min. Saf. Environ. Prot. 2019, 46, 29–33. [Google Scholar]
  5. Onifade, M.; Genc, B.; Bada, S. Spontaneous combustion liability between coal seams: A thermogravimetric study. Int. J. Min. Sci. Technol. 2020, 30, 691–698. [Google Scholar] [CrossRef]
  6. Wen, H.; Guo, J.; Jin, Y.F.; Wang, K.; Zhang, Y.T.; Zheng, X.Z. Experimental study on the influence of different oxygen concentrations on coal spontaneous combustion characteristic parameters. Int. J. Oil Gas Coal Technol. 2017, 16, 187–202. [Google Scholar] [CrossRef]
  7. Zhang, D.; Cen, X.; Wang, W.; Deng, J.; Wen, H.; Xiao, Y.; Shu, C.-M. The graded warning method of coal spontaneous combustion in Tangjiahui Mine. Fuel 2021, 288, 119635. [Google Scholar] [CrossRef]
  8. Yutao, Z.; Yuanbo, Z.; Yaqing, L.; Xueqiang, S.; Yujie, Z. Heat effects and kinetics of coal spontaneous combustion at various oxygen contents. Energy 2021, 234, 121299. [Google Scholar] [CrossRef]
  9. Wang, H.; Li, J.; Chen, X.; Fan, C.; Wang, P.; Hu, L. Thermodynamic Characteristics of Oxidation and Combustion of Coal under Lean-Oxygen Conditions. ACS Omega 2021, 6, 17255–17266. [Google Scholar] [CrossRef] [PubMed]
  10. Deng, J.; Xu, J.C.; Chen, X.K. Perspectives on spontaneous combustion mechanism and prediction theory of coal. J. Liaoning Tech. Univ. 2003, 22, 455–459. [Google Scholar]
  11. Yang, Y.; Deng, J.; Zhang, H.N.; Wang, W.F. Oxidation characteristics of coal by STA-FTIR experiment. J. China Coal Soc. 2018, 43, 1031–1041. [Google Scholar]
  12. Jia, X.; Wu, J.; Lian, C.; Rao, J. Assessment of coal spontaneous combustion index gas under different oxygen concentration environment: An experimental study. Environ. Sci. Pollut. Res. Int. 2022. [Google Scholar] [CrossRef]
  13. Qi, X.; Li, Q.; Zhang, H.; Xin, H. Thermodynamic characteristics of coal reaction under low oxygen concentration conditions. J. Energy Inst. 2017, 90, 544–555. [Google Scholar] [CrossRef]
  14. Jiang, Z.; Yuan, K.J.; Li, S.F.; Chow, W.K. Study of FTIR Spectra and Thermal Analysis of Polyurethane. Spectrosc. Spectr. Anal. 2006, 2006, 624–628. [Google Scholar]
  15. Yuan, K.J.; Jiang, Y.; Li, Y.F.; Chou, Y.J. The Thermal Degradation of Polyurethane. Polym. Mater. Sci. Eng. 2005, 2005, 24–28. [Google Scholar]
  16. Lei, Y.; Liang, D. Polyurethane Flexible Foam Materials and Yinran Properties; Sun Yat-Sen University Press: Guang Zhou, China, 2013. [Google Scholar]
  17. Singh, H.; Jain, A.K. Ignition, combustion, toxicity, and fire retardancy of polyurethane foams: A comprehensive review. J. Appl. Polym. Sci. 2009, 111, 1115–1143. [Google Scholar] [CrossRef]
  18. Guo, P.; Tang, Y.; Wang, H.; Hu, S.; Zhou, J. Study on kinetics features of coal spontaneous combustion influenced by polyurethane. China Saf. Sci. J. 2020, 30, 68–73. [Google Scholar]
  19. Wang, H.; Tian, Y.; Chen, X.; Li, J. Kinetic and Synergetic Effect Analysis of the Co-Combustion of Coal Blended with Polyurethane Materials. ACS Omega 2020, 5, 26005–26014. [Google Scholar] [CrossRef]
  20. Wang, H.; Tian, Y.; Li, J.; Chen, X. Experimental study on thermal effect and gas release laws of coal-polyurethane cooperative spontaneous combustion. Sci. Rep. 2021, 11, 1994. [Google Scholar] [CrossRef]
  21. Miao, G.; Li, Z.; Meng, Q.; Li, J.; Yang, Y. Experimental research on the emission of higher molecular weight gases during coal oxidation. Fuel 2021, 300, 120906. [Google Scholar] [CrossRef]
  22. Liu, Z.L. Research on reaction temperature and gas release of large samples of polyurethane based reinforcement materials. China Energy Environ. Prot. 2021, 43, 156–160. [Google Scholar]
  23. Qi, Y.; Wang, W.; Qi, Q.; Ning, Z.; Yao, Y. Distribution of spontaneous combustion three zones and optimization of nitrogen injection location in the goaf of a fully mechanized top coal caving face. PLoS ONE 2021, 16, e0256911. [Google Scholar] [CrossRef]
  24. Liang, Y.T.; Luo, H.Z.; Zhou, X.Q. Coal Mine Fire Prevention Rules; Emergency Management Press: Beijing, China, 2021. [Google Scholar]
  25. Li, L. A Quantum Chemical Study on Dissociation Behaviour of Typical Bonds and Molecular Structural of Coal; Dalian University of Technology: Dalian, China, 2016. [Google Scholar]
  26. Yang, Y. Mechanism and Performance of Inhibitor Based on Oxidation Characteristic of the Spontaneous Combustion of Coal; Xi’an University of Science and Technology: Xi’an, China, 2015. [Google Scholar]
  27. Jiang, L. Pyrolysis Kinetics and Flame Spread Characteristics Studies of Typical Polymeric; University of Science and Technology of China: Hefei, China, 2017. [Google Scholar]
  28. Vyazovkin, S.; Burnham, A.K.; Criado, J.M.; Pérez-Maqueda, L.A.; Popescu, C.; Sbirrazzuoli, N. ICTAC Kinetics Committee recommendations for performing kinetic computations on thermal analysis data. Thermochim. Acta 2011, 520, 1–19. [Google Scholar] [CrossRef]
  29. Vyazovkin, S.; Chrissafis, K.; Di Lorenzo, M.L.; Koga, N.; Pijolat, M.; Roduit, B.; Sbirrazzuoli, N.; Suñol, J.J. ICTAC Kinetics Committee recommendations for collecting experimental thermal analysis data for kinetic computations. Thermochim. Acta 2014, 590, 1–23. [Google Scholar] [CrossRef]
  30. Hu, R.Z.; Gao, S.L.; Zhao, F.Q.; Shi, Q.Z.; Zhang, T.L.; Zhang, J.J. Thermal Analysis Kinetics; Science Press: Beijing, China, 2008. [Google Scholar]
  31. Zhang, Y.N. Application of the Thermogravimetric Analysis in the Research of the Oxidation of Coal; Xi’an University of Science and Technology: Xi’an, China, 2004. [Google Scholar]
  32. Scaccia, S. TG–FTIR and kinetics of devolatilization of Sulcis coal. J. Anal. Appl. Pyrolysis 2013, 104, 95–102. [Google Scholar] [CrossRef]
  33. Chen, X.R. Research on Quantitative Analysis of Coal Pyrolysis Products Using TG-FTIR-MS Technique; Zhejiang University: Hangzhou, China, 2016. [Google Scholar]
  34. Chen, L.H.; Chen, X.; Wu, Y.Y.; Zhou, H.; Cen, K.F.J. Quantitative analysis of gaseous products evolved by coal combustion using TG-FTIR-MS. J. Zhejiang Univ. Eng. Sci. 2016, 50, 961–969. [Google Scholar]
Figure 1. Experimental system.
Fire 05 00181 g001
Figure 2. Phasing of coal and polyurethane.
Fire 05 00181 g002
Figure 3. TG curves for different ratios of polyurethane and coal.
Fire 05 00181 g003
Figure 4. DTG curves of different ratios of polyurethane and coal.
Fire 05 00181 g004
Figure 5. Characteristic temperatures at different ratios of polyurethane to coal and various oxygen concentrations.
Fire 05 00181 g005
Figure 6. Three-dimensional diagram of polyurethane–coal mixture pyrolysis gas products at different scales.
Fire 05 00181 g006
Table 1. Proximate and elemental analyses results of coal and polyurethane samples.
No.Sample Proximate AnalysisElemental Analysis
Mad (%)Vad (%)Aad (%)FCad (%)N (%)C (%)H (%)S (%)O (%)
1Coal0.5716.274.3878.771.3787.705.681.353.902
2Polyurethane3.6688.721.336.296.3260.506.030.0027.15
Table 2. Experimental conditions.
No.SamplePU:CProportion of PolyurethaneHeating Rate (℃/min)Oxygen Concentration
1C0:10%5, 10, 154%, 10%, 14%, 20%
2PU:C1:420%5, 10, 154%, 10%, 14%, 20%
3PU:C3:730%5, 10, 154%, 10%, 14%, 20%
4PU:C4:640%5. 10, 154%, 10%, 14%, 20%
5PU:C1:150%5, 10, 154%, 10%, 14%, 20%
6PU:C7:370%5, 10, 154%, 10%, 14%, 20%
7PU1:0100%5, 10, 154%, 10%, 14%, 20%
Table 3. Summary of calculated activation energy and characteristics.
PU:CActivation Energy (KJ/mol)
Oxygen Concentration
4%10%14%20%
0:1E1 = 27.676
E2 = 246.634
E3 = 657.732
E1 = 24.214
E2 = 298.722
E3 = 445.098
E1 = 20.045
E2 = 371.644
E3 = 283.214
E1 = 36.341
E2 = 403.212
E3 = 229.108
1:4E1 = 15.839
E2 = 17.388
E3 = 193.125
E1 = 31.318
E2 = 10.937
E3 = 260.263
E1 = 47.202
E2 = 82.261
E3 = 361.759
E4 = 316.655
E1 = 52.959
E2 = 92.800
E3 = 334.988
E4 = 245.138
3:7E1 = 40.917
E2 = 68.948
E3 = 103.804
E4 = 264.760
E1 = 44.364
E2 = 312.582
E3 = 336.077
E4 = 432.114
E1 = 42.196
E2 = 104.898
E3 = 311.102
E4 = 329.891
E1 = 47.289
E2 = 204.624
E3 = 362.956
E4 = 263.870
4:6E1 = 46.742
E2 = 70.672
E3 = 243.564
E4 = 503.642
E1 = 47.148
E2 = 83.439
E3 = 312.806
E4 = 458.459
E1 = 32.598
E2 = 61.189
E3 = 373.473
E4 = 321.453
E1 = 39.581
E2 = 80.003
E3 = 383.042
E4 = 240.050
1:1E1 = 21.161
E2 = 63.125
E3 = 214.776
E4 = 530.458
E1 = 43.541
E2 = 87.305
E3 = 272.981
E4 = 343.260
E1 = 43.560
E2 = 89.209
E3 = 149.419
E4 = 34.355
E1 = 27.007
E2 = 30.990
E3 = 143.533
E4 = 21.330
7:3E1 = 66.463
E2 = 44.873
E3 = 299.062
E4 = 907.59
E1 = 12.643
E2 = 69.017
E3 = 318.451
E4 = 406.875
E1 = 44.440
E2 = 66.862
E3 = 352.197
E4 = 296.294
E1 = 42.736
E2 = 68.360
E3 = 350.16
E4 = 253.959
1:0E1 = 52.722
E2 = 75.071
E3 = 243.110
E4 = 407.590
E1 = 44.388
E2 = 314.635
E3 = 63.083
E4 = 266.879
E1 = 32.972
E2 = 71.750
E3 = 57.120
E4 = 258.823
E1 = 40.869
E2 = 335.636
E3 = 105.080
E4 = 192.011
Publisher’s Note: MDPI stays neutral with regard to jurisdictional claims in published maps and institutional affiliations.

