Article

Evacuation Path Planning Based on the Hybrid Improved Sparrow Search Optimization Algorithm

1
The School of Building Environment Engineering, Zhengzhou University of Light Industry, Zhengzhou 450001, China
2
Zhengzhou Key Laboratory of Electric Power Fire Safety, Zhengzhou 450001, China
*
Author to whom correspondence should be addressed.
Fire 2023, 6(10), 380; https://doi.org/10.3390/fire6100380
Submission received: 13 September 2023 / Revised: 1 October 2023 / Accepted: 4 October 2023 / Published: 6 October 2023
(This article belongs to the Special Issue Advances in Industrial Fire and Urban Fire Research)

Abstract

:
In the face of fire in buildings, people need to quickly plan their escape routes. Intelligent optimization algorithms can achieve this goal, including the sparrow search algorithm (SSA). Despite the powerful search ability of the SSA, there are still some areas that need improvements. Aiming at the problem that the sparrow search algorithm reduces population diversity and is easy to fall into local optimum when solving the optimal solution of the objective function, a hybrid improved sparrow search algorithm is proposed. First, logistic-tent mapping is used to initialize the population and enhance diversity in the population. Also, an adaptive period factor is introduced into the producer’s update position equation. Then, the Lévy flight is introduced to the position of the participant to improve the optimization ability of the algorithm. Finally, the adaptive disturbance strategy is adopted for excellent individuals to strengthen the ability of the algorithm to jump out of the local optimum in the later stage. In order to prove the improvement of the optimization ability of the improved algorithm, the improved sparrow algorithm is applied to five kinds of maps for evacuation path planning and compared with the simulation results of other intelligent algorithms. The ultimate simulation results show that the optimization algorithm proposed in this paper has better performance in path length, path smoothness, and algorithm convergence, showing better optimization performance.

1. Introduction

With the rapid development of China’s economy, there are more and more modern multifunctional buildings, such as super high-rise buildings, large commercial complexes, and underground shopping centers. If there is a fire in such buildings, the quick escape of pedestrians is important work for the safety management department [1]. Therefore, the importance of proper evacuation path planning during fire emergencies cannot be overstated [2]. It could save lives by providing clear directions, minimizing confusion, and increasing overall preparedness. Having a well-organized and communicated plan in place empowers individuals to react effectively, enhancing their safety and improving the chances of a successful evacuation.
Smart optimization algorithms have been widely applied in the field of pedestrian evacuation path planning, enhancing the efficiency and safety of emergency evacuations [3,4,5]. These algorithms use advanced techniques to analyze complex data and deliver optimized evacuation plans based on various factors, such as building layout, exit locations [6], occupancy, and potential fire hazards. The smart optimization algorithms could be classified into several categories based on their approach and methodology. The first category consists of graph-based algorithms, which include Dijkstra’s algorithm [7] or the A* search algorithm [8]. The second category involves swarm intelligence algorithms, such as ant colony optimization [9] and particle swarm optimization [10]. The third category encompasses machine learning-based algorithms, including neural networks [11], support vector machines [12], or reinforcement learning techniques [13]. However, each type of intelligent algorithm has its own disadvantages. The drawback of graph-based algorithms is their susceptibility to computational complexity and scalability issues when dealing with large and complex datasets. The limitations of machine learning-based algorithms include their dependence on large amounts of high-quality data, so potential biases in data can lead to biased outcomes and difficulty in interpreting and explaining the decision-making process. On the other hand, swarm intelligence algorithms have the advantage of collective intelligence, adaptability, and robustness in solving complex problems by simulating the behaviors of social insect colonies. Therefore, swarm intelligence algorithms have been rapidly developed and widely used in evacuation path planning.
In 2020, Xun et al. [14] proposed the sparrow optimization algorithm (SSA), inspired by the foraging and anti-predatory behavior of sparrows in nature. The SSA is characterized by its global search capability, efficient exploration of the search space, and ability to find near-optimal solutions. It has been successfully utilized in numerous domains, such as power load forecasting [15], image processing [16], robot path tracking [17], performance optimization of wireless sensor networks (WSNs) [18], wireless location of WSNs [19], and fault diagnosis [20]. Because the basic sparrow search algorithm has low convergence accuracy in solving multi-drone collaborative trajectory planning problems and is prone to falling into local optima, the scholars will more or less improve the sparrow algorithm when they apply it. Zhang et al. [21] proposed a sparrow algorithm using logarithmic spiral strategy and adaptive ladder strategy, which can plan coordinated flight trajectories with approximately optimal cost and constraint conditions while satisfying time coordination conditions. Jiang et al. [22] transformed the route planning problem into a multidimensional function optimization problem by establishing a three-dimensional task space model and a cost function for unmanned aerial vehicle route planning, simultaneously introducing chaos strategy and adopting the convergence speed and exploration ability of the adaptive inertia weight balancing algorithm. A trajectory planning method based on the chaotic sparrow search algorithm was proposed by others [23] to solve the problems of high computational complexity and difficult convergence in drone trajectory planning.
Due to the wide use of the sparrow search algorithm in trajectory planning for unmanned aerial vehicles (UAVs), we aim to implement this algorithm in planning evacuation paths for people. In this manuscript, the improved sparrow search algorithm was applied to solve pedestrian evacuation path planning. The improvements include the integration of logistic-tent chaotic mapping, nonlinear factors, the Lévy flight strategy, and the adaptive perturbation strategy. Consequently, a hybrid optimized sparrow search algorithm is proposed. These enhancements further contribute to the algorithm’s capability to handle real-world complexities and optimize evacuation plans in dynamic environments.

2. Introduction of the Basic Sparrow Algorithm

The main idea of the SSA algorithm is to conduct local and global searches by imitating sparrows’ foraging and anti-predation behavior, and the sparrow foraging process is the algorithm optimization process. The SSA consists of three types of sparrows: producers, scroungers, and scouts. The producers usually have high fitness values and are responsible for providing foraging areas and directions for the scroungers. In order to obtain better food, the scroungers will always follow the producers, while constantly monitoring the producers and competing for food to ensure their predation rate. When scouts discover predators, they will immediately send an alarm signal, and the overall sparrow will engage in anti-predation behavior. During each iteration, the places of the producers are updated according to Equation (1).
X i , j t + 1 = X i , j · exp ( i α · i t e r max ) R 2 > ST X i , j + Q · L R 2 < ST
where t indicates the current iteration number. X i , j represents the position information of the i-th sparrow in the j-th dimension of the population. α is the random number in [0, 1]. iter max is a constant with the maximum iterations. Q is a random number subject to normal distribution. L shows a matrix of 1 * d for which each element is 1. R 2 belongs to [0, 1], representing the early warning value of the sparrow population position. ST belongs to [0.5, 1], representing the safety value of the sparrow population position. When R 2 < ST, it indicates that the warning value is less than the safety value, and there are no predators in the foraging environment. The producers could perform extensive search operations. When R 2   > ST, it means that some sparrows in the population have discovered predators and issued warnings to other sparrows in the population. In the case, all sparrows need to fly to a safe area for foraging.
During the foraging process, some scroungers will constantly monitor the producers. When the producers find better food, the scroungers will compete with them. If the competition is successful, they will immediately obtain the producers’ food. Otherwise, the scroungers will continue to update their position according to Equation (2).
X i , j t + 1 = Q · exp ( X worst X i , j t i 2 ) i > n / 2 X p t + 1 + X i , j X i , j t · A + · L o t h e r w i s e
In Equation (2), X p represents the optimal location discovered by the current producer. X worst indicates the current global worst case position. A is a 1 × d matrix whose elements are randomly assigned 1 or −1. L is still a 1 * d matrix for which all elements are 1. When i > n/2, this indicates that the i-th joiner has not received food and is in a state of hunger. At this point, they need to fly to other places for foraging to obtain more energy.
In the sparrow population, the number of sparrows aware of danger, i.e., the scouts, accounts for 10% to 20% of the total. The positions of these sparrows are randomly generated and continuously updated according to Equation (3).
X i , j t + 1 = X b e s t t + β X i , j t X b e s t t f i > f g X i , j t + K · X i , j t X w o r s t t ( f i f w ) + ε f i = f g
In Equation (3), X best represents the current global optimal position. K, used as the step control parameter, is a random number subject to standard normal distribution. β is a random number belonging to [−1, 1]. f i is the fitness value of the current sparrow individual. f g represents the global best fitness value. f w shows the global worst-case fitness value. ε is a constant that avoids having a denominator of 0. When f i > f g , it indicates that the sparrows are at the edge of the population and highly vulnerable to predators. When f i = f g , it represents that the sparrows in the middle of the population are also at risk, and they need to approach other sparrows to reduce the risk of predation.

3. The Proposed Sparrow Optimization Algorithm

The basic sparrow algorithm adopts a random strategy during population initialization, which results in low initial population quality. Thus, logistic-tent chaotic mapping was used in the proposed algorithm to initialize the population and enhance population diversity. On the other hand, in order to prevent the proposed algorithm from falling into the local optima, there are two methods to enhance the search range to overcome such a situation. One was that an adaptive convergence factor was introduced at the producer update location, and the other is that the Lévy flight mechanism was also introduced in the update equation of the scroungers. Finally, adaptive perturbation was used in the proposed algorithm to enhance the local search ability of the later algorithm and maintain the diversity of solutions.

3.1. Optimization of Initial Sparrow Population Diversity—Logistic-Tent Chaos Mapping

The initial population of the sparrow algorithm is randomly generated, resulting in uneven distribution of the sparrow population and susceptibility to falling into local optima. Chaotic mapping has the characteristics of randomness, convenience, and regularity, and could be used in population initialization. The distributions of commonly used mapping algorithms, such as tent mapping [24] and logistic mapping [25], are shown in Figure 1.
Comparing the types of mappings in Figure 1, it can be found that the distribution of tent mapping is more uniform, while logistics mapping is more distributed at the boundary position and evenly distributed in the middle position. It seems that tent mapping is more suitable for population initialization than logistics mapping. However, Shan et al. [26], found that although the distribution of tent mapping was uniform, there were small and unstable periods in tent mapping. Thus, both tent mapping and logistic mapping need to improve. From Figure 1c, it can be seen that the distribution of logistic-tent chaotic mapping is very uniform between [0, 1], and the mapping effect is very good, which could be used to initialize the sparrow population and increase population diversity.

3.2. Optimization of the Producers’ Location—The Adaptive Convergence Factor

In Equation (1) of the producers’ location update, the parameter α is a random value between [0, 1], which has greater randomness, likely affecting the rate of convergence and accuracy of the algorithm. When the current value of α is larger, the producers’ search scope is relatively wider. However, with a decrease in α, the producers perform local searches to improve algorithm accuracy. Therefore, a periodic nonlinear adaptive α is proposed, and the update method of α is shown in Equation (4).
a = sin ( π 2 ( 1 i T ) ) 3
In Equation (4), i is the number of iterations, and T is the maximum number of iterations. The value range of α is still [0, 1], while the improved α would decrease periodically and monotonously as the number of iterations increases, which greatly improves the rate of convergence and accuracy of the algorithm.

3.3. Optimization of the Scroungers’ Location—The Lévy Flight Mechanism

According to Equation (2), it is not difficult to find that the scroungers will be more inclined towards the better food locations during the search process, leading to a reduction in the diversity and search range of the population. Therefore, the Lévy flight mechanism was introduced in the location update of the scroungers. The Lévy flight mechanism is able to generate random step sizes, and introducing step sizes s to the update of the scroungers’ positions could effectively enhance the diversity of the population and avoid falling into the local optima. The random step size s is generated as shown in Equation (5) [27]. Here μ and ν are random numbers subject to the normal distribution.
s = μ ν 1 / β , β = 3 / 2
The equation for updating the position of the scroungers after improving the random step size is shown in Equation (6).
X i , j t + 1 = Q · exp ( X worst X i , j t i 2 ) i > n / 2 X p t + 1 + s · X i , j X i , j t · A + · L   o t h e r w i s e

3.4. Jumping out of the Local Optima—The Mutation Factor

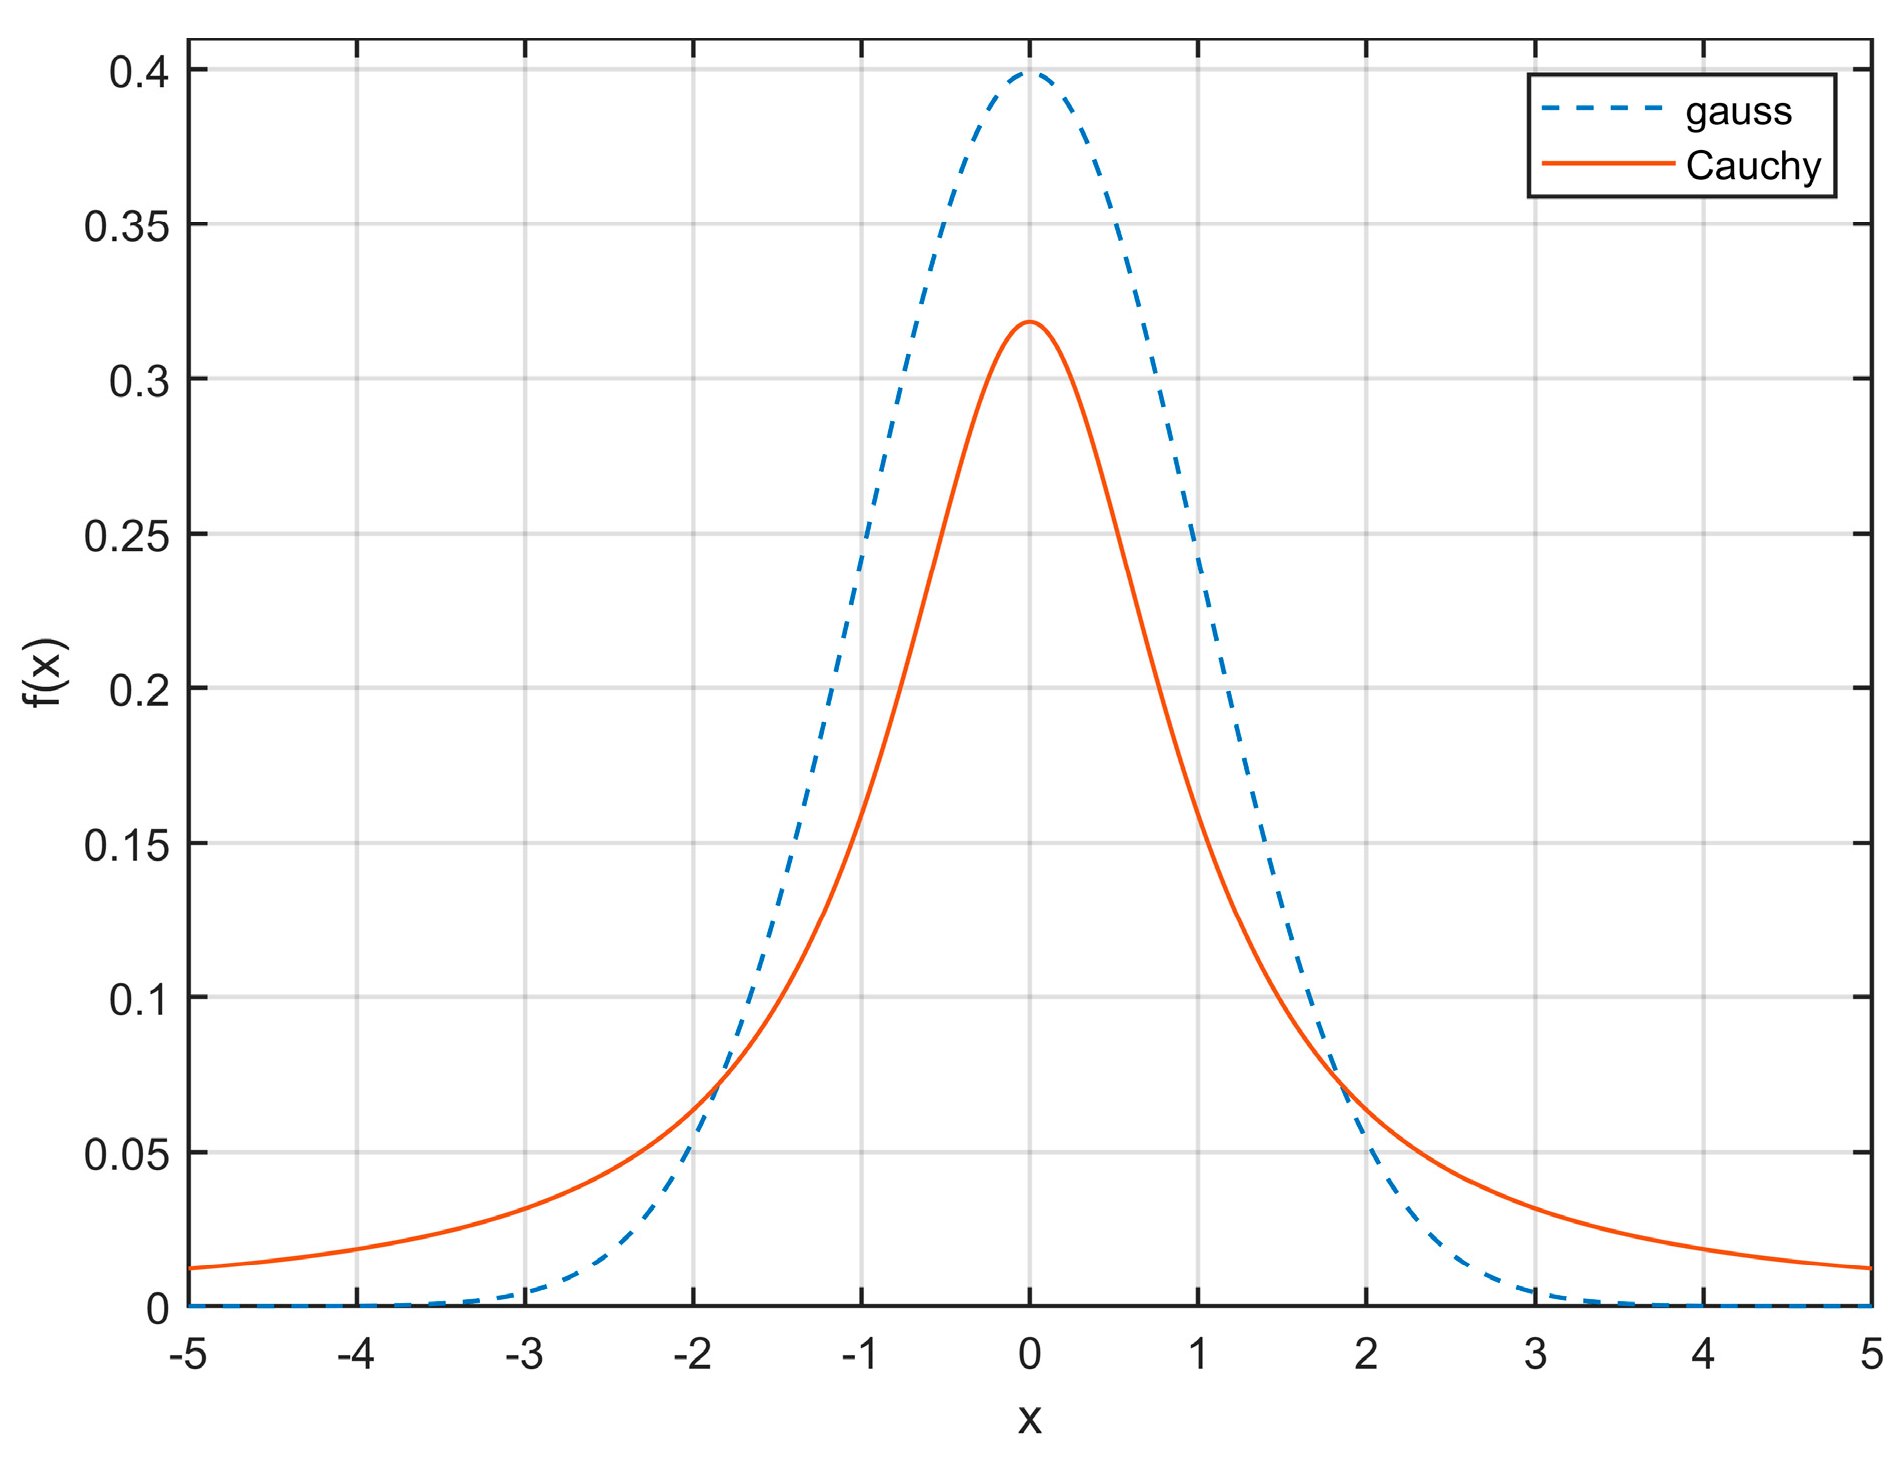
In the optimization process, the algorithm needs to have good global exploration ability and diversity in the initial stage, while in the middle and later stages, it needs to strengthen local search and the ability to jump out of the local optima solutions. Obviously, different evolutionary stages have different requirements for the algorithm’s search ability, and a single mutation operator is difficult to meet two requirements in different stages. In this manuscript, Gaussian–Cauchy perturbation was introduced in the proposed algorithm. Because the probability density distribution characteristics of Gaussian chaos and Cauchy chaos are different, their impacts on the algorithm’s optimization ability are also different. The specific probability density function formulas of Gauss and Cauchy distribution are shown in Equations (7) and (8). Figure 2 shows Cauchy distribution with α = 1 and Gauss distribution N (0, 1).
f ( x ) = 1 2 π σ exp ( ( x μ ) 2 2 σ 2 )
f α ( x ) = 1 π α α 2 + x 2
It can be seen from Figure 2 that the peak value of Cauchy distribution at the origin is smaller than that of Gaussian distribution, and the speed of the long flat shape at both ends approaching zero is slower than that of Gaussian distribution. Therefore, using the Cauchy mutation that obeys the Cauchy distribution random number can produce a larger mutation step size, which is conducive to the algorithm guiding individuals to jump out of the local optimal solution and ensuring the global exploration ability of the algorithm. However, Gaussian mutation has better local search ability than Cauchy mutation. Therefore, Cauchy perturbation is suitable for use in the first half of the loop iteration (T/2), and Gaussian perturbation is suitable for use in the second half of the loop iteration (T/2).

3.5. The Process of the Optimization Sparrow Algorithm

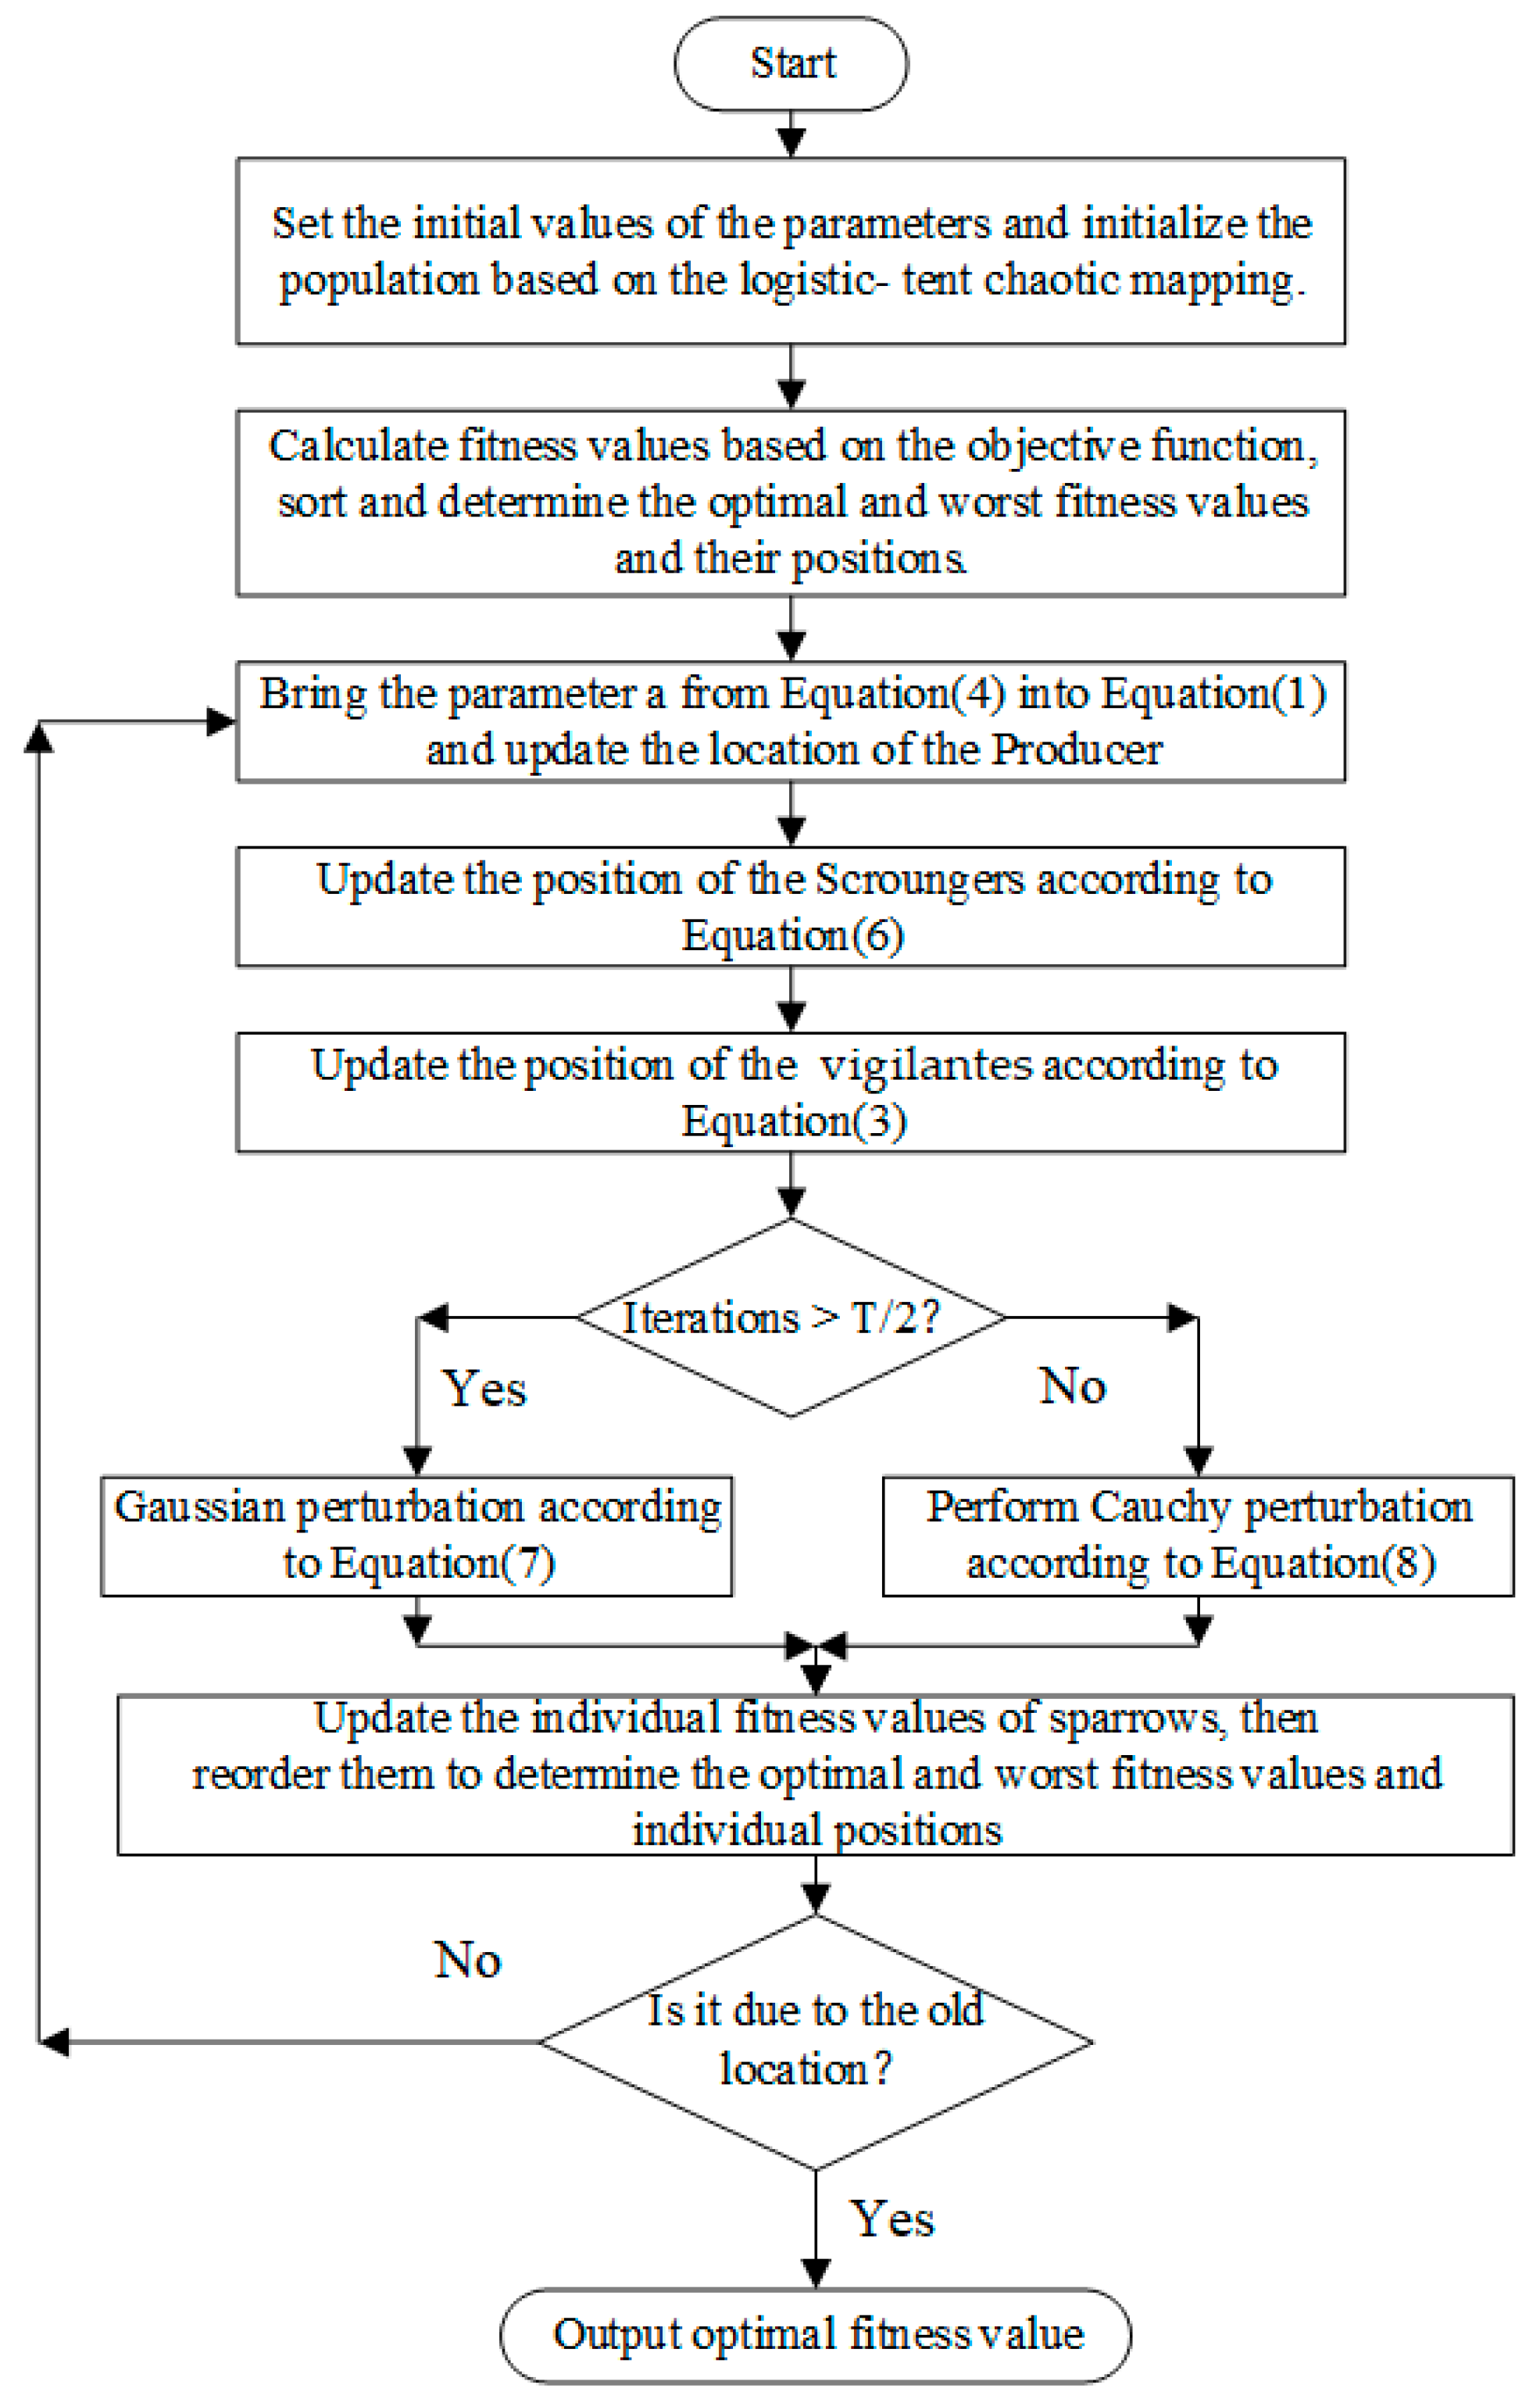
According to the above improvement measures, the hybrid optimization sparrow algorithm is proposed to improve its algorithmic efficiency. The sparrow optimization algorithm steps are as follows. First, the sparrow population is initialized using logistic-tent chaotic mapping, and then fitness values are calculated for all sparrow individuals. Producers and scroungers are assigned based on the fitness values. Afterwards, the producers, scroungers, and scouts are iteratively updated, and the corresponding perturbation method is selected based on the number of iterations of the algorithm to perturb the optimal sparrow individual position. Finally, an iteration cycle is carried out until the optimal value is output. The specific step flowchart is shown in Figure 3.

4. Simulation Experiments and Analysis

4.1. Path Planning Simulation Using the Hybrid Optimization Sparrow Algorithm

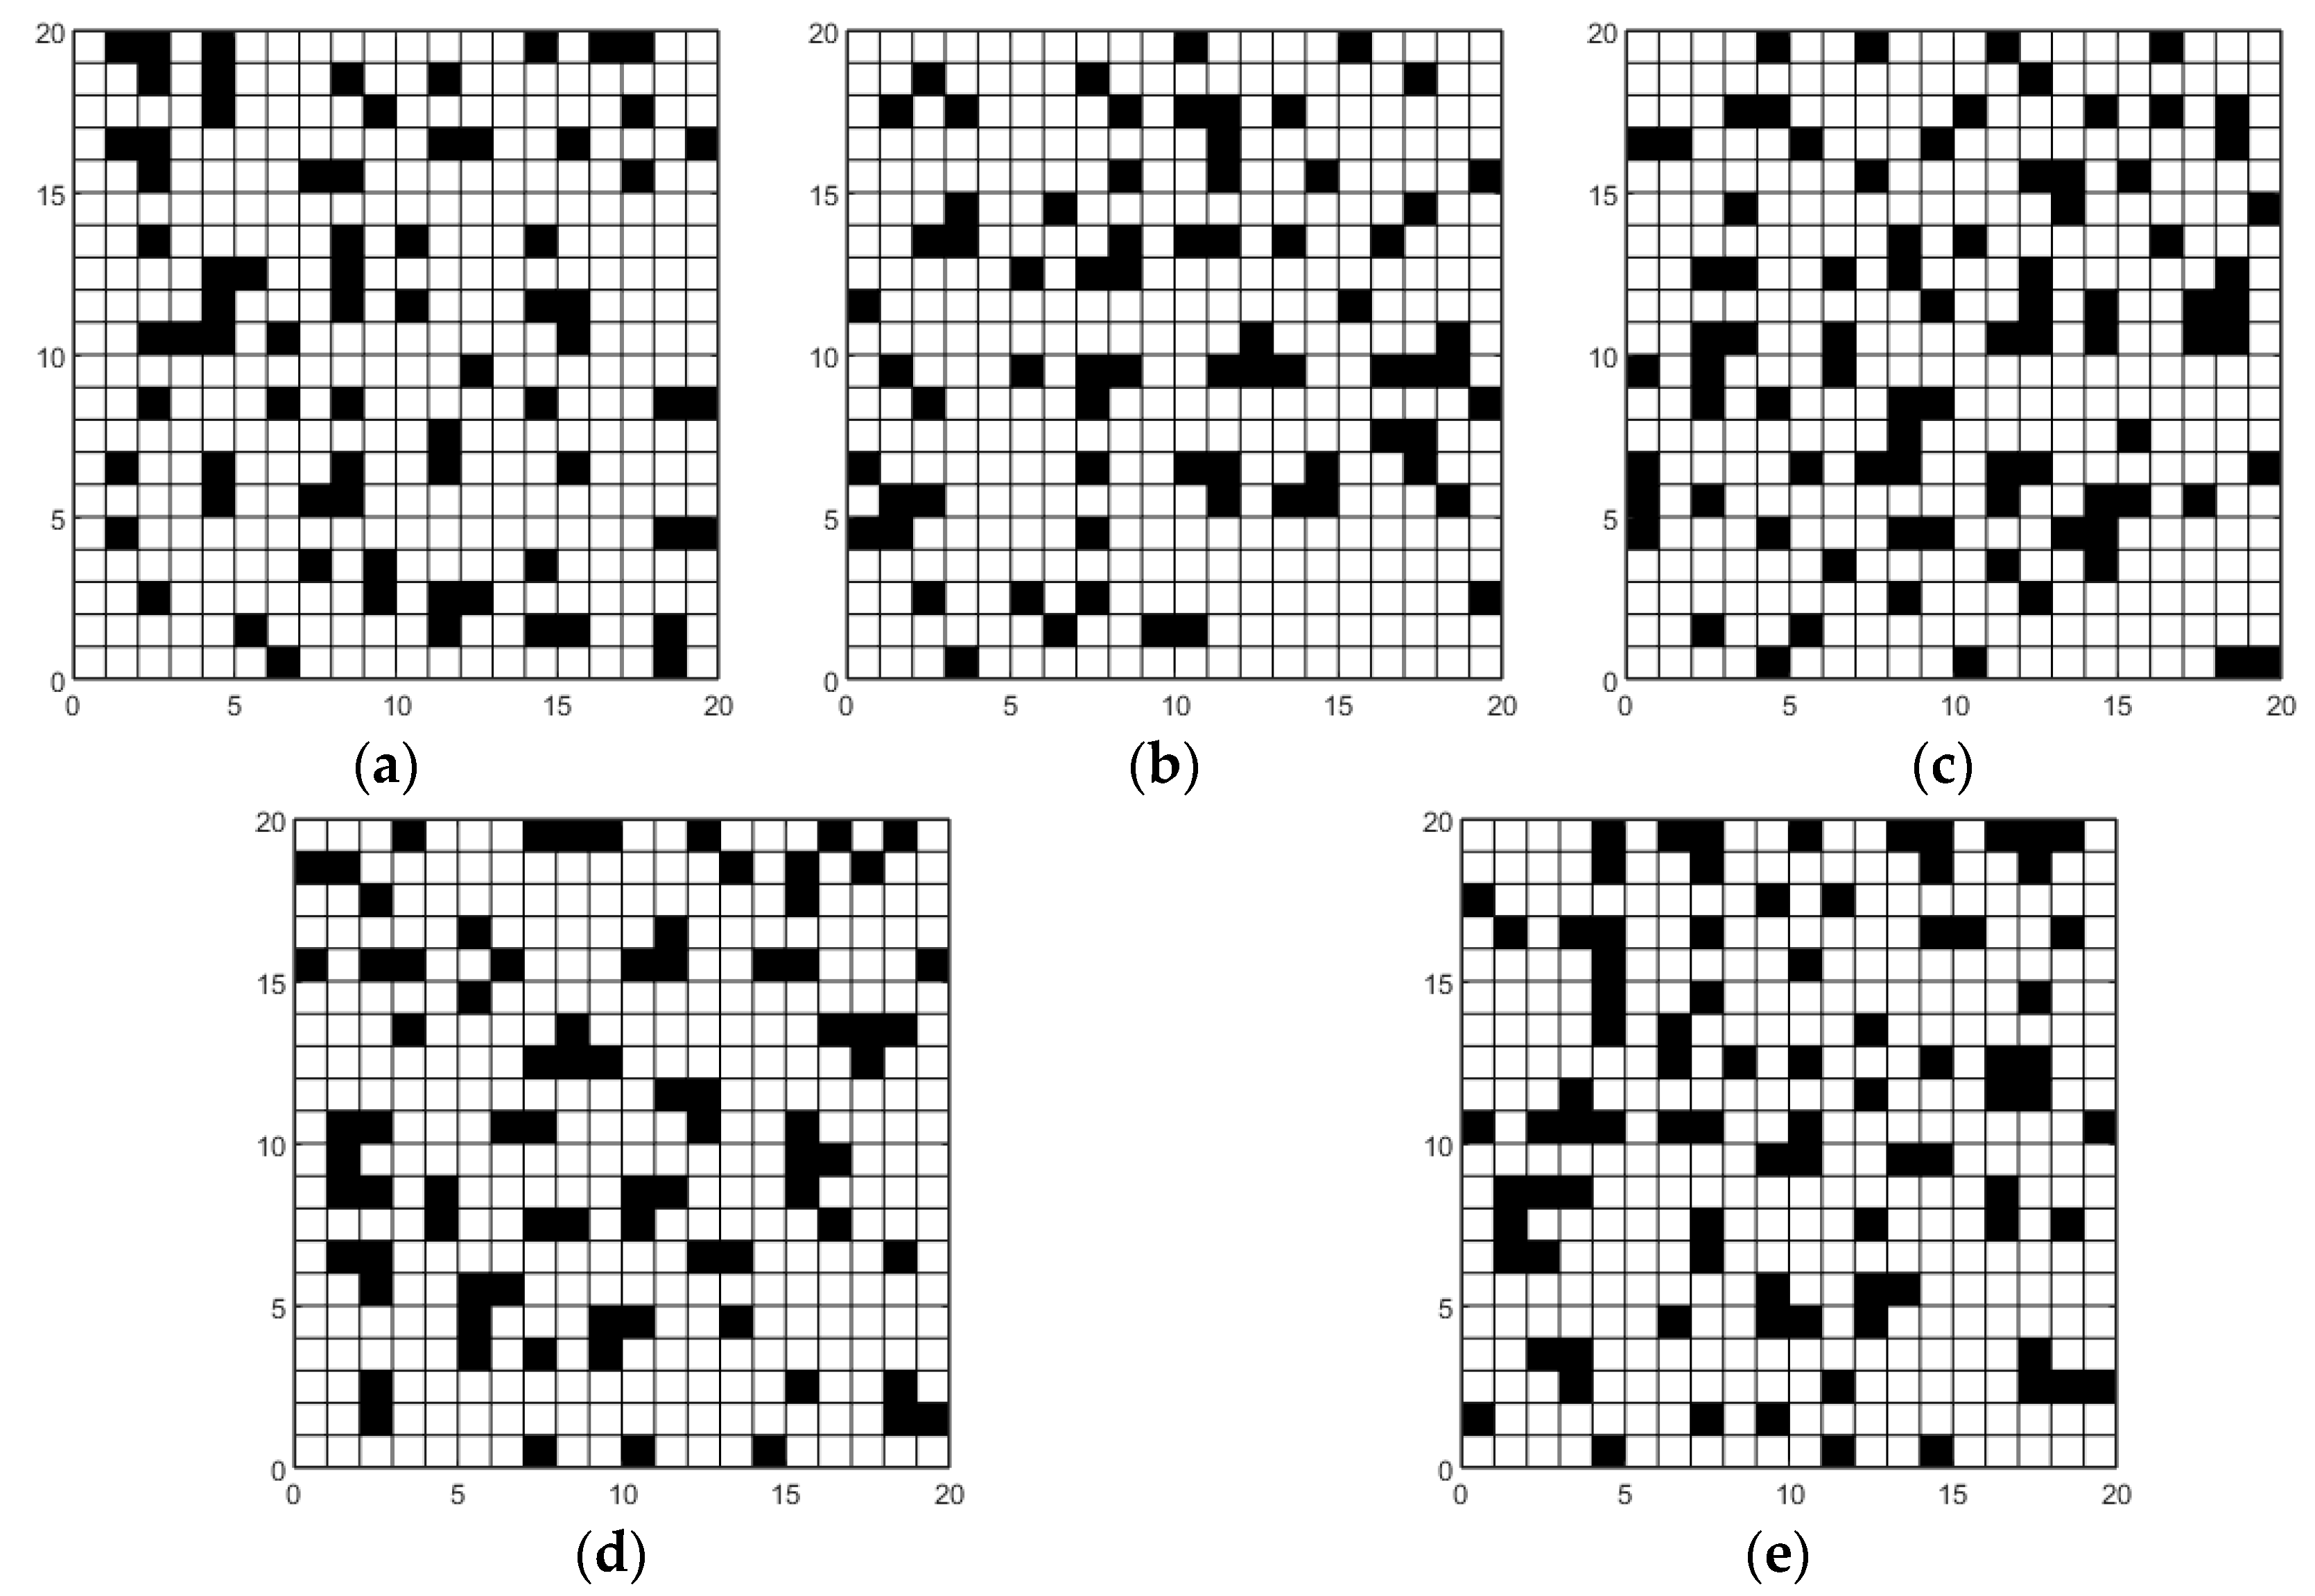
In order to test the path planning ability of the hybrid optimization sparrow algorithm (HSSA for short), four other algorithms were introduced for comparison, including the basic sparrow algorithm (SSA for short), the sparrow algorithm based on tent mapping and Lévy flight optimization (TSSA for short), the whale algorithm (WOA for short), and the grey wolf algorithm (GWO for short). Five different maps with the size of 20 × 20 were generated using grid method modeling. The parameters of the three different sparrow algorithms (SSA, TSSA, and HSSA) are exactly the same, with an initial sparrow population of 50 and 200 iterations. The proportion of producers is 20%, while the rest are scroungers and scouts. Among them, the SSA has a random initial population, and TSSA maps the initial population using tent mapping. The maps of the optimal path are shown in Figure 4. The iteration times of the GWO algorithm and the WOA algorithm are consistent with those of the SSA algorithm. Except for the population and the iterations, the other parameters of the WOA and the GWO can be seen in references [28,29].

4.2. Qualitative Analysis of Path Planning

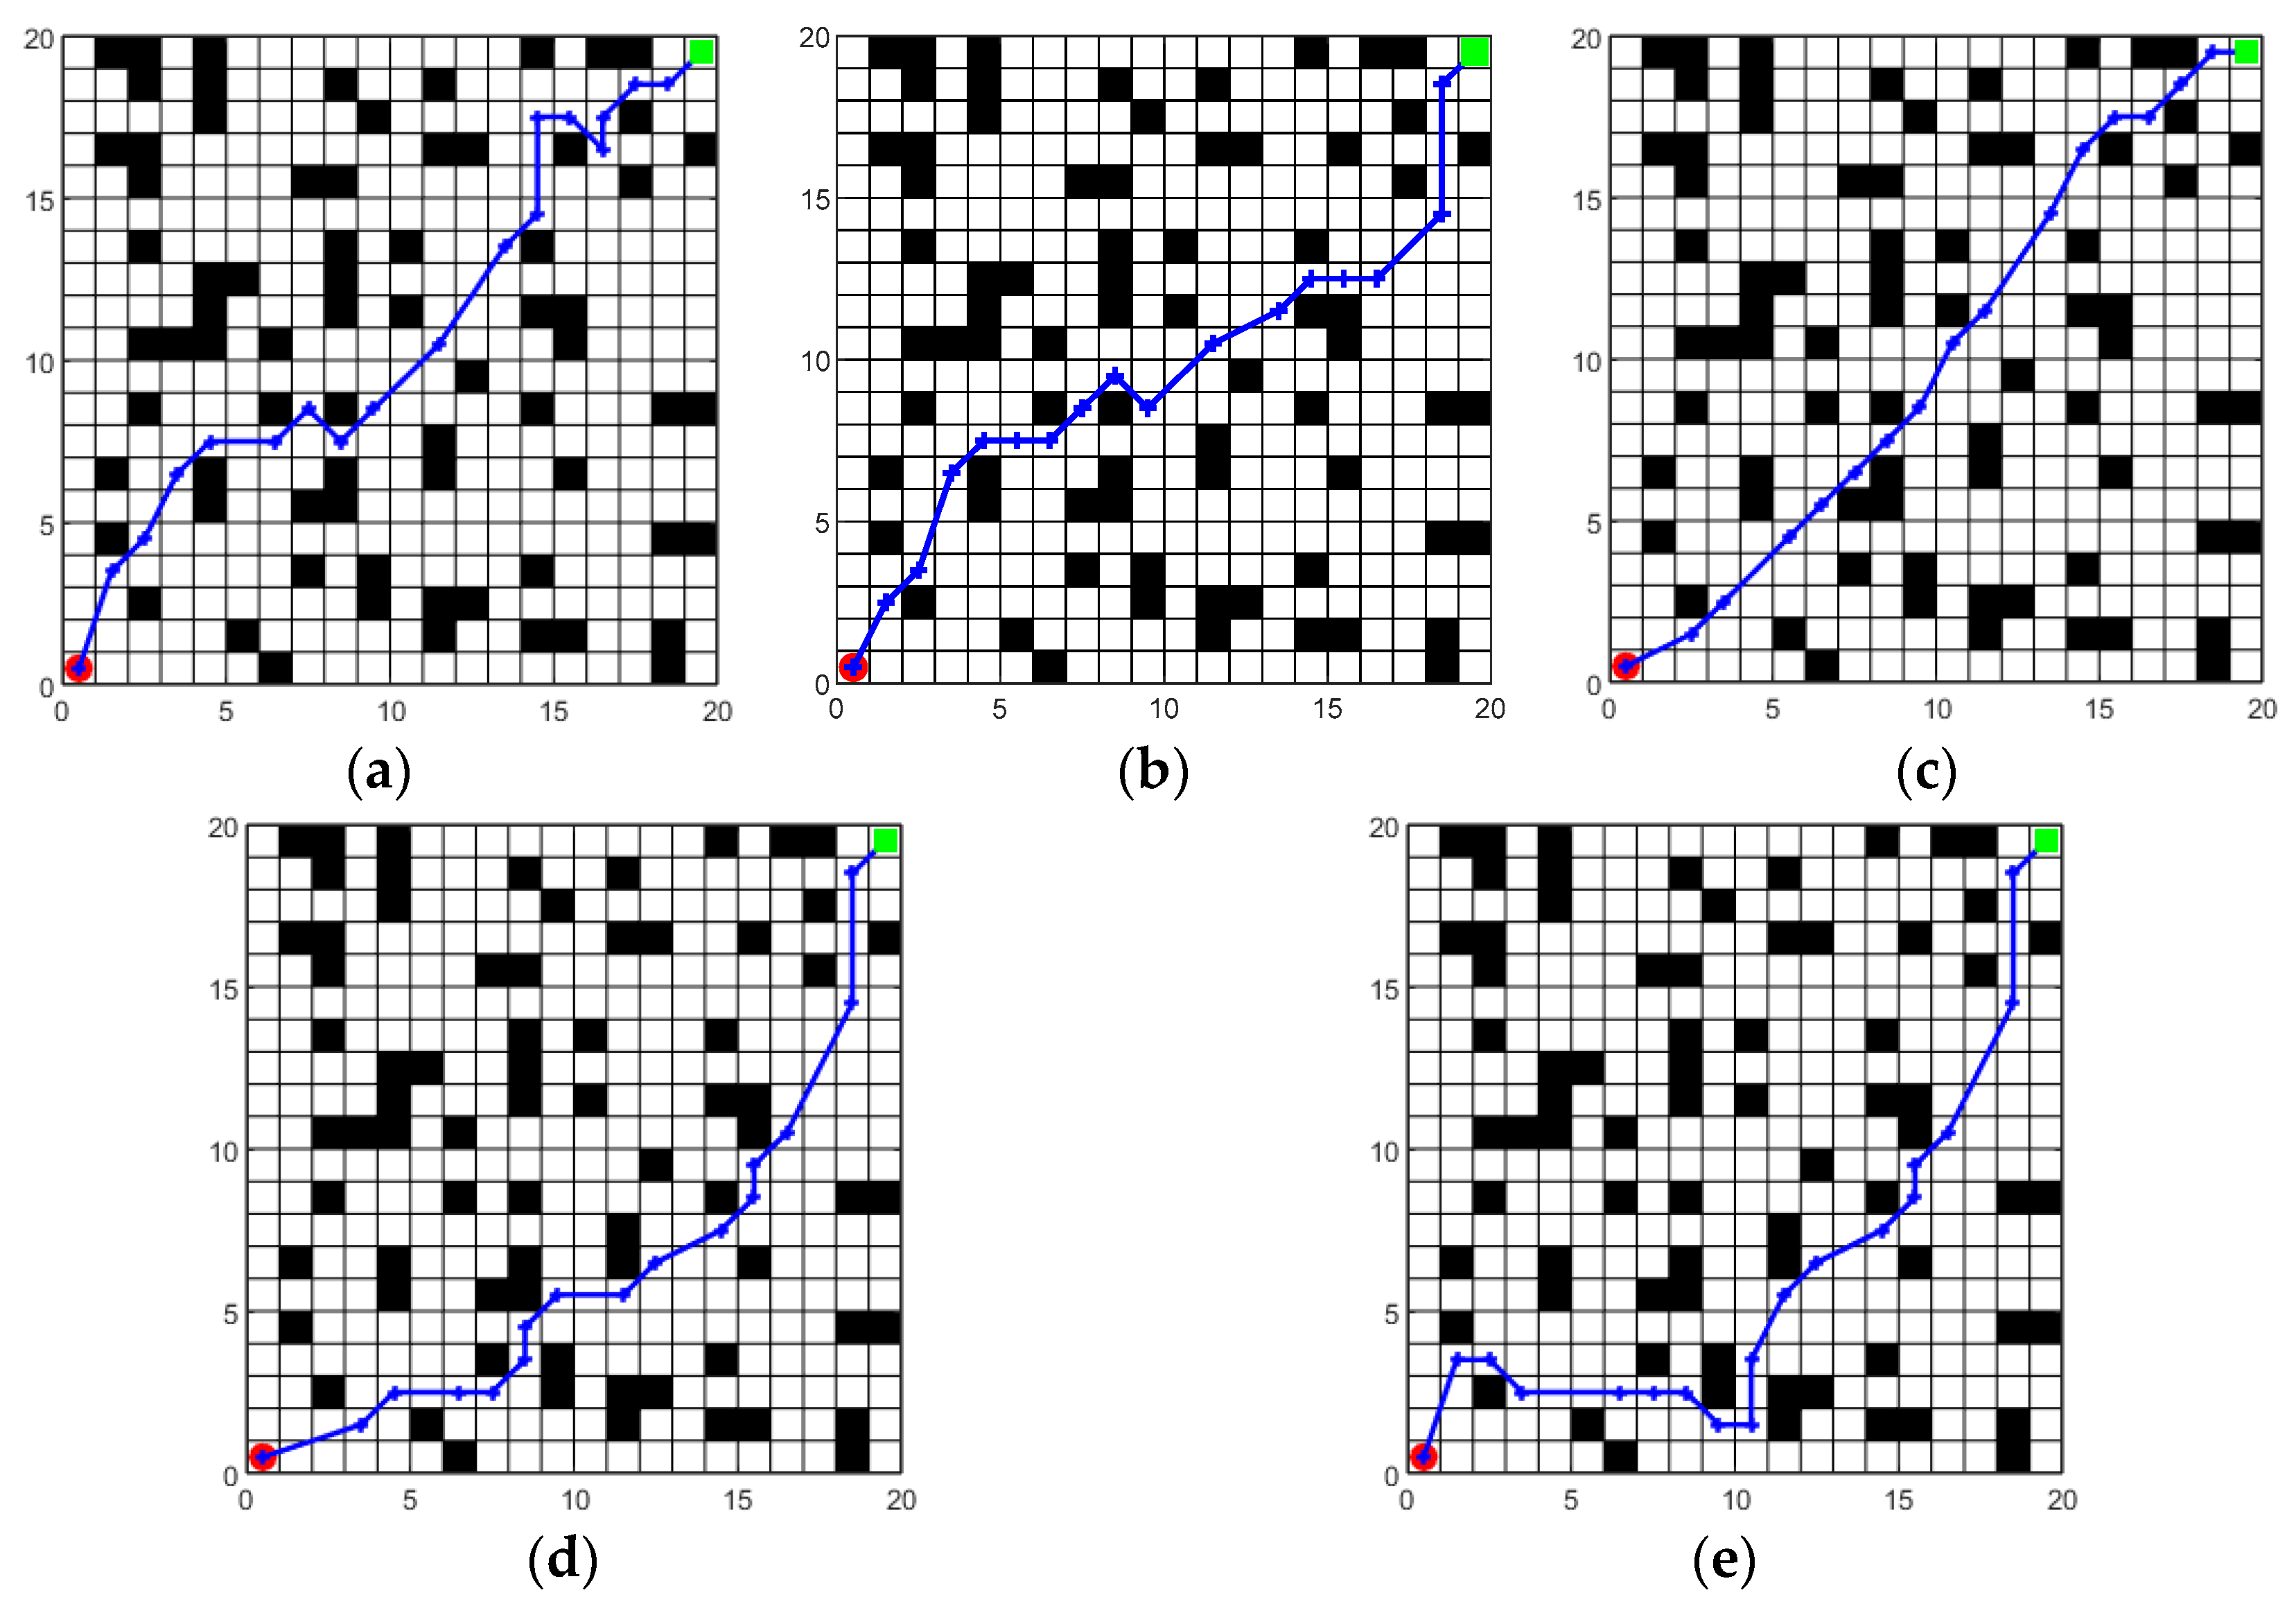
The SSA algorithm, the TSSA algorithm, the HSSA algorithm, the GWO algorithm, and the WOA algorithm are respectively used for path planning on the five grid maps. Here, the optimal paths planning by different algorithms on map 1 and map 5 are displayed. The optimal paths are shown in Figure 5 and Figure 6.
According to Figure 5 and Figure 6, intuitively, the paths planned by the proposed algorithm (HSSA) on map 1 and map 5 approach a straight line, having better smoothness than the other algorithms. In the meantime, it is easy to find that the two paths planned by the proposed algorithm (HSSA) have few infection points and thus reduced unnecessary collisions with obstacles. Ultimately, it also has a positive impact on decreasing the lengths of the planned paths.

4.3. Quantitative Analysis of Path Planning Results

The qualitative analysis of the optimal paths given by the different algorithms mainly relies on the intuition and experience of the researchers. The quantitative analysis of the optimal path given by the different algorithms is based on the statistical data, which can more scientifically verify the advantages and disadvantages of each algorithm. This section exhibited the detailed results about path planning. In order to reduce the impact of random factors, each algorithm was tested 10 times on five different maps.

4.3.1. The Length of Optimal

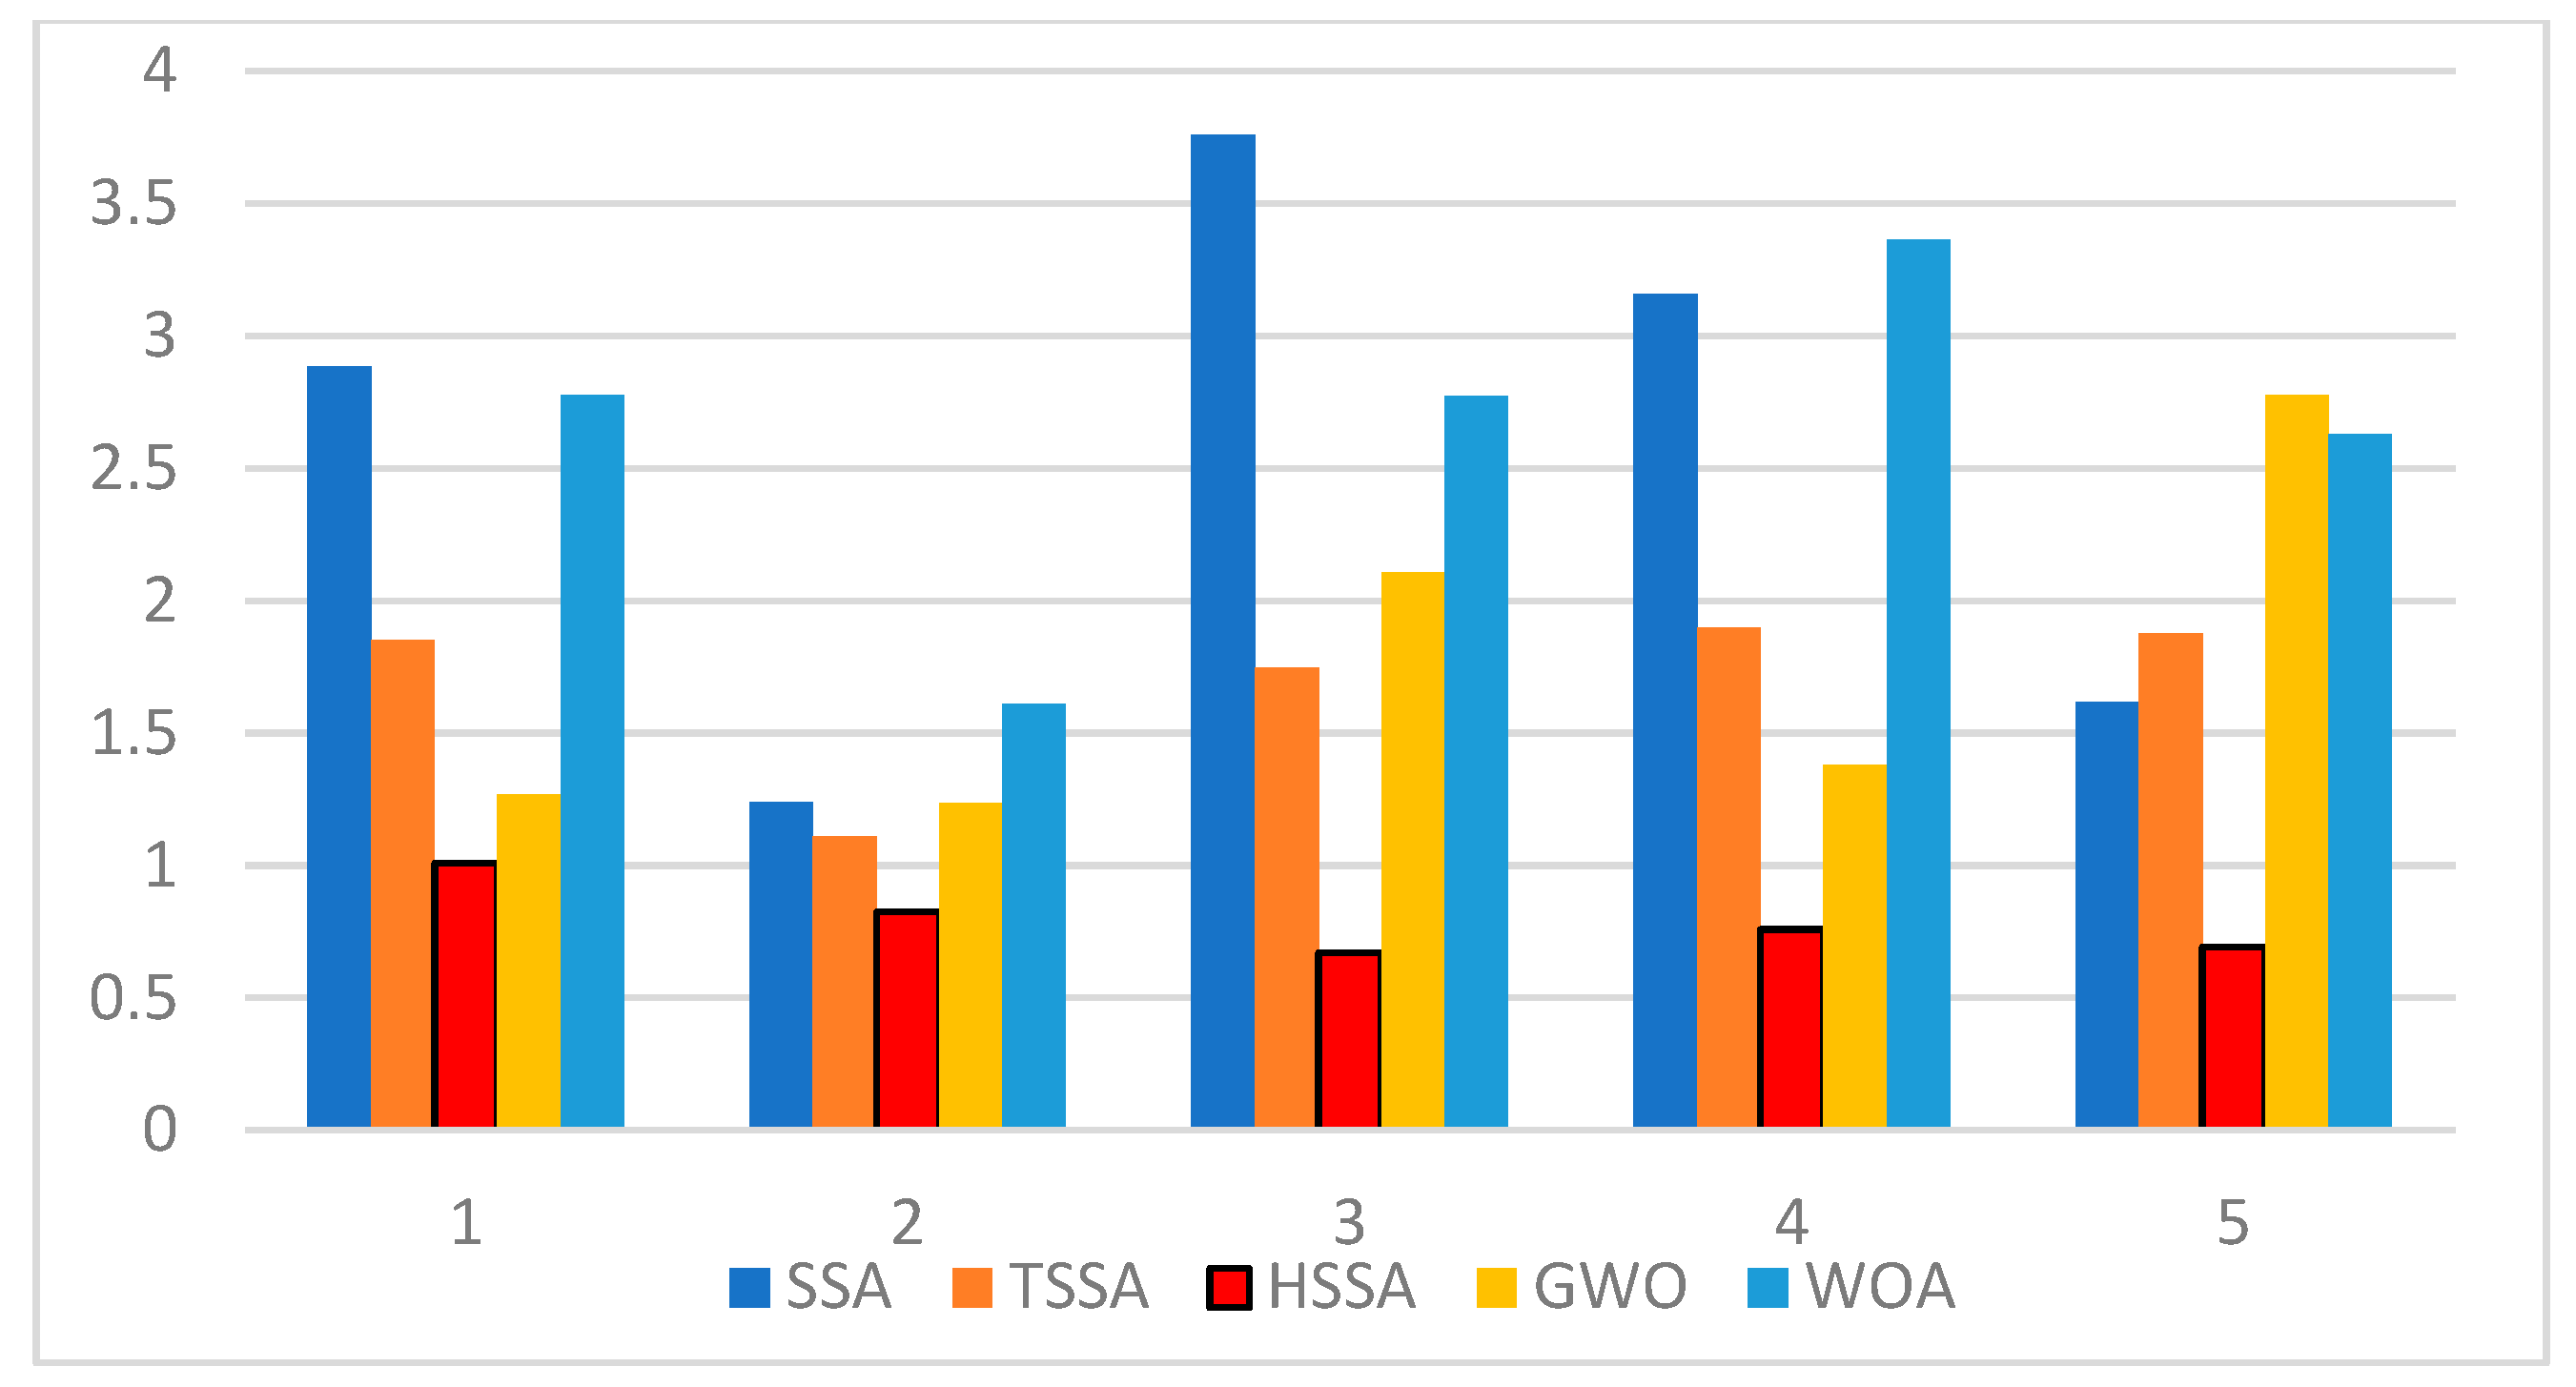
The lengths of the optimal path solved by the different algorithms on different maps are shown in Figure 7, including the minimum values and average values of the optimal path length. In addition, the standard deviations of the lengths of the optimal paths are chosen to prove the stability of the algorithms, and the results are shown in Figure 8.
As can be seen from Figure 7 and Figure 8, the HSSA algorithm has great advantages over the SSA algorithm, TSSA algorithm, GWO algorithm, and WOA algorithm in finding the optimal path. The analysis of searching for the optimal paths for five maps is as follows.
(1)
In Figure 7a, compared with the lengths of the optimal paths planned by the SSA algorithm for five different maps, the lengths of the optimal paths planned with the HSSA algorithm are shortened by 22.52%, 18.26%, 20.43%, 10.97%, and 22.02%, respectively. In Figure 7b, the lengths of the average paths planned by the HSSA are decreased by 29.24%, 19.50%, 27.14%, 19.16%, and 26.34%, respectively, compared with the SSA algorithm. Meanwhile, the standard deviations of the optimal path lengths are also significantly smaller than those of the SSA algorithm.
(2)
In Figure 7a, compared with the lengths of the optimal paths planned by the TSSA algorithm for five different maps, the lengths of the optimal paths planned with the HSSA algorithm are shortened by 3.53%, 10.58%, 7.89%, 5.28%, and 10.05%, respectively. In Figure 7b, the lengths of the average paths planned by the HSSA are decreased by 15.81%, 13.62%, 13.11%, 10.70%, and 15.02%, respectively, compared with the TSSA algorithm. The corresponding standard deviation of the optimal path lengths planned by the HSSA algorithm is also smaller than that of the TSSA algorithm, indicating that the performance of the HSSA algorithm is stronger than the performances of the SSA and TSSA algorithms.
(3)
In Figure 7a, compared with the lengths of the optimal paths planned by the GWO algorithm for five different maps, the lengths of the optimal paths planned with the HSSA algorithm are shortened by 5.58%, 7.62%, 6.80%, 5.28%, and 7.38%, respectively. In Figure 7b, the average lengths of the optimal paths planned by the HSSA algorithm are decreased by 7.55%, 8.74%, 11.63%, 8.69%, and 14.90%, respectively, compared with the GWO algorithm. As shown in Figure 8, the standard deviations of the optimal path lengths planned by the HSSA algorithm are decreased by 20.40%, 30.36%, 68.20%, 44.99%, and 70.74%. The minimums of the optimal path lengths, the averages of the optimal path lengths, and the standard deviations of the optimal path lengths could prove that the stability and searching ability of the HSSA algorithm is much stronger than that of the GWO algorithm on the five maps.
(4)
Comparing with the WOA algorithm, the lengths of the optimal paths planned by the HSSA algorithm are shortened by 15.22%, 9.49%, 18.42%, 1.77%, and 17.81%, respectively, and the average lengths of the optimal paths are decreased by 17.68%, 13.33%, 27.47%, 13.39%, and 25.08%, separately. Meanwhile, with regard to the path planning in map 4, although the length of the optimal path planned by the HSSA algorithm is just a little smaller than that of the WOA algorithm, the average lengths and the standard deviations of the optimal paths also could prove the stronger stability and searching ability of the HSSA algorithm than that of the WOA algorithm on this map.
By analyzing the above results, it indicates that compared to other comparative algorithms, the HSSA algorithm proposed in this article has stronger search ability and better stability, which is especially suitable for path planning in complex situations.

4.3.2. The Time Cost of the Optimal Path

The comparison of optimal path time cost for each algorithm on different maps is shown in Table 1, including the minimum time costs of the optimal path, the average time costs of the optimal path, and the standard deviations of the optimal path time costs.
In order to easily compare the time cost results of the optimal path planned by the different algorithms, the best results of the minimum of the optimal path time cost are in bold and italic font with underlining; then, the best results of the average of the optimal path time cost are in bold font, and the best results of the standard deviation of the optimal path time cost are in bold and italic font, as shown in Table 1.
From Table 1, the SSA algorithm seems to be the best one in the time cost. Although the HSSA algorithm has no significant advantage in the time cost of path planning, the lengths of the optimal path planned by the HSSA algorithm are better than the SSA algorithm and TSSA algorithm. It is that the SSA algorithm did not find global optimal results and might search local optimal results, which proves that it is necessary to improve the original SSA algorithm. The above results indicate that the HSSA algorithm still has room for further improvement, which is also the direction of future efforts.

4.3.3. The Convergence of Different Algorithms

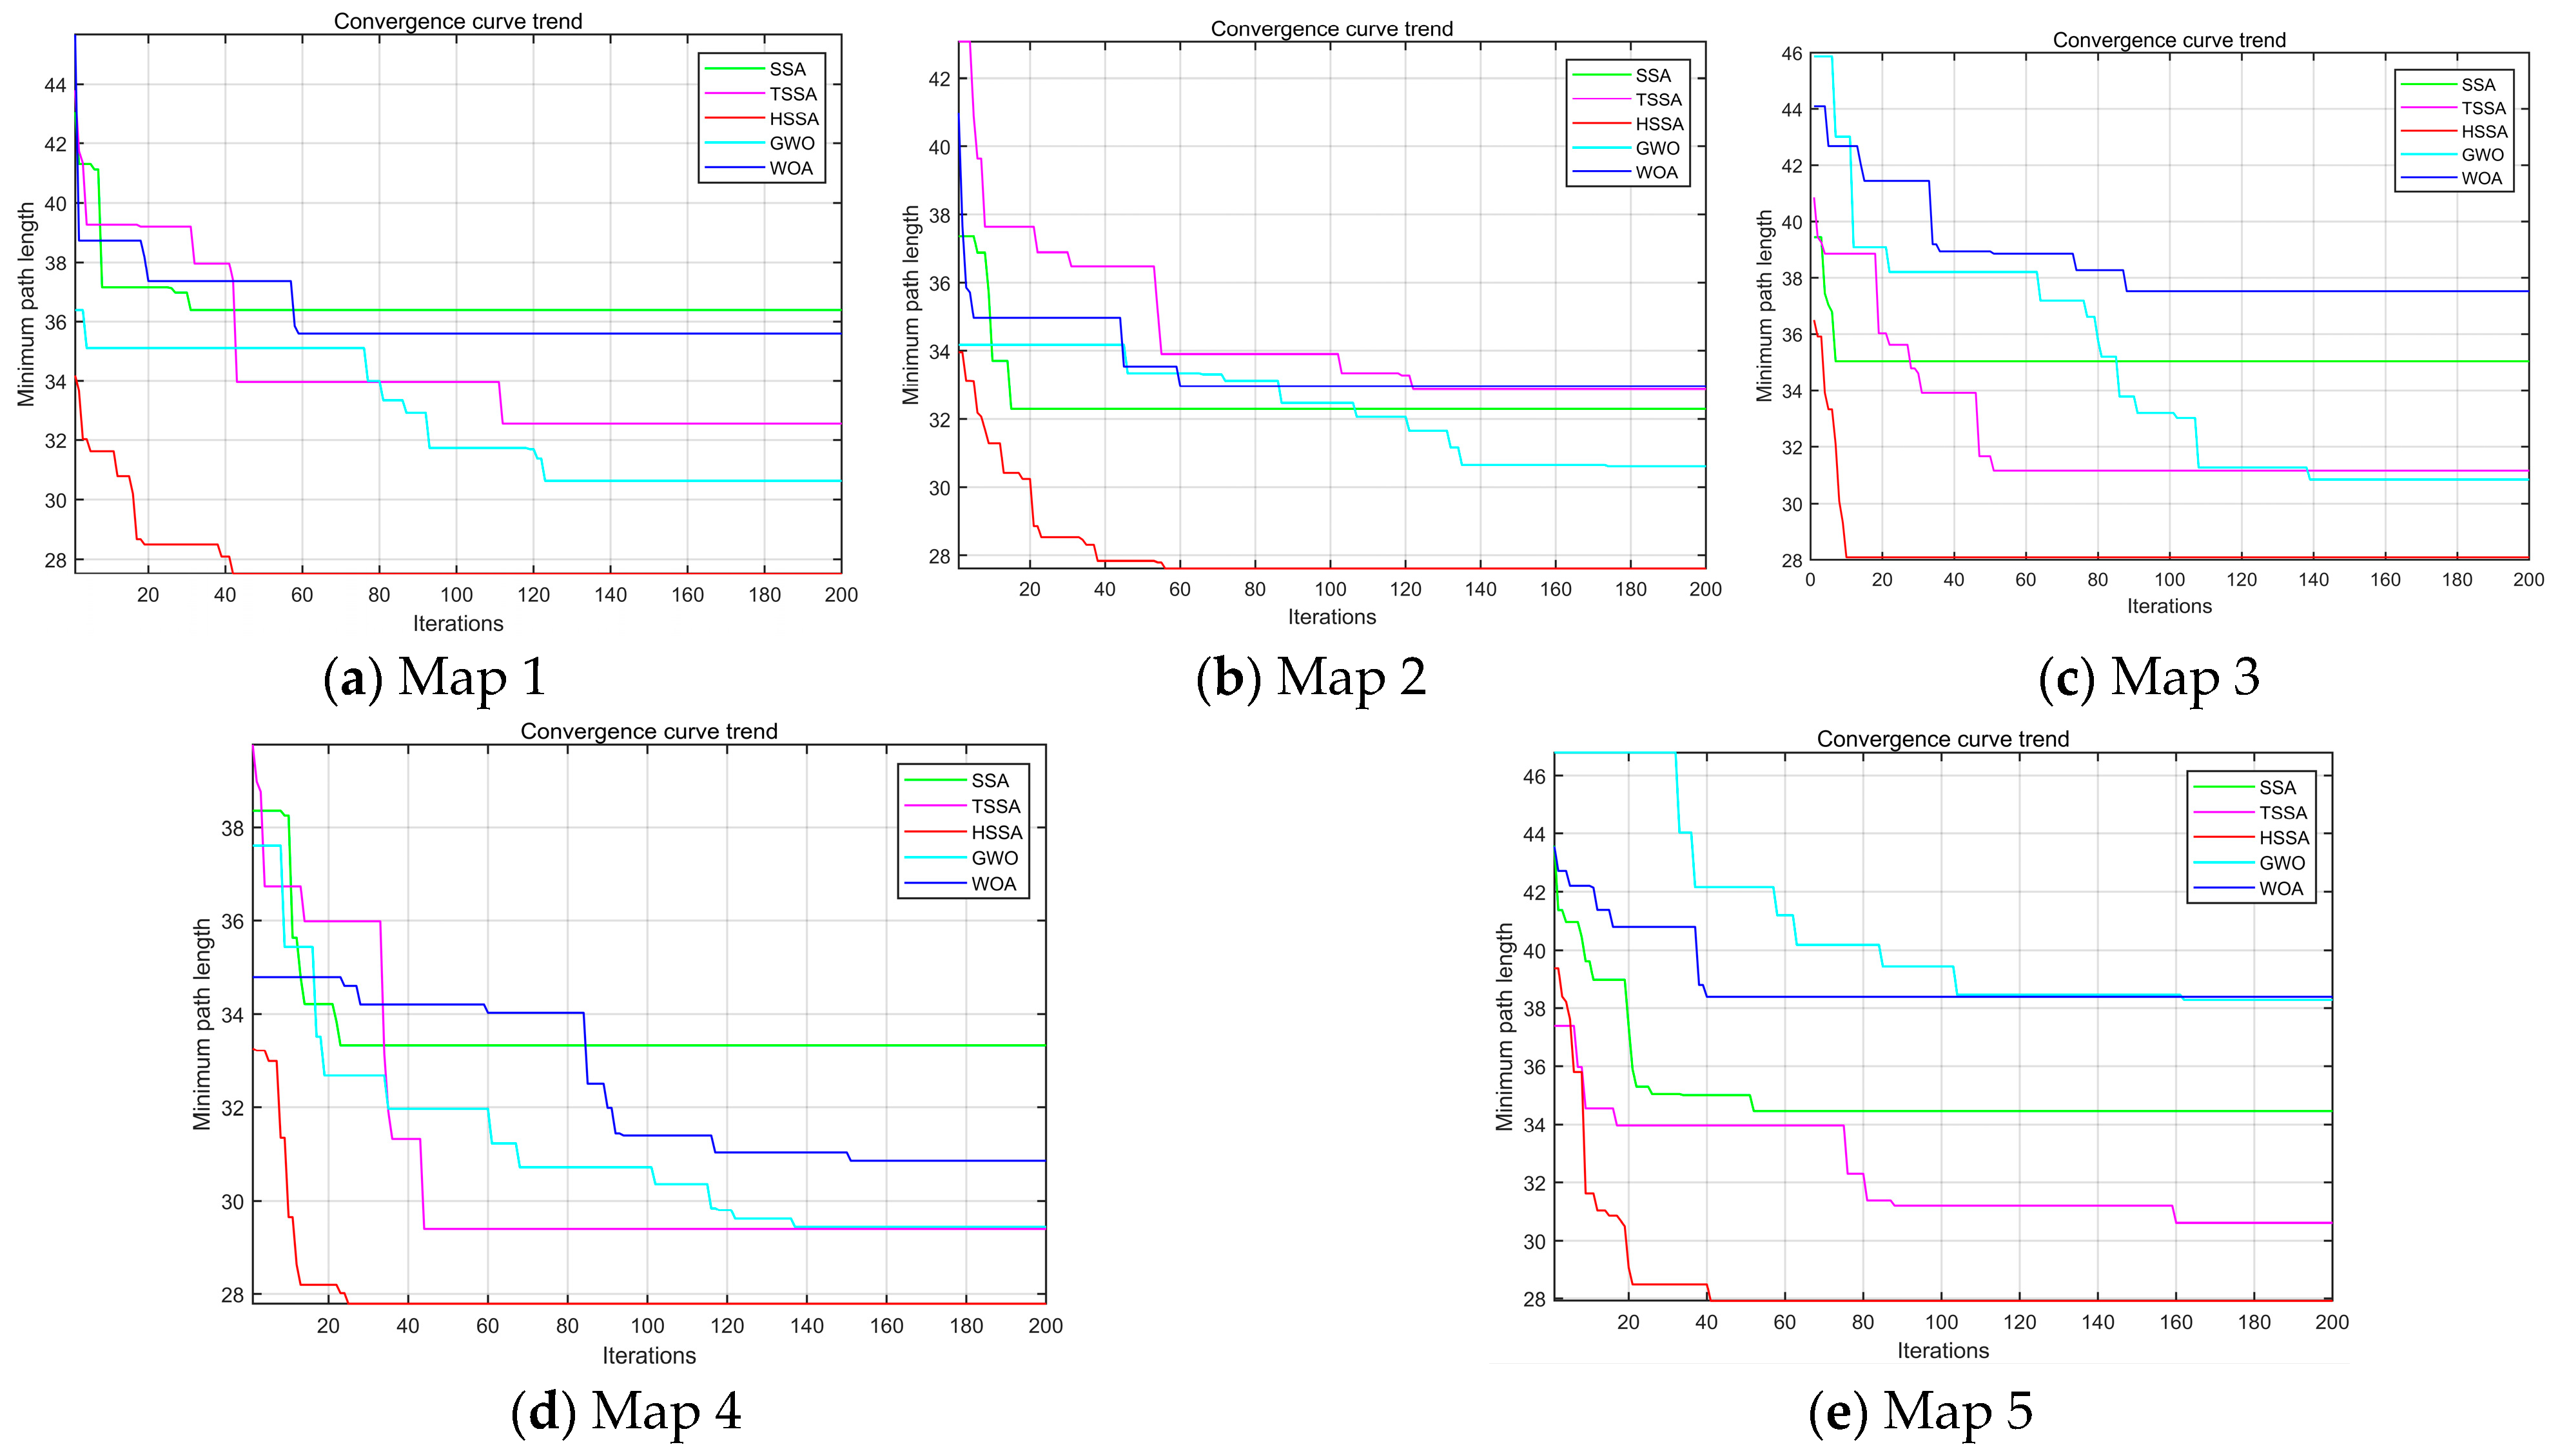
Convergence refers to whether the output of an algorithm approaches the true result when solving numerical problems. If an algorithm has good convergence, it can approach the real results by gradually increasing the accuracy of the calculation. On the contrary, if the rate of convergence of the algorithm is slow or does not converge, it is necessary to consider improving the algorithm or selecting other algorithms. Therefore, studying the convergence of algorithms could help us determine the effectiveness and feasibility of an algorithm in solving problems. The convergence curves of each algorithm in different maps are shown below.
As can be seen from Figure 9, in maps 1, 2, 3, and 4, the lengths of the initial path planned by the HSSA algorithm are the smallest compared to the other algorithms. In map 5, the lengths of the initial path planned by the HSSA algorithm are two grids larger than that of the TSSA algorithm. On the whole, in the initial stage of path planning, the HSSA algorithm has good optimization ability. In addition, except for map 4 and map 5, the numbers of iterations to reach the global optimal path by the HSSA algorithm are obviously smaller than the other algorithms. And, the numbers of iterations to reach the global optimal path by the HSSA algorithm are a little larger than those of the SSA. This shows that the HSSA has an extremely fast rate of convergence. Finally, it is not hard to find that the lengths of the global optimal path planned by the HSSA are the shortest. The above research indicates that the HSSA has good performance and is suitable for planning personnel evacuation paths.

5. Conclusions

In response to the problem of the sparrow algorithm being prone to falling into local optimal, this paper proposes a hybrid improved sparrow search algorithm (HSSA), including four improvements. First, during the initialization phase, the population was initialized through logistic-tent mapping to improve the quality and diversity of the sparrow population. Then, an adaptive period factor was introduced into the producers update position equation, and a Lévy flight mechanism was considered into the scroungers update equation to enhance the global search range. Finally, adaptive perturbation was used to strengthen the local search ability in the later period of optimization iterative, preventing the algorithm from falling into local optima in the later convergence stage.
Afterward, the HSSA algorithm and four other algorithms, including the SSA, TSSA, GWO, and WOA algorithms, were tested in five different grid maps to plan paths. Compared with the other algorithms, the HSSA algorithm had significant advantages in path planning length and algorithm convergence. These results verified the performance of the HSSA algorithm and indicated that the algorithm had better path planning ability in complex situations, which is expected to be used in more practical applications.

Author Contributions

X.W.: Conceptualization, Writing—original draft, Methodology, Funding acquisition, Writing—review and editing; Y.Z. (Yuming Zhang): Conceptualization, Data curation, Data analysis; Y.Z. (Yinlong Zhao): Data analysis, Writing—review and editing. All authors have read and agreed to the published version of the manuscript.

Funding

The present study was supported by the National Natural Science Foundation of China (71904006) and the Science and Technology Research Plan of Henan Province (222102320469, 232102320043, 232102320046).

Institutional Review Board Statement

Not applicable.

Informed Consent Statement

Not applicable.

Data Availability Statement

The datasets used and/or analyzed during the current study are available from the corresponding author on reasonable request.

Conflicts of Interest

There is no conflict of interest to report regarding the present study.

References

  1. Haghani, M.; Sarvi, M. Crowd behaviour and motion: Empirical methods. Transp. Res. Part B Methodol. 2018, 107, 253–294. [Google Scholar] [CrossRef]
  2. Fridolf, K.; Nilsson, D.; Frantzich, H. Fire evacuation in underground transportation systems: A review of accidents and empirical research. Fire Technol. 2013, 49, 451–475. [Google Scholar] [CrossRef]
  3. Yang, X.; Yang, Y.; Qu, D.; Chen, X.; Li, Y. Multi-Objective Optimization of Evacuation Route for Heterogeneous Passengers in the Metro Station Considering Node Efficiency. IEEE Trans. Intell. Transp. Syst. 2023, 99, 1–14. [Google Scholar] [CrossRef]
  4. Ibrahim, A.M.; Venkat, I.; Subramanian, K.G.; Khader, A.T.; Wilde, P.D. Intelligent evacuation management systems: A review. ACM Trans. Intell. Syst. Technol. (TIST) 2016, 7, 1–27. [Google Scholar] [CrossRef]
  5. Sharbini, H.; Sallehuddin, R.; Haron, H. Crowd evacuation simulation model with soft computing optimization techniques: A systematic literature review. J. Manag. Anal. 2021, 8, 443–485. [Google Scholar] [CrossRef]
  6. Guan, W.; Hou, S.; Yu, G.; Gong, H.; Guan, S.; Zhao, J. Dynamic Evacuation Path Planning for Multi-Exit Building Fire: Bi-Objective Model and Algorithm. Fire Technol. 2023, 59, 2853–2876. [Google Scholar] [CrossRef]
  7. Zhu, Y.; Li, H.; Wang, Z.; Li, Q.; Dou, Z.; Xie, W.; Zhang, Z.; Wang, R.; Nie, W. Optimal Evacuation Route Planning of Urban Personnel at Different Risk Levels of Flood Disasters Based on the Improved 3D Dijkstra’s Algorithm. Sustainability 2022, 14, 10250. [Google Scholar] [CrossRef]
  8. Liu, L.; Wang, B.; Xu, H. Research on path-planning algorithm integrating optimization A-star algorithm and artificial potential field method. Electronics 2022, 11, 3660. [Google Scholar] [CrossRef]
  9. Zhang, R.; Sun, W.; Tsai, S.-B. Simulation of Sports Venue Based on Ant Colony Algorithm and Artificial Intelligence. Wirel. Commun. Mob. Comput. 2021, 2021, 1–11. [Google Scholar] [CrossRef]
  10. Asghari, K.; Masdari, M.; Gharehchopogh, F.S.; Saneifard, R. A chaotic and hybrid gray wolf-whale algorithm for solving continuous optimization problems. Prog. Artif. Intell. 2021, 10, 349–374. [Google Scholar] [CrossRef]
  11. Peng, Y.; Li, S.-W.; Hu, Z.-Z. A self-learning dynamic path planning method for evacuation in large public buildings based on neural networks. Neurocomputing 2019, 365, 71–85. [Google Scholar] [CrossRef]
  12. Zhou, Z.-X.; Nakanishi, W.; Asakura, Y. Data-driven framework for the adaptive exit selection problem in pedestrian flow: Visual information based heuristics approach. Phys. A Stat. Mech. Its Appl. 2021, 583, 126289. [Google Scholar] [CrossRef]
  13. Wang, Q.; Liu, H.; Gao, K.; Zhang, L. Improved multi-agent reinforcement learning for path planning-based crowd simulation. IEEE Access 2019, 7, 73841–73855. [Google Scholar] [CrossRef]
  14. Xue, J.; Shen, B. A novel swarm intelligence optimization approach: Sparrow search algorithm. Syst. Sci. Control. Eng. 2020, 8, 22–34. [Google Scholar] [CrossRef]
  15. Song, J.; Jin, L.; Xie, Y.; Wei, C. Optimized XGBoost based sparrow search algorithm for short-term load forecasting. In Proceedings of the 2021 IEEE International Conference on Computer Science, Artificial Intelligence and Electronic Engineering (CSAIEE), Beijing, China, 20–22 August 2021. [Google Scholar]
  16. Liu, T.; Yuan, Z.; Wu, L.; Badami, B. An optimal brain tumor detection by convolutional neural network and enhanced sparrow search algorithm. Proc. Inst. Mech. Eng. Part H J. Eng. Med. 2021, 235, 459–469. [Google Scholar] [CrossRef]
  17. Liu, T.; Yuan, Z.; Wu, L.; Badami, B. Optimal brain tumor diagnosis based on deep learning and balanced sparrow search algorithm. Int. J. Imaging Syst. Technol. 2021, 31, 1921–1935. [Google Scholar] [CrossRef]
  18. Kathiroli, P.; Selvadurai, K. Energy efficient cluster head selection using improved Sparrow Search Algorithm in Wireless Sensor Networks. J. King Saud Univ. -Comput. Inf. Sci. 2022, 34, 8564–8575. [Google Scholar] [CrossRef]
  19. Cao, L.; Yue, Y.; Zhang, Y. A data collection strategy for heterogeneous wireless sensor networks based on energy efficiency and collaborative optimization. Comput. Intell. Neurosci. 2021, 2021, 9808449. [Google Scholar] [CrossRef]
  20. Lv, J.; Sun, W.; Wang, H.; Zhang, F. Coordinated approach fusing RCMDE and sparrow search algorithm-based SVM for fault diagnosis of rolling bearings. Sensors 2021, 21, 5297. [Google Scholar] [CrossRef] [PubMed]
  21. Zhang, Z.; He, R.; Yang, K. A bioinspired path planning approach for mobile robots based on improved sparrow search algorithm. Adv. Manuf. 2022, 10, 114–130. [Google Scholar] [CrossRef]
  22. Jiang, Z.; Ge, J.; Xu, Q.; Yang, T. Fast Trajectory Optimization for Gliding Reentry Vehicle Based on Improved Sparrow Search Algorithm. J. Phys. Conf. Ser. 2021, 1986, 012114. [Google Scholar] [CrossRef]
  23. Liu, G.; Shu, C.; Liang, Z.; Peng, B.; Cheng, L. A modified sparrow search algorithm with application in 3d route planning for UAV. Sensors 2021, 21, 1224. [Google Scholar] [CrossRef]
  24. Ibrahim, R.A.; Elaziz, M.A.; Lu, S. Chaotic opposition-based grey-wolf optimization algorithm based on differential evolution and disruption operator for global optimization. Expert Syst. Appl. 2018, 108, 1–27. [Google Scholar] [CrossRef]
  25. Teng, Z.-J.; Lv, J.-L.; Guo, L.-W. An improved hybrid grey wolf optimization algorithm. Soft Comput. 2019, 23, 6617–6631. [Google Scholar] [CrossRef]
  26. Shan, L.; Qiang, H.; Li, J.; Wang, Z. Chaotic optimization algorithm based on Tent map. Control. Decis. 2005, 20, 179–182. [Google Scholar]
  27. Reynolds, A. Liberating Lévy walk research from the shackles of optimal foraging. Phys. Life Rev. 2015, 14, 59–83. [Google Scholar] [CrossRef] [PubMed]
  28. Mirjalili, S.; Mirjalili, S.M.; Lewis, A. Grey wolf optimizer. Adv. Eng. Softw. 2014, 69, 46–61. [Google Scholar] [CrossRef]
  29. Mirjalili, S.; Lewis, A. The Whale Optimization Algorithm. Adv. Eng. Softw. 2016, 95, 51–67. [Google Scholar] [CrossRef]
Figure 1. The distribution histogram of different mapping. (a) Logistic mapping; (b) Tent mapping; (c) Logistic-tent mapping.
Fire 06 00380 g001
Figure 2. The probability density curves of Cauchy distribution and Gaussian distribution.
Fire 06 00380 g002
Figure 3. Flow chart of the optimization sparrow algorithm steps.
Fire 06 00380 g003
Figure 4. Five different maps generated using the grid method. (a) map 1; (b) map 2; (c) map 3; (d) map 4; (e) map 5.
Fire 06 00380 g004
Figure 5. The optimal paths are planned by different algorithms for map 1. (a) The optimal path planned by SSA; (b) The optimal path planned by TSSA; (c) The optimal path planned by HSSA; (d) The optimal path planned by GWO; (e) The optimal path planned by WOA.
Fire 06 00380 g005
Figure 6. The optimal paths are planned by different algorithms for map 5. (a) The optimal path planned by SSA; (b) The optimal path planned by TSSA; (c) The optimal path planned by HSSA; (d) The optimal path planned by GWO; (e) The optimal path planned by WOA.
Fire 06 00380 g006
Figure 7. The lengths of the optimal paths solved by the different algorithms with 10 simulations. (a) The minimum values of the optimal path lengths. (b) The average values of the optimal path lengths.
Fire 06 00380 g007
Figure 8. The standard deviations of the lengths of the optimal paths solved by different algorithms with 10 simulations.
Fire 06 00380 g008
Figure 9. The convergence curve of path planning algorithms in different graph scenarios.
Fire 06 00380 g009
Table 1. The computing time of the optimal path solved using different algorithms with 10 simulations.
Map 12345
Algorithm
SSAMinimum (s)0.2154 0.23260.21820.20040.2304
Average (s)0.31440.36960.39660.35320.4045
Standard deviation0.09540.10520.11740.13740.1882
TSSAMinimum (s)0.62810.40560.95890.25280.5586
Average (s)0.92970.82971.23290.70210.9218
Standard deviation0.23820.24410.25780.24990.2976
HSSAMinimum (s)0.35810.23310.29200.28180.3266
Average (s)0.55470.43230.45340.40350.5202
Standard deviation0.09740.12150.11580.07950.1160
GWOMinimum (s)0.24530.24130.27290.28450.2587
Average (s)0.47470.45850.40780.45520.4419
Standard deviation0.17110.18620.07890.14960.0852
WOAMinimum (s)0.38270.34320.33970.26890.3402
Average (s)0.59370.48300.47120.40440.4089
Standard deviation0.15750.13420.10920.11670.0614
Disclaimer/Publisher’s Note: The statements, opinions and data contained in all publications are solely those of the individual author(s) and contributor(s) and not of MDPI and/or the editor(s). MDPI and/or the editor(s) disclaim responsibility for any injury to people or property resulting from any ideas, methods, instructions or products referred to in the content.