Article

An FDS Simulation to Predict the Kerosene Pool Fire Results at Rocket Launchpad Basement Facilities in the Republic of Korea

1
Corporate Affiliated Research Institute, TECHEVER Corporation, Goseong, 52919, Republic of Korea
2
Department of Bioenvironmental Energy, Pusan National University, Miryang 50463, Republic of Korea
3
Launcher Complex Development Team, Korea Aerospace Research Institute, Daejeon 34133, Republic of Korea
*
Author to whom correspondence should be addressed.
Fire 2023, 6(10), 385; https://doi.org/10.3390/fire6100385
Submission received: 7 August 2023 / Revised: 18 September 2023 / Accepted: 2 October 2023 / Published: 8 October 2023
(This article belongs to the Special Issue Fire Numerical Simulation)

Abstract

:
In the Republic of Korea, a new rocket launchpad was constructed to launch the KSLV-II on an island, and all the launchpad facilities are located in basement. Because of the complex and diverse facilities, fire accidents have increased. Using the FDS (Fire Dynamics Simulator) to predict the damage from kerosene storage and drain tank pool fires is garnering more attention as a tool of choice. The FDS supports a sprinkler model, which is needed to analyze fire extinguishing by water sprinkling. To predict and estimate the resistance of the building and thermal damage, the main analysis factors for a kerosene tank pool fire accident are temperature and HRR (heat release rate per unit volume). In 3 m 3 release cases, the maximum temperature decreased by 33% from 900 K to 600 K by sprinkled water, and the maximum HRR decreased by 70% from 20,000 kW/ m 3 to 6000 kW/ m 3 . In 10 m 3 release cases, the temperature and HRR decreased by 44%, from 800 K to 450 K and 68% from 25,000 kW/ m 3 to 8000 kW/ m 3 , respectively.

1. Introduction

Due to the significant development in aerospace and mechanical engineering technologies, aerospace industries have attracted attention. In addition to extraterrestrial explorations using rockets, many countries and industries have developed aerospace applications aimed at enhancing defense and wireless communication technologies. The Republic of Korea has also developed a rocket called the KSLV-II and attempted to launch it. The KSLV-II is a three-stage liquid propellant rocket; seven-ton level engines have already been developed and tested. Moreover, 75-ton level engines are being developed. The main rocket launchpad should be located at a low latitude region to accelerate the rocket’s velocity using the Earth’s rotation, and should not affect airplane routes. For these reasons, the KSLV-II launchpad is located at a low latitude region, but this region is an island and surrounded by trees and mountains. Additionally, the KSLV-II launchpad is located on an island and the area is smaller than other launch areas such as The Kennedy Space Center in the USA, and South Uist in the UK. Therefore, the launchpad facilities are situated below the ground in basements. The KSLV-II uses kerosene and liquified oxygen as the propellant and oxidant. Also, valves, pipes, pumps, and tanks supply fuel and oxidant to the rockets, and electronic controllers for storing and charging the fuel and oxidants are installed in the basement [1,2,3]. Additionally, due to the construction and operation of the rocket launchpad facility increasing the capabilities of space activities, various risks may occur such as property and human damage. The KSLV-II launchpad has facilities to store kerosene and oxidant for launching rockets. A rocket launchpad facility is composed of complex equipment and pool fires accidents can occur due to kerosene leaks. If the compressed or stored oxidant and fuel are dispersed or happen to leak, it may cause fire & explosion accidents. Sealed basements are more vulnerable to fire accidents than open areas, as shown by Jeon et al. [4], and fire accidents that are caused by fuel leakages account for the highest rate, more than 30% [5,6]. Accidents involving the storage and drain tank, where a significant amount of kerosene is stored, are likely to cause the most damage, as these types of storage are vulnerable to fire accidents and have more severe effects on launches. Fires are not started easily, and the following conditions must be satisfied. First, fuels are released and mixed with air or other oxidants, then, at conditions over the flash point, ignition sources must be provided. Kerosene pool fires are normally divided into a combustion and plume zone. Kerosene is heated, causing it to evaporate and mix with the incoming air, leading to combustion. Some of the heat generated from the flame is transferred through the convection and conduction to the kerosene’s surface and maintain the flame [7,8]. In rocket launchpad facilities, kerosene storage and drain tanks are constructed underground and are used for storing and charging both fuel and oxidizers. The launchpad basement should have enhanced safety regulations, but following the fire defense regulations in the Republic of Korea [9], the safety rules for the basement were formulated for living spaces, subway stations, oil storage tanks, and commercial spaces. The rules for basement research facilities and launchpad basement facilities were not specifically and empirically designed. Therefore, Jen et al. [10], indicated the need for special safety guidelines to ensure the safety of such areas and establish safety management plans.
To solve these problems, CFD (Computational Fluid Dynamics) simulations are getting more attention as useful tools. CFD simulations can predict the scale of fire accidents and damage, in addition to determining safe and vulnerable areas. Further, CFD data can be used as design criteria to enhance the safety management system. Because large fire accidents cannot be reproduced experimentally, the results predicted by CFD simulations are very important. In addition to selecting the proper scenarios, it is important to determine the analysis method and tools for analyzing through a CFD simulation. Several CFD programs that are numerically accurate are available, such as FDS, FLACS, ANSYS, and EXSIM. FDS (Fire Dynamics Simulator) is developed by NIST (National Institute of Standards and Technology) and contains various analysis tools [11,12]. FDS supports LES (large eddy simulation) and DNS (direct numerical simulation) methods.
Furthermore, FDS provides tools, such as ventilation and sprinklers, and in fire scenarios, such as pool fires and jet fires, sprinkler systems are the most commonly applied fire suppression equipment.
The sprinkler tool is not limited to the purpose of spraying liquids or water. Through sprinkler atomization, it can contribute to initial fire suppression and the removal of smoke within a fire space, alongside smothering effects and cooling effects. While it is necessary to understand the relationship between spray length, spray angle, and spray flow rate to implement sprinklers, the sprinkler tool incorporates these relationships as empirical constants [13,14,15]. If sprinklers are applied, different results are obtained. The reason for this is that sprinklers normally extinguish fires, so the fire will be suppressed quickly than in the case without sprinklers, and flame temperature or other thermal quantities will be smaller. In some cases, sprinklers accelerate vapor explosion or can be used as barriers to block heat and material transfer. Thus, the application of a sprinkler model is very important because the majority of buildings have installed sprinklers, and the results from using sprinklers are different [16].
In predicting the damage to a building from fire accidents, we use two main factors.
(1)
Temperature
(2)
HRR (heat release rate per unit volume)
This study shows the results based on pool fires scenarios and compares sprinkler effects using the FDS. We expect that these results could help establish safety standards and minimize the damage to humans and property.

2. Numerical Modeling

FDS is a computational fluid dynamics program that analyzes the range and impact of damage through fire and explosion scenarios and a mitigation system. Considering the objectives results may be necessary, validation for FDS aspects is warranted [17,18]. Therefore, in this study, through the validation approaches and an assumption model, FDS was analyzed.

2.1. Validation Approach

The risk presented in Figure 1 indicates the potential damage probability and the physical and human damage range due to workers’ exposure to toxic and flammable substances. It is utilized based on numerous variables and risk factors that can occur in fire, explosion, and toxic accidents to explain the uncertainty surrounding the occurrence of a specific accident. The FDS used in this study is a result analysis program that effectively simulates fire, explosion, and leakage phenomena based on various modules [19]. It quantitatively analyzes and evaluates incidents by visualizing and quantifying the extent and severity of human and property damage through the analysis of parameters such as radiative heat intensity, toxic gas concentration and distribution, and heat release rate size, according to accident scenarios [20,21].
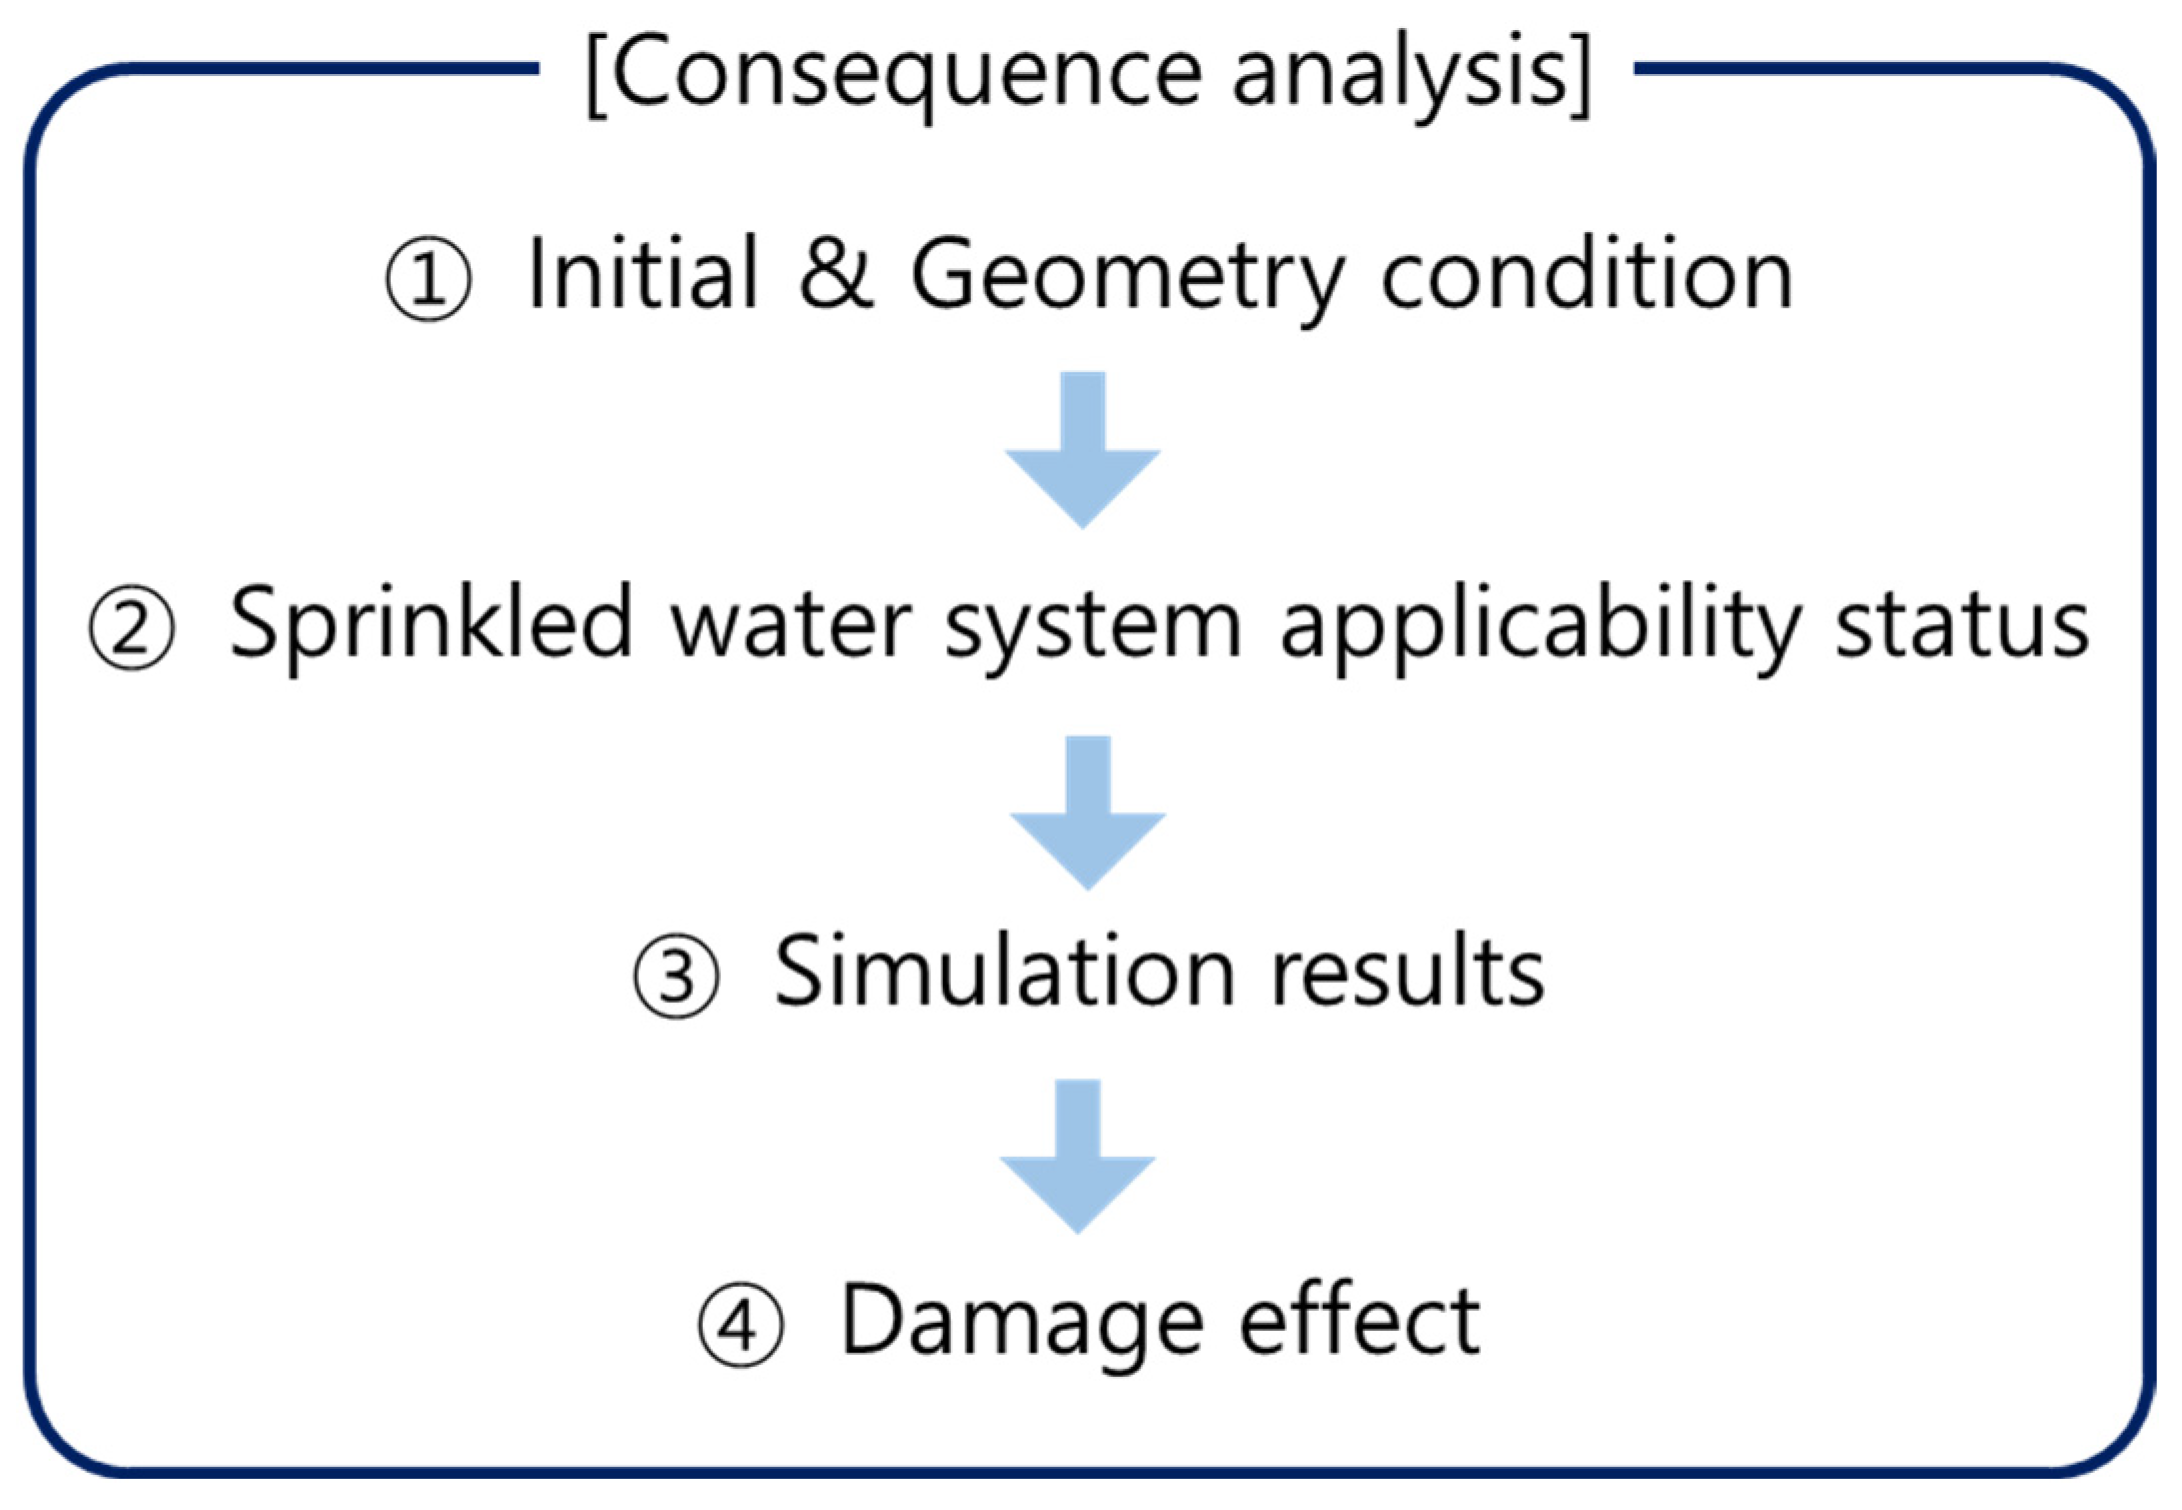
Consequence analysis using FDS focused on the temperature and heat release rate due to the pool fire in the kerosene storage and drain tank, and confirmed the damage mitigation through the sprinkled water system. Figure 2 illustrates the scheme for the consequence analysis.
The first part consisted of setting up the initial conditions and geometry for the kerosene storage and drain tank pool fire for 3D FDS simulation. In the second part, simulations were conducted by categorizing scenarios of a kerosene tank pool fire into those with and without the application of the damage mitigation system, specifically, the sprinkler system. In the third part, provided simulations confirmed the mitigation effects based on the temperature and heat release rate, considering the sprinkler water system. Finally, the study performed the impact of damage on the rocket launchpad basement facility.

2.2. Hydrodynamic and Combustion Model

FDS solves the Navier–Stokes equations for the analysis of smoke dispersion, heat transport and ventilation in low Mach number flow conditions. In turbulence analysis cases, LES (large eddy simulation) and DNS (direct numerical simulation) are used. LES computes more swiftly than DNS, but depending on the grid size, some turbulences are not computed or predicted. DNS uses small sized grids, so it needs more calculation time than LES, but due to a large number of grids, it can compute small eddies and numerical accuracies. The numerically correct results do not mean real results. However, the numerically correct results computed through precise assumption are reliable. NIST recommends the LES model to analyze large scale cases [22].
For solving the combustion characteristics, FDS uses a combustion model based on the mixture fraction concept [11]. A mixture means that fuels or inflammable materials are well blended with oxidants. The mixing ratio is calculated by oxidant mole fraction and fuel mole fraction if the liquid and solid fuels require diffusion rates and heat of vaporization. In particular, pool fires occur on the surface of a flammable liquid and are influenced by surface evaporation rate, surface temperature distribution, flame height, and flame tilt due to wind. In the FDS pool fire combustion model, it assumes a quiescent state without considering convection caused by temperature differences within the internal liquid. The amount of fuel evaporating at any arbitrary time is calculated using the Stefan diffusion model [23,24].
m ˙ F = ρ min Y ~ F , Y ~ O 2 / s τ m i x

2.3. Governing Equations

Governing equations are fundamental equations that are the basis of the FDS analysis qualitatively and quantitatively. These equations indicate what physical and thermodynamic laws must be applied to the scenarios. Therefore, understanding the governing equations is important to analyze fire accidents using FDS. There are three main equations existed to analyze fire accidents using FDS.
Conversation of mass
ρ t + · ρ u = 0
Conservation of momentum
t ( ρ u ) + · ( ρ u u ) = ρ g + f o u t + · σ i j
Conservation of Energy
t ( ρ u ) + · ρ h u = D p D t + q ˙ H q ˙ e · q ˙ c + u · σ i j
Large-eddy simulation (LES) model
ρ D u D t · u = ρ D u 2 / 2 D t = ρ f o u t · u p · u + · σ i j · u u · σ i j
μ L E S = ρ ( C s ) 2 ( u · σ i j ) 1 2
k L E S = μ L E S C p P r t
( ρ D ) l , L E S = μ L E S S C t

2.4. Sprinkle Model

Fire can be separated into five classes, such as A, B, C, D, F or K, according to the combustion characteristics in the Republic of Korea, but each country has a slightly different marking scheme. Flammable liquids that cause pool fires, such as kerosene and gasoline, are labelled as class B. Class B pool fires should be put out using a CO2 foam extinguisher [25]. However, a basement region or subway station where smoke and heat are easily stacked cannot be as easily extinguished. To solve this problem, a sprinkled water extinguishing system is an effective method [22,25,26]. Sprinkled water extinguishing systems can promptly decrease surface temperature, lessen the spread of a pool fire, and/or cool the temperature of smoke, thus easily decreasing overpressure caused by the high temperature of smoke. Therefore, in order to rapidly extinguish and minimize the generation of smoke from a kerosene pool fire at the rocket launchpad basement facility, this study performed the FDS using the FDS’ sprinkled water system operation model and fire suppression mode to measure cooling effects and performance [25,27,28,29,30,31]. The following equations summarize the sprinkler response equation and the fire suppression equation through sprinkler activation.
Activation equation
d T l d t = u R T I ( T g T l ) C R T I ( T l T m ) C 2 R T I β u
Fire suppression equation
Q ˙ = Q ˙ 0 e k ( t t 0 )
k = 0.716 m ˙ w 0.0131

3. Analysis Factors

Temperature and HRR (heat release rate per unit volume) are the primary factors that damage buildings and are directly related to the failure of buildings and death. The plume produced by the pool fire includes flame, soot and smoke, and the HRR indicates the size of fire and amount of heat. Each material has a different resistance to thermal damage, distinct failure temperature and heat. If the plumes that caused the pool fire accident are retained for a long time, the total heat per unit volume of the plumes will increase due to their increasing temperature. Then, when the distinct failure temperature and heat resistance are exceeded, the building structure will be destroyed by thermal damage [22,25,26,32]. Through HRR and temperature changes, we can predict and estimate the resistance of the building and thermal damage. The fire risk is determined by a combination of factors, including combustibility, the amount of heat released during combustion, heat release rate, flame spread, and smoke. The heat release rate determines the intensity of the fire, and has an important role in controlling fire hazards [33]. Fire risk predicts the evacuation safety throughout a tall building. Therefore, it is essential to input the heat release rate. Additionally, since temperature and heat release rate have a close relationship where the heat release rate decreases as the temperature decreases, it is considered reasonable to perform an analysis factor involving temperature and heat release rate in this study [23,24,33].

4. Consequence Analysis Simulation Definitions

The kerosene storage and drain tanks, which are highly likely to cause pool fires due to leakages from tank crack formation, tank breaking, etc., were selected as the scenarios in the rocket launchpad facility. Therefore, in the scenario of a pool fire at the rocket launchpad basement facility, this study selected the kerosene storage and drain tank. The damage impact of a kerosene storage and a drain tank pool fire is compared according to the sprinkler operation based on the worst-case. The volume of the kerosene storage tank is 70 m 3 and the drain tank volume is 3 m 3 . The first scenario simulates a break in the kerosene storage tank, and thus, kerosene is released. Since the kerosene storage tank room has an overflow block barrier and drainage holes, if the entire volume of kerosene is spilled, just 10 m 3 of fuels would exist in the storage room and the remnant would be removed by drain holes. Due to the entire volume of the fuels spilled, since the volume of kerosene is less than 10 m 3 , all would leak without drainage.The second scenario simulates a break in the drain tank, and thus all the stored fuels are released.
The scenarios are as follows.
(1)
3 m 3 of kerosene released without sprinkler
(2)
3 m 3 of kerosene released with sprinkler
(3)
10 m 3 of kerosene released without sprinkler
(4)
10 m 3 of kerosene released with sprinkler
For analyzing kerosene pool fire accidents using FDS, this study examines the properties of kerosene such as molecular weight, density, heat of combustion, specific heat and so on. A kerosene pool fire could be easily analyzed using a simple chemistry model with a C/H ratio [11] to accurately assess the kerosene pool fire results. Therefore, kerosene pool fire simulations were conducted using the FDS based on the Table 1 and Table 2 [34,35,36,37].
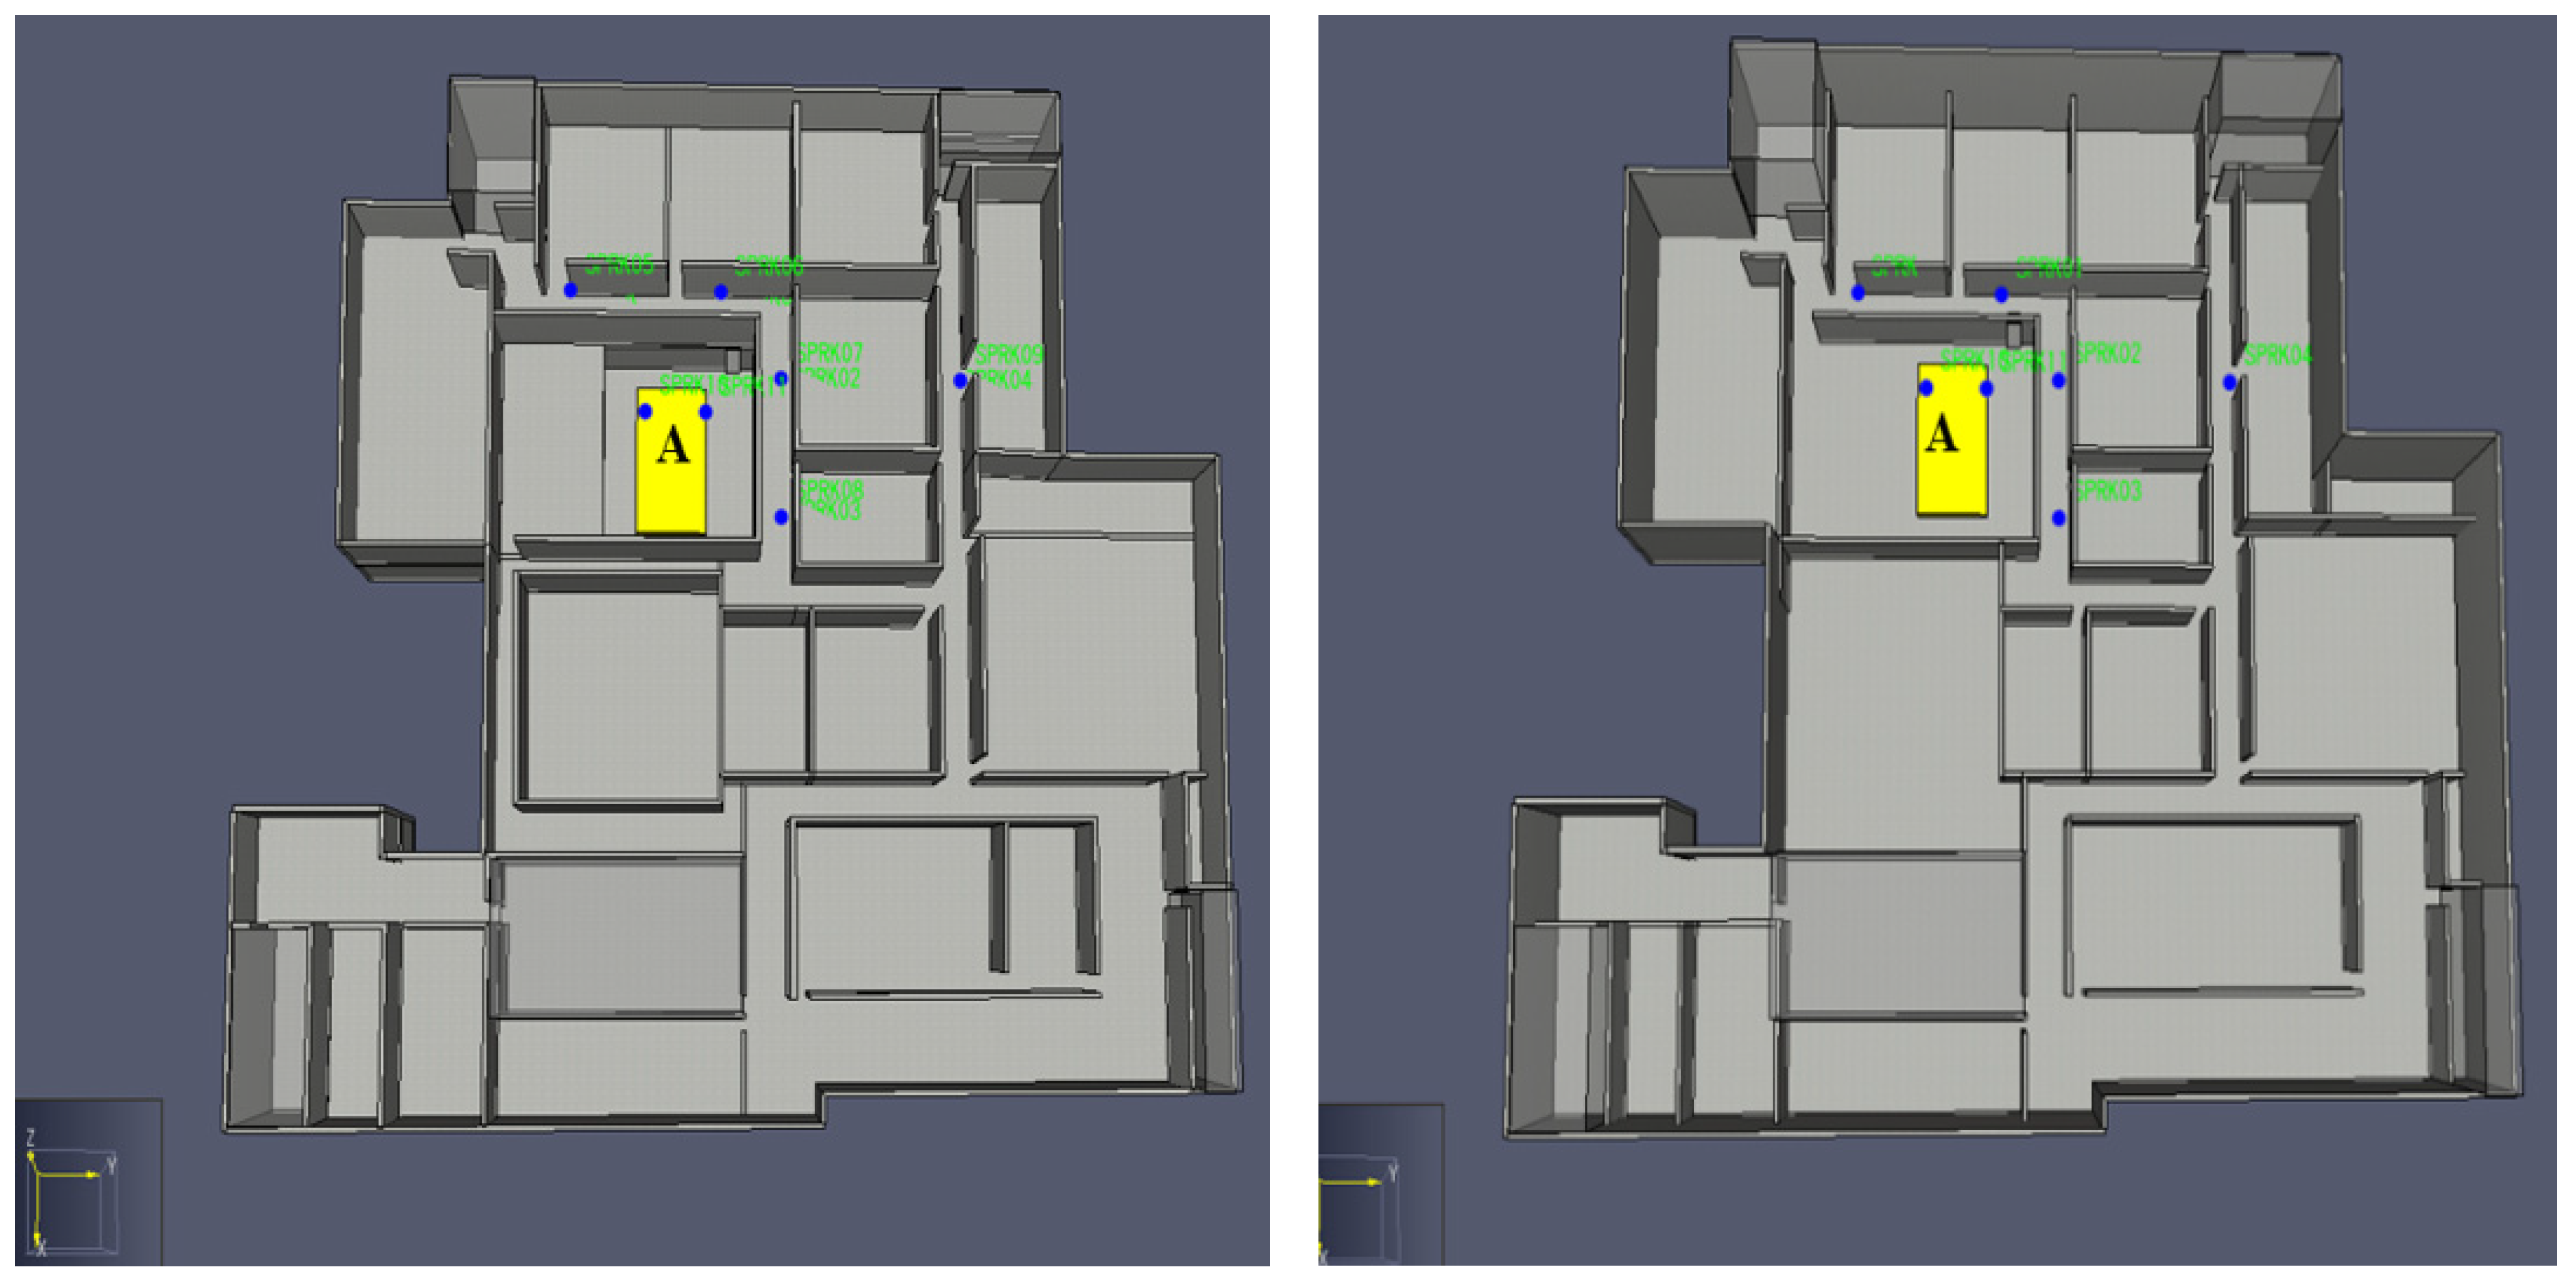
Also, for the analysis of FDS pool fire 3D results, geometry has been applied and modeling has been performed based on the location of the kerosene storage and drain tank. In Figure 1, B2 is the second basement floor and B1 is the first basement floor. The kerosene storage tank is located at A. The yellow box is the released kerosene pool, and the blue points represent the location of sprinklers. In the results page, the yellow box will be shown, but it is not a computational error and just means a kerosene pool. The room area is 218.96 m 2 and volume is 2300 m 3 . In B2, two doors exist in the storage tank room, and one door exists in B1, therefore, fire and smoke could be diffused to adjacent corridors. The thickness of each wall is 0.25 m and consists of concrete. Sprinklers are equipped on the ceiling and ventilation systems are installed. The room contains the storage and drain tank, and the kerosene storage tank volume is 70 m 3 and the drain tank volume is 3 m 3 . The whole building height is 16.5 m and it is assumed that the lowest location is 0 m. Thus, B2’s floor is 5.5 m and B1’s floor is 11 m. Finally, for the sprinkler system, water spray was used with the following settings: sprinkler activation temperature of 74 degrees, velocity of 5, flow rate of 80, and a height of 10.5, and simulations were conducted.

5. Simulation Results

5.1. 3   m 3 of Kerosene Released without Sprinkler

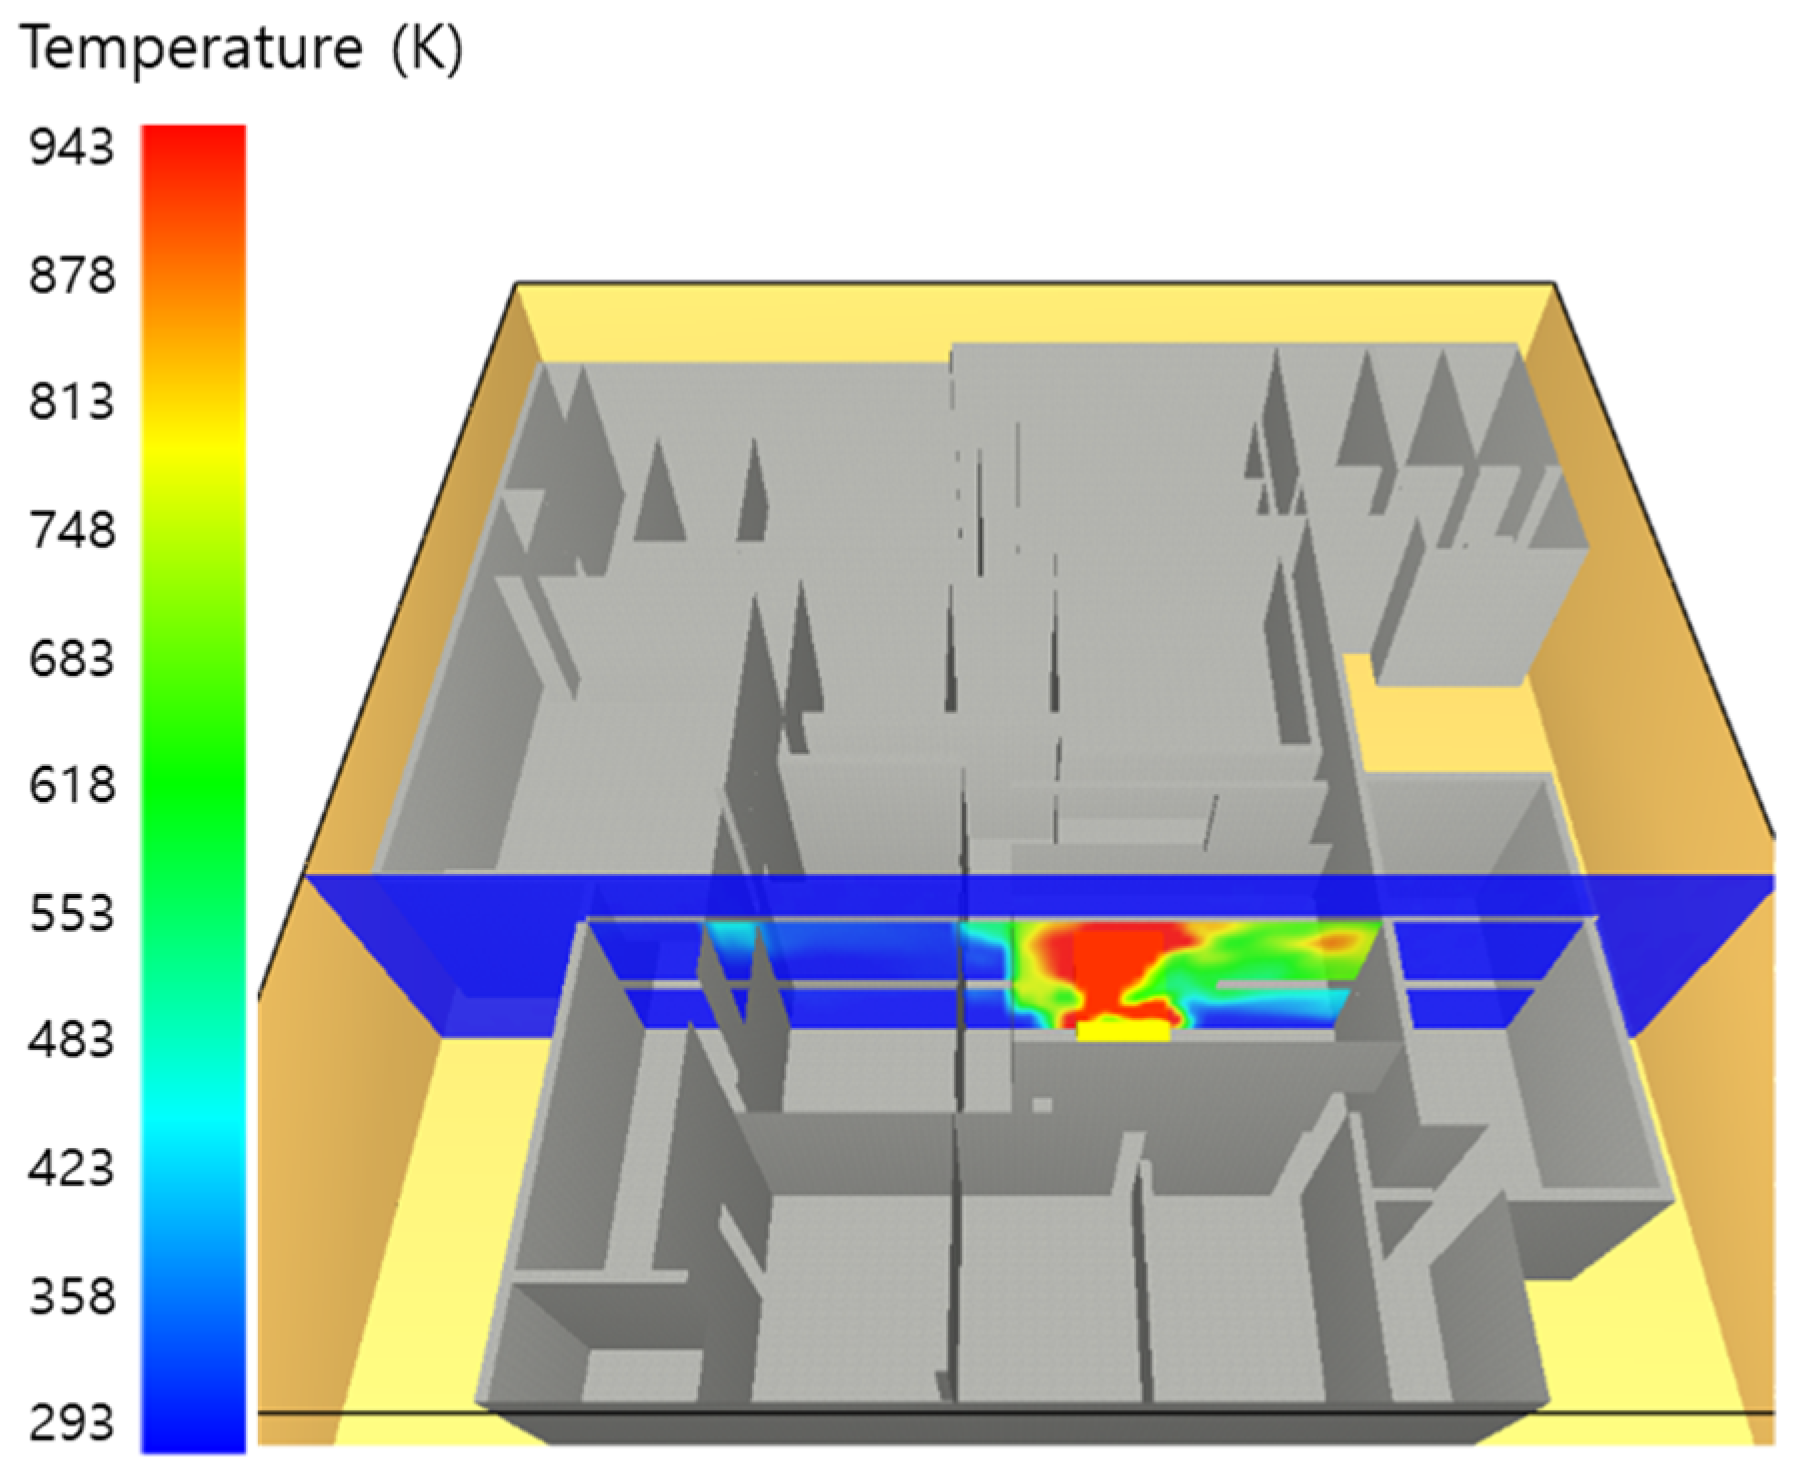
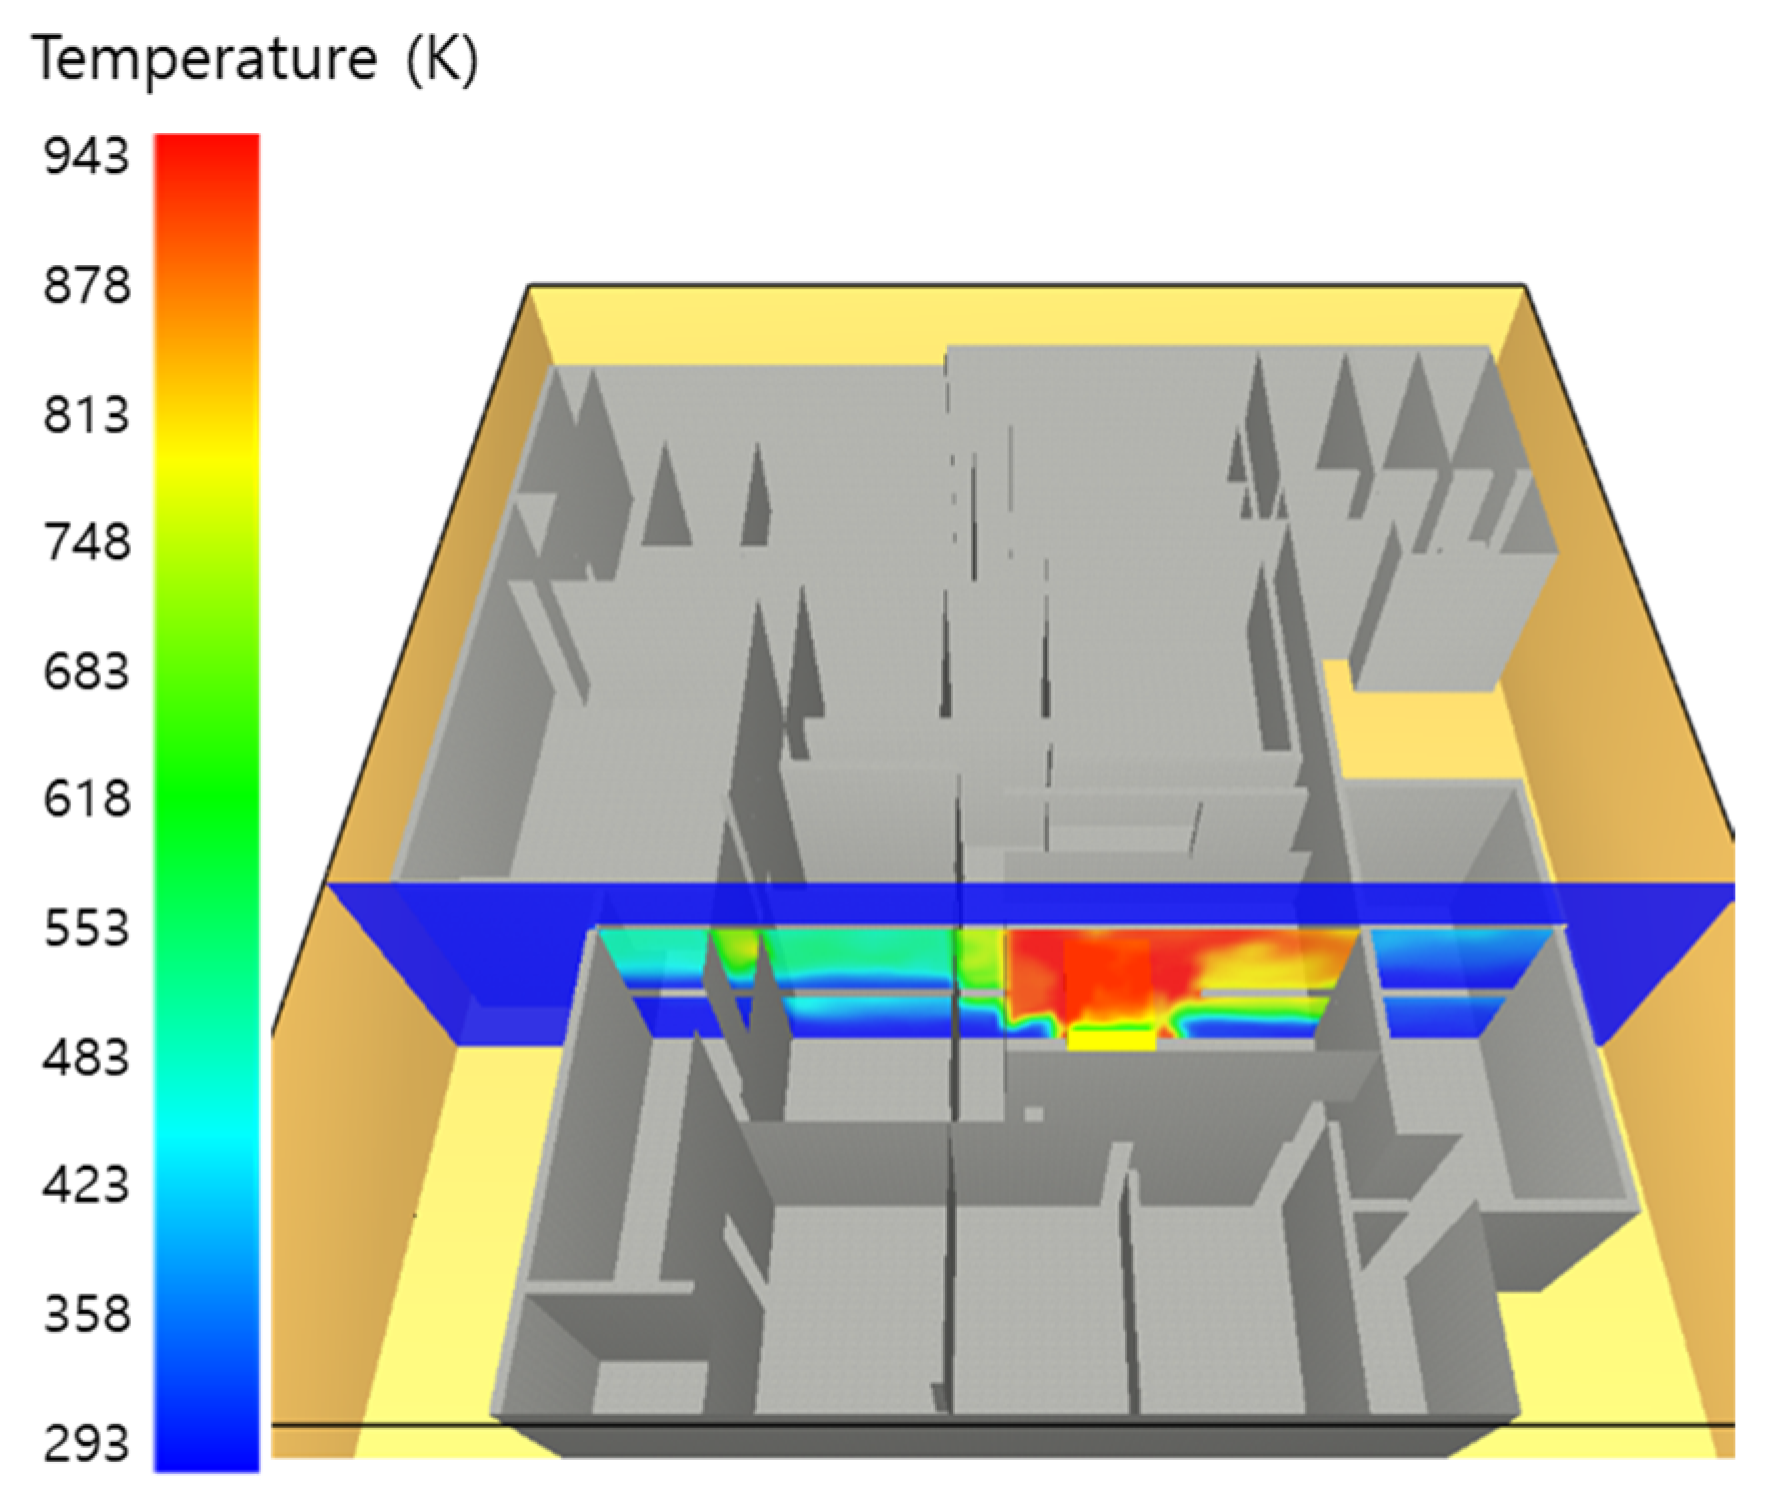
To easier understand the results, we should recognize the X, Y, and Z coordinates. The X axis is vertical, the Y axis is horizontal, and the Z axis is the height of floors. For example, in Figure 3, the coordinates of the kerosene pool are X = 12 m, Y = 20 m, and Z = 5.5 m, and that location is marked as A. Figure 4 and Figure 5 show the kerosene storage room temperature after 60 s and 120 s, and X is 12 m, which means the center of the kerosene pool. After 60 s, the plumes recorded over 940 K as the maximum temperature and at 120 s as the ambient temperature had increased up to 900 K.
Figure 6 and Figure 7 show the kerosene storage room temperature after 60 s and 220 s, and Z is 6.5 m (B2 bottom height is 5.5 m). After 60 s, the hottest plumes are detected, and through adjacent corridors, plumes are dispersed to 3 o’clock and 6 o’clock directions. After 220 s, the plumes are dispersed in the 12 o’clock direction. The plumes are hotter than the ambient air, therefore, they rise due to convection because the XY plane temperature range is 600–900 K, and the YZ plane temperature range is 400–600 K.
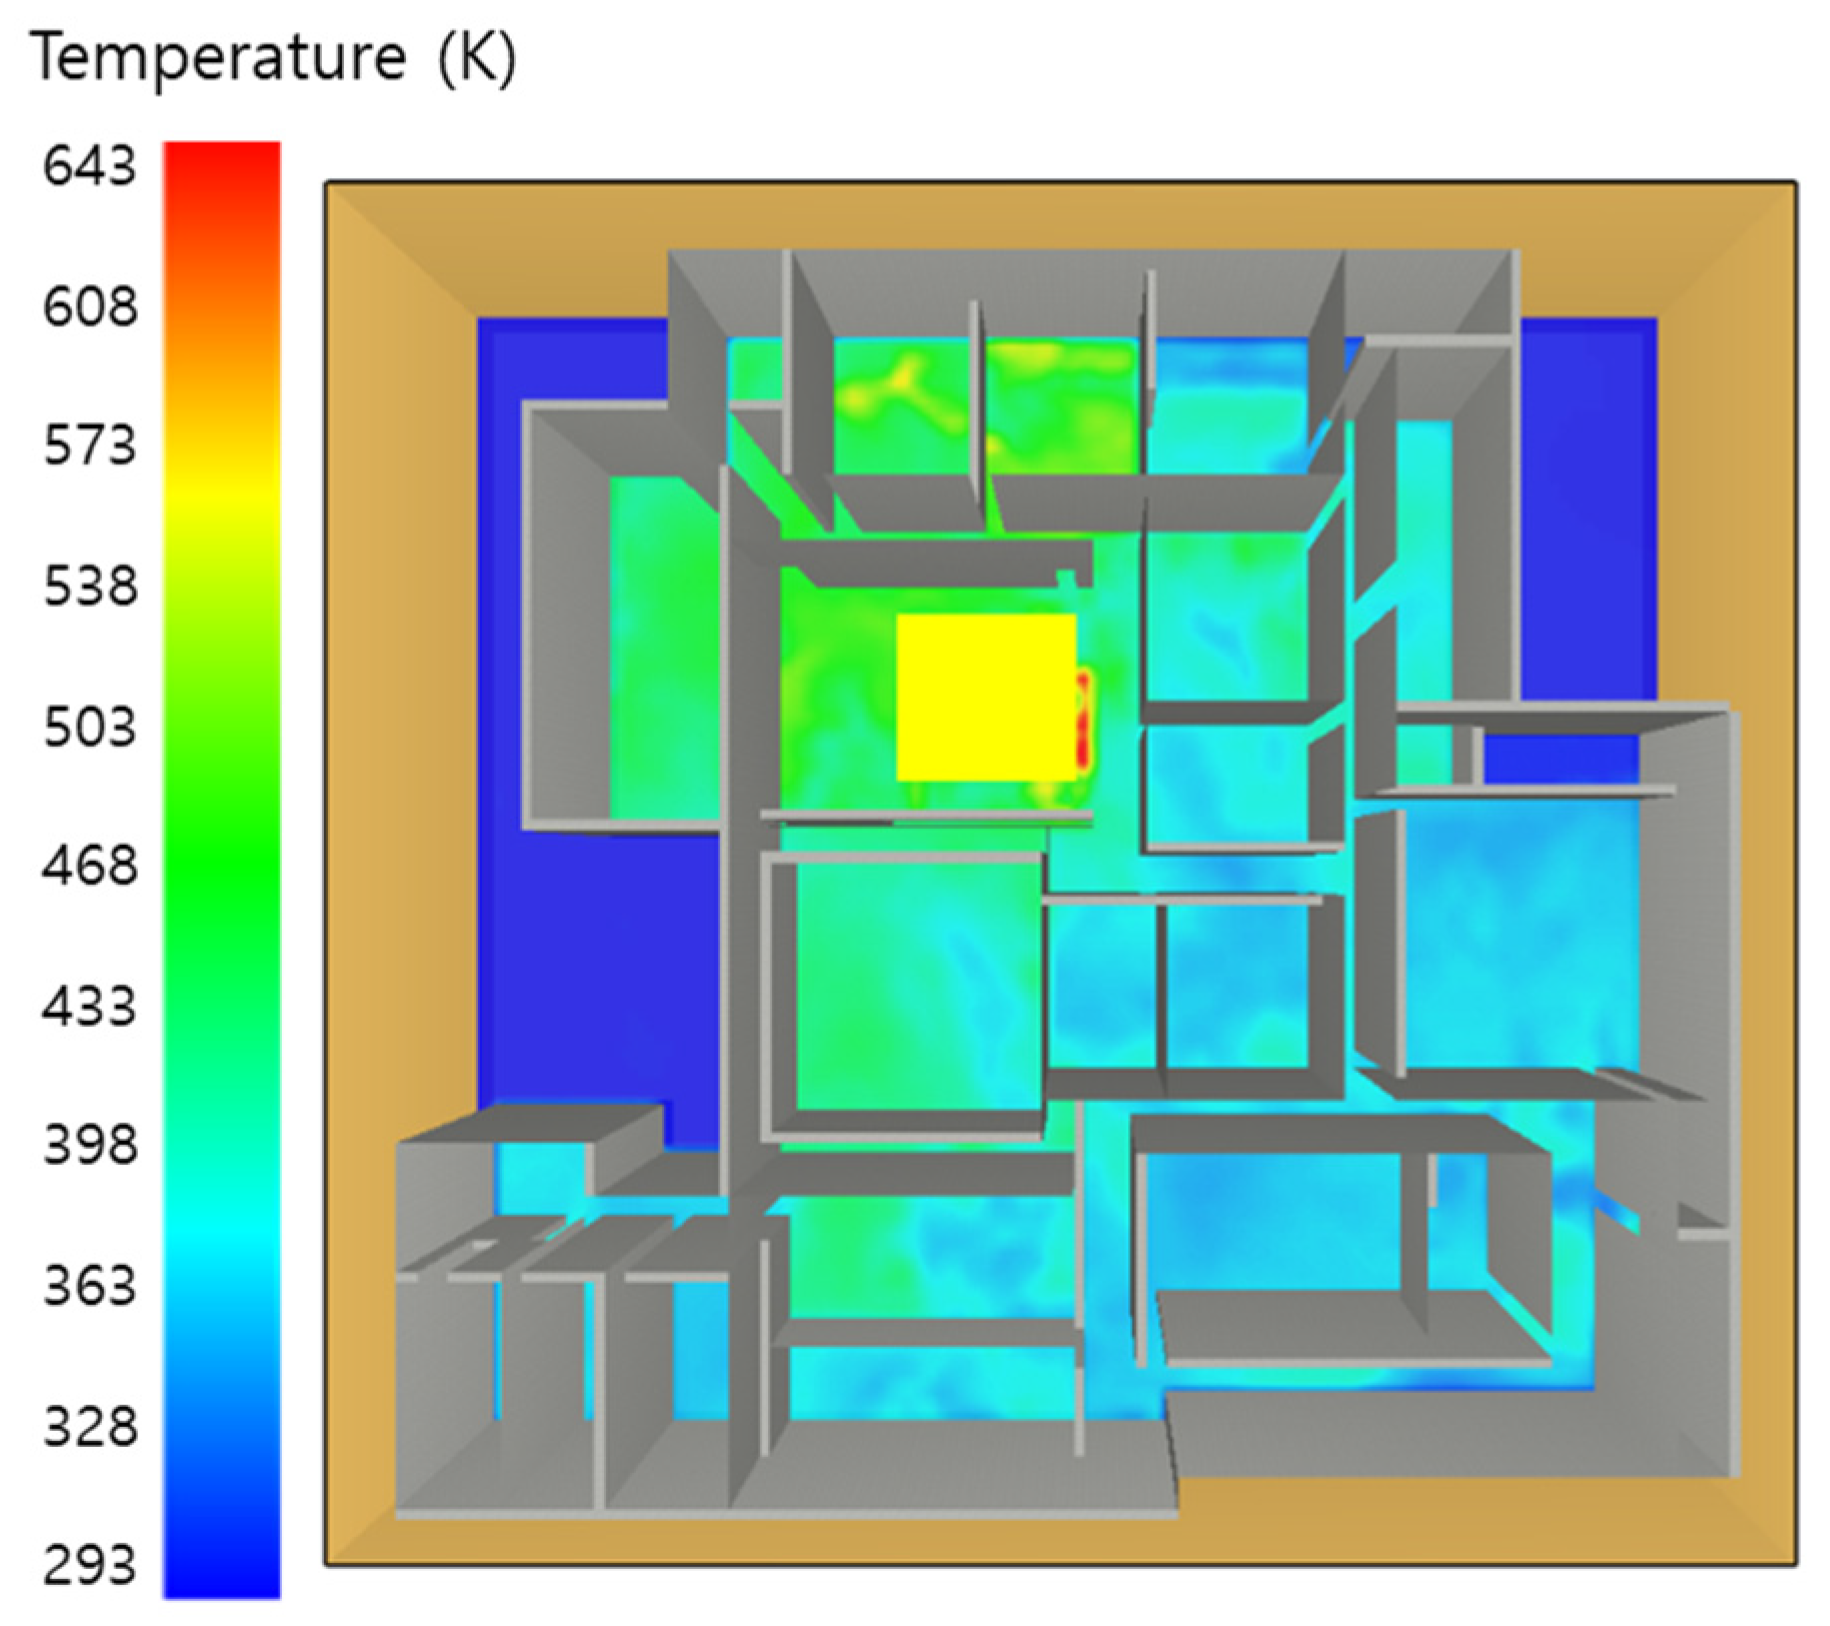
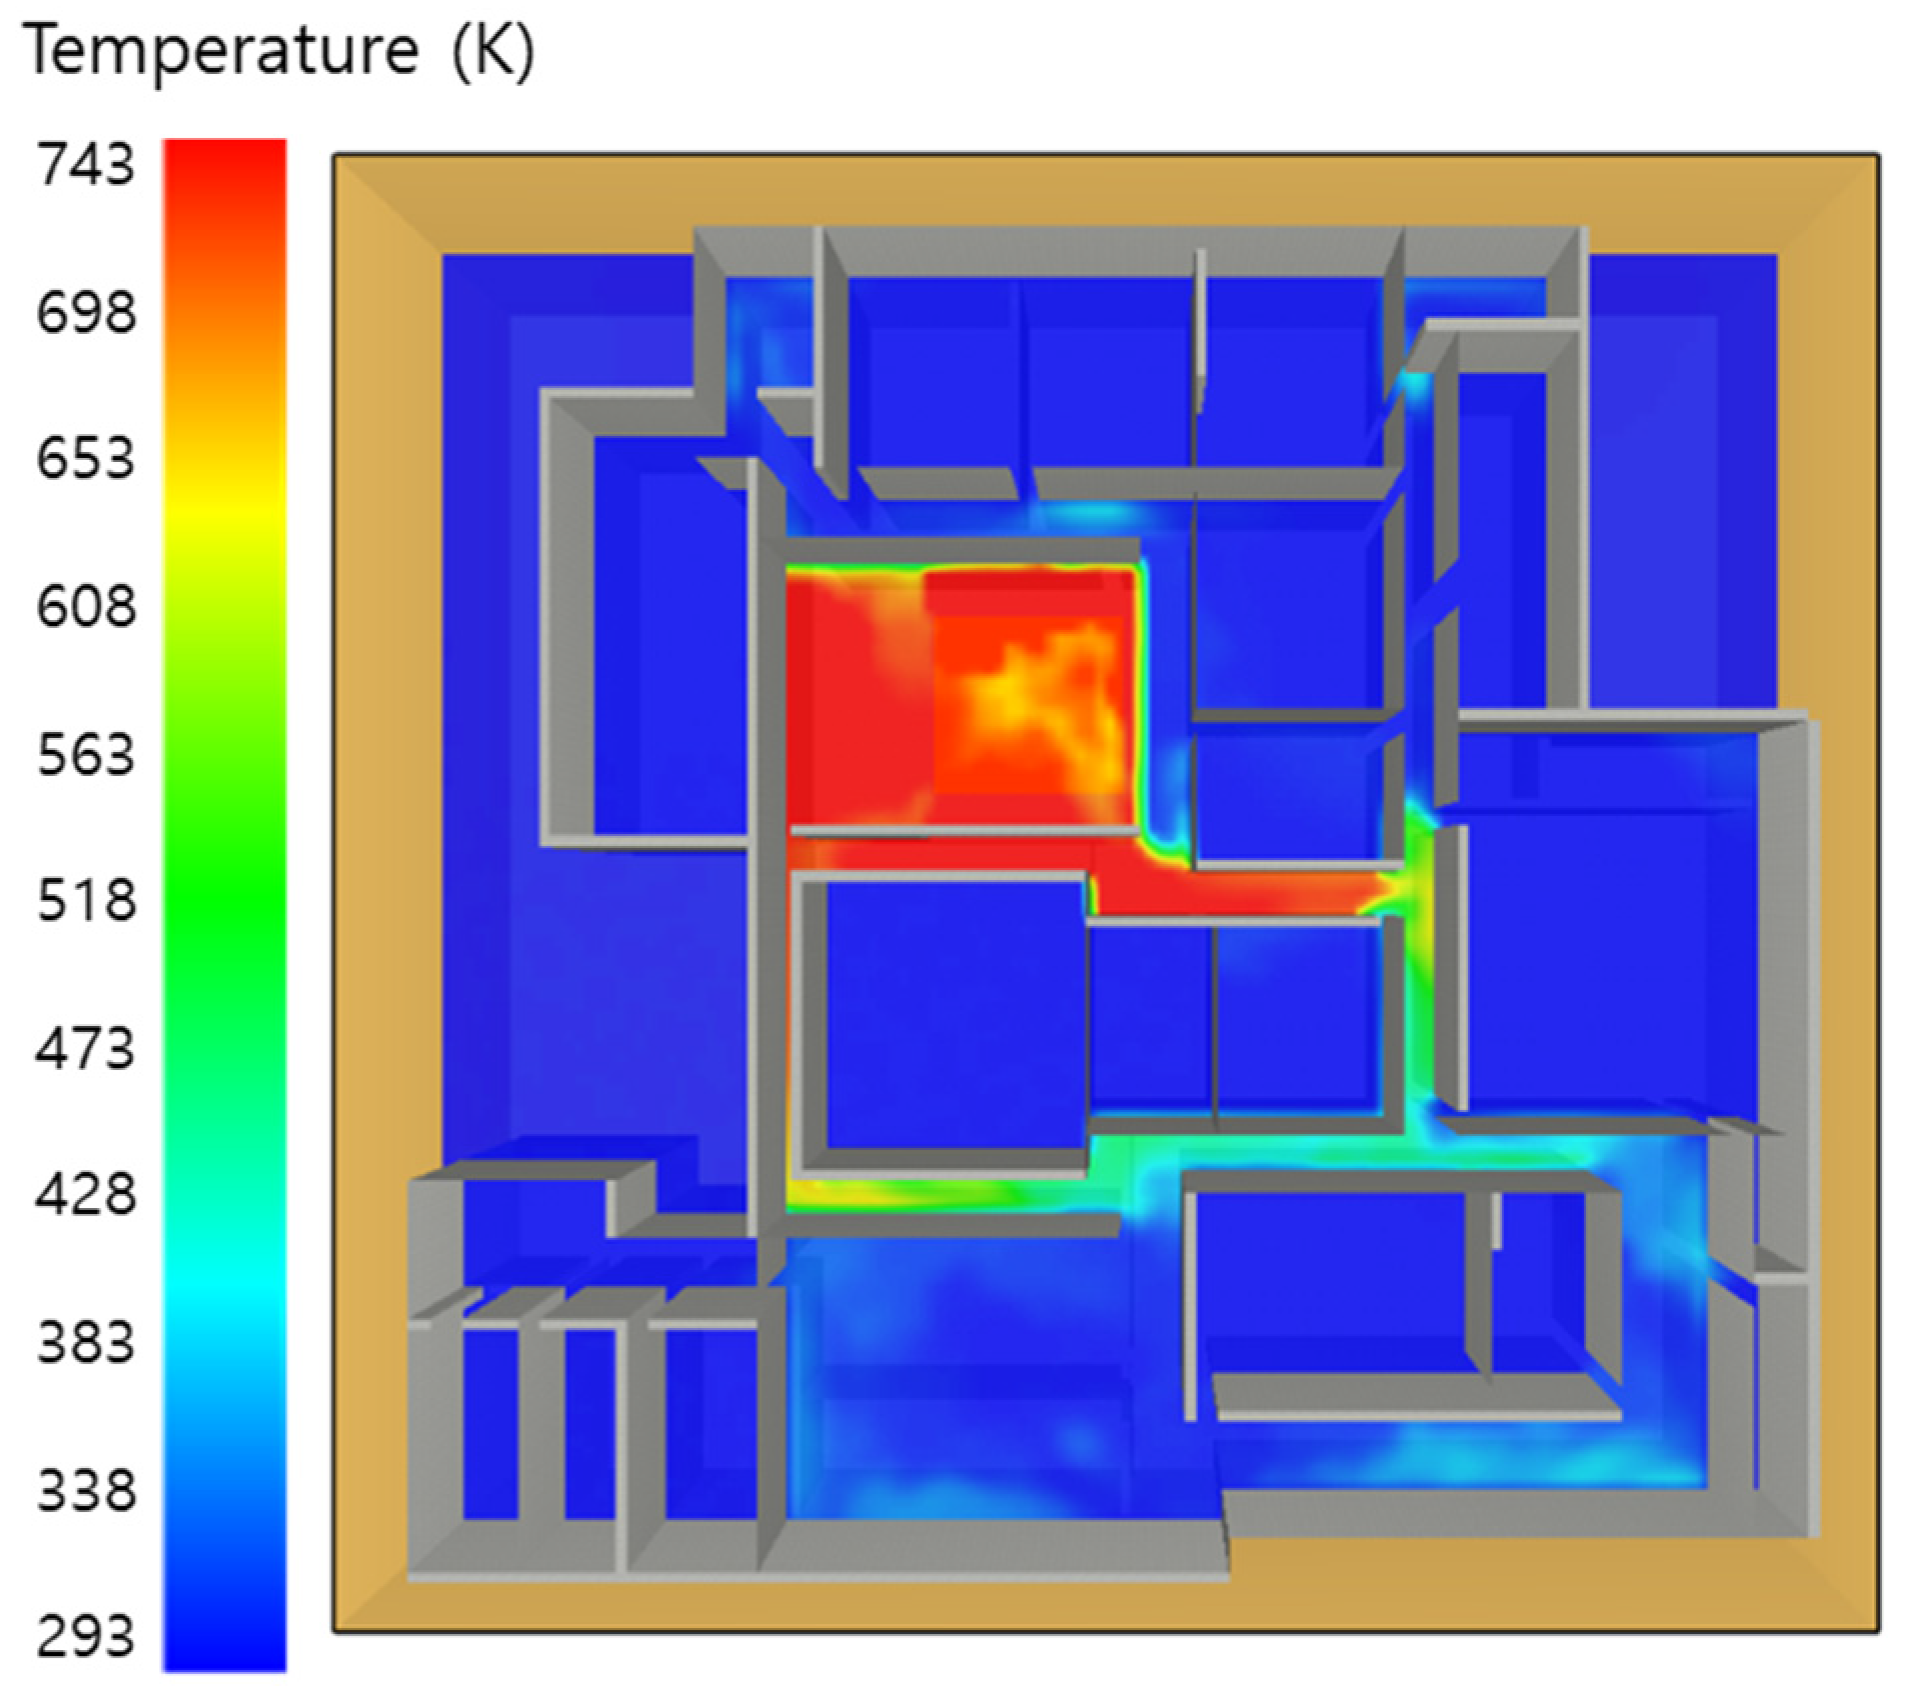
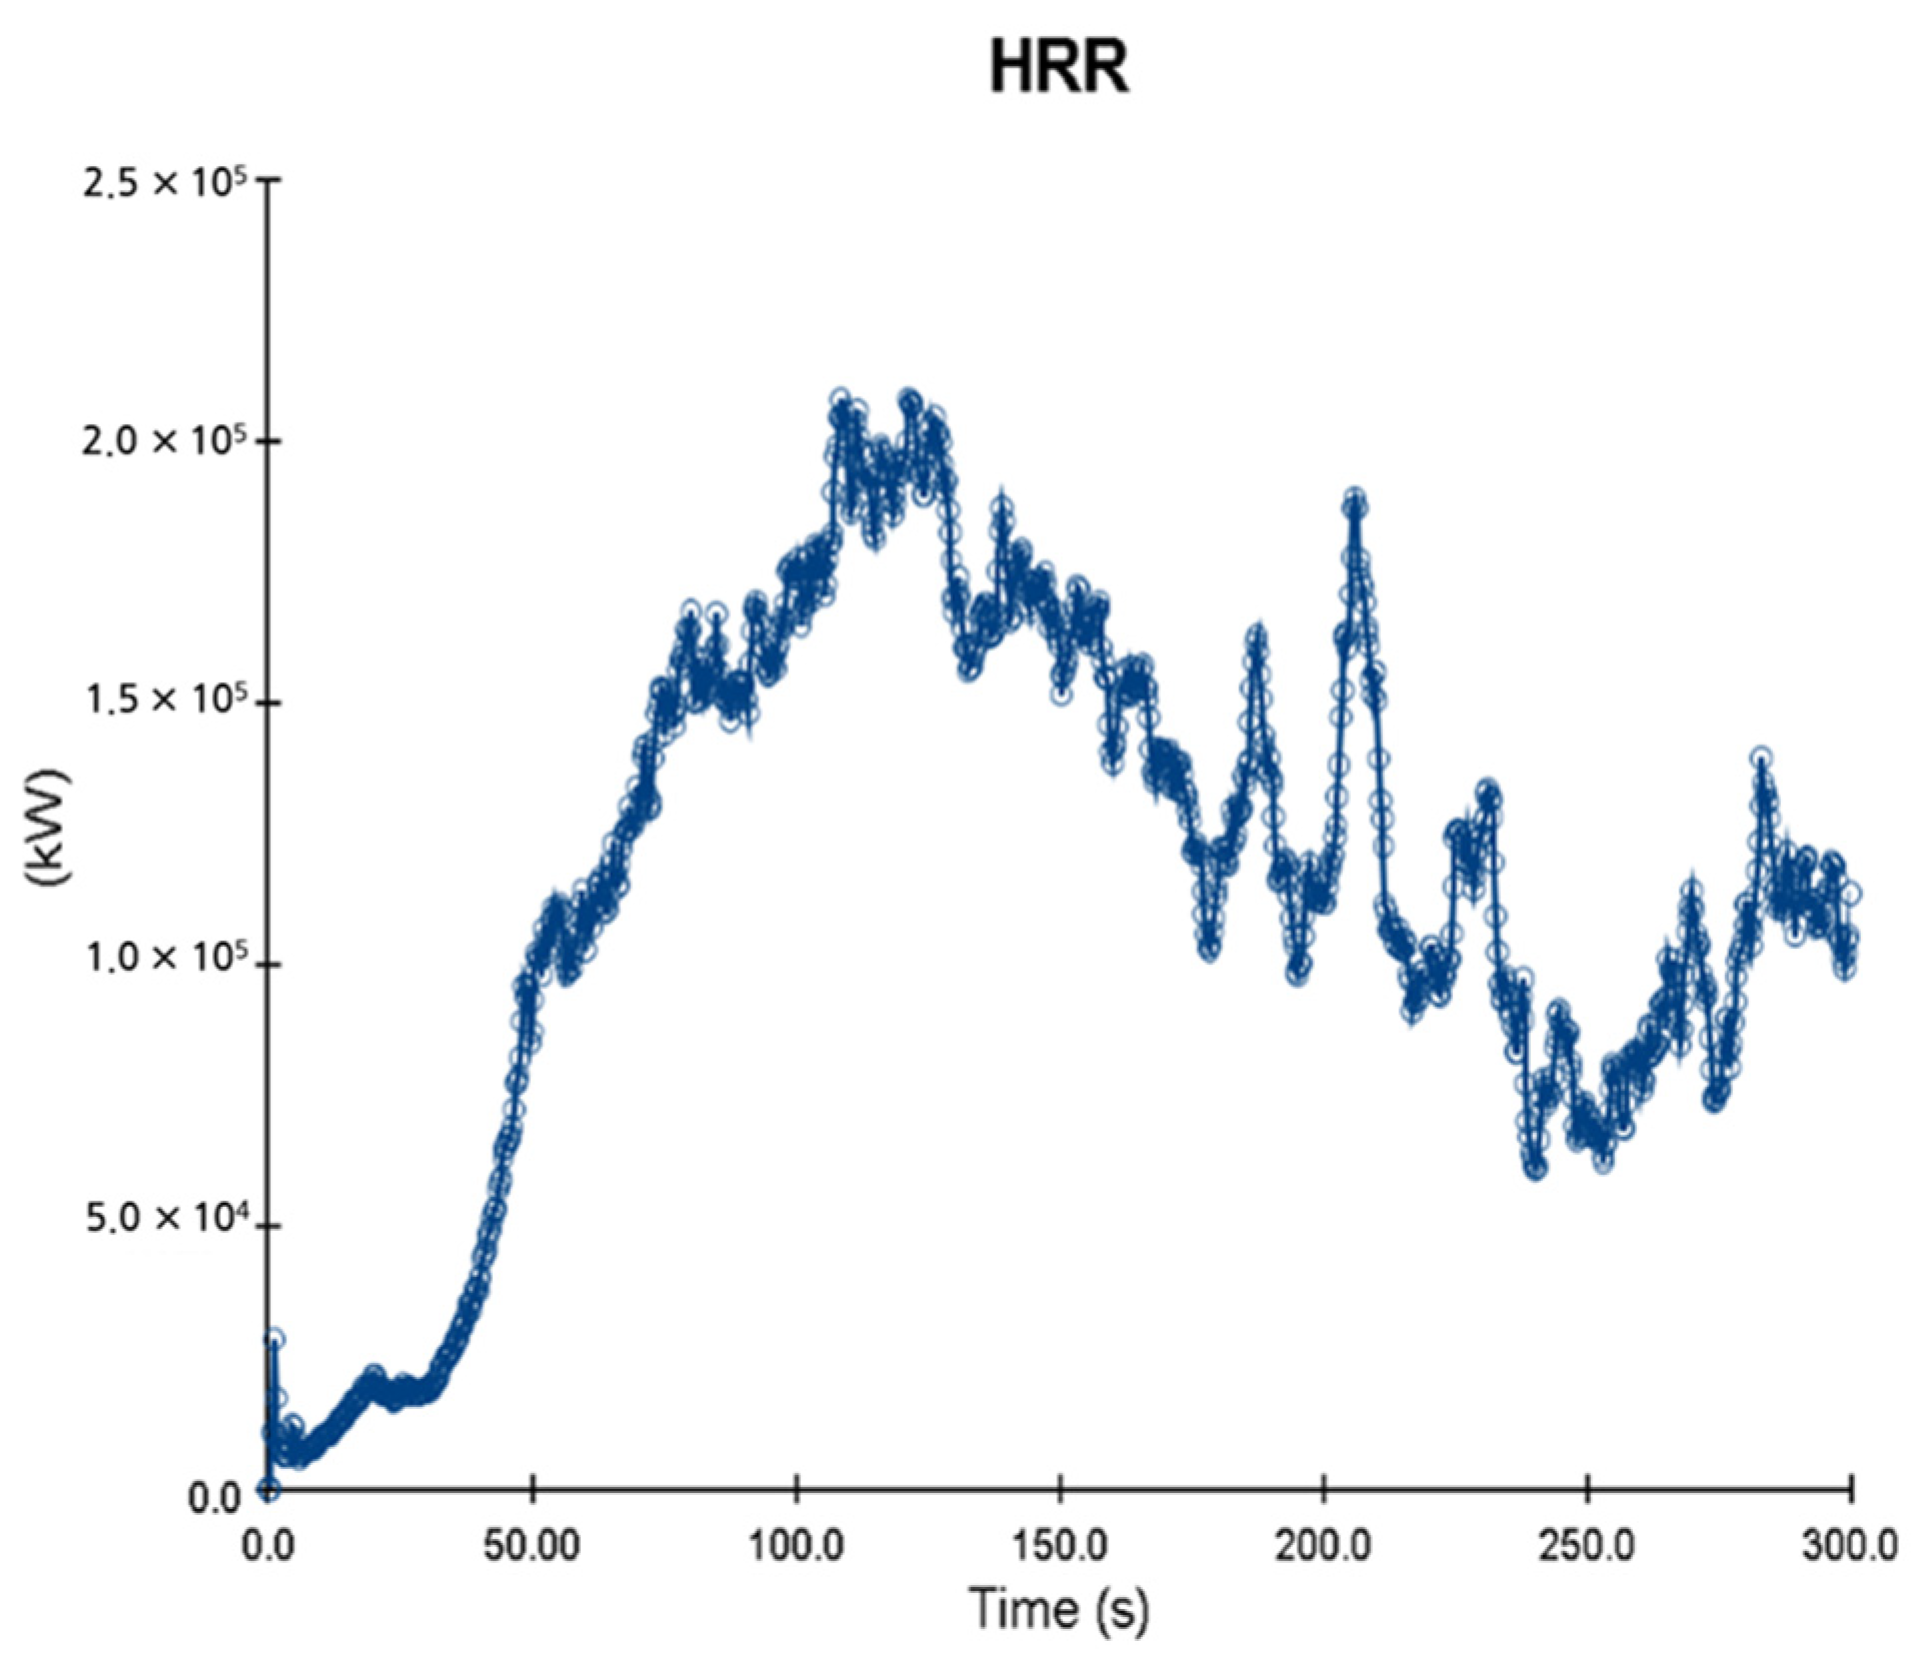
Figure 8 and Figure 9 show the kerosene storage room temperature after 120 s and 220 s, and the Z coordinate is 11.5 m (B1 bottom height is 10.5 m). The pool fire plumes produced at B2 dispersed to B1, and after 120 s, the storage room temperatures increased up to 840 K and the plumes dispersed through the adjacent 3 o’clock and 6 o’clock directional corridors. A vortex was generated by the corridor in the 6 o’clock direction at 120 s, which does not adjoin to the kerosene storage room; therefore, the plume’s retention time is longer than that of the rooms and corridors. After 220 s, due to the vortex, the ambient room temperature increased up to 400 K. As the building is located under the ground, air does not supply sufficiently. Therefore, incomplete combustion occurs, and the plumes’ temperatures dropped to 400–700 K. Figure 10 shows the total HRR. At 50 s, by evaporated kerosene, the burn rate accelerated, which caused a dramatic increase in the HRR. At 120–150 s, the maximum HRR is 20,000 kW/m3 and, due to the lack of air, the HRR decreased.

5.2. 3   m 3 of Kerosene Is Released with Sprinkler

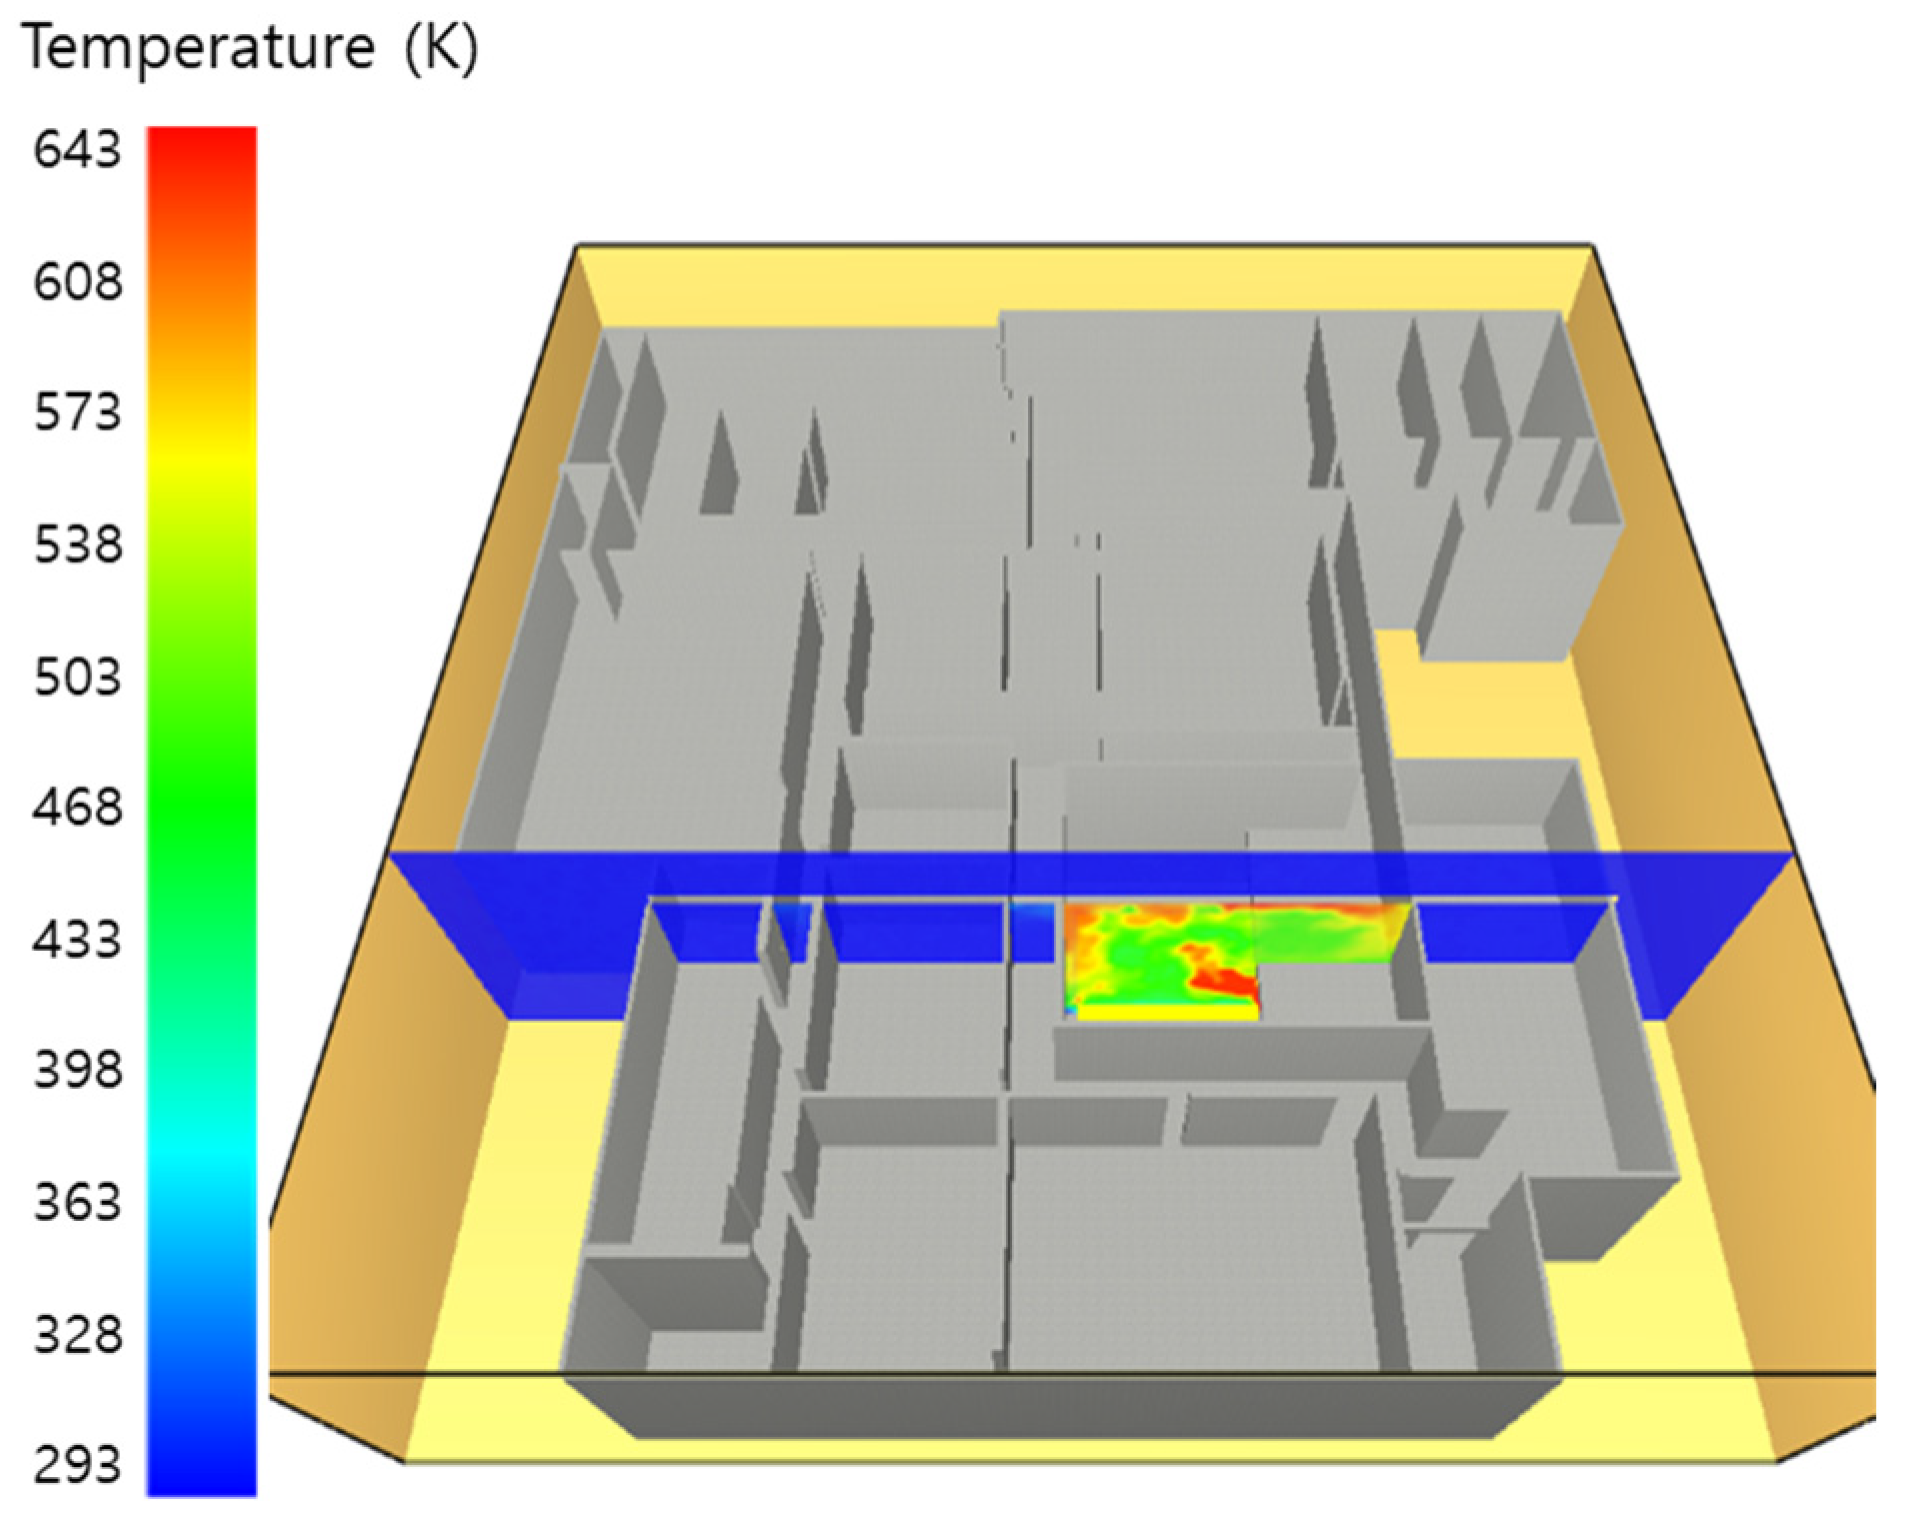
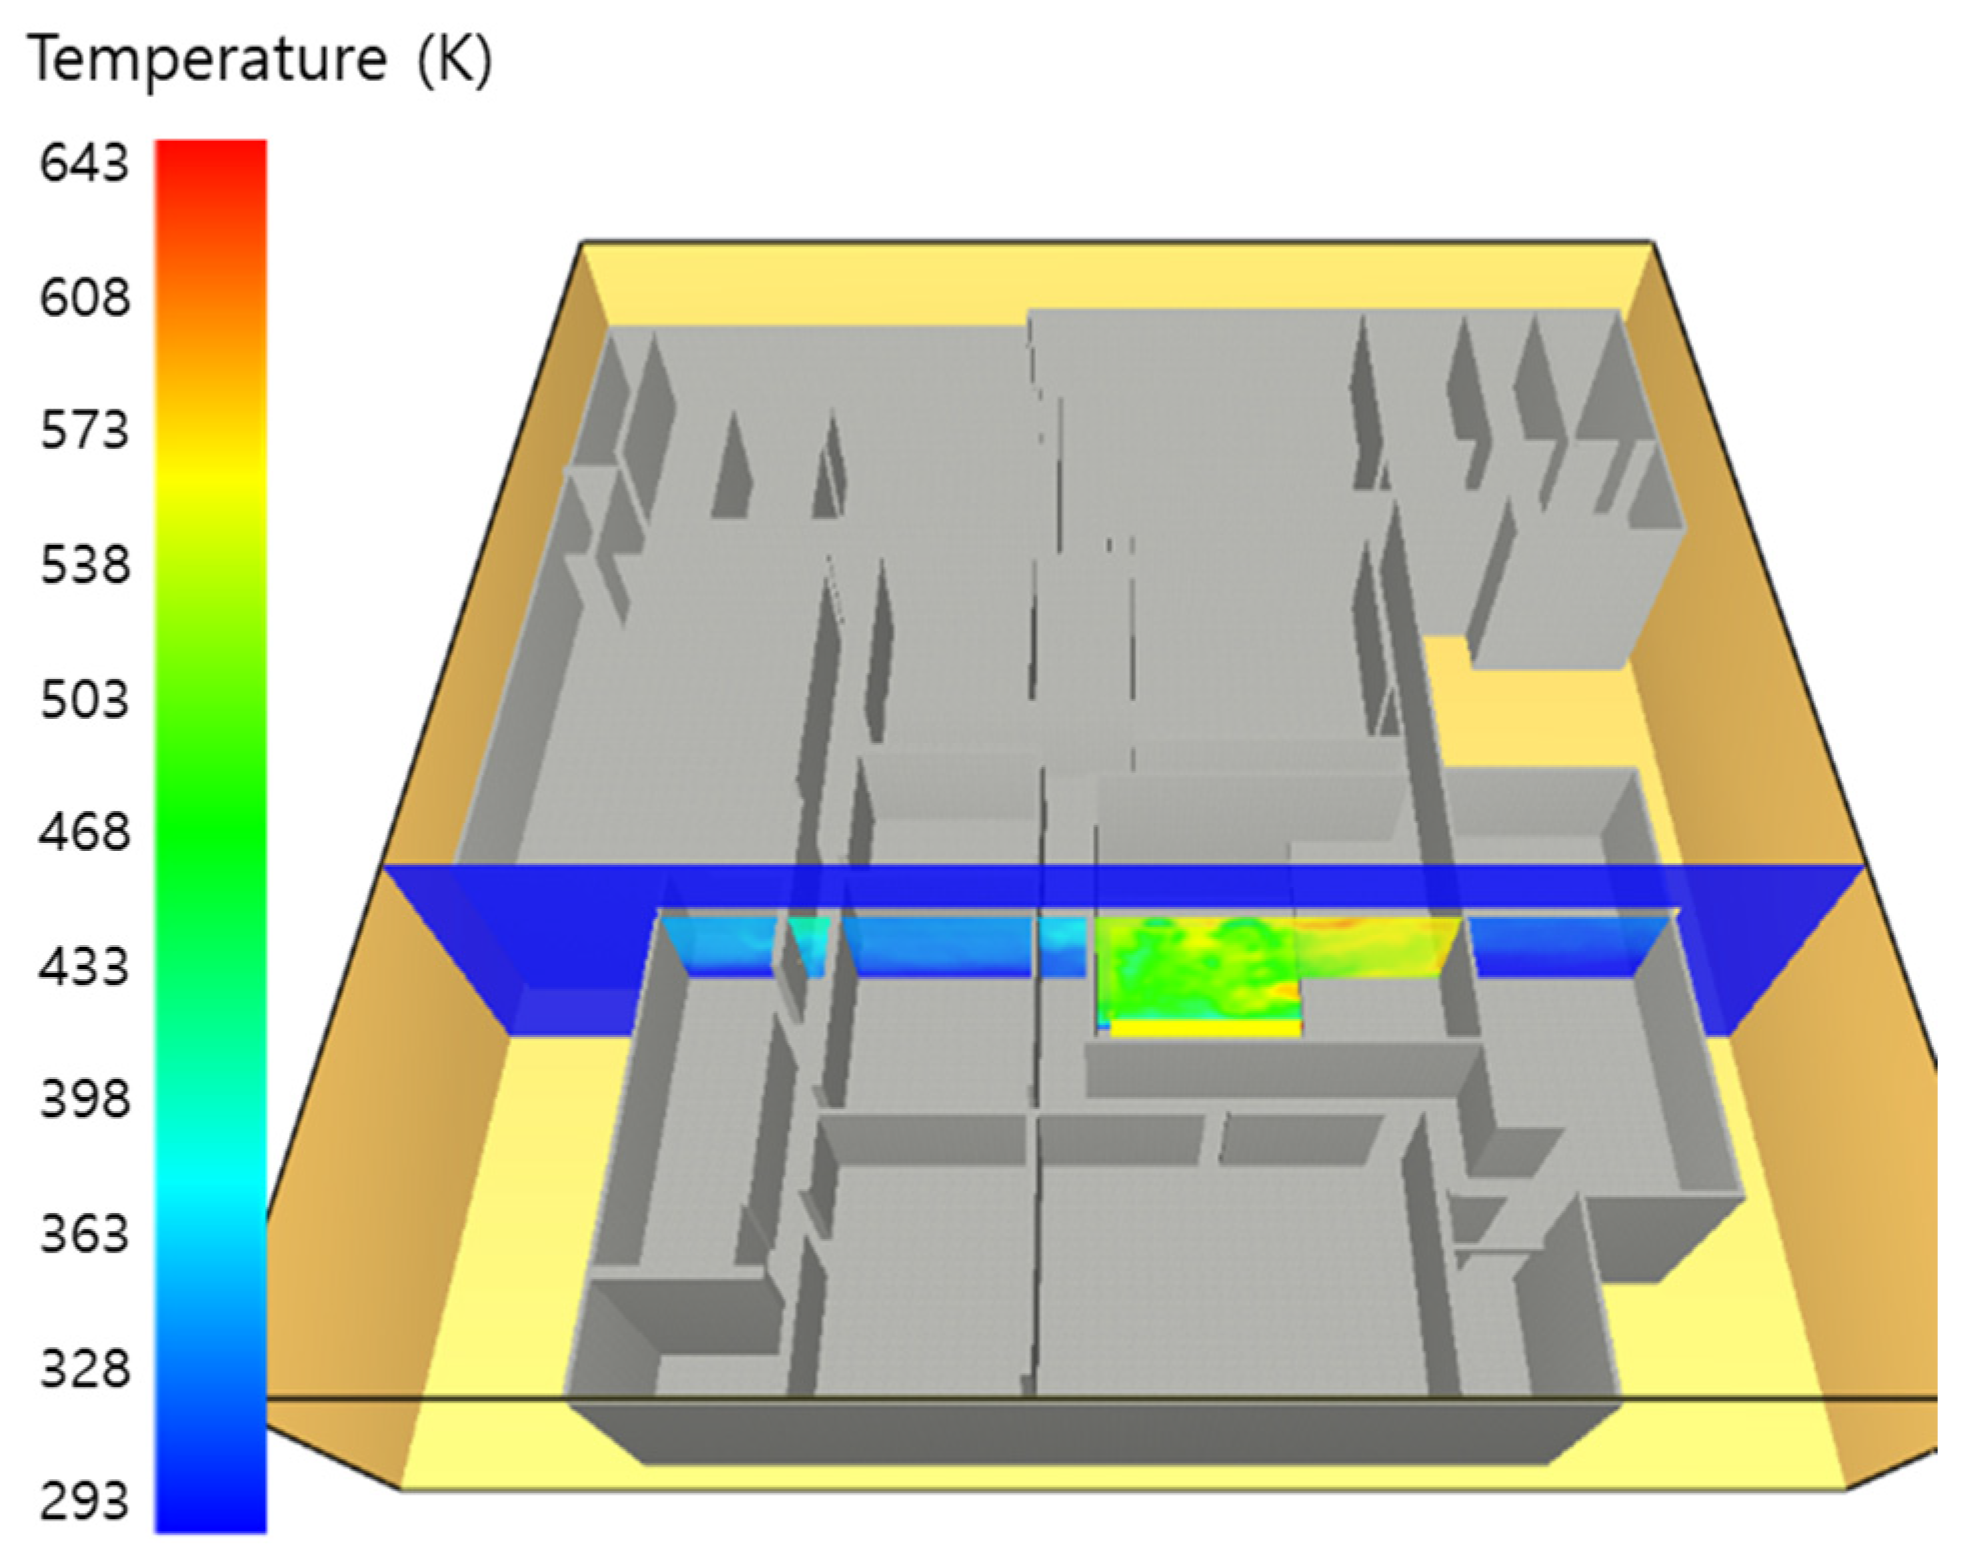
Figure 11 and Figure 12 show the kerosene storage room temperature after 60 s and 120 s, and the X coordinate is 12 m. The sprinkler operates at 10 s; at 60 s, the maximum plume temperature is 700 K, less than what was shown in Figure 4 and 5, and at 120 s, the temperature steadily decreases and records 600 K. At 220 s, due to the sprinkler, the temperature drops to 400–500 K, as shown in Figure 13.
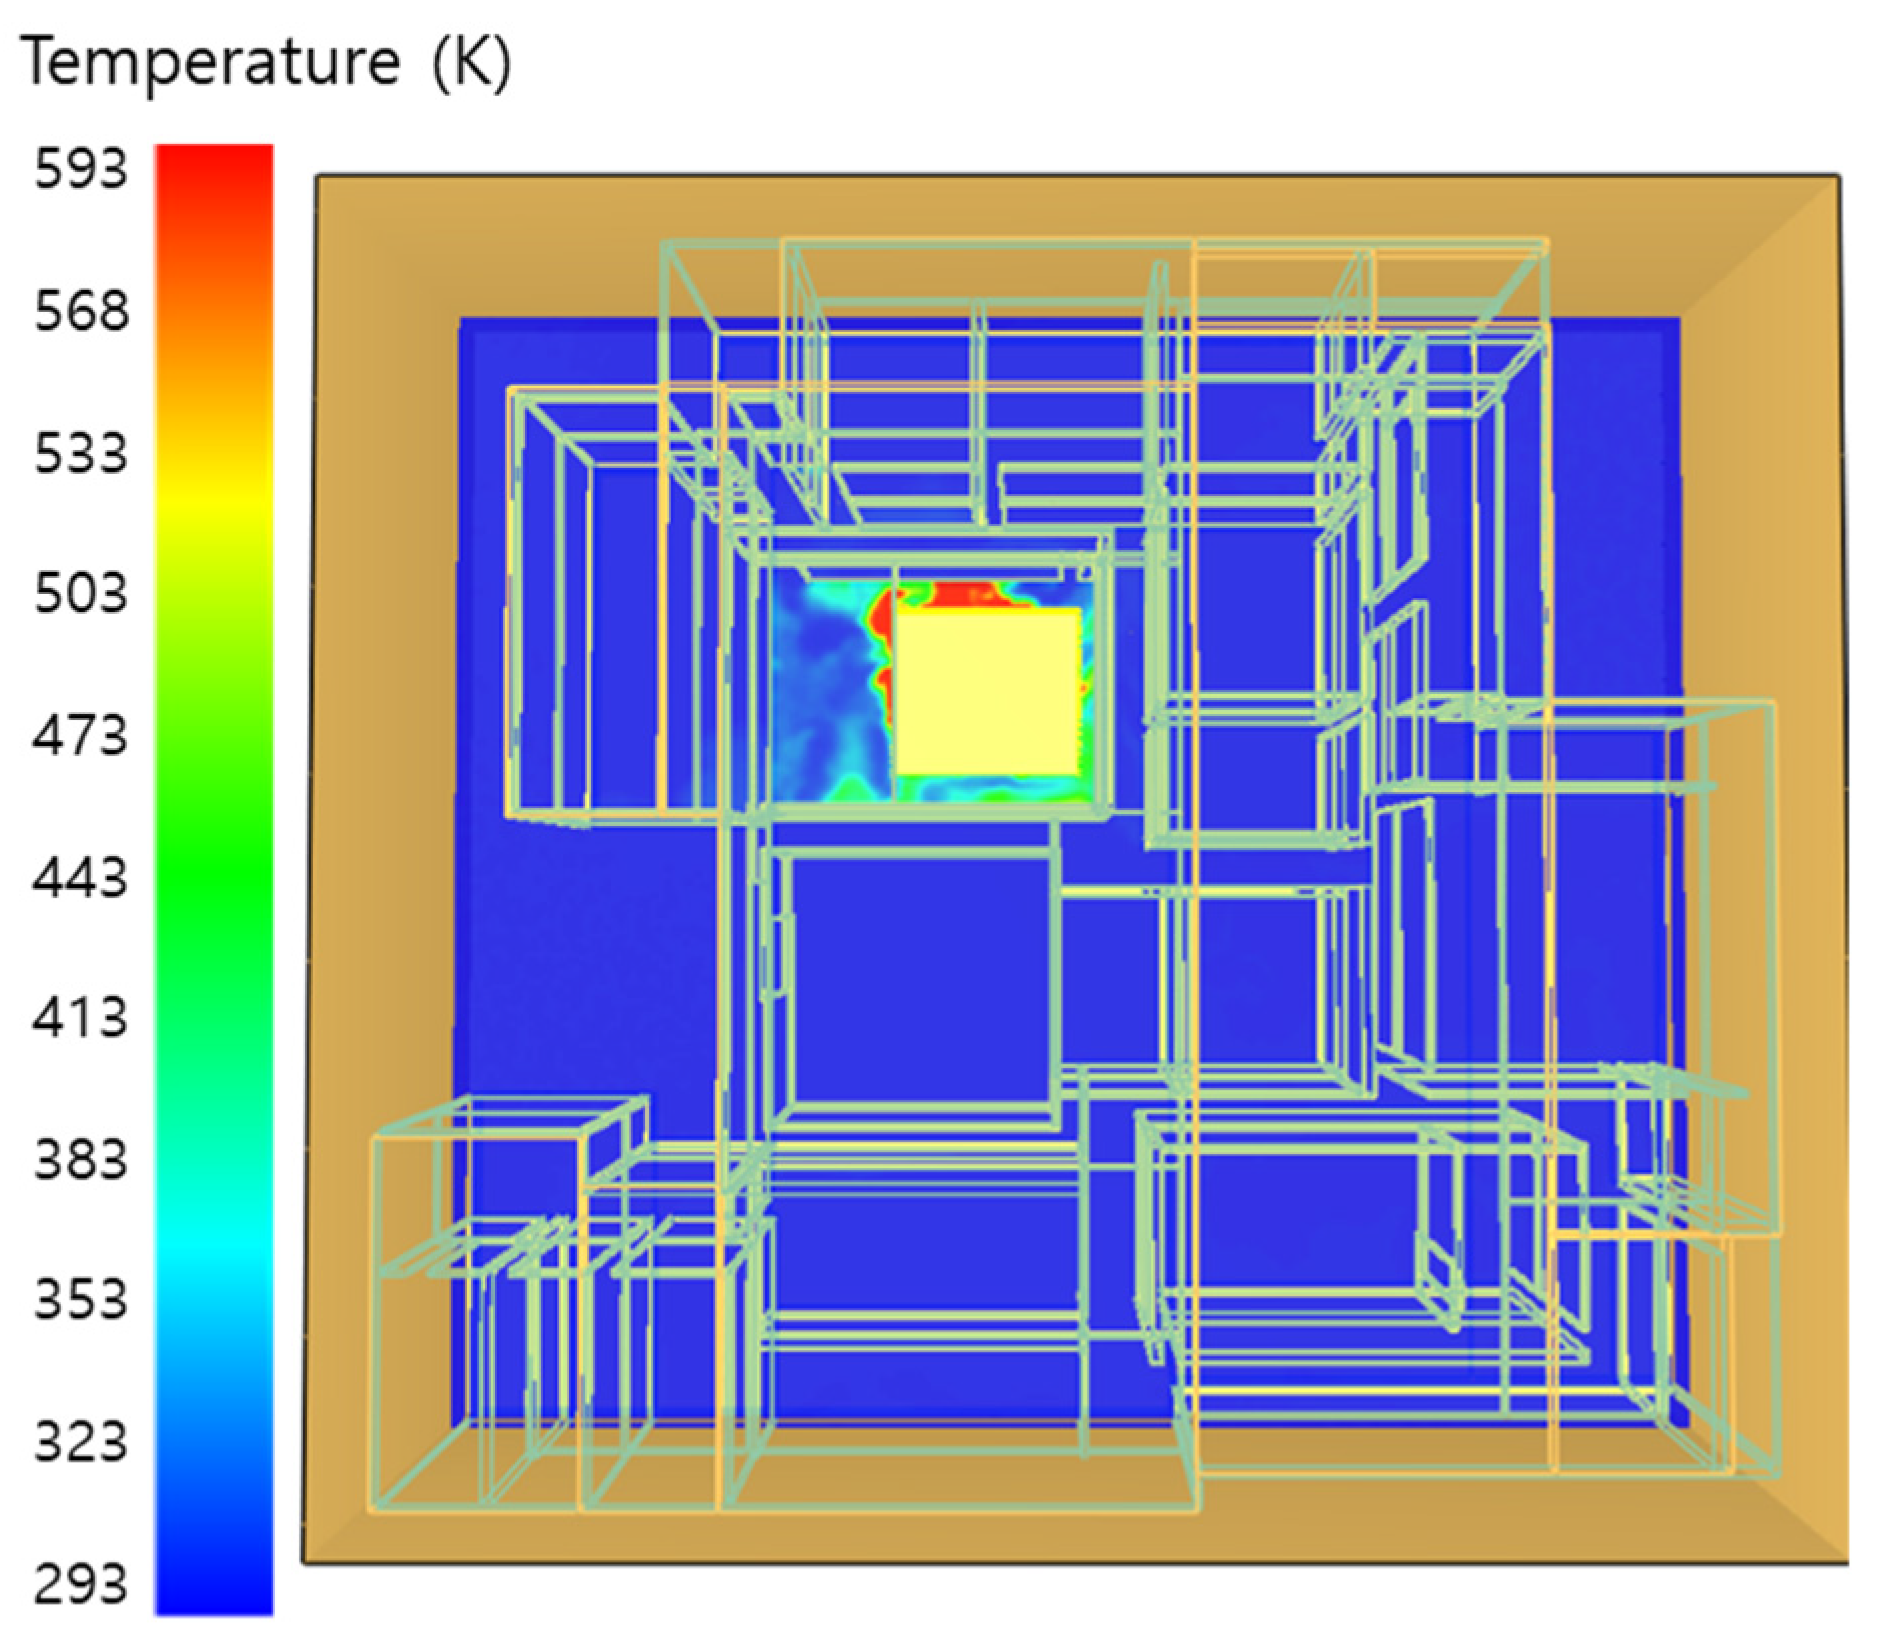
Figure 14 shows the storage room temperature. At B2, the temperatures drop to 500 K, but the plumes were condensed by the water mist; therefore, the diffusion velocity dropped and was stuck on the bottom. Figure 15 shows that the plume diffused to 6 o’clock corridors after 30 s but, due to the sprinkler, the temperature and diffused areas decreased than that shown in Figure 6. The plumes shown in Figure 16 dispersed to the adjacent corridors and rooms, as previously shown in Figure 7. Finally, the plumes dispersed to the whole of B2 & B1 and increased the temperatures up to 400 K. However, the plumes are stuck by the vortex, as shown in Figure 17, and the southernmost and easternmost room temperatures were recorded at 150–200 K higher than the surrounding corridors and rooms.
Figure 18 shows the total HRR. At 50 sec, the HRR is dramatically increased and at 150 s, the HRR does not increase. The reason is that the sprinkled water cooled the pool surface and plumes, therefore, the scale of fire is not exaggerated. As a result, compared with the sprinkler case to without a sprinkler, the maximum temperature decreased from 900 K to 600 K, a 33% difference, and the maximum HRR decreased from 20,000 kW/m3 to 6000 kW/m3, a 70% difference.

5.3. 10   m 3 of Kerosene Released without Sprinkler

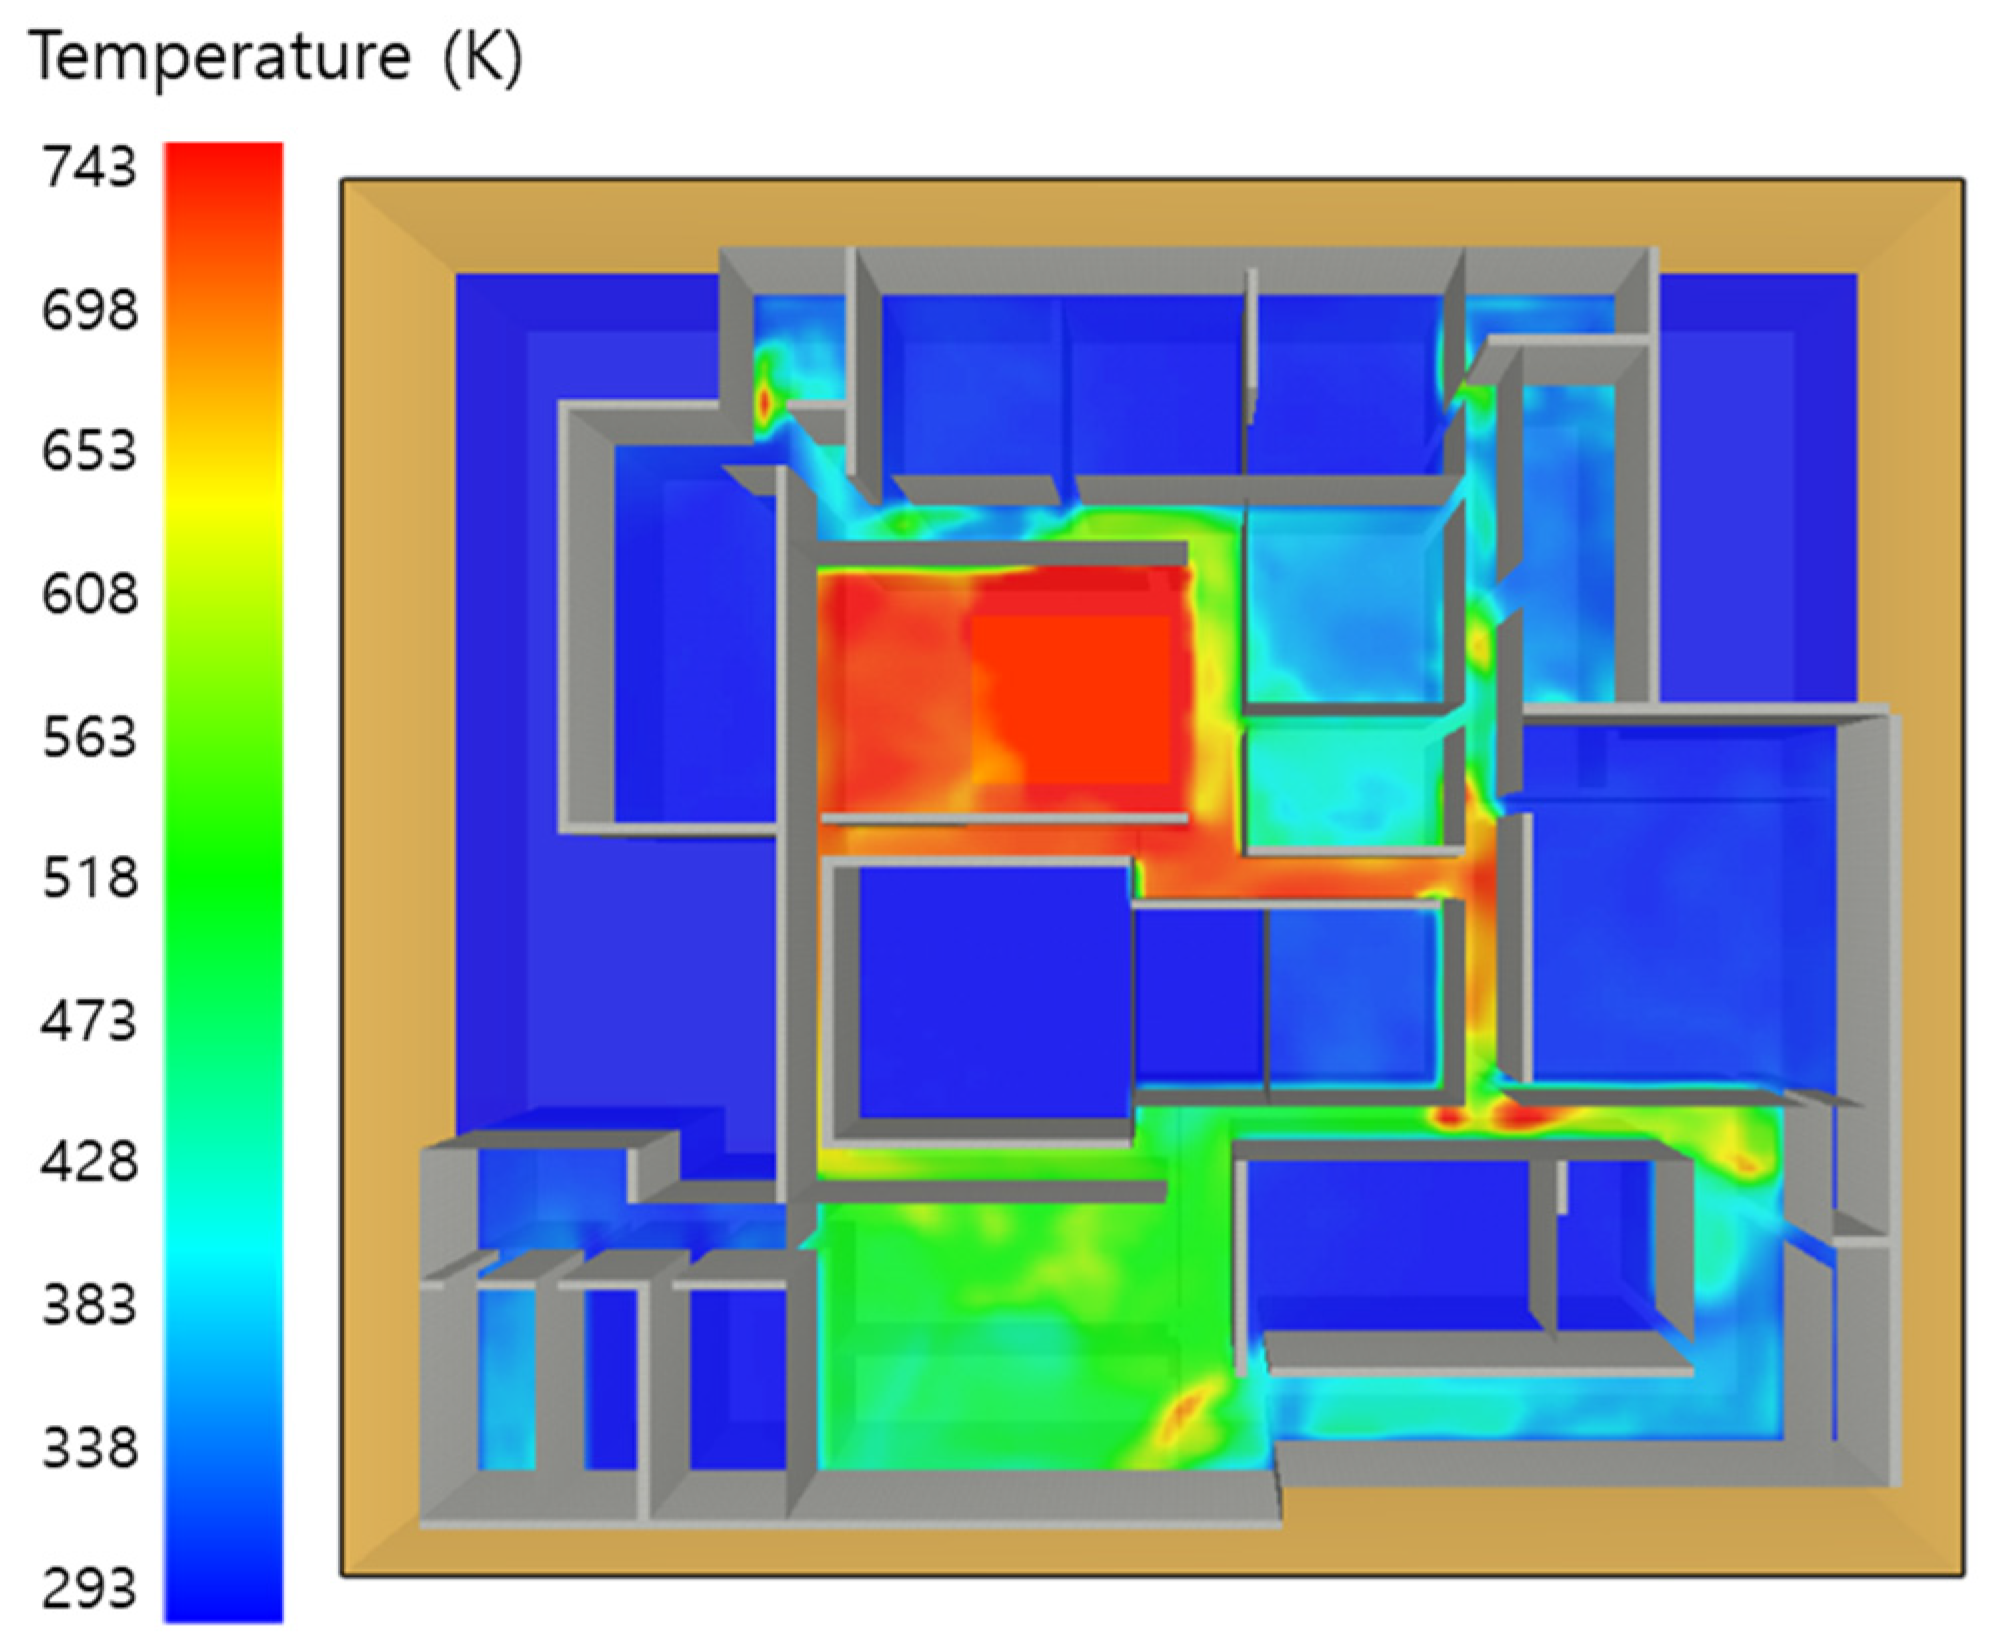
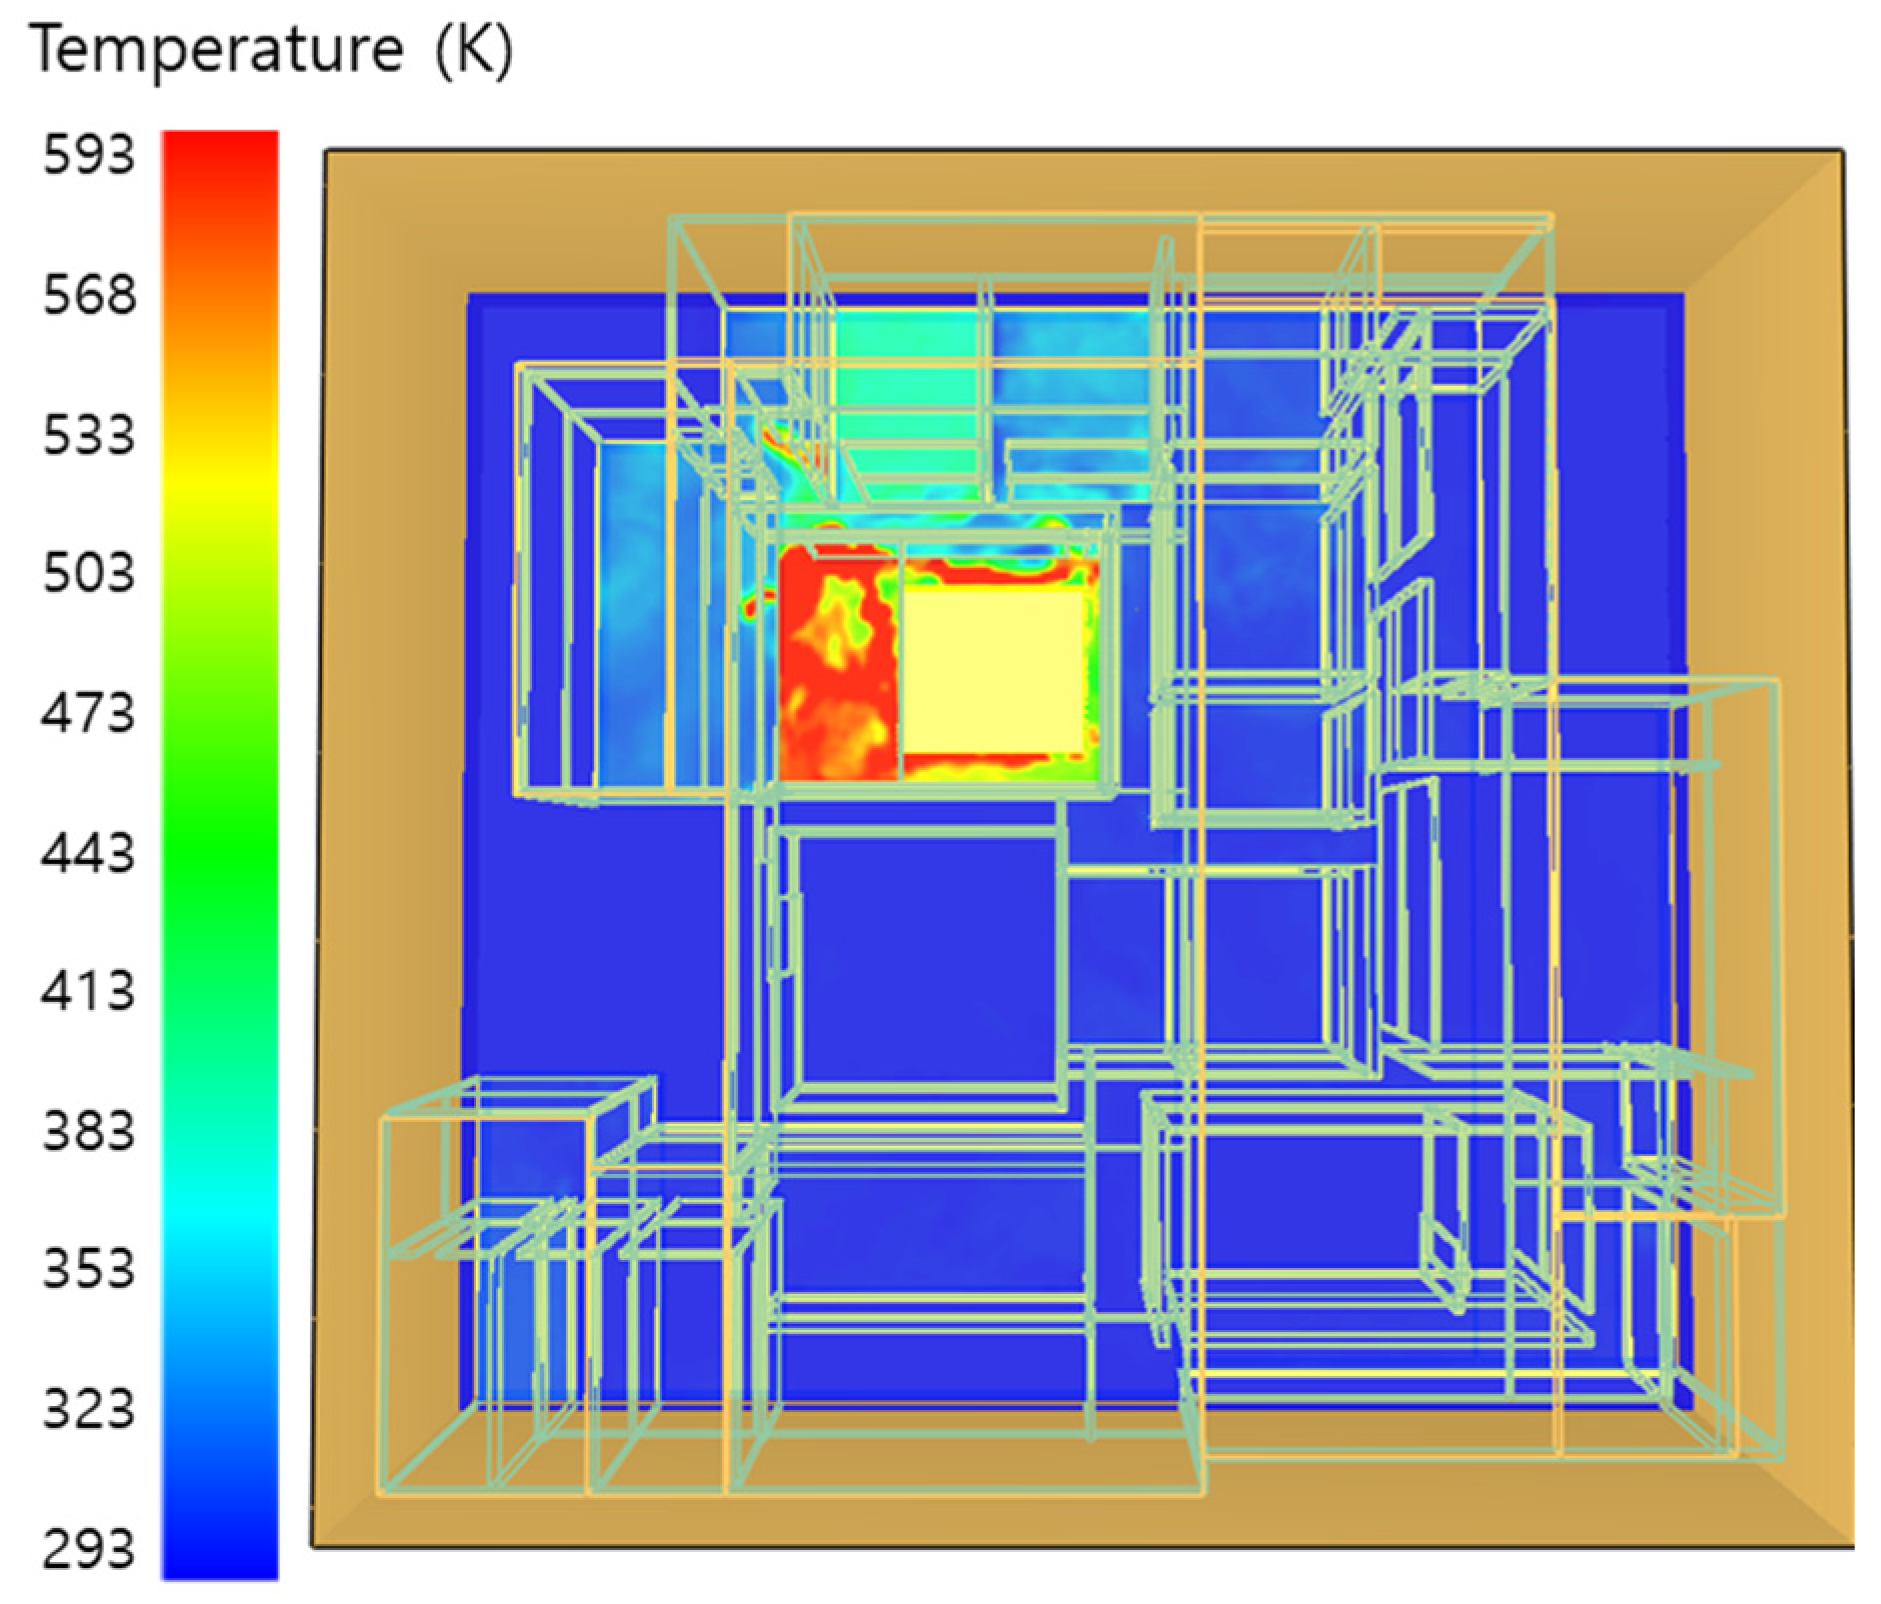
Figure 19 and Figure 20 show the storage room temperature. After 60 s, the maximum temperature of the plumes extends over 800 K, but due to the lack of air, the temperature dropped to 500 K and the ambient plumes were removed. In Figure 21 and Figure 22, the temperature shift is shown at B2. After 60 s, the plumes dispersed to the 6 and 12 o’clock directions, and after 270 s, the whole floor temperatures of B2 were increased, more than 350 K.
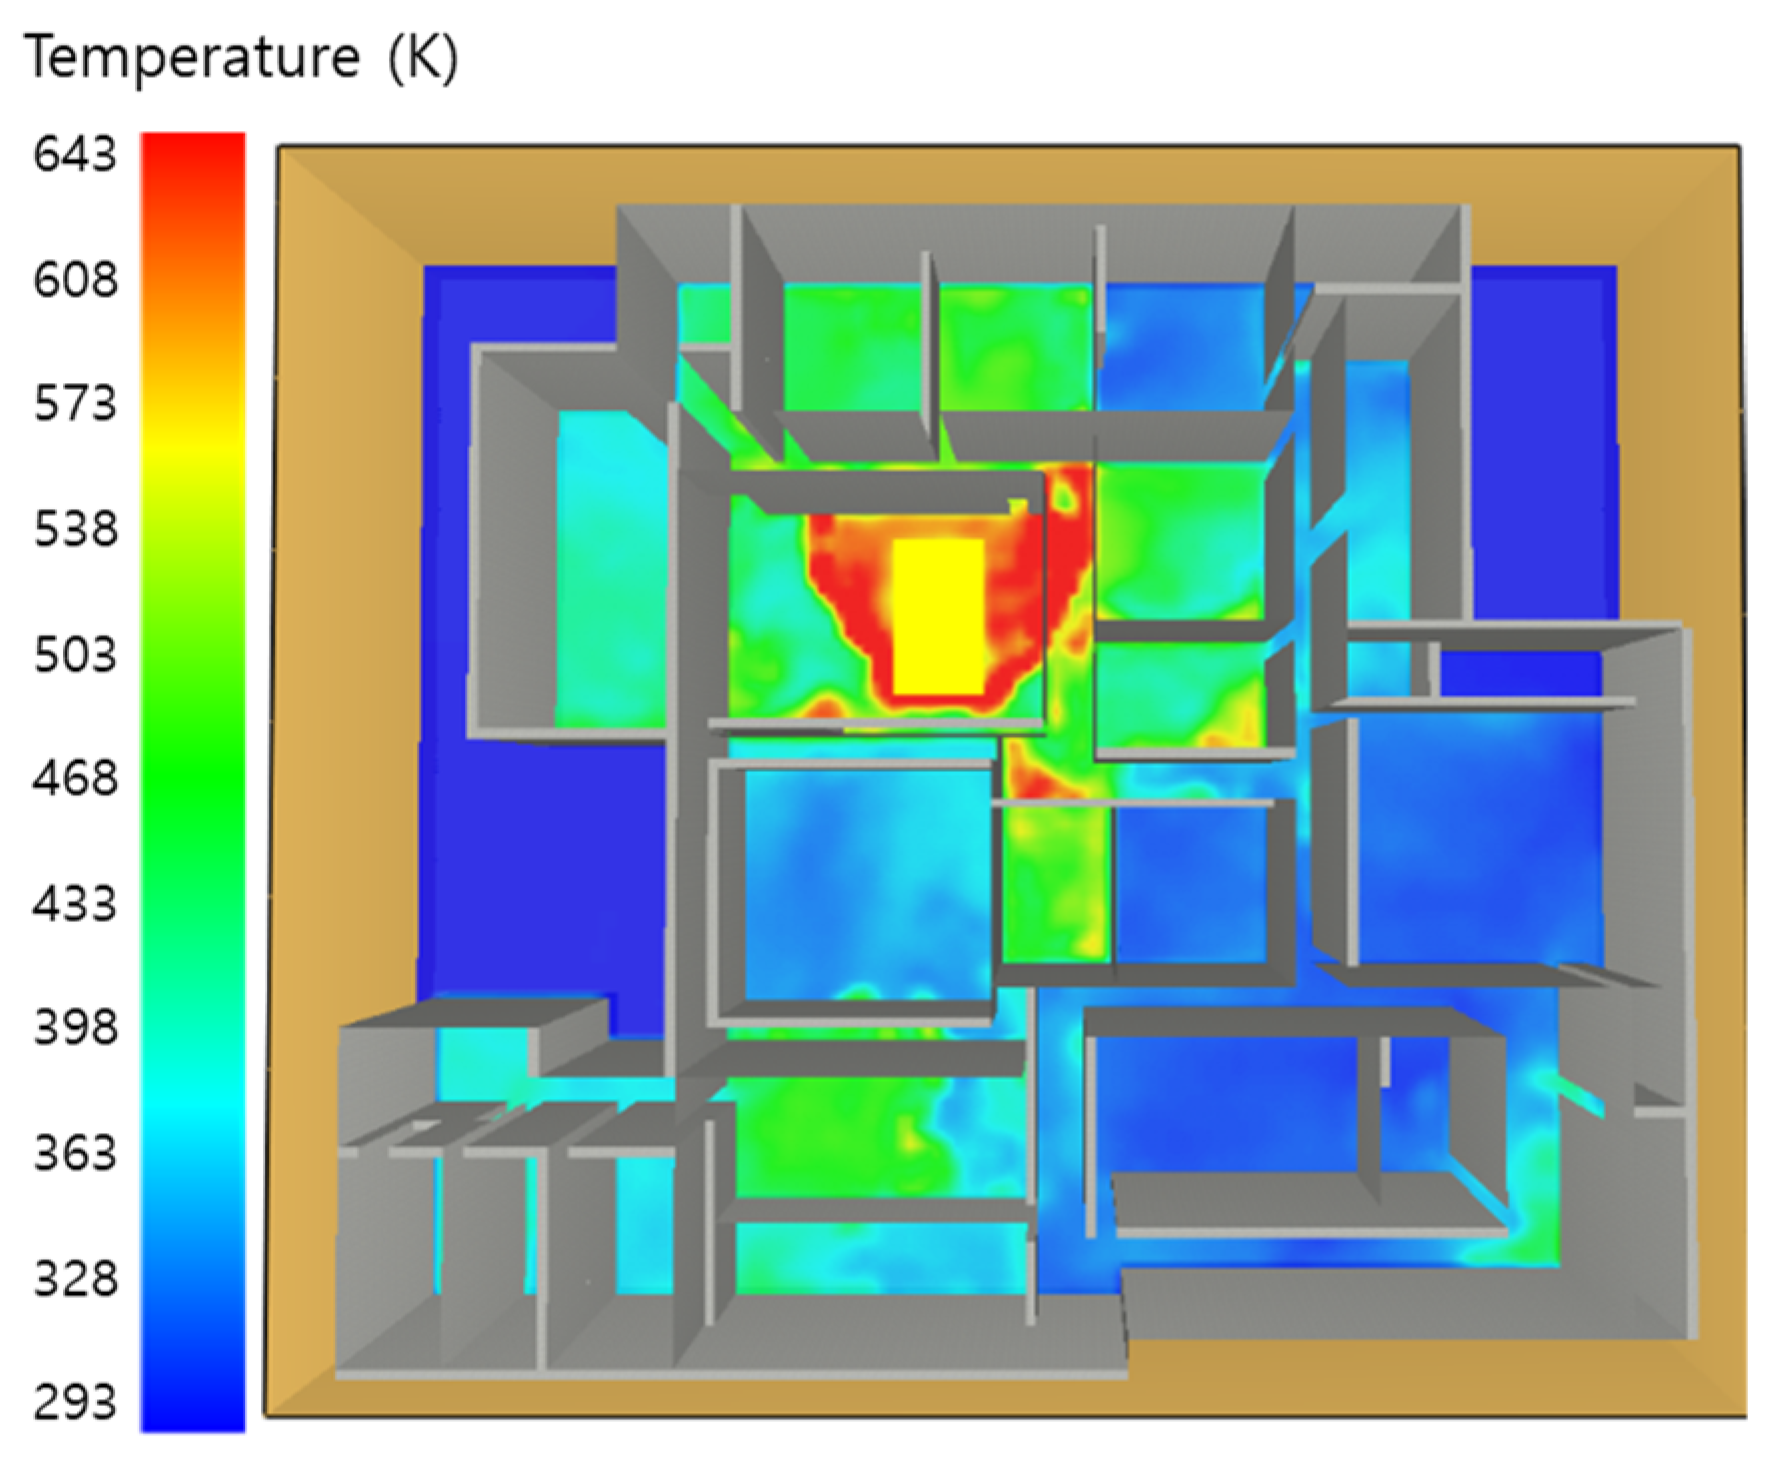
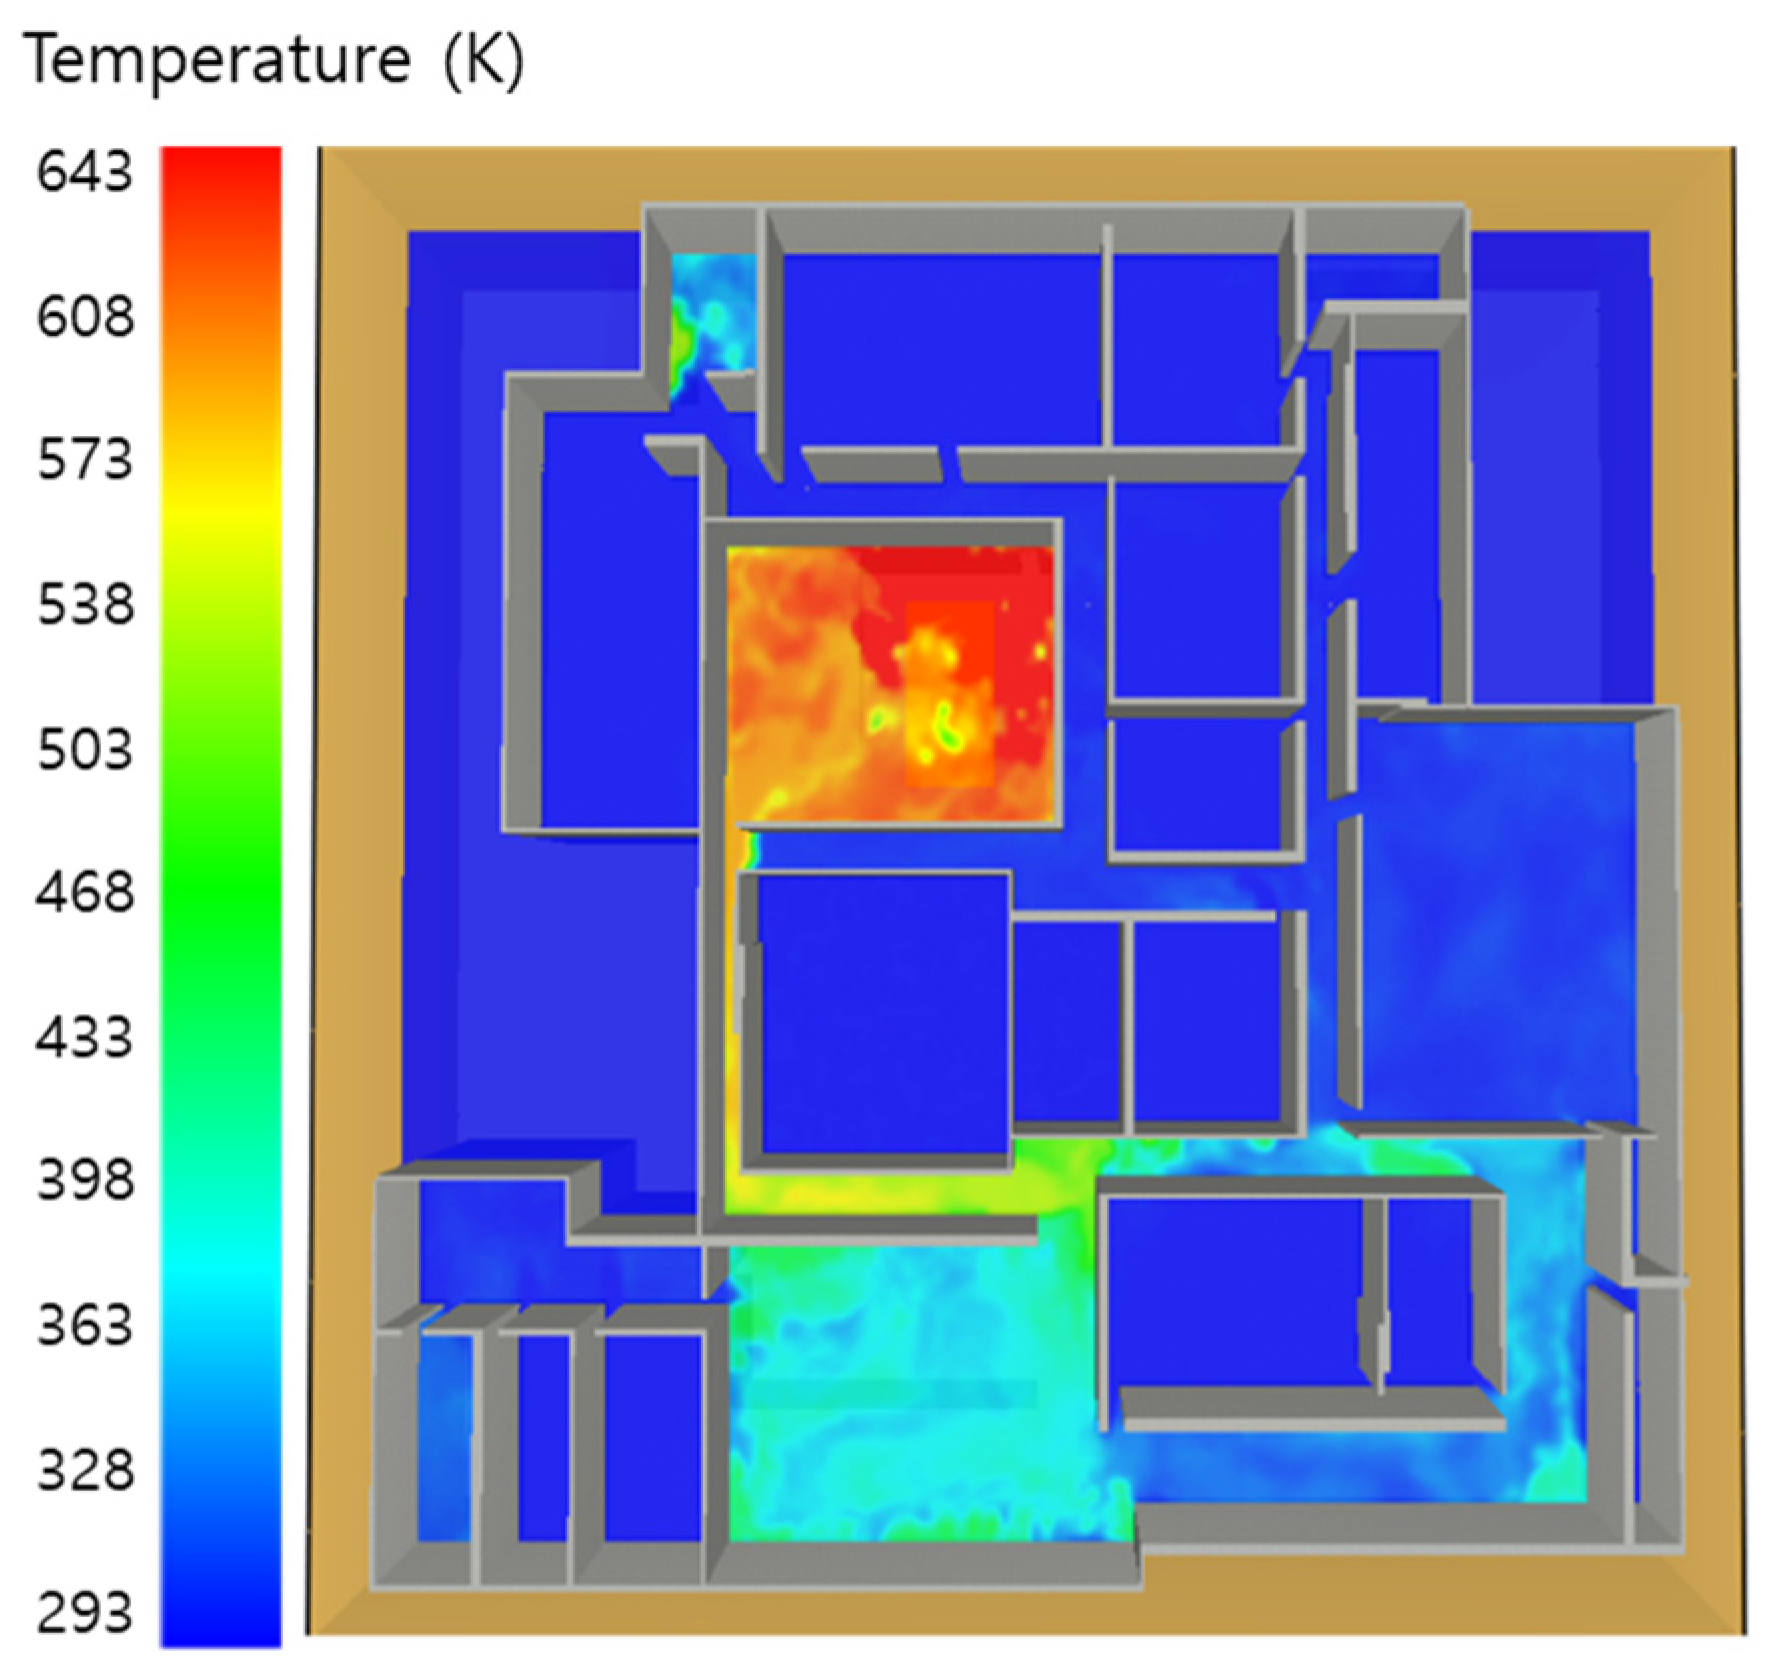
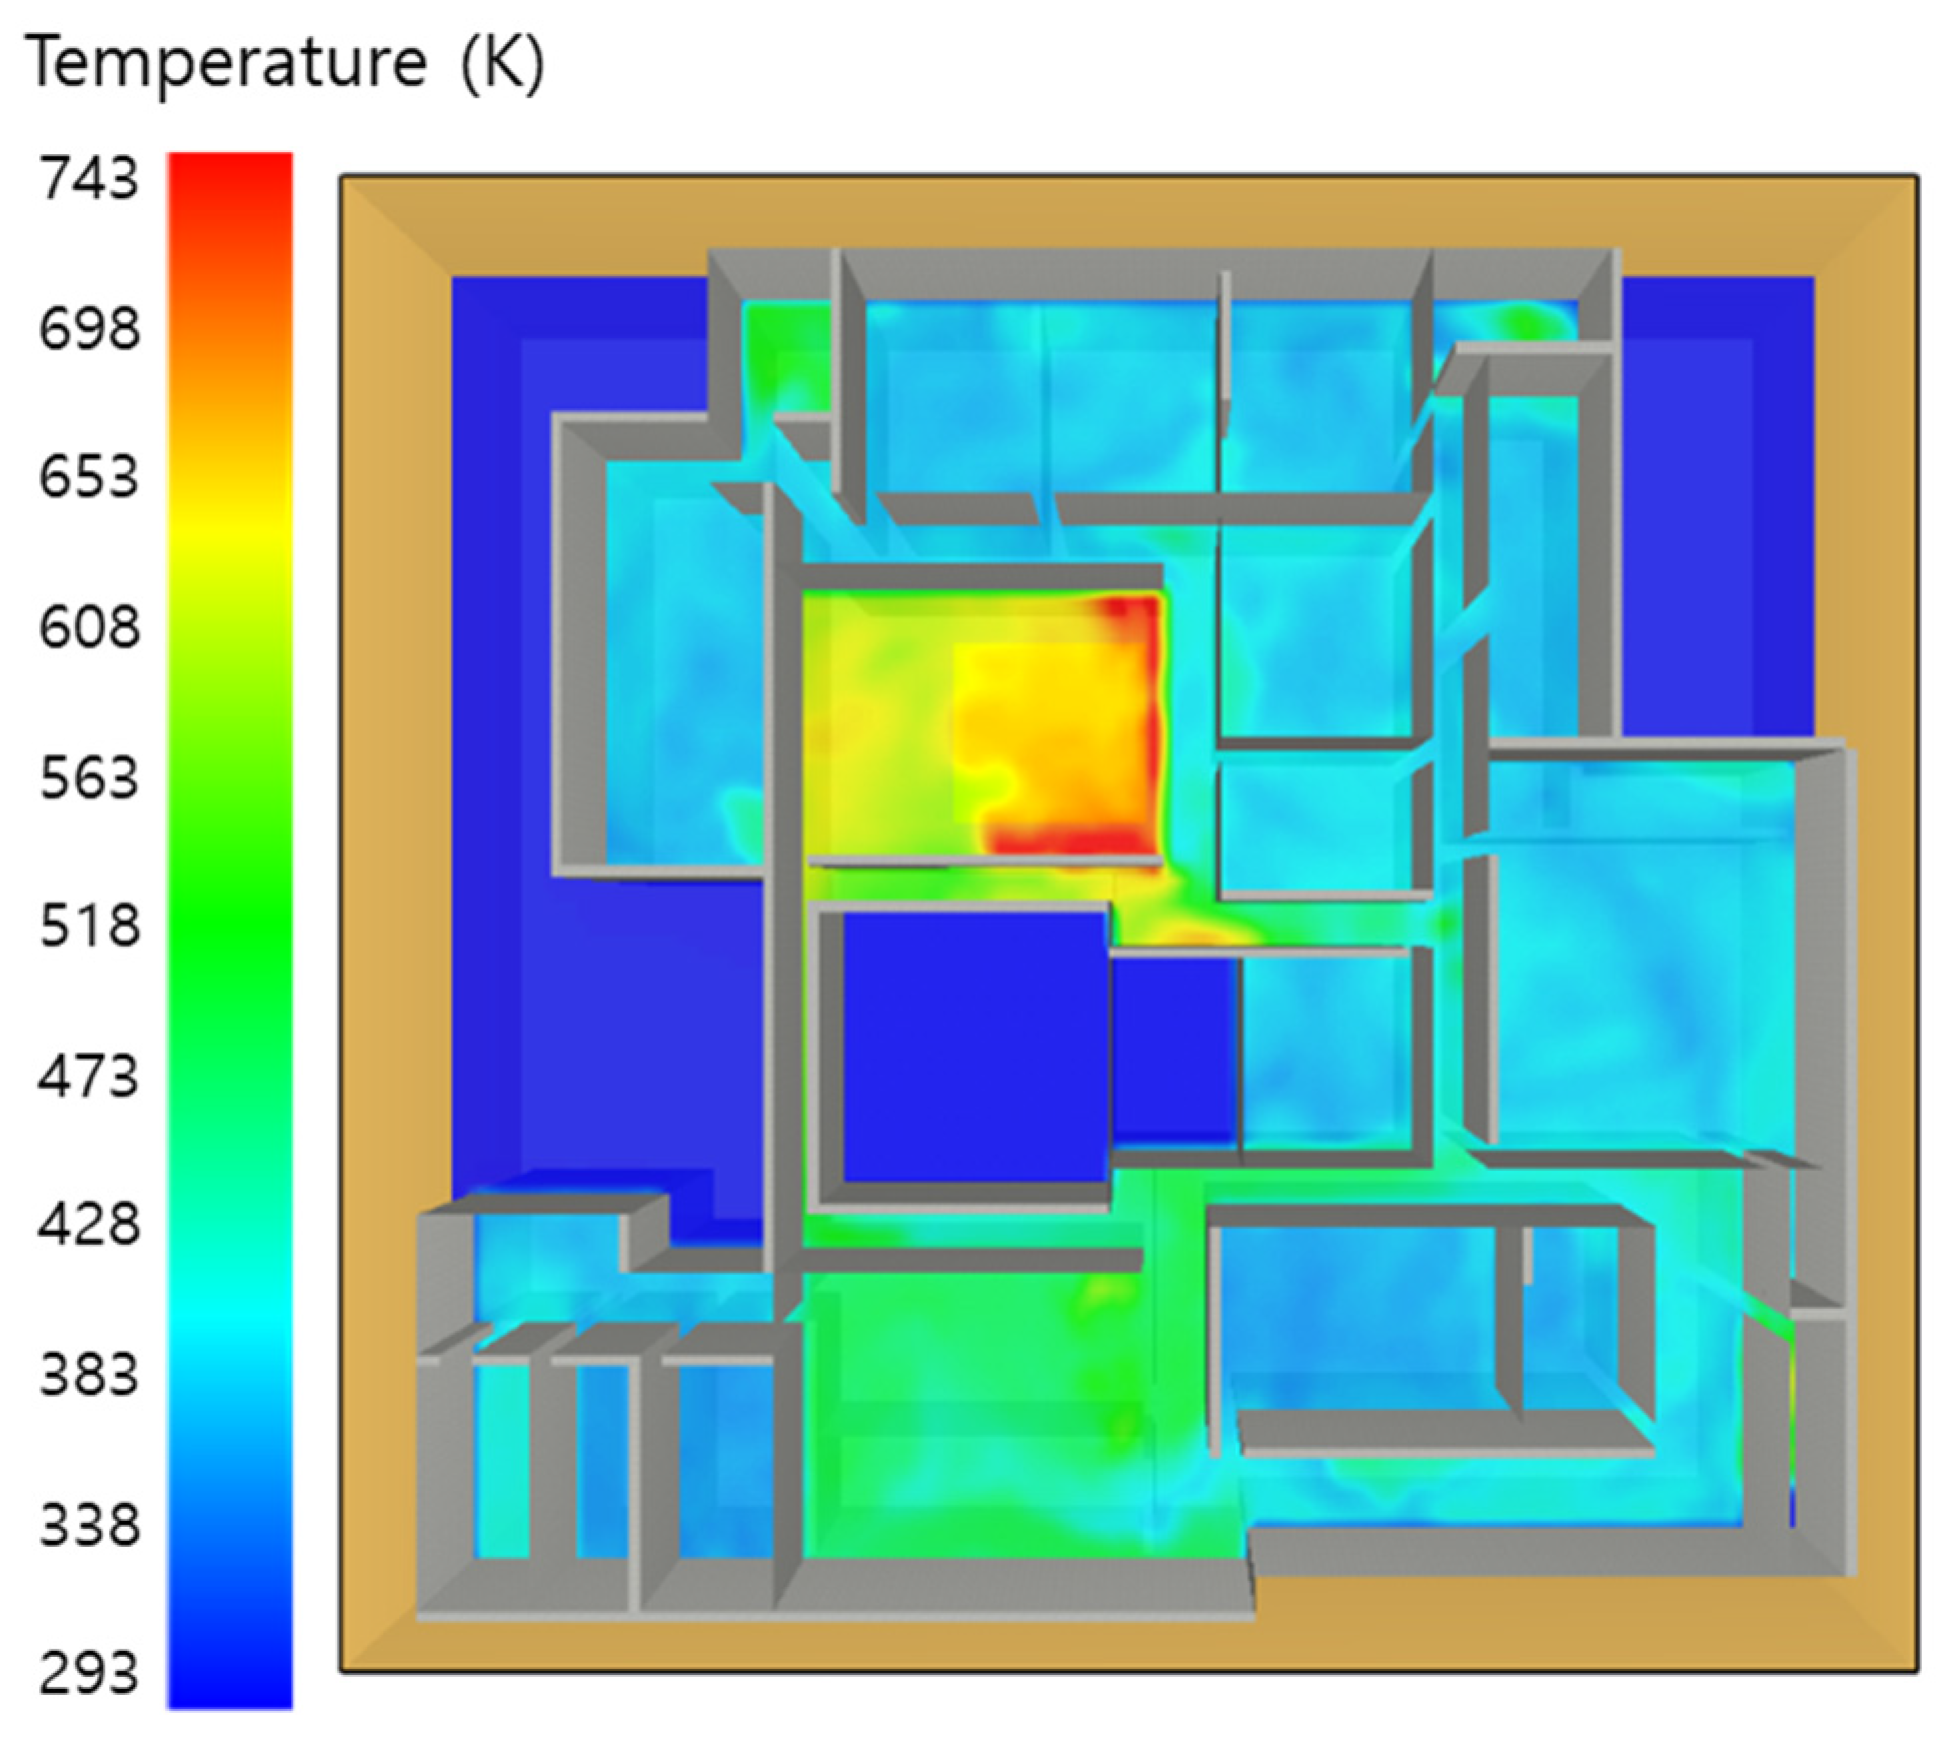
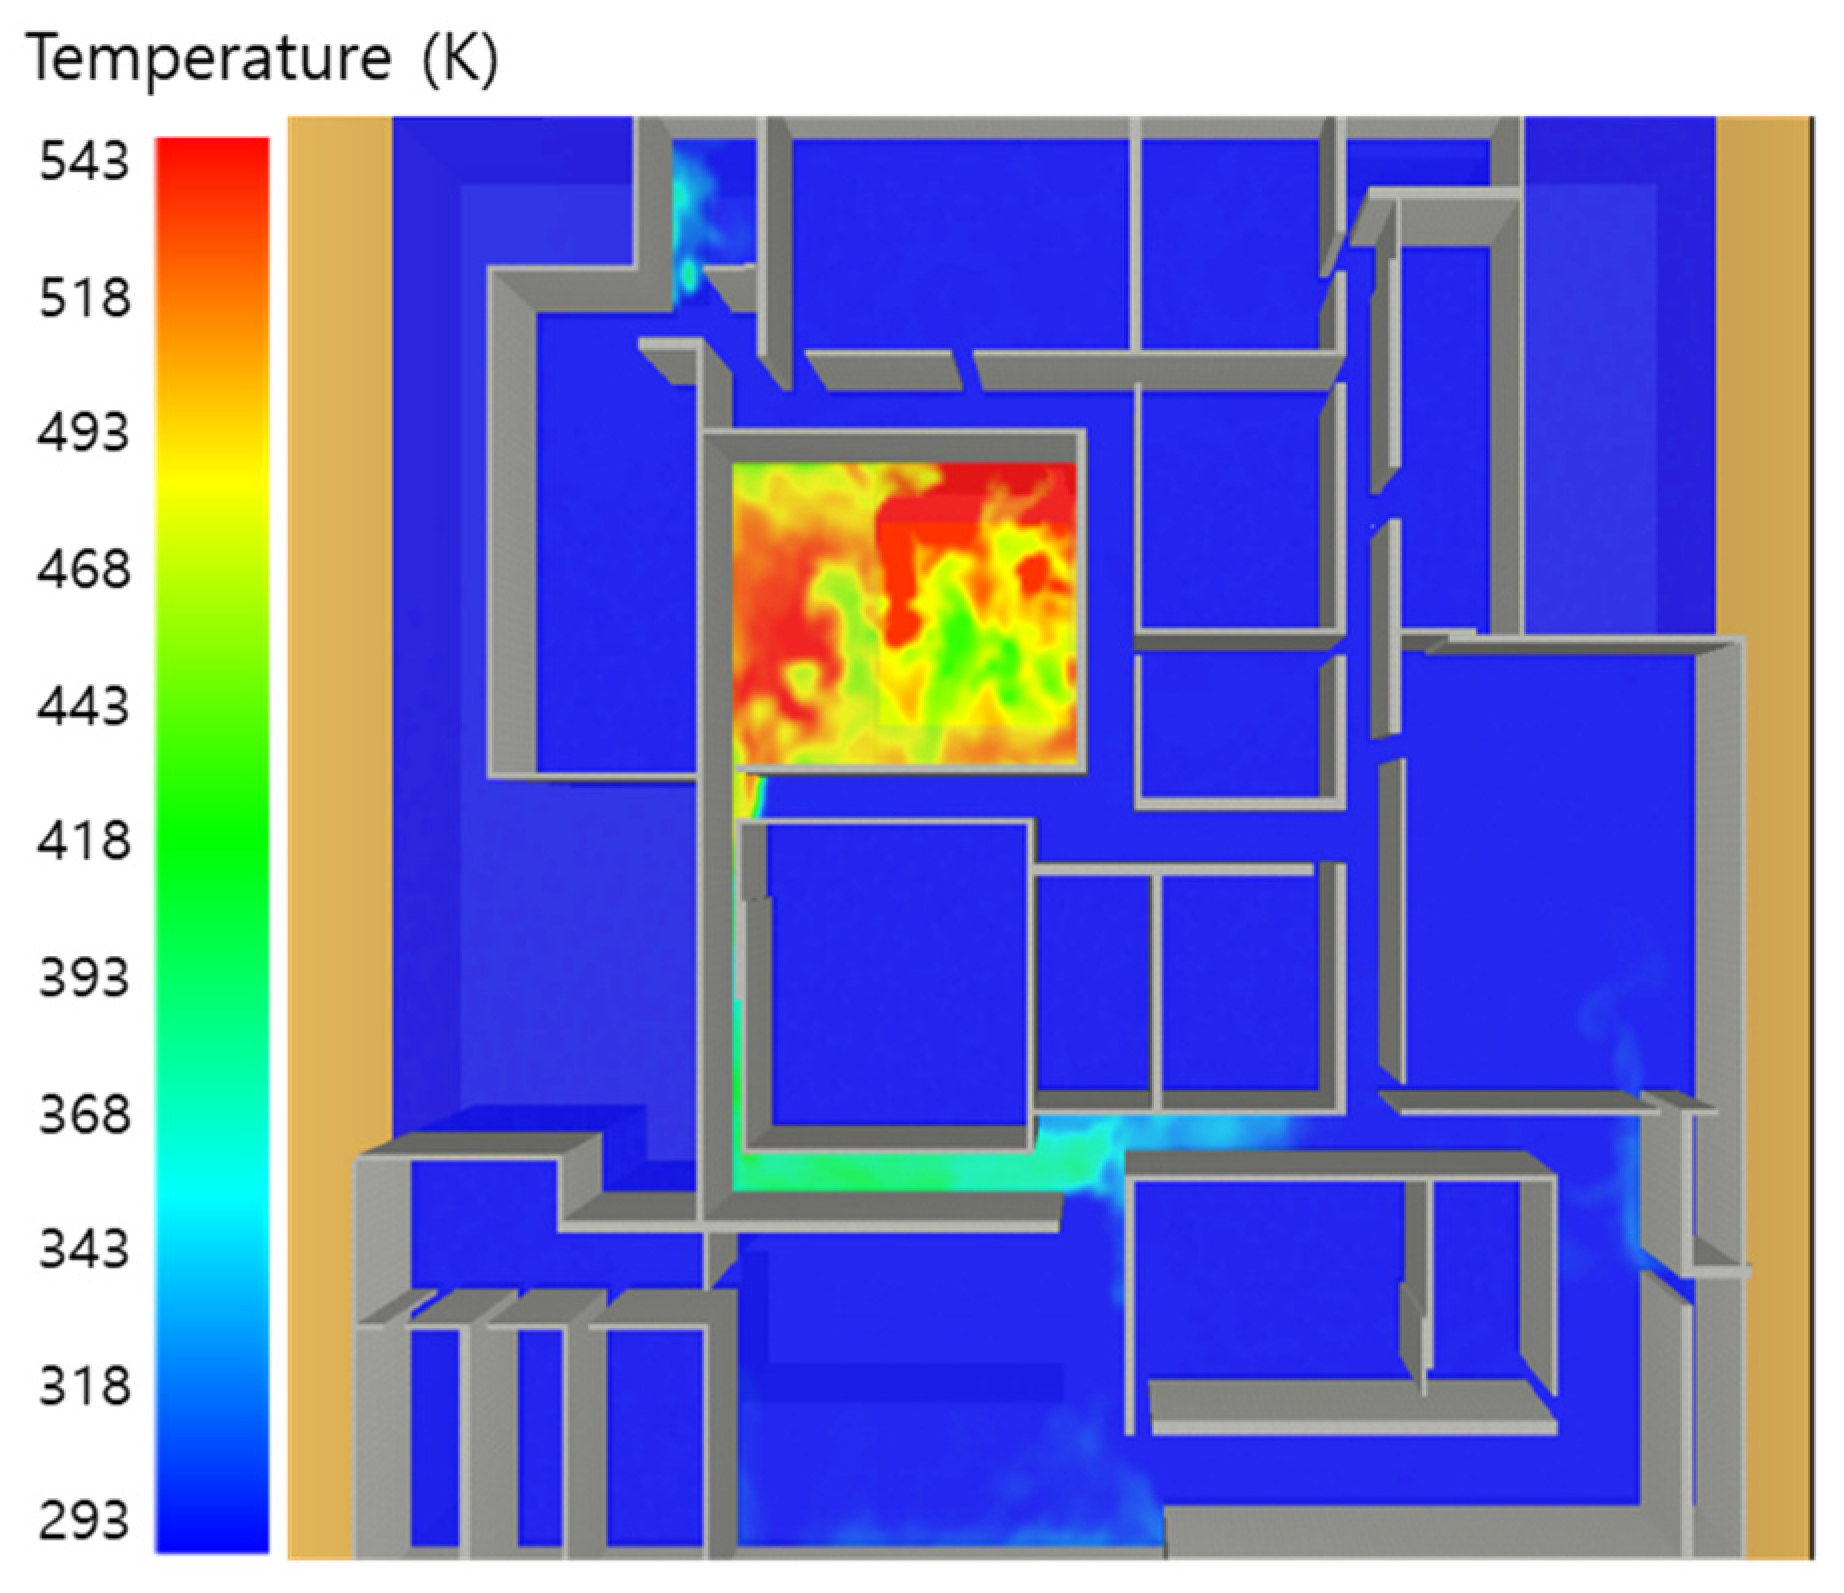
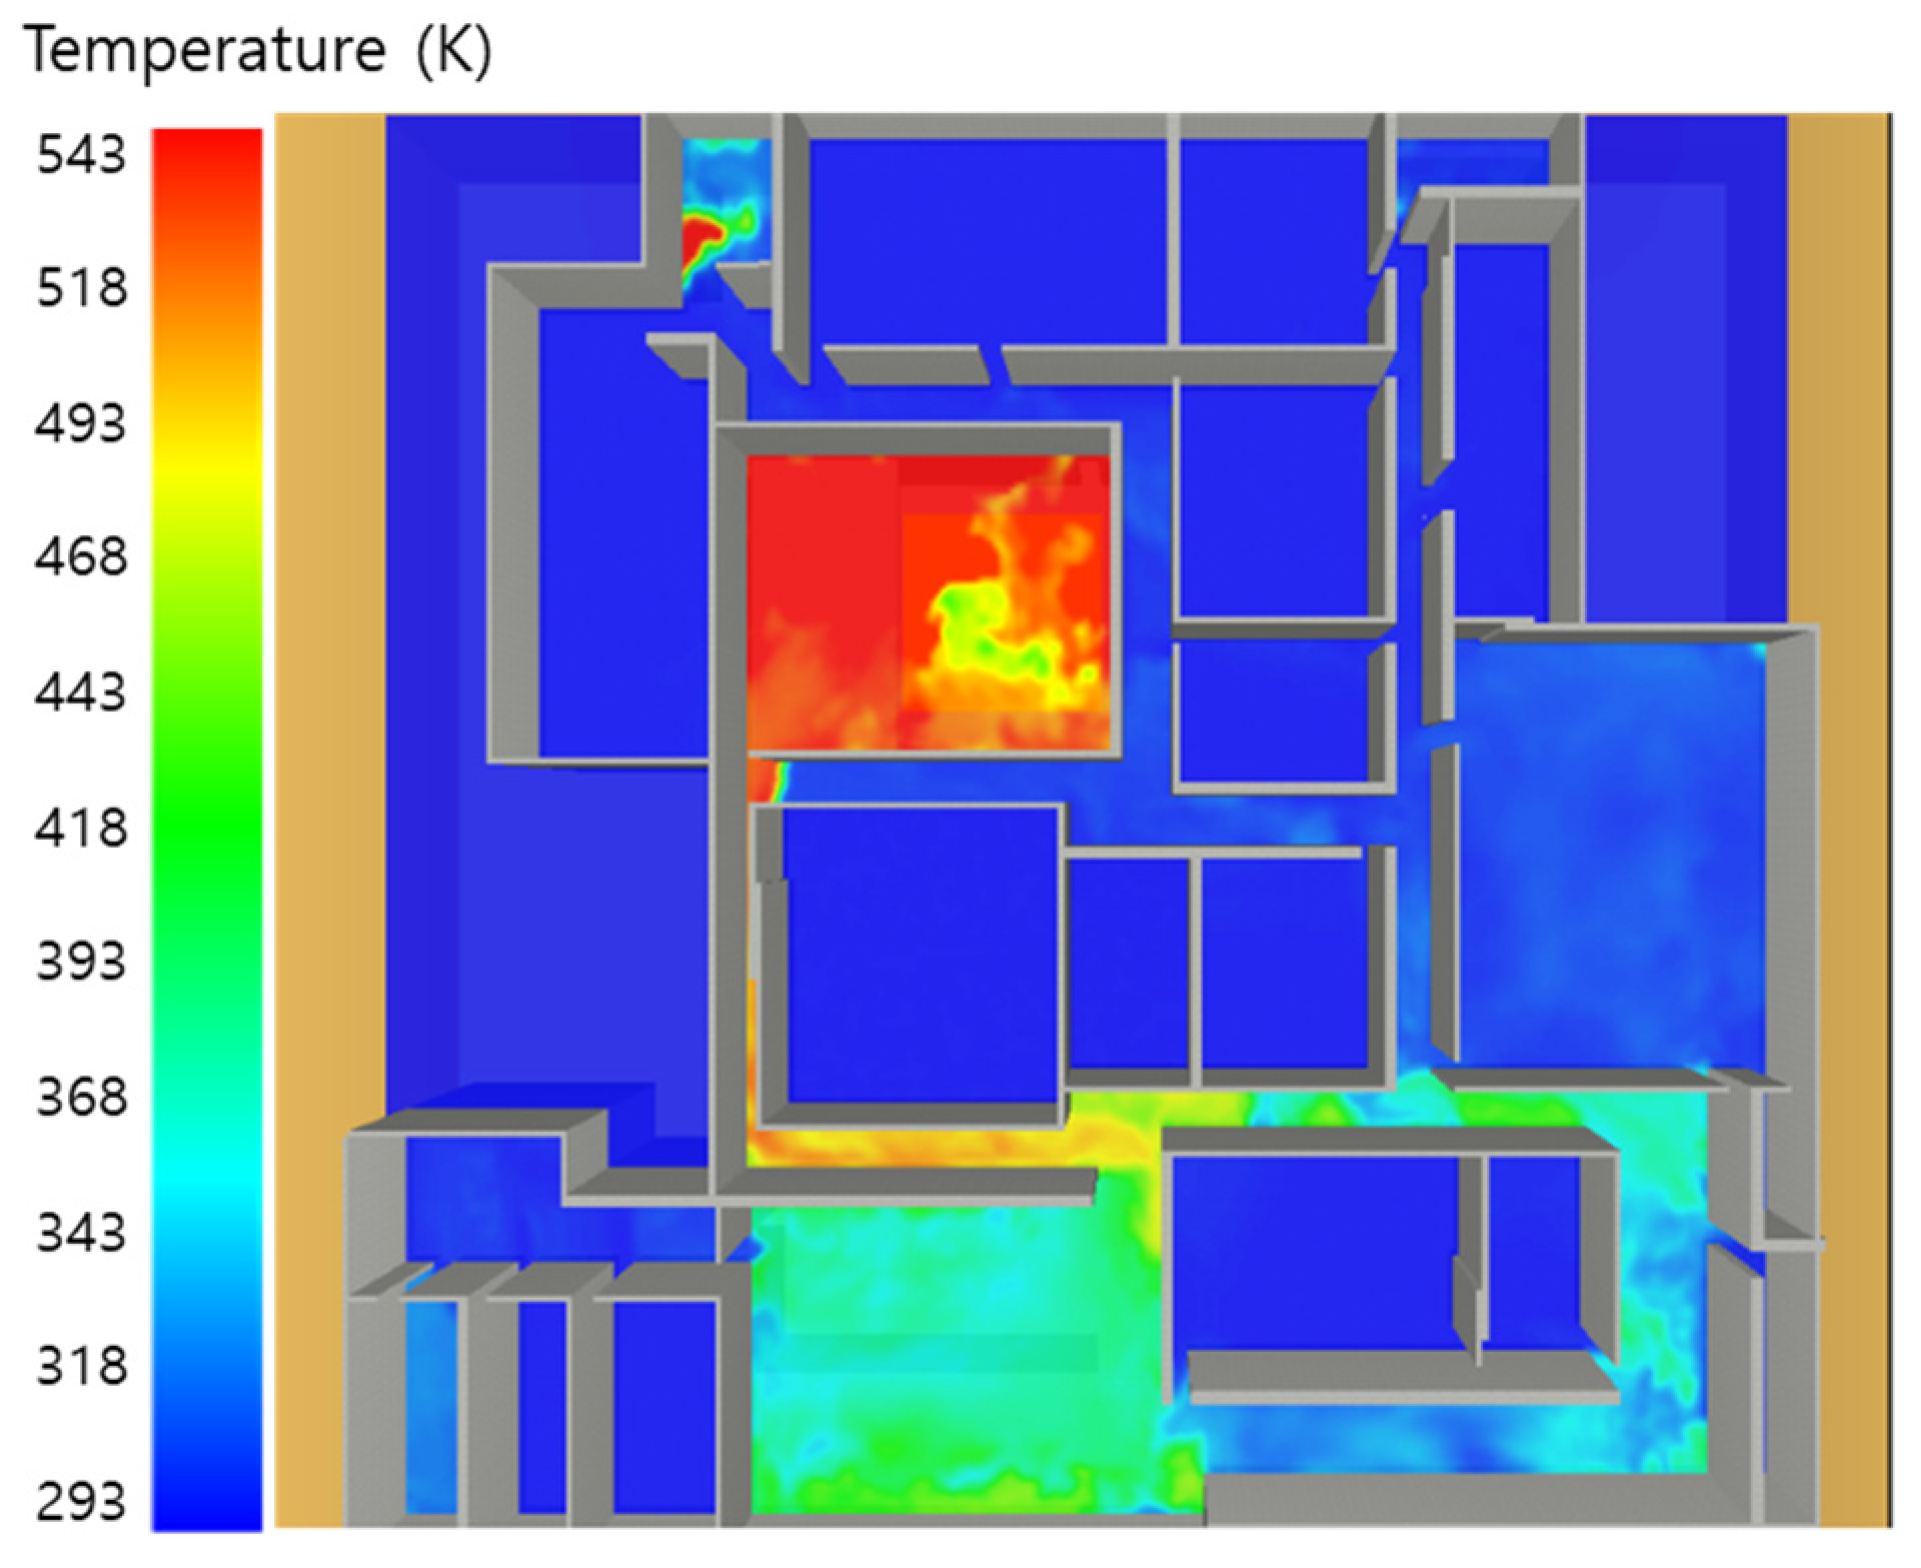
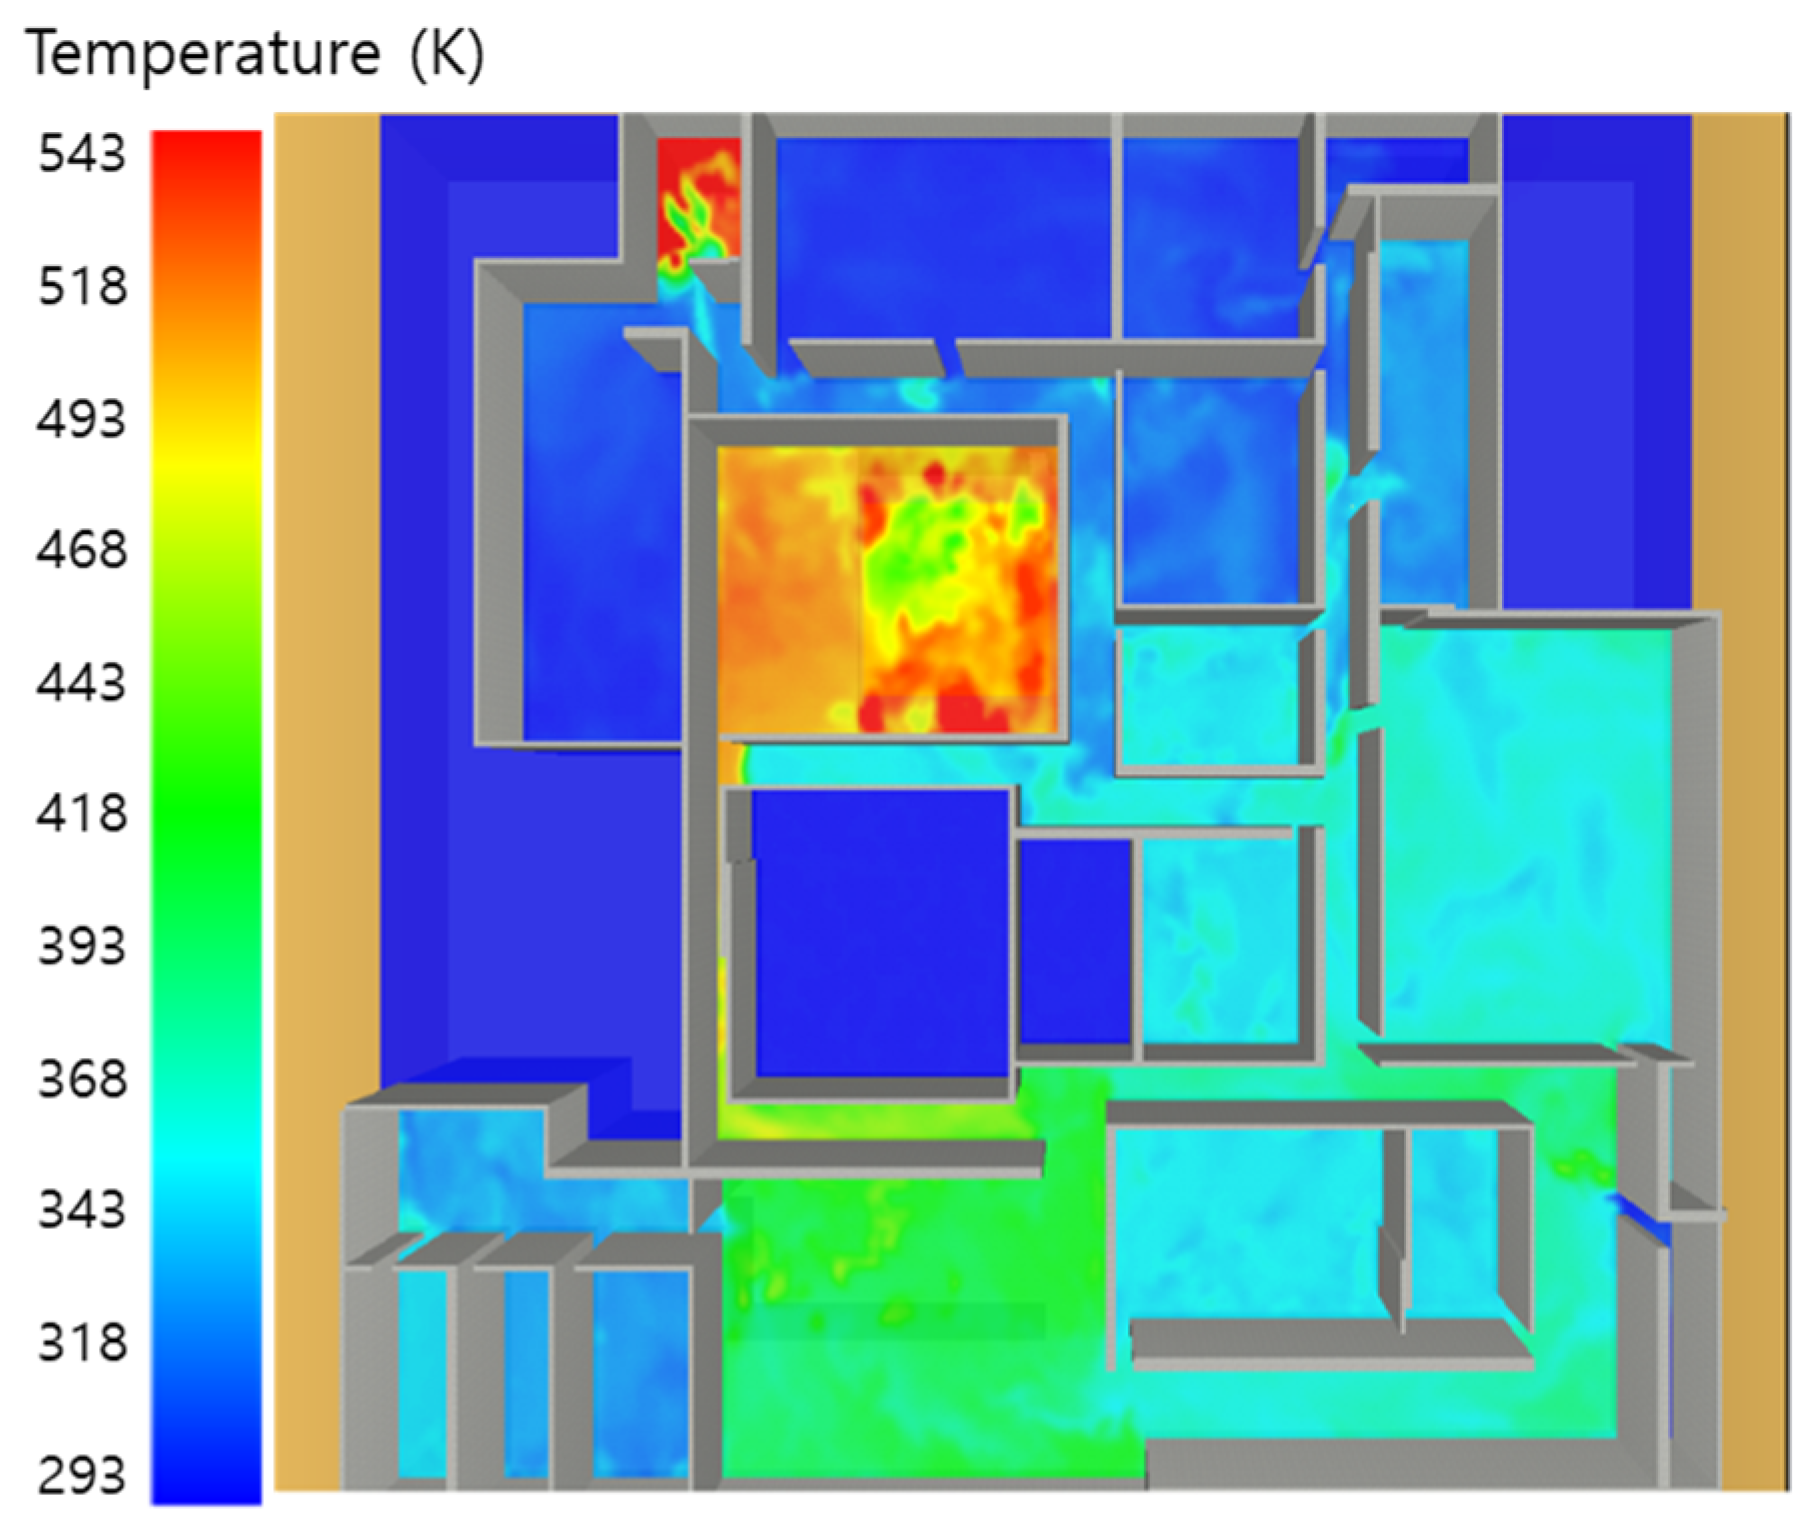
Figure 23, Figure 24 and Figure 25 show the shift in storage room temperature shift of the XY plane. After 60 s, the plumes over 700 K were diffused to the adjacent 3 and 6 o’clock directional corridors. After 120 s, by the vortex, the southernmost room temperature increased to 500 K. Then, the heat had spread to outside.
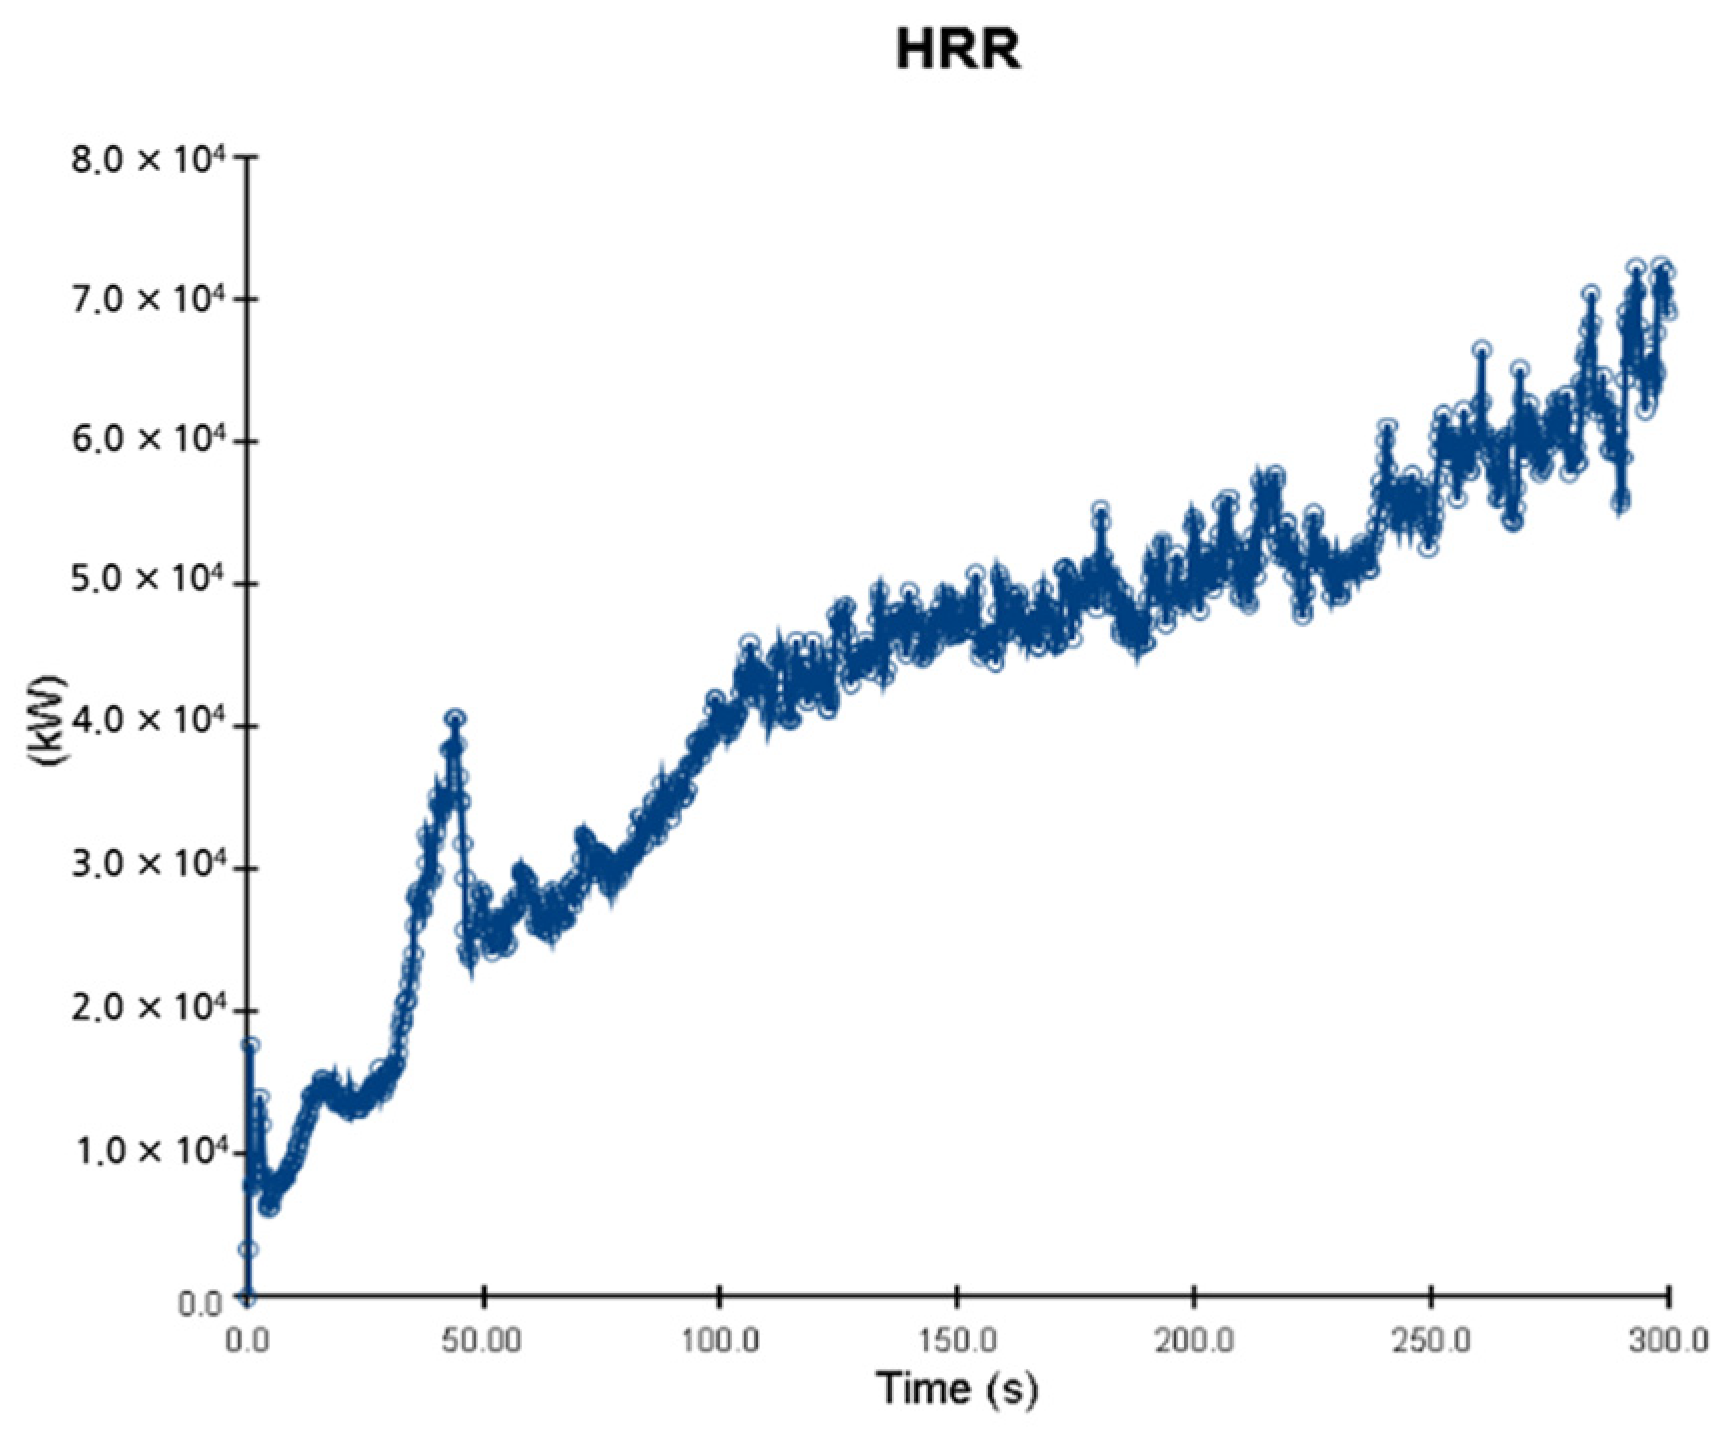
In the HRR case, as shown in Figure 26, after 50 s, the HRR increased significantly until 120 s. However, the maximum HRR is 20,000 kW/m3, which is the same as that shown in Figure 10. The reason for this is that the kerosene room does not have sufficient air, therefore, regardless of the pool size, if the kerosene volume is more than 3 m3, the maximum HRR values are the same in any case, since the HRR tends to drop due to the lack of oxidants.

5.4. 10 m 3 Kerosene Release with Sprinkler

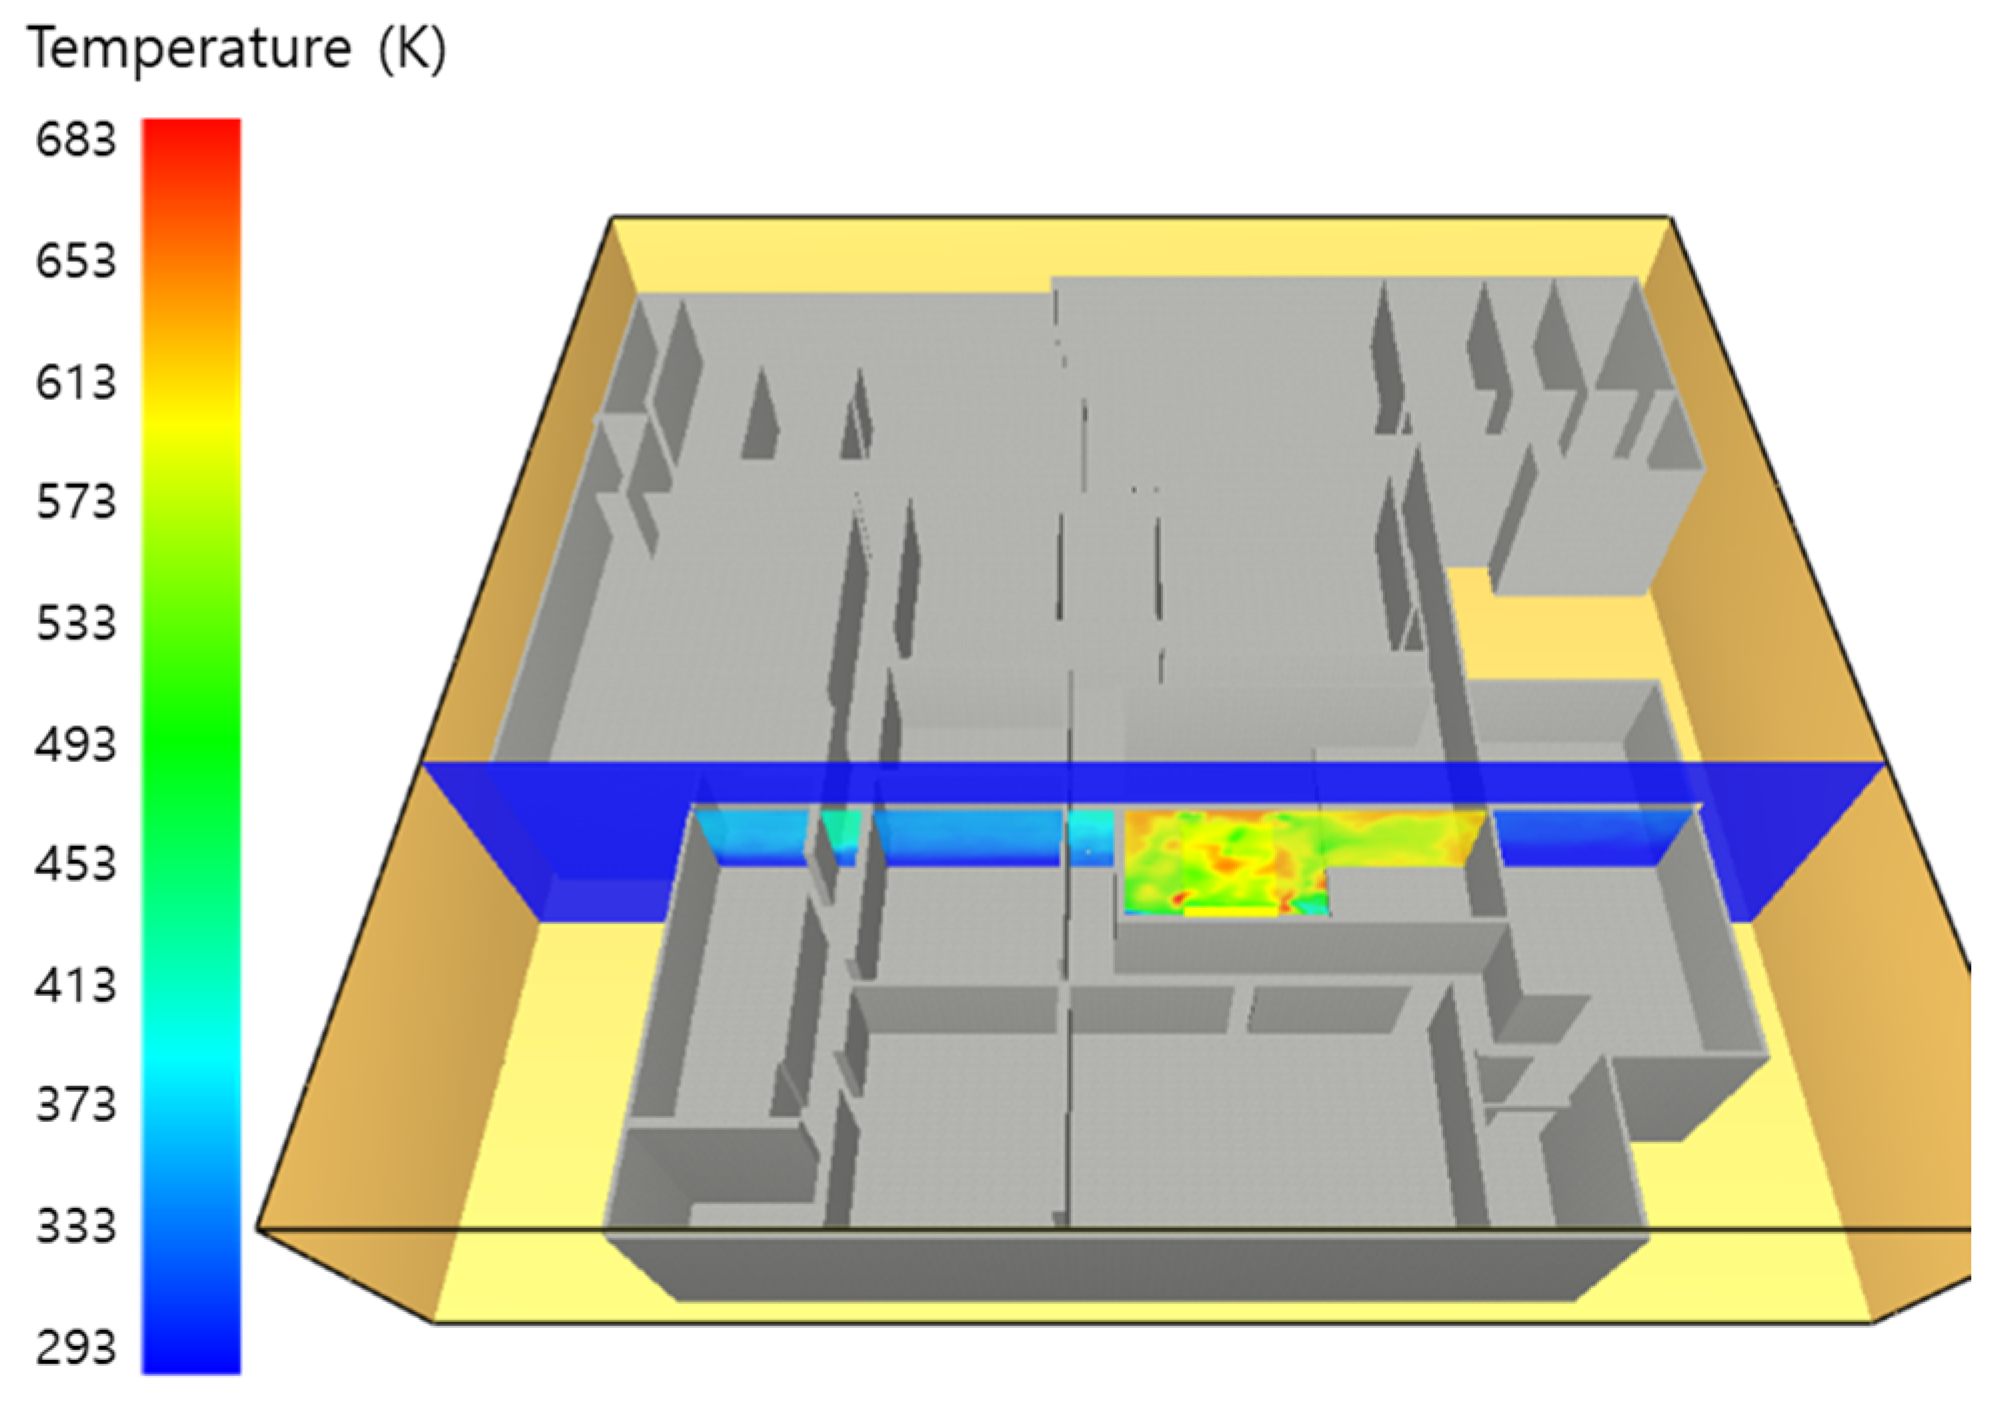
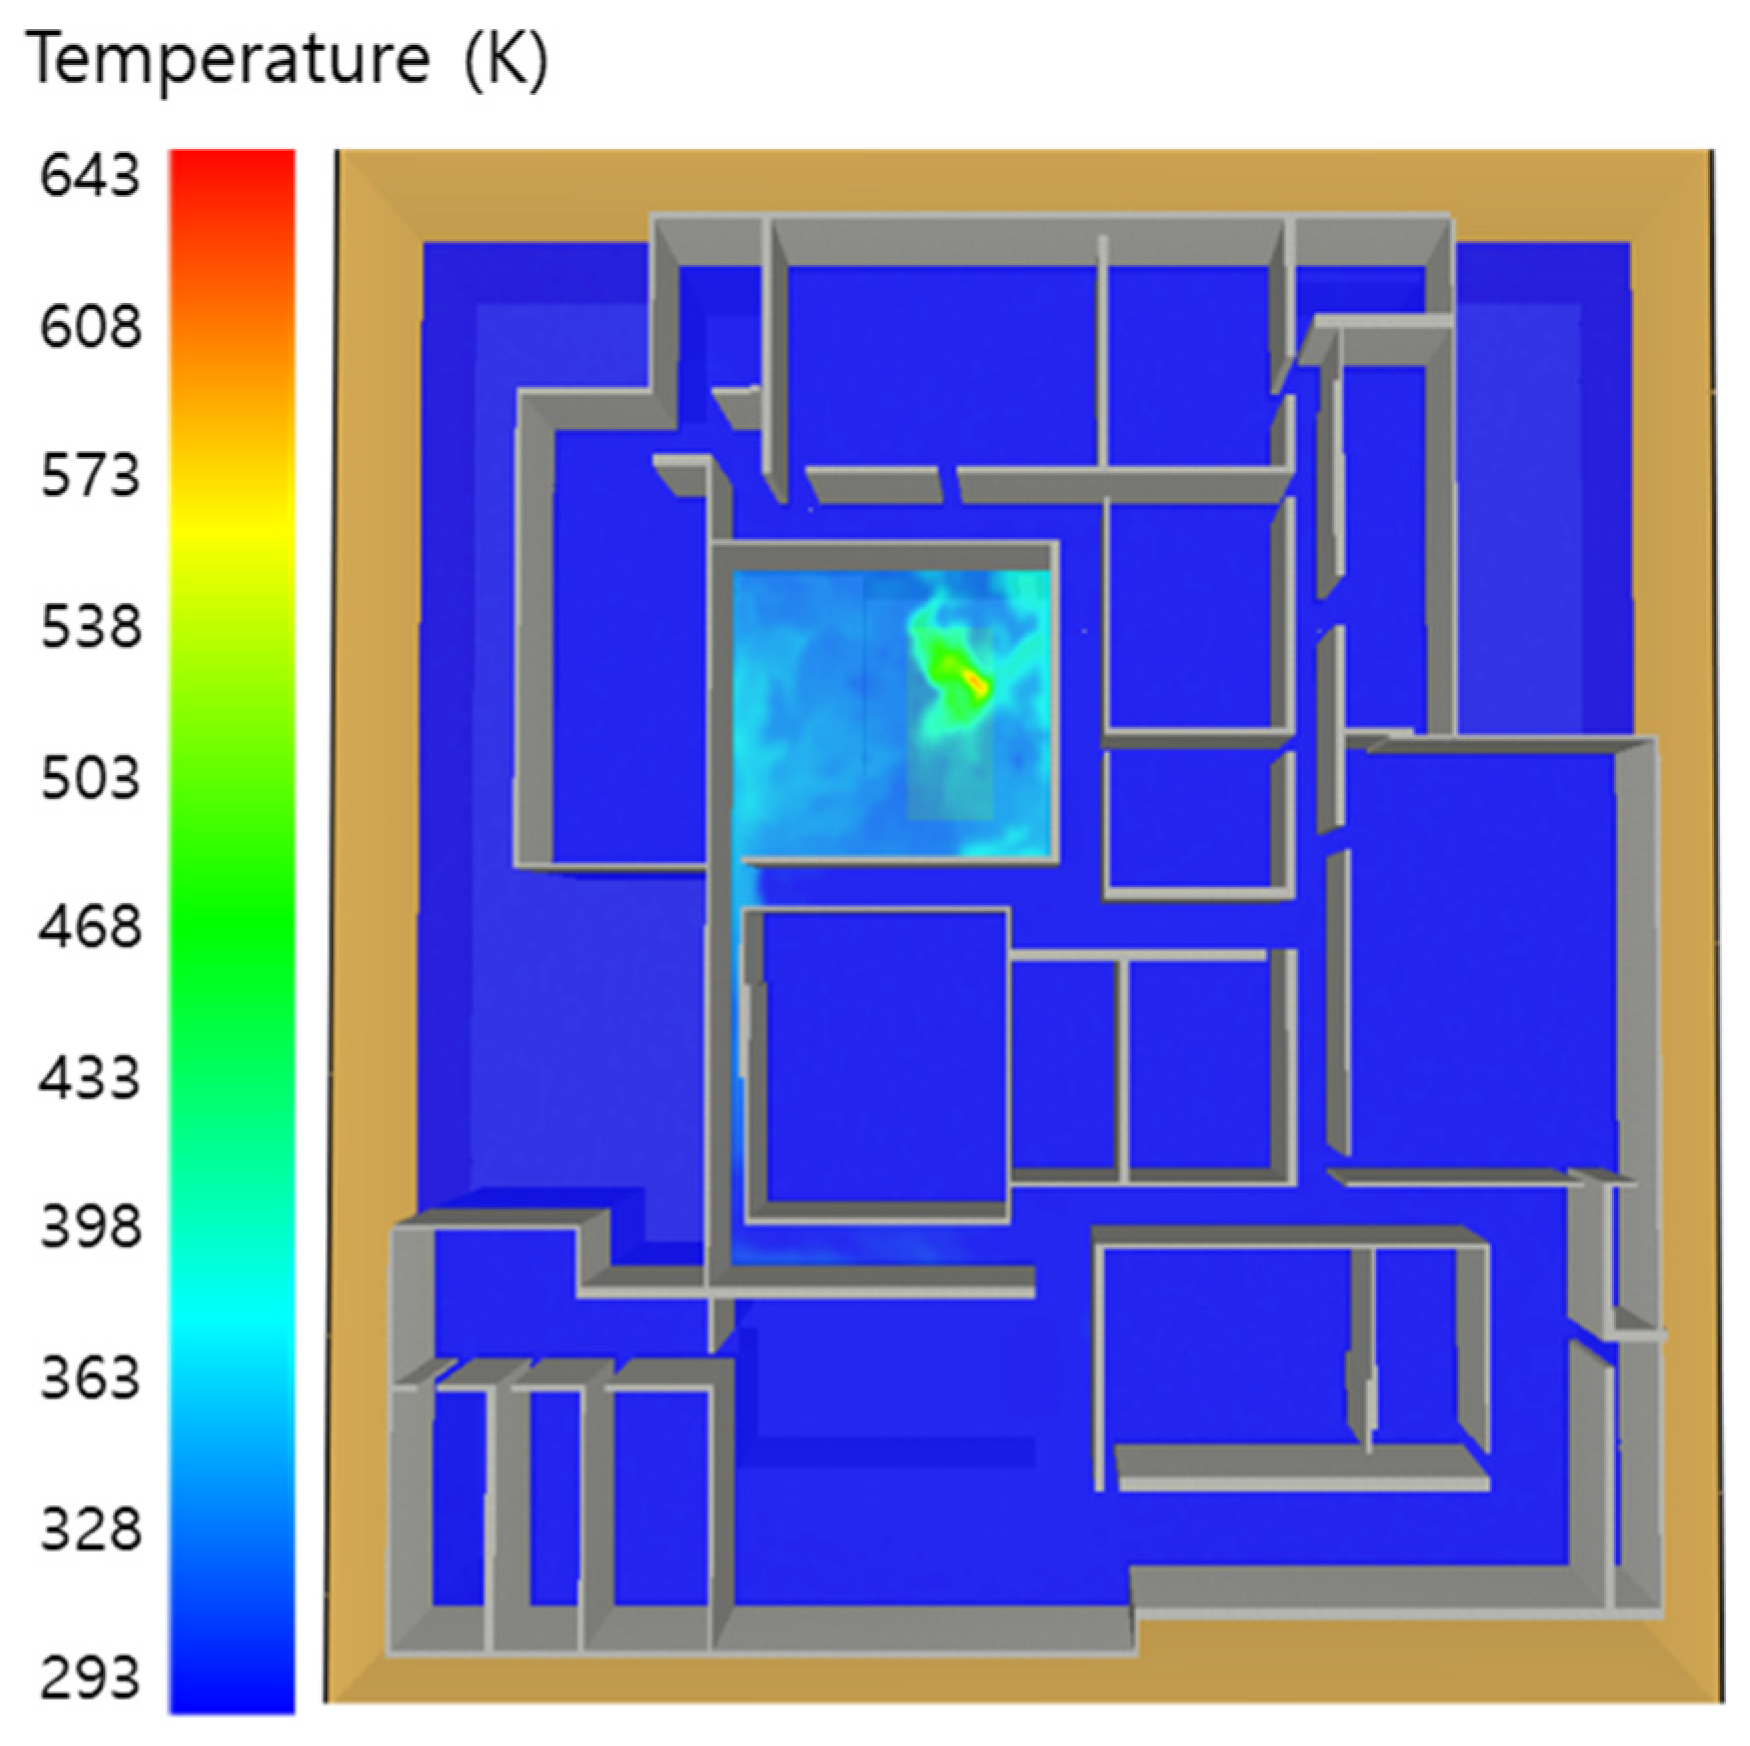
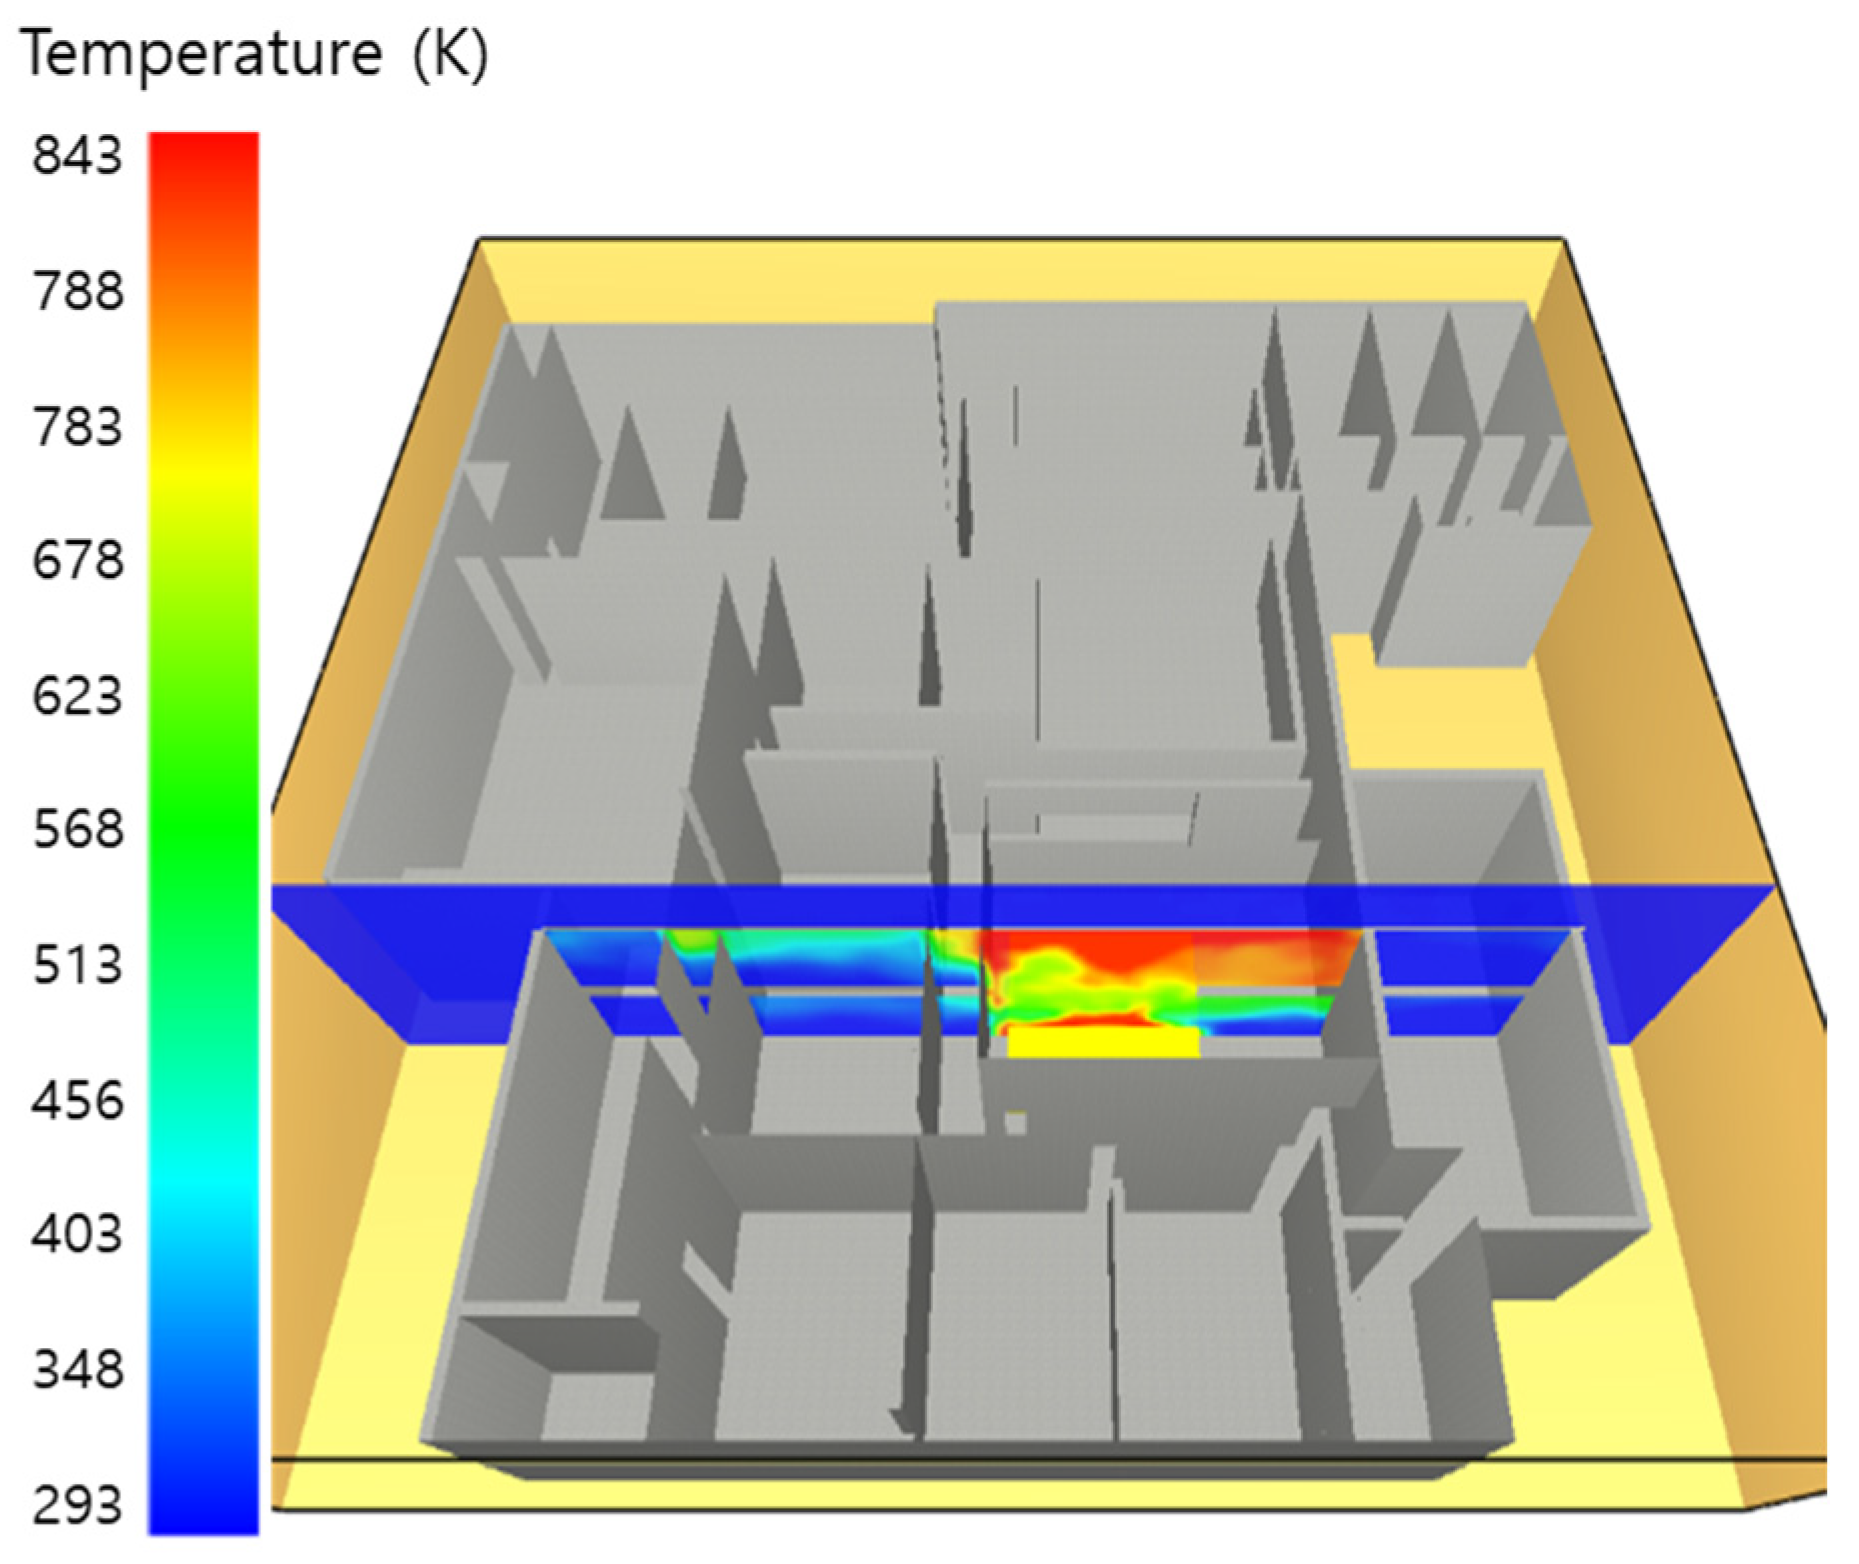
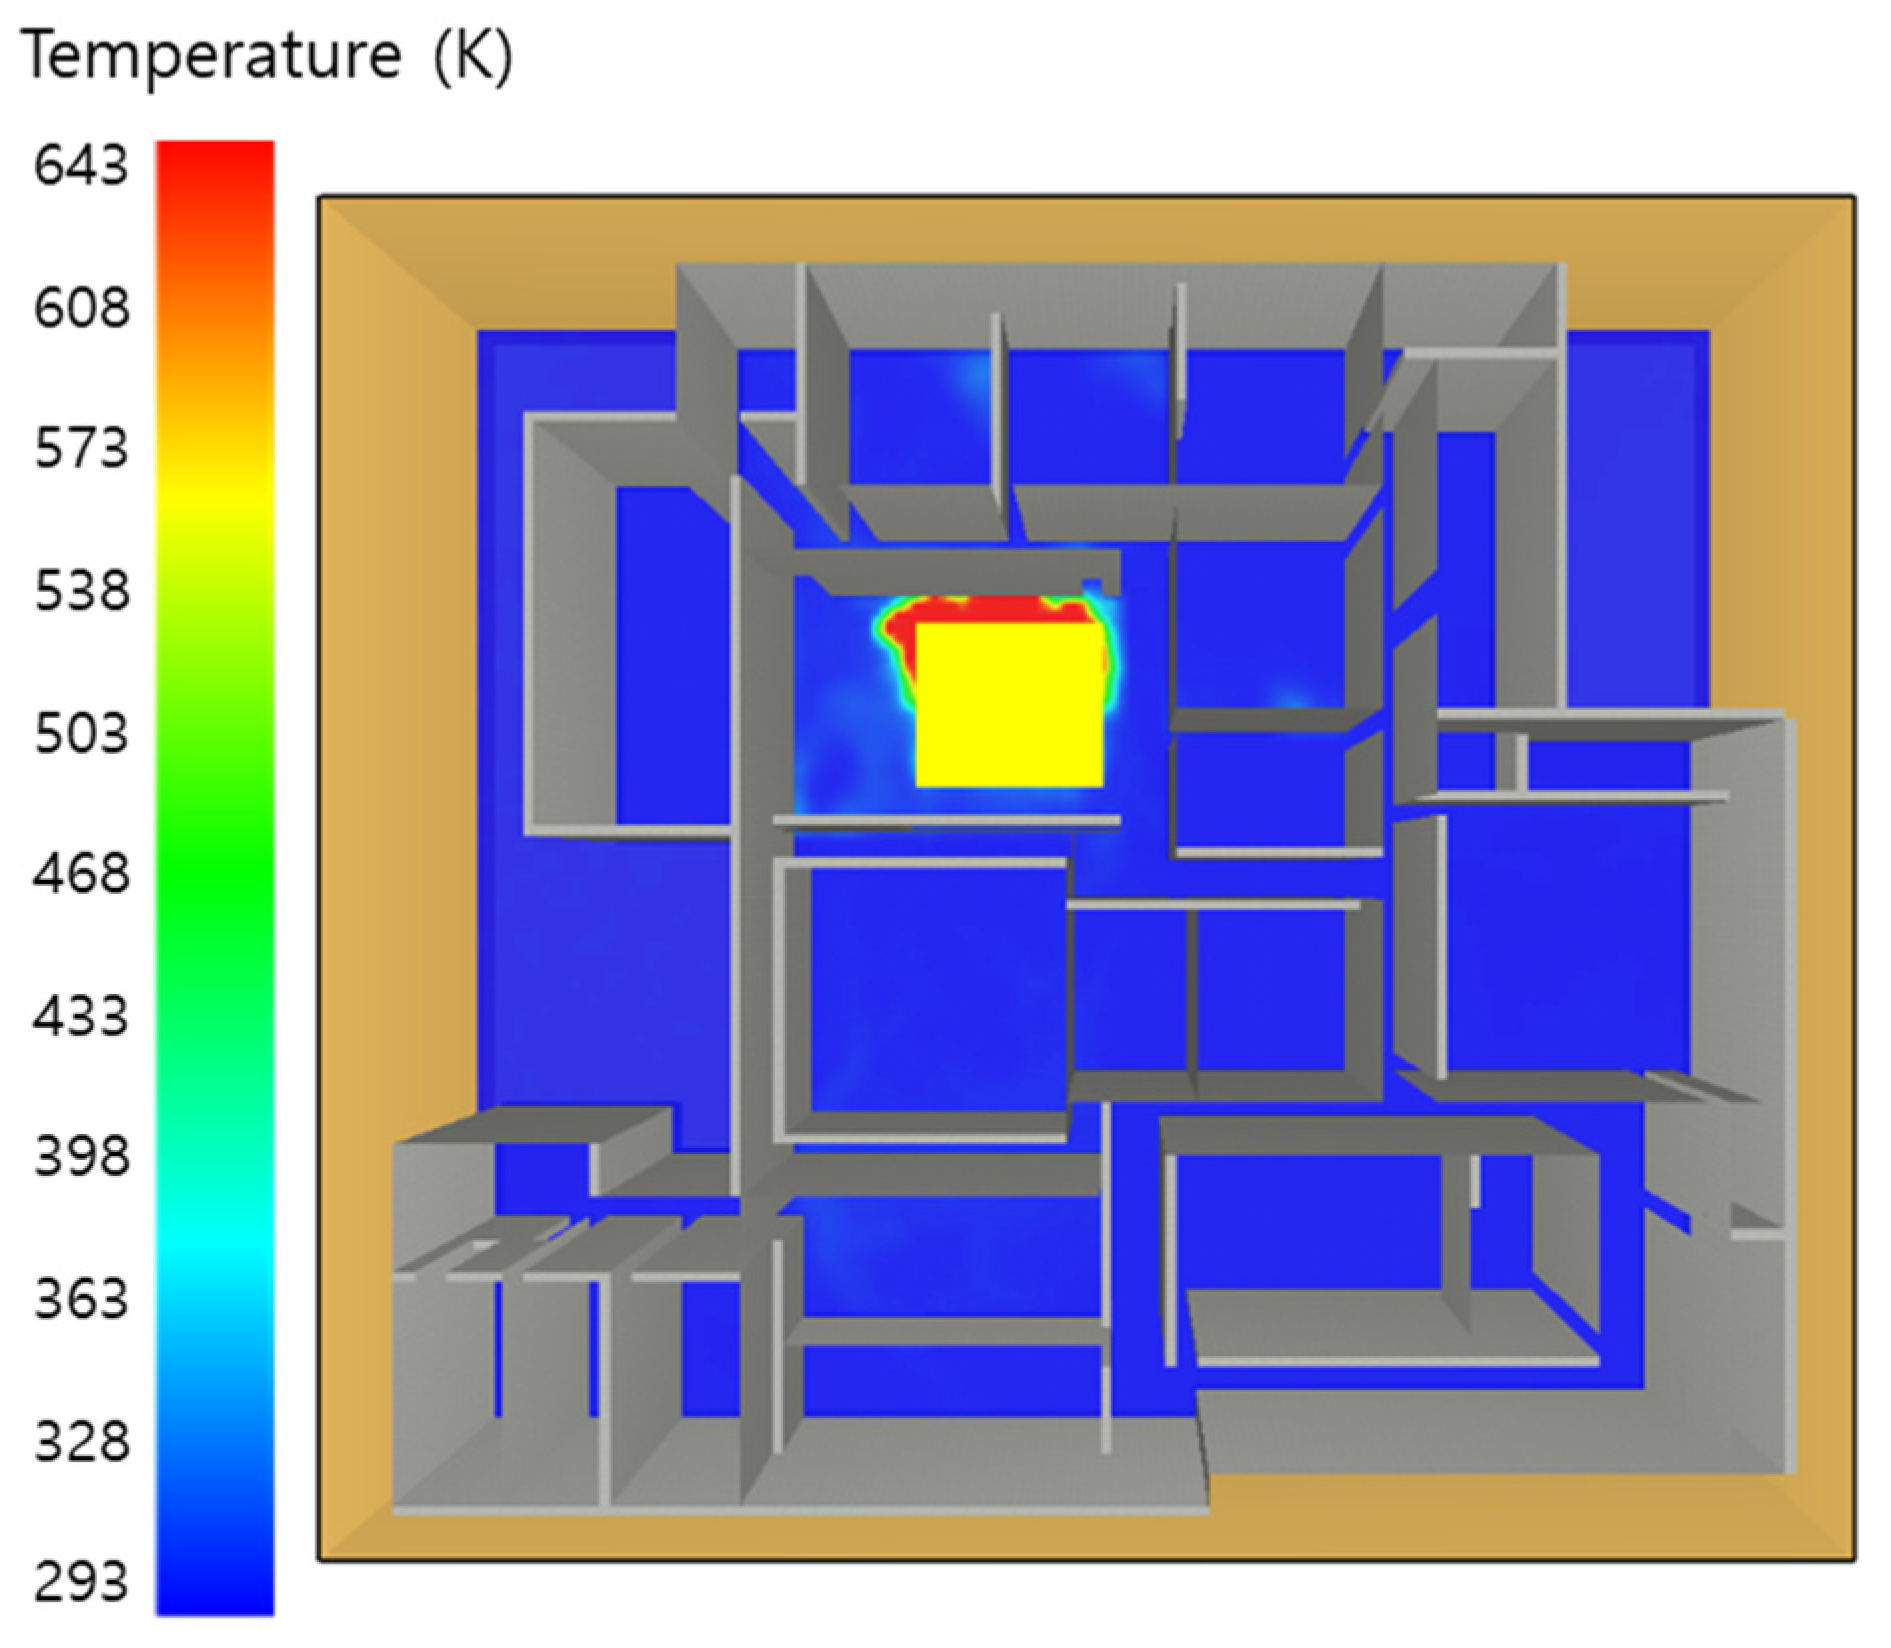
Figure 27 and Figure 28 show the temperature shift in the kerosene storage room. After 60 s, the maximum temperature of 640 K is detected, but it is 200 K less than that shown in Figure 19 and Figure 20 because of the sprinkler operation. At 240 s, because of the sprinkler and the lack of air, the ambient temperatures dropped to 500 K, which is the same temperature as that shown in Figure 19 and Figure 20, and it is high despite the sprinklers being activated. The condensed plumes increased the density and specific heat by sprinkled water, which prevented heat emission. At the XY plane, the temperatures are shown in Figure 29 and Figure 30. After 60 s, the plume’s temperature is higher than 550 K, and is dispersed in the 12 o’clock direction through the door. At 250 s, the plumes dispersed into the adjacent corridors in the 12 o’clock and 9 o’clock directions. However, as shown in Figure 30, the plume diffusion inclination is parallel to that shown in Figure 13. The reason is that the condensed plume by water has a low diffusion velocity, and relatively hot plumes spread upward due to a faster diffusion rate. Therefore, the colder and slower plumes gradually spread in the 12 o’clock direction.
Figure 31, Figure 32, Figure 33 and Figure 34 show the global temperature shift trend at B1 over time. After 60 s, the plumes were dispersed through the adjacent corridors in the 6 o’clock direction and the storage room temperatures increase more than 500 K; at 160 s, the southernmost room temperatures increased to 450 K. Then, the plumes moving in the southernmost room dispersed through the adjacent corridors. At 240 s, the plumes dispersed to the easternmost room and the heat spread to the entirety of B1. At 300 s, although the heat had spread to entirety of B1, the sprinkler had been activated. Therefore, due to the lack of air and cooling by the sprinkler, the temperatures decreased.
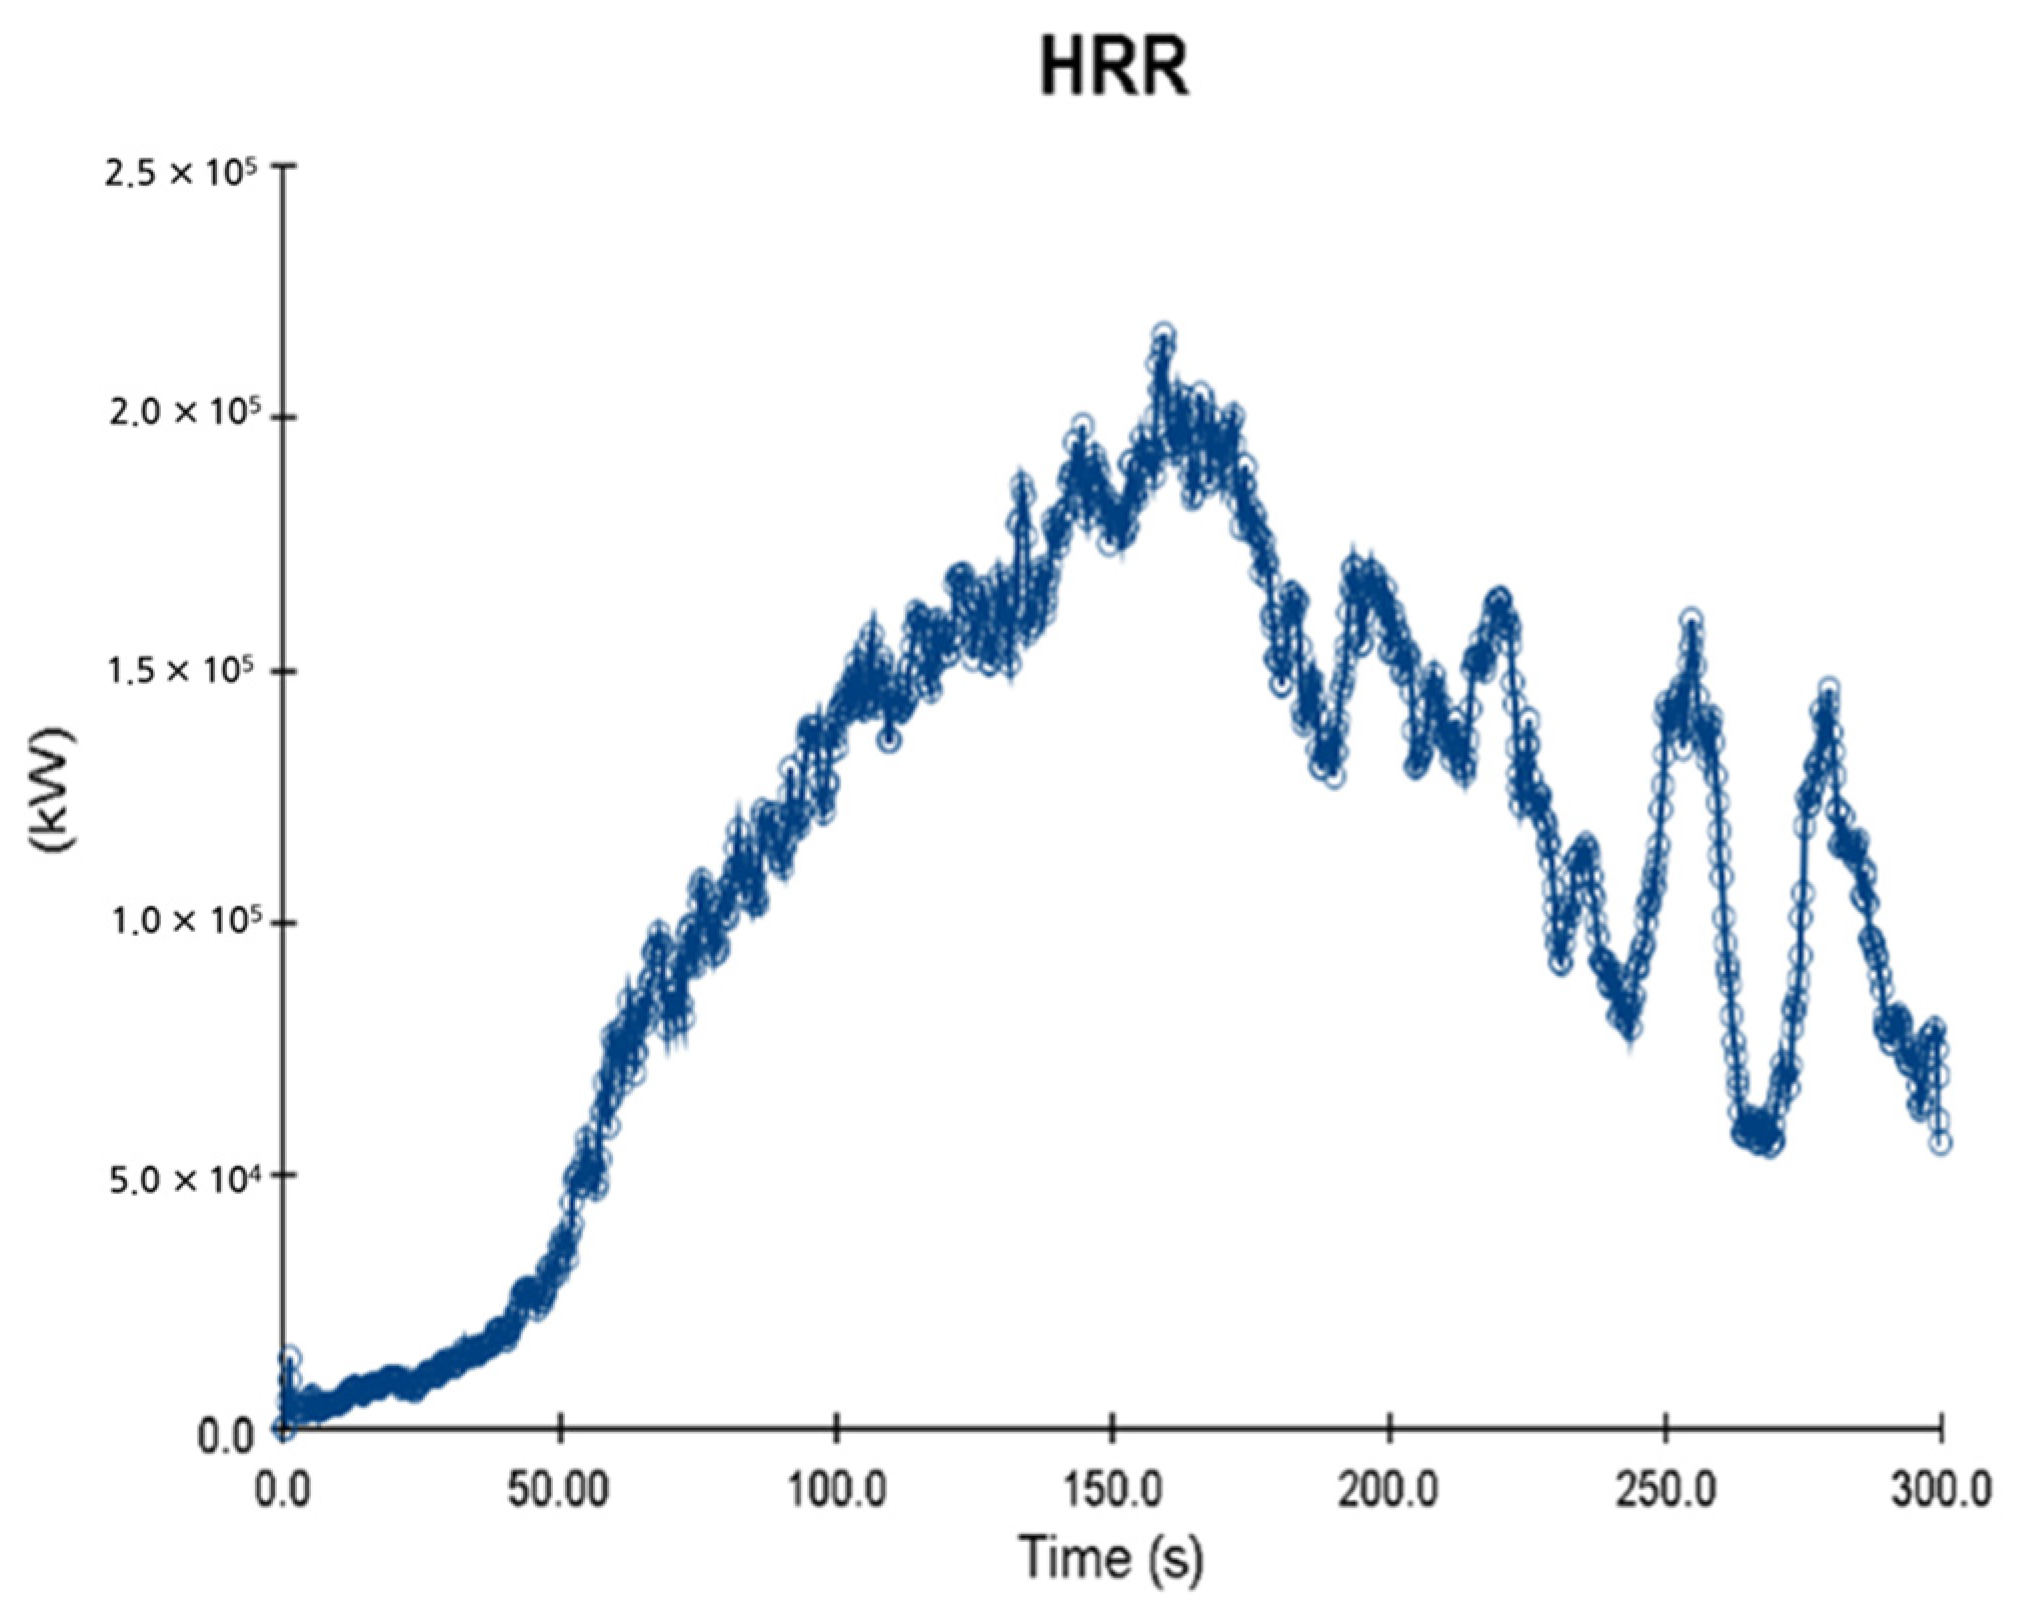
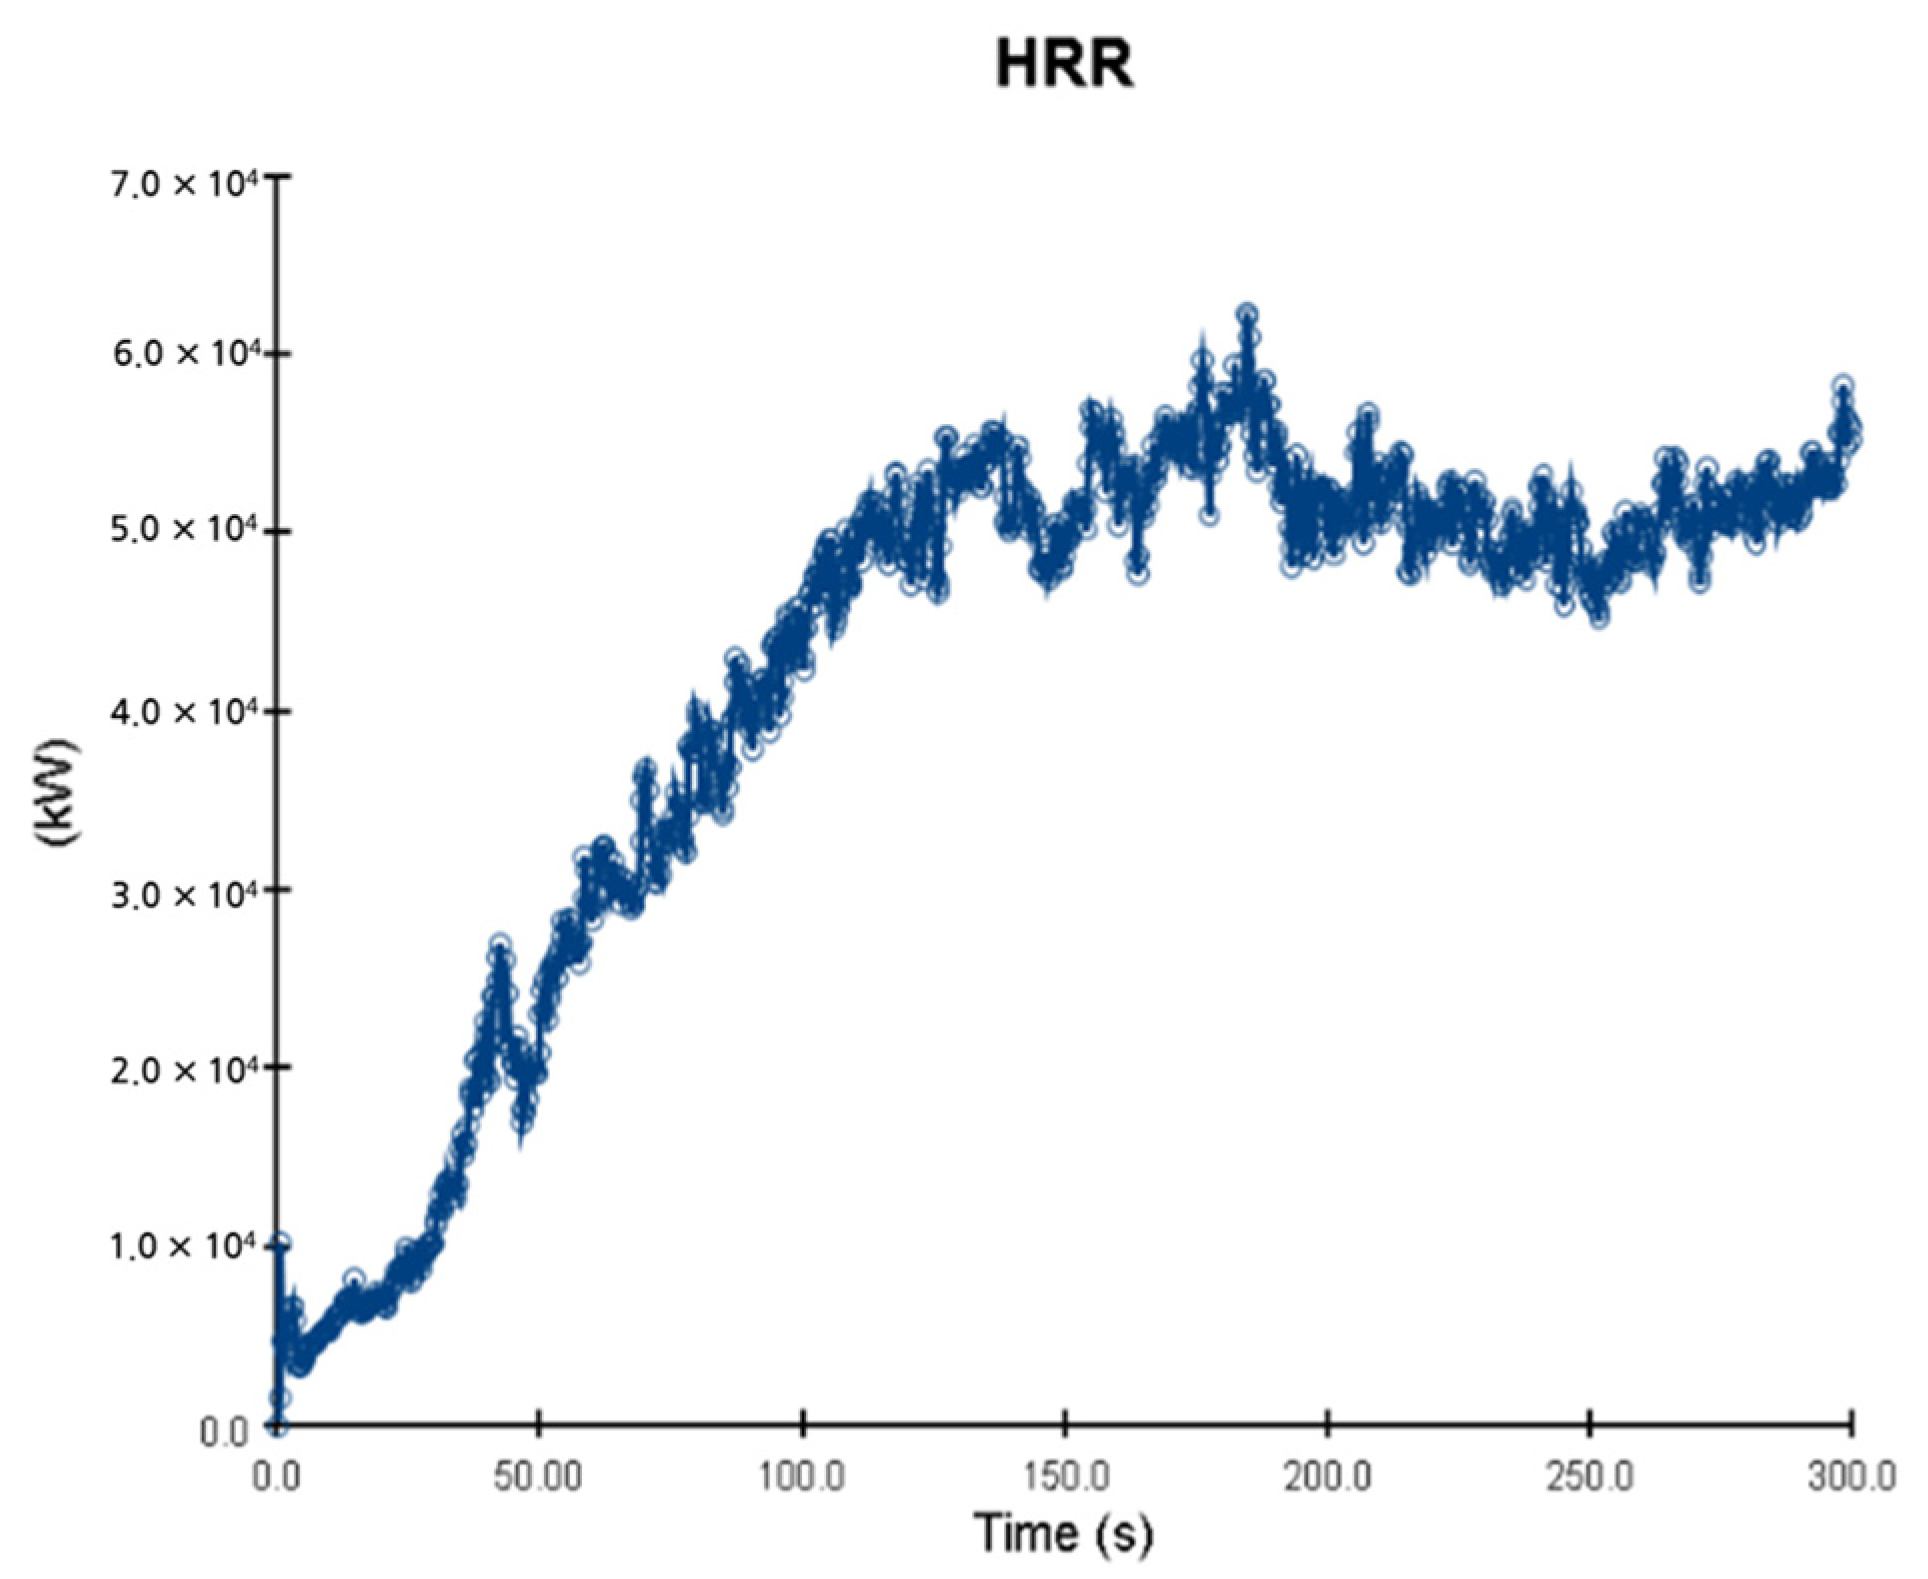
In the HRR case, as shown in Figure 35, the maximum HRR decreased from 25,000 kW/m3 to 8000 kW/m3 by 68%, and the temperature dropped from 800 K to 450 K by 44%. However, as shown in Figure 35, the HRR increased steadily, unlike that shown in Figure 18. The reason for this is that without the sprinkler, each plume has less thermal energy, because the sprinkled plumes have a more specific heat, and due to its higher velocity, the plumes can be dispersed into the atmosphere swiftly. The thermal energy discharge rate can be accelerated by reducing the ventilation period and increasing the ventilation flow rate.

6. Conclusions and Discussion

In each scenario, the thermal energy changes, based on the presence or absence of sprinklers, were as follows.
① 3 m 3 release cases
Owing to the sprinkled water, the maximum temperature dropped from 900 K to 600 K by 33%, and the maximum HRR dropped from 20,000 kW/m3 to 6000 kW/m3 by 70%. However, at 300 s with the sprinkler, the HRR was higher than that without the sprinkler, because without the sprinkler plumes, thermal energy discharges more swiftly than sprinkler plumes.
② 10 m 3 release cases
Owing to the sprinkled water, the maximum temperature dropped from 800 K to 450 K by 44%, and the maximum HRR dropped from 25,000 kW/m3 to 8000 kW/m3 by 68%. However, at 300 s with the sprinkler, the HRR was higher than that without the 3 m3 release cases. To discharge the thermal energy quickly, it is necessary to reduce the ventilation period and increase ventilation flow rate.
In particular, the leaked kerosene volumes, such as 10 m3 and 3 m3, were not affected seriously by the plume’s temperature and HRR. That is why the plume’s temperature produced by the kerosene is always fixed if the kerosene completely combusted. So, at 0 to 120 s, where the oxidants are present sufficiently regardless of the leaked volume, the maximum temperatures are similar. Owing to the sprinklers, the plumes are cooled, but the HRR is different in these cases. The reason is that the HRR is dependent on the pool size, as a 10 m3 leakage pool size is larger than 3 m3; therefore, the combustible area and kerosene–oxidants mixture quantities are larger than in the 10 m3 leakage case. Therefore, the heat release rate is increased in the 10 m3 leakage case. Moreover, owing to the hot plumes, the water is evaporated, which increases the plume’s specific heat and density, and decreases the diffusivity of plumes. So, even if the temperatures are dropped, the thermal energy cannot easily spread. As shown Figure 12 and Figure 21, the slope of the HRR tends to decrease. That is why by using the sprinklers, the temperatures and combustion rates decrease. Therefore, we expect that, after a few minutes, the fires should be completely suppressed and the HRR should drop under the 3.7 kW/m3 level, which is an acceptable value for the safety of humans and materials.
Through the FDS simulation, we could predict the results through the kerosene pool fire and sprinklers. Finally, the fuel types affect the maximum temperature and the pool size affects the HRR. To handle the fire accidents appropriately for swiftly exhausting the plumes, based on the FDS results, ventilation facilities need to be magnified. It is expected that the results calculated as above can be used to help the formulate an escape route and the underground design, and can have a greater impact on the actual safety design and safety analysis.

Author Contributions

Conceptualization: I.S.Y. and E.S.J.; methodology: H.J.K. and K.M.J.; formal analysis: H.J.K.; data curation: K.M.J.; writing—original draft preparation: H.J.K., K.M.J. and E.S.J.; writing—review and editing: H.Y.O. and S.I.K.; visualization: H.J.K.; supervision: E.S.J. All authors have read and agreed to the published version of the manuscript.

Funding

This research did not receive any specific grant from funding agencies in the public, commercial, or not-for-profit sectors.

Institutional Review Board Statement

Not applicable.

Informed Consent Statement

Not applicable.

Data Availability Statement

Data is contained within the article.

Acknowledgments

This work was supported by the Korea Space Launch Vehicle (KSLV-II) funded by the Ministry of Science and ICT (MSIT, Republic of Korea).

Conflicts of Interest

The authors declare no conflict of interest.

Nomenclature

C Water flow rate coefficient
ρ Kerosene density
f o u t External force
σ i j Stress Tensor
g Gravitational force
β Water Volume Fraction
h Enthalpy
k Fuel Constant
P Pressure
m ˙ w Water Impining Coefficient
Q ˙ Total Heat Release Rate
μ Viscosity
R T I Water Flow Rate Coefficient
q ˙ H HRR from combustion
T Temperature
q ˙ e Heat of Vaporization
T g Gas Temperature
q ˙ c Conductive and Radiative Heat Transfer
T l Link Temperature
P r t Prandtl Number
T m Sprinkler tip temperature
S c t Schmidt Number
u Velocity
C s Grid Cell Coefficient

References

  1. Altavilla, A.; Garbellini, L. Risk assessment in the aerospace industry. Saf. Sci. 2002, 40, 271–298. [Google Scholar] [CrossRef]
  2. Padiha, D.; Butt, C.; Tisato, J.; Wilson, S. The Australian approach to ground population modelling and risk assessment. In Proceedings of the 4th IAASS Workshop on Launch and Re-Entry Safety, Chincoteague, VA, USA, 18 September 2012; pp. 1–6. Available online: https://www.semanticscholar.org/paper/THE-AUSTRALIAN-APPROACH-TO-GROUND-POPULATION-AND-Padilha-Butt/0f3042cca8f4363ba0179a3eaeb7e440198fd656 (accessed on 13 March 2022).
  3. Lariviere, M.; Kezirian, M.T. Preliminary safety assessment of the DLR SpaceLiner vehicle. J. Space Saf. Eng. 2019, 6, 15–23. [Google Scholar] [CrossRef]
  4. Jeon, G.Y.; Na, W.J.; Hong, W.H. A study on the prediction of evacuation behavior through virtual-reality simulation for an evacuation simulation in underground spaces. Korea Inst. Archit. Sustain. Environ. Build. Syst. 2007, 1, 36–42. [Google Scholar]
  5. Park, J.K.; Roh, S.K.; Seo, Y.M. A Study on the Risk Assessment System of the Underground Space. J. Korean Inst. Fire Sci. Eng. 2002, 16, 70–74. [Google Scholar]
  6. Ronchi, E.; Alvear, D.; Berloco, N.; Capote, J.; Colonna, P.; Cuesta, A. Human Behavior In Road Tunnel Fires: Comparison Between Egress Models (FDS+Evac, STEPS, Pathfinder). In Proceedings of the 12th International Interflam 2010 Conference, Nottingham, UK, 5–7 July 2010. [Google Scholar]
  7. Nakakuki, A. Heat transfer in hot-zone-forming pool fires. Combust. Flame 1997, 109, 353–369. [Google Scholar] [CrossRef]
  8. Park, H.-J.; Cha, J.-H. Combustion Characteristics of Pool Fire by Height of Fire Source. J. Korea Acad. Ind. Coop. Soc. 2010, 11, 4671–4676. [Google Scholar]
  9. Ministry of Public Administration and Security. The Framework Act on Firefighting Services, 2022. Available online: https://elaw.klri.re.kr/kor_service/lawView.do?hseq=60700&lang=ENG (accessed on 20 November 2022).
  10. Chi, J.-H.; Wu, S.-H.; Shu, C.-M. Using Fire Dynamics Simulator to Reconstruct a Hydroelectric Power Plant Fire Accident. J. Forensic Sci. 2011, 56, 1639–1644. [Google Scholar] [CrossRef]
  11. McGrattan, K.; McDermott, R.; Weinschenk, C.; Forney, G. Fire Dynamics Simulator, Technical Reference Guide; National Institute of Standards and Technology: Gaithersburg, MD, USA, 2013.
  12. McGrattan, K.; McDermott, R.; Weinschenk, C.; Overholt, K. Fire Dynamics Simulator User’s Guide; National Institute of Standards and Technology: Gaithersburg, MD, USA, 2013.
  13. Kim, S.-C. A Numerical Study of the Effect of Sprinkler Spray on the Flow Characteristics Induced by Fire. J. Korean Inst. Fire Sci. Eng. 2012, 26, 105–110. [Google Scholar] [CrossRef]
  14. Ko, G.H. Estimation of FDS Prediction Performance on the Operation of Water-Mist. J. Korea Acad. Coop. Soc. 2014, 15, 4809–4814. [Google Scholar]
  15. Kim, J.H.; Kim, W.H.; Lee, S.K. A comparison of the prediction of sprinkler response time applying fire models. Korean Inst. Fire Sci. Eng. 2001, 15, 46–52. [Google Scholar]
  16. Kim, S.-C. Activation Conditions of Sprinkler Head Considering Fire Growth Scenario. Fire Sci. Eng. 2020, 34, 45–51. [Google Scholar] [CrossRef]
  17. Lee, S.; Landucci, G.; Reniers, G.; Paltrinieri, N. Validation of Dynamic Risk Analysis Supporting Integrated Operations Across Systems. Sustainability 2019, 11, 6745. [Google Scholar] [CrossRef]
  18. Goerlandt, F.; Khakzad, N.; Reniers, G. Validity and validation of safety-related quantitative risk analysis: A review. Saf. Sci. 2017, 99, 127–139. [Google Scholar] [CrossRef]
  19. Burt, B.A. Definitions of risk. J. Dent. Educ. 2001, 65, 1007–1008. [Google Scholar] [CrossRef] [PubMed]
  20. Kaplan, S.; Garrick, B.J. On the quantitative definition of risk. Risk Anal. 1981, 1, 11–27. [Google Scholar] [CrossRef]
  21. Korea Safety and Health Corporation: Occupational Safety and Health Act 2020. Available online: https://elaw.klri.re.kr/kor_service/lawView.do?hseq=55395&lang=ENG (accessed on 12 August 2021).
  22. Vasanth, S.; Tauseef, S.; Abbasi, T.; Abbasi, S. Assessment of four turbulence models in simulation of large-scale pool fires in the presence of wind using computational fluid dynamics (CFD). J. Loss Prev. Process. Ind. 2013, 26, 1071–1084. [Google Scholar] [CrossRef]
  23. Kim, S.-C. Predicting the Mass Burning Flux of Methanol Pool Fires by Using FDS Model. Fire Sci. Eng. 2017, 31, 12–18. [Google Scholar] [CrossRef]
  24. Jaebum, K.; Jaemoon, L.; Sehong, M. Study of the Reliability of the FDS Fire Model by Verification Experiments. J. Korean Soc. Hazard Mitig. 2019, 19, 197–203. [Google Scholar]
  25. Liu, Z.; Kim, A.K.; Carpenter, D. A study of portable water mist fire extinguishers used for extinguishment of multiple fire types. Fire Saf. J. 2007, 42, 25–42. [Google Scholar] [CrossRef]
  26. Sun, B.; Guo, K.; Pareek, V.K. Computational fluid dynamics simulation of LNG pool fire radiation for hazard analysis. J. Loss Prev. Process. Ind. 2014, 29, 92–102. [Google Scholar] [CrossRef]
  27. Kim, M.B.; Jang, Y.J.; O Yoon, M. Extinction limit of a pool fire with a water mist. Fire Saf. J. 1997, 28, 295–306. [Google Scholar] [CrossRef]
  28. Mishra, K.B. Experimental Investigation and CFD Simulation for Organic Peroxide Pool Fires (TBPB and TBPEH); BAM: Berlin, Germany, 2010. [Google Scholar]
  29. Roh, J.S.; Ryou, H.S.; Park, W.H.; Jang, Y.J. CFD simulation and assessment of life safety in a subway train fire. Tunn. Undergr. Space Technol. 2009, 24, 447–453. [Google Scholar] [CrossRef]
  30. Yoo, J.H.; Kim, B.S.; Lee, H.S.; Ko, E.S.; Lee, G.B. A study on consequence analysis of LNG/LPG/Gasoline station. J. Korean Inst. Gas 2009, 13, 54–60. [Google Scholar]
  31. Yang, P.; Tan, X.; Xin, W. Experimental study and numerical simulation for a storehouse fire accident. Build. Environ. 2011, 46, 1445–1459. [Google Scholar] [CrossRef]
  32. Wen, J.; Kang, K.; Donchev, T.; Karwatzki, J. Validation of FDS for the prediction of medium-scale pool fires. Fire Saf. J. 2007, 42, 127–138. [Google Scholar] [CrossRef]
  33. Hong, T.-K.; Roh, B.-S.; Park, S.-H. A Study on the Characteristics of FDS Heat Release Rate Predictions for Fire involving Solid Combustible Materials in a Closed Compartment. J. Korea Acad.-Ind. Coop. Soc. 2020, 21, 349–356. [Google Scholar]
  34. Magee, J.W.; Bruno, T.J.; Friend, D.G.; Huber, M.L.; Laesecke, A.; Lemmon, E.W.; McLinden, M.O.; Perkins, R.A.; Baranski, J.; Widegren, J.A. Thermophysical Properties Measurements and Models for Rocket Propellant RP-1: Phase I. National Institute of Standards and Technology (NIST), USA. 2007. Available online: https://nvlpubs.nist.gov/nistpubs/Legacy/IR/nistir6646.pdf/ (accessed on 27 December 2021).
  35. Vukadinovic, V.; Habisreuther, P.; Zarzalis, N. Influence of pressure and temperature on laminar burning velocity and Markstein number of kerosene Jet A-1: Experimental and numerical study. Fuel 2013, 111, 401–410. [Google Scholar] [CrossRef]
  36. Zhang, M.; Hu, Z.; He, G.; Liu, P. Large-eddy simulation of kerosene spray combustion in a model scramjet chamber. J. Aerosp. Eng. 2010, 224, 949–960. [Google Scholar] [CrossRef]
  37. Hautman, D.J.; Dryer, F.L.; Schug, K.P.; Glassman, I. A multiple-step overall kinetic mechanism for the oxidation of hydrocarbons. Combust. Sci. Technol. 1981, 25, 219–235. [Google Scholar]
Figure 1. Definition of Risk.
Fire 06 00385 g001
Figure 2. Consequence analysis scheme.
Fire 06 00385 g002
Figure 3. Schematics of launchpad first basement floor (left) and second basement floor (right).
Fire 06 00385 g003
Figure 4. Kerosene storage room temperature (X = 12, 60 s).
Fire 06 00385 g004
Figure 5. Kerosene storage room temperature (X = 12, 120 s).
Fire 06 00385 g005
Figure 6. Kerosene storage room temperature (Z = 6.5, 60 s).
Fire 06 00385 g006
Figure 7. Kerosene storage room temperature (Z = 6.5, 120 s).
Fire 06 00385 g007
Figure 8. Kerosene storage room temperature (Z = 11.5, 120 s).
Fire 06 00385 g008
Figure 9. Kerosene storage room temperature (Z = 11.5, 220 s).
Fire 06 00385 g009
Figure 10. Total HRR of 3 m 3 released without sprinkler.
Fire 06 00385 g010
Figure 11. Kerosene storage room temperature (X = 12, 60 s).
Fire 06 00385 g011
Figure 12. Kerosene storage room temperature (X = 12, 120 s).
Fire 06 00385 g012
Figure 13. Kerosene storage room temperature (X = 12, 220 s).
Fire 06 00385 g013
Figure 14. Kerosene storage room temperature (Z = 6.5, 220 s).
Fire 06 00385 g014
Figure 15. Kerosene storage room temperature (Z = 11.5, 30 s).
Fire 06 00385 g015
Figure 16. Kerosene storage room temperature (Z = 11.5, 150 s).
Fire 06 00385 g016
Figure 17. Kerosene storage room temperature (Z = 11.5, 300 s).
Fire 06 00385 g017
Figure 18. Total HRR of 3 m 3 kerosene released with sprinkler.
Fire 06 00385 g018
Figure 19. Kerosene storage room temperature (X = 12, 60 s).
Fire 06 00385 g019
Figure 20. Kerosene storage room temperature (X = 12, 270 s).
Fire 06 00385 g020
Figure 21. Kerosene storage room temperature (Z = 6.5, 60 s).
Fire 06 00385 g021
Figure 22. Kerosene storage room temperature (Z = 6.5, 270 s).
Fire 06 00385 g022
Figure 23. Kerosene storage room temperature (Z = 11.5, 60 s).
Fire 06 00385 g023
Figure 24. Kerosene storage room temperature (Z = 11.5, 120 s).
Fire 06 00385 g024
Figure 25. Kerosene storage room temperature. (Z = 11.5, 300 s).
Fire 06 00385 g025
Figure 26. Total HRR 10 m 3 kerosene released without sprinkler.
Fire 06 00385 g026
Figure 27. Kerosene storage room temperature (X = 12, 60 s).
Fire 06 00385 g027
Figure 28. Kerosene storage room temperature (X = 12, 250 s).
Fire 06 00385 g028
Figure 29. Kerosene storage room temperature (Z = 6.5, 60 s).
Fire 06 00385 g029
Figure 30. Kerosene storage room temperature (Z = 6.5, 250 s).
Fire 06 00385 g030
Figure 31. Kerosene storage room temperature (Z = 11.5, 60 s).
Fire 06 00385 g031
Figure 32. Kerosene storage room temperature (Z = 11.5, 160 s).
Fire 06 00385 g032
Figure 33. Kerosene storage room temperature (Z = 11.5, 240 s).
Fire 06 00385 g033
Figure 34. Kerosene storage room temperature (Z = 11.5, 300 s).
Fire 06 00385 g034
Figure 35. Total HRR of 10 m 3 kerosene released with sprinkler.
Fire 06 00385 g035
Table 1. Properties of kerosene [34,35].
Physical PropertiesValuePhysical PropertiesValue
Critical temperature (°C)321.45Viscosity (N·s/m2 ) 0.00164
Boiling point (°C)150.82Critical pressure (bar)22.9
Flammable/toxicFlammableSurface tension (N/m)0.0275
Molecular weight (g/mol)154.74Upper flammable limit (%)5.6
Lower flammable limit (%)0.7Density (kg/m3)820
Heat of combustion (kJ/kg)43,200Burning velocity (mm/s)0.07
Table 2. Kerosene reaction and species production rate [36,37].
ReactionSpecies Production Rate
C n H m 2 n C 2 H 4 + m 2 n H 2 ω 1 = 2.09 × 10 17 exp 24,962 T [ C n H m ] 0.5 [ O 2 ] 1.07 [ C 2 H 4 ] 0.4
C 2 H 4 + O 2 2 C O + 2 H 2 ω 2 = 5.01 × 10 14 exp 25,164 T [ C 2 H 4 ] 0.9 [ O 2 ] 1.18 [ C n H m ] 0.37
H 2 + 1 2 O 2 H 2 O ω 3 = 3.31 × 10 13 exp 20,634 T [ H 2 ] 0.85 [ O 2 ] 1.42 [ C 2 H 4 ] 0.56
C O + 1 2 O 2 C O 2 ω 4 = 4.00 × 10 14 exp 20,131 T [ C O ] 1.0 [ H 2 O ] 0.5 [ O 2 ] 0.25
Disclaimer/Publisher’s Note: The statements, opinions and data contained in all publications are solely those of the individual author(s) and contributor(s) and not of MDPI and/or the editor(s). MDPI and/or the editor(s) disclaim responsibility for any injury to people or property resulting from any ideas, methods, instructions or products referred to in the content.