Article

Regional Drivers behind the Burning of Remanent Forests in Michoacán Avocado Belt, Central Mexico

by
Luis D. Olivares-Martinez
1,2,
Alberto Gomez-Tagle
3,* and
Diego R. Pérez-Salicrup
4
1
Environmental Edaphology Group, Department of Agrochemistry and Environment, University Miguel Hernández, Avinguda de la Universitat d’Elx, s/n, 03202 Elche, Spain
2
Graduate Program in Integrative Ecology, Natural Resources Institute (INIRENA), Universidad Michoacana de San Nicolás de Hidalgo, Avenida Juanito Itzicuaro SN, Morelia 58330, Michoacán, Mexico
3
Earth Science Department, Natural Resources Institute (INRENA), Universidad Michoacana de San Nicolás de Hidalgo, Avenida Juanito Itzicuaro SN, Morelia 58330, Michoacán, Mexico
4
Ecosystems and Sustainability Research Institute (IIES), Universidad Nacional Autonóma de México (UNAM), Antigua Carretera a Patzcuaro No.8701 Col, Ex Hacienda de San José de la Huerta, Morelia 58190, Michoacán, Mexico
*
Author to whom correspondence should be addressed.
Submission received: 7 December 2022 / Revised: 14 February 2023 / Accepted: 15 February 2023 / Published: 21 February 2023

Abstract

:
The state of Michoacán in central Mexico supplies nearly 50% of the global avocado trade in a region known as the Michoacan Avocado Belt or Avocadoland. Fire has been a component associated with regional land-use change processes. We documented fire regime attributes for the period 2000–2017, discussed the use of fire related to the expansion of avocado orchards, and evaluated the role of atmospheric variables and human infrastructure. There was a mean of 276 fires covering 3287 ha of forest per year. Over 80% of the burned area was covered by pine and pine–oak forests, with a strong correlation of ignitions with the distance to urban settlements, roads, agricultural plots, and avocado orchards. There is a median fire return interval of 2–3 years, and the distance to avocado orchards and main roads was highly correlated with fire recurrence. Final users of the international marketing of this fruit may be unaware of the fire-related land-use changes, namely, the damage to biodiversity, forest health, and water bodies, as well as to producers’ well-being, behind the great demand for avocados. The present conditions of insecurity and social conflict must be addressed to guarantee, among other things, the conservation of these diverse forests.

1. Introduction

The avocado is a tropical, highly nutritious fruit whose consumption has been growing rapidly throughout the world, and Mexico has been leading this global production. According to FAO [1], this fruit has been produced in more than ninety countries, and during the last four decades, world production increased from 0.716 million tons in 1961 to 5.03 million tons in 2014. Within this period, the cultivated surface increased by roughly 700%, from 78,690 hectares to 547,849 hectares [2].
While Mexico’s production represents 45.95% of world exports, the state of Michoacan concentrates more than 85% of the national production [3,4]. The income generated by this fruit has grown rapidly, and by 2019, it reached almost 2.7 billion US dollars annually [4]. This production is concentrated in a region known as the Michoacan Avocado Belt (MAB, La Franja Aguacatera Michoacana in Spanish), the avocado growing-strip region [5], or even as Avocadoland because of international marketing [6]. Despite the undeniable economic profits associated with the production of this fruit, the unplanned and indiscriminate resulting land-use change has generated the irremediable degradation of forests, soils, and water [7,8,9,10]. The negative environmental impact of the agroindustrial production of avocado has been reported in central Mexico, Sierra de Bahoruco in the Dominican Republic, and La Ligua and Petorca valleys in Valparaiso, Chile [2,11,12,13,14,15].
This crop has doubled its cultivated area in Michoacan in less than ten years [7,10,16]. Although De la Tejera et al. [2] documented that the main transition occurred from traditional agriculture (small farmers growing rain-fed maize, beans, and squash) to intensive avocado cultivation, the process of land-use changes from native pine and pine–oak forest to avocado orchards was also intensified [8,10,17]. Hence, many of the orchards that currently produce avocado for exportation were established on what was until recently (<10 years) forest-covered land.
The threatened native forests of Michoacan, central Mexico, with the same ecological requirements as avocado plantations are highly diverse, with at least 13 pine and 24 oak species [18,19]. Felid and other wildlife groups are also threatened by avocado expansion [20]. Moreover, these forests also host one of the largest migratory events in the world: the monarch butterfly migration from the United States and Canada to the forests in central Mexico [17,21].
Although denied by Mexican exporters [10], the adverse effects of these land-use changes are known by those involved in avocado production, including the land managers themselves, yet external economic pressure, a culture of monetary ambition, drug cartels, and extortion have been strong drivers of avocado orchard expansion [8,11,12,22]. According to Barsimantov and Navia [22], this avocado expansion was enhanced by the North American Free Trade Agreement (NAFTA) during the 1990s after eradicating a quarantine pest, the avocado seed borer.
One of the tools used for land-use change is the spread of fires in forested areas [22,23,24,25]. Fires weaken the forest trees, favoring the presence of pests such as bark beetles. According to Mexican legislation, outbreaks of these pests must be treated by felling and fumigating the infested trees, and timber can then be sold later. This situation offers the possibility of having available land clear and monetary resources to start an avocado plantation and provide it inputs until fruit production begins, normally between the 4th and 5th year [24]. Even though national and local legislation strongly limit land-use changes from native forest to other uses, such as the Sustainable Forest Development Law [26], the lack of effective law enforcement mechanisms has allowed the occurrence of massive illegal land-use changes following fires mainly to agricultural and urban uses [8,13,22]. Nevertheless, the role of fire and local changes to fire regimes associated with avocado orchards has not been evaluated.
Michoacan has two government institutions that fight and suppress wildfires: one at the federal level and another at the state level. Until now, it has been a major challenge to cartographically analyze all the information generated by these agencies, in part because the oldest records in the databases present inconsistencies such as different field names, typos, or even a complete lack of spatial coordinates [24,27]. In the present study, we use recent and old records with available revised and curated coordinates.
In this work, we characterized the main components of the fire regime and its atmospheric conditions in the region and assessed the spatial association of fires and their return intervals with anthropogenic factors.

2. Materials and Methods
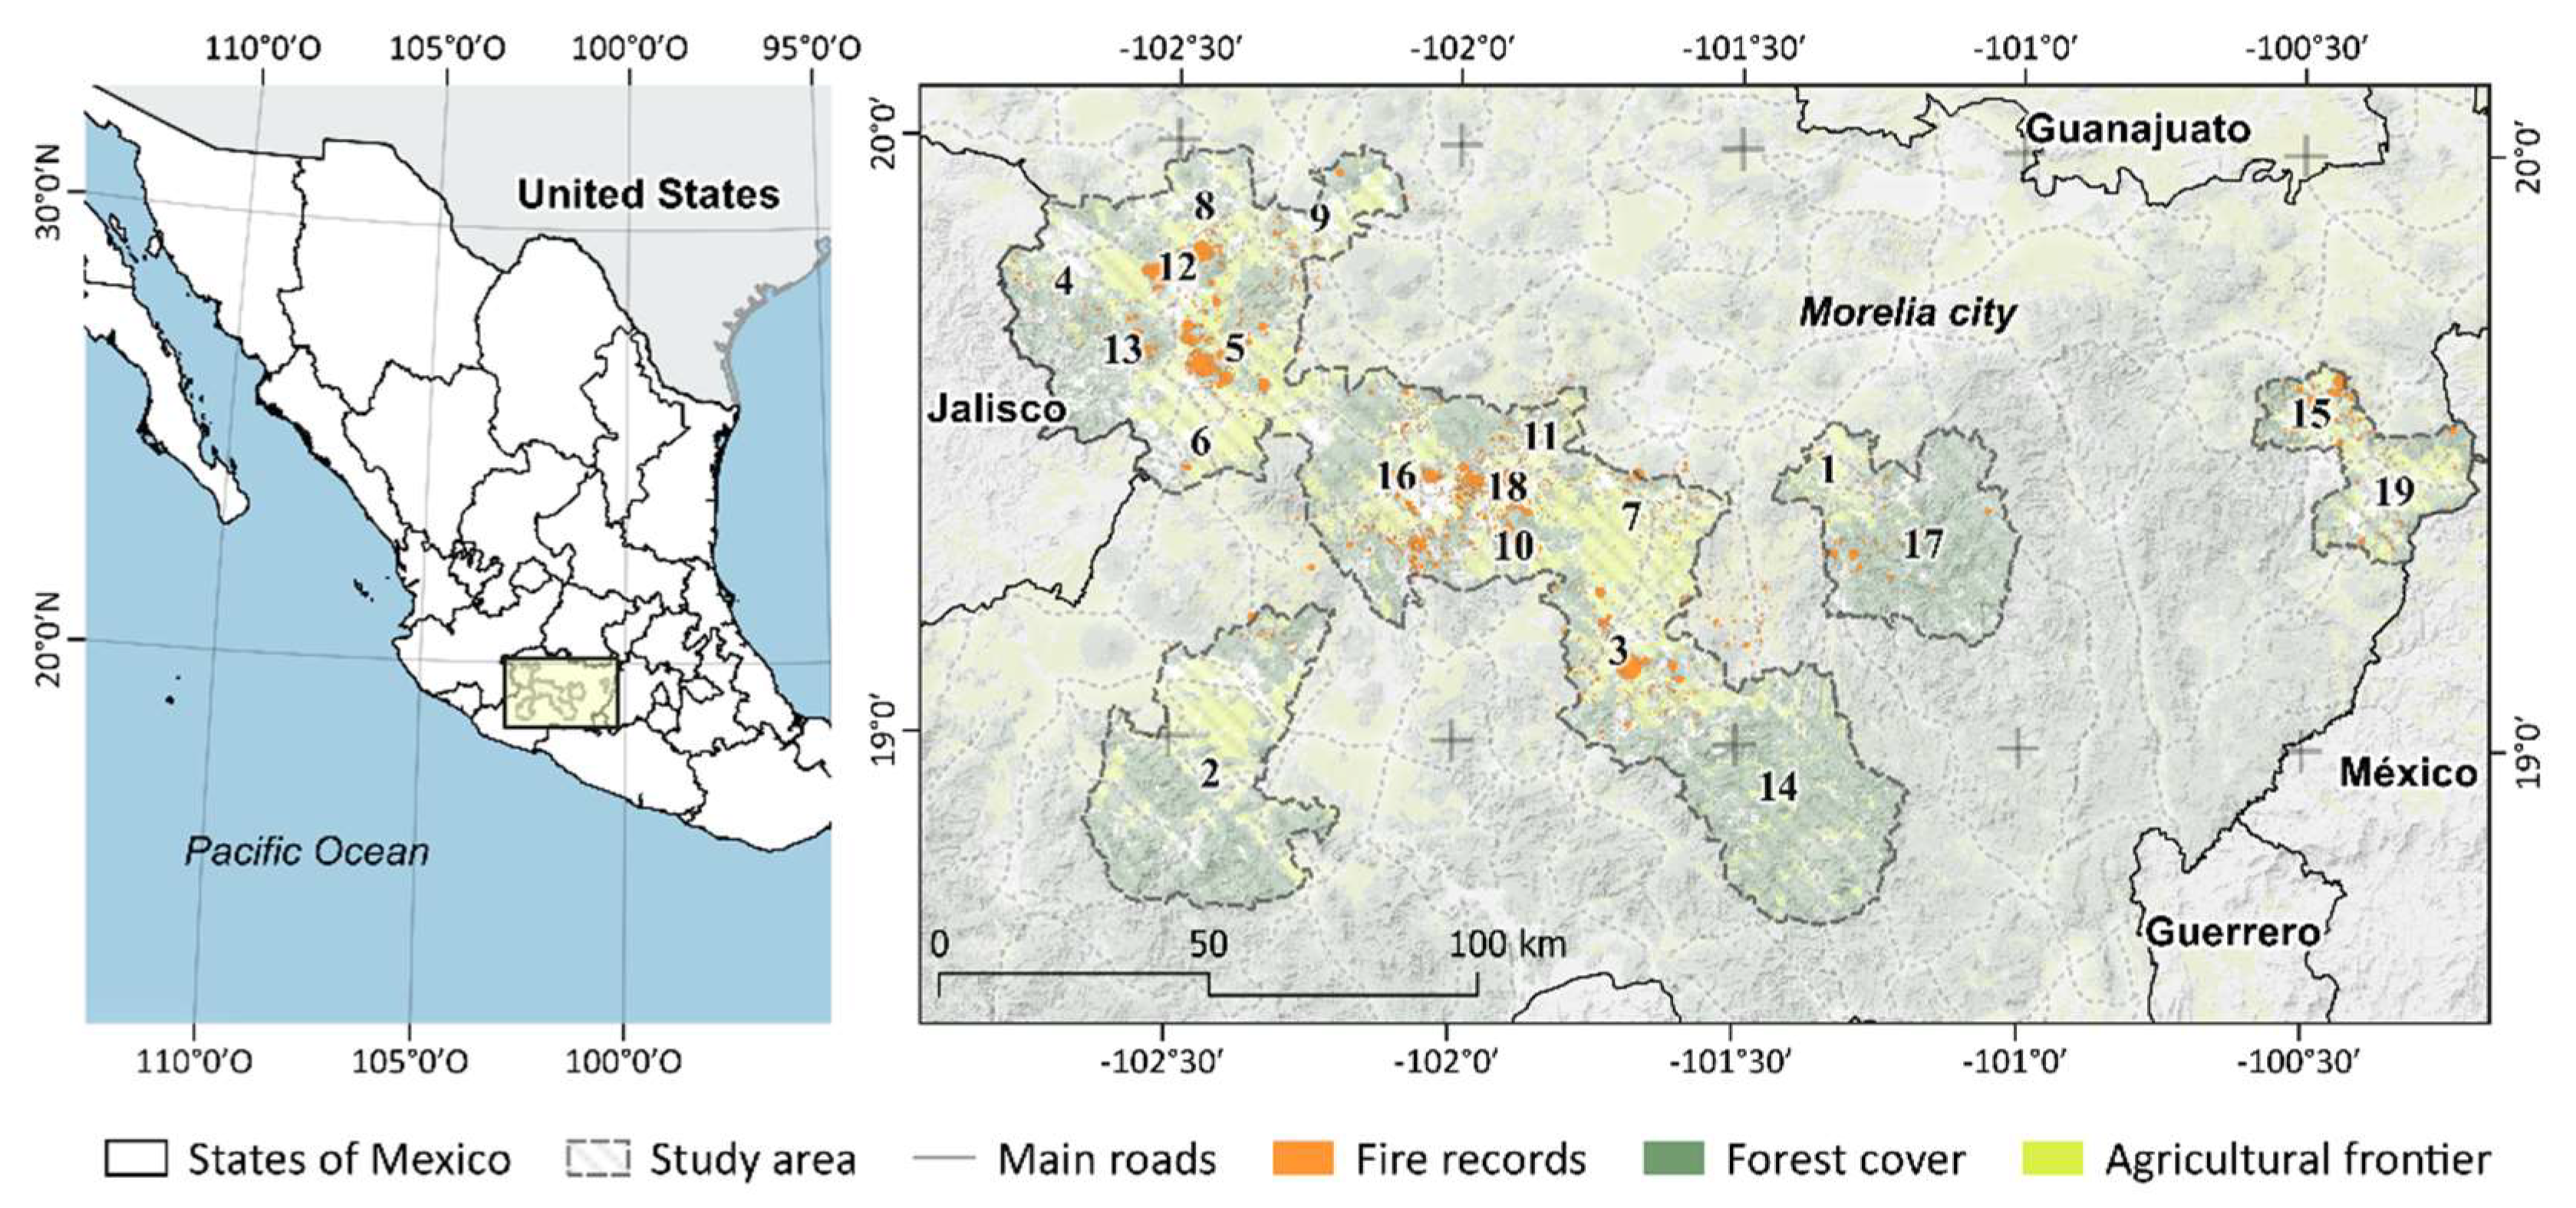
2.1. Study Region

The MAB is a region that embodies Mexico’s (and the world’s) largest avocado production. Avocados are cultivated mainly to supply international demand from the United States. It is located in the physiographic province of the Trans-Mexican Volcanic Belt, or Neovolcanic Axis, between coordinates 18°45′ N and 20°06′ N and between 101°47′ W and 103°13′ W. The dominant soils are Andosols, Luvisols, Alisols, Umbrisols, Phaeozems, and Acrisols, of which Andosols are the preferred ones for establishing avocado crops [5,28,29]. The orchards are concentrated between 1100 and 2900 masl. Subtropical (46.16%), tropical (22.75%), and temperate (22.29%) climates predominate in the avocado orchard area (Table A1). There are three well-differentiated seasons: wet (rainy), dry–cold, and dry–hot. The first runs from mid-May or early June through October, the second from November to January, and the third from February to mid-May. During the wet season, a reduction in precipitation known as midsummer drought (or Canícula) occurs, usually during August. This is a two- or three-week-long phenomenon during the wet season, where rainfall events are scarce. Therefore, avocado growers carry out relief irrigation to reduce fruit losses.
Over 86% of the region receives annual rainfall between 1000 and 1500 mm, and nearly 95% of annual rainfall takes place during the wet season. Nevertheless, avocados are planted in less humid areas with up to 800 mm per year [5,30]. This precipitation pattern is associated with local convective and larger tropical cyclonic events from the Atlantic and Pacific Oceans. In contrast, the remaining 5% of annual precipitation occurs during the dry–cold season and is associated with low temperatures during winter storms, while rainfall during the dry–hot season is mainly associated with tropical waves [31].
The main vegetation types in the region are forests dominated by pines (e.g., Pinus ayacahuite, P. devoniana, P. douglasiana, P. leiophylla, P. montezumae, P. pseudostrobus, and P. maximinoi) and oaks (e.g., Quercus castanea, Q. rugosa, Q. obtusata, Q. laurina, and Q. laeta) with 13 and 24 species reported in these two genera, respectively [18,19]. Similarly, sacred fir (Abies religiosa) can be found in areas above 3000 masl. [18,32]. Grasslands and cloud forests can also be present because of their transitional physiographic conditions [32,33,34]. These forests experience low-intensity and low-severity fires with a short return interval ranging from a couple of years to decades [35,36,37,38,39].

2.2. Input Data

As a first step to characterize the fire regime components in MAB, we obtained fire suppression records for the period 2000 to 2017 from 19 municipalities from 2 government institutions responsible for forest management (Figure 1). The first source was the National Forestry Commission (CONAFOR, according to its Spanish acronym), and the second was the Michoacan State Forestry Commission (COFOM, by its Spanish acronym). The information was provided in five separate time series: two from COFOM and three from CONAFOR, and these series were complementary to each other with no redundancy of records.
Within the databases, not all fire records had coordinates, and some presented clear typographical errors, which resulted in fire points placed entirely outside the studied region. Therefore, the databases were curated and standardized in a single database after an intensive process of reviewing, filtering, and verifying information. We conducted field visits to check the accuracy of fire occurrence and spatial information of the final database.

2.3. Characterization of the Components of the Fire Regime

From the cleansed database, we directly obtained the burned area, land-use/cover, percentage of trees affected, days of fire duration, rate of spread, and fire seasonality. We inferred the rate of spread through the fire size and days of fire duration and the seasonality from the recorded fire dates throughout the year. The data mining, fire spatial, and all statistical analyses were performed using the statistical software R v3.5.1 by R Core Team (Vienna, Austria) [40] and considering p-values < 0.05 to test significance.
To estimate fire return intervals, we assumed that the location provided in the data set was the center of each fire event. Circular buffers with an area equivalent to the one reported in the database were built using QGIS v3.10.4-A software by QGIS Development Team [41], considering the recorded locations as centroids. We assumed that when two circles overlapped, a fire had taken place in the same location as a previous fire, and we could then estimate the fire return interval as the number of years between these two fire events.
Each polygon was intersected with the rest of the polygons of the layer using the raster package from the R software, which generated several subsets of the general database where only the attributes of the intersected polygons appeared (Figure 2). All intersection subsets were stored in a unique list as data frames (table objects). As the process generates redundant data frames, filtering the list to purge the redundant information was necessary.
Once the list was filtered, descriptive statistics were applied to all the data frames in order to know different attributes of each intersection: average return interval per intersection and the number of fires in the period or area of the intersecting polygons.
Finally, the processed information was assigned back to the original polygons using the tidytext and reshape2 packages (Figure 2).

2.4. Data Mining for the Atmospheric Conditions of Each Fire and the Region Overall

To explore the relationship between atmospheric variables and fire regimes, we included the following weather-related variables: (a) the precipitation on the day of the fire, (b) the accumulated precipitation from the 30 days before the fire, (c) the minimum temperature on the day of the fire, (d) the maximum temperature on the day of the fire and (e) the relative humidity of the day of the fire. This information was obtained from the daily records of weather stations near each of the fires (Figure 3). For this, an extraction and association algorithm was developed for the aforementioned fire database. Data were mined from two sources: 141 weather stations from the Mexican National Weather Service (SMN by its acronym in Spanish) that report daily records of precipitation, evaporation, and minimum and maximum temperature (some since 1921); and 30 automated private stations of the Asociación de Productores y Empacadores Exportadores de Aguacate de México, the Association of Producers and Export Packers of Avocado of Mexico, in English (APEAM, by its acronym in Spanish), which have hourly records of all the atmospheric variables of interest from 1 April 2010, to date (Figure 3).
The spatial association between given fires and weather stations at each specific date was performed considering Thiessen–Voronoi polygons built from the locations of the available weather stations. Three polygonal layers were generated: one for the active SMN stations, another for the inactive nowadays and active SMN stations, and one more for the APEAM stations.
Given the higher coverage inside the MAB, better temporal resolution, and higher data quality, priority was given to data from APEAM stations. If a record was outside the time frame or the area covered by APEAM’s stations’ Thiessen–Voronoi polygons, SMN stations were used—first their active stations and then all SMN stations layer. In cases where there were no records for a required day in an active station, it could be in an inactive station that had been active at the time. Preference was given to the former over the inclusion of both for reasons of the robustness of the information.
In some cases, there were no atmospheric records for any of the assigned stations for a given fire. When that happened, the atmospheric information was associated with the minimum Euclidean distance method, where we identified a matrix of the ten stations closest to the fire, and the values of the nearest station that had complete information for the day of that fire were assigned.
Even though the relative humidity was not included as a measured variable in all the weather stations, it was estimated from the mean and minimum temperature at each daily record according to United Nations Food and Agriculture Organization standard procedures [42]. Shapiro–Wilk and Lilliefors (Kolmogorov–Smirnov) normality tests were performed, and the information obtained was contrasted with non-parametric tests since data had non-normal distributions. To prevent potential multicollinearity, relative humidity was used only as a descriptive parameter and its use was discarded in subsequent analyses.

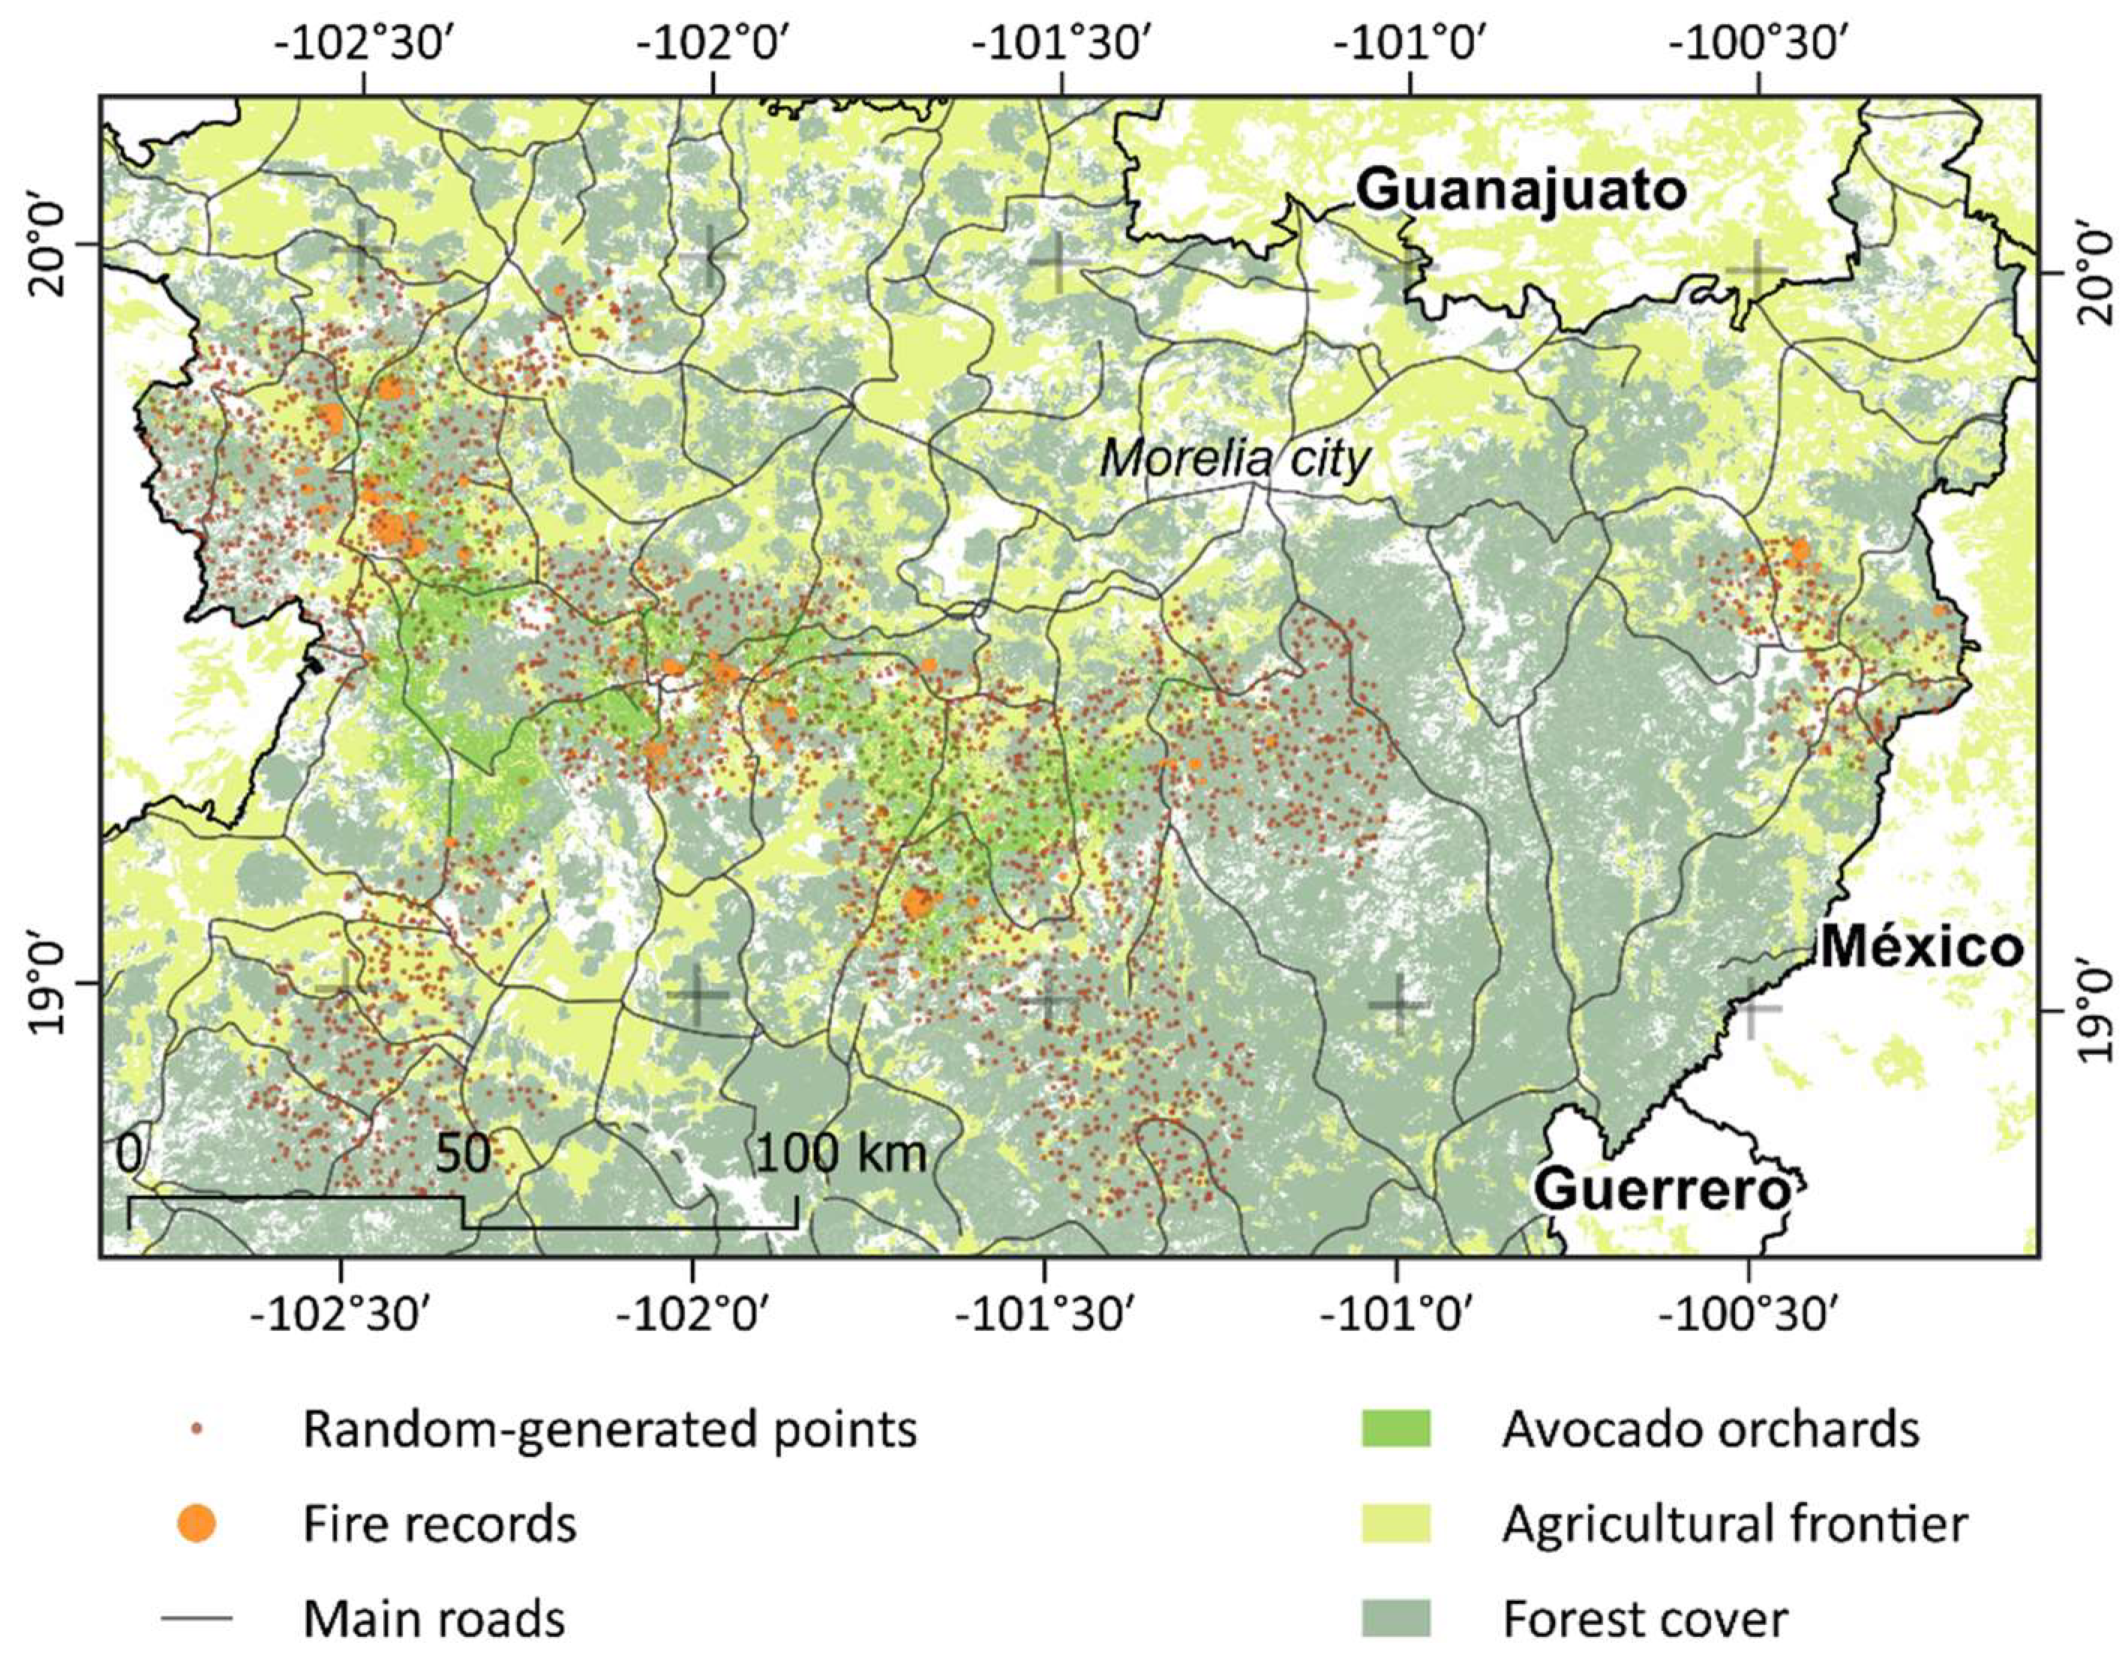
2.5. Distance Analysis

To understand the spatial relationship of fires and their fire return intervals with anthropogenic factors in the study area, we considered the distances from the fire centroids to the following: (1) agricultural areas in general, (2) existing avocado orchards, (3) main roads, and (4) urban settlements.
The avocado orchards considered here were those of the survey of Morales-Manilla and Cuevas [13], generated with images from 2007–2011 at a 1:20,000 scale. The geospatial information about the presence of agricultural areas, roads, and urban areas corresponds to the National Institute of Statistics and Geographical Information (INEGI, by its Spanish acronym) information with a 1:50,000 scale [34]. Distances were calculated using the standard distance algorithm for raster images and vectors within QGIS v3.10.4-A [41].
The calculated distances (n = 4588) were compared with a distribution of the same number of points occurring with a random spatial distribution within all the areas comprising the analyzed municipalities (Figure 4), by employing the Mann–Whitney–Wilcoxon test. Later, generalized linear models (GLMs) were fitted considering the quasi-Poisson family and log link based on the positively skewed distribution of the distances data. The GLMs were fitted by comparing each point’s fire attribute’s frequency, burned area, and distances against the above-mentioned anthropogenic factors.

2.6. Atmospheric Comparisons and Analysis of the Influence of ENSO

Because the extent of the fires covers a region whose climate is influenced by its proximity to the Pacific Ocean and the number of fires presented a year-on-year variation, the relationship between the number of fires, burned area rate of spread, and percentage of trees burned with El Niño-Southern Oscillation (ENSO) was also considered. For this, the fire regime components previously listed, as well as the precipitation and the maximum and minimum temperatures, were grouped at a monthly level and compared with the reported values of the Oceanic “El Niño” Index (ONI). The ONI synthesizes the quarterly moving average of standard deviations of the temperature on the equatorial surface of the Pacific Ocean [43]. Kruskal–Wallis and Conover–Iman tests were performed considering three ENSO categories: “El Niño” months, “La Niña” months and “Neutral months,” depending on whether the monthly value of the ONI was higher, lower, or intermediate from the range of one standard deviation of its quarterly average, respectively.

3. Results

3.1. Eighteen Years of Fires

Between 2000 and 2017, 5486 fires were registered within the 19 municipalities considered; of these, 4588 had geographic coordinates. The curated database link can be found in the Supplementary Materials section. The fires occurred at an altitude of 1945 ± 428 masl (average ± standard deviation). The mean number of days for which fires lasted was 1.1, with a maximum of 16 days. The rate of spread was 8.84 ± 22.32 ha per day.
The municipality of Uruapan concentrated more than 15% of the fires in all the years, and in some years, it accumulated as many as 30% of the fires of the studied 19 municipalities (Table A2 and Figure 5). Other municipalities with a high incidence of fires were Ziracuaretiro and Ario de Rosales, with percentages ranging from 5% to 17%.
In the 19 municipalities studied, an average of 276.4 fires occurred annually with an area of 3286.79 ha per year; however, the amount and extent of the fires varied considerably across years (Figure 6). The size distribution of the fires was exponential; thus, 98% of the fires had sizes of less than 100 ha, while 82% had less than 10 ha. Some years the fires in MAB reached an area of more than 1500 ha.
According to the curated database, most of the area burned occurs over three main forest types: pine (25%), pine–oak (50%), and oak–pine (15%). In several field visits, the burned areas could be found in patches of remanent forest consistently according to the processed records, including those that had recurrent fires.
As expected, most fires occur during the dry–hot season from April to May, sometimes extending to the onset of the wet season (Figure 7). Once the wet season starts, the burned area and the number of fires drop abruptly.
In total, 3985 unduplicated intersections of the fire areas for the 2000 to 2017 period were obtained. We performed the fire overlap analysis with 4587 records. One of the original records was discarded because it corresponded to an urban fire in the city of Uruapan, and no extension information data was provided. The fire return interval presented a non-normal distribution strongly skewed to the left. In other words, short fire return intervals were very common. The average return interval between fires was 3.2 years, with a median of 2.5 years. The largest fire return interval found was 16 years; however, the occurrence of 713 polygons without any intersection suggests that they could be sites with an even longer fire return interval.

3.2. Highly Atmospheric-Sensitive Fires

Fires occurred on warm and dry days with minimum temperatures of 10.0 ± 4.7 °C (n = 3291) and maximum temperatures of 28.4 ± 5.0 °C (n = 3283). The mean daily precipitation was 0.29 ± 2.4 mm (n = 3355), and the accumulated precipitation of the last 30 days was 5.87 ± 20.6 mm (n = 3366), while the relative humidity was 55.7 ± 8.2% (n = 3283).
None of these variables showed normal distribution according to the Shapiro and Lilliefors tests (p > 0.05). Maximum and minimum temperatures in the region had symmetrical, but non-normal, distributions (Table 1 and Table A3). The distribution of precipitation and the accumulated precipitation of 30 days was strongly skewed to the left in an exponential form. The atmospheric variables of precipitation, relative humidity, and maximum and minimum temperature on the day of the fires had a significant difference to regional means (p < 0.01 and U > 4,466,713).
The minimum temperature did not affect the monthly burned area, although it had a proportional and significant relationship to the number of fires (p < 0.001). Maximum temperature, precipitation, and relative humidity significantly affected the extent and the monthly number of fires (p < 0.001). The relationship with the maximum temperature was directly proportional, while precipitation and relative humidity were inversely proportional. All these relationships had an exponential form. For example, we observed that fires of more than 500 ha had a mean monthly relative humidity of 52.8%, while fires of less than 50 ha had an average relative humidity of 64.9%.
The size, rate of spread, severity, and the number of monthly fires showed a significant relationship with the ONI categories: p < 0.01, df = 2, χ2= 12.053 for the burned area, χ2 = 13.357 for the percentage of trees burned, χ2 = 10.315 for the rate of spread, and χ2 = 11.505 for the number of fires (Figure 8). Similarly, the ONI categories showed a significant relationship with the precipitation and maximum temperature (p < 0.01, df = 2 in both cases, χ2 = 6.145 for precipitation, and χ2 = 14.163 for maximum temperature). The minimum temperature and the relative humidity did not show a significant relationship with the ENSO (Table 2).

3.3. Antrhopogenic Fires and Illegal Burnings

There were 2401 records with a fire cause registered by COFOM and CONAFOR personnel, from which only 0.37% corresponded to natural causes. In MAB, the ignition causes may be intentional (67.7%) or accidental (31.9%), but almost all are derived from human activity.
The minimum distances from the fire locations to main roads, urban areas, avocado orchards, and agricultural frontier showed an exponential distribution. The minimum distances to randomly generated points also showed this type of distribution. However, the distributions for these driving factors had significant differences with respect to those of randomly generated points according to the Mann–Whitney–Wilcoxon U test (p < 0.001).
The analyses indicate that fires were mainly concentrated around the polygons of the agricultural frontier, followed by avocado orchards, then roads, and finally, urban areas (Table 3). The average distance from fires to main roads and urban areas was over 1 km, while the distance to avocado orchards and agricultural areas was less than 500 m.
The largest fire recorded was about 1800 ha; it was a 4-day surface fire in the municipality of Ario de Rosales during the dry season on 17th April 2002. This fire was associated with non-intentional causes derived from agricultural activities. Even when there were no mega-fires (>40,500 ha burned), there were 210 records of large fires of more than 40.5 ha, whose recorded location was less than 2 km apart from an avocado orchard and less than 2.3 km from a highway during the period 2000–2017.
Contrastingly, the areas that burned more than once showed a significant association with both the distance to main roads and avocado orchards. The GLM that considered the cumulative effect of the two variables had the best deviance (p < 0.001, df = 2288). So, only the avocado orchards that not necessarily need the conection to main roads are unrelated to fire recurrence e.g., those of smaller or local production (Table A4).

4. Discussion

4.1. The Cleaner the Inputs, the Clearer the Outputs

Although there was some uncertainty about the precision of fire locations caused by the quality of the available data, the curated database was consistent and useful. The brigades of the government agencies responsible for forest management and firefighting (CONAFOR and COFOM) have recorded fires since several decades ago, but it is known that they only sometimes accurately register the coordinates of the burned locations [44]. The correction of typos, the elimination of inconsistent data before data analyses, and the assumption that the registered coordinate was the centroid of circular polygons provided the smallest possible cartographic errors of commission and omission.
There are other examples of the use of vector analysis to measure fire frequency at a municipality or large pixel scale [16,27,45]. However, we present an alternative to estimate the return interval with a higher resolution that allows analysis at the plot scale. Using this method with polygons that have the same shape as the fires, and not with inferred burned areas, is advisable. However, working with equivalent areas became a practical option when the time series analyzed did not allow it.
Although not evaluated in this work, the degree of commission and omission of this technique can be evaluated by having a database with polygons of the burned areas. However, the burned areas we verified in the field concurred with the curated records.

4.2. Social Drivers in MAB

In the MAB, fires are very common below 2000 masl, which coincides with the altitudinal range of greatest potential for avocado crops [5]. Fire intensities and severities were low, something expected for this kind of ecosystem [39]. The return interval identified in the current study is consistent with other forests of the region, where 2–3 years have been a sustained fire return interval since 1925 [38]. Temperate forests in other parts of the world could require decades or even hundreds of years for fires to return to the same stands [46,47].
The number of fires with natural causes was almost negligible. Lightning strikes represented 0.2% of the fire causes (Figure A1). Even if the unspecified causes of recent years were considered wildfires, natural causes would only increase to 10%. So, ignitions in this region are mostly anthropogenic, and the atmospheric conditions might regulate their magnitude and size.
The inhabitants of these montane tropical forests have a well-established cultural management of fire, which has been transmitted among people who have lived in forests for many generations [36,37]. The influence of avocado exportation schemes on fire ignition patterns emerged only a few decades ago. Its changes have been carried out by only a limited part of the agricultural sector, with motivations that respond to the exportation economy rather than traditional management [8].
In many parts of the world, the distance to main roads has been considered an important variable in explaining the distribution of fires [47,48,49,50]. A road can facilitate access for firefighting, but it may also facilitate access for people who can cause a fire, both unintentionally and intentionally. In MAB, distance to roads strongly correlates with the land-use change to avocado orchards [16].
Urban areas and roads have been important variables explaining the spread of fires in Mexico [24,45,49]. Though for MAB, single fires were more associated with the presence of agricultural plots, from which it has been found that it is easier for changes from traditional rain-fed agriculture to avocado orchards to occur [2].
Even with the association of single fires to human settlements and the agricultural frontier, the aggregated distance to avocado orchards and main roads were the only factors related to the recurrence of fires. These are two fundamental requirements for the international avocado trade, so the fire recurrence interval has shifted from being driven by traditional practices to being dominated by large-scale export agricultural schemes on supposedly legitimate land that theoretically should not have been burned.
The relation between orchards and illegal burnings has only been partially described by Barsimantov and Navia [23] and Gutiérrez et al. [24]. It is the first time that the presence of avocado orchards has been identified as a consistent driver of forest fires throughout the patches of the remanent forest of MAB.

4.3. Atmospheric Controllers in MAB

Atmospheric conditions also significantly affect the number, size, intensity, and severity of fires in this region. Although anthropogenic ignitions can occur at any time of the year, fires in MAB usually happen after a month without rain, at the end of the dry–hot season, in which the fuel bed can be dry enough to ignite easily.
The occurrence of fires is facilitated by hot and dry weather conditions, a type of fuel that is dry enough to ignite, and by air conditions that allow the spread of flames [46,51]. Under these conditions, fires could spread quickly if windy weather is added. Although a considerable decrease in precipitation occurs during the “Canicula” or midsummer drought [43], the database has not registered fires in this period (Figure 6), quite possibly because the fuel bed is not dry enough, which limits ignition.
The Neovolcanic Axis is the first physical barrier to the humid winds from the Pacific Ocean that enter through the Michoacan coast. Therefore, it is related to orographic rain shadow processes, especially during ENSO variations. Within the ENSO, there is a subdivision of significant increases in the ONI index called “El Niño,” as well as significant decreases named “La Niña” [52]. For MAB, it has been observed that “El Niño,” tends to make winters considerably more humid, while “La Niña” makes them drier [53].
In the state of Michoacan, there is a general perception that there are more and larger fires during “la niña” periods compared to those of “el niño,”. Post hoc analyses of our data showed that those variables did not differ during “la niña” months compared to “el niño” (Table 2). Surprisingly, the neutral months without “la niña” or “el niño” saw a significantly greater amount, severity, intensity, and cumulative size of fires.
It has been widely thought that ENSO has considerable repercussions for fire management throughout Mexico by increasing fires in quantity and extent. However, the ENSO impact is different in all places, especially when analyzing regional or stand-level changes where contrary or even null effects are found [39,53]. In addition, some authors and national stakeholders usually consider “La Niña” years or “El Niño” years instead “La Niña” and “El Niño” periods or months [52,53,54], as if all the months within a year behaved in the same manner. This conception leads to misunderstanding since contributions, such as that of Huang et al. [43], indicate that even within the same year, there can be a combination of both phenomena (Figure 8).

4.4. Charboiled Guacamole?

The remanent forests in MAB have not ceased to resist the ignitions that have been part of the illegal land-use change that has fragmented them. There is a high probability that a single and isolated ignition near agricultural plots could start a forest fire, and, on the other hand, there is also a high probability that a burnt remanent forest will reignite in less than three years if the stand is located near a main road and an avocado orchard. These anthropogenic fires decrease the fuel bed so much that they deplete the effects that natural factors such as lightning may have.
Ignitions that become fires occur at an average temperature of 19 °C on dry days with a relative humidity of 55% and after a dry month (30 days) with less than 6 mm of accumulated rainfall. These conditions may be affected by ENSO atmospheric phenomena since rainfalls during the dry season prevent the fuel bed from being dry enough to ignite and burn easily. So, “El Niño,” could mean good news to avoid all these anthropogenic fires burning out of control. As government agencies have been doing, the greatest attention to fire prevention and firefighting should be put on the last months of the dry season.
As a tool for illegal land-use change, fires can degrade the forest patches that remain in a soaring avocado agricultural matrix. It is difficult to think about a reduction in the high recurrence of fires and the damage they can cause, given the conditions of insecurity and social conflict present in MAB. An international agenda with an environmental justice perspective and a national framework for action are key steps to address these issues that are closely linked to the fate of forest conservation in this region.
The motivations behind illegal burnings and associated land-use change in this region are primarily economic reasons [8,10,16,36,55,56]. The social context in which the avocado is produced in MAB for export has an entire network of complex power relationships inside an environment of corruption and impunity [12,22,56,57], as well as recently being associated with drug cartels and illegal activities [11,55,58].
Given the large amount of money that swirls each year around this activity [4], there is international consumer pressure, which has been legitimized by international agreements such as NAFTA (now USMCA) between Mexico, the United States, and Canada [11,54,55]. At the same time, because of its profitability and specific characteristics, some agricultural products had been targeted by organized crime groups and drug trafficking cartels in Michoacan. It has been documented that drug cartels have disrupted, infiltrated, and even controlled production and commercialization chains of certain fruits, such as lime or avocado [12,58,59]. Navarro [59] mentioned that drug cartels have controlled nearly 10% of avocado production operations in Michoacan.
Final consumers of the fruit may be unaware that behind the large demand for avocados there may be producers who intentionally burn and cut down high-diversity forests, hoard water, and pollute soils with harmful pesticides, and that some producers may be extorted or banished from their crops by organized crime organizations such as drug cartels [11,12,22,55,58,59].

5. Conclusions

Through the cleansing of the historical fire data sets of the Mexican government agencies COFOM and CONAFOR, it was possible to characterize the fire regime of MAB. The 2–3 years fire return interval was confirmed as a regional phenomenon in these tropical mountain forests. The fire recurrence analysis is presented as an alternative for exploring fire effects to more detailed geographic scales when single coordinates of fire events are available but not polygons. The distance to orchards and roads is the best predictive variable of the recurrence of fires in MAB. The use of fire was recognized as a tool of land-use change to avocado. The ENSO can diminish the fire effects overall in the region through increases in winter rainfalls, especially if analyzed by month rather than by year.

Supplementary Materials

The complete database of MAB’s fires and its metadata could be found at: https://github.com/OlivaresLD/fires_avocadoland.

Author Contributions

L.D.O.-M., A.G.-T. and D.R.P.-S. designed the conceptual framework, L.D.O.-M. cleansed the databases, made figures and the first draft of the manuscript, L.D.O.-M. and A.G.-T. performed the data analysis, L.D.O.-M., A.G.-T. and D.R.P.-S. contributed equally to the writing and reviewing of the paper. All authors have read and agreed to the published version of the manuscript.

Funding

This research was funded by the following projects: CONACyT Project CONACyT/PDCPN2016/Proyecto3053 “Impactos y consecuencias del desarrollo de la franja aguacatera sobre aspectos hidrológicos, funcionales, genéticos y de biodiversidad en ecosistemas templados de México”, ICTI Project PFCTI/ICTI/2019/A/315 “Aplicación del conocimiento ecológico para favorecer la sustentabilidad del cultivo de aguacate en el estado de Michoacán: Aspectos de suelo, hidrológicos e interacciones bióticas”, and UNAM Project PAPIIT-UNAM IN214820 “El fuego en la Reserva de la Biosfera Mariposa Monarca: caracterización de un proceso socioecosistémico”.

Institutional Review Board Statement

Not applicable.

Informed Consent Statement

Not applicable.

Data Availability Statement

The geographical data employed for the site description can be downloaded at https://www.inegi.org.mx/ (accessed on 6 December 2022), the SMN weather stations records can be read at https://smn.conagua.gob.mx/ (accessed on 6 December 2022), the original fire records can be found at https://www.gob.mx/conafor/documentos/incendios-forestales-27734 (accessed on 6 December 2022).

Acknowledgments

We want to thank COFOM and CONAFOR officials for providing the time series databases required in performing this research. We also thank CONACyT for the first author grant (CVU 588502). We want to give special thanks to the three anonymous reviewers for their comments and contributions which improved this document. LDOM thanks Antonio Jordán and Jorge Mataix-Solera; through the opportunity of seminars, discussions, and tapas afternoons, many of the ideas that shaped this manuscript came to fruition today.

Conflicts of Interest

The authors declare no conflict of interest. The funders had no role in the design of the study; in the collection, analyses, or interpretation of data; in the writing of the manuscript, or in the decision to publish the results.

Appendix A

Table A1. Atmospheric summary of the Michoacan Avocado Belt.
GroupSubgroupClassCode 1Annual Average TemperatureTotal Annual PrecipitationWinter RainfallOrch.
% 2
TropicalSemi-humid tropicalSummer rainfallsAw0(w)>22 °C~950 mm<5%2.76
Summer rainfallsAw1(w)>22 °C>1084 mm<5%19.99
SubtropicalHumid subtropicalSummer rainfallsA(C)(m)(w)18–22 °C640–720 mm<5%25.21
Semi-humid subtropicalSummer rainfalls(A)C(w1)(w)>18 °C>778 mm<5%4.11
Summer rainfalls(A)C(w2)(w)>18 °C>995 mm<5%16.84
TemperateHumid temperateSummer rainfallsC(m)(w)12–18 °C520–640 mm<5%6.81
Semi-humid temperateSummer rainfallsC(w1)(w)12–18 °C518–995 mm<5%14.04
Summer rainfallsC(w2)(w)12–18 °C>664 mm<5%1.44
SubalpineHumid subalpineSummer rainfallsC(E)(m)(w)5–12 °C380–520 mm<5%0.04
Semi-humid subalpineSummer rainfallsC(E)(w2)(w)5–12 °C>276 mm<5%8.75
1 Climatic class according to INEGI (1985) standards, whose symbols are based on the Köppen climate classification. 2 Percentage of the total avocado orchards’ surface covered by the specified climate class (5). Emboldened climatic classes cover together more than 75% of the avocado-orchards.
Table A2. The annual number of fires per municipality in the 2000–2017 period.
Municipality200020012002200320042005200620072008200920102011201220132014201520162017TotalPercent of total
Acuitzio10628245177964151621451412.6%
Apatzingán1338613141171232410201911.7%
Ario1712151724264437634625362845252125185249.6%
Cotija49612671035857120330911.7%
Los Reyes27618282434292327191929152919715213897.1%
Peribán458831814781254203371021.9%
S. Escalante212124333363328331482714236325303917.1%
Tangamand.400421171047118271713616151623.0%
Tangancícua.224715717265101052099509171973.6%
Taretan5121536963176123088861.6%
Tingambato181118141412343549221319144219211133606.6%
Tingüindín7267479761064434343961.7%
Tocumbo7834218188497584461171422.6%
Turicato111614151275200231250771.4%
Tuxpan71551267171023783012137111222133.9%
Uruapan4232393759618054125110491079011350386475122522.3%
Villa Madero1331824102213152332132029311141493045.5%
Ziracuaretiro262738273943482244282337272917625175239.5%
Zitácuaro25181423141914214128181939301458223726.8%
Total2611652413142963664453214893722073973344142001132612905486
Figure A1. Reported causes behind fires on MAB from 2000 to 2017. Until 2006, causes were not specified in the records. Wildfires correspond to lightning strikes as natural causes.
Fire 06 00081 g0a1
Table A3. Average fire regime parameters under the ENSO influence.
“El Niño”“La Niña”Neutral Month
Burned area (ha)93.9 ± 317.3218.2 ± 425.3453.9 ± 780.0
Number of fires9 ± 2023 ± 4035 ± 46
Rate of spread 12.06 ± 3.163.34 ± 4.274.62 ± 5.03
Rate of spread 20.23 ± 0.420.34 ± 0.630.31 ± 0.50
Percentage of trees burned0.7 ± 1.72.4 ± 3.43.6 ± 5.5
Average ± standard deviation; n = 216 (months in the 2000–2017 period). We considered quarterly average months instead of years as a unit of analysis according to the ONI index of Huang et al. [43] because there can be a combination of “El Niño” and “La Niña” phenomena within the same year. 1 Rate of spread according to the difference of days between the beginning and the end of the fire; 2 rate of spread according to the hours between the notification of a fire and the end of its fighting.
Table A4. GLM summary between fire recurrency and anthropogenic factors.
Anthropogenic FactorMain RoadsAgricultural FrontierAvocado
Orchards
Human
Settlements
Main Roads +
Avocado Orchards.
ModelF~Dr *F~Da ―F~Do *F~Dh ―F~Dm + Do ***
Intercept68.8169.0969.4868.9168.93
Slope3.00 × 10−52.28 × 10⁻⁵−1.98 × 10−52.19 × 10−54.86 × 10⁻⁵
Residual deviance1,799,3351,803,3001,800,1991,802,0571,788,979
Null deviance1,804,5641,804,5641,804,5641,804,5641,804,564
d.f.22892289228922892288
D2%0.2420.0700.2900.1390.864
Fire recurrency (F) compared to the distance to main roads (Dr), agricultural frontier (Da), human settlements (Dh), and avocado orchards (Do). D2% = Deviance or pseudo-R2 in percentual units, d.f. = degrees of freedom of the residual deviance, n = 4588, family = quasipoisson, link = log. *** p-value less than 0.001. * p-value less than 0.05; ―p-value more or equal than 0.05.

References

  1. Food and Agriculture Organization of the United Nations (FAO). June 2022. FAOSTAT. Crops and Livestock Products. Available online: https://www.fao.org/faostat/en/#data/QCL (accessed on 26 August 2022).
  2. De la Tejera Hernández, B.; Santos, O.Á.; Santamaría, Q.H.; Gómez, M.T.; Olivares, V.C. El oro verde en Michoacán: ¿un Crecimiento sin Fronteras? Acercamiento a la Problemática y Retos del Sector Aguacatero Para el Estado y la Sociedad; Economía y Sociedad; Universidad Michoacana de San Nicolás de Hidalgo: Morelia, México, 2013; Volume 17, pp. 15–40. [Google Scholar]
  3. SIAP (n.d.). Anuario Estadístico de la Producción Agrícola [online]. Available online: https://bit.ly/2WtexHT (accessed on 16 December 2018).
  4. SIAP (2020). Balanza Comercial Agropecuaria y Agroindustrial Noviembre 2019 [online]. Servicio de Información Agroalimentaria y Pesquera. Available online: https://bit.ly/2L3CqAr (accessed on 2 April 2020).
  5. Gutiérrez-Contreras, M.; Lara-Chávez, M.B.N.; Guillén-Andrade, H.; Chávez-Bárcenas, A.T. Agroecología de la Franja Aguacatera en Michoacán, México; Asociación Interciencia: Caracas, Venezuela, 2010; Volume 35, pp. 647–653. [Google Scholar]
  6. APEAM AC. Avocadoland (Primer Episodio) [Video]. YouTube. Available online: https://bit.ly/2yoIktk (accessed on 13 November 2017).
  7. Bravo-Espinosa, M.; Mendoza, M.E.; Carlón Allende, T.; Medina, L.; Sáenz-Reyes, J.T.; Páez, R. Effects of converting forest to avocado orchards on topsoil properties in the trans-Mexican volcanic system, Mexico. Land Degrad. Dev. 2014, 25, 452–467. [Google Scholar] [CrossRef]
  8. Reyes González, A. Análisis Comparativo de los Patrones Espaciales de la Deforestación en una Zona Tropical y una Templada de Michoacán. Master’s Thesis, Universidad Nacional Autónoma de México, Facultad de Filosofía y Letras, Mexico City, México, 2014. [Google Scholar]
  9. Ortiz Paniagua, C.F. Avocado Export Agriculture and Tourism in Michoacan. A Perspective from Social Preferences by Ecosystems Services. El Periplo Sustentable 2017, 33, 452–485. [Google Scholar]
  10. Cho, K.; Goldstein, B.; Gounaridis, D.; Newell, J.P. Where does your guacamole come from? Detecting deforestation associated with the export of avocados from Mexico to the United States. J. Environ. Manag. 2021, 278, 111482. [Google Scholar] [CrossRef] [PubMed]
  11. De la Vega-Rivera, A.; Merino-Pérez, L. Socio-environmental impacts of the avocado boom in the Meseta Purepecha, Michoacan, Mexico. Sustainability 2021, 13, 7247. [Google Scholar] [CrossRef]
  12. Kennedy, L. The Avocado War (season 2, episode 1) [streaming series episode]. In Mussman, J. (executive producer), Rotten. Netflix & Zero Point Zero Production. Available online: https://bit.ly/35CmNct (accessed on 4 October 2019).
  13. Morales Manilla, L.M.; Cuevas García, G. Informe Final: “Inventarios 1974–2007, e impacto ambiental regional del cultivo del aguacate en el estado de Michoacán (Etapa I)”; CIGA, UNAM–Fundación Produce Michoacán, Abril: Morelia, Michoacán, México, 2011; 138 p, Available online: https://bit.ly/3XDhiUn (accessed on 26 August 2020).
  14. Budds, J. El acceso a los recursos de agua de los agricultores en el valle de La Ligua, Chile. Rev. De Derecho Adm. Econ. 2003, 2, 371–379. [Google Scholar]
  15. Budds, J. La demanda, evaluación y asignación del agua en el contexto de escasez: Un análisis del ciclo hidrosocial del valle del río La Ligua, Chile. Rev. De Geogr. Norte Gd. 2012, 52, 167–184. [Google Scholar] [CrossRef] [Green Version]
  16. Ramírez-Mejía, D.; Levers, C.; Mas, J.F. Spatial patterns and determinants of avocado frontier dynamics in Mexico. Reg. Environ. Change 2022, 22, 1–19. [Google Scholar] [CrossRef]
  17. Sáenz-Ceja, J.E.; Pérez-Salicrup, D.R. Avocado Cover Expansion in the Monarch Butterfly Biosphere Reserve, Central Mexico. Conservation 2021, 1, 299–310. [Google Scholar] [CrossRef]
  18. Amezcua Cruzaley, S. Las Coníferas de Michoacán; Comisión Forestal del Estado de Michoacán (COFOM): Morelia, Michoacán, México, 2008. [Google Scholar]
  19. Arizaga, S.; Martínez-Cruz, J.; Salcedo-Cabrales, M.; Bello-González, M.A. Manual de la Biodiversidad de Encinos Michoacanos; Instituto Nacional de Ecología: Mexico City, México, 2009. [Google Scholar]
  20. Monterrubio-Rico, T.C.; Charre-Medellín, J.F.; Pérez-Martínez, M.Z.; Mendoza, E. Use of remote cameras to evaluate ocelot (Leopardus pardalis) population parameters in seasonal tropical dry forests of central-western Mexico. Mammalia 2018, 82, 113–122. [Google Scholar] [CrossRef]
  21. Vilar, V.; Gohari, A.; Montel, N.; Roussel, V. Les Avocats du diable. In Envoyé Spécial (TV Show) [video]. YouTube; French 2. Available online: https://bit.ly/35zfv9D (accessed on 21 September 2017).
  22. Barsimantov, J.; Navia Antezana, J. Forest cover change and land tenure change in Mexico’s avocado region: Is community forestry related to reduced deforestation for high-value crops? Appl. Geogr. 2012, 32, 844–853. [Google Scholar] [CrossRef]
  23. Gutiérrez, M.F.; Pérez-Salicrup, D.R.; Sandoval, A.F.; Arzeta, S.N.; Mas, J.F.; Ramírez, M.I.R. Modeling anthropic factors as drivers of wildfire occurrence at the Monarch Butterfly Biosphere. Madera Y Bosques 2018, 24, 23. [Google Scholar]
  24. Pérez-Medrano, R.; COFOM, Morelia, Michoacán, México. Personal communication, 2018.
  25. CEDDRSSA. Caso de Exportación: El Aguacate; Centro de Estudios para el Desarrollo Rural Sustentable y la Soberanía Alimentaria: Mexico City, Mexico, 2017. [Google Scholar]
  26. DOF. Ley General de Desarrollo Forestal Sustentable; Cámara de Diputados del H. Congreso de la Unión: Mexico City, México, 2018. [Google Scholar]
  27. Briones-Herrera, C.I.; Vega-Nieva, D.J.; Monjarás-Vega, N.A.; Flores-Medina, F.; Lopez-Serrano, P.M.; Corral-Rivas, J.J.; Carrillo-Parra, A.; Pulgarin Gámiz, M.A.; Alvarado-Celestino, E.; González-Cabán, A.; et al. Modeling and Mapping Forest Fire Occurrence from Aboveground Carbon Density in Mexico. Forests 2019, 10, 402. [Google Scholar] [CrossRef] [Green Version]
  28. Medellín, J.F.; Mas, J.F.; Chang-Martínez, L.A. Potential expansion of Hass avocado cultivation under climate change scenarios threatens Mexican mountain ecosystems. Crop Pasture Sci. 2021, 72, 291–301. [Google Scholar] [CrossRef]
  29. Olivares-Martínez, L.D.; Miguel Hernández University, Elche, Spain. Personal communication, 2015.
  30. INEGI. Conjunto de Datos Geográficos de las Cartas de Climas, Precipitación Total Anual y Temperatura Media Anual [Map]; Scale 1:1,000,000; Series I (Continuo Nacional); Instituto Nacional de Estadística y Geografía: Aguascalientes, Mexico, 1985. [Google Scholar]
  31. Breña-Naranjo, J.A.; Pedrozo-Acuña, A.; Pozos-Estrada, O.; Jiménez-López, S.A.; López-López, M.R. The contribution of tropical cyclones to rainfall in Mexico. Phys. Chem. Earth 2015, 83–84, 111–122. [Google Scholar] [CrossRef]
  32. Sáenz-Ceja, J.E.; Pérez-Salicrup, D.R. Modification of fire regimes inferred from the age structure of two conifer species in a tropical montane forest, Mexico. Forests 2020, 11, 1193. [Google Scholar] [CrossRef]
  33. INEGI. Uso del Suelo y Vegetación de México, (Serie VI), INEGI, 2014–2017; Instituto Nacional de Estadística y Geografía: Aguascalientes, Mexico, 2018; Electronic format: SHP; Scale 1:50,000; Available online: https://bit.ly/2zUWOkP (accessed on 26 August 2020).
  34. INEGI. Conjunto de Datos Geográficos de las Cartas Topográficas; Instituto Nacional de Estadística y Geografía: Aguascalientes, Mexico, 2018; Electronic format: SHP; Scale 1:50,000; Available online: https://bit.ly/3c3oAKd (accessed on 26 August 2020).
  35. Rodríguez-Trejo, D.A.; Fulé, P.Z. Fire ecology of Mexican pines and a fire management proposal. Int. J. Wildland Fire 2003, 12, 23–27. [Google Scholar] [CrossRef]
  36. Fulé, P.Z.; Ramos-Gómez, M.; Cortés-Montaño, C.; Miller, A.M. Fire regime in a Mexican forest under indigenous resource management. Ecol. Appl. 2011, 21, 764–775. [Google Scholar] [CrossRef] [PubMed] [Green Version]
  37. Gutiérrez Martínez, G.; Orozco Hernández, E.; Ordóñez Días, J.A.B.; Camacho Sanabria, J.M. Forest fire regime and distribution in the State of Mexico (2000 to 2011). Rev. Mex. De Cienc. For. 2015, 6, 92–107. [Google Scholar]
  38. Sáenz-Ceja, J.E.; Pérez-Salicrup, D.R. Dendrochronological reconstruction of fire history in coniferous forests in the Monarch Butterfly Biosphere Reserve, Mexico. Fire Ecol. 2019, 15, 18. [Google Scholar] [CrossRef] [Green Version]
  39. Agee, J.K. Fire Ecology of Pacific Northwest Forests; Island Press: Washington, DC, USA, 1996. [Google Scholar]
  40. R Core Team. R: A Language and Environment for Statistical Computing; R Foundation for Statistical Computing: Vienna, Austria, 2018; Available online: https://www.R-project.org/ (accessed on 26 August 2020).
  41. QGIS Development Team. QGIS Geographic Information System v3.10.4-A Coruña. Open Source Geospatial Foundation Project. 2020. Available online: http://qgis.osgeo.org (accessed on 26 August 2020).
  42. Allen, R.G.; Pereira, L.S.; Raes, D.; Smith, M. Evapotranspiración del Cultivo: Guías Para la Determinación de los Requerimientos de agua de los Cultivos; FAO: Roma, Italy, 2006; Volume 56, ISBN 92-5-304219-2. [Google Scholar]
  43. Huang, B.; Thorne, P.W.; Banzon, V.F.; Boyer, T.; Chepurin, G.; Lawrimore, J.H.; Menne, M.J.; Smith, T.M.; Vose, R.S.; Zhang, H.-M. Extended reconstructed sea surface temperature, version 5 (ERSSTv5): Upgrades, validations, and intercomparisons. J. Clim. 2017, 30, 8179–8205. [Google Scholar] [CrossRef]
  44. Espino, J.; (CONAFOR, Morelia, Michoacán, México). Personal communication, 2018.
  45. Matin, M.A.; Chitale, V.S.; Murthy, M.S.; Uddin, K.; Bajracharya, B.; Pradhan, S. Understanding forest fire patterns and risk in Nepal using remote sensing, geographic information system, and historical fire data. Int. J. Wildland Fire 2017, 26, 276–286. [Google Scholar] [CrossRef] [Green Version]
  46. Niklasson, M.; Granström, A. Numbers and sizes of fires: Long-term spatially explicit fire history in a Swedish boreal landscape. Ecology 2000, 81, 1484–1499. [Google Scholar] [CrossRef]
  47. Román-Cuesta, R.M.; Gracia, M.; Retana, J. Environmental and human factors influencing fire trends in ENSO and non-ENSO years in tropical Mexico. Ecol. Appl. 2003, 13, 1177–1192. [Google Scholar] [CrossRef]
  48. Monjarás Vega, N.A.; Vega Nieva, D.J.; Corral Rivas, J.J.; López Serrano, P.M. Modelización y mapeo del riesgo de incendios forestales a partir de la distancia a carreteras y poblados en México. In Aproximaciones Tecnológicas de Vanguardia en la Geomática, Geodesia y Geoinformática en México; Medrano, C.N., Cárdenas, O.R., Salado, C.A., Tristán, A.C., Eds.; Universidad Autónoma de San Luis Potosí: San Luis Potosí, México, 2019; pp. 79–96. [Google Scholar]
  49. Narayanaraj, G.; Wimberly, M.C. Influences of forest roads on the spatial patterns of human-and lightning-caused wildfire ignitions. Appl. Geogr. 2012, 32, 878–888. [Google Scholar] [CrossRef]
  50. Abdi, O.; Kamkar, B.; Shirvani, Z.; Teixeira da Silva, J.A.; Buchoithner, M.F. Spatial-statistical analysis of factors determining forest fire: A case study from Golestan, Northeast Iran. Geomat. Nat. Hazards Risk 2018, 9, 267–280. [Google Scholar] [CrossRef] [Green Version]
  51. Peralta-Hernández, A.R.; Barba-Martínez, L.R.; Magaña-Rueda, V.O.; Matthias, A.D.; Luna-Ruíz, J.J. Temporal and spatial behavior of temperature and precipitation during the canícula (midsummer drought) under El Niño conditions in central México. Atmos 2008, 21, 265–280. [Google Scholar]
  52. Magaña Rueda, V.; Pérez, J.L.; Conde, C. El fenómeno de El Niño y la oscilación del sur. Sus impactos en México [online]. Ciencias 1998, 51, 14–18. Available online: https://bit.ly/2W6w3T3 (accessed on 26 August 2020).
  53. Bravo Cabrera, J.L.; Azpra Romero, E.; Zarraluqui Such, V.; Gay García, C.; Porrúa, F.E. Significance tests for the relationship between" El Niño" phenomenon and precipitation in Mexico. Geofísica Int. 2010, 49, 245–261. [Google Scholar] [CrossRef]
  54. Maldonado Aranda, S. Stories of drug trafficking in rural Mexico: Territories, drugs and cartels in Michoacán. Eur. Rev. Lat. Am. Caribb. Stud./Rev. Eur. De Estud. Latinoam. Y Del Caribe 2013, 94, 43–66. [Google Scholar] [CrossRef] [Green Version]
  55. Contreras Peña, L.V. El Desarrollo del Capitalismo Monopolista Transnacional en la Agricultura en Michoacán. Master’s Thesis, Universidad Autónoma Chapingo, Dirección de Centros Regionales Universitarios, Texcoco, Mexico, 2015. [Google Scholar]
  56. Reforma. Utilizan Plagiarios Datos del Gobierno. REFORMA. Available online: https://bit.ly/2xLdcDN (accessed on 29 October 2017).
  57. Ornelas, R.G. Organized Crime in Michoacán: Rent-Seeking Activities in the Avocado Export Market. Politics Policy 2018, 46, 759–789. [Google Scholar] [CrossRef]
  58. García-Ponce, O.; Lajous, A. How Does a Drug Cartel Become a Lime Cartel? The Washington Post: Washington, DC, USA; Available online: https://www.washingtonpost.com/news/monkey-cage/wp/2014/05/20/how-does-a-drug-cartel-become-a-lime-cartel/ (accessed on 20 May 2014).
  59. Navarro, C. Environmental Concerns Accompany Surge in Demand for Mexican Avocados; LADB: Albuquerque, NM, USA, 2016. [Google Scholar]
Figure 1. Region of study and fire records. The numbers correspond to municipalities in the following order. 1: Acuitzio, 2: Apatzingán, 3: Ario, 4: Cotija, 5: Los Reyes, 6: Peribán, 7: Salvador Escalante, 8: Tangamandapio, 9: Tangancícuaro, 10: Taretan, 11: Tingambato, 12: Tingüindín, 13: Tocumbo, 14: Turicato, 15: Tuxpan, 16: Uruapan, 17: Villa Madero, 18: Ziracuaretiro, 19: Zitácuaro.
Fire 06 00081 g001
Figure 2. Flow diagram of the fire recurrence geographical analysis. Dashed boxes represent list objects, n = number of fires in the period or area of the intersecting polygons, and Xf and σ are its average return interval and standard deviation, respectively. Detailed information is given in the Characterization of the fire regime components section.
Fire 06 00081 g002
Figure 3. Location of the different weather stations considered for atmospheric variables analysis.
Fire 06 00081 g003
Figure 4. The random points and fire centroids were used for the distance analysis.
Fire 06 00081 g004
Figure 5. Eighteen years of fires across the Michoacan Avocado Belt: (1) high fire activity and recurrence associated with orchards and main roads; (2) isolated fires in remanent forests enclosed by the agricultural frontier; (3) fire records in one of the monarch butterflies’ arrival areas.
Fire 06 00081 g005
Figure 6. The number of fires and the area burned annually in the MAB from 2000 to 2017.
Fire 06 00081 g006
Figure 7. Average number of fires per month in the MAB from 2000 to 2017 throughout a mean year with (A) mean monthly precipitation and its standard error in a blue line and ribbon and (B) the mean monthly temperature in a red line and the maximum and minimum temperatures in the edges of a brownish ribbon.
Fire 06 00081 g007
Figure 8. Fires during the 18-year period in MAB. “El Niño” and “La Niña” periods are indicated with yellow and red colors, respectively. Maximum and minimum temperatures showed as the margins of the ribbon.
Fire 06 00081 g008
Table 1. Atmospheric variables in MAB and subset of days with fires.
Fires on MABMAB Overall
x ± snDistributionx ± snDistribution
Minimum
temperature (°C)
10.0 ± 4.73291Gamma11.2 ± 2.46573Gamma
Maximum
temperature (°C)
28.4 ± 5.03283Gamma27.3 ± 3.86573Gamma
Precipitation (mm)0.29 ± 2.363355Exponential1.91 ± 406573Exponential
Precipitation last 30 days (mm)5.87 ± 20.603366Exponential
Relative
humidity (%)
55.7 ± 8.23283Gamma60.0 ± 7.16573Gamma
x represents the mean, s is the standard deviation, and n is the number of records.
Table 2. Relationship between atmospheric variables and the fire records per month.
Min. T
°C
Max. T
°C
Prec.
mm
ENSO KW
Burned area*********
“La Niña” a
“El Niño” a
Neutral month b
Number of fires************
“La Niña” a
“El Niño” a
Neutral month b
Rate of spread************
“La Niña” ab
“El Niño” a
Neutral month b
Percentage of trees burned************
“La Niña” ab
“El Niño” a
Neutral month b
ENSO KW***
“La Niña” a
“El Niño” a
Neutral month b
*
“La Niña” a
“El Niño” ab
Neutral month b
If not otherwise specified, Mann–Whitney–Wilcoxon tests were performed. KW if a Kruskal–Wallis analysis was conducted. —for p > 0.05, * for p < 0.05, and *** for p < 0.01. The bold letters represent the statistical differences in a post hoc Conover–Iman analysis.
Table 3. Distance and significance of the social drivers of ignitions on the MAB.
Distance to:Human SettlementsMain RoadsAvocado OrchardsAgricultural Frontier
U statistic6,701,0676,372,7186,729,6719,857,362
p-valuep < 0.001p < 0.001p < 0.001p < 0.001
Median1356 m1168 m309 m257 m
Percentile 802690 m2775 m2607 m977 m
Percentile 903465 m3779 m5005 m1614 m
Percentile 954258 m4598 m7179 m2219 m
Disclaimer/Publisher’s Note: The statements, opinions and data contained in all publications are solely those of the individual author(s) and contributor(s) and not of MDPI and/or the editor(s). MDPI and/or the editor(s) disclaim responsibility for any injury to people or property resulting from any ideas, methods, instructions or products referred to in the content.

