Review

Fire Retardance Methods and Materials for Phase Change Materials: Performance, Integration Methods, and Applications—A Literature Review

Faculty of Engineering, Constantin Brâncuși University of Târgu-Jiu, 210185 Târgu Jiu, Romania
*
Author to whom correspondence should be addressed.
Fire 2023, 6(5), 175; https://doi.org/10.3390/fire6050175
Submission received: 28 March 2023 / Revised: 13 April 2023 / Accepted: 21 April 2023 / Published: 23 April 2023

Abstract

:
Thermal control methods based on phase change materials have a wide range of applications, from thermal management to latent heat storage for renewable energy systems, with intermittent availability. Organic PCMs have some advantages over inorganics; however, their major drawback is flammability. In critical applications, such as buildings, electric vehicles, and aerospace applications, flammability is an issue that must be addressed in order to comply with safety standards. This review paper covers current studies assessing the PCM response to fire or excessive temperature, methods for ensuring flame retardancy, and their impact on the PCMs key characteristics: phase transition temperature range, latent heat, heat transfer rate, and compatibility with other system materials. A special focus is set on the preparation methods and the effectiveness of the flame-retardance achievement method. Some research gaps and further research directions are identified and discussed.

1. Introduction

Phase change materials (PCMs) are increasingly used as passive thermal control means with the purpose of limiting the controlled object temperature variation [1,2,3,4,5], or in energy supply systems, where their availability is not synchronous with their demand [6,7,8,9,10,11,12]. From the flammability point of view, it is relevant to categorize the PCMs taking as differentiation criteria the chemical nature of the substance, as presented in several review articles [13,14,15]. In a broader sense, PCMs can be categorized as organics, inorganics, and metallics. Metallic PCMs have high thermal conductivity and no flammability, but the relatively high melting point temperature limits their applicability [16]. Organic compounds are chemically stable, non-corrosive to the metallic surfaces, and do not tend to exhibit phase segregation [17]. The most important disadvantages are the low value of the thermal conductivity and the flammability. Inorganic PCMs have high phase transition enthalpy and thermal conductivity higher than organics and are not flammable [18,19]. The main drawbacks include chemical degradation after a number of cycles, chemical interaction with the metallic surfaces, and supercooling. A special class of PCMs are eutectics [20,21], which consist of mixtures of two or more pure PCMs with the purpose of tuning the melting point and the phase transition enthalpy. Eutectics have several advantages over pure PCMs: high volumetric phase transition enthalpy, a narrow phase transition temperature range, and thermo-physical properties that can be precisely modulated in order to comply with the application requirements.
The standard selection process of an adequate PCM for each application depends on two classes of criteria, as follows:
I.
Main class criteria:
I.a.
The temperature range over which the phase transition process occurs;
I.b.
Enthalpy variation during phase transition.
II.
Secondary class criteria:
II.a.
Chemical compatibility with the rest of the system components;
II.b.
Constraints related to mass/volume or storage density;
II.c.
Supercooling;
II.d.
Thermo-physical properties stability;
II.e.
Flammability;
II.f.
Cost;
II.g.
Lifecycle considerations and environmental impact.
While the main class criteria are primarily considered, secondary class criteria must always be considered, depending on (i) PCM selected in accordance with the Class I criteria and (ii) specific application requirements.
Most PCM applications require thermal energy storage as there is latent heat at temperatures close to the ambient [22]. For such applications, organic PCMs are the most adequate. The commonly-used organic PCMs are as follows [14]: paraffins, alcohols, fatty acids, esters, polyethylene, polyurethanes, polyethylene-glycol, and polyalcohol. Flammability data are presented in Table 1 for the commonly used organic PCMs.
The main applications for which organic PCMs are suitable include building materials and integration in the built environment [4,24,25,26,27,28], thermo-regulated textiles and clothing [1,2,29,30], thermal control of electric battery systems [5,31,32,33,34,35,36,37,38], and thermal control of electronics [39,40,41].
This review analyzes the state-of-the art research regarding the strategies and techniques employed to suppress the flammability of organic PCMs. An introductory section discusses the flame retardancy evaluation methods, the flammability quantitative metrics, and the industry-standard flammability tests. The aim of the review was to explore the diversity of preparation methods, identify commonly used approaches, and analyze the flame retardancy performance of various methods. Wherever it was possible, details on the preparation method/synthesis route were provided, and the results of the standard flammability tests were presented and discussed. As a secondary objective, the review aims to identify and categorize the methods employed to achieve flame retardancy in PCMs. Research gaps and possible new research directions were identified and discussed in the Conclusions section. The information sources were the databases ScienceDirect, Web of Science, Scopus, and IEEE Xplore. Preference was given to recent research articles, with more than 50% being from 2020 or later.

2. Evaluation of PCMs Flammability

The flammability of organic PCMs is a critical matter in applications such as those mentioned above, where personal injuries or material damage can occur. The quantitative evaluation of flammability is expressed usually by parameters such as flame spread velocity [42], and flash point values (provided usually in the Material Safety Datasheet—MSDS for commercial PCMs) [43]. The flash point—defined as the “lowest liquid temperature at which, under certain standardized conditions, a liquid gives off vapors in a quantity such as to be capable of forming an ignitable vapor/air mixture” (EN 60079-10-1)—is one of the most important parameters in fire protection since it is easy to interpret in the larger context of the application. Another important parameter that must be considered in the overall design of the PCM-based application is the auto-ignition temperature (the lowest ambient temperature at which the substance will undergo spontaneous combustion). Other flammability quantitative metrics are
  • The Critical Heat Flux (CHF) [43]—the lowest value of the thermal load per unit area at which a combustion reaction can be initiated, either spontaneous or piloted.
  • The Heat Release Parameter (HRP) [44,45]—a dimensionless parameter depending on the burned material temperature T b and the unburned material temperature T u :
    α = T b T u T b
  • The Heat Release Rate (HRR) is a quantitative metric of the rate at which the fire releases thermal energy [46]. This parameter is more important in assessing fire propagation dynamics. HRR is measured in flux per unit surface area and it is determined following ISO 5660-1.
Standard flammability tests were designed in order to define a baseline, meaningful comparison between the flammability of different chemicals or flame retardancy methods.
Although the flammability test conditions may be significantly different from the real-life application conditions under which fire risks exist, it is essential to assess the flammability under standard test conditions. The results of the standard flammability tests (and the flammability grading received after testing) allow a cross-comparison between various materials. Thus, indirectly, the behavior of a material under real-life fire conditions can be estimated. This section presents the standard flammability tests reported in the literature employed to assess quantitatively (and grade) pure or encapsulated PCMs, shape-stabilized, and composite materials PCMs. From the fire risk/flammability/flame retardancy point of view, PCMs do not differ from other materials; no specific flammability test exists that is only applicable to PCMs.
The flammability tests presented in this section were selected based on their prevalence in the studies included in this review paper, discussing the prerequisites and conditions, and their applicability and limitations.

2.1. UL 94 Horizontal Flammability Test [47]

The horizontal flammability test is an industry standard used to preliminarily indicate the material adequacy regarding the flammability for a given application.
The horizontal burning (HB) test for assessing the solid material’s flammability evaluates the influence of the speed of the burning process (burning rate) of a specimen in mm/min bases on its thickness. It is conducted using standard specimens with nominal dimensions 125 mm × 13 mm and a maximum thickness of 13 mm. The test specimens are conditioned for a minimum of 48 h at standard temperature and humidity, 23 °C and 50%, respectively. The flame source is a Bunsen burner supplied with methane at the fixed flow rate 105 mL/min. The air flow is adjusted in such way that a clean blue flame with a height of approximately 20 mm appears. An open flame is applied to one end of the test specimen (maintained in horizontal position) for 30 s. If the flame front reaches the first 25 mm mark within 30 s, the flame is removed. The highest rating a material can be classified as is HB, under the following criteria:
  • if the flame advances at a speed of less than 40 mm/min for sample of thickness ranging between 3 and 13 mm;
  • if the rate flame advances at a speed of less than 75 mm/min for samples thinner than 3 mm;
  • if the flame is extinguished before the first mark.

2.2. UL-94 Vertical Burning Test [48]

The only difference between UL-94 and the horizontal burning is that the specimen is maintained in a vertical position and the combustion source is placed below the test specimen. The vertical burning test measures the time taken for the self-extinguishment of the test specimen (placed in vertical position) to occur. In this test, the burning and the afterglow time are measured. The dripping of the burning test specimen is monitored too. The flammability rating is set according to Table 2.

2.3. Limiting Oxygen Index (LOI) [49]

Limiting oxygen index (standardized in France NFT 51 and in US ASTM D2863) is a quantitative measure of the minimum percentage of oxygen in a mixture of oxygen and nitrogen, at which the combustion process of the test material can be maintained. The test specimen is placed in vertical position in a cylindrical glass container. An ignition source is put in contact with the test specimen at its top edge. A continuous stream of oxygen/nitrogen mix is fed at a low rate from the bottom of the glass cylinder to support the burning flame. The oxygen concentration in the mix is slowly reduced until the combustion of the test specimen ceases. The data and the procedure for the LOI test are specified through ASTM D2863 [50].

2.4. Cone calorimetry (ASTM E1354 [51], ISO 5660 [52])

In the cone calorimetry technique, a square-shaped sample (100 mm × 100 mm) is subject to a constant heat flux (35 kW/m2—ISO5660 or 50 kW/m2—ASTM E1354). During the monitoring process, the heat release rate (HRR) is recorded along with other relevant parameters, such as time to ignition, the total amount of smoke produced, the rate at which the specimen mass decreases, time to flame out, and the total amount of heat released during combustion. The peak value of the heat release rate (PHRR) represents a quantitative measure of the ease of combustion and flame intensity. The parameters and the methodology of performing the cone calorimetry test were described in more detail by Dowbysz and Samsonowicz [53].
The choice of FR material, the integration with the PCMs, and the preparation/synthesis methods depend significantly on the PCM containment method, i.e., bulk material, shape-stabilized in a matrix material, or encapsulated.
As any other quantitative measurement technique, flame retardancy tests are subject to errors. The most probable source of errors is the quality of the sample. Even if the sample is subject to standard conditioning procedures prior to the flammability test, it is uncommon that different samples would produce different results. For this reason, more relevant results could be obtained if the test is repeated a number of times with identical samples conditioned in the same way. After performing a number of repetitions, a statistical analysis could provide some insight into the relevance of the results. For example, a high value of the standard deviation is an indication of how scattered the results are from the average value, and suggests that either samples could have different flammability properties or that differences in the other test conditions occurred.
Flammability test strategy and the choice of the test are important topics that require detailed discussion. Since some test results could be influenced by subjective factors, it is always useful to perform more than one test, and the qualitative results (such as UL94 grading) should be interpreted in the context of quantitative results (cone calorimetry). Standard test conditions can be very different from real-life applications, which limits their relevance. The test results are, however, relevant if the test is conducted before and after the implementation of a flame retardancy method.
UL-94 vertical and horizontal, LOI and cone calorimetry are the industry-standards to assess the flammability characteristics of materials. In this respect, it is useful to employ such tests for PCMs to assess their appropriateness to be integrated in applications from the flammability perspective.
Although most flammability assessment studies are of an experimental nature, it is worthy to mention that numeric studies exist too, such as De Silva et. al. [54], and De Silva et al. [55].

3. Fire Retardants. Classification and Integration into PCM-Based Systems

The mechanism of action for fire retardants and other means to suppress the organic PCMs flammability must consider the combustion mechanism itself. In general, the physical mechanism of the combustion of organic compounds is represented schematically in Figure 1, Roshan [56]. There are three combustion prerequisites: (i) the thermal energy from the ignition source generates volatile compounds with high flammability, (ii) the volatile products’ concentration is within the flammability limits, and (iii) the volatile products’ temperature is higher than the ignition point. Once the combustion is initiated, the process is self-sustained as long as the thermal energy supplied to the organic compound is sufficient to support its thermal degradation at a rate higher than that required to feed the flame. When the heat supplied by the ignition source is discontinued or negligible, the combustion can be self-sustained if the requirements are fulfilled. The thermal oxidation exothermic reaction then becomes then the thermal energy source. The fire-retardant method’s mechanism of action consists of reducing the heat supplied to a value lower than the critical level for flame stability. This can be achieved by suppressing the intensity of chemical or physical processes occurring during one or more stages of the burning process. The typical strategies to reach this goal are as follows:
  • Creation of a heat sink that absorbs the heat generated by the combustion reaction. This can be achieved by using a substance that degrades in an endothermic process, releasing non-flammable volatile products, which isolate the flame and prevent the access of the oxygen. Aluminum or magnesium hydroxide are the typical compounds that achieve this mechanism.
  • Increasing the loss rate of thermal energy and mass from the burning compound surface by melt dripping. Halogenated compounds with free radical initiators can be used for this purpose.
  • Flame degradation by using chemical species (hydrogen halides or metal halides) that consume the main promoters of the thermo-oxidation in the flame (H and OH radicals).
  • Suppressing the heat and mass transfer at the phase interface by the creation of a superficial charred layer on the surface of the burning compound with insulating properties. Intumescent char can be used for this purpose.
  • Suppressing the thermal volatilization mechanism of the organic compound (or at least its rate) in order to reduce the flammability of the volatile products.
A wide range of fire-retardant additives exist. The most frequently used are nitrogen, sulfur, phosphorus organic/inorganic compounds, halogens (Br, Cl, F), magnesium, silicone, aluminum, antimony, calcium, tin, boron, zirconium, zinc, carbon (graphite), and titanium.
The FRs can be categorized as follows, based on the mechanism of action: (Sittisart and Farid [57]):
  • Flame quencher, which is the most common FR, e.g., halogenated alkanes.
  • FRs that act by local heat absorption (chemical compounds such as magnesium or aluminum hydroxide, which decompose endothermically preventing the heat from reaching the combustible material).
  • Intumescent Flame Retardants, which operate by creating a high-volume char layer that prevents the exposure of the underlying substance to the source of ignition. APP, PER, and EG are the most commonly used IFRs (De Silva et al. [58]).
  • Synergist FRs, of which two distinct types exist:
    Chemical compounds that do not have flame retardancy properties if isolated but work with other FRs to improve the flame retardancy properties. For example, antimony oxide has a synergetic effect for halogenated alkanes.
    Synergist systems, consisting of two or more FRs that work together to achieve a flame retardancy effect stronger than the effect of each FR alone. MMT clay is an FR that works together with heat absorbers and IFRs, Cai et al. [59]. APP used together with EG improves the fire retardancy effect, Cai et al. [60].
Standard IFRs composition consists of three principal components: (i) an acid source, (ii) a carbonizing source, and (iii) a foaming or blowing source [61]. The IFR components must undergo decomposition at a temperature lower than the PCM thermal degradation temperature. The acid source consists usually of phosphorous acid, boric acid, and halides or sulfuric acid. The carbonizing source can be sorbitol, pentaerythritol (monomer, dimer or trimer), char-forming polymers such as PA-6, mannitol, starch, dextrin, phenol-formaldehyde resins, polycarbonates, and polyurethane. The blowing agent consists usually of nitrogen-based compounds, such as urea-formaldehyde resin, urea, dicyandiamide, polyamides, and melamine.
The IFRs action, as FRs can be described through a two-stage mechanism, is as follows:
The acid source decomposes at high temperature generating an inorganic acid with low pH; the acid causes the dehydration of the carbonizing agent, the result being the apparition of a carbonaceous layer. The properties of the carbon layer depend on the number of carbon atoms; the reactive hydroxyl groups (OH) determine the intensity of the dehydration reaction.
The blowing agent undergoes decomposition and releases flammable gases; these can expand the carbonaceous layer converting it into an inflated multicellular layer. For this mechanism to be effective, the blowing agent must undergo decomposition during the carbonizing source dehydration reaction in order to trigger the expansion of the carbonaceous layer. Once this layer is formed, it insulates the underlying material from the thermal energy source and oxygen, achieving the flame retardancy effect.
The integration of FRs and PCMs is achieved in different ways, depending mainly on the PCM state (bulk PCMs, encapsulated PCMs or composite, shape-stabilized PCMs) and the FR nature. Given the large number of methods for achieving flame retardancy for PCMs, a systematization was developed, dividing the FR methods into three main classes:
A.
FR integration in the PCM mass:
A.1.
FRs integration for bulk PCMs;
A.2.
FRs for shape-stabilized PCMs;
A.3.
FRs for encapsulated PCMs.
B.
FR surface coatings.
C.
FR achieved through modification of the chemical bonds.
In the next sections, flame retardancy experimental studies are reviewed and discussed based on the classification presented above.

3.1. Flame Retardants for Bulk PCMs

The integration of bulk PCMs with flame retardants poses less constraints than in the cases of shape-stabilized or encapsulated PCMs. However, PCMs cannot be utilized in latent heat storage applications in a bulk form; it is therefore important to consider the flame retardancy method’s implication on the PCM application lifecycle stages, more specifically, the implication that the flame retardancy method for the bulk PCM will have on the containment method PCM (encapsulated or integrated into a matrix material).
The studies reporting on the integration of FRs into bulk PCMs are scarce due to the lack of practicability.
Palacios et al. [62] conducted an experimental study considering three PCM as follows: (i) Paraffin RT-21, (ii) 73.5% CA + 26.5% MA, and (iii) 75.2% CA + 24.8% PM. The following FRs were Al(OH)3, Mg(OH)2, Hydromagnesite (HM), APP, and an IFR. For each PCM in the list mentioned above, five recipes were developed, consisting of two components, the PCM and one FR. This resulted in a total of 15 recipes. The flammability characteristics were assessed by means of the dripping test (described in the standard UNE 23727 [63]). The lowest ignition time (9 s) was observed for the recipe 50% (CA + PA) + 50% HM, and the highest (50 s) was observed for the recipe 60% Paraffin + 40% IFR. It was reported that the flammability properties of paraffin were not improved significantly by the FRs used, while fatty acid mixtures’ fire resistance improved significantly at a mass fraction of 50% of HM or Mg(OH)2.
Palacios et al. [64] developed a new PCM formulation with high thermal conductivity and reduced flammability, considering paraffin RT-21 and two eutectic mixtures containing CA, MA, and PM. Mg(OH)2 was used as the FR and two thermal conductivity enhancers were used, EG and powder graphite. The dripping test results are presented in Table 3.
These studies are limited to the investigation of the bulk PCM and they advance the discussion, analyzing the flammability when the PCM is shape-stabilized (encapsulated of integrated into a matrix material). As bulk PCMs cannot be used in applications directly, not many studies exist that aim to achieve flame retardancy for such substances, as either shape-stabilization or encapsulation are required to render the PCM suitable for applications. The vast majority of the methods in class A are directed towards shape-stabilized PCMs.

3.2. Flame Retardants for Shape-Stabilized PCMs

The problem with integrating flame retardants in PCMs is frequently considered in the context of PCMs shape stabilization methods. Containment by shape stabilization consists basically of methods that involve integrating the PCM into a matrix material, with the purpose of preventing leakage of the PCM in the liquid state [14]. Review studies addressing the shape stabilization methods for solid–liquid PCMs were presented by Zhang et al. [65] and Chinnasamy et al. [8]. When discussing the flammability of the shape-stabilized PCMs, the flammability of the SS matrix material must also be taken into account.
The shape stabilization method is a critical issue in the selection and effectiveness of the flame suppression method. Wang et al. [66] conducted an experimental study assessing the flame retardancy of SS PCMs with paraffin, HDPE, and SBS. The following materials were used in this study: paraffin with MP 31 °C and LH 106.7 kJ/kg, HDPE, SBS (linear copolymer, S/B = 3/7), and EG with expansion ratio 100–400 mL/g (EG was thermally cured in a muffle furnace for 20 s at 400, 500, 600, 700, and 800 °C, denoted EG4-EG8). A total of ten samples with the components and weight ratio were prepared, as presented in Table 4.
The following flame retardancy tests were carried out:
  • Horizontal burning test using samples with the dimensions 75 mm × 10 mm × 3 mm. Samples were clamped in a horizontal position at one end while the source of fire was applied at the other end for 10 s. The strip underwent combustion until the flame hit a mark at 5 cm distance from the clamps. The burning time was recorded and the sample mass before and after burning was also recorded.
  • Thermal stability test, where 10 mg samples were heated from 40 °C to 600 °C at a constant heating rate of 20 °C/min under an air flow of 25 mL/min.
  • Cone calorimetry, where samples with the dimensions 100 mm × 100 mm × 3 mm were subject to a heat flux of 35 kW/m2.
The combustion time for pure PCM and PCM-EG samples treated at different temperatures is presented in Figure 2—Left. It can be noticed that EG extends the combustion time considerably. The sample PCM-E4 had the highest value of combustion time. Other reports exist in the literature (Sittisart and Farid [57]) attributing the effect of a higher combustion time to the EG effect of insulation. The different values of the combustion time for different thermal treatment temperatures were explained by the different pore sizes, which have different absorption characteristics. The HRR is plotted in Figure 8—Right. It can be noticed that the pure PCM HRR is twice as high as the corresponding value of flame-retarded samples.
Various stabilization methods were reported, such as carbon-based (nanostructure), metallic support (metal form/matrix), or polymer matrix. The shape stabilizing material/structure plays a key role in the flammability of the composite.
Other PCM applications such as fire protective clothing require low or zero flammability. Integrating PCMs into fire protective clothing or other protective clothing for hazardous environments is a method of improving the thermal comfort. It is essential though that the clothing layer containing PCMs is non-flammable, as reported by Bartkowiak et al. [23] and He et al. [67]. In fact, international regulations define the standards for such clothing [68,69].
Su et al. [70] developed a PCM-coated fabric with flame retardancy properties through a dry coating process. The protective clothing for firefighting personnel (NFPA-1971 Standard on Protective Ensembles for Structural Fire Fighting and Proximity Fire Fighting) was selected as the test object. Based on this textile fabric, a layered structure was manufactured, consisting of an outer shell (OS), a moisture barrier (MB), and a thermal liner (TL). A PCM coating slurry consisting of a PCM suspension (45%), 15% adhesive, 0.3% thickening agent, 10% defoamer, and distilled water up to 100% was prepared. The slurry was mechanically stirred until it reached the appropriate viscosity for the next step of the process. Then, the coating slurry with FR was prepared by means of the dry method coating technique. The flammability properties of the PCM-coated fabrics were assessed experimentally by the cone calorimetry method. Three layouts were manufactured, as presented in Table 5, with the PCM-coated layer in three different positions.
Two substrate fabrics were considered (denoted F1 and F2), as presented in Table 6.
It was reported that the PCM-coated fabric flame retardancy was modified by the substrate fabric, the PCM MP value, the FR type, and the location of the PCM-coated fabric. The PCM-coated fabric with the PN-FR had a higher resistance to the action of fire. On the other hand, the PCM coated fabric with the Si-FR had a lower heat release rate. The PCM-coated fabric integration had a positive effect on the thermal protective performance of firefighting protective clothing. The main influence factors were the MP value and the type and the position of PCM-coated fabric. The PCM-coated fabric with the substrate fabric F2, the MP 42 °C, and the PN-FR was deemed as the most suitable if direct contact with the fire source for a short duration was expected. It was reported that the PCM-coated fabric with the substrate fabric F2 and the Si-FR was deemed more appropriate if operation in a low thermal radiation environment for a prolonged time was required.
Wang et al. [71] prepared a number of 12 PCM-coated fabrics by means of the dry-coating method. Their properties were tested under two types of conditions: (i) low-level thermal radiation and (ii) fire exposure. Under the low-level thermal radiation, it was reported that the PCM incorporation significantly improved the fabric thermal protective performance. The factors that influenced the fabric thermal performance were the PCM content, the PCM melting point, and the thermophysical properties of the fabric. The fabric coated with a PCM with the melting point 35 °C provided the best thermal protective performance under both low-level thermal radiation and fire exposure conditions.
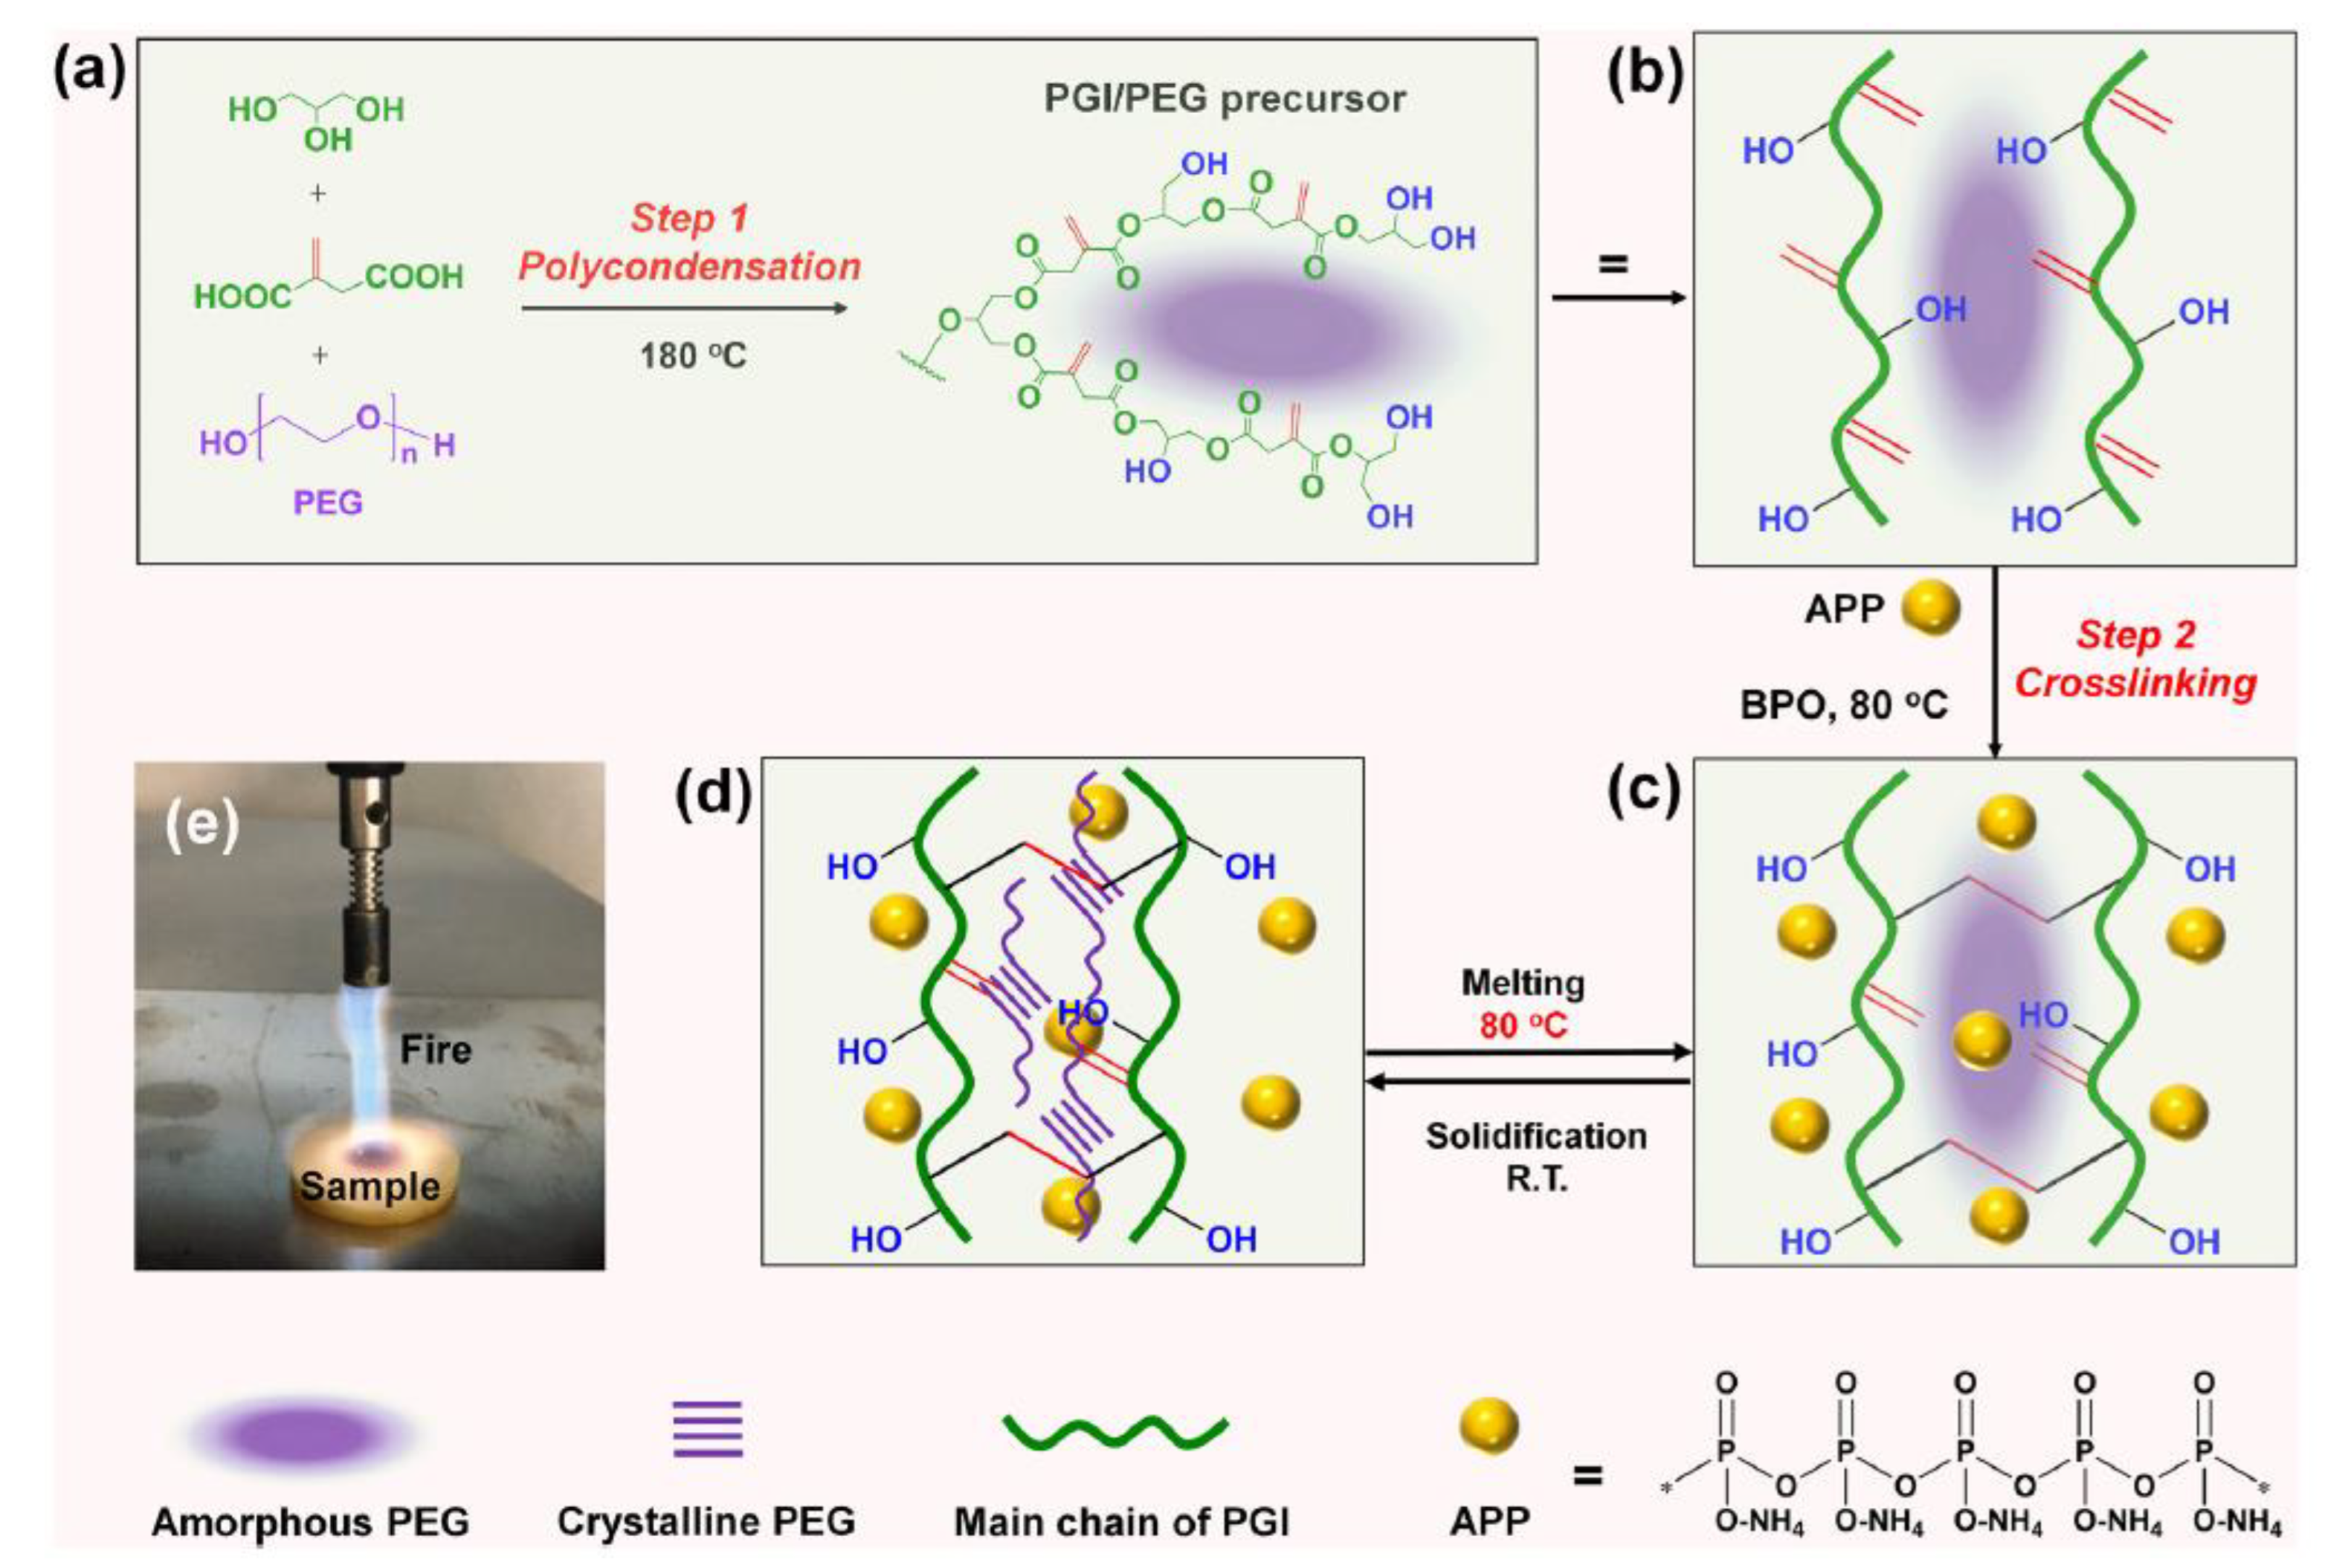
Yin et al. [72] developed a low environmental impact process to prepare a fire-safe PCM by mixing poly (glycerol-itaconic acid)-loaded polyethylene glycol (PEG) and ammonium polyphosphate (APP). The synthesis process is presented schematically in Figure 3.
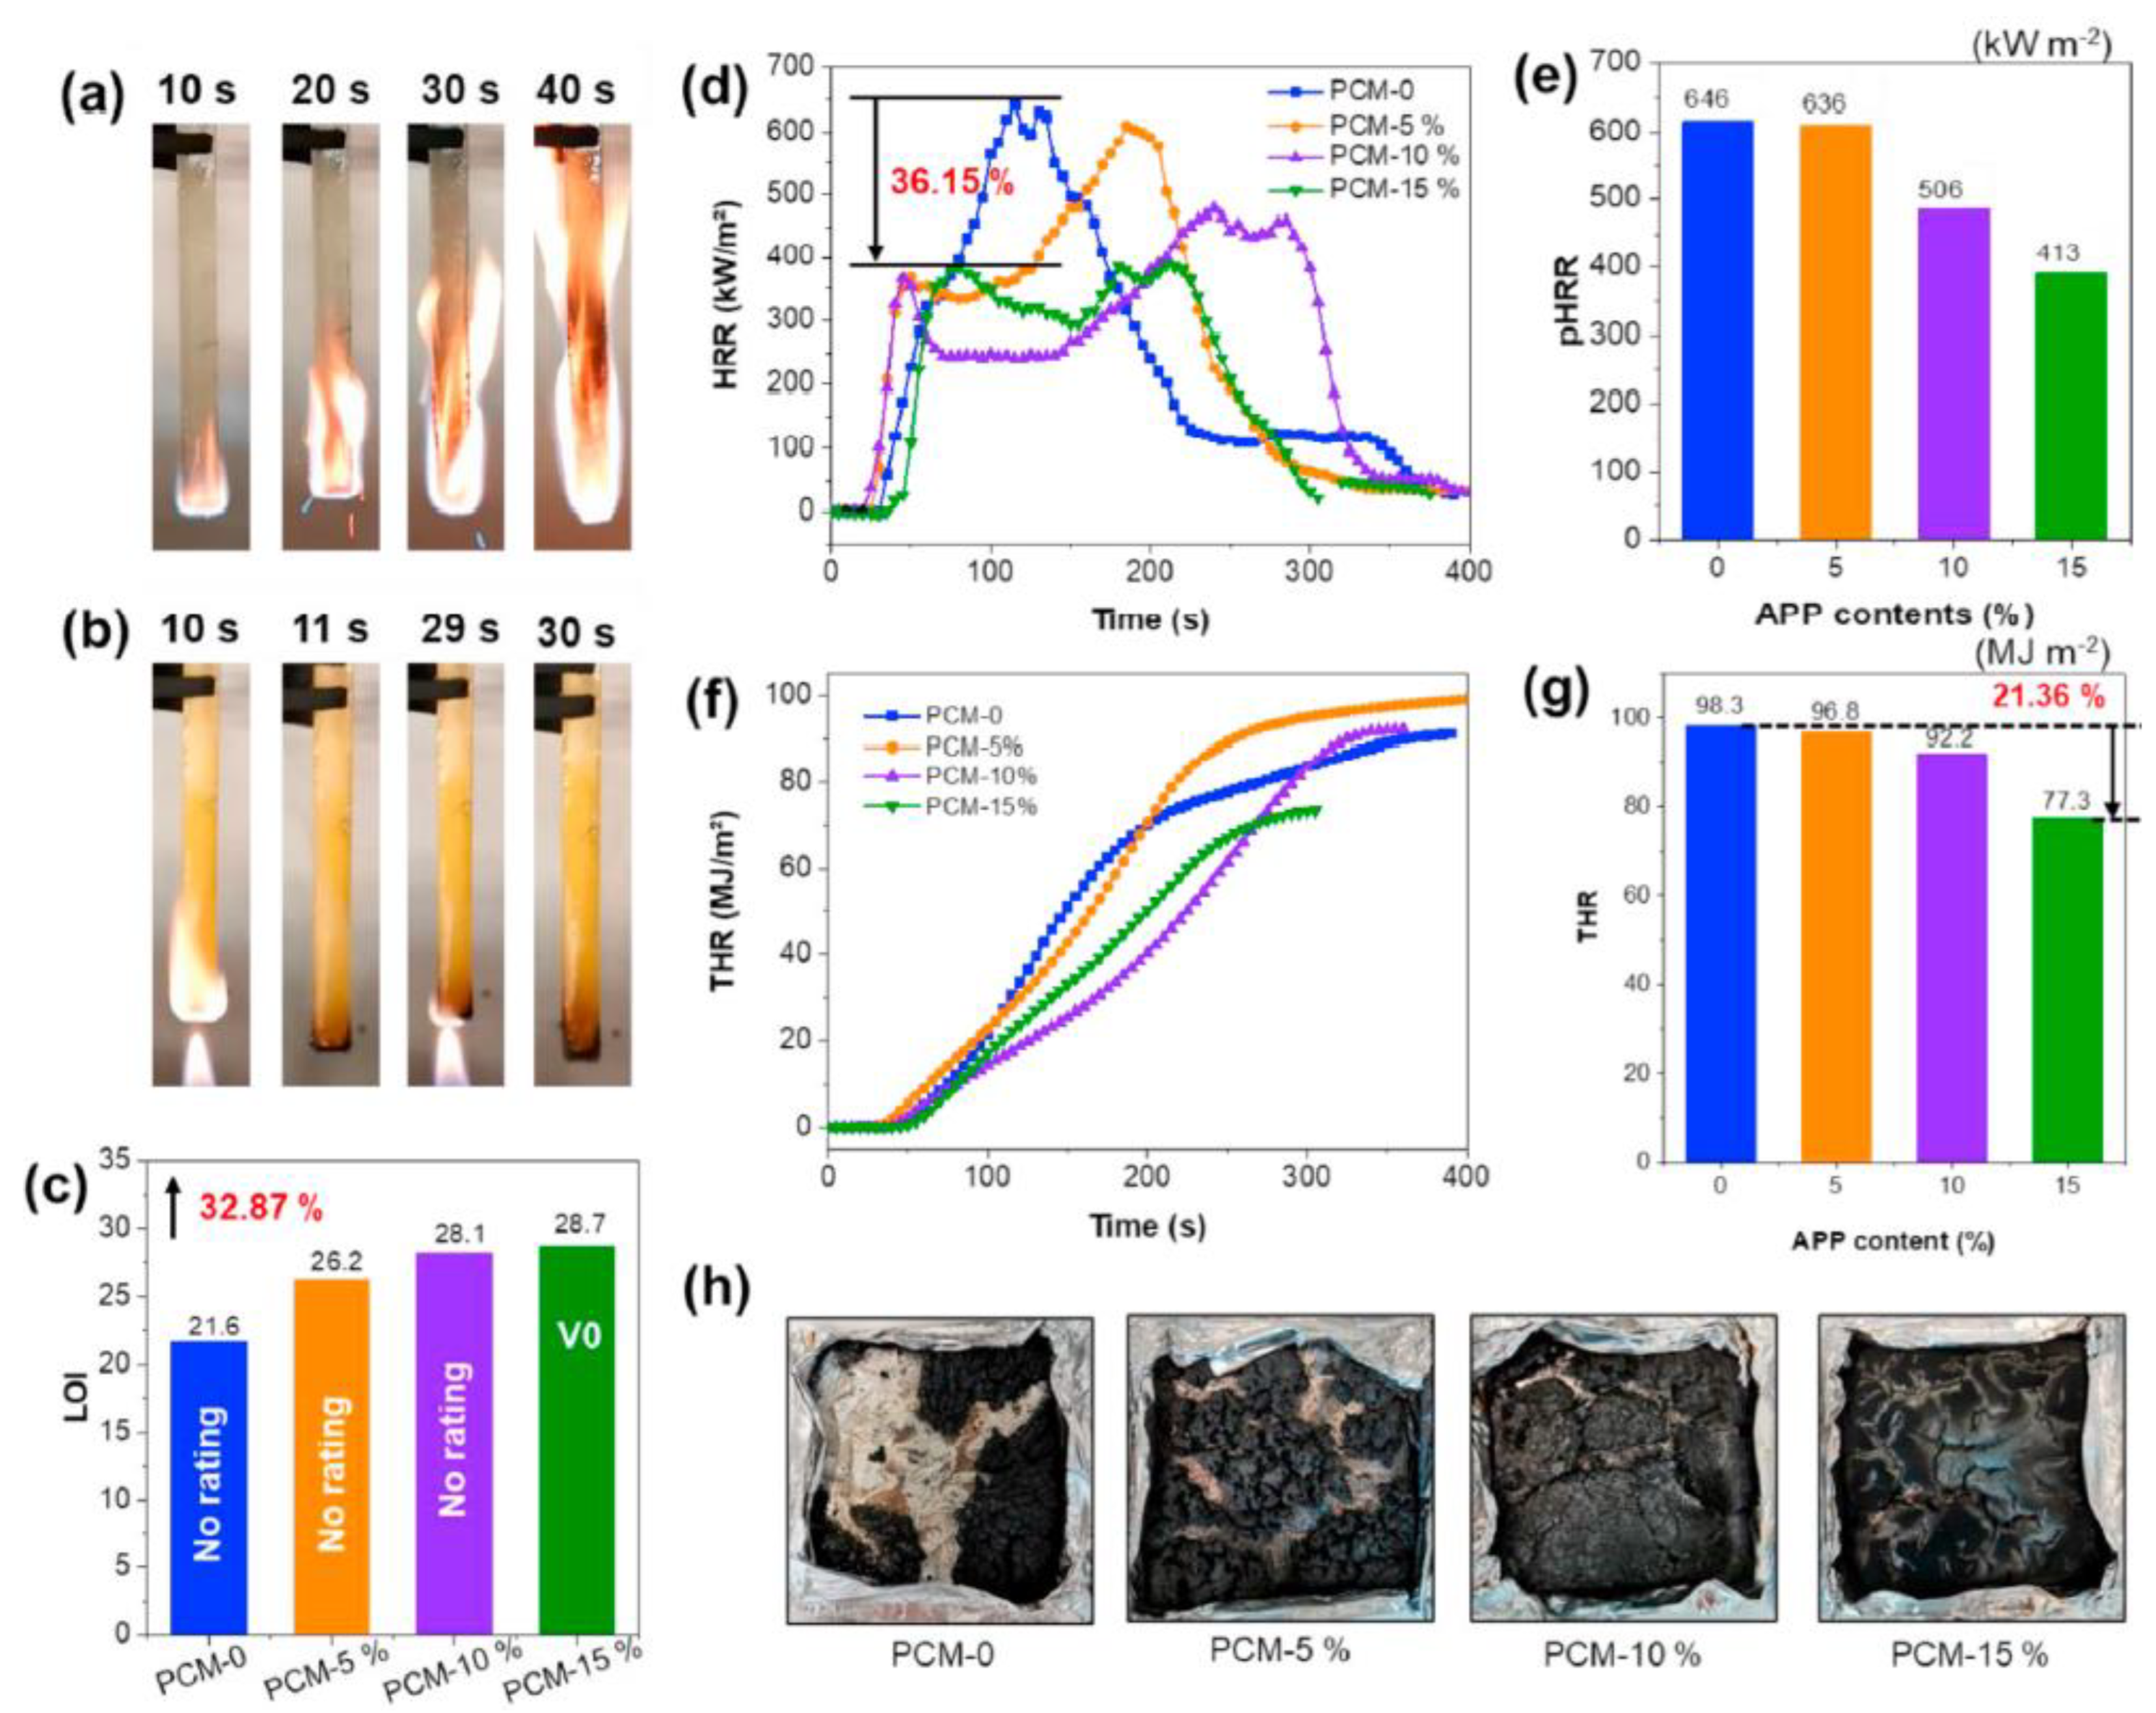
The newly developed PCM flammability was assessed by means of the LOI, UL-94, and cone calorimetry tests. The results are illustrated in Figure 4. The UL-94 test showed that PCM-5% and PCM-10% resulted in No Rating, the same as PCM-0. PCM-15% passed UL-94 with a V-0 rating, with self-extinguishing performance (Figure 4b), which indicated that a proper amount of APP contributed to suppressing the fire spread considerably. The LOI test (Figure 4c) showed that the addition of 15 wt% APP considerably increased the PCM matrix LOI index. It was reported that the LOI index increased from approximately 22% (PCM-0) to 29% (PCM-15%). The cone calorimetry test was conducted for the four PCMs samples. The HRR and THR curves are presented in Figure 4d,f. As shown in Figure 4d, the pure PCM-0 exhibited a high value of PHRR at 646 kW/m2. After APP addition, the peak HRR decreased slightly to 636 kW/m2 (PCM-5%), 506 kW/m2 (PCM-10%), and 413 kW/m2 (PCM-15%). The curves of modified PCMs showed a significant decrease before reaching the main peak, as opposed to PCM-0 with a continuously rising HRR. This was attributed to the formation of layers of a carbonaceous nature during combustion, which can suppress the mass (volatiles, oxygen, etc.) and heat transfer.
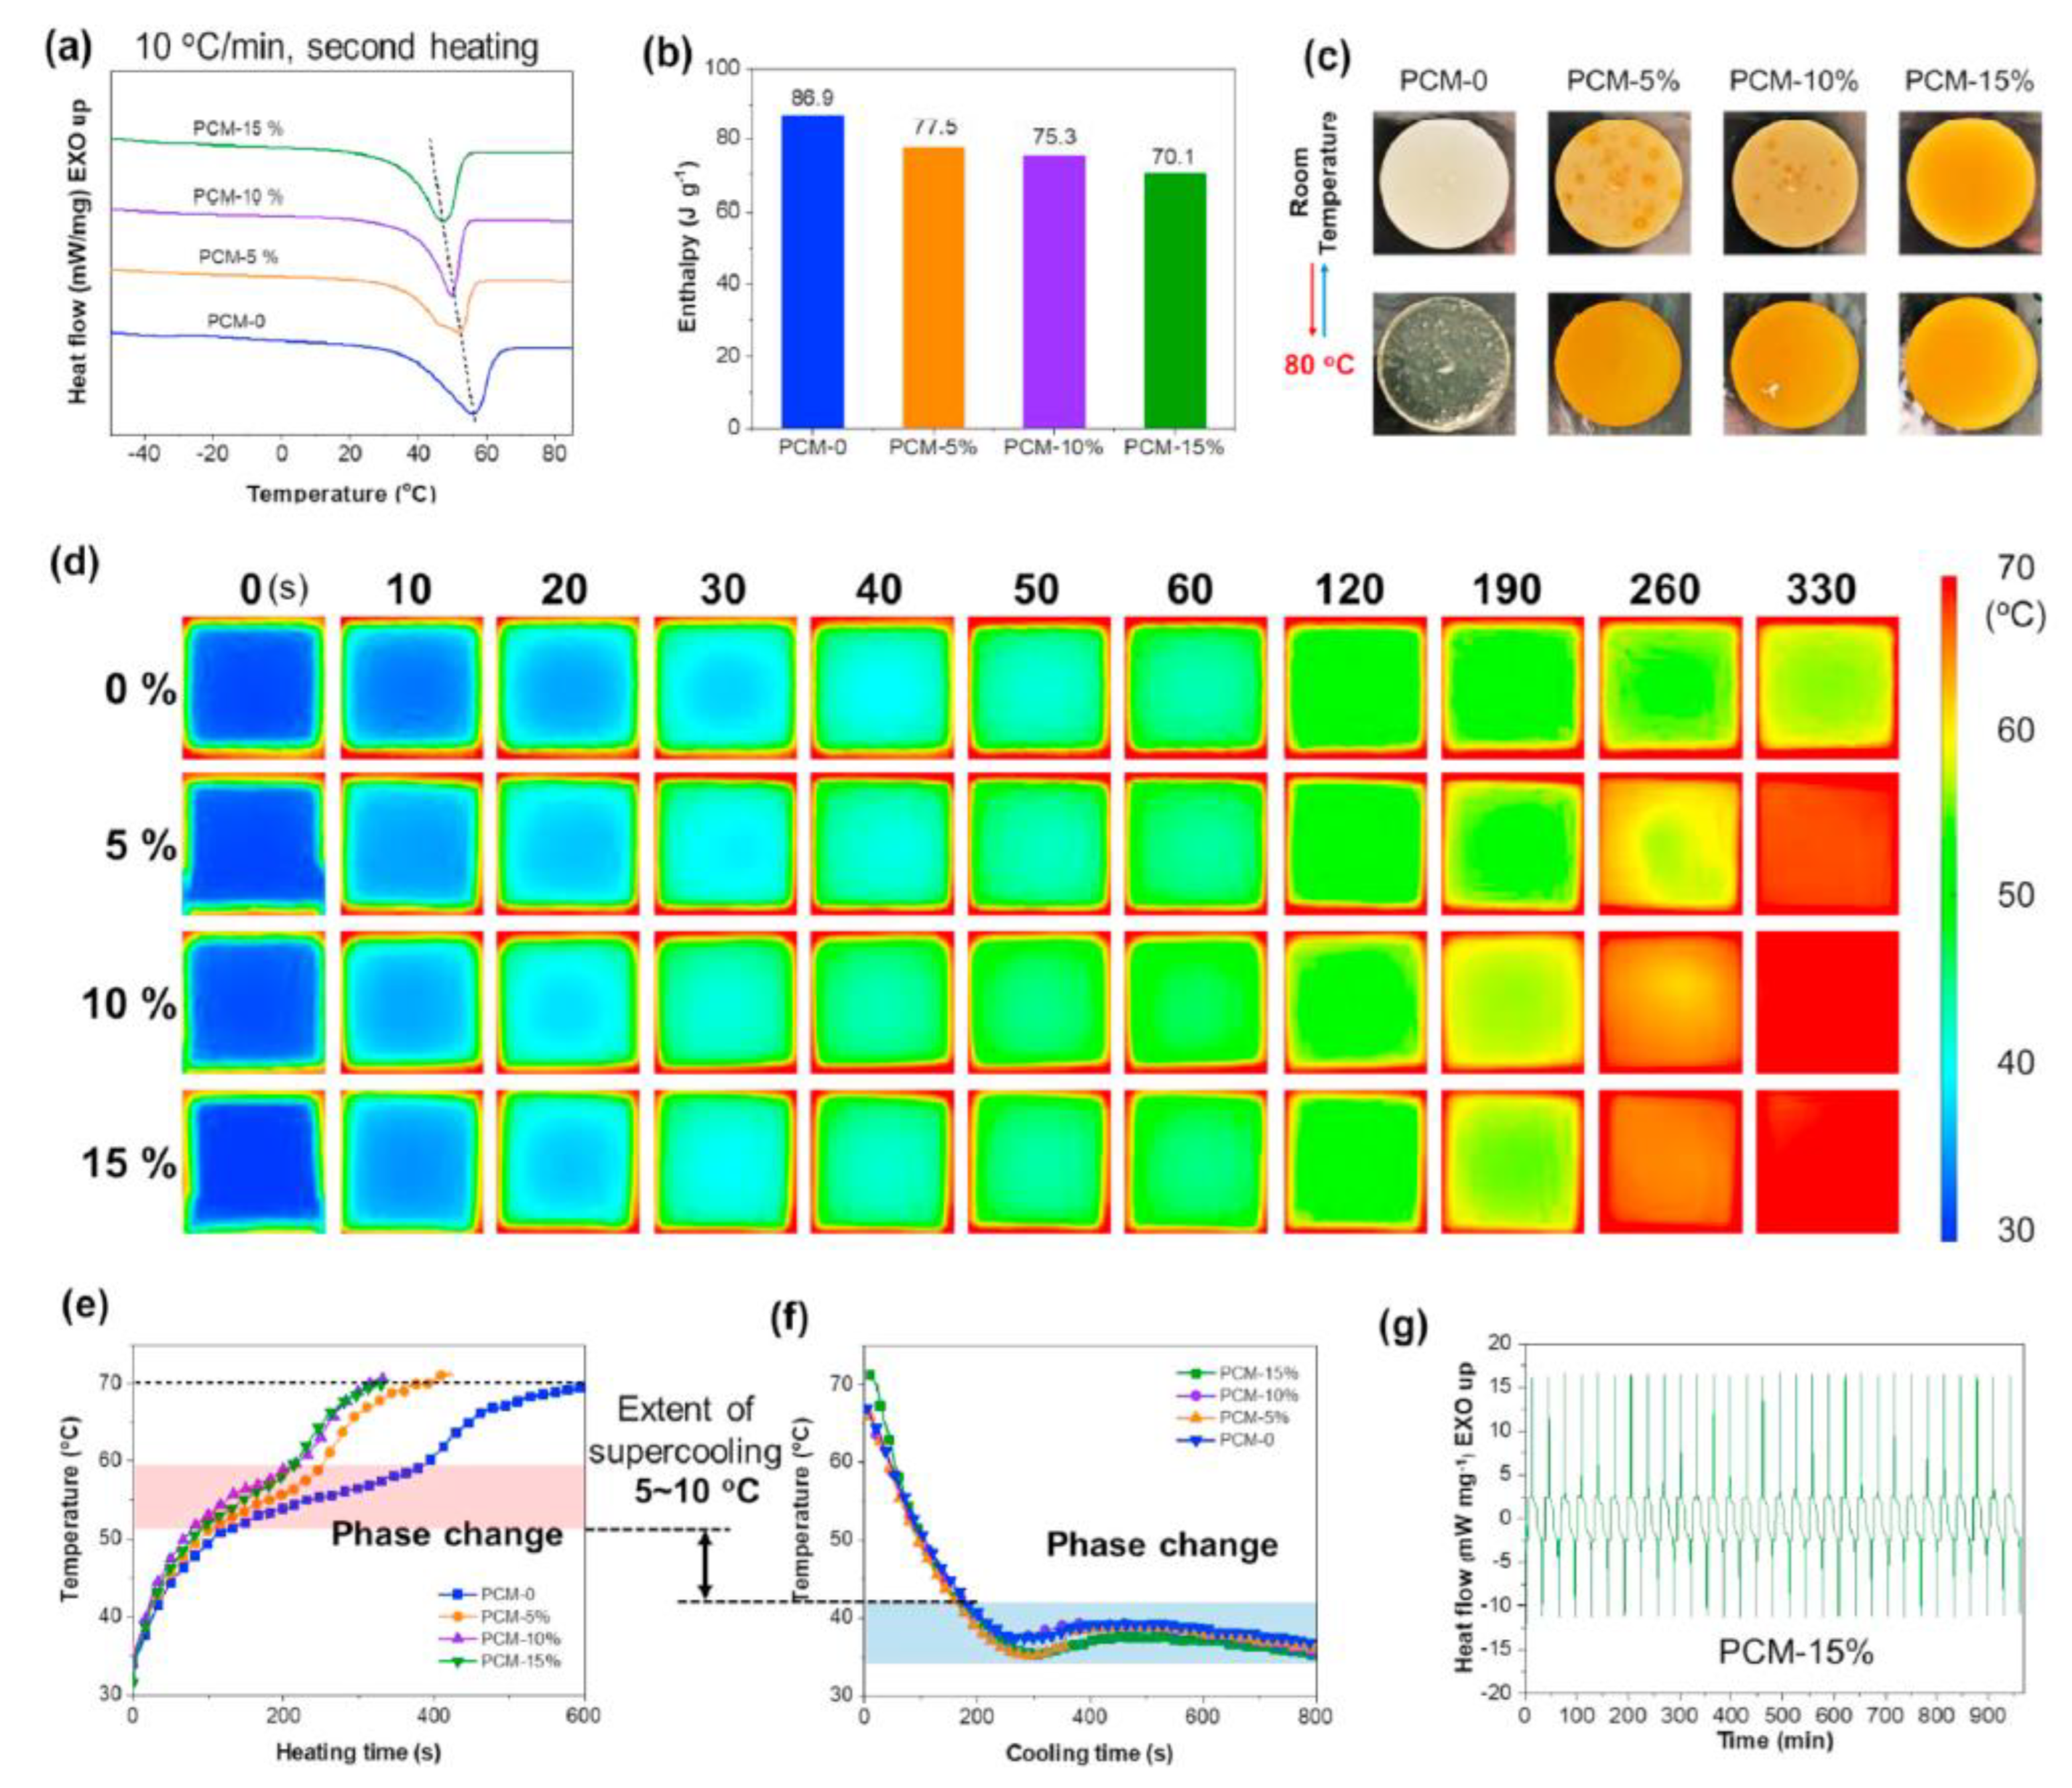
The MP and the LH of the four PCM samples are presented graphically in Figure 5. It was reported that the increase in the APP contents resulted in a reduced value of the latent heat. However, at APP content 15 wt%, the enthalpy of fusion was still higher than 70 kJ/kg, which is a relatively high value for similar PCMs. The supercooling values for PCM-0, PCM-5%, PCM-10%, and PCM-15% were 13.21 °C, 5.90 °C, 10.01 °C, and 3.86 °C, respectively. The APP samples’ color (IR camera images, Figure 5d) changed faster than that of PCM-0, which is an indication that APP contributes, to a low extent, to accelerating the heat transfer rate. The temperature–time curves of the samples during the heating and cooling process are presented in Figure 5e. An important observation is that the PCM-APP surface temperature was higher than that of PCM-0 for the same moment in time.
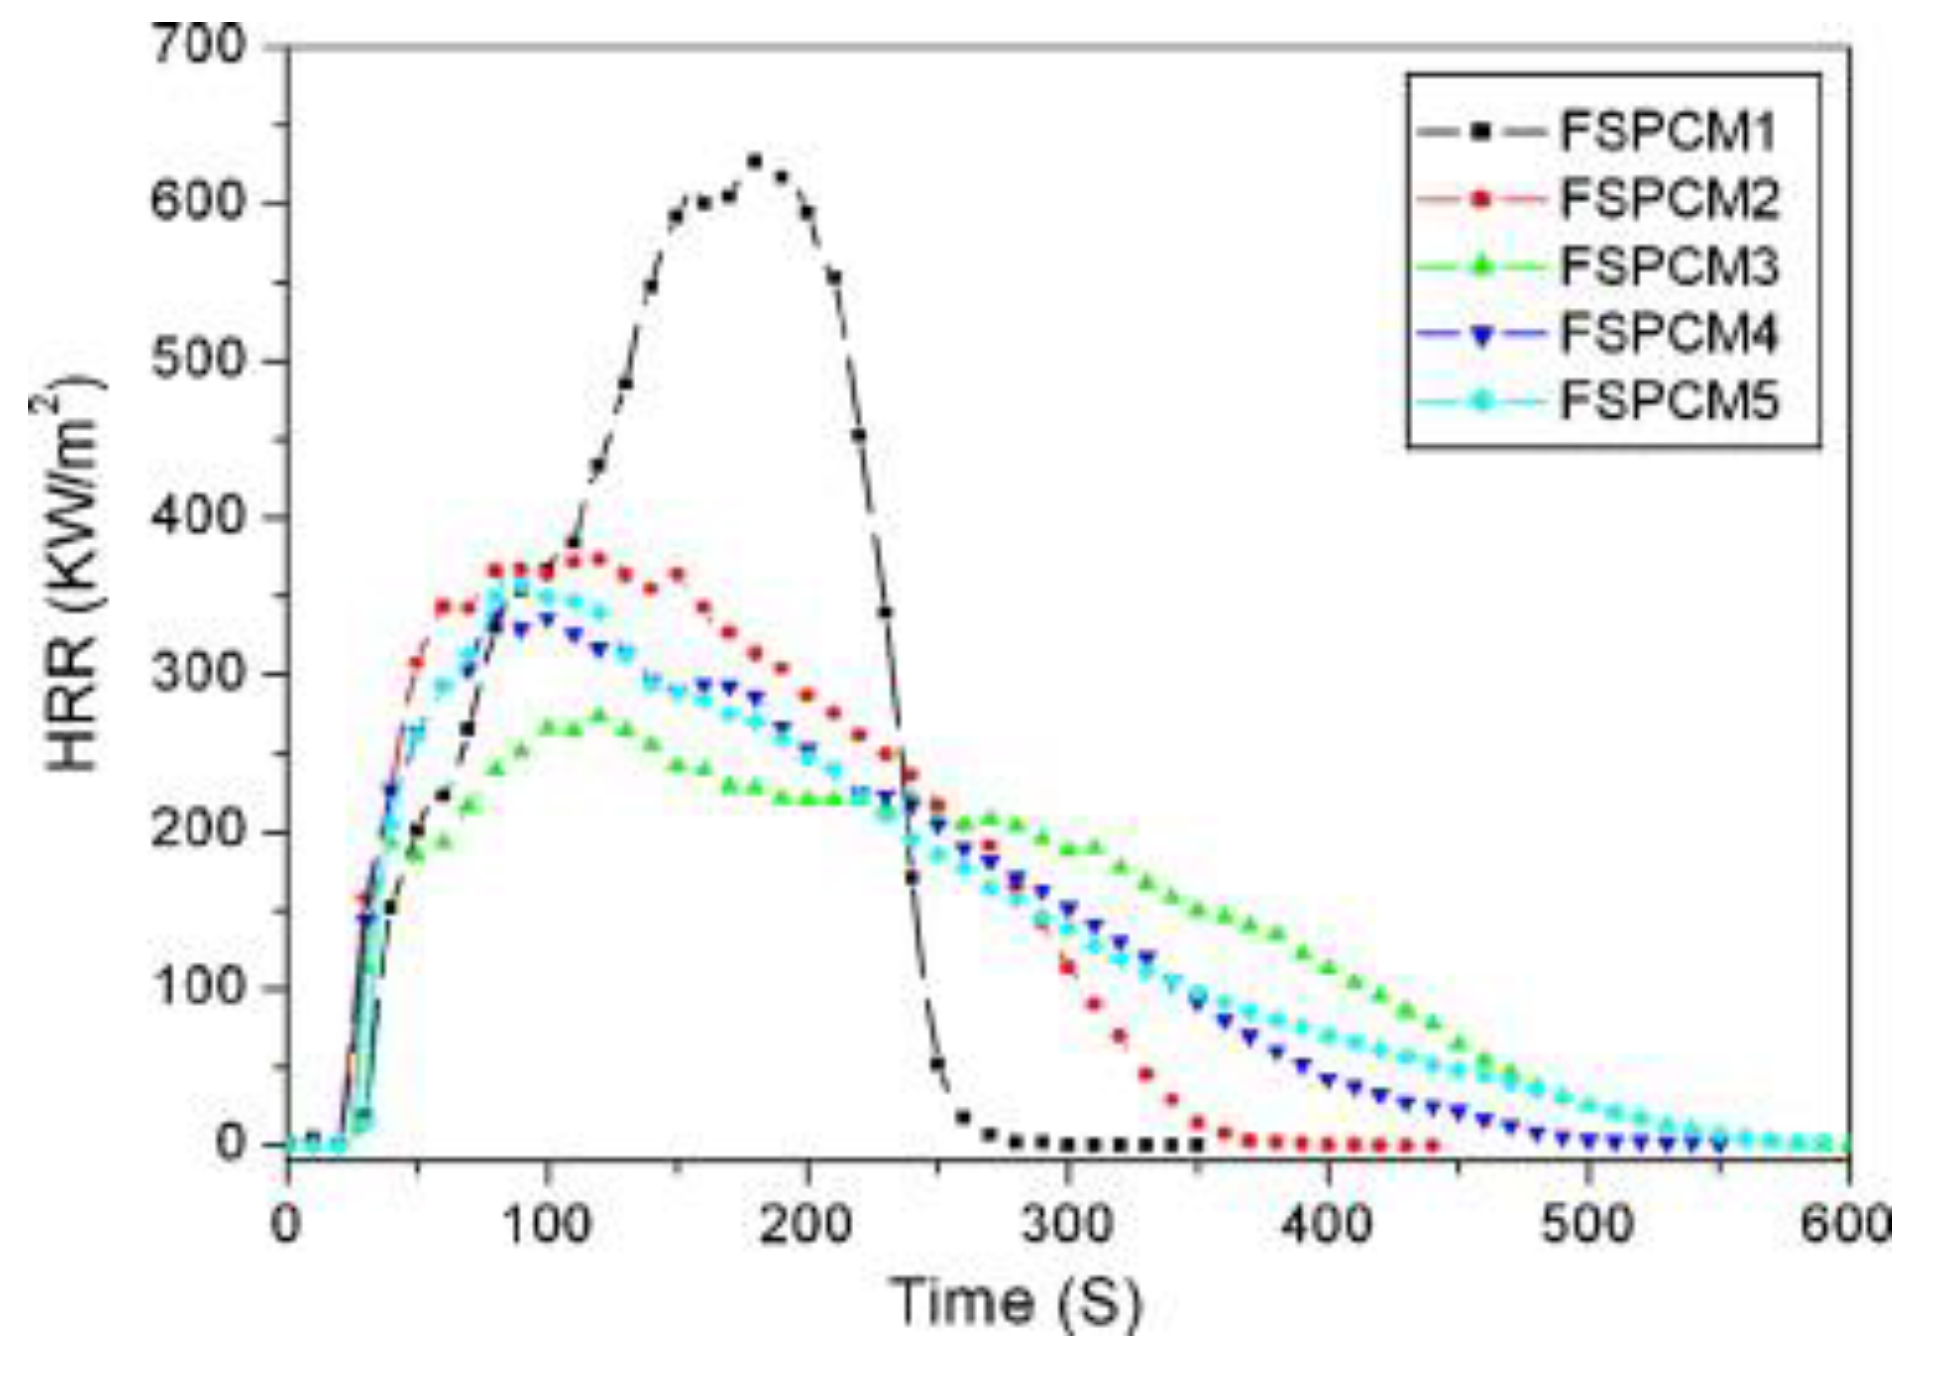
Zhang et al. [73] prepared a SS PCM based on paraffin, and HDPE with good retention capability but with low thermal conductivity and high flammability. EG and an IFR were used to reduce the flammability. Five recipes were developed, as detailed in Table 7. The IFR used in this study was a mixture of pentaerythritol (PER), ammonium polyphosphate (APP), and melamine (ML). The ratio APP/PER/ML was 2:1:1. The PCM was paraffin with an MP value of approximately 51 °C and latent heat of 142 kJ/kg. The samples were prepared in a three-stage process: in the first stage, HDPE and IFR were dried at 60 °C for 24 h; in the second stage, the mixtures were premixed using a high-speed blender; in the last stage, the mixture was extruded using a twin-screw extruder at a temperature range from 90 to 160 °C with a screw speed of 250 rpm.
The flammability parameters were assessed through the cone calorimetry standard test. The HRR curves for the heat flux value 35 kW/m2 are shown in Figure 6. The ignition times decreased from 58 s (PCM1) to 27, and 26 s for PCM2 and PCM3, respectively (Table 7). The ignition times of PCM4 and PCM5 increased to 34 and 38 s, respectively, when the mass fraction of 5% EG replaced an equivalent IFR. On the other hand, EG significantly increased the thermal conductivity, as presented in Table 7. In the case of PCM1, the HRR had two peaks, corresponding to the flammability of the paraffin and HDPE, respectively (Figure 6—Left). This was attributed to the gasification heat difference between paraffin and HDPE.
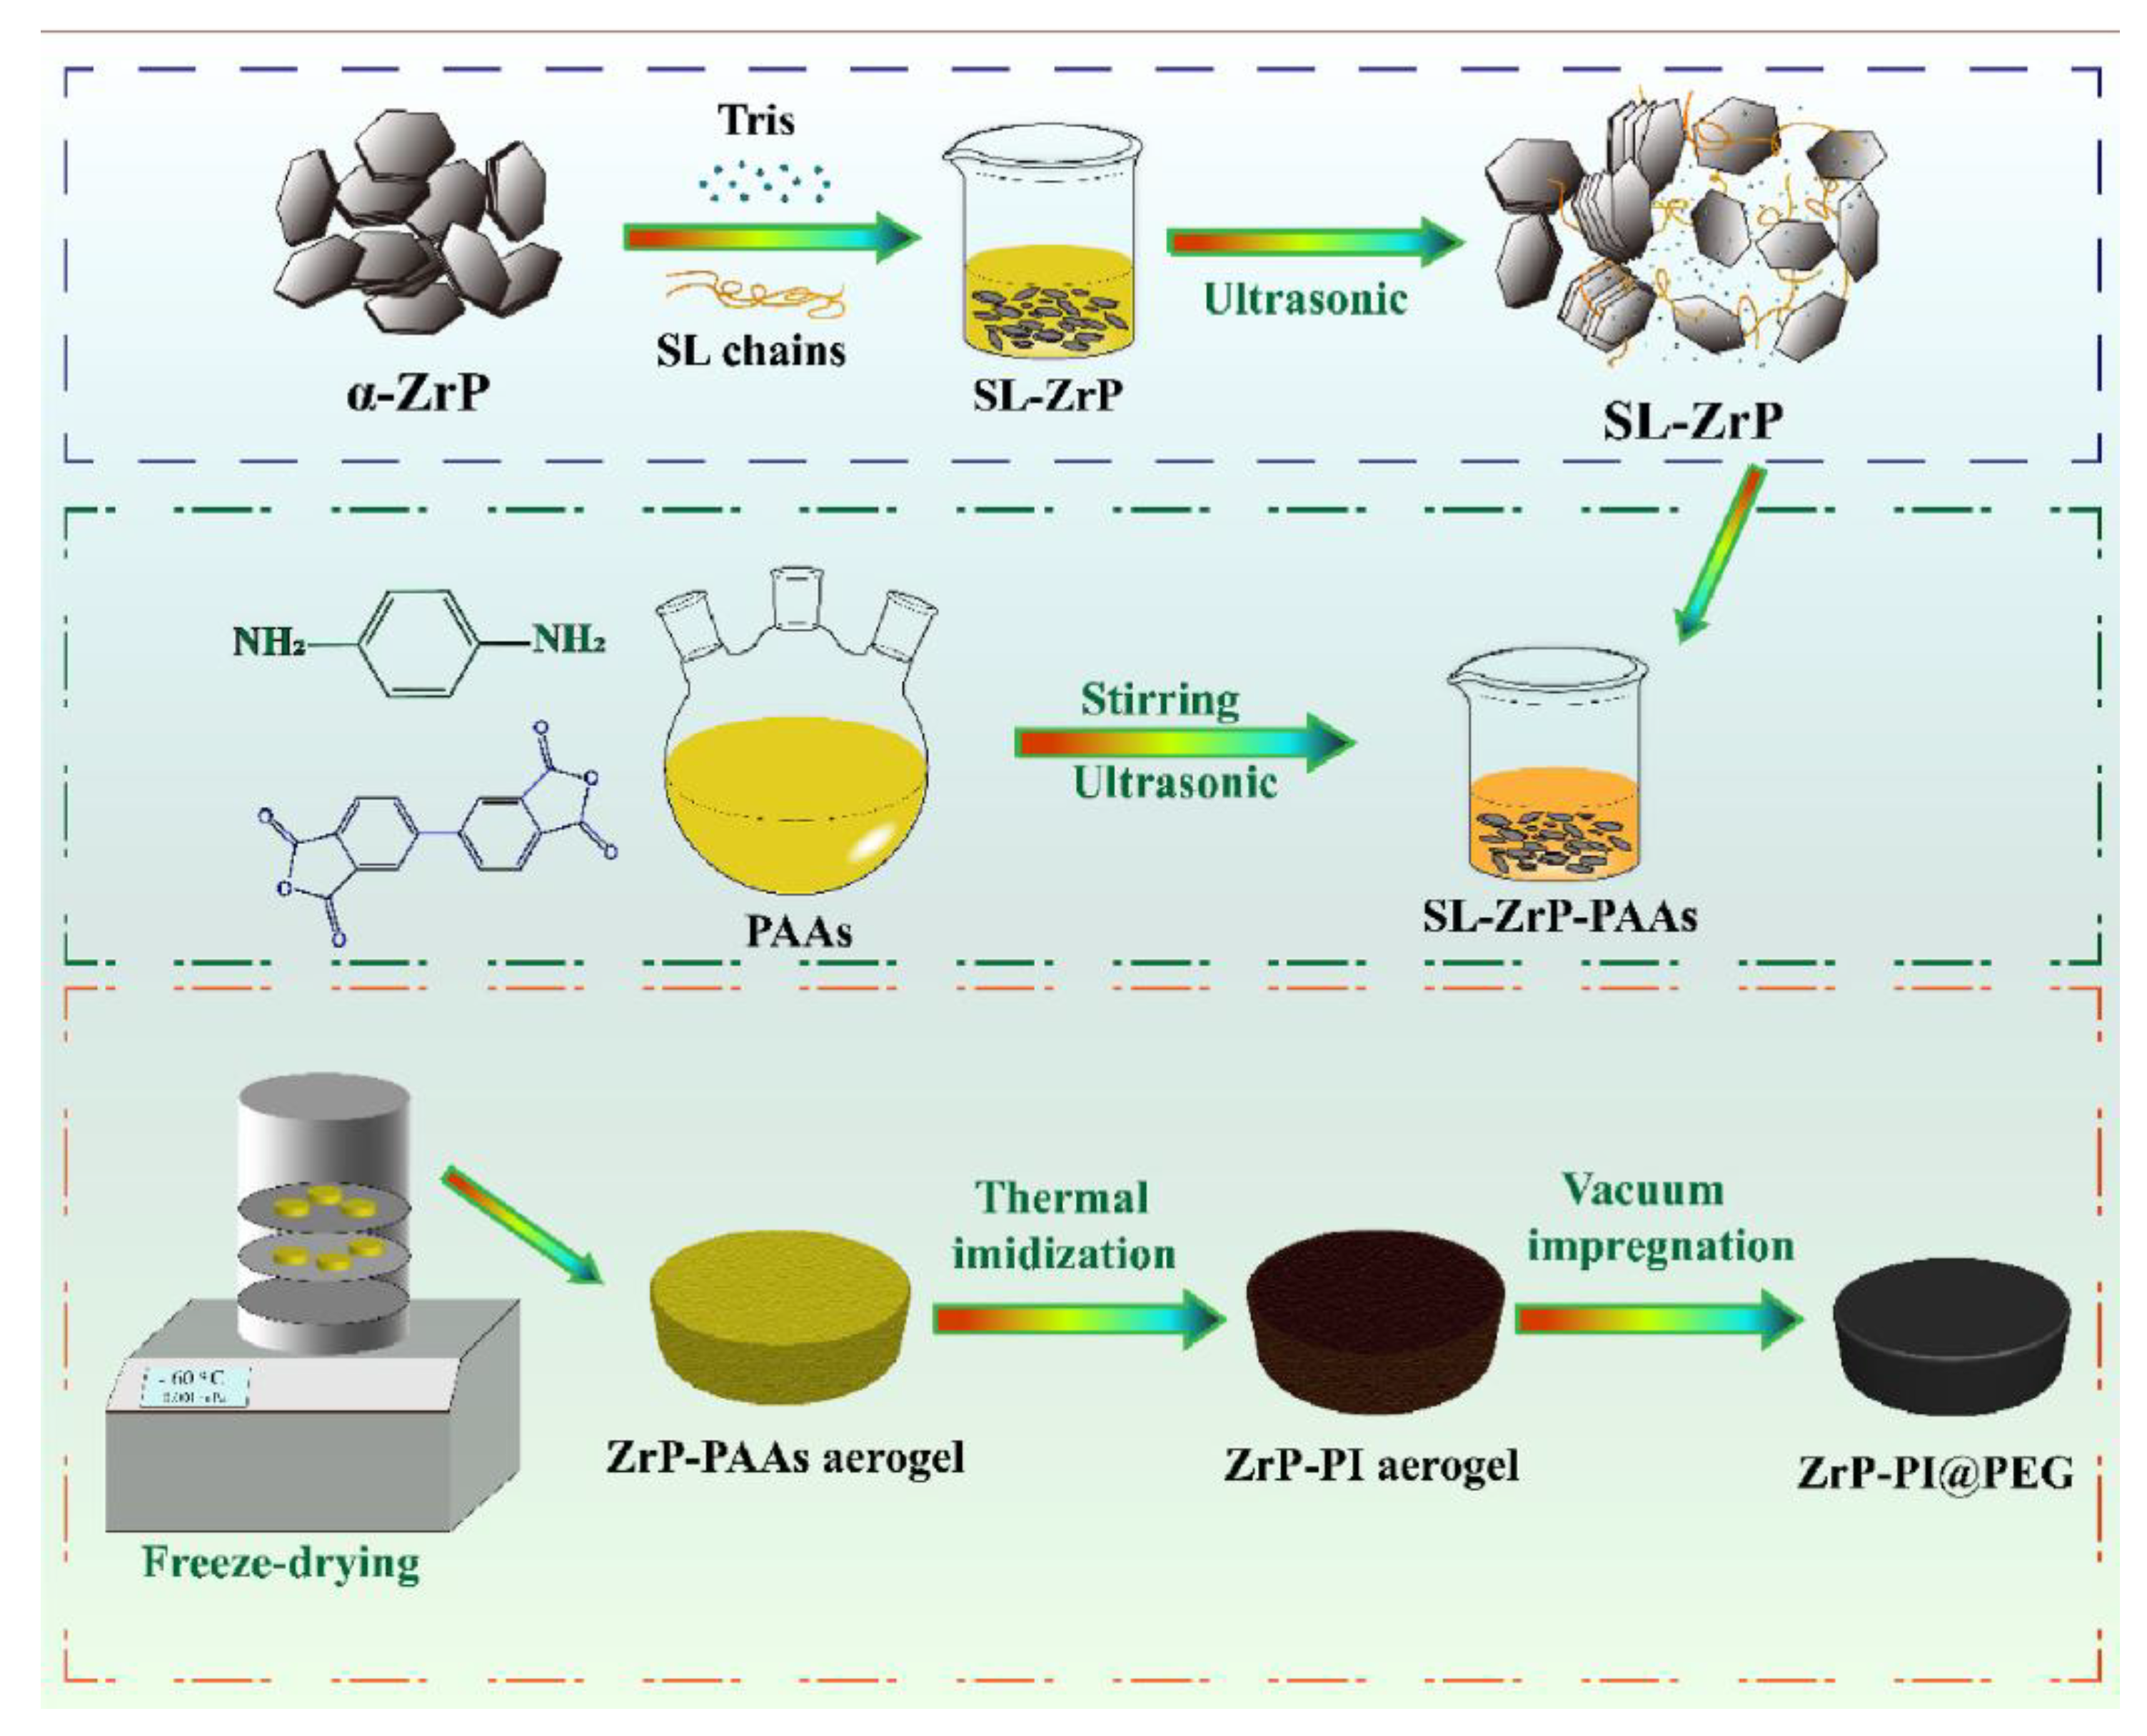
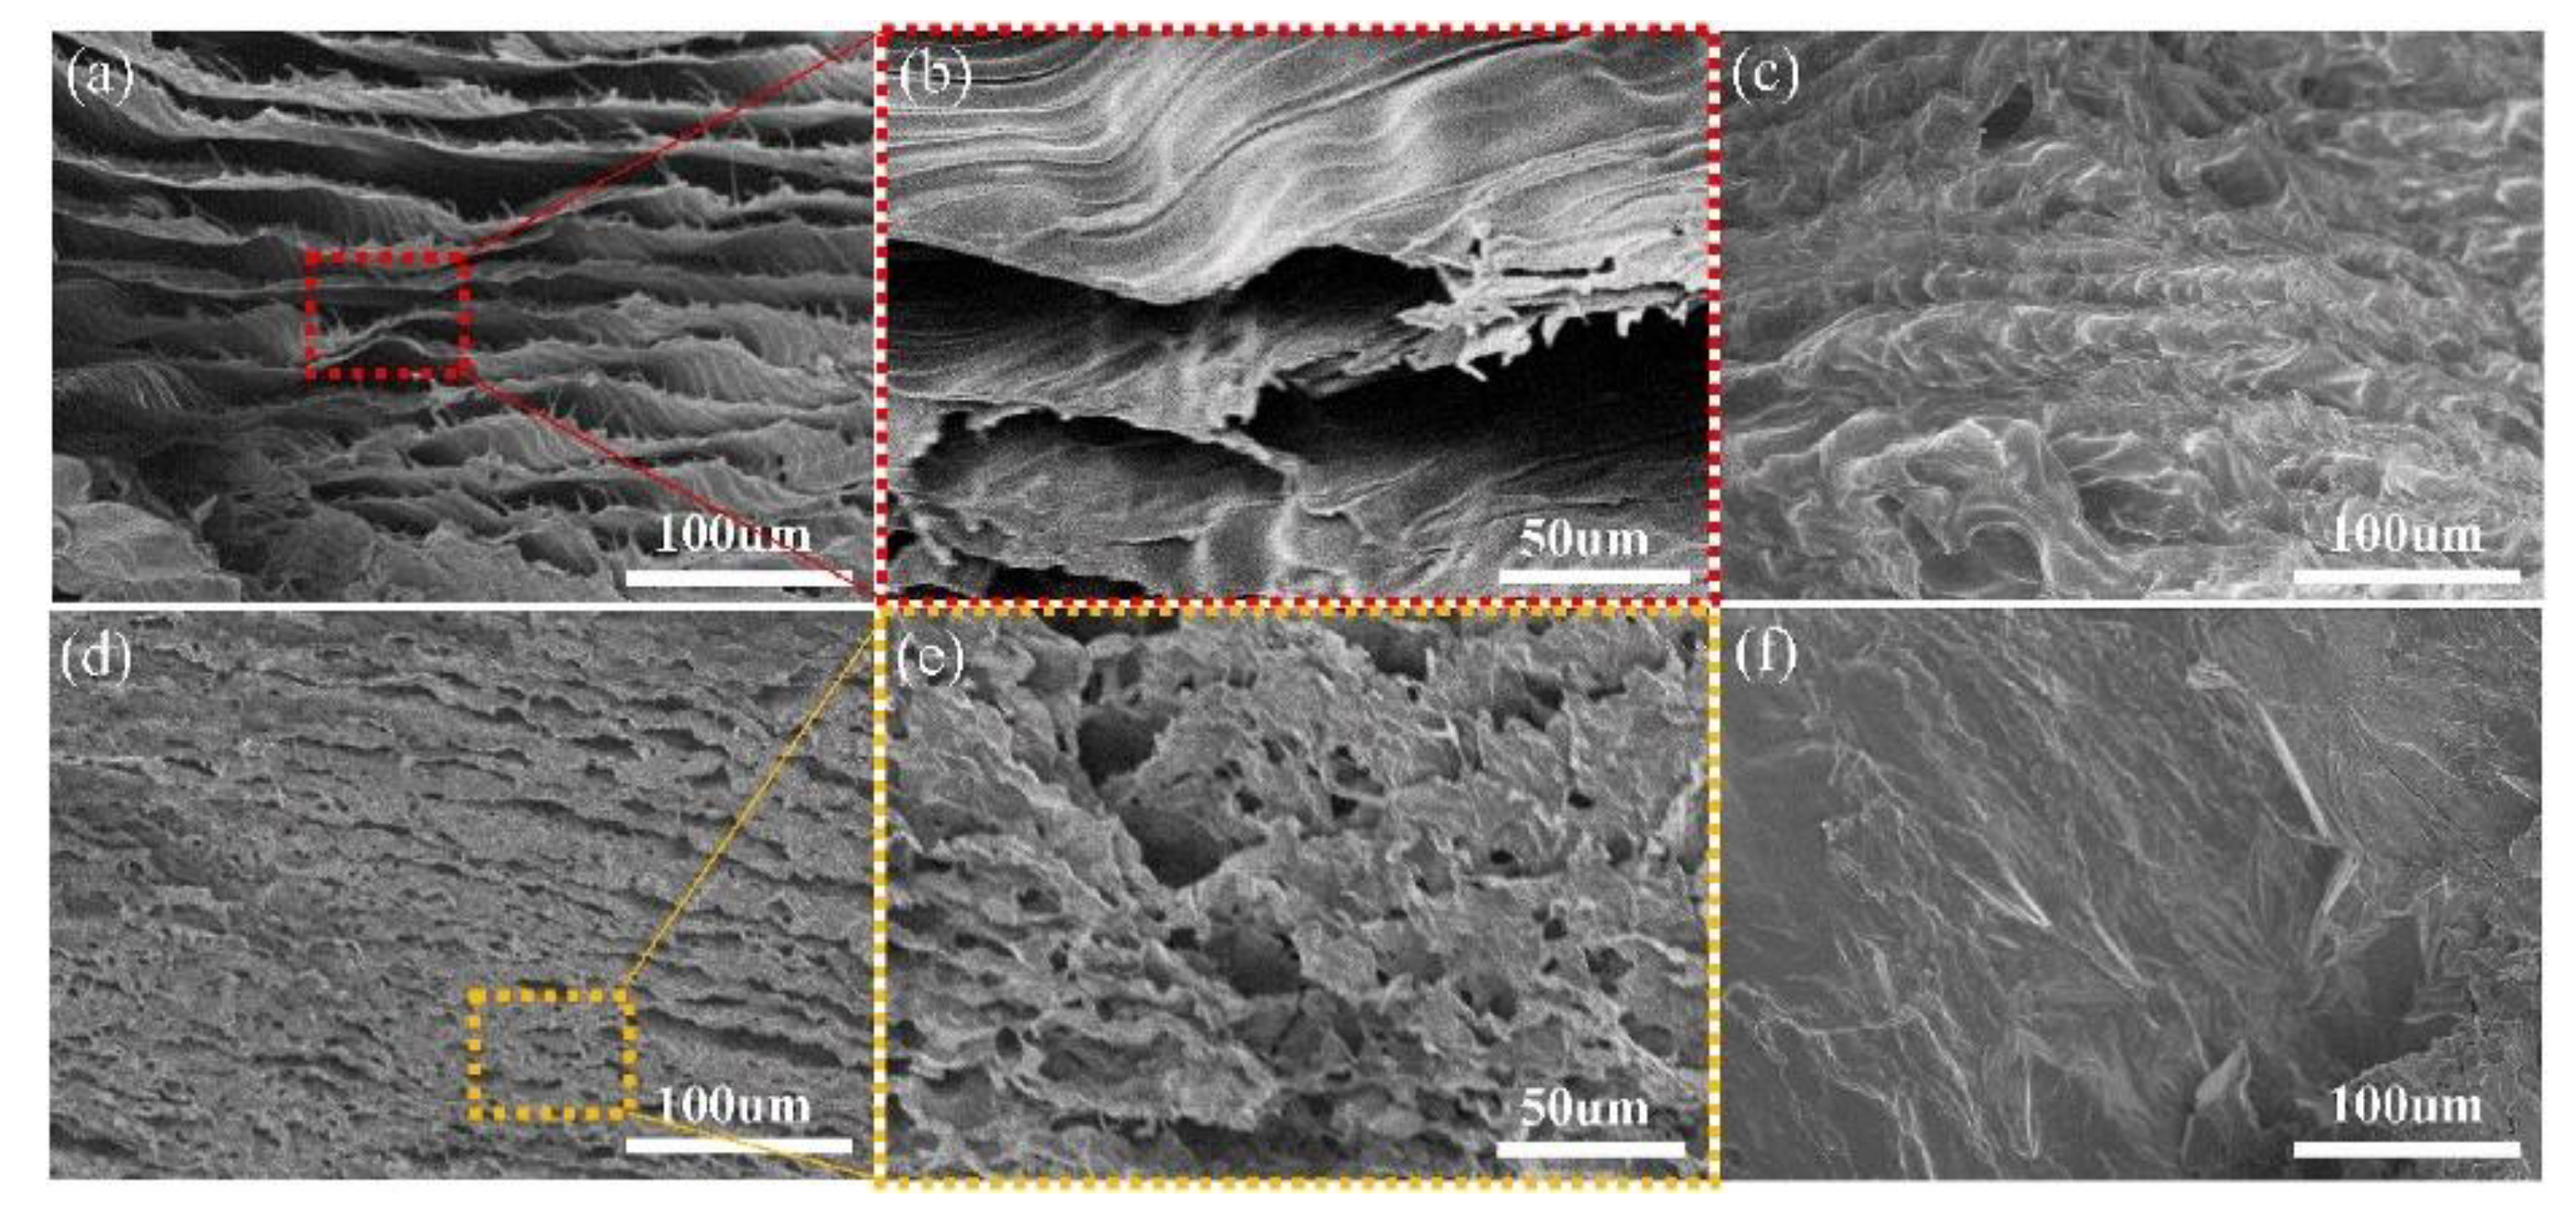
Huang et al. [74] developed an SS, composite low flammability PCM using α-ZrP (zirconium phosphate) as the flame retardant, following a synthesis process presented in Figure 7. Tris solution was used to thoroughly exfoliate the dispersed α-ZrP. After exfoliation, ultrasonication was employed to expose more catalytic spots for higher reactivity. The ZrP was dispersed uniformly in sodium lignosulfonate-zirconium phosphate (SL-ZrP) to synthesize the biochar precursors. The prepared ZrP-polymide (PI) hybrid aerogels were employed as porous encapsulation support materials prepared by freeze-drying/thermal imidization process. The PI aerogel ensured a temperature-resistant, tight, porous skeleton. A novel approach reported in [75] introduced SL-ZrP with the objective of strengthening the porous structure. PEG was encapsulated in the hybrid aerogel after vacuum impregnation to obtain, finally, the composite PCMs (ZrP-PI@PEG).
The SEM images presented in Figure 8 reveal the inner microstructures of aerogels and composite PCMs.
The PI aerogel and ZrP-PI-1 hybrid aerogel microstructures presented in Figure 8 are stacked lamellar structures. The ZrP-PI-1 hybrid aerogel structure is tighter than the PI aerogel. Another difference, which can be noticed from Figure 8b, is the fact that the inter-layer structure of PI appears to be continuous with no irregularities. The lamellae of the ZrP-PI-1 hybrid aerogel have irregularities and micropores observable on their surface. ZrP-PI-1@PEG has a smooth surface filled with PEG. In contrast, PI@PEG is insufficiently filled with PEG in the sheet layer. As a result, the surface appears rough with some large gaps.
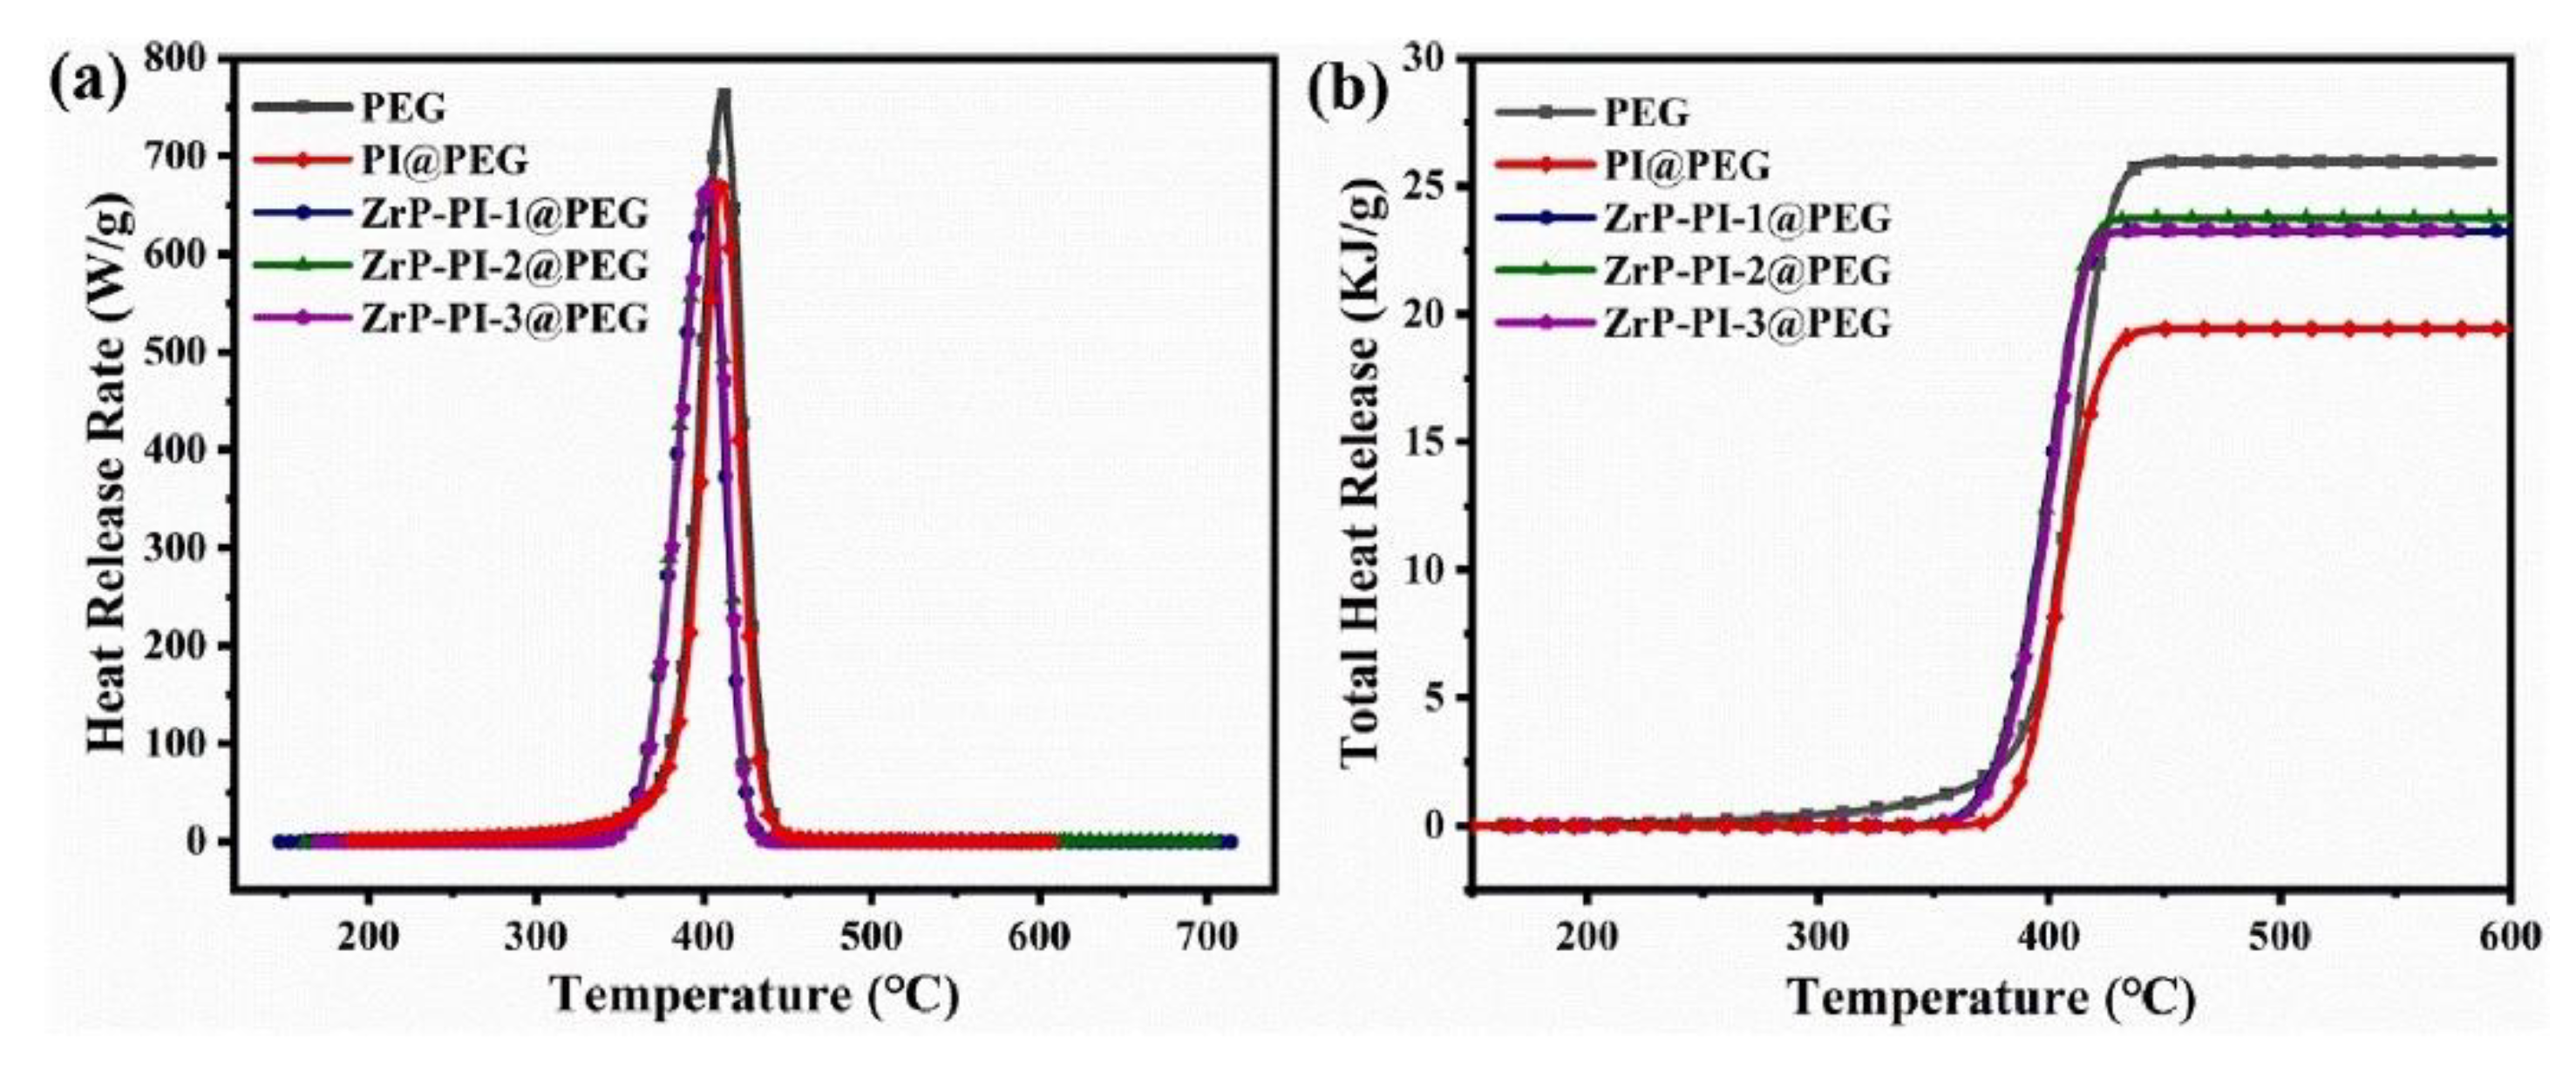
The flame retardancy was assessed by means of cone calorimetry (Figure 9).
A higher peak of the HRR curve can be observed in Figure 9a as well as a larger THR. Although the difference between temperature values at PHRR was not significant, the char residue of PEG was considerably lower than for the other samples. From these two observations, it can be concluded that PEG is flammable and releases a considerably higher amount of heat during the combustion compared to the other samples.
Zhou et al. [76] prepared shape-stabilized, flame-retardant PCMs using paraffin with the phase change temperature range 58–60 °C, and HDPE as a supporting material. The flame retardancy property was achieved through the integration of aluminum hydroxide and magnesium hydroxide as FRs. A total of seven recipes were prepared, as presented in Table 8.
The flammability properties of the samples prepared, as indicated in Table 8, were assessed through the cone calorimetry test, with the main results listed in Table 9.
The SEM examination suggested that the addition of Mg(OH)2 and Al(OH)3 produced an oxidic film on the surface of the SS PCM, and formed a physical barrier synergizing with the char layer generated from the EG expansion, preventing heat and mass transfer. The recipe SS-FR-PCM6 effectively suppressed the smoke, CO and CO2 generation, and reduced the PHRR by approximately 59%. In terms of char residue, PCM3 scored the best with 32.9%. PCM6 only reached 26.2%. However, following a detailed data analysis, SS-FR-PCM6 showed better thermal stability and flame retardancy properties compared with other PCMs. The heat storage properties (MP and LH) were assessed by means of DSC, demonstrating that the FR additives did not significantly alter the suitability of the SS PCM as a latent heat storage medium.
Xue et al. [75] manufactured a three-dimensional functional structure consisting of (i) melamine foam (MF), (ii) phosphorous cellulose (PC), and (iii) graphite nanoplatelets (GNP) to be used as a shape-stabilization matrix for an organic PCM. The novelty of the solution proposed consisted of the fact that it attempted to address three issues simultaneously: (i) the shape stabilization, (ii) the low value of the TC, and (iii) the flammability issues of the PCM. The PC was obtained through the reaction of the microcrystalline cellulose (MCC) and phosphorous acid in urea (molten), as described by Pan et al. [77]. Two sorts of MF/PC/GNP foams were prepared, denoted Px and PxGy (where x stands for PC concentration and y for the GNP concentration). For a baseline comparison, a PC-MX foam was prepared similarly, without GNP. The composite PCM was prepared by placing the hybrid foam on the surface of the molten PEG at 80 °C for 24 h in a vacuum oven to ensure the full impregnation of the foam in the PEG. After impregnation, the foam saturated with the PEG was cooled down naturally. It was reported that the PHRR value decreased from approximately 725 kW/m2 to 624 kW/m2. The TC value reached 1.08 W/(m⋅K), corresponding to a GNP content of 2.4 wt%.
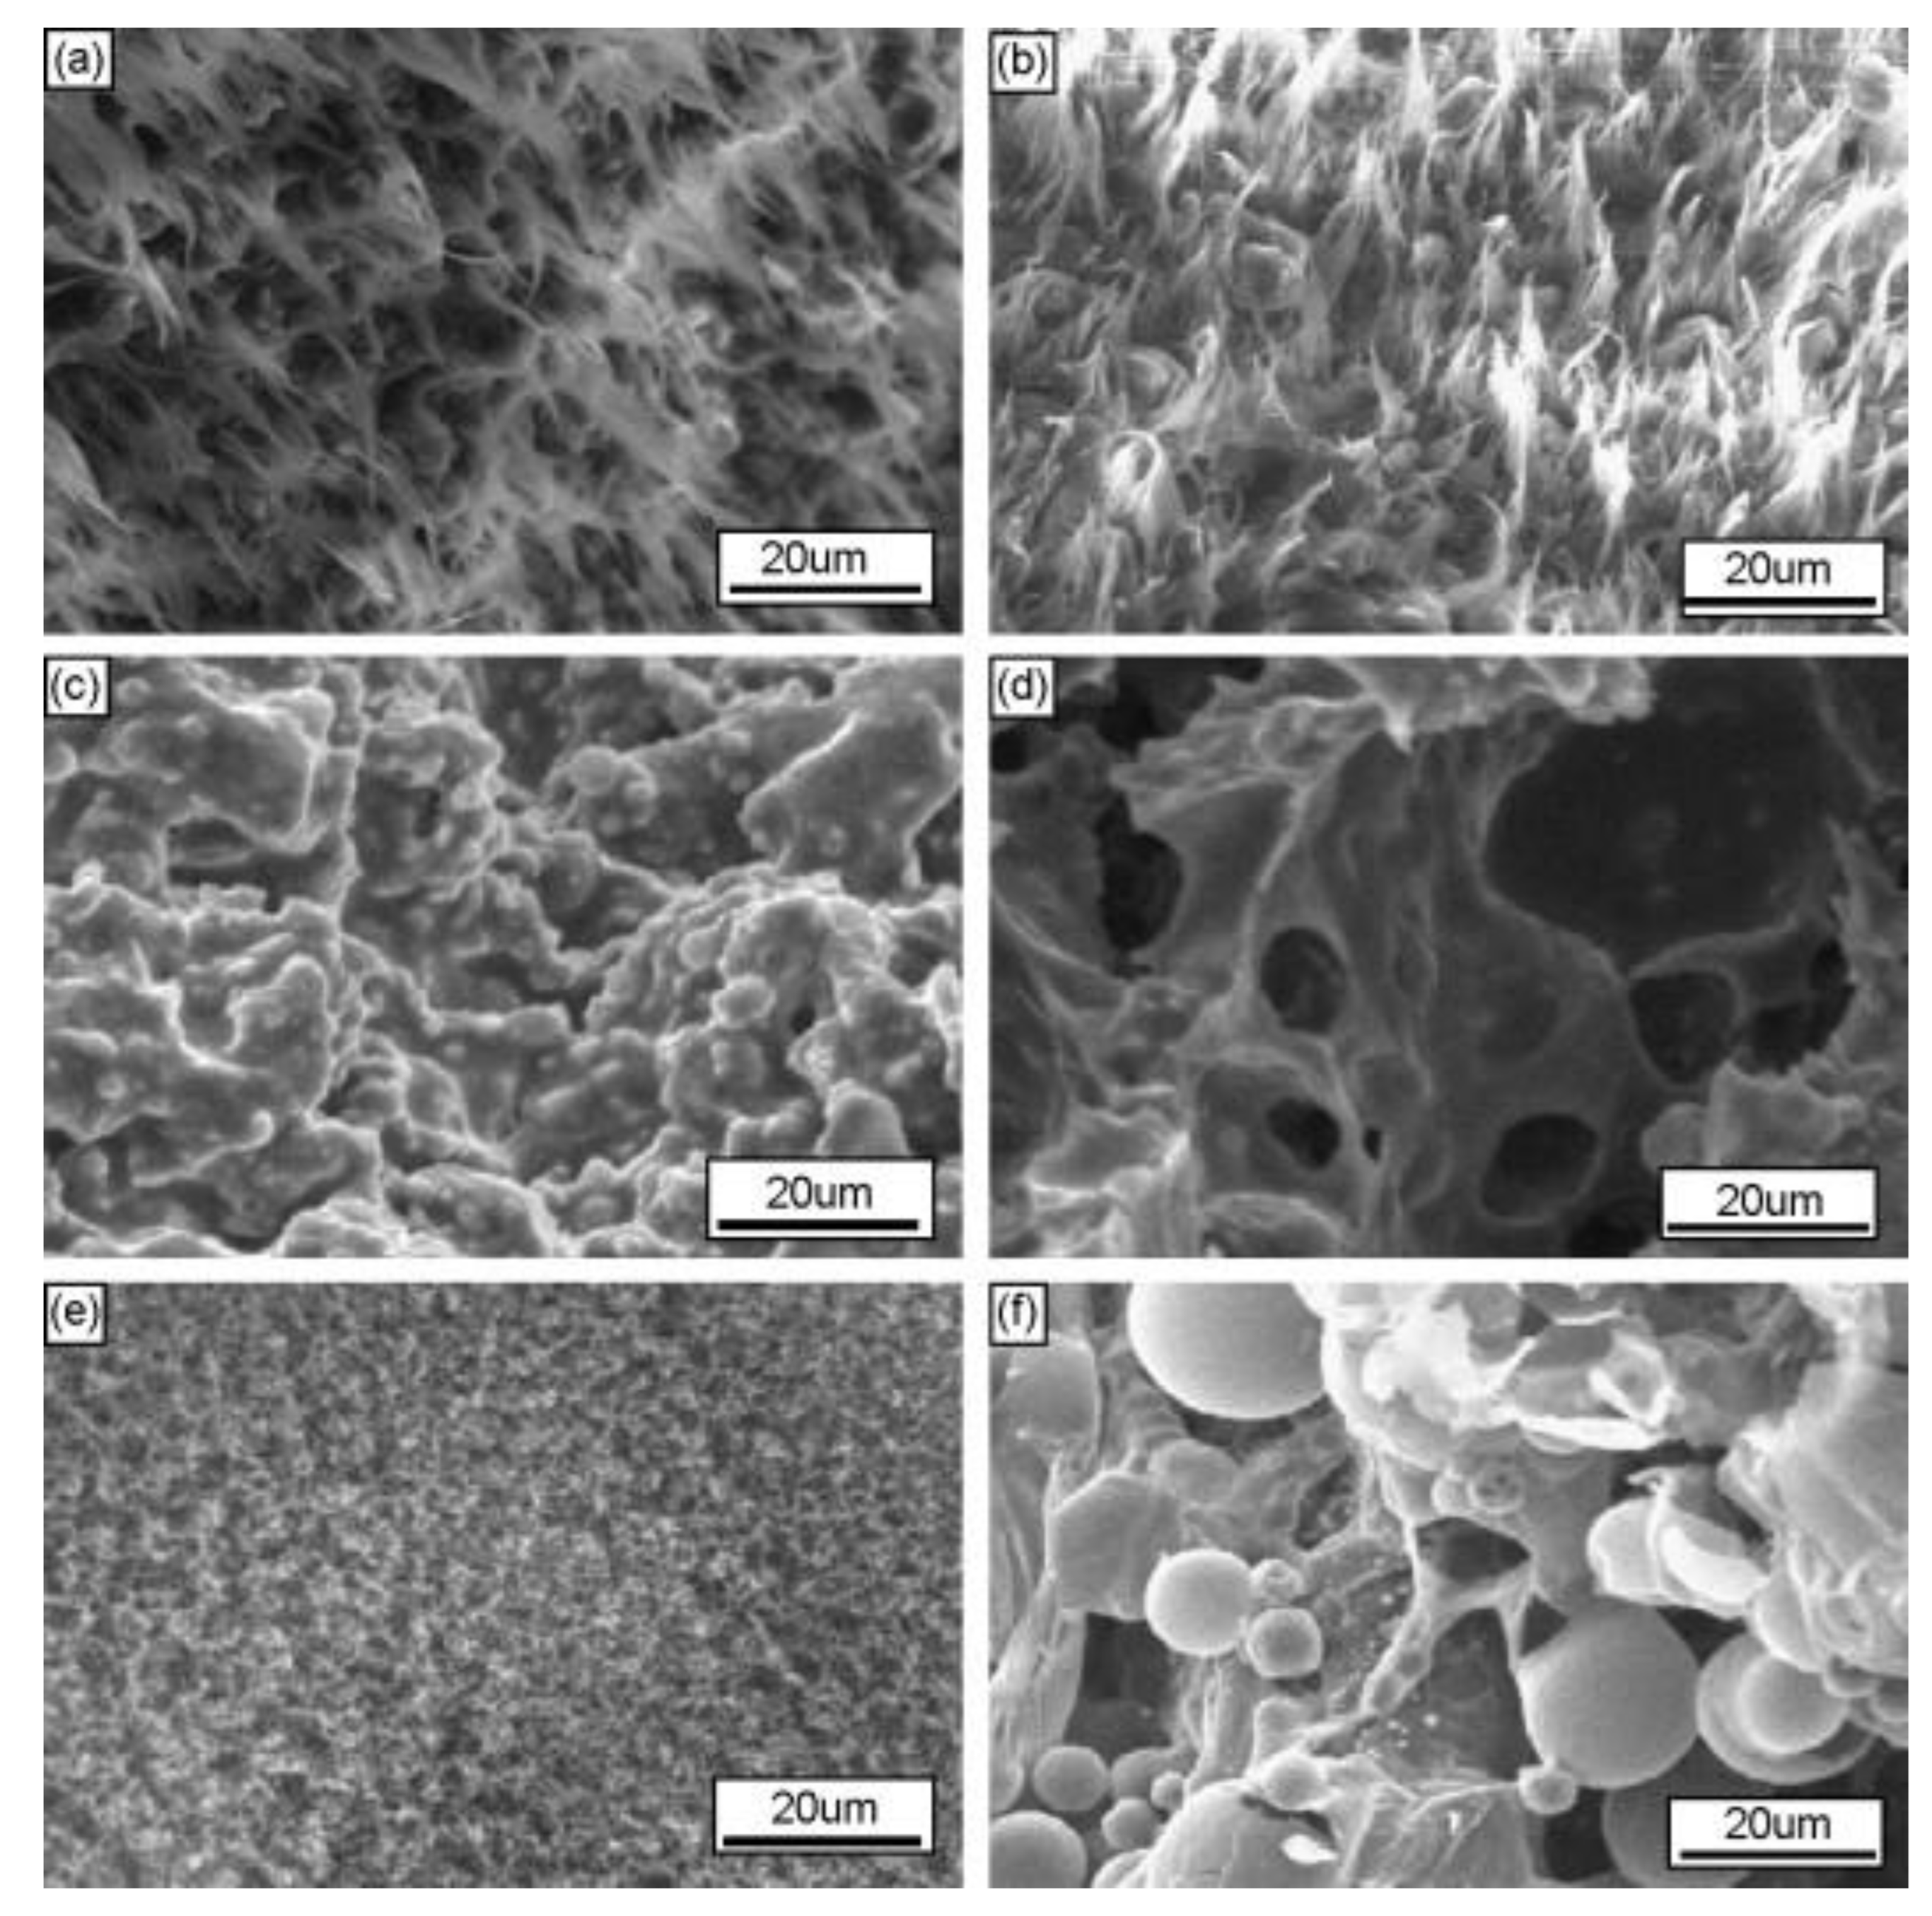
Zhang et al. [78] prepared a composite paraffin/HDPE/IFR/iron shape-stabilized PCM. Paraffin with the LH value 142.61 kJ/kg was used as the PCM and 5 samples were prepared varying the iron fraction and maintaining the same paraffin/HDPE/IFR ratio, 3:1:1. The iron fractions for the 5 samples denoted by FSPCM1 were 0, 1, 3, 5, and 10, respectively. It was reported that the LH of the composites was significantly lower than that of the pure paraffin: 79.91, 76.57, 71.15, 70.31, and 68.73, respectively. The images of the samples obtained by SEM are presented in Figure 10.
Analyzing the microstructure images presented in Figure 10, it can be noticed that paraffin was dispersed uniformly into the HDPE matrix, which provides mechanical strength to the composite PCM.
The SS composite PCM flammability properties were assessed by means of cone calorimetry. The HRR curves are presented in Figure 11.
Based on the cone calorimetry test results, a possible mechanism explaining the synergetic effect of iron with the paraffin/HDPE/IFR system was proposed. The char formation mechanisms occurring during the combustion of the composite paraffin/HDPE/IFR/iron are presented in Figure 12.
The other experimental studies on FR integration in PCMs with shape stabilization are summarized in Table 10.

3.3. Flame Retardants in Microencapsulated PCMs

The main objective achieved through PCM encapsulation is the containment of the molten phase. The size of the capsules varies from 10−9 to 100 m and the structure of the capsules is size independent. A capsule consists of a shell, which acts as a protective layer, and the core, containing the actual PCM. Nanoencapsulation/microencapsulation has the advantage of achieving a large area-to-volume ratio, thereby considerably enhancing the heat transfer. A comprehensive review addressing encapsulation methods, materials, thermo-physical and mechanical properties was reported by Huang et al. [89]. The usual organic shell materials are urea-formaldehyde (UF) resin, melamine-formaldehyde (MF) resin, polyurea (PU), poly(urea-urethane) (PUU), and acrylic resin [78]. All these compounds are flammable to variable extents.
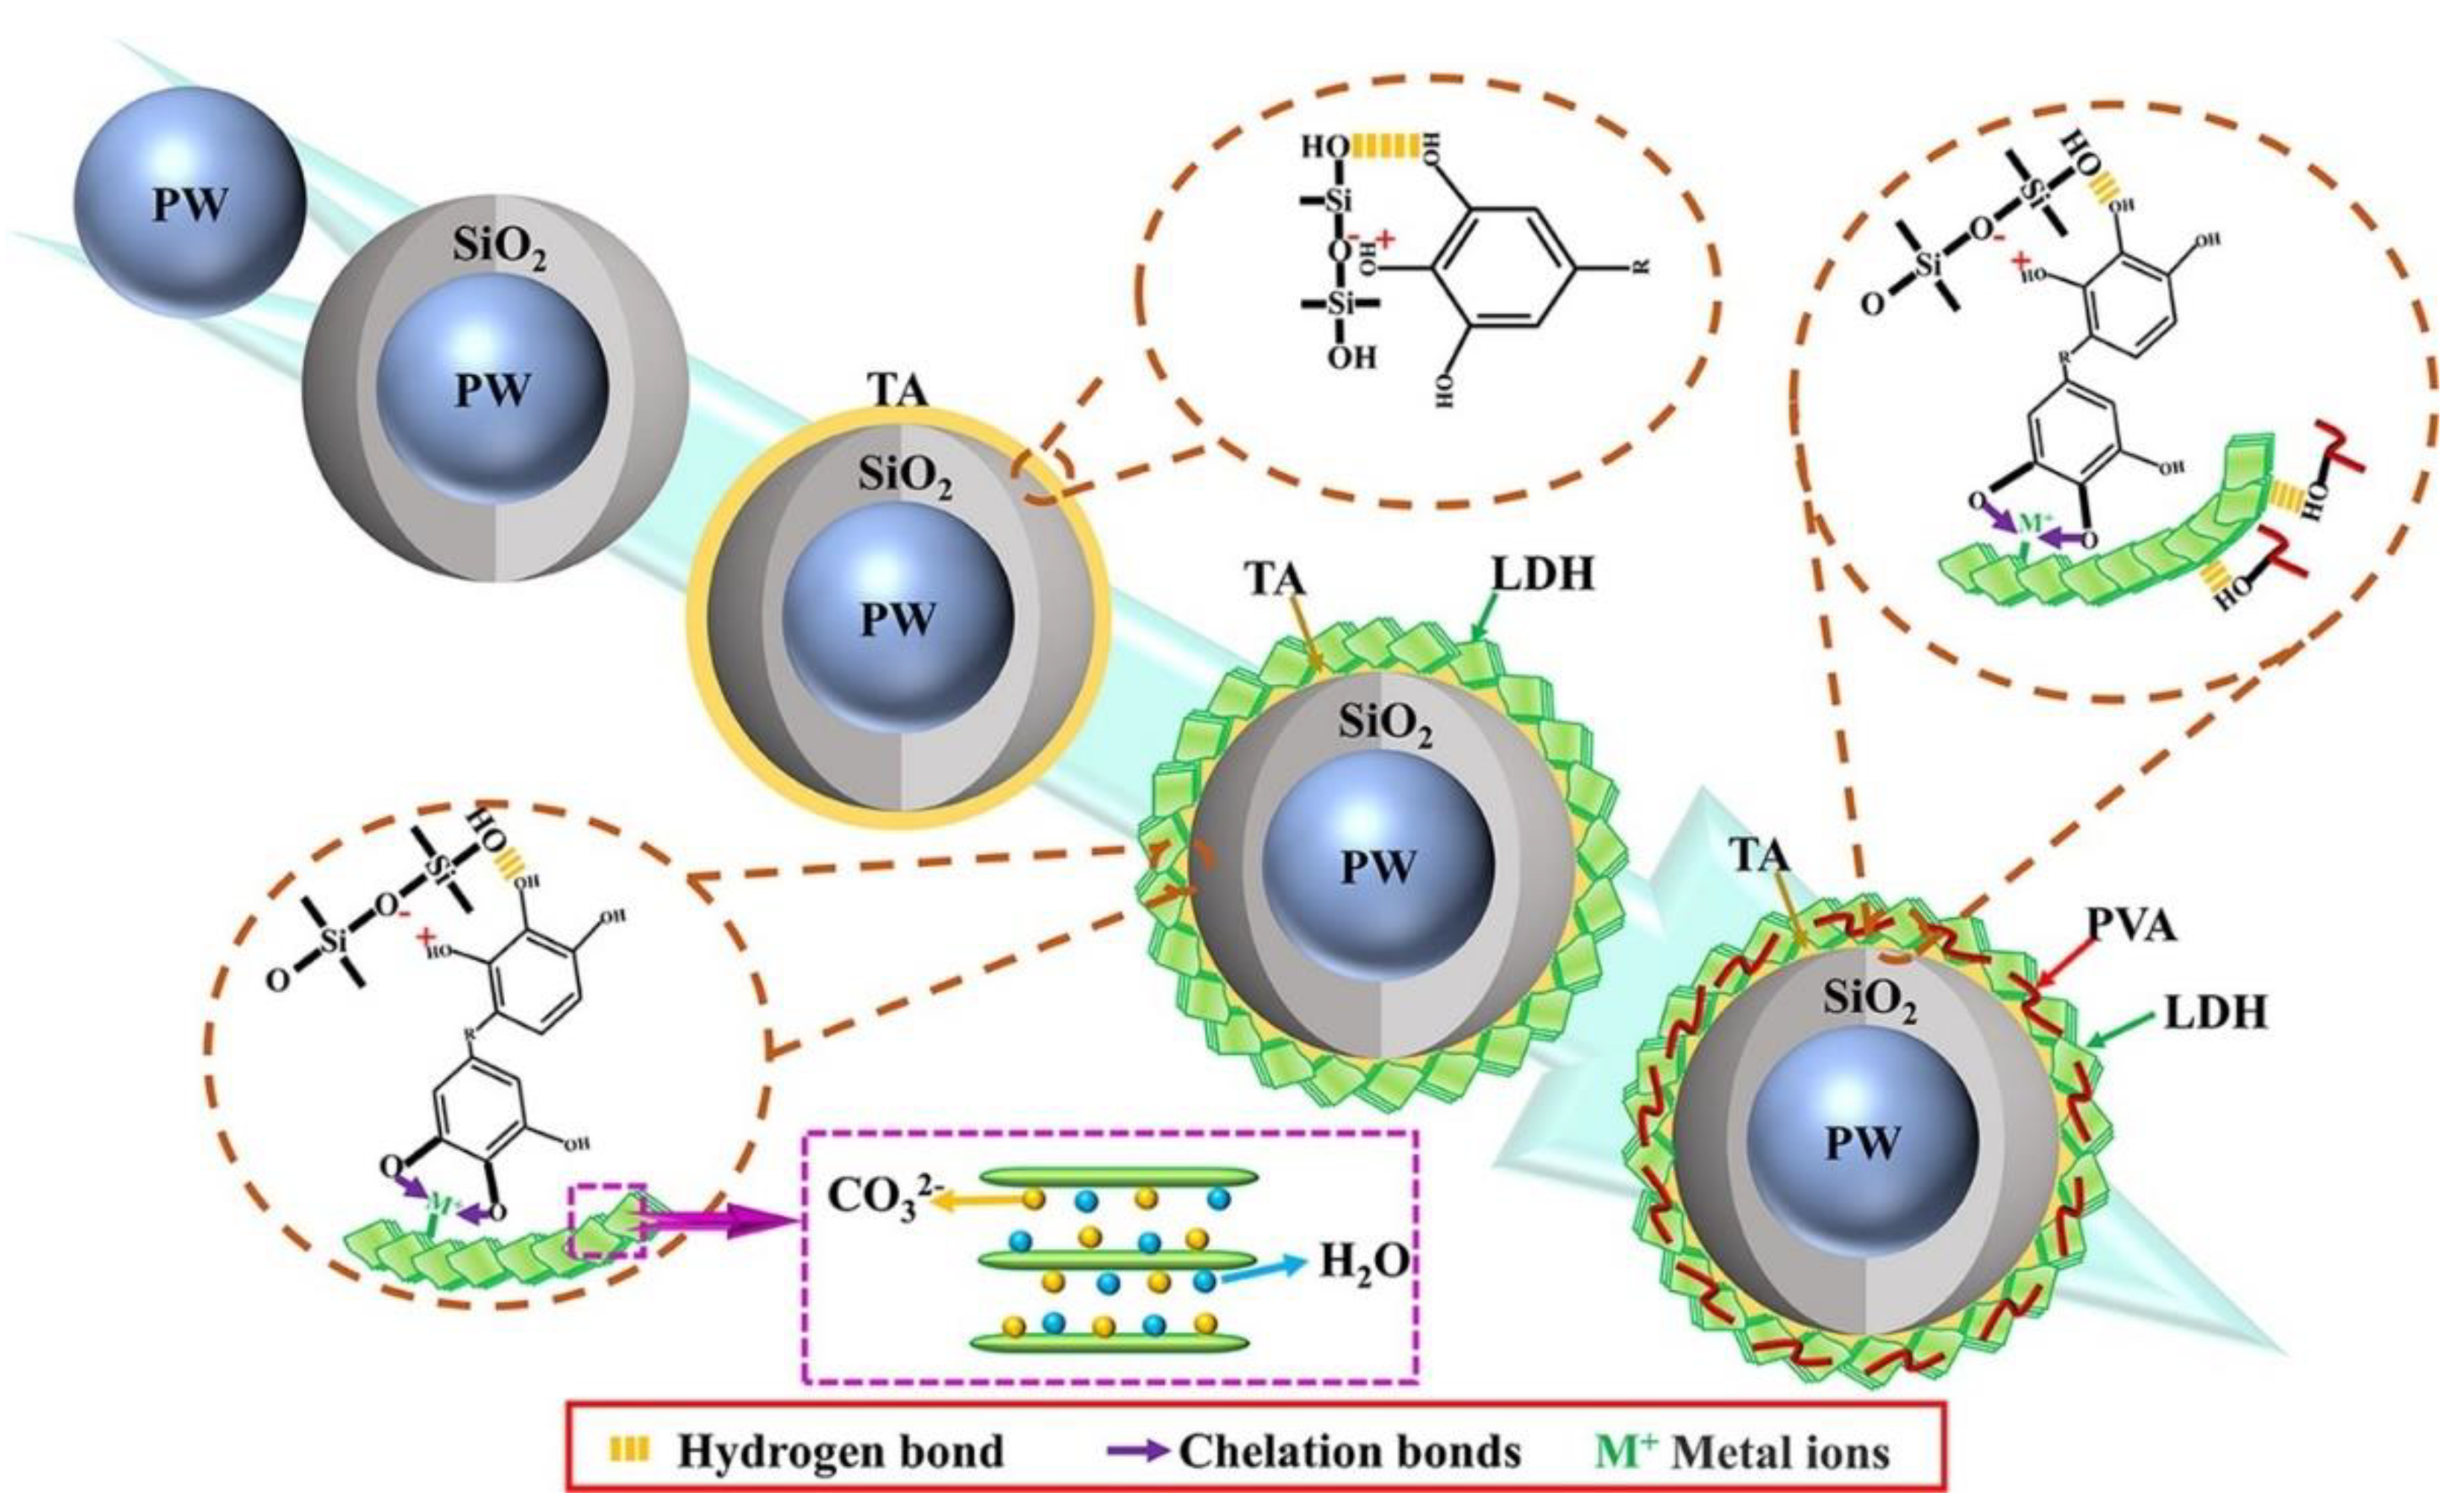
Zhang et al. [90] developed microcapsules with a multi-layer shell (SiO2) and paraffin core wax. The silica multi-layer shell (M-EPCM) capsule structure is presented in Figure 13. The following materials were used in this study: poly vinyl alcohol (PVA-1788), Na2SiO3 9H2O, cetyltrimethylammonium ammonium bromide (CTAB), PW, Ni(NO3)2 9H2O, Zn(NO3)2 9H2O, Al(NO3)2 9H2O, tannic acid (TA), vinyl PDMS, (V-PDMS), hydrogen-terminated PDMS (H-PDMS), dihydroxy-terminated PDMS (OH-PDMS), and platinum catalyst (1000 ppm). A total of five recipes, as detailed in Table 11, were prepared.
Due to the fact that it was not possible to perform flammability tests on powders, the microcapsules were integrated into a silicone rubber foam (SRF), for which the microstructure, chemical composition, thermal stability, leakproof characteristics, thermal conductivity, and phase change properties were determined.
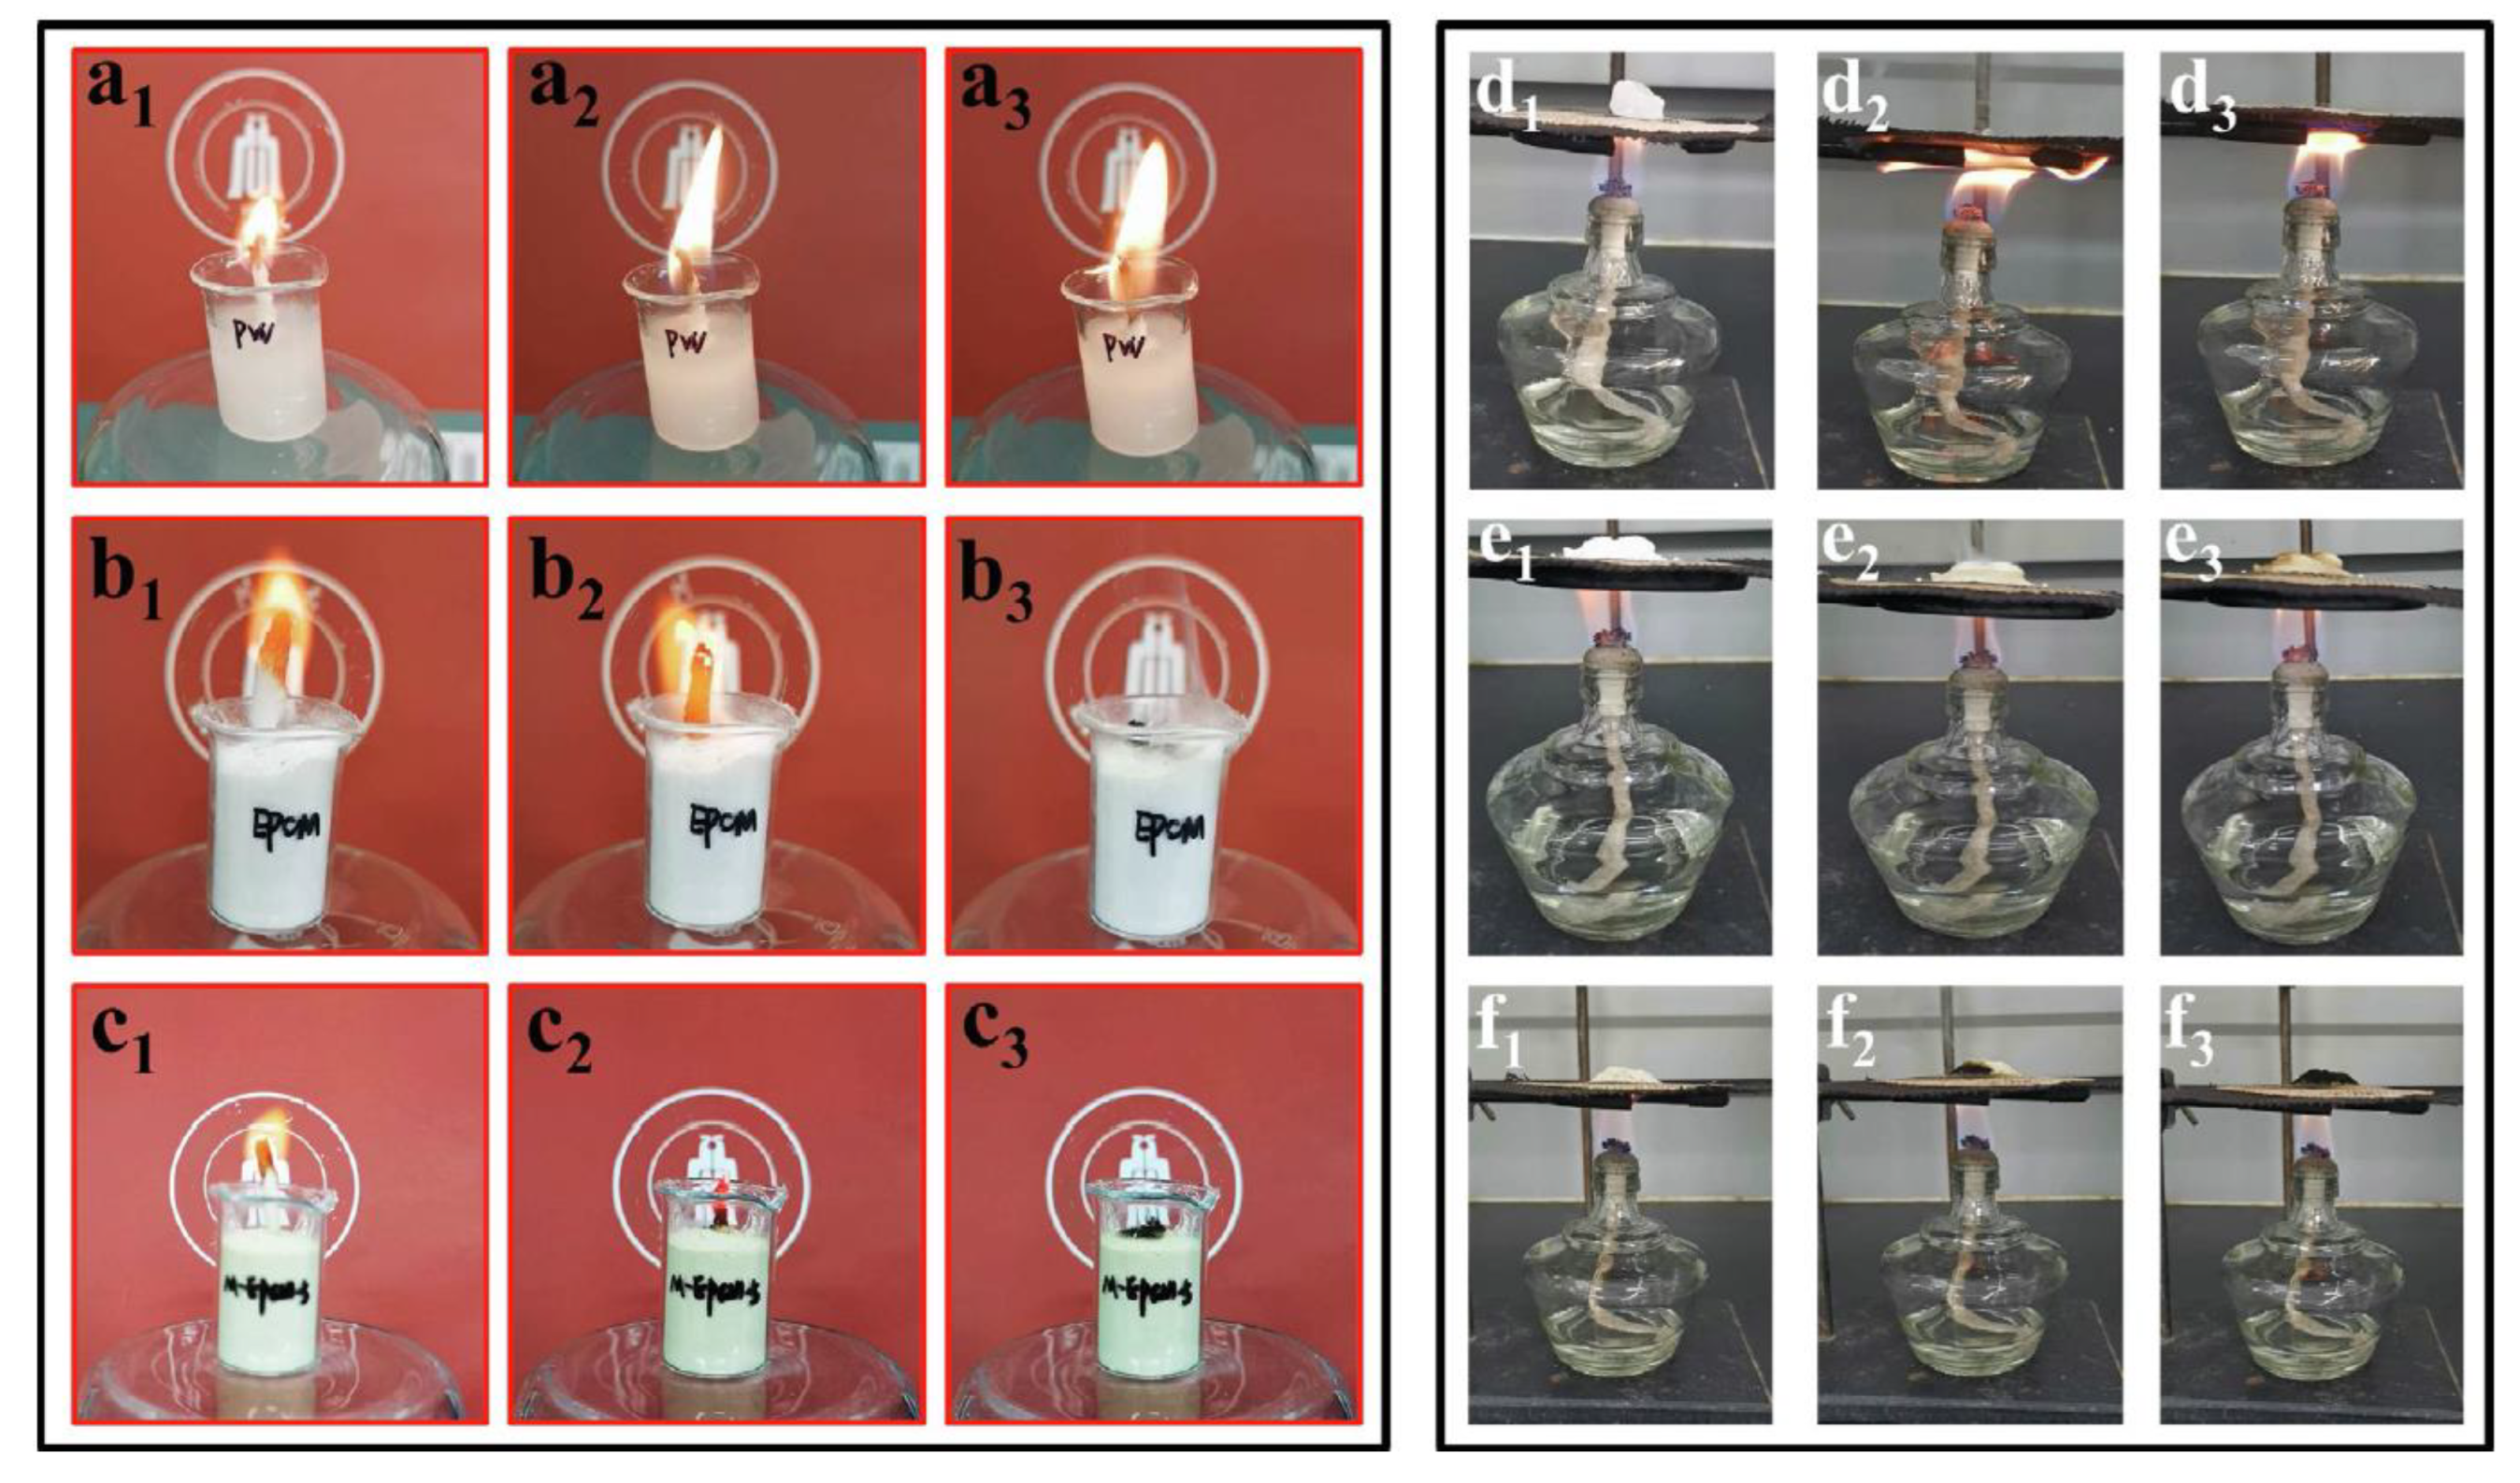
The TC of the sample M-EPCM-5 was determined to be 1.109 W/m·K. This value corresponded to an increase of 93.5% compared to that of EPCM, which was 0.573 W/m·K. This was mainly attributed to the high TC value of the SiO2-TA-LDH-PVA multilayer shell, especially the layered double hydroxides (LDH) layer, which endows MEPCM-5 with a rapid thermal response capacity. The flammability was assessed by the self-extinguishing test, with the results presented in Figure 14.
It can be noticed from Figure 14 that the pure PW (a1–a3) underwent continuous burning after ignition, and it did not self-extinguish until complete combustion; it follows that the PW does not have any flame retardancy properties. In the case of EPCM (b1–b3), the flame was put out in a few seconds from the moment the flame was removed. The flame underwent self-extinguishment even faster in the case of M-EPCM-5 (c1–c3), with this sample demonstrating a significant flame retardancy performance. In the case of the high-temperature heating test, the pure PW underwent rapid melting and the molten phase infiltrated the asbestos net (d1–d3), after which the alcohol lamp caused ignition. In the case of the EPCM sample, no fire was observed (f1–f3).
Photos of the samples during the UL-94 test are presented in Figure 15.
The UL-94 test revealed the following: the SRF/E sample underwent violent combustion right after ignition. This was explained by the fact that the PW core generated vapor at high temperature, which exerted mechanical pressure on the silica shell, eventually damaging it. The samples SRF/M1 and SRF/M2 also underwent rapid burning, which suggests that integrating a smaller amount of LDH into the multi-layer shell structure does not improve the flame retardant’s performance. When the LDH was increased, the flame-retardant effect in the SRF matrix improved significantly. Thus, the samples SRF/M3, SRF/M4, and SRF/M4 were rated V-1. The samples SRF/M3 and SRF/M4 could self-extinguish within 30 s, and the burning time of SRF/M5 was less than 18 s. They could not be ignited during the second ignition, reaching a V-1 rating, indicating that the M-EPCM-5 sample has a good flame retardancy.
Kang et al. [91] developed a process to insert FR halloysite nanotubes (c-HNTs) into a microencapsulated PCM (CA). c-HNTs were doped by 9,10-dihydro-9-oxa-10-phosphaphenanthrene-10-oxide (DOPO) and Cu nanoparticles in order to achieve a double objective: (i) enhance the TC, and (ii) reduce the flammability.
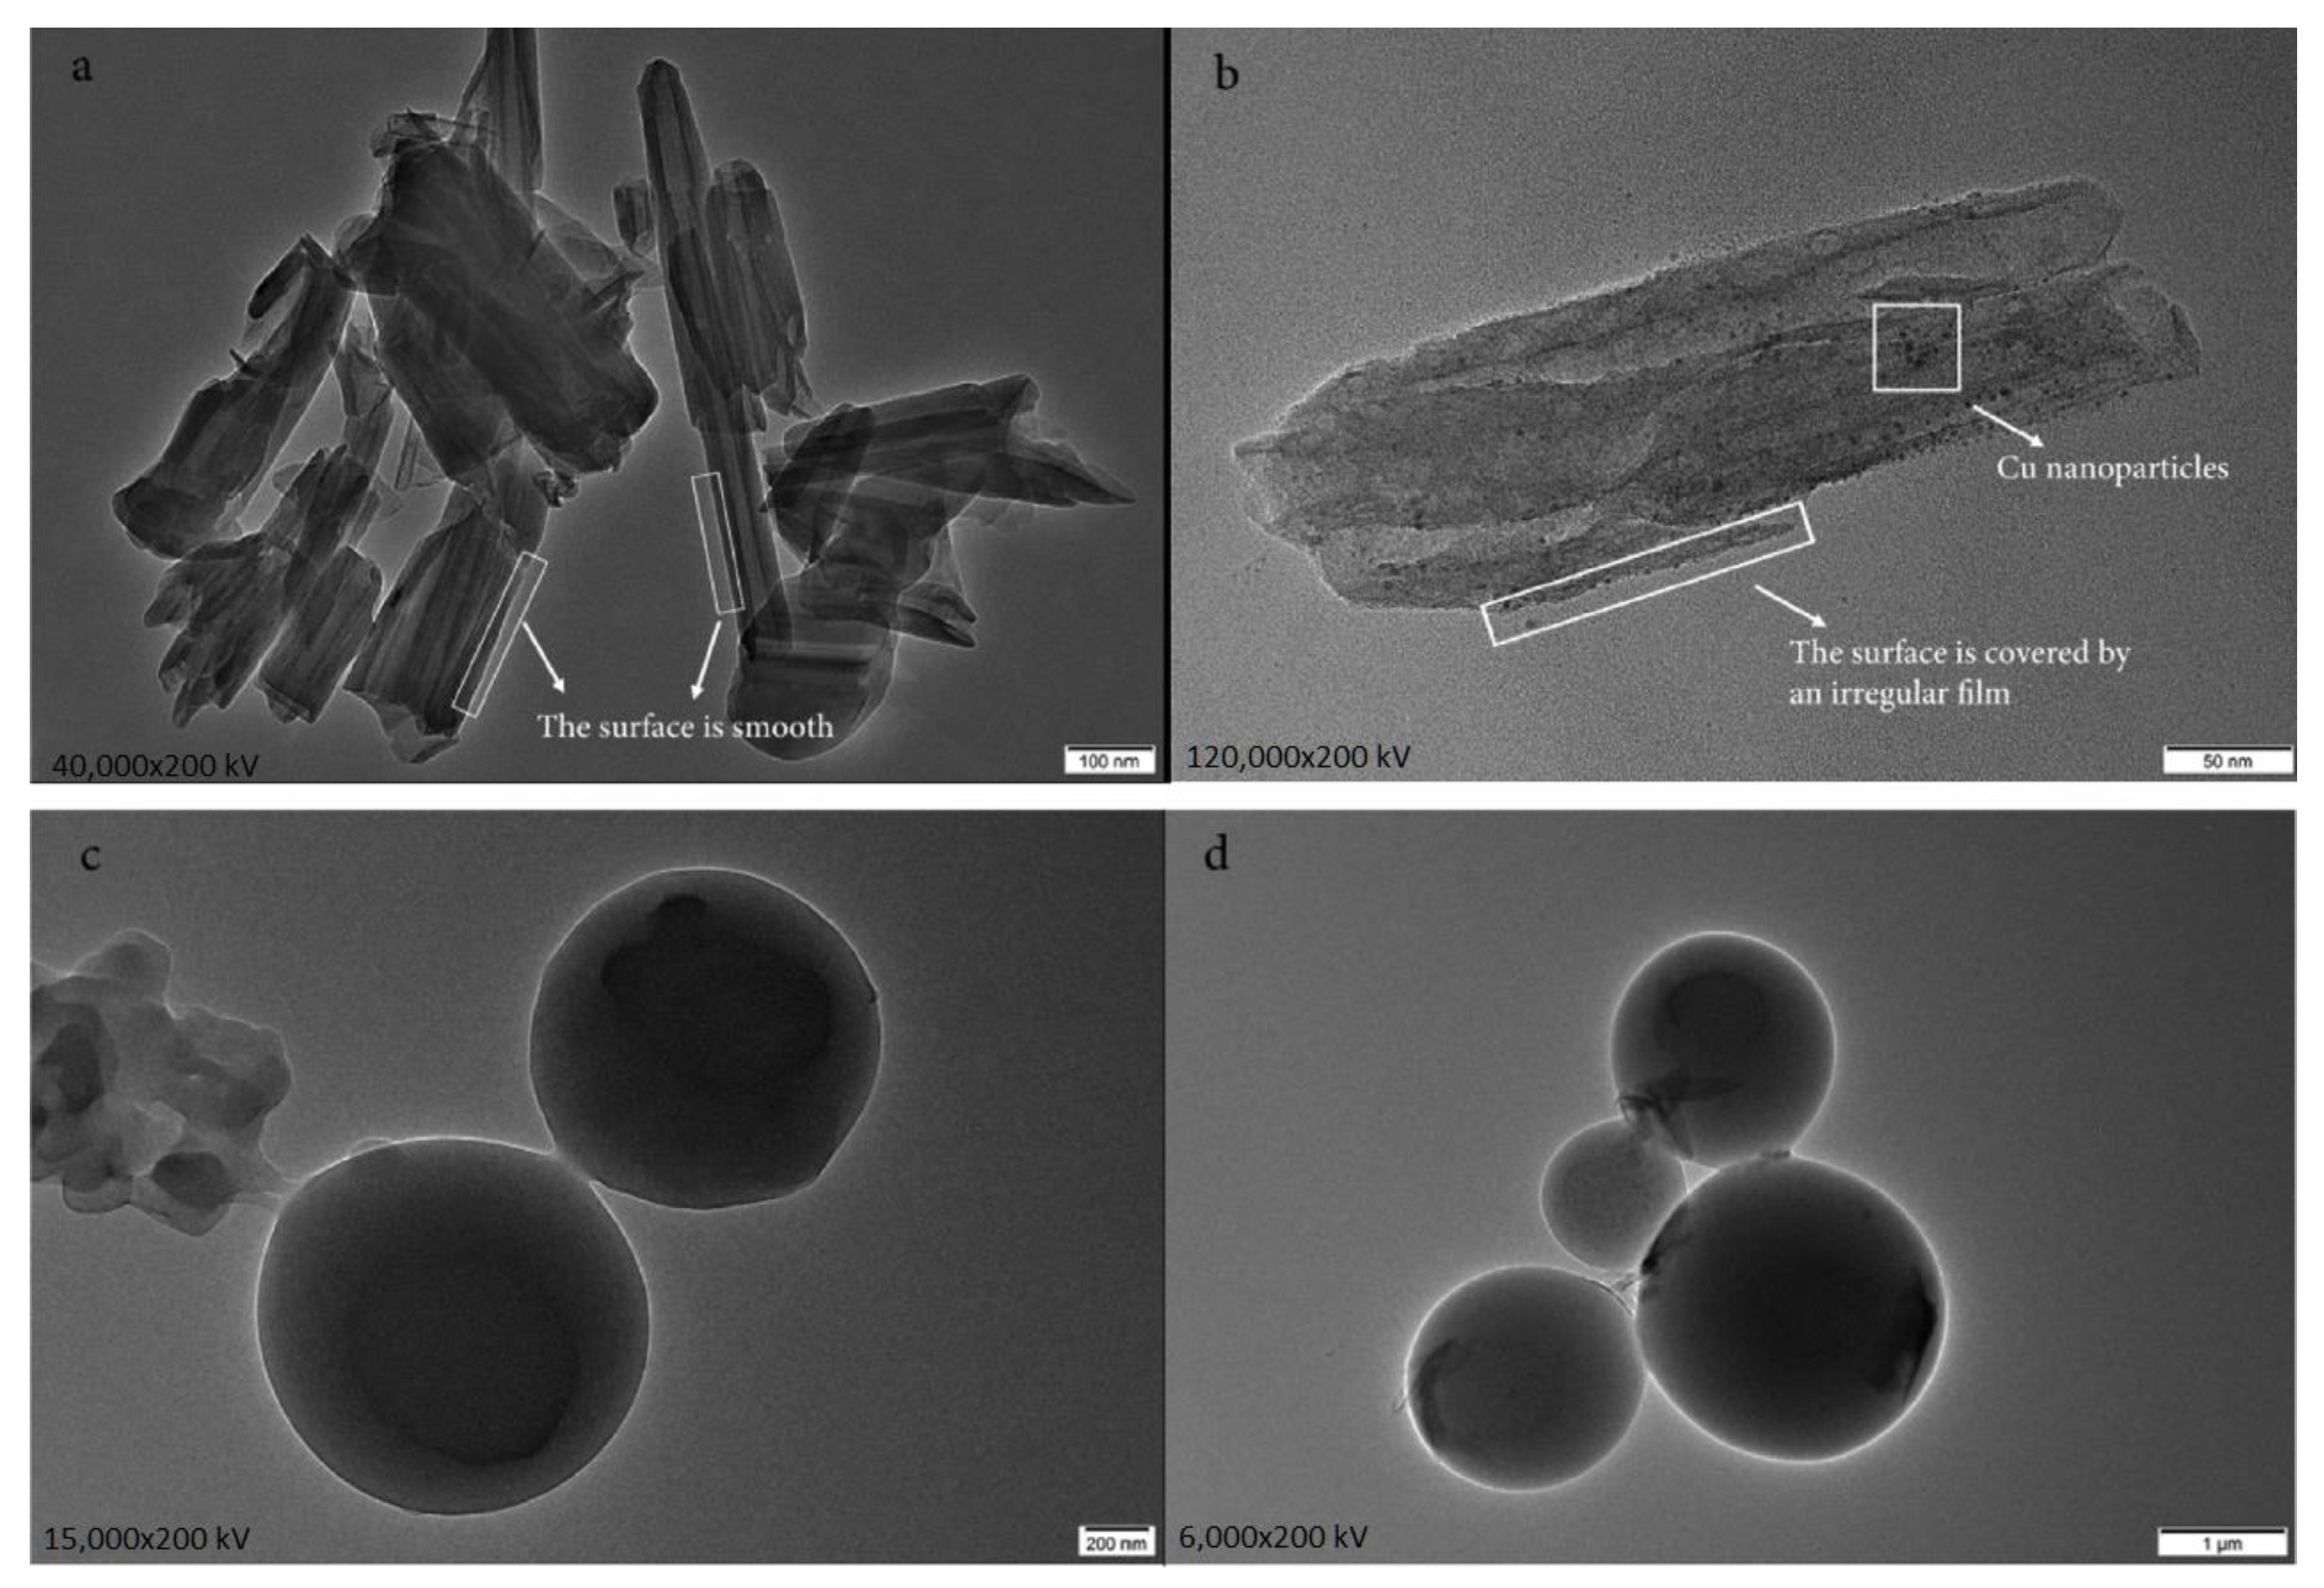
The microcapsules were prepared in a two-stage process, as follows: I. FR-modified HNTs with DOPO and Cu particles were synthesized. II. An in-situ polymerization method was employed to insert the double-modified HNTs into the CA/PMMA microencapsulated PCM, achieving, thus, a shell-channel-core structure. The flame retardancy properties are attributed to DOPO and HNTs. Cu particles played a synergistic role in flame retardancy and in reducing the amount of smoke. The morphological characterization of the HNTs and microencapsulated PCMs microstructure was carried out through TEM. TEM images of the HNTs and microencapsulated PCMs are presented in Figure 16. The HNTs and c-HNTs show the same tubular structure, as can be observed in Figure 16a,b.
The morphology of the CA capsule can be visualized in Figure 16c. The microencapsulated PCM has a well-defined core-shell structure with a clear-cut boundary and a regular shape. In contrast, the c-HNT modified microcapsules are presented in Figure 16d, where tubular nanotubes penetrating the microcapsule shell are visible.
The PCM microcapsules were integrated into EP to obtain test specimens compatible with the cone calorimetry test. The cone calorimetry test results are presented in Table 12.
It can be noticed from Table 12 that the PHRR value for EP/MPCM dropped significantly (~37.7%). At the same time, the THR and TSP values reduced from 117 MJ/m2 and 30.7 m2 to 91 MJ/m2 and 24 m2, respectively.
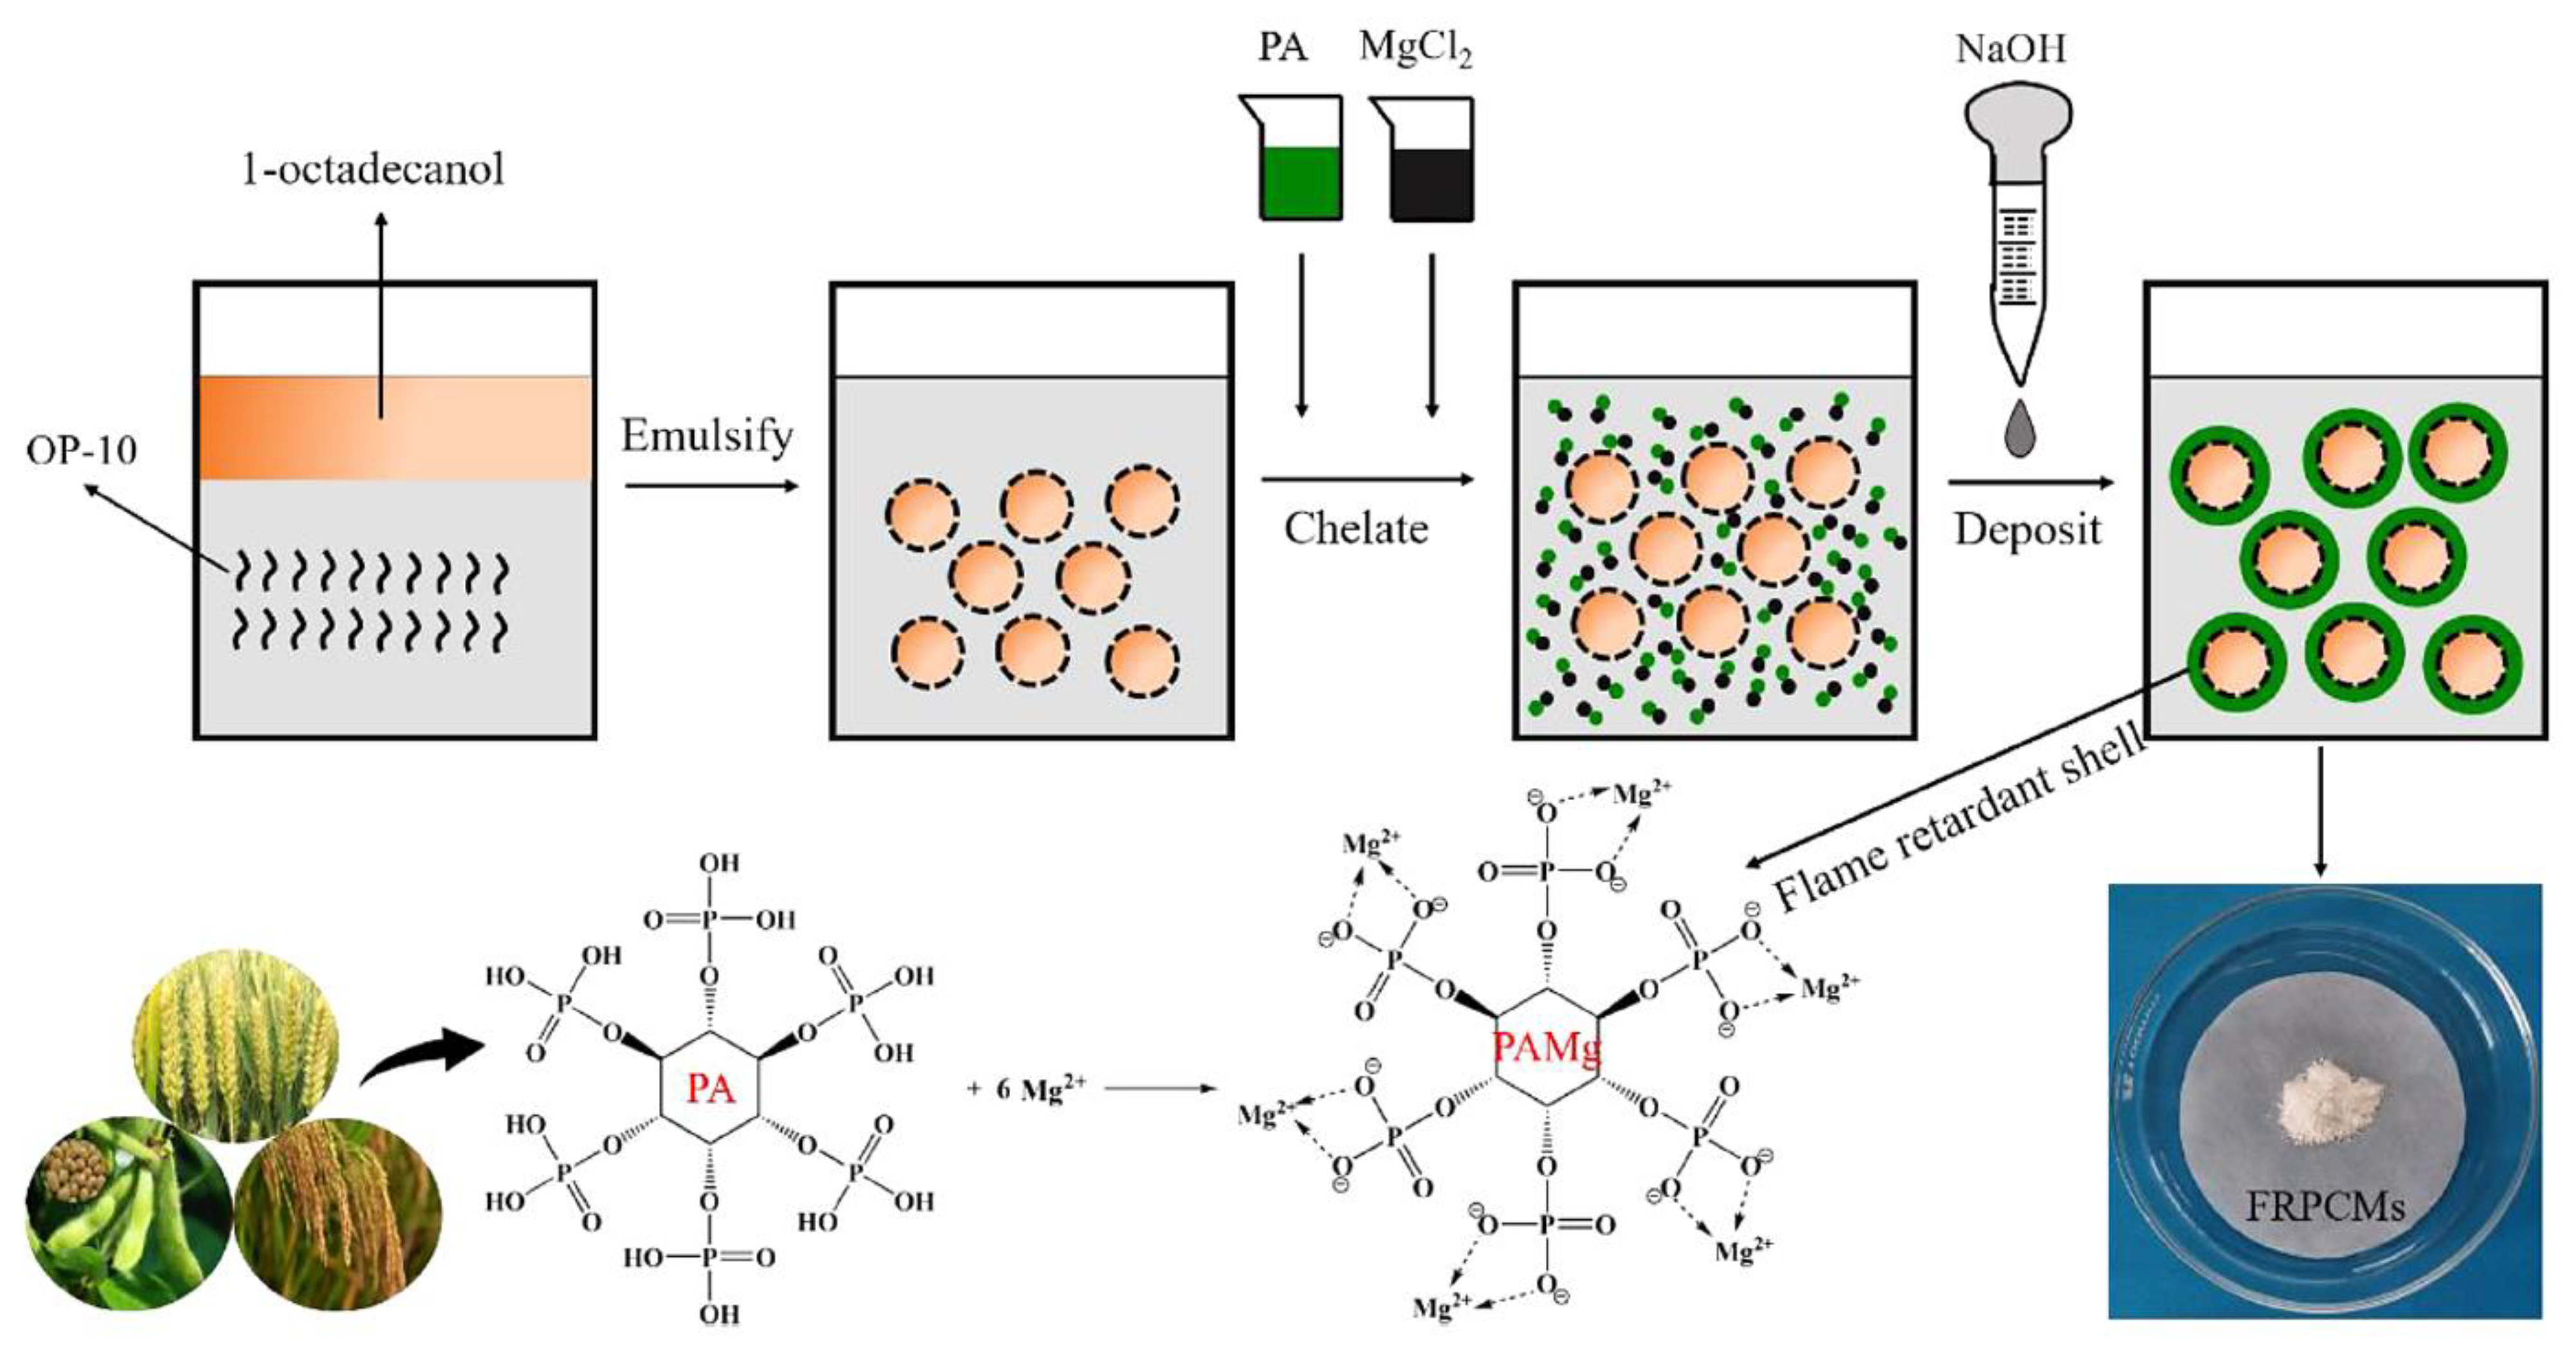
Liao et al. [92] designed a chelation–deposition method to develop an FR PCMs using 1-Octadecane as the PCM and a bio-based magnesium phytate (PAM) as the flame-retardant shell. The list of materials included an aqueous solution (50% wt) of phytic acid (PA), magnesium chloride (MgCl2), 1-Octadecane, surfactant Tween 80, sodium hydroxide (NaOH), and deionized water. The preparation method is presented schematically in Figure 17.
Three different recipes were used to prepare shape-stabilized PCMs, as detailed in Table 13.
The leakage characteristics of the samples were assessed by placing them on a heated plate and heating them up from room temperature to 90 °C. The images of the samples before and after heating are presented in Figure 18. Pure 1-Octadecanol underwent complete melting during the heating process, having no ability to preserve its original shape. No samples displayed any obvious flow or leakage abnormality, except FRPCM-1, which displayed some noticeable leakage during the heating process. Since FRPCM-1 has the lowest PA, this suggested that the lower fraction of magnesium phytate (PAMg) was not enough to retain the internal PCM. The samples FRPCM-2 and FRPCM-3, with a larger amount of the PAMg shell, remained unchanged throughout the whole heating process and no sign of leakage was observed. The leakage proof property was attributed to the PAMg shell.
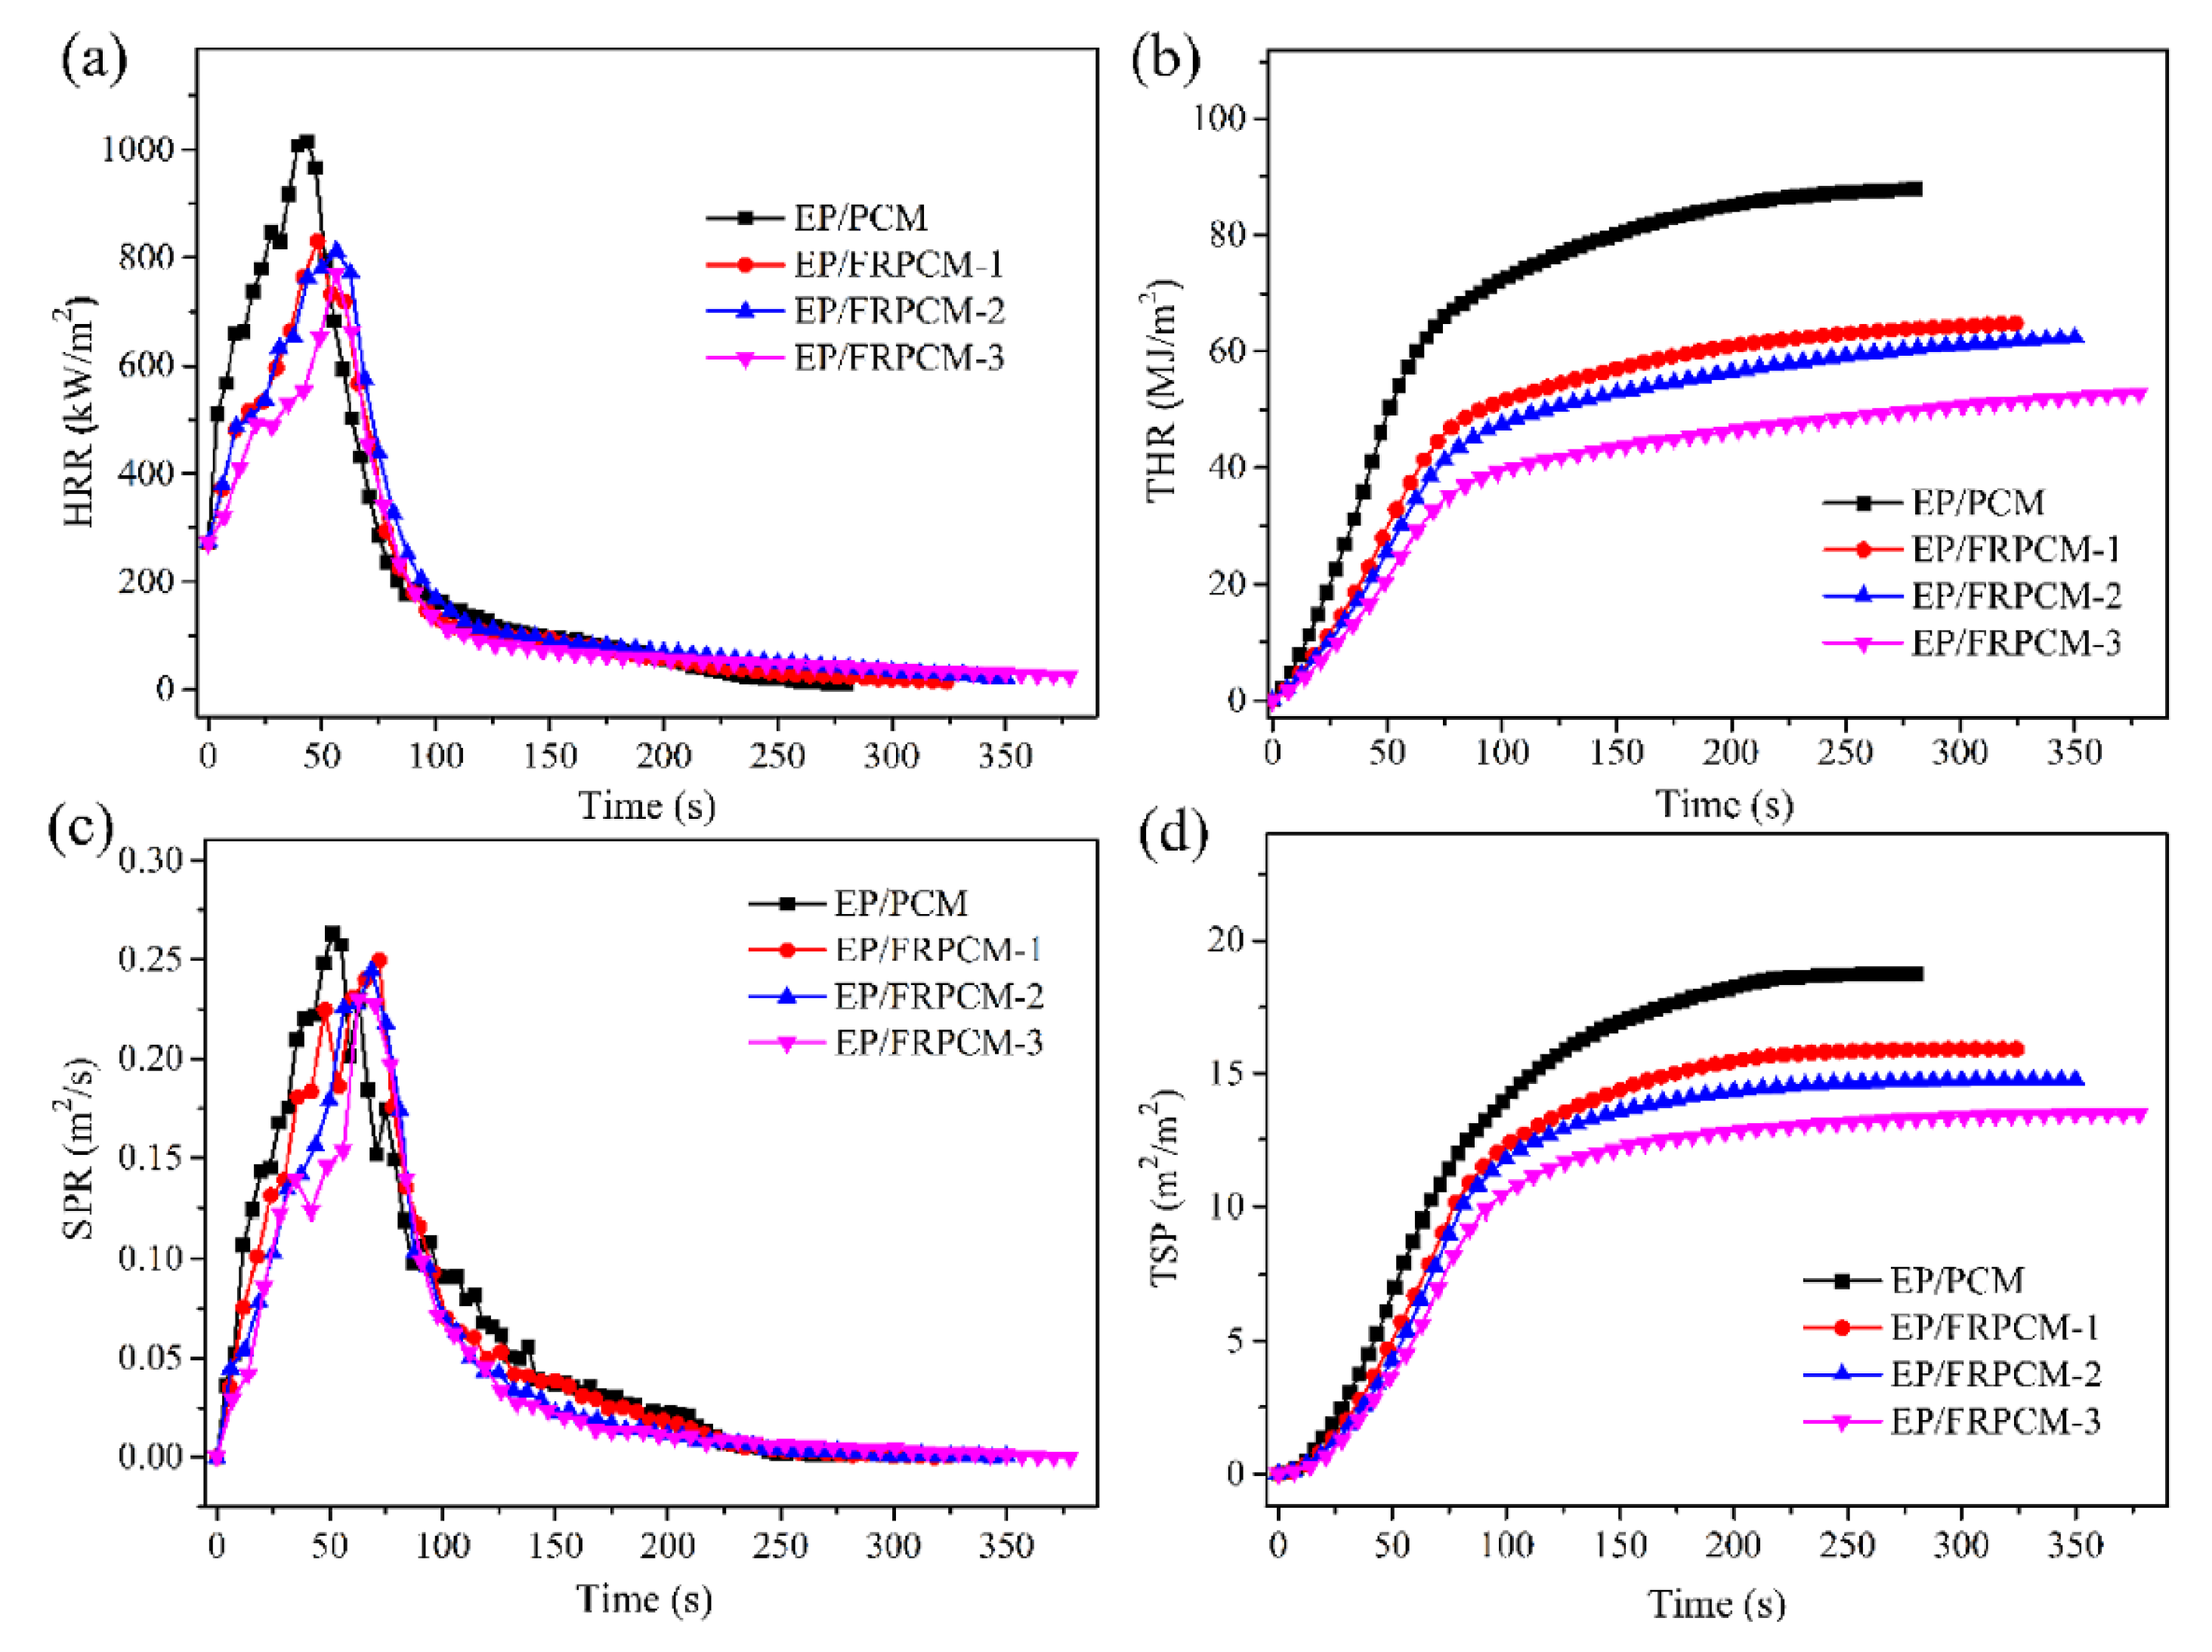
Since the prepared FRPCMs were powder products, a direct assessment of the flammability properties was not possible. For this reason, the FRPCMs particles were mixed with epoxy resin (EP) to prepare bulk specimens, to which LOI and a cone calorimetry test were applied. The LOI test results for EP/PCM, EP/FRPCM-1, EP/FRPCM-2, and EP/FRPCM-3 were 18.5%, 19.5%, 20.2%, and 21.6%, respectively. The cone calorimetry curves are presented in Figure 19.
Other relevant studies aiming to develop low-flammability microencapsulated PCMs were examined, and their materials and preparation methods are reviewed in Table 14.

3.4. Flame Retardant Surface Coatings

FR integration into the bulk PCM is a straightforward, cost-effective, and rapid method. Another method to achieve flame retardancy is surface coating. The surface coating process is cost-effective, and it has the potential of upscaling and integration with other fabrication processes. However, several drawbacks exist: coatings are sensitive to mechanical stress; exposure to environmental factors reduces the effectiveness of the coatings; little data exist on the long-term effectiveness of flame-retardant surface coatings.
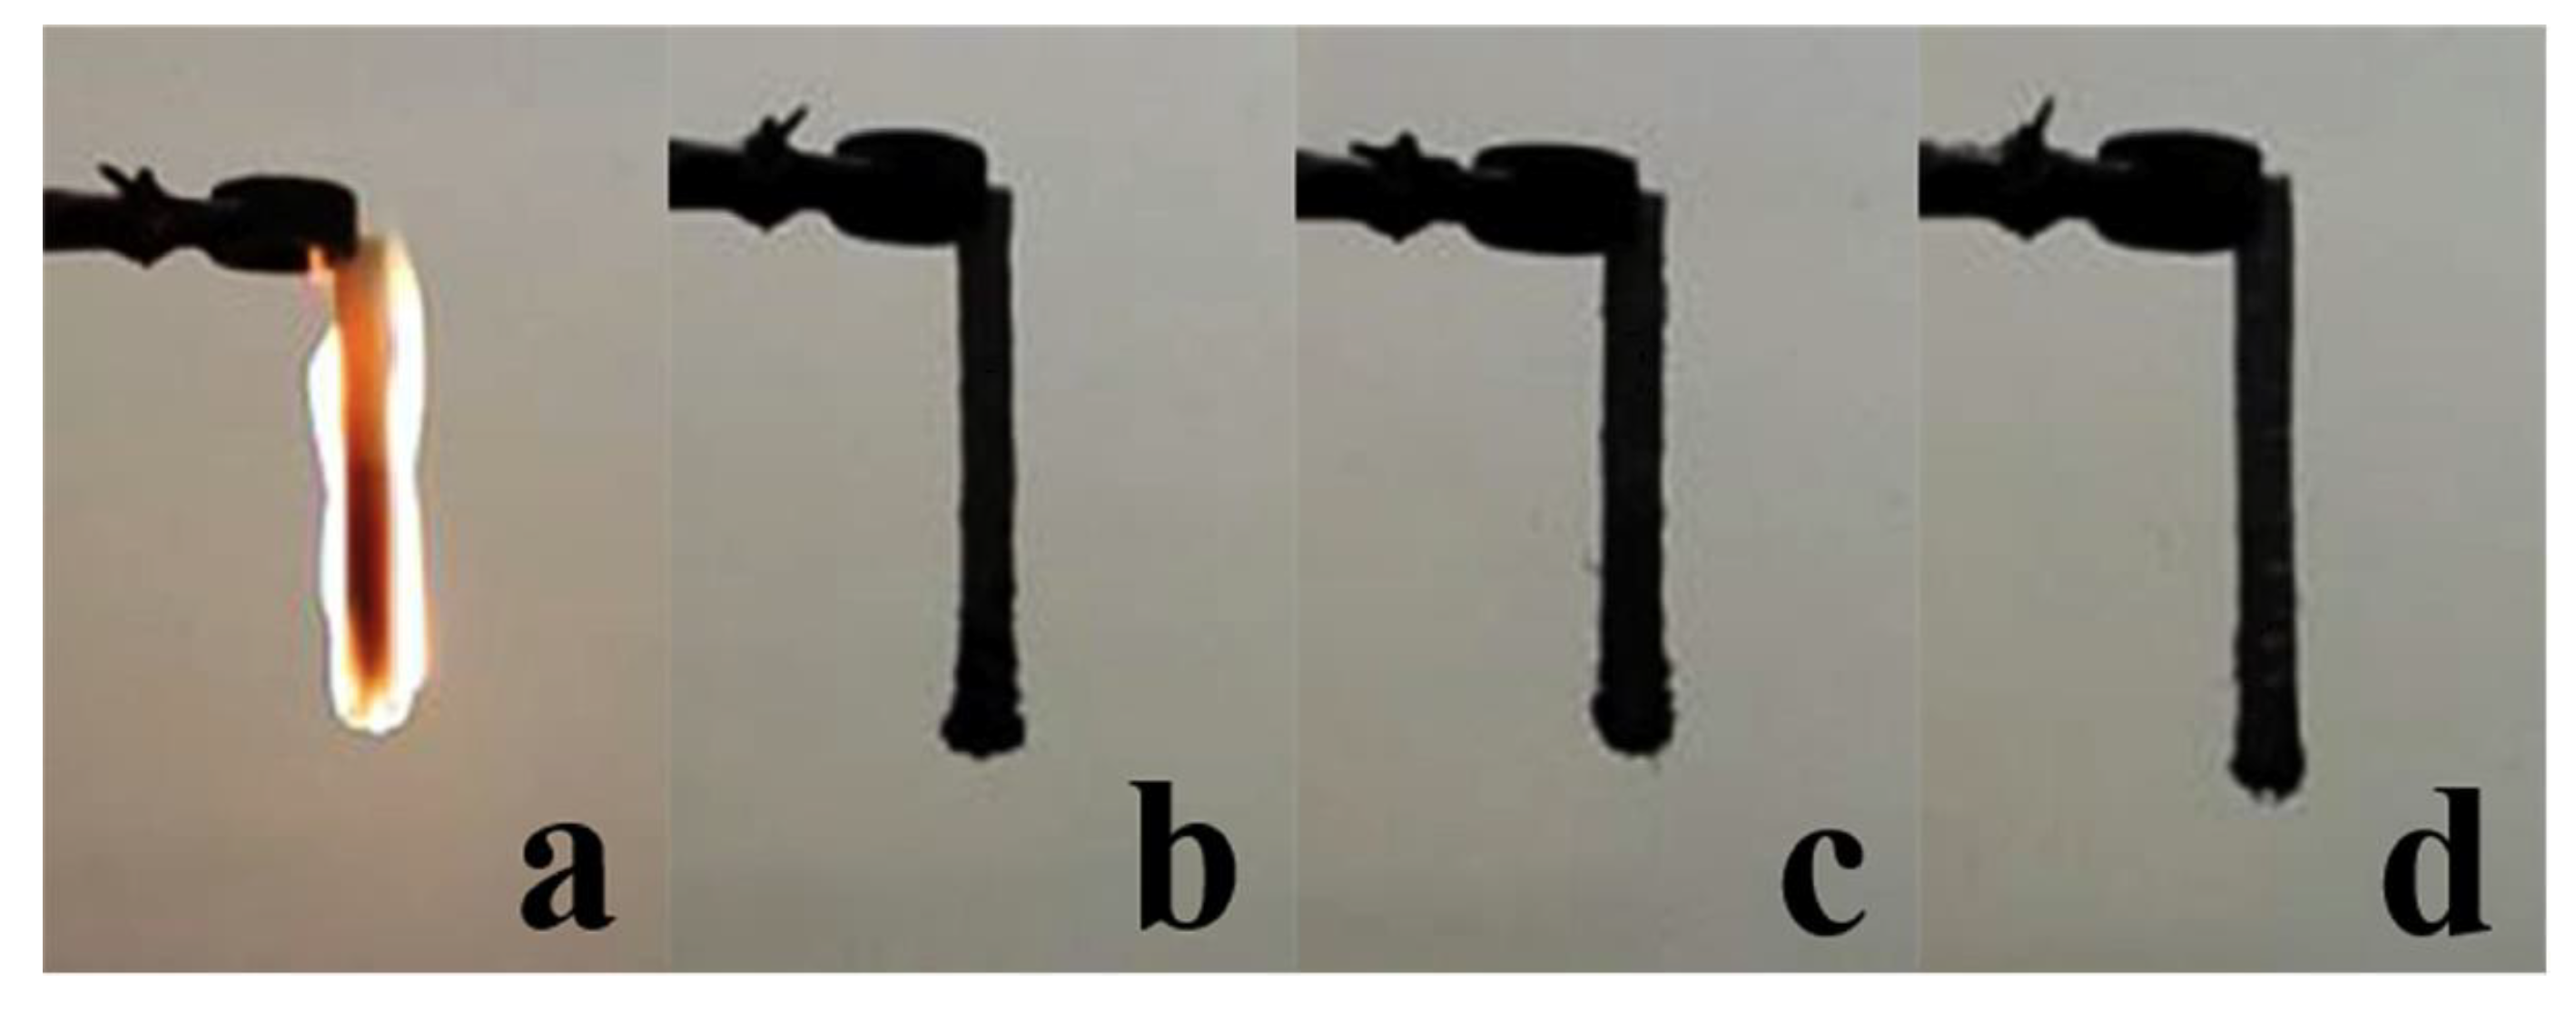
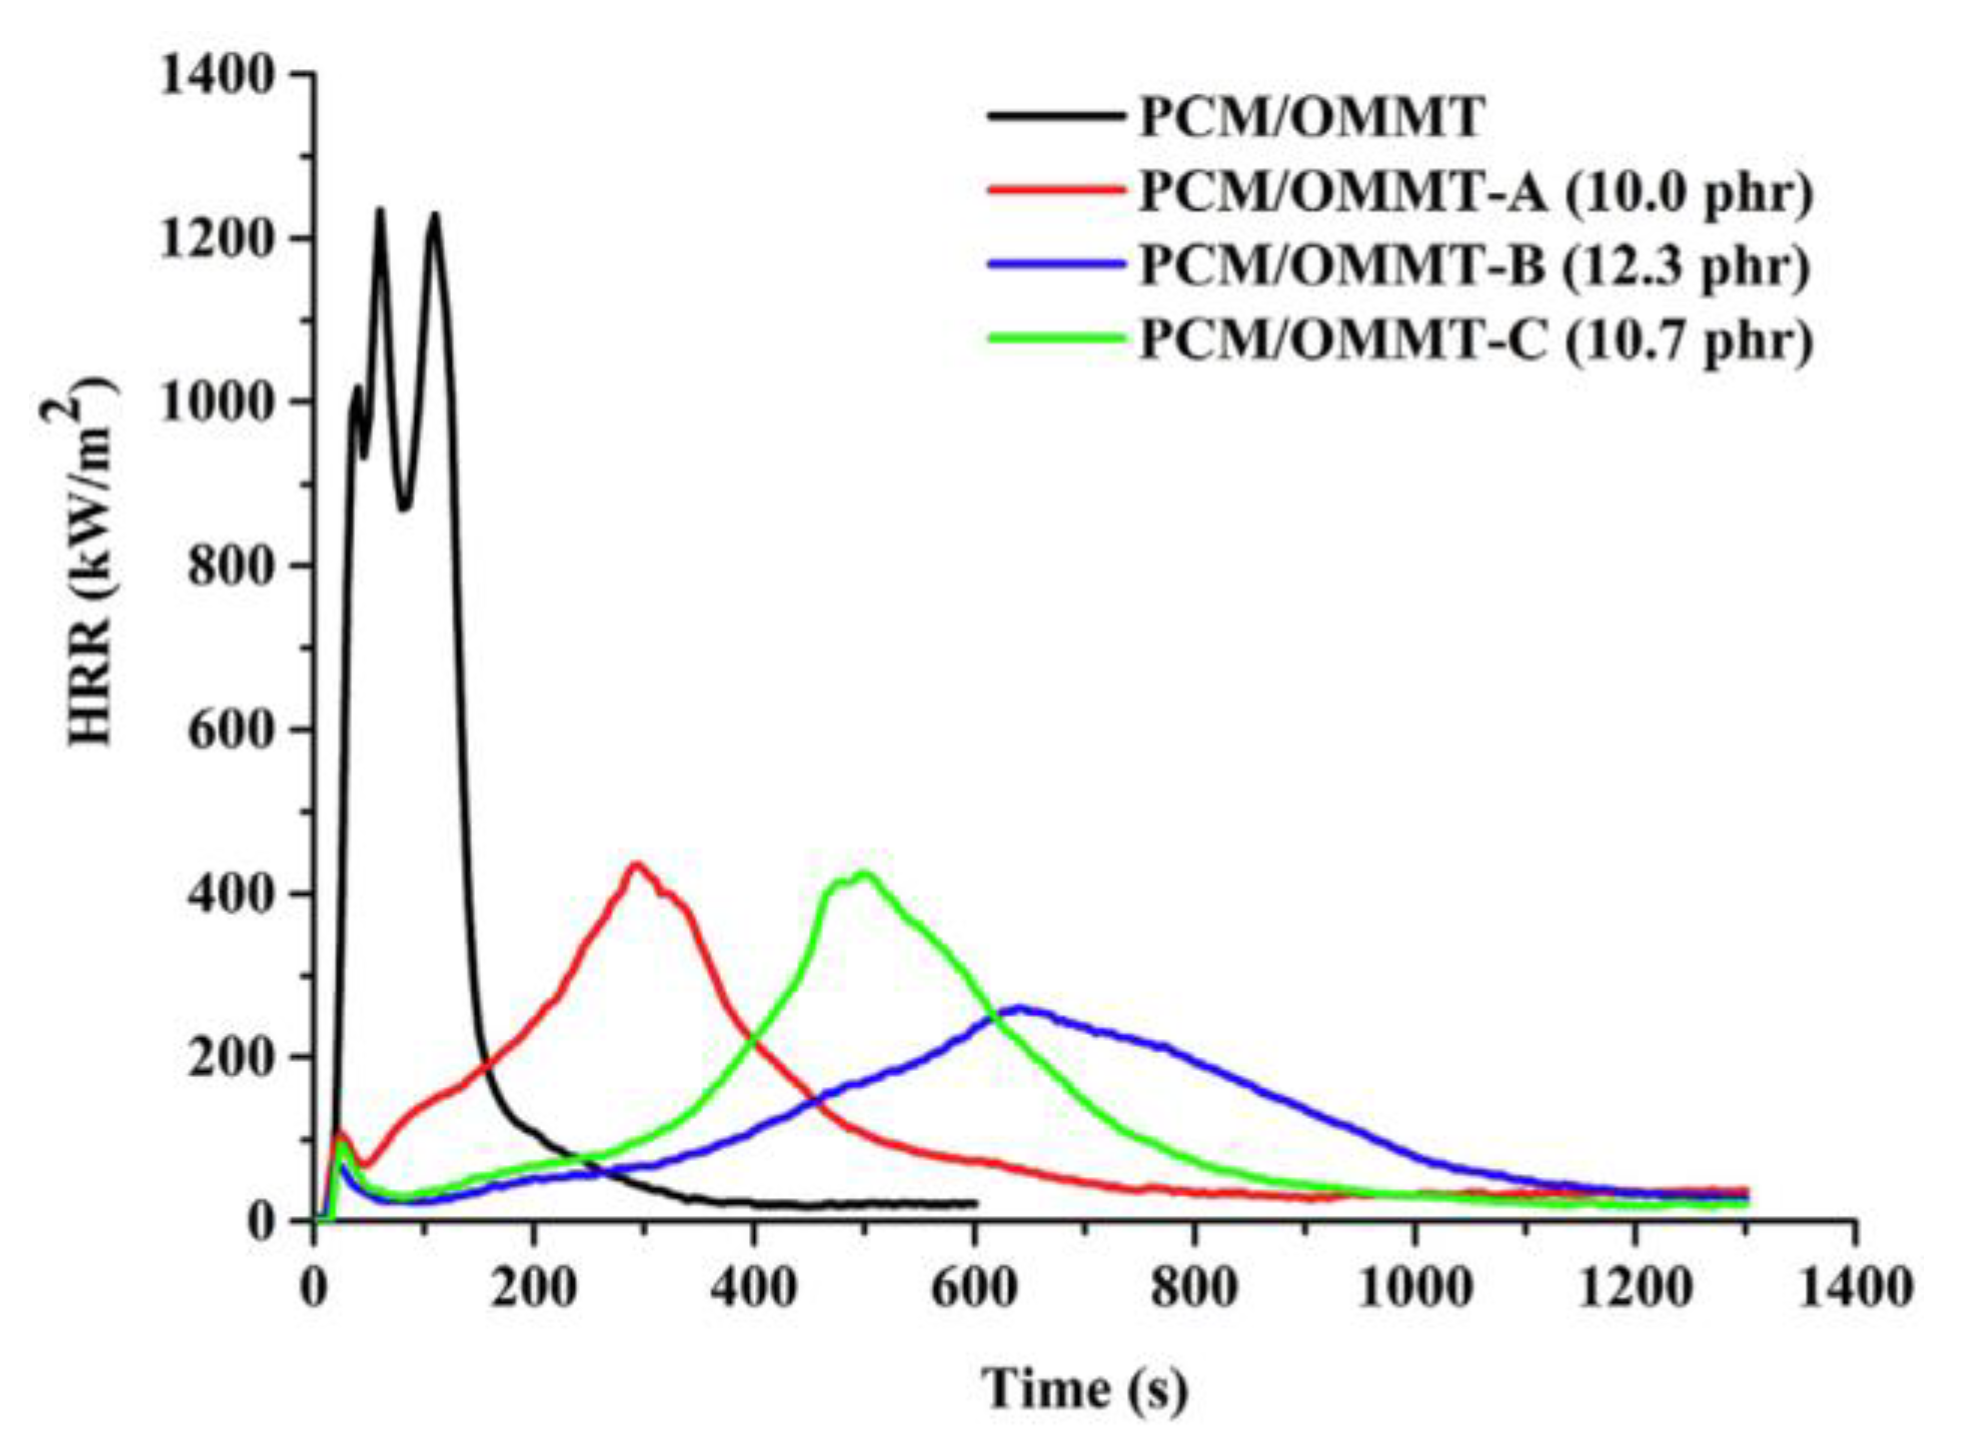
Xu et al. [102] carried out an experimental study in the attempt to reduce the flammability of a SS PCM consisting of paraffin, a polymer matrix, and OMMT, with the mass fraction 60/40/20. Three coatings were considered, as follows: (i) acrylic resin/EG (nine test specimens, PCM/OMMT-A), (ii) alkyd resin/EG (PCM/OMMT-B, nine test specimens), and (iii) epoxy resin/EG (PCM/OMMT-C, nine test specimens). The following materials were used in this study: HDPE, SBS star copolymer with S/B ratio 3/7, paraffin with the MP 28 °C and LH 133 kJ/kg, OMMT, EG with expansion ratio 100–400 mL/g, acrylic resin (FB9788), alkyd resin, EP, and acetone. The preparation process was described in [86]: SBS and OMMT were mixed with paraffin and maintained at 60 °C for 30 min. The liquid mixture was blended at 60 rpm for 6 min at the temperature 140 °C. Strips (130 mm × 13 mm × 3 mm) for horizontal burning, vertical burning, and LOI, or plates (13 mm × 13 mm × 3 mm) for in situ FTIR measurement and (100 mm × 100 mm × 3 mm) for cone calorimetry were hot-pressed. The strips and plates were coated (through brushing) and then allowed to dry at room temperature to remove the solvent (acetone). The final thickness of the coatings was approximately 300 μ m. The UL-94 test was carried out taking as a guideline the standard ASTM D3801-1996. The photos of the strips during the vertical burning test are presented in Figure 20.
No dripping could be observed during the combustion process (Figure 20). This was attributed to the OMMT inclusion, which contributed to increasing the molten phase viscosity and suppressing the paraffin evaporation. The sample PCM/OMMT (without coating) underwent rapid combustion, whereas the surface coated sample PCM/OMMT underwent self-extinguishment, achieving V0 classification when the EG fractions were higher than 8.8, 10.7, and 12.0 phr for the samples PCM/OMMT-A, PCM/OMMT-B, and PCM/OMMT-C, respectively. The cone calorimetry test HRR curves are presented in Figure 21.
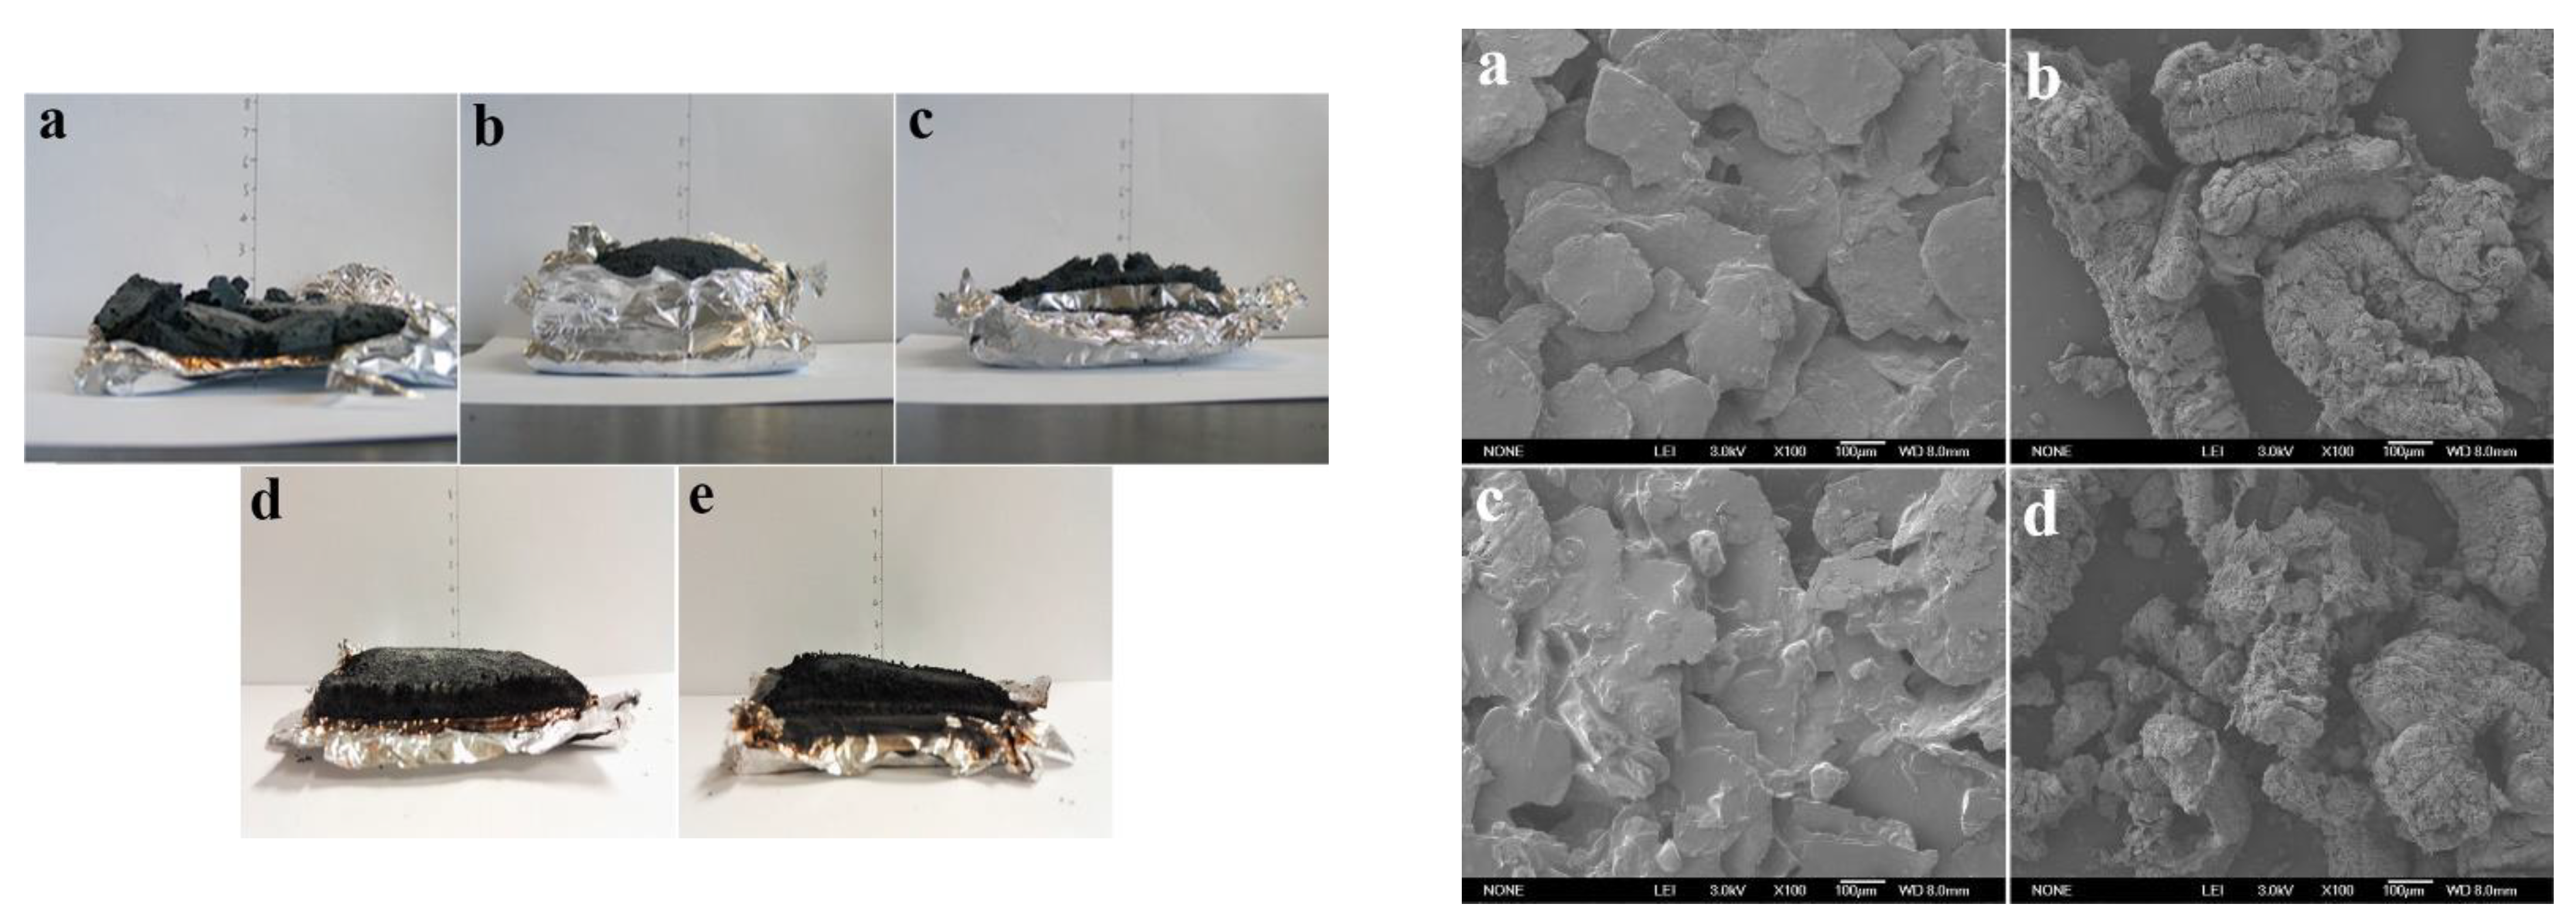
The EG in the coatings expanded swiftly at high temperatures, as can be observed in Figure 22 (residues after cone calorimetry tests). The endothermic expansion process reduced the heat transfer rate which, in turn, delayed the paraffin gasification in the support. Another observation is that the porous microstructures EG (Xu et al. [103]) in the inflated layers trapped the gaseous paraffin and volatile products resulting from the degradation of resins at high temperatures. The flame retardancy effect was attributed also to the thick layers of char, which blocked the oxygen and heat diffusion into the matrix.
Xu et al. [103] investigated, experimentally, a novel surface coating method to achieve flame retardancy for SS PCMs. The coating components were EG, acrylic resin, and RP. Two coating recipes were developed: (A) AR:acetone:RP 10:20:10 and (B) AR:acetone:EG:RP 10:20:5:5. The SS PCM consisted of the following components: SBS star copolymer with S/B ratio of 3/7 (SBS, T161B), paraffin with the MP 30 °C and LH 132.7 kJ/kg, and OMMT. The effectiveness of the surface coatings on the flammability of the SS PCM was assessed quantitatively by LOI, UL-94, cone calorimetry, and thermogravimetric analysis–Fourier transform infrared spectrometry (TGA-FTIR). A visual examination by FESEM offered insight into the material’s microstructure.
Photos of the shape-stabilized PCMs after the cone calorimetry test are presented in Figure 23—(a–e, Left). It can be noticed that the volume expansion of the coated samples SSPCMs, especially PCM/OMMT-A, was significantly higher than for PCM/OMMT and the bulk FR sample PCM/OMMT. The coating’s microstructure before and after combustion is presented in Figure 23 (a–d, Right). EG was not expanded after combustion and it had the appearance of a flat structure. The EG particle’s shape changed after combustion into a vermicular one; a porous structure emerged consisting of inflated layers. The higher the EG amount, the more paraffin and other combustion gases were absorbed. The EG char layers acted as a barrier, delaying the combustion process.
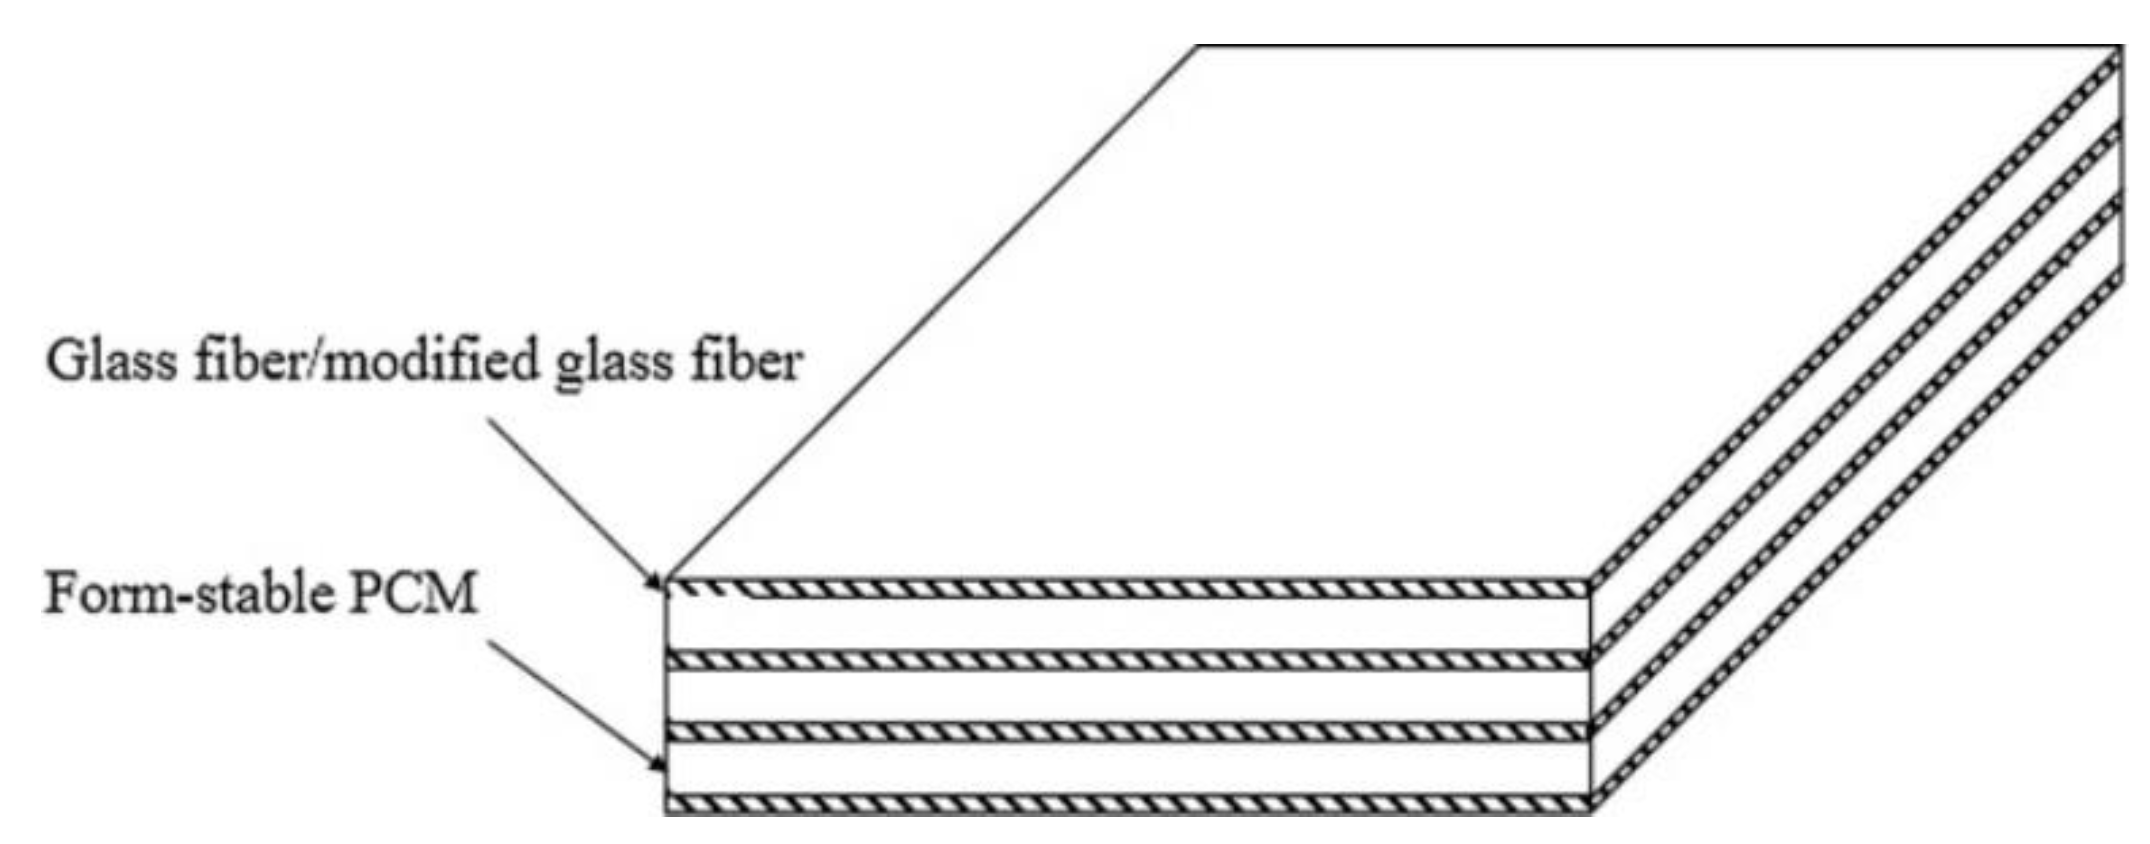
Huang et al. [104] proposed a combined approach to suppress the flammability of paraffin (MP 48 °C, LH 170 J/g). A layered structure (Figure 24) consisting of shape-stabilized PCM layers alternating with modified glass fibers was proposed in [105].
The chemicals used in this study and their properties were EG (expansion ratio 400 mL/g), olefin block copolymer (OBC), antimony trioxide (AT), and chlorinated paraffin (CP-70). EG was thermally treated in a muffle furnace at 900 °C. The SS PCM was prepared by blending the molten components OBC, paraffin, EG, CP-70, and AT with the mass ratio of CP/AT 5:2. The glass fibers were coated with a flame-retardant film (expandable graphite and acrylic resin). The SS composite PCM were manufactured by pressing the SS PCM and glass fiber or modified glass fiber in a mold. Four composite PCM recipes were prepared, as presented in Table 15.
The ISO 5660 cone calorimetry test was used to assess the flammability. The samples (with the dimensions 100 mm × 100 mm × 3 mm) were wrapped in a steel holder and were exposed to an external heat flux (35 kW/m2). On performing the LOI test, the following results were reported: 21%, 21%, 24%, and 26% for CPCM-1 to CPCM-4, respectively. HRR and THR curves are presented in Figure 25. The best performance in terms of flame retardancy was reported for the sample CPCM-4. The flame retardancy performance in the case of CPCM-4 was explained by the presence of the modified fiber glass.
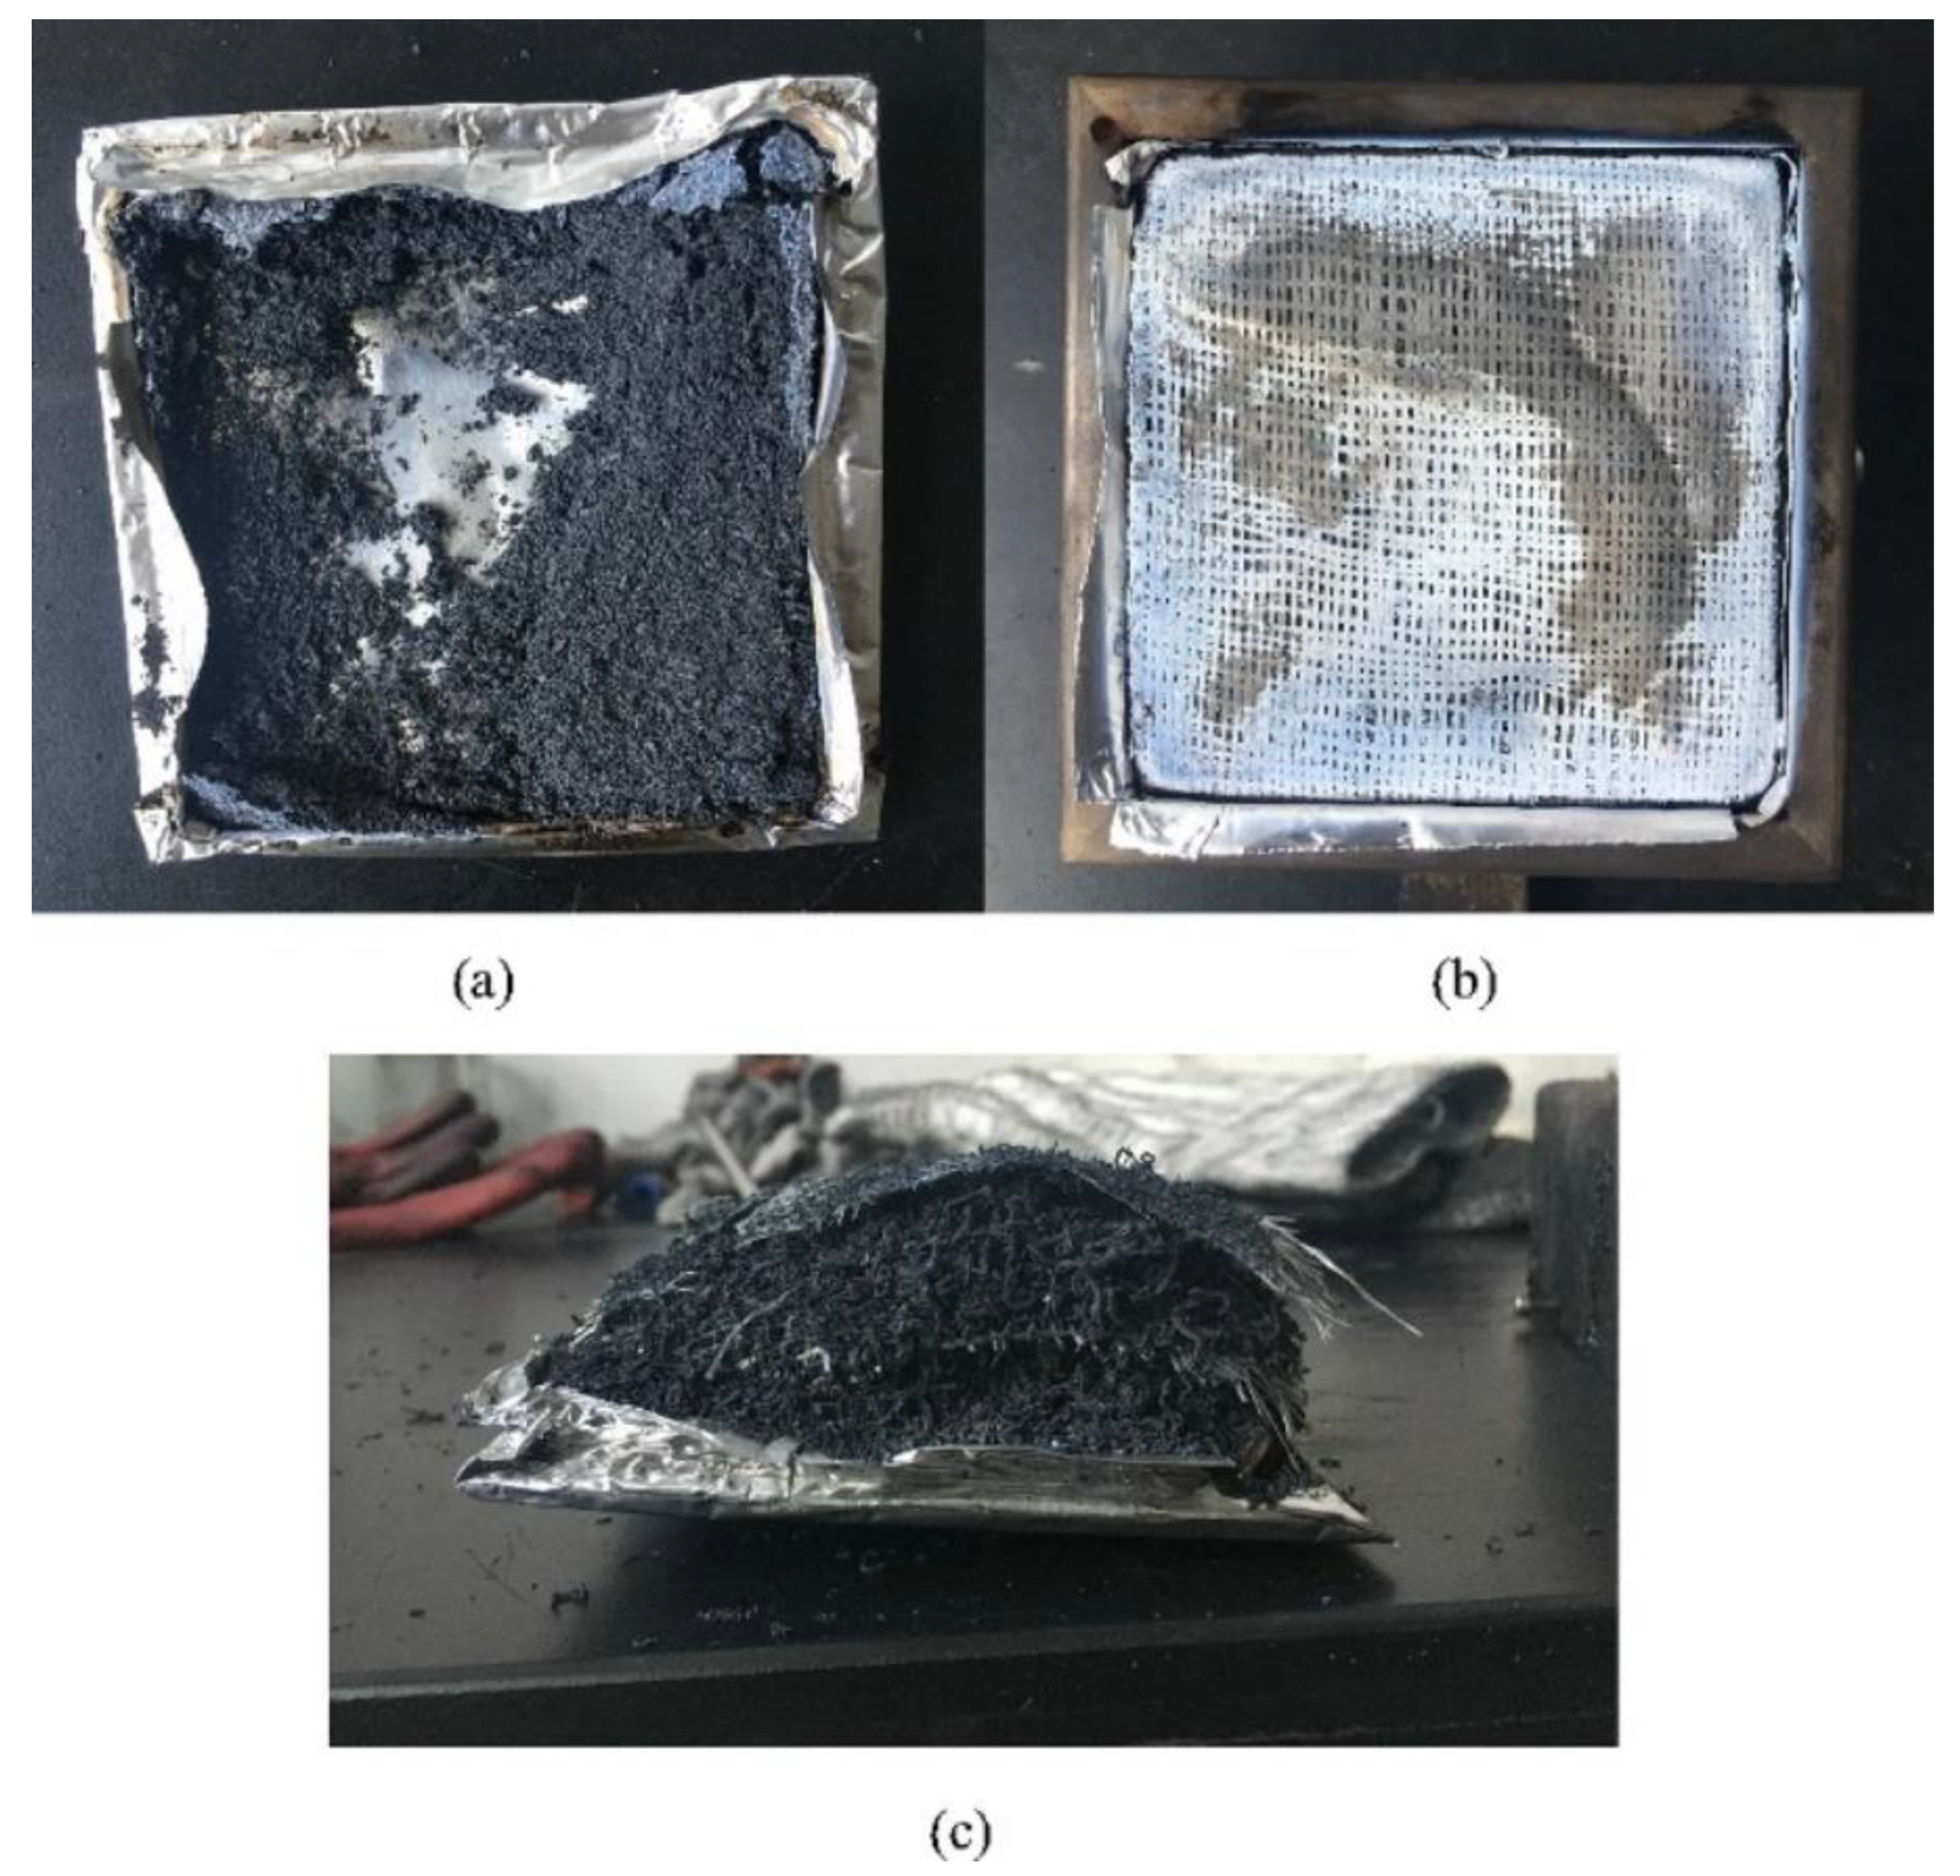
In Figure 26, the photos of the test specimens after performing the cone calorimetry test are presented.
It can be observed from Figure 26 that the specimen CPCM-1 (Figure 26a) underwent almost complete combustion while CPCM-2 (Figure 26b) maintained its original shape, which can be explained by the glass fiber’s mechanical properties. The specimen CPCM-4 (Figure 26c) underwent significant expansion as the modified glass fiber formed char layers after combustion, which suppressed the combustion rate. The specimen CPCM-4 achieved a V-0 rating and maintained its paraffin content (70%). Its peak HRR was 58.8% lower than the corresponding value for CPCM-1.
Xu et al. [106] developed and tested surface coatings based on various FRs to improve the flame resistance of PCMs. Paraffin with MP 28 °C and LH 133 J/g was used as PCM. SBS, HDPE, and OMMT were used as shape-stabilization agents. The PCM and the shape-stabilizing agents with the ratio 30/10/60/20 were mixed and heated up at 60 °C for 30 min. A torque rheometer was used to blend the mixture at 140 °C for 6 min at 60 rpm. The SS PCM was hot-pressed under a pressure of 8 MPa for 4 min at 140 °C into strips (with the standard dimensions 130 mm × 13 mm × 3 mm for horizontal burning, vertical burning, and LOI and 100 mm × 100 mm × 3 mm for the cone calorimetry test). The FRs investigated in this study were EG, Talc, APP, OMMT, EGP, IFR (APP/PER/ML with the mass fraction 1:1:1), RP, and Al(OH)3. The flame-retardant coatings were prepared by means of dispersing an FR into an acetone-based solution of acrylic resin. The mass ratio of acrylic resin/acetone/FR was the same for all coatings, 10/1/10. The SS PCMs were treated with the coating solutions (by means of brushing) and dried naturally to allow the evaporation of the solvent agent. The thickness of the dried coating layer reported in [106] was approximately 300 microns. The flammability was assessed by horizontal and vertical burning tests, LOI, and cone calorimetry. This study is different from others in that it considers both bulk FR integration into the PCM and surface coating as methods to reduce flammability. It was reported that the bulk integration had a limited effect on reducing the flammability (even at an FR mass fraction as high as 40%), while surface coating resulted in a considerably higher flame resistance. With EG as FR, the LOI index reported was as high as 30%, and V0 grading was achieved. The PHRR reduced from approximately 1140 to 390 kW/m2, and the combustion process took much longer to complete. The surface coating FR mechanism was explained as follows: at moderate temperature, the EG-based coating suppressed the volatilization of the paraffin; as the temperature increased, the EG underwent expansion and formed a porous char layer of a significant thickness. The EG expansion dissipated a considerable amount of heat and prevented the matrix temperature from increasing steeply. This delayed the paraffin gasification, thus achieving a flame retardancy effect.

3.5. Flame Retardancy Achieved through Modification of the Chemical Bonds

A recent research direction aims to identify ways to modify the PCM chemical bonds by inserting the flame retardant through covalent bonds. This approach is inherently more complex, but the advantage is that the PCM has intrinsic flame retardancy properties [22]. The new chemical structure is more stable than the physical blending methods discussed so far, with the main advantage being that no phase separation can occur.
Jiang et al. [105] developed a novel type of shape-stabilized PCMs containing phosphorus and silica through a complex two-stage synthesis process:
(i)
transesterification reaction of
a.
diethyl phosphite;
b.
1-tetradecanol;
c.
1-hexadecanol;
d.
1-octadecanol.
(ii)
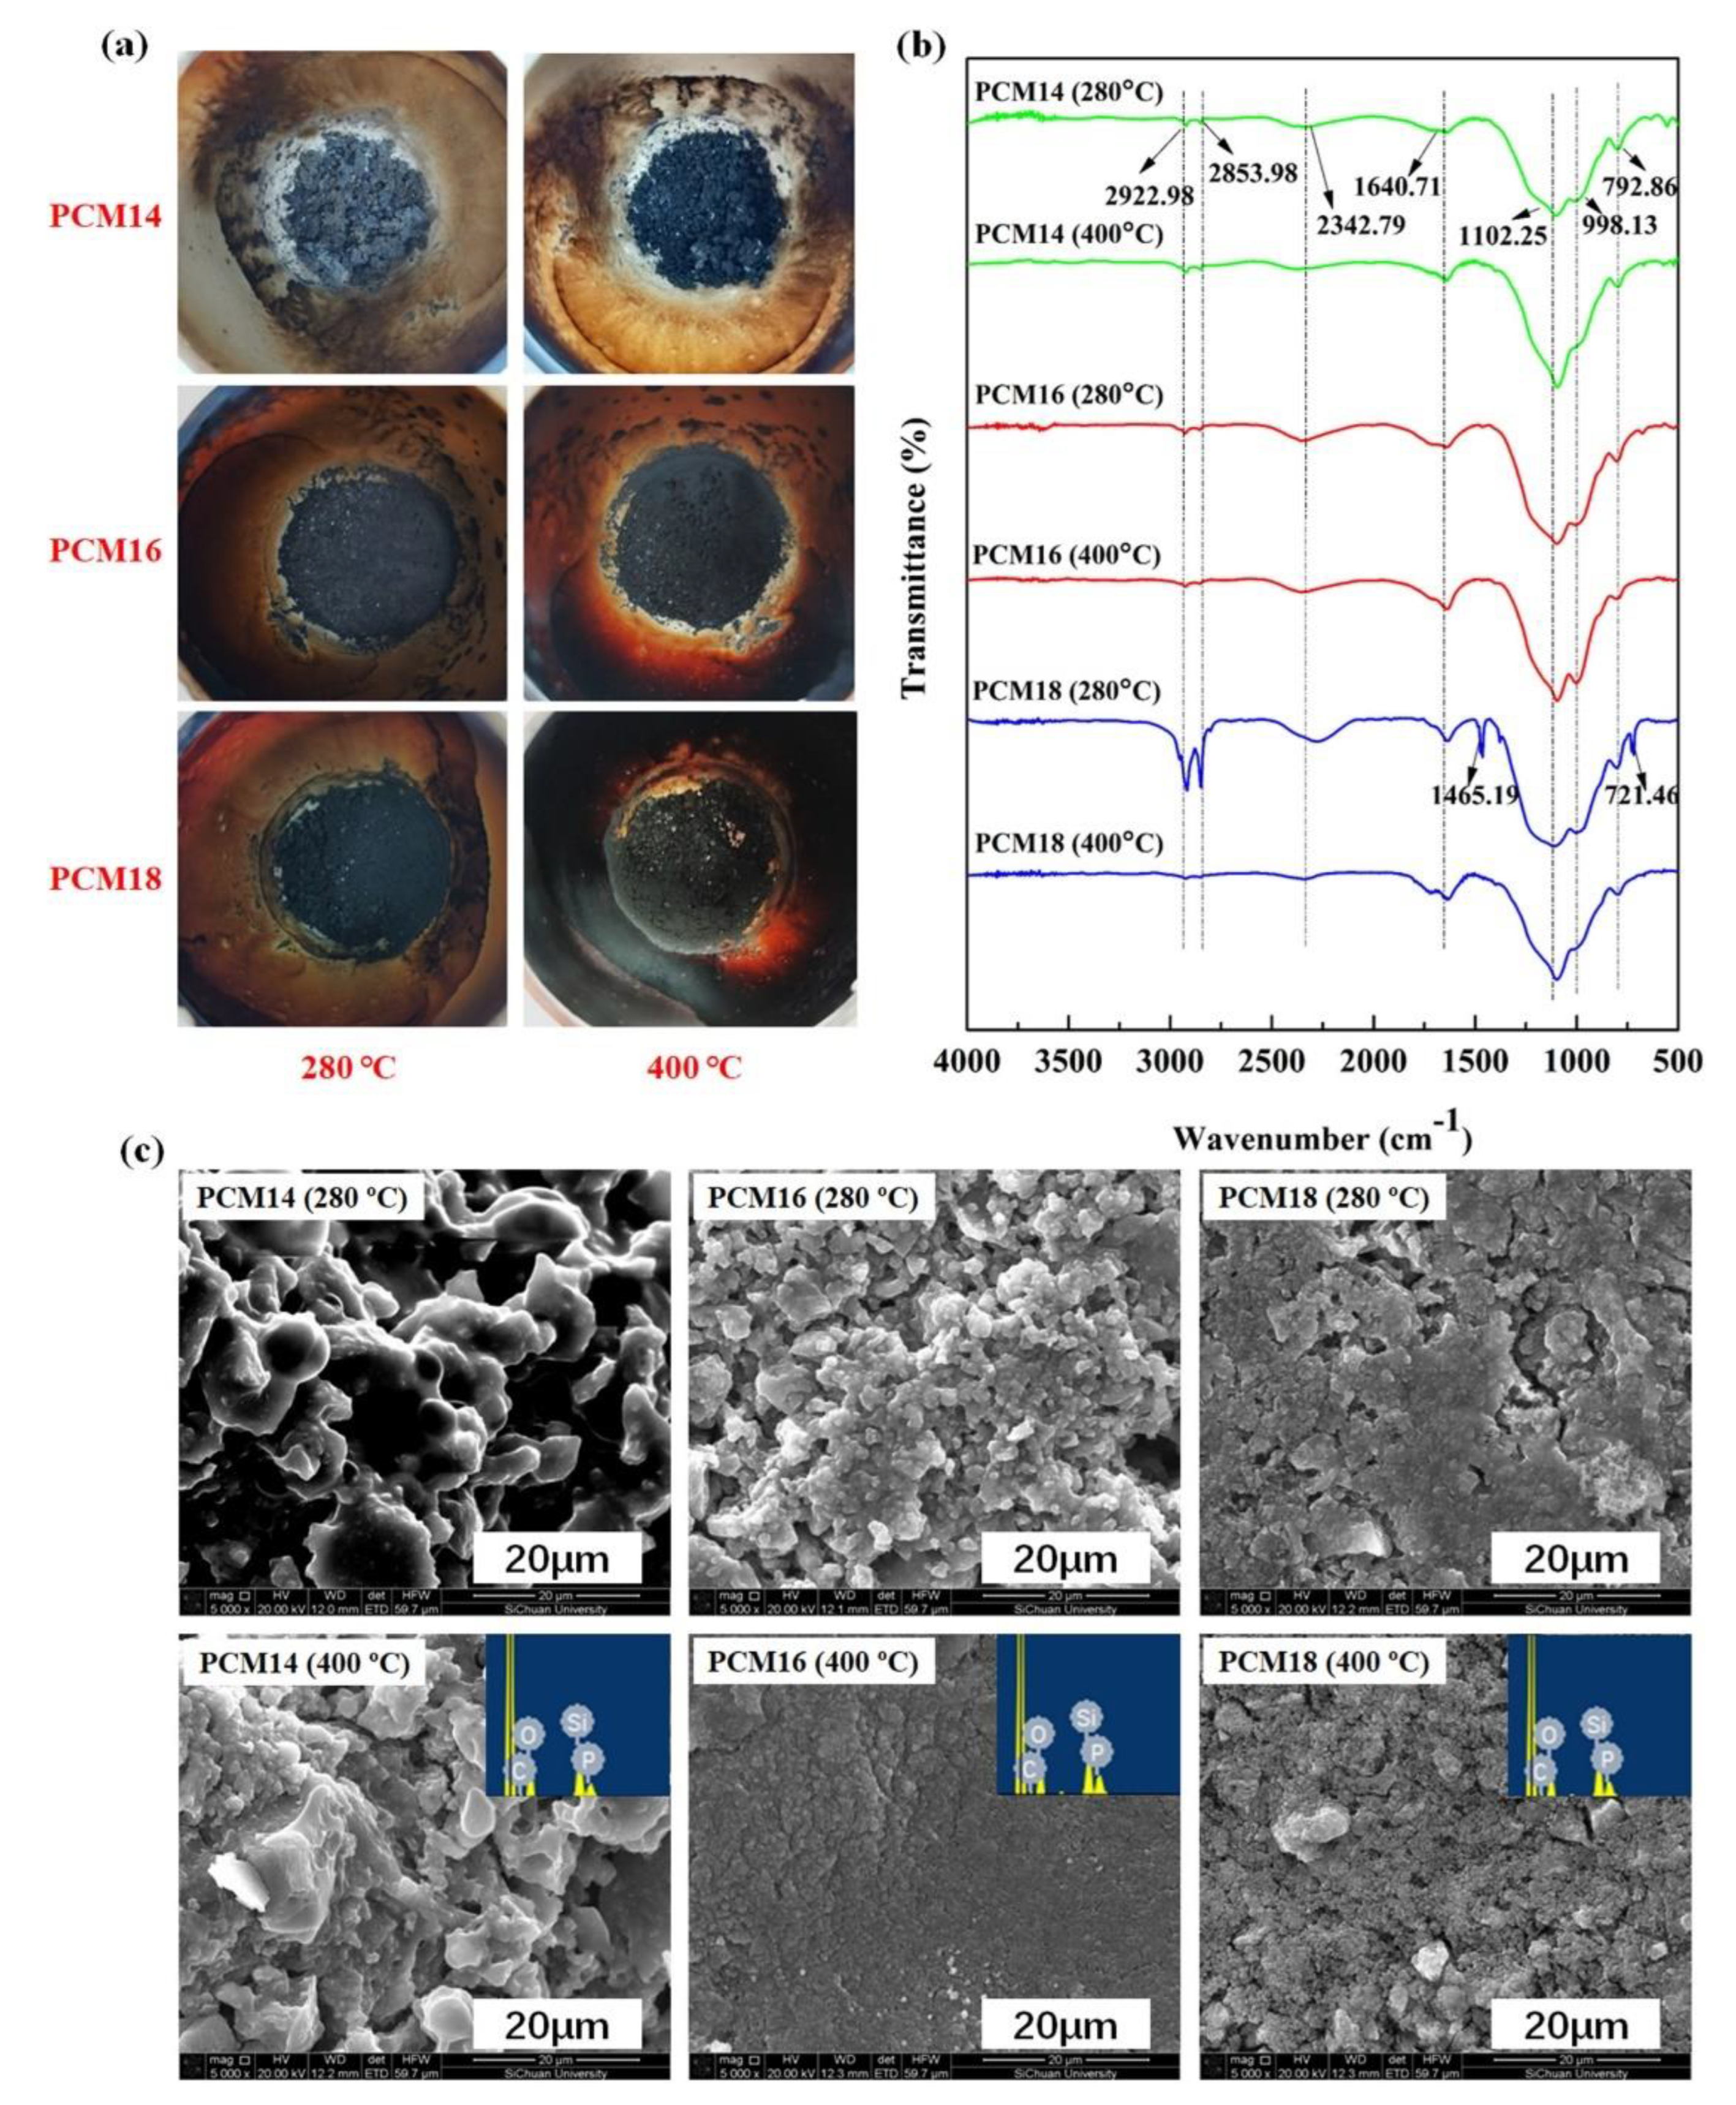
ring-opening reaction followed by hydrolytic condensation of 2, 3-epoxypropoxy propyl trimethoxysilane. The mixture consisting of the previously synthesized phosphite of higher alcohol (PHA) and KH-560 (0.11 mol) was stirred at a high speed for 6 h at the temperature 140 °C under a protective nitrogen atmosphere. Then, the liquid was transferred to an open dish, and distilled water was added to the mixture. In the last step of the process, a white solid powder was obtained after heating at 80 °C for 48 h. The synthesized PCMs were denoted as follows: sample based on 1-tetradecanol: PCM14; sample based on 1-hexadecanol: PCM16; sample based on 1-octadecanol: PCM18. The whole synthesis process is illustrated schematically in Figure 27.
The shape stability was ensured by the support of the Si-O-Si network structure. When the temperature is above the melting point of higher alcohols, the Si-O-Si network structure limits the movement of alkyl chains.
The morphologic macroscopic examination of the three samples following a thermal treatment at two temperatures (280 °C and 400 °C) is presented in Figure 28a. Loose lumps can be observed in the sample PCM14, as opposed to PCM16 and PCM18 for which the residual chars are compact and without breaks, cracks, or irregularities. For the samples PCM14 and PCM16, the residual char morphological structure generated at 280 °C did not change significantly upon further heating up to 400 °C, thus confirming a good thermal stability of chars at high temperatures. In contrast, PCM18 produced a smaller residue amount when the temperature increased from 280 °C to 400 °C. This effect was attributed to a second decomposition of the residual alkyl chains. The protection of external char layers, which limit the heat and mass transfer, caused a delay in the decomposition of alkyl chains.
The SEM photos and EDS spectra demonstrate that the char-forming ability at high temperature was enhanced by the incorporation of phosphorus and silicon. The residual chars have the capacity to insulate the oxygen and thermal heat flux to prevent the spreading of the combustion process.
Zhang et al. [107] prepared hybrid PCMs by a composite process of PU with FRs. Dried PEG10000 was dissolved in distilled toluene at 60 °C. A solution of toluene-2, 4-diisocyanate, and dibutyltindilaurate was injected and stirred at 40 °C for 6 h resulting in an NCO-terminated prepolymer. A predetermined amount of TBBP-A was added to the mixture, and the reaction was continued for 10 h at 120 °C. PCM/TBBP-A composite materials were obtained after vacuum drying. Five different samples were obtained with TBBP-A content 0%, 10%, 15%, 10%, and 25%, respectively. An identical process was used for DBDPE and TBBP-A to obtain PCM/TBBP-A/DBDPE composite materials. The synthesis route for the preparation of the phase change composite is presented in Figure 29.
The flammability was assessed by the LOI test, with the results presented in Table 16.
It can be noticed from Table 16 that the oxygen index of PCMs using PEG10000 as a latent heat storage core was relatively low (16%). This was explained by the fact that the oxygen content is high in the polyether structure. This suggests that polyether structure in SS PCMs poses fire risks in practical applications. However, the flame resistance increased with the increase in the TBBP-A fraction. At the maximum value of the TBBP-A fraction, the LOI value reached 20.2%, which is lower than the minimum value for self-extinguishment L O I 21 . For the second type of composite PCM, a LOI value above 21% was reached for DBDPE fraction values of 15% or more.
Chen et al. [108] developed a FR PCM (FRPCM) by mixing pentaerythritol phosphate (PEPA) with phosphorus-grafted hexadecanol. The synthesis route for the FRPCM is presented in Figure 30. The chlorine groups were replaced by hexadecyl or methyl groups, resulting in seven samples, denoted in Figure 30 A to G. The newly inserted functional groups interact with the molecular movement of the compound, with the ultimate effect being the modification of the fusion enthalpy.
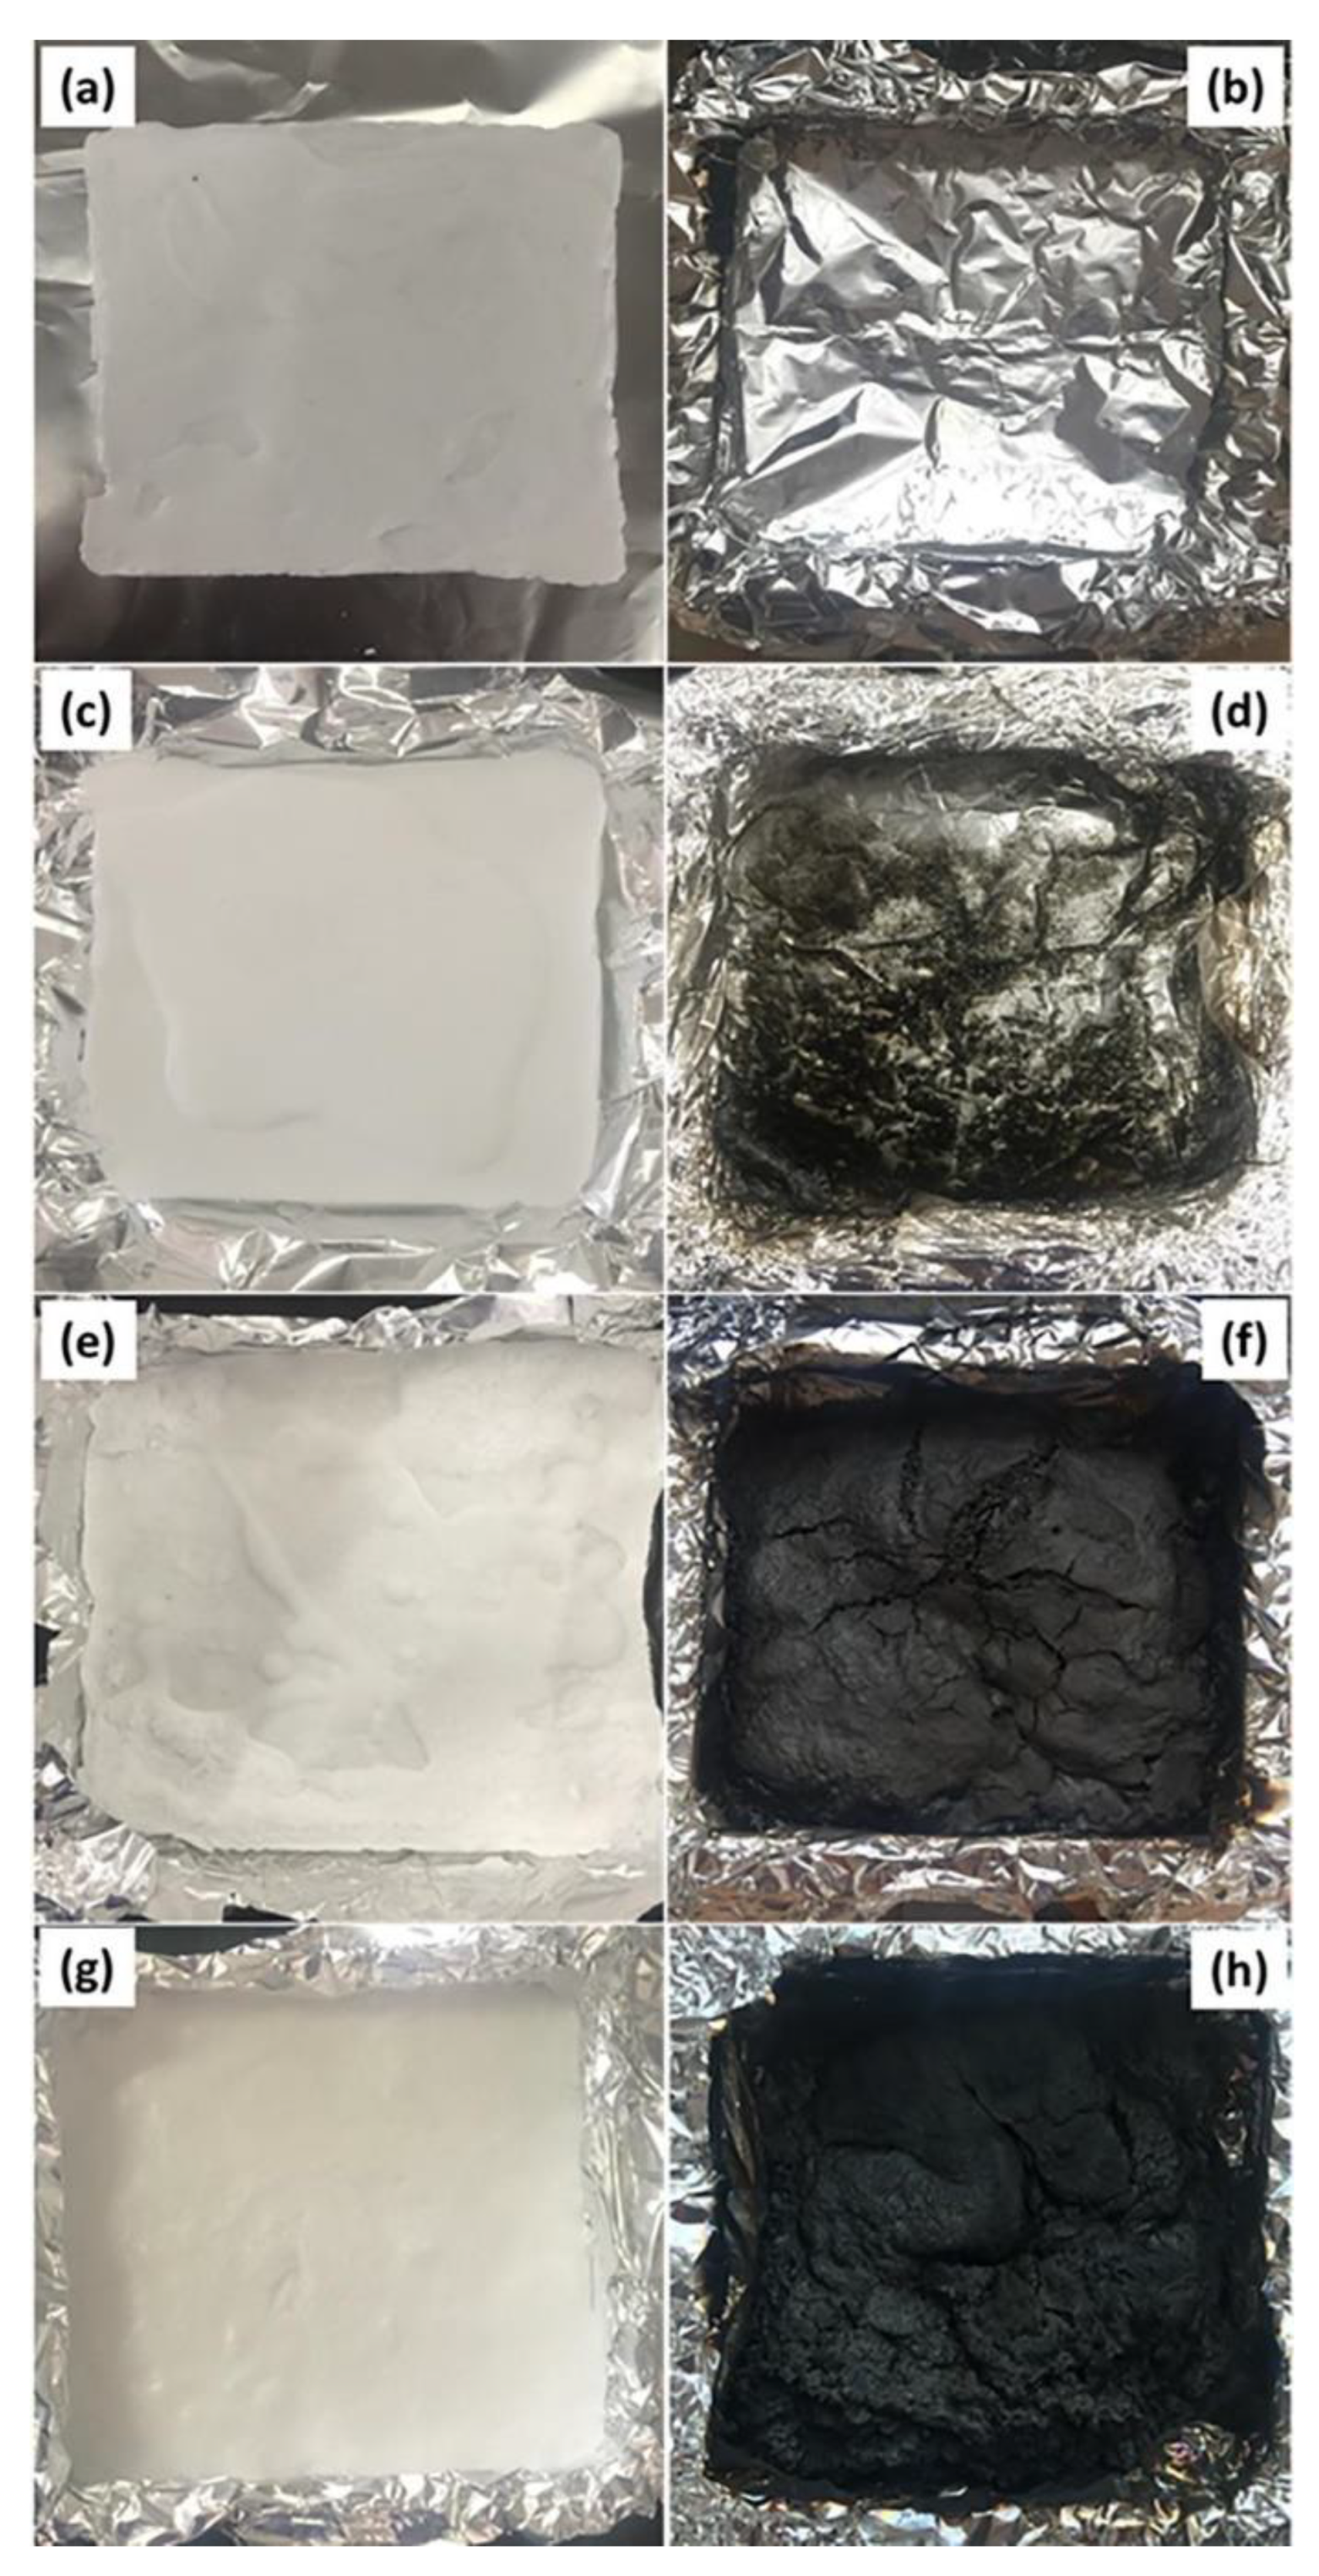
The flammability was assessed by cone calorimetry in accordance with the ASTM 1354 and ISO 5660 specifications, wrapping the samples with aluminum foil in an iron holder and exposing them to an incident heat flux of 35 kW/m2. Standard sample dimensions (for cone calorimetry) were used (100 mm × 100 mm × 3 mm). To obtain a baseline for comparison, a mixture of 20% PEPA and 80% hexadecanol was prepared, denoted P-20. A number of four samples denoted G-10, G-15, G-20, and G-25 were prepared by mixing PEPA with the modified hexadecanol in different concentrations.
The cone calorimetry test results are presented in Table 17.
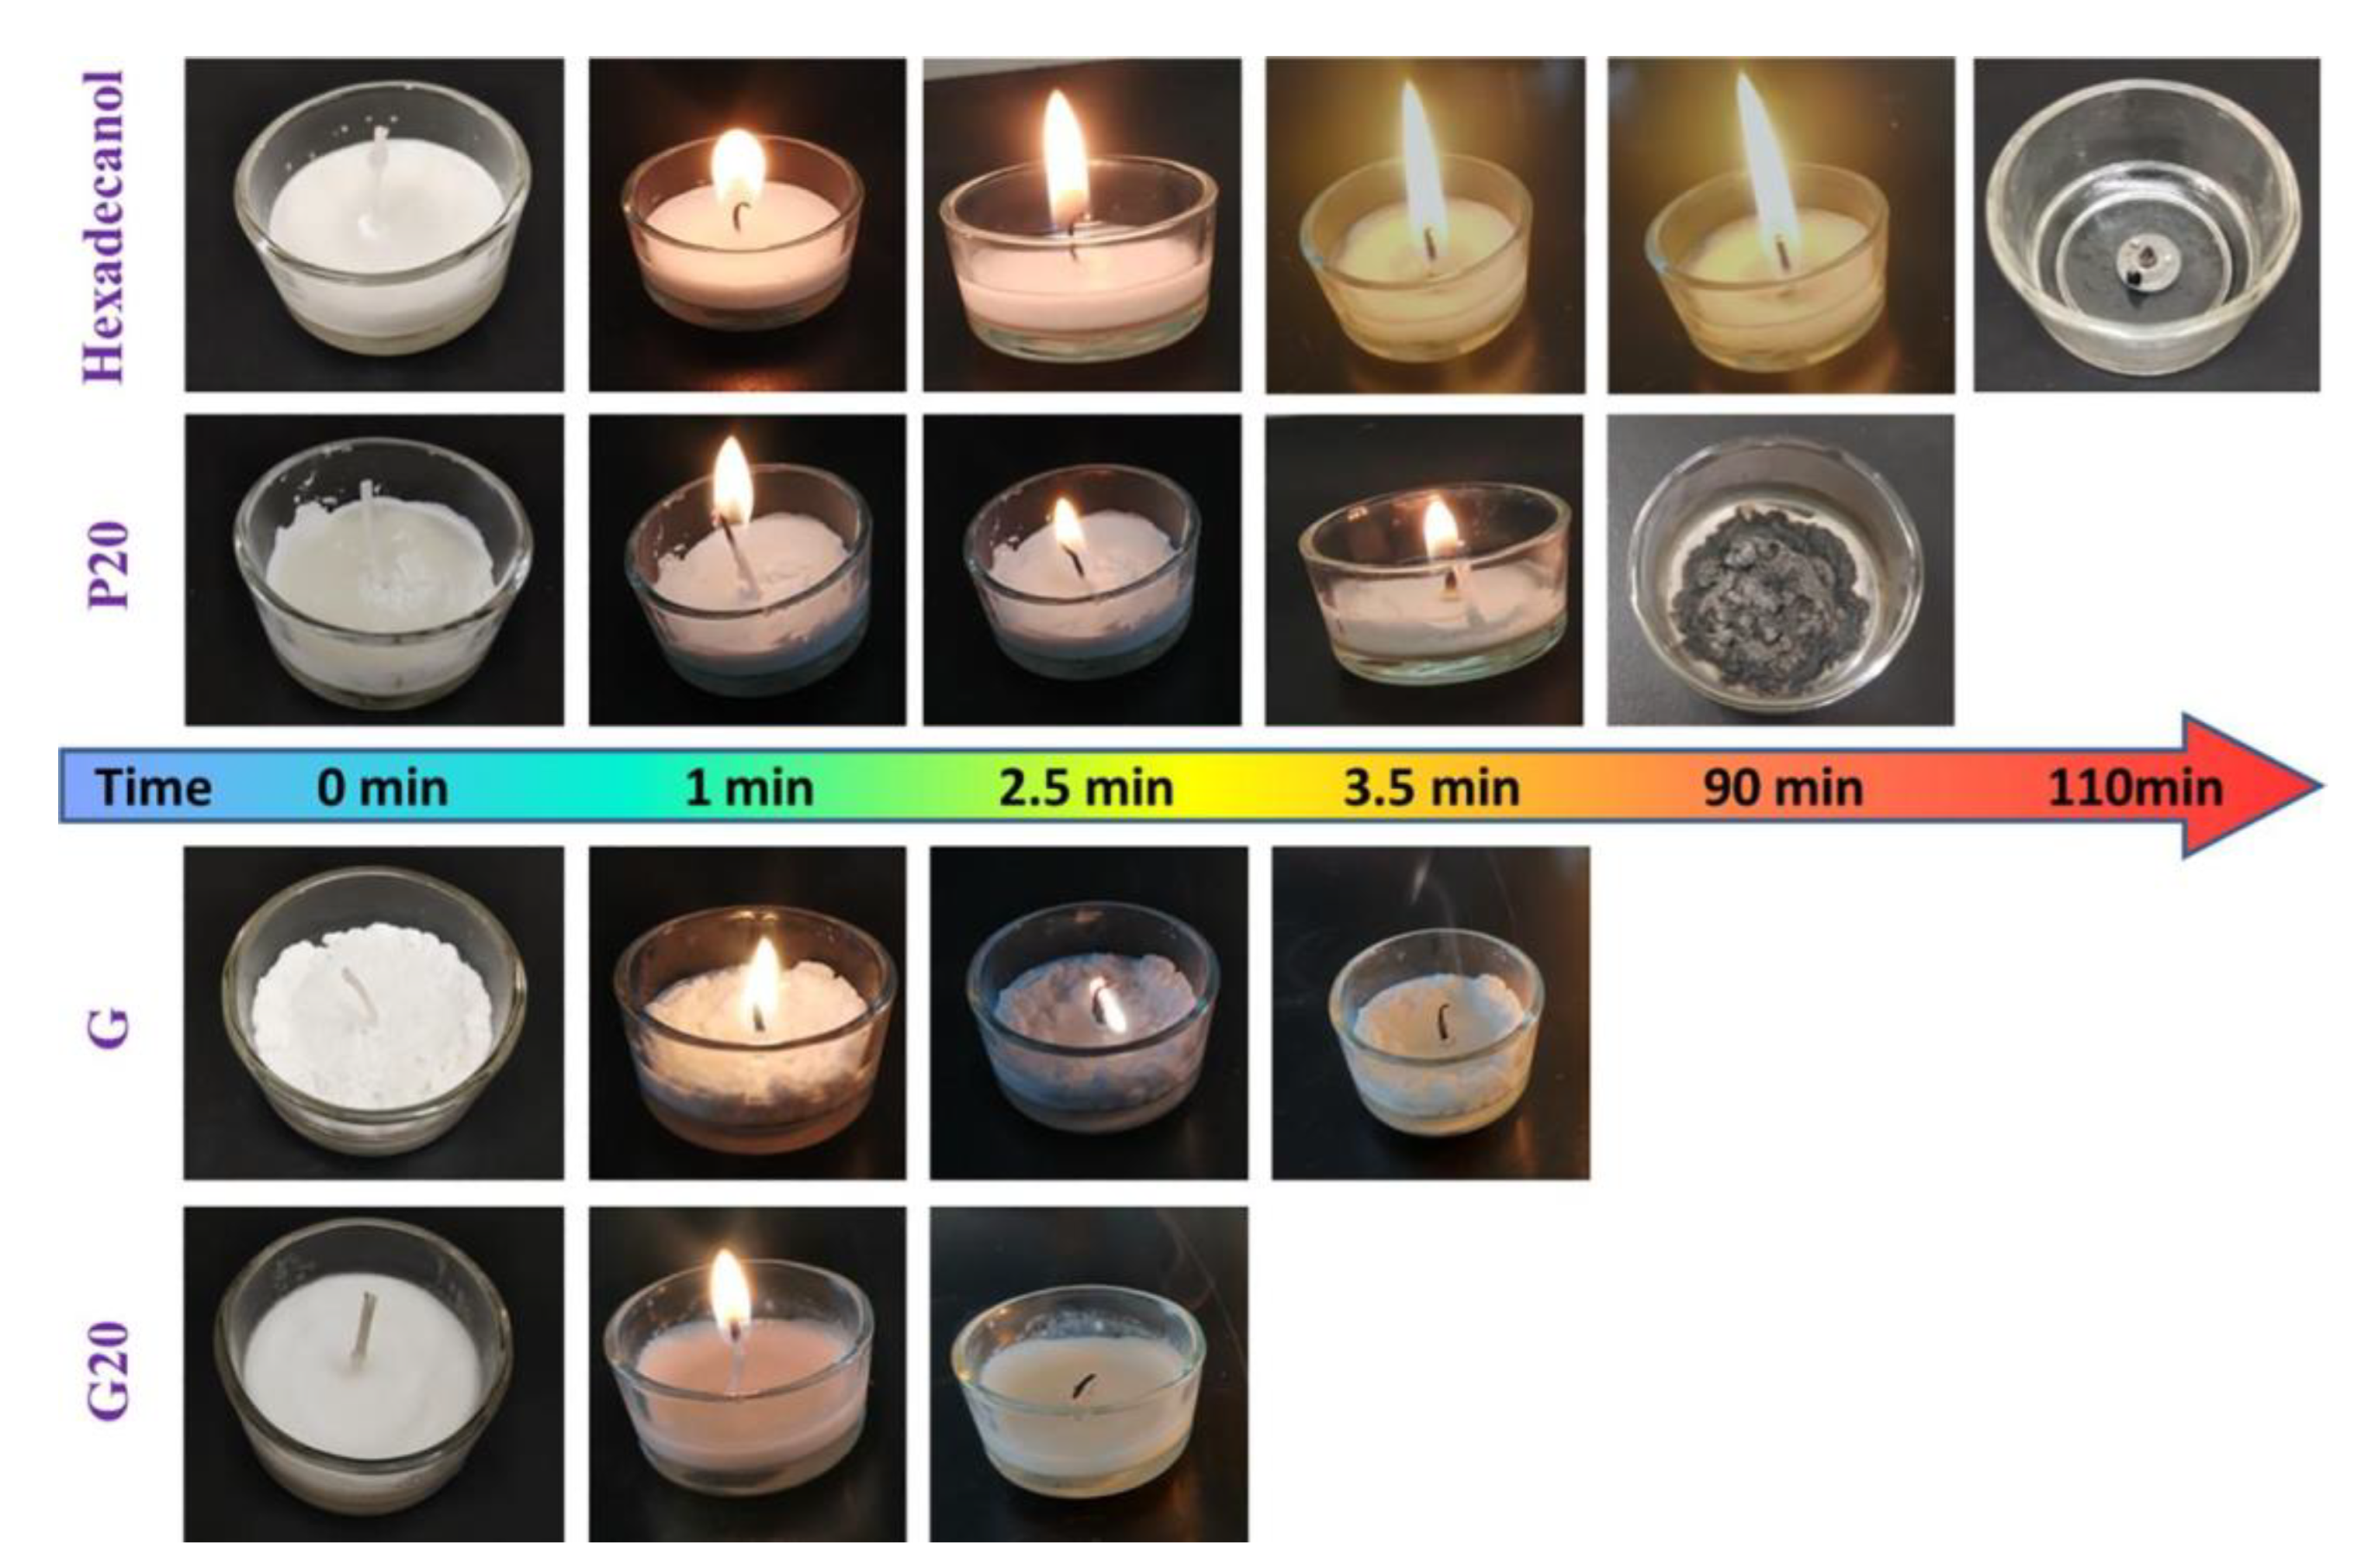
The photos of the samples after the cone calorimetry test are shown in Figure 31. Hexadecanol did not produce combustion residues (Figure 31b). When phosphorus compounds were added, various amounts of residues were produced (Figure 31d,f,h).
The candle test was applied to assess the self-extinguishment property of FRPCMs. The photos taken during the candle test at various moments in time are presented in Figure 32. The results of the self-extinguishing test are presented in Table 18.
From Figure 32, it can be noticed that hexadecanol burns completely. The grafted phosphorous groups have the effect of reducing the burning time, as demonstrated by the candle test. This flame-extinguishing effect was enhanced when PEPA was added.
Chemically-modified PCMs are a promising development direction in achieving low or zero flammability. Their main advantages are (i) low or absent phase separation possibility, and (ii) no miscibility issues. Their disadvantages include the absence of a standard synthesis procedure, and their inability to self-extinguish in ambient conditions. It is expected that chemically-modified PCMs, with the support of an additional FR, can achieve zero flammability, rendering them suitable for critical applications.

4. Applications

PCM applications exist in which flammability is the final acceptance criteria. This is the case with automotive and building applications. In the automotive industry, in comparison with air cooling and liquid cooling systems, the PCM-based BTMSs have several advantages: they do not require any external energy source, have lower failure risk, are compact, and have good storage capacity, expressed as mass-to-volume ratio. However, some drawbacks that need to be addressed exist: flammability, leakage of the molten phase, volume expansion at phase change, low thermal conductivity, and supercooling.
Li et al. [80] developed a composite PCM based on paraffin with ethyl vinyl acetate grafted with maleic anhydride (EVA-g-MAH)/EG/ML/triphenyl phosphate for EV battery systems. The following preparation procedure was employed: PA and EVA-g-MAH were mixed and heated up in an oil bath at 170 °C until complete melting occurred, and then the mixture was stirred uniformly for 2 h. ML and triphenyl phosphate (TPH) as FRs were added to the solution while stirring was continued. After 2 h of continuous stirring, the porous EG was added to the mixture and stirring was continued for 1 h. At the end of the stirring process, the liquid mixture was poured into different molds for cooling. A total of eight recipes were prepared, as presented in Table 19. The thermo-physical properties relevant to the heat storage functionality are also presented in Table 19.
The flammability of the composite PCM was evaluated by means of UL-94 and the cone calorimetry test. The UL-94 test results and the total duration of the residual flame are presented in Table 20.
The data from the UL-94 test are meaningful in the context of the UL-94 test images, presented in Figure 33.
It can be noticed from Figure 33a that pure paraffin combustion produces a thin layer of liquid combustible material, which drips and continues to burn after 18 s, suggesting that paraffin is highly flammable. In the case of the PEE sample (with 3.5% EG), a carbonization layer on the surface of the composite was formed due to the presence of EG. However, it was still not possible to form a high-density carbonization interface layer during the combustion. The flame retardancy grading of PEE is V2 (poor flame retardant). ML (sample MPCM) sublimate endothermically and releases gases such as nitrogen, water vapor, and carbon dioxide, which inhibit the oxidation reaction (flame). The burning time is reduced in the case of this sample, with 33.3% compared to the sample PEE. In the case of sample MTPCM3, a stable carbonization interface layer can be formed during combustion, isolating the thermal energy and mass exchanges, and inhibiting the flame propagation. The photos of the samples after the cone calorimetry test and the proposed FR mechanism of action are presented in Figure 34.
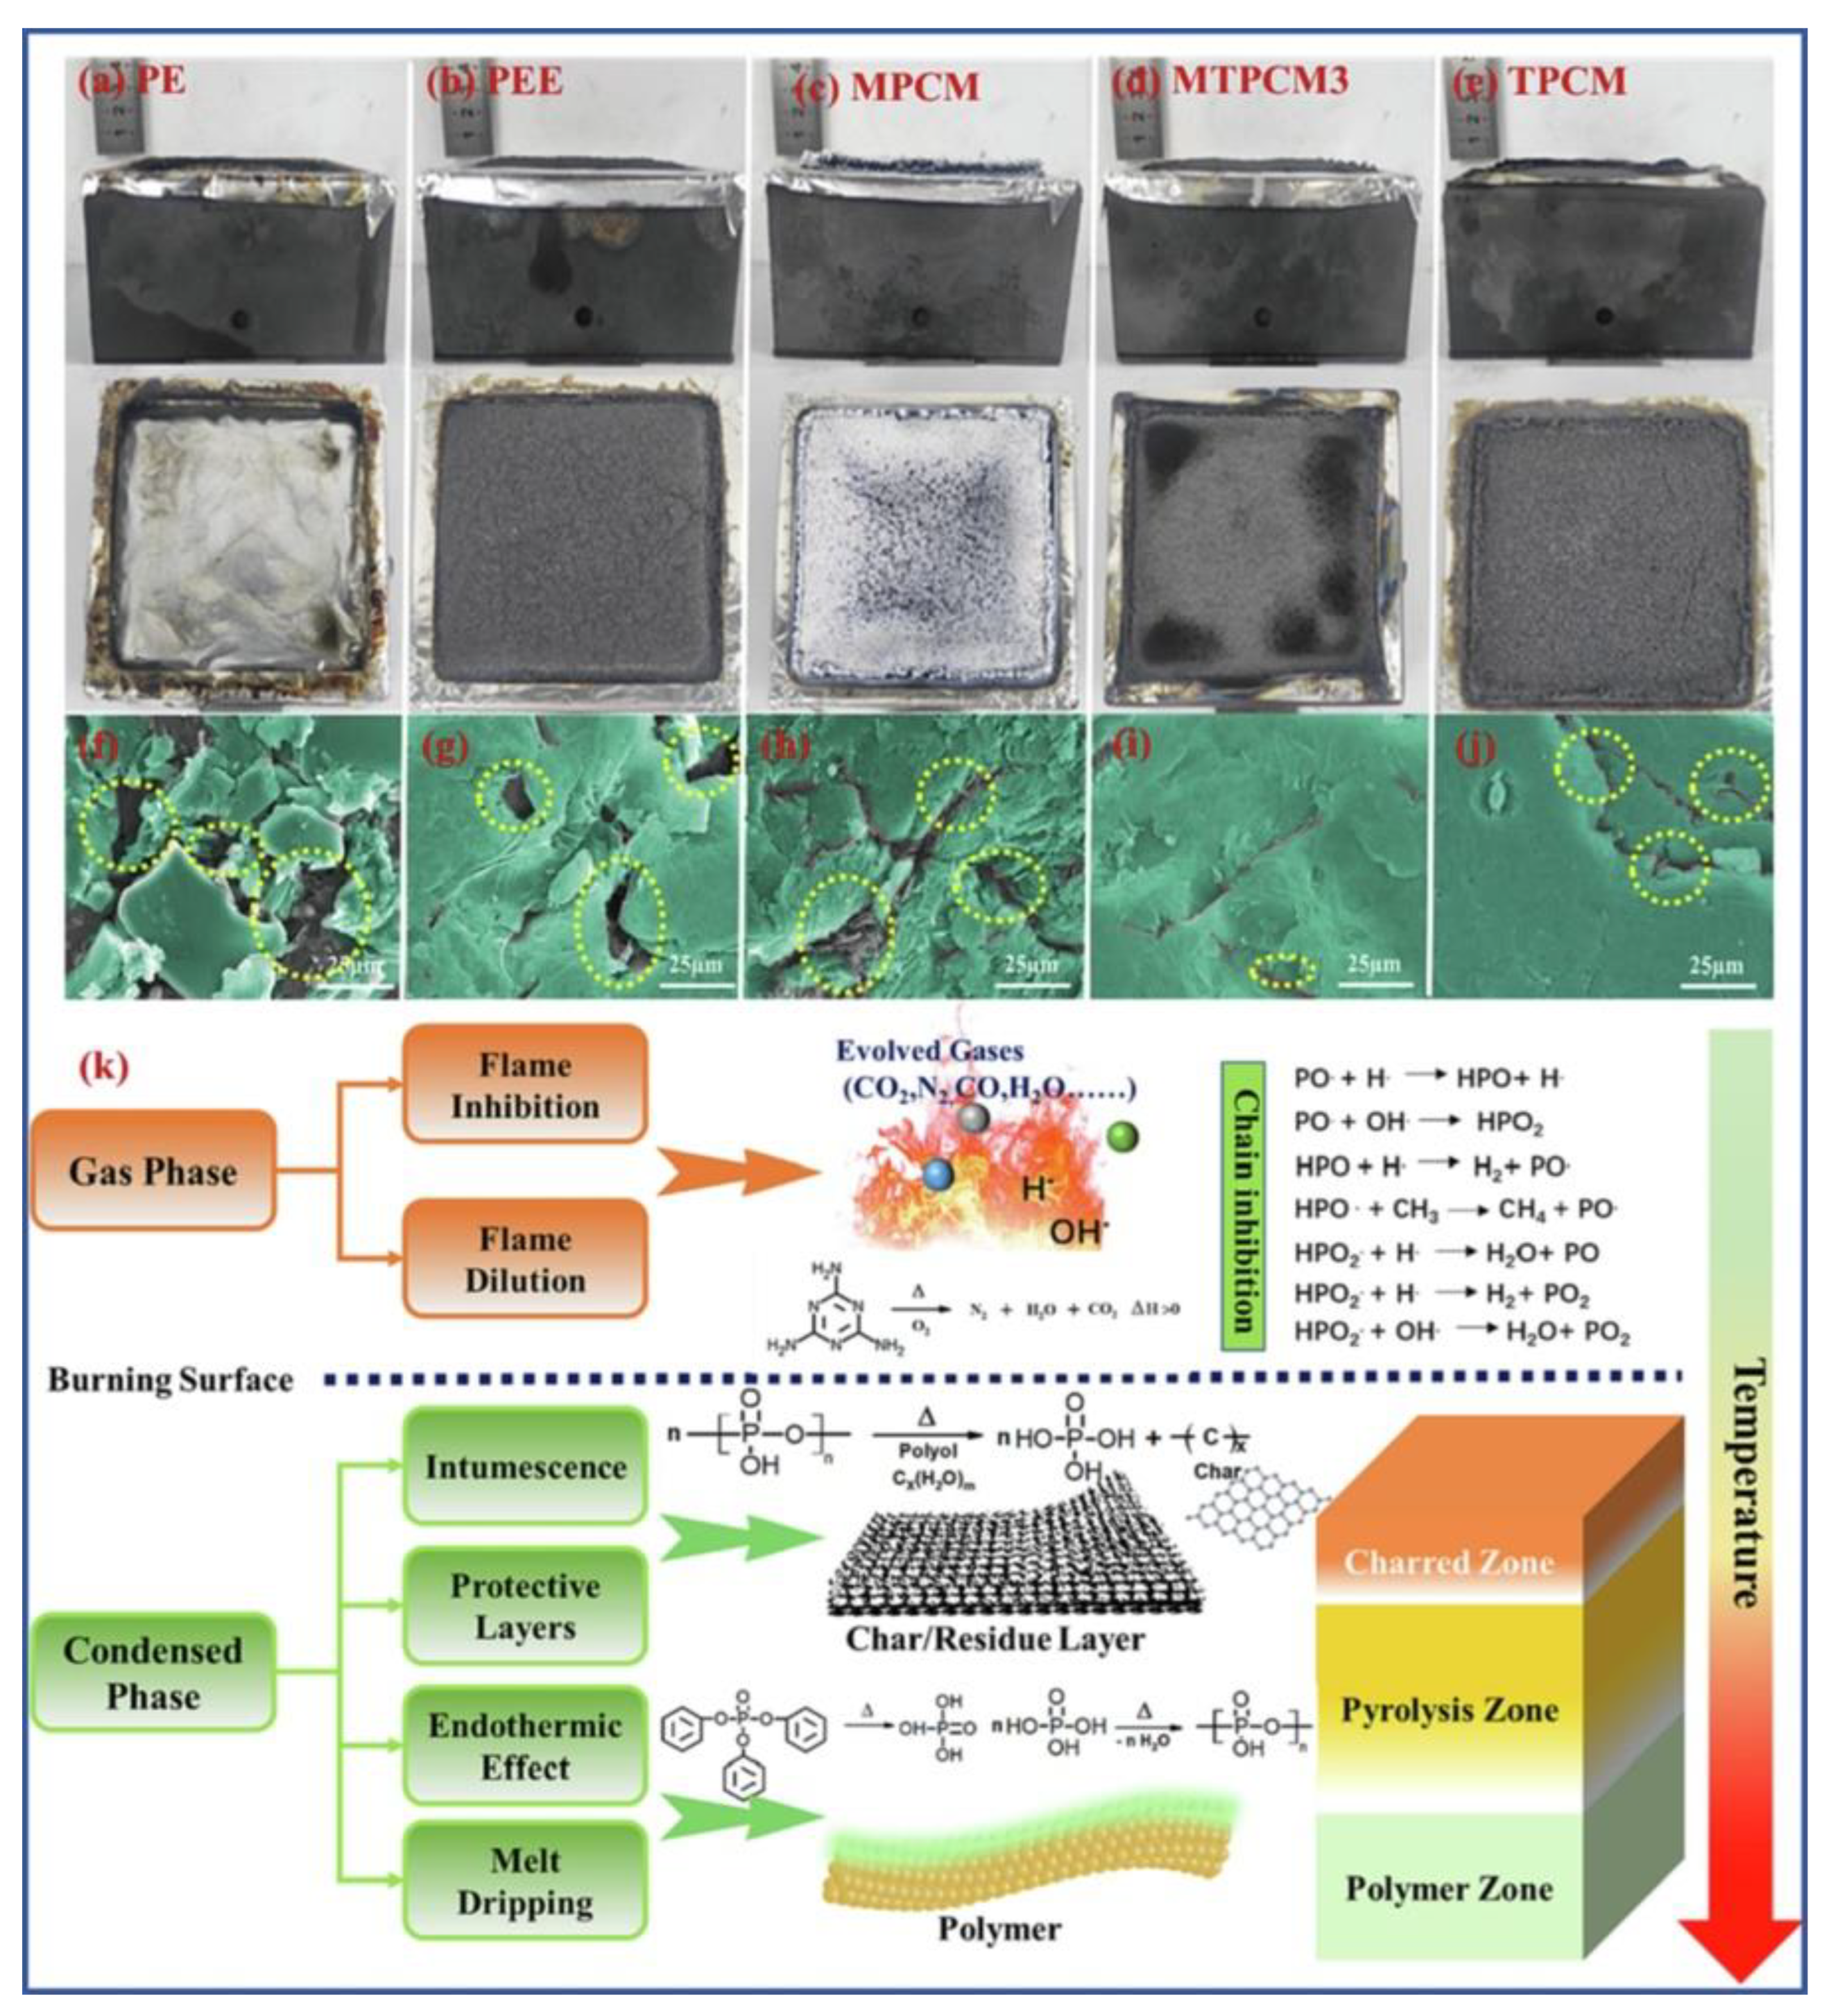
From Figure 34a it can be noticed that the sample PE underwent complete combustion (leaving almost no char residue). The carbon layer surface (Figure 34f) is irregular, with many cracks and cavities (marked with yellow ellipses). Less cracks and fractures can be observed in the case of sample PEE (Figure 34g), but they are still enough to allow the access of oxygen to the combustible material. The effect of ML (Figure 34c,h) blocks, effectively, the access of oxygen at the initial stages of material ignition; however, the carbon layer surface is irregular and porous, which still allows gas diffusion during combustion. The sample with TPP has a regular (Figure 34d,i) surface compared to the previous samples, and a significantly better fire retardancy.
The composite PCMs reaction upon exposure to an open flame and the flame retardancy mechanism are graphically illustrated in Figure 35. For PE, the combustion becomes self-sustained shortly after the exposure to the flame. Once the melting advances, the combustion intensity increases. Upon adding EG and ML, the composite PCM can form a loose carbon layer following the EG combustion. ML thermal degradation generates gaseous flame-retardant components, partially inhibiting the flame. The composite PCM with TPP significantly inhibits the combustion due to the condensed carbon layer, which occurs after decomposition. This layer acts as a thermal barrier and strengthens the carbon layer density. Thus, the oxygen access to the combustible mass is blocked. The sample MTPCM demonstrated the best flame retardancy performance. This was explained by the synergistic effect of the gas and solid phases.
Thermal runaway (TR) in battery packs is an avalanche-type, failure propagation mechanism. It is initiated when a single cell temperature reaches a value at which violent, exothermic chemical reactions occur inside the cell (e.g., due to an internal short-circuit, rapid charging, excessive environment temperature, failure of the cooling systems), which contribute to a further temperature increase. The thermal energy released causes the heating up of the adjacent cells, which will undergo a similar process. Thermal runaway can cause the venting of the battery gases, ejection of cell content, and self-ignition of the cells. The rate of thermal runaway propagation was reported in the range of several hundreds of milliseconds by Thankur et al. [109] and Lamb et al. [110].
Huang et al. [86] proposed a solution to prevent the thermal runaway in battery packs, using paraffin as PCM, SBS as a shape-stabilization material, EG as TCE, and a commercial flame retardant (consisting of APP, phosphoric acid, and ZnO with the mass fractions 0.5/0.45/0.05). Six types of samples, with their components and mass fraction listed in Table 21, were prepared.
The composite PCM was prepared in a multi-stage process as follows: Paraffin particles were melted at 150 °C and SBS was added with continuous stirring. EG was gradually added upon complete mixing of paraffin and SBS. In the last stage, the FR was added to the mixture and, after further stirring, the composite PCM was poured into an acrylic mold. LOI, UL-94, and cone calorimetry were employed to evaluate the flammability of the composite PCMs (with the results presented in Table 16). The LOI test results for PS and PSE are below the flammability threshold (21%), suggesting a high flammability for these two samples. Adding EG, a carbonization layer on the surface of the composite PCM occurs, with a limited flame retardancy effect. As the FR percentage increased, the LOI value improved significantly. At the FR content 15 wt%, the LOI value was 35.9% and the UL-94 grading was V0. This was attributed to the presence of a high-density carbonization interface layer, formed by the piperazine pyrophosphate and phosphoric acid. The formation of a carbonization layer, which created a barrier for oxygen and heat, and the bridging bond of phosphate compounds were favored by the presence of ZnO. At the FR content of 20 wt%, the LOI value dropped to approximately 24%, suggesting that an optimum FR content exists for which the best flame retardancy effect could be obtained. The photos of the samples taken during the UL-94 and specific curves from the cone calorimetry are presented in Figure 36.
Thermal runaway occurs most frequently at the center (due to accumulation of heat) and edge (mechanical extrusion caused by external forces) of a battery module. In Figure 37, the temperature variation in various cells is represented, selecting the heating element no. 10 as a triggering object for simulating the thermal runaway (central stimulation).
The temperature variation in various cells is also represented in Figure 38; the heating element no. 1 was used as a triggering object for simulating the thermal runaway (edge stimulation).
Upon triggering the TR in the element no. 10 (central stimulation), the rods 9, 6, and 5 underwent a significant temperature increase. The elements no. 9 and no. 6 reached a temperature value above 100 °C in 1800 s, suggesting that the two battery cells underwent major damage. It can be observed that the temperature curve of no. 2 and no. 4 heating elements started roughly at the same time, and the area where heat was concentrated could be maintained within the radius of step I. This suggests that PEF15 was capable of absorbing the thermal energy from the heating element. It was reported that the TR propagation was faster than the TR triggered at the edge (Figure 38).
Cui et al. [111] developed composite PCMs for the thermal management of lithium-ion batteries using APP, carbon forming agent (CFA), and kaolinite as flame retardants. EG was used as TCE, and the PCM was paraffin with an MP of 46 °C and LH 210 J/g. It was reported that (i) the combined use of kaolinite significantly increased the LOI value, and (ii) the addition of 10% FR caused the increase in the residual carbon content from 2.3% to 11.8%.
Weng et al. [112] developed a tubular composite PCM structure with flame-retardant-modified PCMs, designed to prevent the TR in battery systems, with Al(OH)3 as FR. The preparation of the flame-retardant composite PCMs (with three different mass proportions of FR) followed a simple process, consisting of mixing the following components: (1) 1,6-hexanediol diacrylate (HDDA); (2) benzoyl peroxide (BPO); and (3) octadecyl acrylate (OA). The resulting solution was maintained at the temperature of 50 °C in an oil bath, and EG with the mass proportion 3% was added. Then, Al(OH)3 with the mass fraction 0, 10, and 15% was added with continuous stirring. The corresponding composite PCMs were denoted as CPCM0, CPCM10, and CPCM15. The recipes of the CPCM0, 10, and 15 are detailed in Table 22.
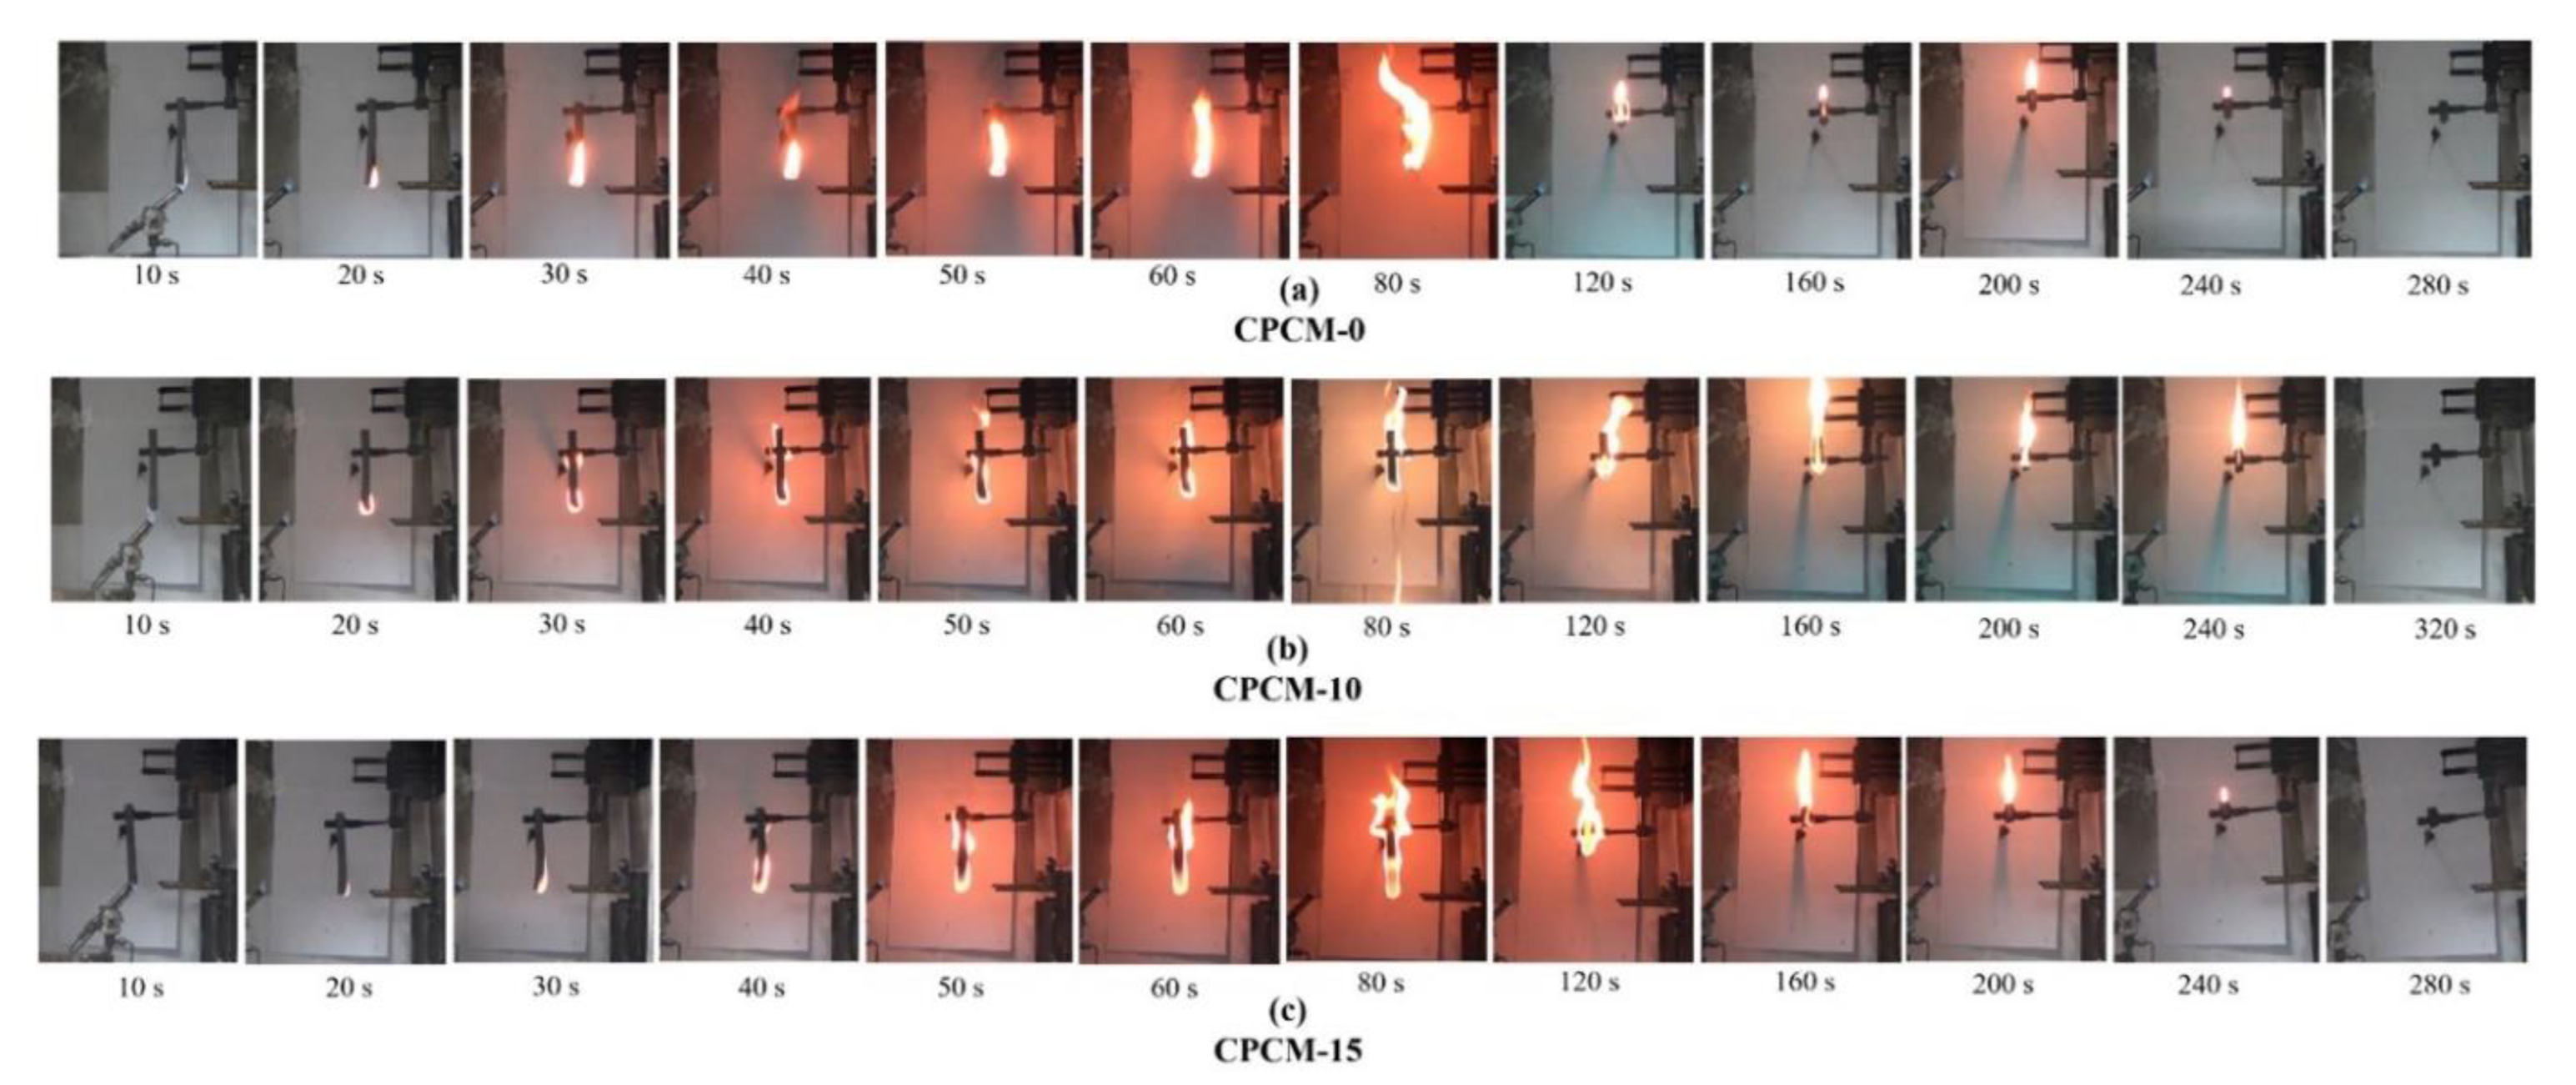
A specific problem with the TR effect in battery cell packs is the avalanche propagation. To investigate the effect of the newly developed PCM in the mitigation of the avalanche effect, a simulation with four cells was carried out. The temperature variation in three battery cells, while the fourth underwent TR, is presented in Figure 39. It can be noticed that the TR times of all cells were delayed in the case of battery packs with composite PCMs. The flame retardancy properties of the PCMs were assessed by means of UL-94 and cone calorimetry. The photos of the UL-94 test are presented in Figure 40.
In the UL-94 test, none of the three samples showed self-extinguishing capabilities, as can be observed in Figure 40. Although some differences exist in the length of the combustion time and in the flame intensity, no UL-94 grading could be attributed to this.
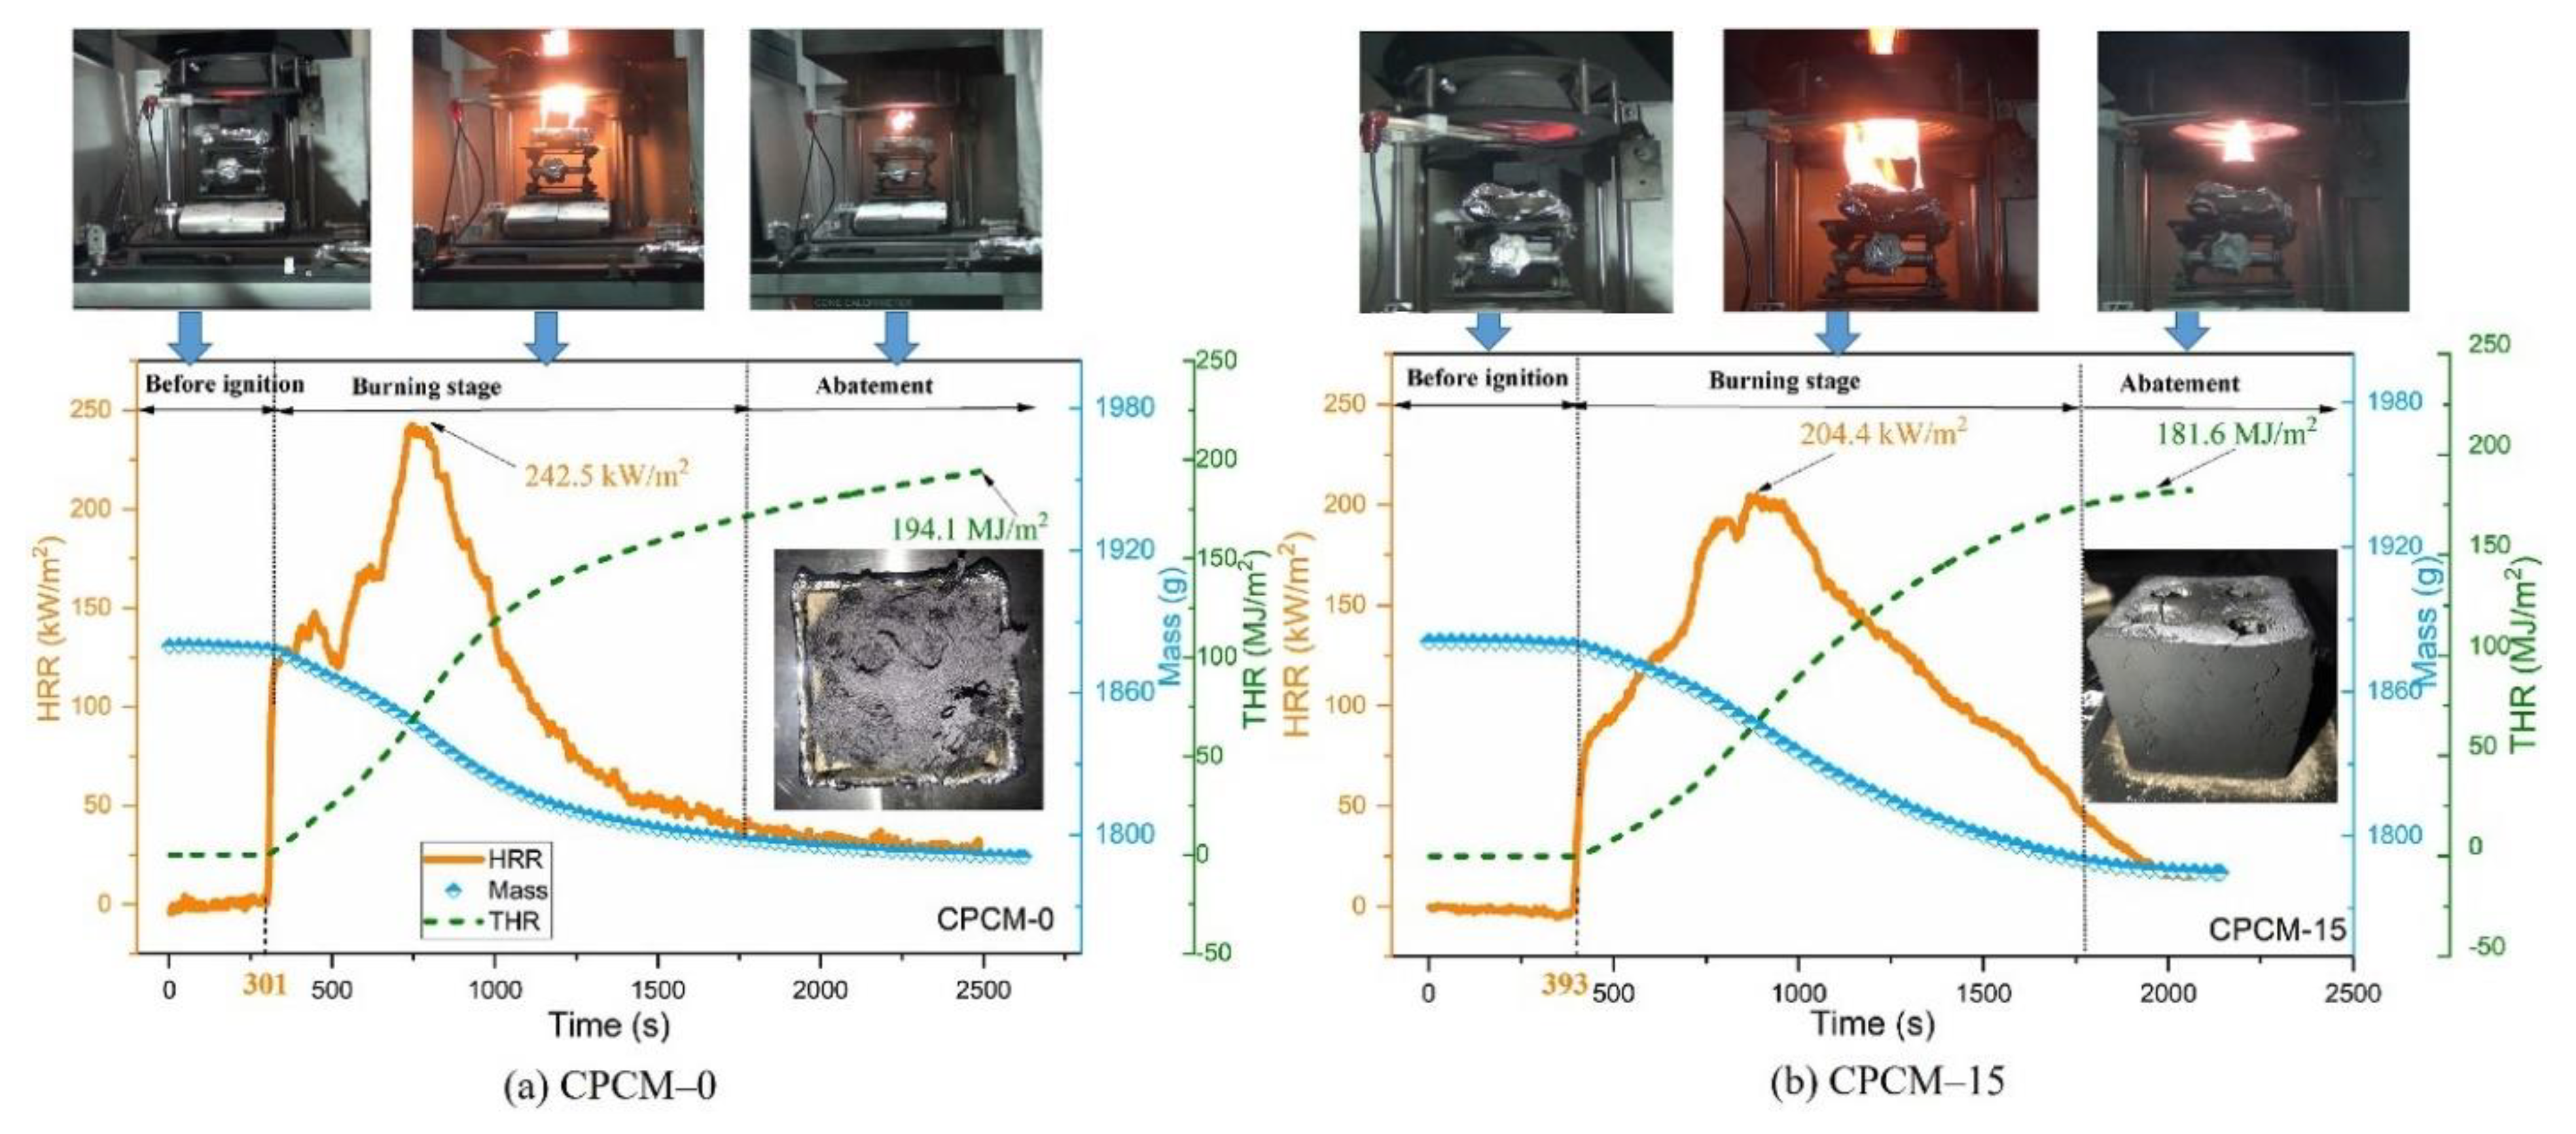
The cone calorimetry test results are presented in Figure 41. Visual analysis reveals differences in the appearance of the char residue. The CPCM0 residue has the appearance of a loose sand whereas CPCM15 preserves the original shape of the test specimen. The FR additive significantly increased the time to ignition: for the sample CPCM15, it was 393 s, with 92 s more than that of CPCM0. The PHRR value improved as well, from 242 kW/m2 to 204 kW/m2. The THR values of CPCM0 and CPCM15 were approximately 194 and 181 MJ/m2, respectively. This difference was explained by the fact that Al(OH)3 reduced the combustible components mass fraction.
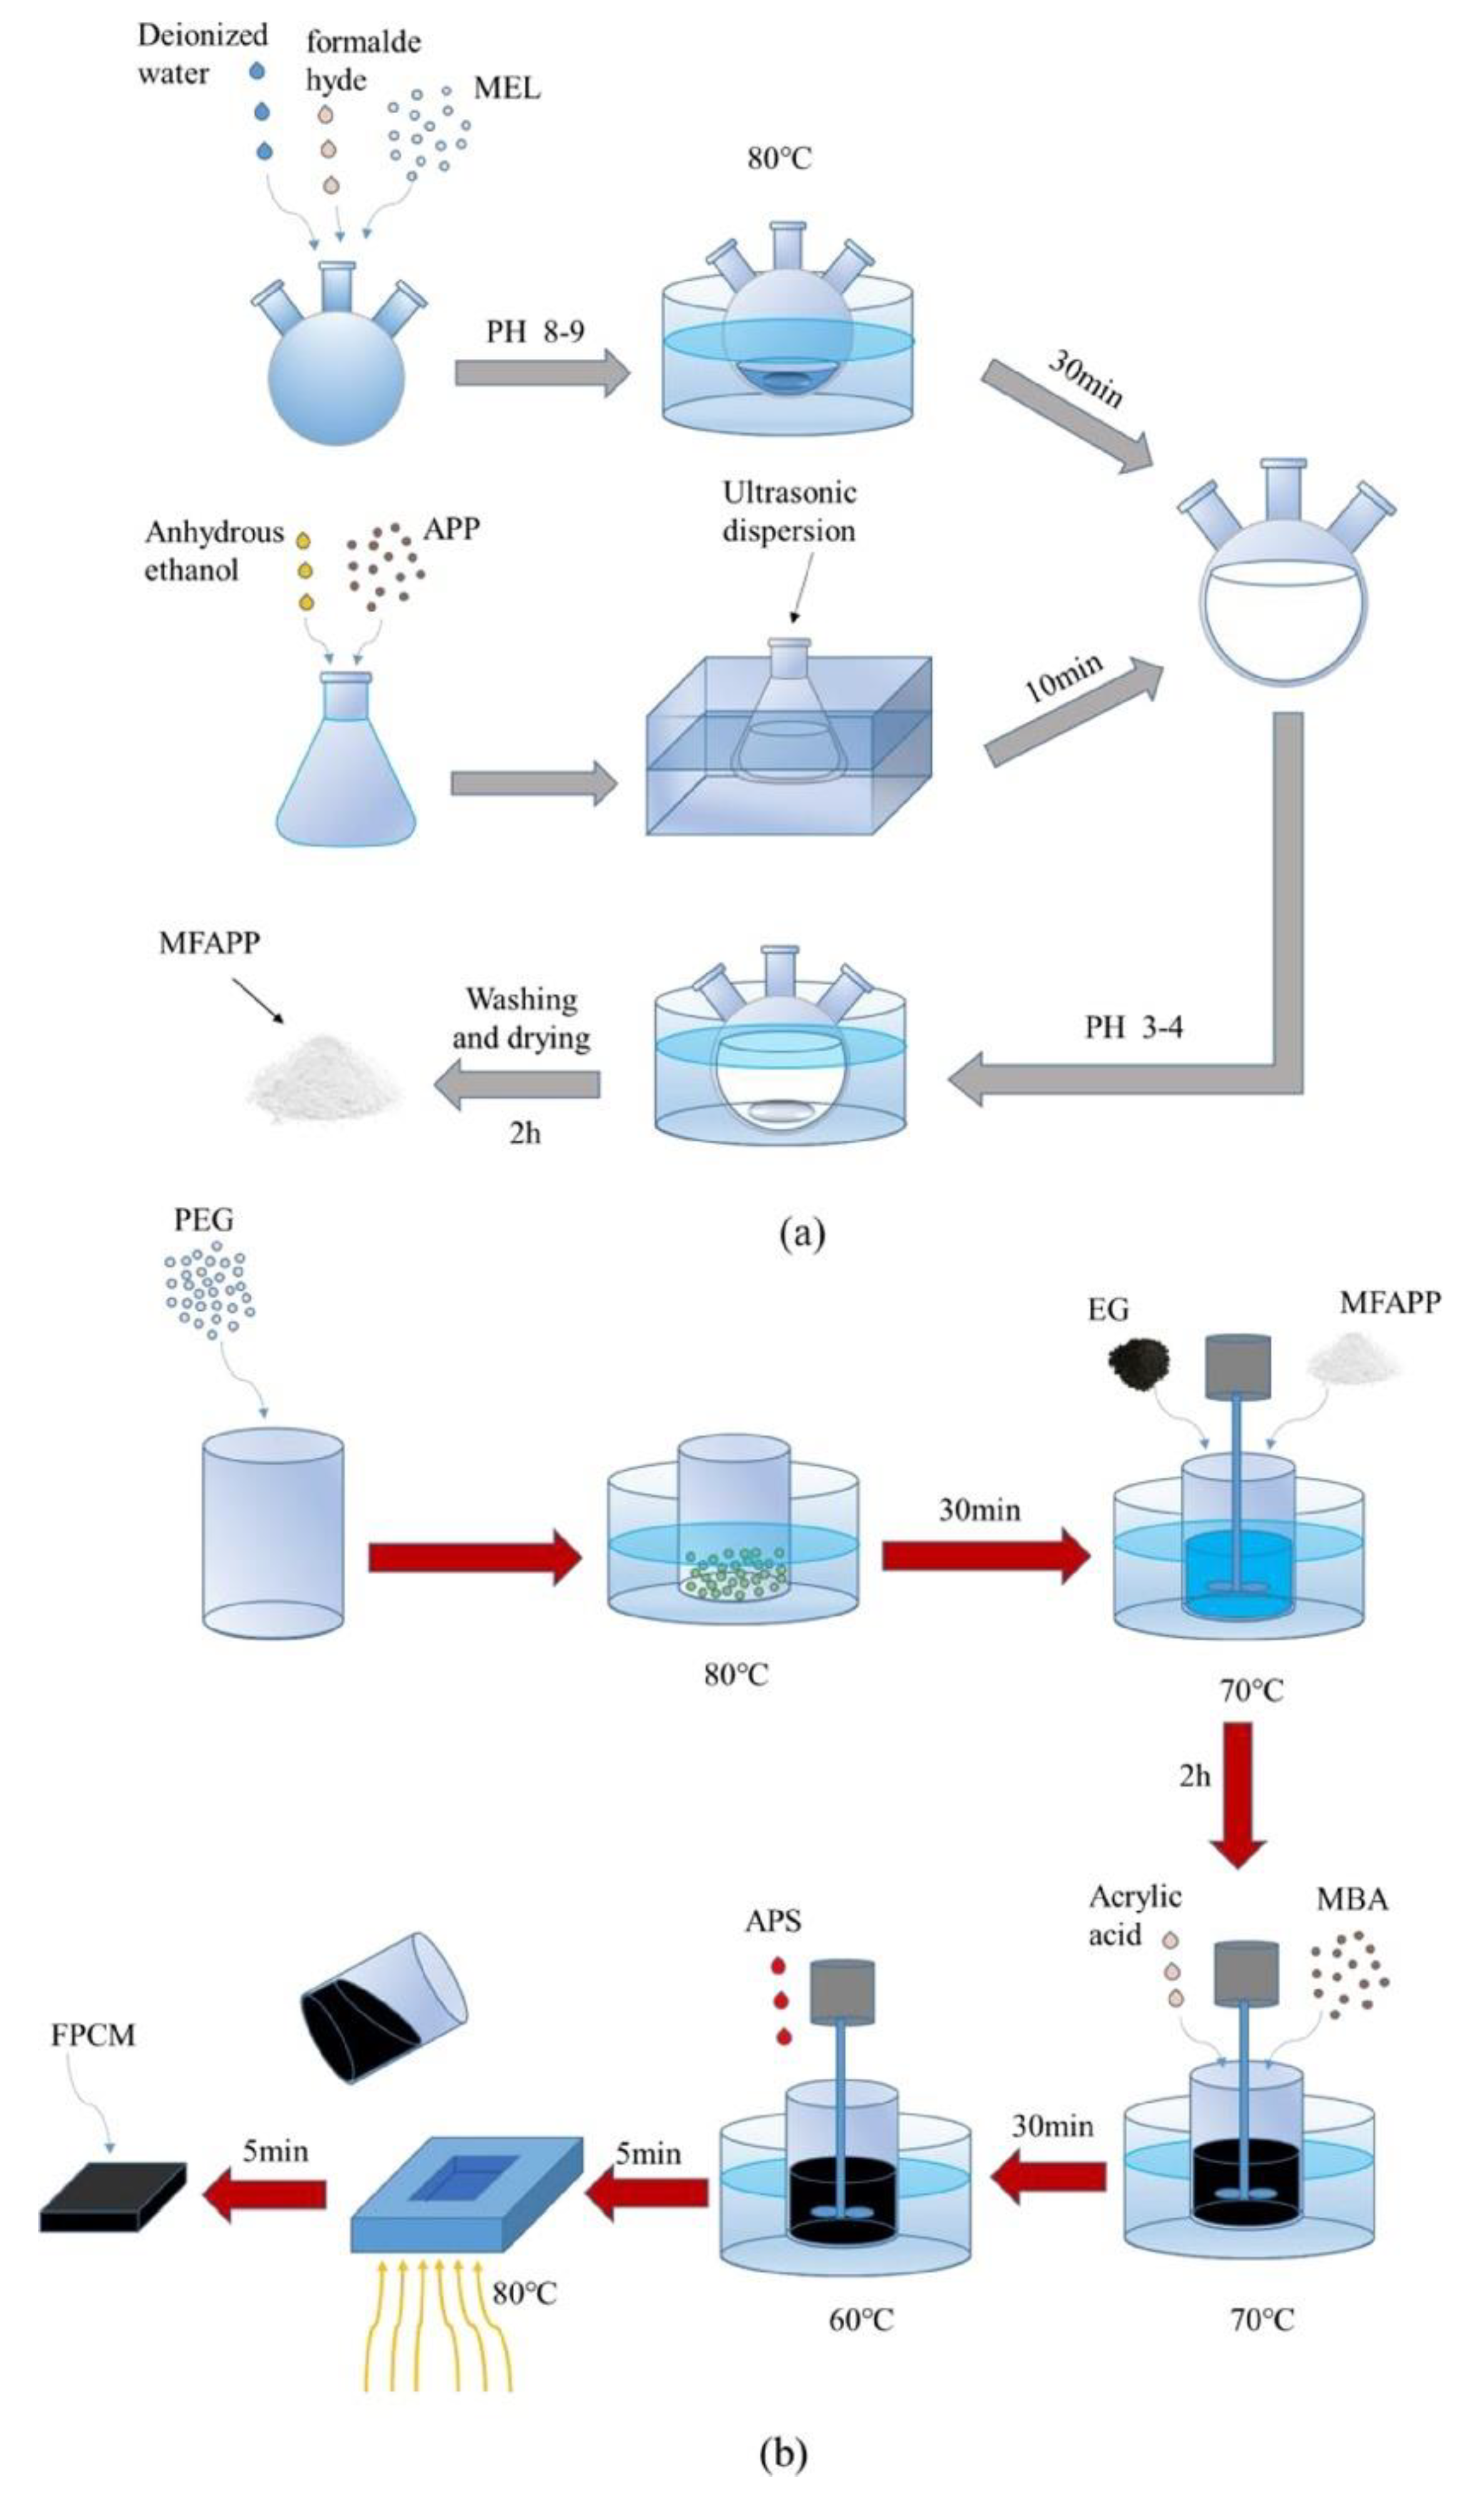
Xu et al. [113] developed an FR for a solid–solid PCM-based BTMS using PEG as the PCM and a cross-linking agent, N , N -Methylenebisacrylamide (MBA). The preparation process consisted of several stages, as follows: (a) FR modification; (b) preparation of the pre-polymer; (c) preparation of the microcapsule-coated ammonium polyphosphate (MFAPP) powder; (d) preparation of the composite FR PCM. The whole process is illustrated schematically in Figure 42.
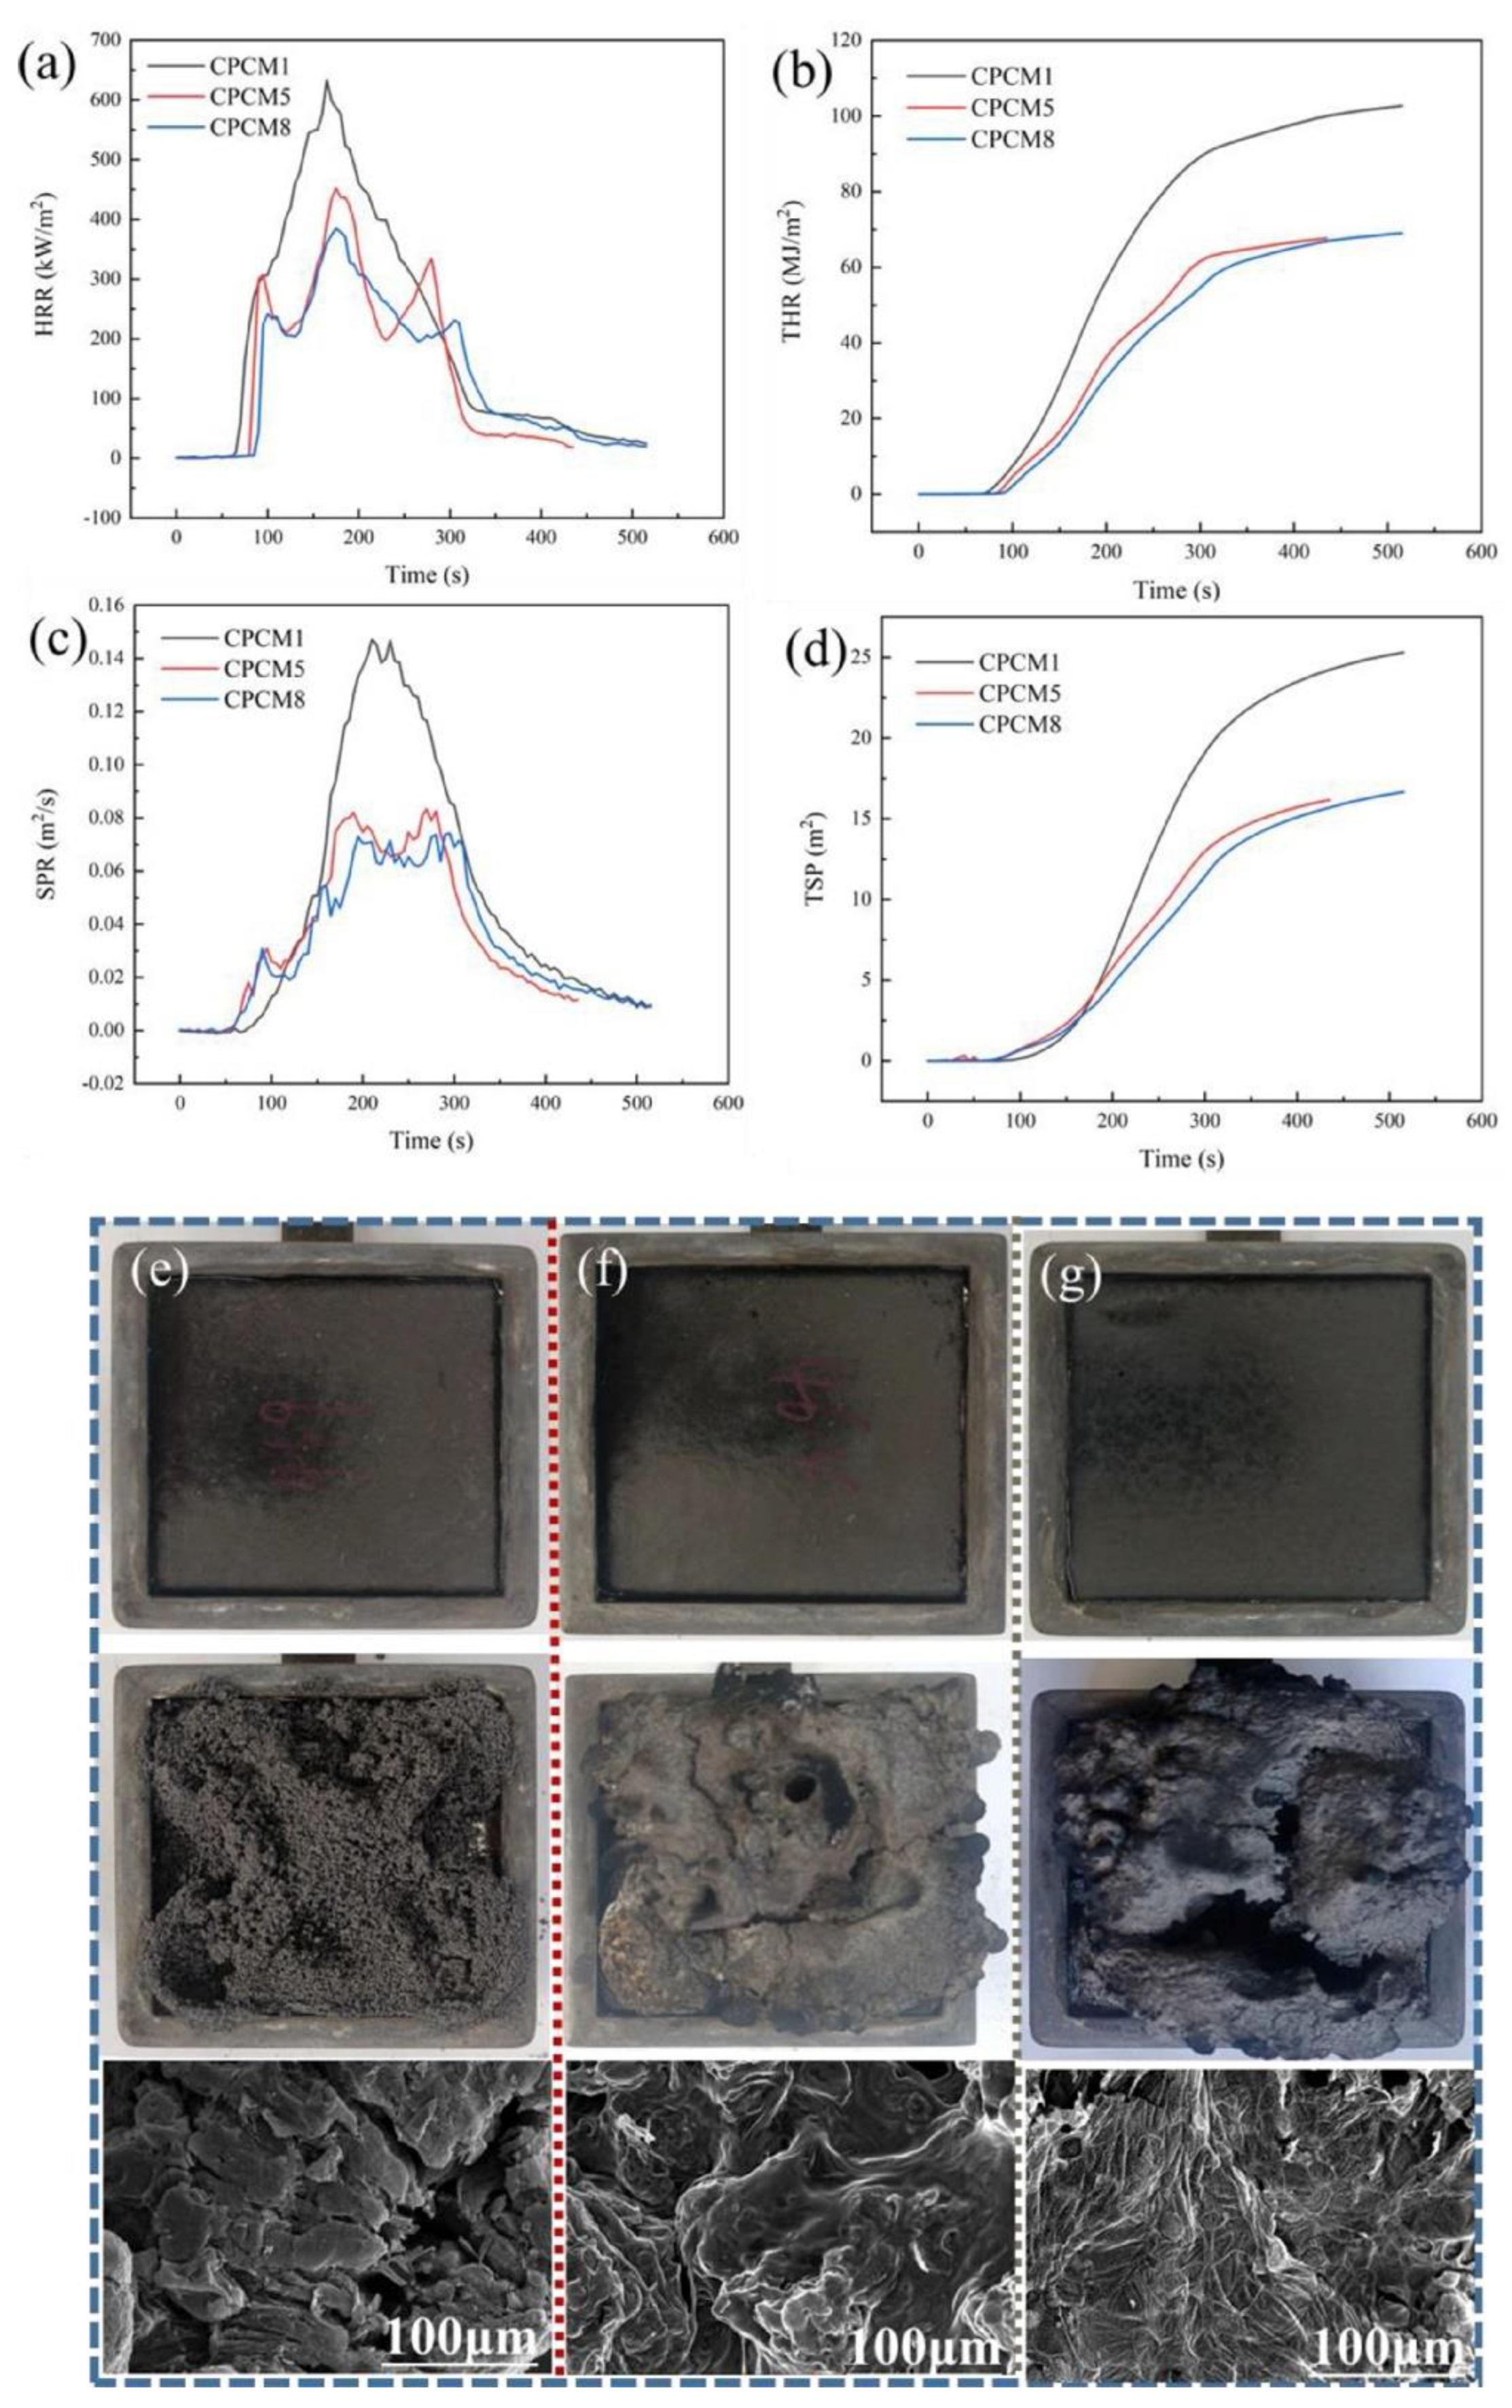
Nine sample types were prepared, varying the MFAPP and EG content as presented in Table 23. The values of LOI and the UL-94 grading are also detailed in Table 23. It was reported that in the absence of FR (samples CPCM-0 and CPCM-1), the material was flammable. The LOI value increased rapidly with the MFAPP content.
This study is among the few that consider the influence of the FR on the thermo-physical PCM properties with relevance to its main purpose, that is, heat storage. The phase transition temperature range and the LH were evaluated by means of DSC calorimetry and TGA. Thermal conductivity (which is a critical thermo-physical property for battery thermal control systems) and leakage characteristics were also assessed and are presented in Figure 43.
In the absence of MFAPP and EG, the LH was approximately 135 J/g and the phase change temperature range was 40–65 °C. Adding EG and MFAPP, the latent heat decreased rapidly, reaching 69.31 J/g at an MFAPP content of 25%. The phase transition temperature range was slightly shifted to the left (in the sense of decreasing) as MFAPP was added. The TC increased significantly with the addition of EG, and it was not significantly influenced by the MFAPP content. The TGA curve for CPCM0 (w/o MFAPP) shows that the pyrolysis temperature is between 400 and 500 °C with almost zero residual carbon. It was reported that the pyrolysis temperature decreased significantly (in the range 350–400 °C). At the same time, the residual carbon increased significantly (approximately 20% or more), indicating that the carbonization ability increased when MFAPP was added. In fact, the carbon layer acts as an FR, preventing the thermal energy and substance exchange between the combustible material and the environment.
Cone calorimetry test results and photos are presented in Figure 44. The ignition times reported in [110] for CPCM-1, CPCM-5, and CPCM-8 were 65 s, 85 s, and 89 s. The cone calorimetry curves presented in Figure 44a–d demonstrate the significant fire retardance capability of samples containing MFAPP.
An important application area for PCMs is in the building industry. The main objectives of integrating PCMs in building elements are to improve the indoor thermal comfort and mitigate the heating/cooling energy demand. The building applications of PCMs were reviewed by Sharshir et al. [4], and Gao and Meng [24]. Organic PCM-enhanced building elements pose a significant fire risk even though they are incorporated in non-flammable support materials, such as cement, gypsum, or aggregates. Such materials must pass flammability certifications to qualify as components of construction materials. Haurie et al. [114] investigated the fire behavior of a mortar type with a commercial PCM. Fine sand as an aggregate, water, and Portland cement with limestone were used to prepare the mortar samples. The PCM used in this experimental study was granulated GR27 (a composite with PCM bound by a clayey matrix, presenting as granules with a size between 1 and 3 mm, with the MP being approximately 27 °C). Three mortar samples with cement/aggregate/PCM mass (in grams) 343/1393/0, 283/972/144 and 310/809/378, respectively, were prepared, corresponding to PCM percentages 0, 10, and 25%. Test specimens with the dimensions 150 mm × 100 mm × 45 mm were fabricated. The leakage and flammability characteristics of the samples were estimated by means of the Dripping test [115] (details on the procedure in the standard UNE 23725-90). Mortar samples with 10% and 25% PCM had a similar TTI value (38 s). TTI indicates the moment of the first ignition after the contact of the heat source with the samples. The average combustion time values were 5 s and 13 s for the samples with PCM percentages of 10% and 25%, respectively. The PHRR values obtained during the cone calorimetry test were 190, 50, and 20 W/g for the PCM and the samples with PCM contents of 25% and 10%, respectively.
The applications for PCM-enhanced textiles were discussed in Section 3 and they will not be repeated.
Although a considerable number of research studies exist that discuss the methods for achieving flame retardancy for PCMs (as presented in Section 3), only three application directions were identified, as presented in Section 4: battery systems for electrical vehicles, building applications, and flame-retardant, PCM-enhanced textiles. These technology areas have strict regulations regarding the fire risk, and, on the other hand, offer a large potential for passive thermal control applications with PCMs.

5. Conclusions

Flame retardancy certification is a critical requirement in some applications where thermal control is achieved through organic PCMs. Although many organic PCMs present fire risks to variable extents, flame-retardance strategies exist that are capable of mitigating the flammability of pure organic PCMs. Most techniques combine shape-stabilization methods with flame-retardance additives, obtaining, in a single process, a shape-stabilized PCM with a flame-retardance capacity. The highest flame-retardance efficiency is achieved in the case of halogenated FRs, which have the major drawback of a critical environmental impact (ozone layer depletion). As a result, such FRs were phased out during the last decades. Halogenated FRs were replaced by IFRs, which are less effective than their halogenated counterparts but have low environmental impact and cost. In combination with synergistic additives (e.g., metallic Cu powder), the IFRs efficiency can be considerably increased. Several experimental studies investigating the effect of synergistic additives were identified and discussed. The synergistic mechanism is, in general, attributed to the additive catalytic role in the FRs decomposition and crosslinking. Chemically-modified PCMs were recently developed, aiming to circumvent the long-term stability issue of FR PCMs synthesized by physical FR integration. Reports indicate that this new strategy has better results in terms of flame retardancy properties than physical integration. Another method to achieve flame retardancy properties is surface coating. The research articles discussing surface coating included in this review study report significant positive results in terms of flame retardancy.
However, the chemical and physical integrity of the protective layer are a major concern of this method. Several studies converge in one idea: when combining two or more strategies, i.e., physical integration with surface coating, a significantly higher flame retardancy can be achieved.
Given the diversity of organic PCMs and PCMs applications, no universally valid flame retardancy solution exists. A number of critical factors were identified, which determine the choice of the flame retardancy method:
  • PCM containment method;
  • PCM nature;
  • PCM application;
  • Flame retardancy performance required by the application;
  • Economic, environmental, and lifecycle considerations.
Some major concerns insufficiently investigated or discussed in the literature were identified:
  • The FR stability and flame retardancy capability in the long-term. This issue deserves special attention since the degradation of the FR capability cannot be assessed once the PCM application is in service. Case studies investigated after long-term operation and many thermal cycles could provide key information in this regard. Two separate points must be included: long-term degradation/preservation of the fire-retardance capability; long-term degradation/preservation of the composite PCM thermo-physical properties.
  • Degradation/alteration of the thermo-physical parameters relevant to the purpose of the PCM—heat storage. Any additive will definitely result in a decrease in the latent heat, since a PCM fraction is replaced by an equivalent amount of another material with a lower specific heat. Few studies (e.g., [113]) were identified discussing quantitatively the effect of FR additives on the MP, LH, and thermal conductivity. The studies discussing such issues converge in the conclusion that FR additives result in a degradation of the heat storage capacity, and a small alteration in the melting point.
  • Scaling-up. Although many different laboratory-scale preparation methods were described in the literature, no discussion was identified on the upscaling of the processes. Either the integration into existing preparation processes or the development of new processes with FR integration phases would provide an interesting and useful discussion.
  • The majority of the flammability assessments employ standard tests, such as LOI, vertical/horizontal burning tests, and most frequently the cone calorimetry test. However, it would be more interesting to evaluate quantitatively the flammability characteristics of the PCM integrated in the applications. It can be argued that the flammability test results could be more precise, reliable, and statistically significant if the tests were to be repeated under identical conditions, multiple times. No reports were identified mentioning multiple repetitions or statistical error margins for the results reported.
  • Lifecycle analysis and circular economy integration are issues discussed scarcely in the analyzed references. The toxicity hazard is another matter of concern that is not addressed properly.

Author Contributions

Conceptualization, B.D.; methodology, B.D.; formal analysis, B.D.; investigation, B.D.; resources, L.A. and M.C.; data curation, L.A. and M.C.; writing—original draft preparation, L.A. and M.C.; writing—review and editing, L.A. and M.C.; supervision, B.D.; All authors have read and agreed to the published version of the manuscript.

Funding

This research received no external funding.

Institutional Review Board Statement

Not applicable.

Informed Consent Statement

Not applicable.

Data Availability Statement

Not applicable.

Conflicts of Interest

The authors declare no conflict of interest.

Nomenclature

APPAmmonium polyphosphatePAPhosphoric Acid
BPODibenzoyl peroxidePCPhosphorus Cellulose
BPODPhenyl phosphonic dichloridePEGPolyethylene Glycol
BTMSBattery Thermal Management SystemPEOPolyethylene oxide
CACapric AcidPEPAPentaerythritol phosphate
DSCDifferential Scanning CalorimetryPERPentaerythritol
EDSEnergy Dispersive SpectroscopePHRRPeak Heat Release Rate (cone calorimetry parameter)
EGExpanded GraphitePMPalmitic Acid
EGPExpanded Graphite PlatesPMMAPoly- Methyl Methacrylate
EPEpoxy ResinPNPhosphorus-Nitrogen
FRFlame RetardantPPPolypropylene
FPFlash PointPUPolyurethane
FT-IRInfrared Fourier-Transform SpectroscopyRPRed Phosphorus
LHLatent HeatSBSStyrene-butadiene-styrene
HDPEHigh Density PolyethyleneSSShape Stabilization
HNTHalloysite NanotubesTBBP-ATetra bromo-bisphenol-A
HRRHeat Release RateTCThermal Conductivity
IFRIntumescent Flame RetardantTCEThermal Conductivity Enhancer
IRInfraredTEMTransmission Electron Microscope
MAMyristic AcidTGAThermo-gravimetric analysis
MLMelamineTHRTotal Heat Release (cone calorimetry parameter)
MLRMass Loss Rate (cone calorimetry parameter)TPHTriphenyl phosphate
MFMelamine FoamTPPThermal Protective Performance
MMTMontmorilloniteTRThermal runaway
MSDSMaterial Safety DatasheetTSPTotal Smoke Production (cone calorimetry parameter)
OMMTOrgano-montmorilloniteTTITime to Ignition (cone calorimetry parameter)

References

  1. Wang, F.; Pang, D.; Liu, X.; Liu, M.; Du, W.; Zhang, Y.; Cheng, X. Progress in application of phase-change materials to cooling clothing. J. Energy Storage 2023, 60, 106606. [Google Scholar] [CrossRef]
  2. Mehrizi, A.A.; Karimi-Maleh, H.; Naddafi, M.; Karimi, F. Application of bio-based phase change materials for effective heat management. J. Energy Storage 2023, 61, 106859. [Google Scholar] [CrossRef]
  3. Meng, B.; Zhang, X.; Hua, W.; Liu, L.; Ma, K. Development and application of phase change material in fresh e-commerce cold chain logistics: A review. J. Energy Storage 2022, 55, 105373. [Google Scholar] [CrossRef]
  4. Sharshir, S.W.; Joseph, A.; Elsharkawy, M.; Hamada, M.A.; Kandeal, A.; Elkadeem, M.R.; Thakur, A.K.; Ma, Y.; Moustapha, M.E.; Rashad, M.; et al. Thermal energy storage using phase change materials in building applications: A review of the recent development. Energy Build. 2023, 285, 112908. [Google Scholar] [CrossRef]
  5. Yu, Z.; Zhang, J.; Pan, W. A review of battery thermal management systems about heat pipe and phase change materials. J. Energy Storage 2023, 62, 106827. [Google Scholar] [CrossRef]
  6. Gu, H.; Chen, Y.; Yao, X.; Huang, L.; Zou, D. Review on heat pump (HP) coupled with phase change material (PCM) for thermal energy storage. Chem. Eng. J. 2023, 455, 140701. [Google Scholar] [CrossRef]
  7. Sikiru, S.; Oladosu, T.L.; Amosa, T.I.; Kolawole, S.Y.; Soleimani, H. Recent advances and impact of phase change materials on solar energy: A comprehensive review. J. Energy Storage 2022, 53, 105200. [Google Scholar] [CrossRef]
  8. Chinnasamy, V.; Heo, J.; Jung, S.; Lee, H.; Cho, H. Shape stabilized phase change materials based on different support structures for thermal energy storage applications–A review. Energy 2023, 262, 125463. [Google Scholar] [CrossRef]
  9. Ghosh, D.; Ghose, J.; Datta, P.; Kumari, P.; Paul, S. Strategies for phase change material application in latent heat thermal energy storage enhancement: Status and prospect. J. Energy Storage 2022, 53, 105179. [Google Scholar] [CrossRef]
  10. Kumar, R.; Pandey, A.; Samykano, M.; Aljafari, B.; Ma, Z.; Bhattacharyya, S.; Goel, V.; Ali, I.; Kothari, R.; Tyagi, V. Phase change materials integrated solar desalination system: An innovative approach for sustainable and clean water production and storage. Renew. Sustain. Energy Rev. 2022, 165, 112611. [Google Scholar] [CrossRef]
  11. Panchal, J.M.; Modi, K.V.; Patel, V.J. Development in multiple-phase change materials cascaded low-grade thermal energy storage applications: A review. Clean. Eng. Technol. 2022, 8, 100465. [Google Scholar] [CrossRef]
  12. Xiao, Y.; Huang, P.; Wei, G.; Cui, L.; Xu, C.; Du, X. State-of-the-art review on performance enhancement of photovoltaic/thermal system integrated with phase change materials. J. Energy Storage 2022, 56, 106073. [Google Scholar] [CrossRef]
  13. Sharma, A.; Tyagi, V.V.; Chen, C.R.; Buddhi, D. Review on thermal energy storage with phase change materials and applications. Renew. Sustain. Energy Rev. 2009, 13, 318–345. [Google Scholar] [CrossRef]
  14. Diaconu, B.M.; Cruceru, M.; Anghelescu, L. Phase Change Materials—Applications and Systems Designs: A Literature Review. Designs 2022, 6, 117. [Google Scholar] [CrossRef]
  15. Radouane, N. A Comprehensive Review of Composite Phase Change Materials (cPCMs) for Thermal Management Applications, Including Manufacturing Processes, Performance, and Applications. Energies 2022, 15, 8271. [Google Scholar] [CrossRef]
  16. Kotzé, J.P.; von Backström, T.; Erens, P.J. High Temperature Thermal Energy Storage Utilizing Metallic Phase Change Materials and Metallic Heat Transfer Fluids. J. Sol. Energy Eng. 2013, 135, 035001. [Google Scholar] [CrossRef]
  17. Cabeza, L.F.; Castell, A.; Barreneche, C.; De Gracia, A.; Fernández, A.I. Materials used as PCM in thermal energy storage in buildings: A review. Renew. Sustain. Energy Rev. 2011, 15, 1675–1695. [Google Scholar] [CrossRef]
  18. Liu, Q.; Zhang, J.; Liu, J.; Sun, W.; Xu, H.; Liu, C. Self-healed inorganic phase change materials for thermal energy harvesting and management. Appl. Therm. Eng. 2023, 219, 119423. [Google Scholar] [CrossRef]
  19. Li, C.; Li, Q.; Ge, R. A review of heat transfer performance enhancement and applications of inorganic salt based shape-stabilized composite phase change materials for medium and high temperature thermal energy storage. Energy Rep. 2022, 8, 12740–12764. [Google Scholar] [CrossRef]
  20. Singh, P.; Sharma, R.; Ansu, A.; Goyal, R.; Sarı, A.; Tyagi, V. A comprehensive review on development of eutectic organic phase change materials and their composites for low and medium range thermal energy storage applications. Sol. Energy Mater. Sol. Cells 2021, 223, 110955. [Google Scholar] [CrossRef]
  21. Huang, J.; Lu, S.; Kong, X.; Liu, S.; Li, Y. Form-Stable Phase Change Materials Based on Eutectic Mixture of Tetradecanol and Fatty Acids for Building Energy Storage: Preparation and Performance Analysis. Materials 2013, 6, 4758–4775. [Google Scholar] [CrossRef] [PubMed]
  22. Png, Z.M.; Soo, X.Y.D.; Chua, M.H.; Ong, P.J.; Suwardi, A.; Tan, C.K.I.; Xu, J.; Zhu, Q. Strategies to reduce the flammability of organic phase change Materials: A review. Sol. Energy 2021, 231, 115–128. [Google Scholar] [CrossRef]
  23. Bartkowiak, G.; Marszałek, A.; Dąbrowska, A. Thermal Load of Mine Rescuer in the Underwear and Protective Clothing with Phase Change Materials in Simulated Utility Conditions. Materials 2020, 13, 4320. [Google Scholar] [CrossRef]
  24. Gao, Y.; Meng, X. A comprehensive review of integrating phase change materials in building bricks: Methods, performance and applications. J. Energy Storage 2023, 62, 106913. [Google Scholar] [CrossRef]
  25. Li, C.; Wen, X.; Cai, W.; Yu, H.; Liu, D. Phase change material for passive cooling in building envelopes: A comprehensive review. J. Build. Eng. 2023, 65, 105763. [Google Scholar] [CrossRef]
  26. Wang, P.; Liu, Z.; Zhang, X.; Hu, M.; Zhang, L.; Fan, J. Adaptive dynamic building envelope integrated with phase change material to enhance the heat storage and release efficiency: A state-of-the-art review. Energy Build. 2023, 286, 112928. [Google Scholar] [CrossRef]
  27. Yang, H.; Xu, Z.; Cui, H.; Bao, X.; Tang, W.; Sang, G.; Chen, X. Cementitious composites integrated phase change materials for passive buildings: An overview. Constr. Build. Mater. 2022, 361, 129635. [Google Scholar] [CrossRef]
  28. Liu, L.; Hammami, N.; Trovalet, L.; Bigot, D.; Habas, J.-P.; Malet-Damour, B. Description of phase change materials (PCMs) used in buildings under various climates: A review. J. Energy Storage 2022, 56, 105760. [Google Scholar] [CrossRef]
  29. Ismail, K.A.; Lino, F.A.; Machado, P.L.O.; Teggar, M.; Arıcı, M.; Alves, T.A.; Teles, M.P. New potential applications of phase change materials: A review. J. Energy Storage 2022, 53, 105202. [Google Scholar] [CrossRef]
  30. Sarier, N.; Onder, E. Organic phase change materials and their textile applications: An overview. Thermochim. Acta 2012, 540, 7–60. [Google Scholar] [CrossRef]
  31. Wang, W.; Li, C.; Zeng, X.; Chen, J.; Sun, R. Application of polymer-based phase change materials in thermal safety management of power batteries. J. Energy Storage 2022, 55, 105646. [Google Scholar] [CrossRef]
  32. Zhao, Y.; Zou, B.; Zhang, T.; Jiang, Z.; Ding, J.; Ding, Y. A comprehensive review of composite phase change material based thermal management system for lithium-ion batteries. Renew. Sustain. Energy Rev. 2022, 167, 112667. [Google Scholar] [CrossRef]
  33. Sanker, S.B.; Baby, R. Phase change material based thermal management of lithium ion batteries: A review on thermal performance of various thermal conductivity enhancers. J. Energy Storage 2022, 50, 104606. [Google Scholar] [CrossRef]
  34. Zare, P.; Perera, N.; Lahr, J.; Hasan, R. Solid-liquid phase change materials for the battery thermal management systems in electric vehicles and hybrid electric vehicles—A systematic review. J. Energy Storage 2022, 52, 105026. [Google Scholar] [CrossRef]
  35. Luo, J.; Zou, D.; Wang, Y.; Wang, S.; Huang, L. Battery thermal management systems (BTMs) based on phase change material (PCM): A comprehensive review. Chem. Eng. J. 2021, 430, 132741. [Google Scholar] [CrossRef]
  36. Zhang, J.; Shao, D.; Jiang, L.; Zhang, G.; Wu, H.; Day, R.; Jiang, W. Advanced thermal management system driven by phase change materials for power lithium-ion batteries: A review. Renew. Sustain. Energy Rev. 2022, 159, 112207. [Google Scholar] [CrossRef]
  37. Shen, Z.-G.; Chen, S.; Liu, X.; Chen, B. A review on thermal management performance enhancement of phase change materials for vehicle lithium-ion batteries. Renew. Sustain. Energy Rev. 2021, 148, 111301. [Google Scholar] [CrossRef]
  38. Chen, J.; Kang, S.; Jiaqiang, E.; Huang, Z.; Wei, K.; Zhang, B.; Zhu, H.; Deng, Y.; Zhang, F.; Liao, G. Effects of different phase change material thermal management strategies on the cooling performance of the power lithium ion batteries: A review. J. Power Sources 2019, 442, 227228. [Google Scholar] [CrossRef]
  39. Maqbool, Z.; Hanief, M.; Parveez, M. Review on performance enhancement of phase change material based heat sinks in conjugation with thermal conductivity enhancers for electronic cooling. J. Energy Storage 2023, 60, 106591. [Google Scholar] [CrossRef]
  40. Liu, Y.; Zheng, R.; Li, J. High latent heat phase change materials (PCMs) with low melting temperature for thermal management and storage of electronic devices and power batteries: Critical review. Renew. Sustain. Energy Rev. 2022, 168, 112783. [Google Scholar] [CrossRef]
  41. Yang, T.; King, W.P.; Miljkovic, N. Phase change material-based thermal energy storage. Cell Rep. Phys. Sci. 2021, 2, 100540. [Google Scholar] [CrossRef]
  42. Funt, J.M.; Magill, J.H. A method for the quantitative evaluation of flammability in polymers. J. Appl. Polym. Sci. 1974, 18, 1243–1245. [Google Scholar] [CrossRef]
  43. Stauffer, E.; Dolan, J.A.; Newman, R. Fire Debris Analysis; Academic Press: Cambridge, MA, USA, 2008; ISBN 978-0-12-663971-1. [Google Scholar] [CrossRef]
  44. Tewarson, A. Flammability Parameters of Materials: Ignition, Combustion, and Fire Propagation. J. Fire Sci. 1994, 12, 329–356. [Google Scholar] [CrossRef]
  45. Williams, F.A. Combustion Theory, 2nd ed.; CRC Press: Boca Raton, FL, USA, 1994; ISBN 9780201407778. [Google Scholar]
  46. Garche, J.; Brandt, K. Electrochemical Power Sources: Fundamentals, Systems, and Applications, 1st ed.; Elsevier: Amsterdam, The Netherlands, 2018; ISBN 9780444637772. [Google Scholar]
  47. Flammability UL 94 HB. 2021. Available online: https://www.impact-solutions.co.uk/plastic-testing/testing-capabilities-list/ul94-fire-testing/ul94-horizontal-burning-test/ (accessed on 11 March 2023).
  48. Vertical Burning Test for Classifying Materials. Available online: https://omnexus.specialchem.com/polymer-properties/properties/flammability-ul94 (accessed on 11 March 2023).
  49. Shrivastava, A. Introduction to Plastic Engineering; Elsevier Inc.: Amsterdam, The Netherlands, 2018; ISBN 978-0-323-39500-7. [Google Scholar]
  50. ASTM D2863; Standard Test Method for Measuring the Minimum Oxygen Concentration to Support Candle-Like Combustion of Plastics (Oxygen Index). ASTM International: West Conshohocken, PA, USA, 2019. Available online: https://asrecomposite.com/wp-content/uploads/2021/09/ASTM-D2863_2013_427900547120.pdf (accessed on 11 March 2023).
  51. ASTM E1354-17; Standard Test Method For Heat And Visible Smoke Release Rates For Materials And Products Using An Oxygen Consumption Calorimeter. ASTM International: West Conshohocken, PA, USA, 1999.
  52. ISO 5660-1:2015; Reaction-to-Fire Tests—Heat Release, Smoke Production and Mass Loss Rate—Part 1: Heat Release Rate (Cone Calorimeter Method) and Smoke Production Rate (Dynamic Measurement). ISO: Geneva, Switzerland, 2015.
  53. Dowbysz, A.M.; Samsonowicz, M. Smoke Generation Parameters from the Cone Calorimeter Method and Single-Chamber Test. EWaS5 2021, 9, 22. [Google Scholar] [CrossRef]
  54. De Silva, D.; Alam, N.; Nadjai, A.; Nigro, E.; Ali, F. Finite Element Modelling for Structural Performance of Slim Floors in Fire and Influence of Protection Materials. Appl. Sci. 2021, 11, 11291. [Google Scholar] [CrossRef]
  55. De Silva, D.; Bilotta, A.; Nigro, E. Approach for modelling thermal properties of intumescent coating applied on steel members. Fire Saf. J. 2020, 116, 103200. [Google Scholar] [CrossRef]
  56. Roshan, P. Functional Finishes for Textiles. Improving Comfort, Performance and Protection; Elsevier: Amsterdam, The Netherlands, 2015; ISBN 978-0-85709-839-9. [Google Scholar]
  57. Sittisart, P.; Farid, M.M. Fire retardants for phase change materials. Appl. Energy 2011, 88, 3140–3145. [Google Scholar] [CrossRef]
  58. De Silva, D.; Nuzzo, I.; Nigro, E.; Occhiuzzi, A. Intumescent Coatings for Fire Resistance of Steel Structures: Current Approaches for Qualification and Design. Coatings 2022, 12, 696. [Google Scholar] [CrossRef]
  59. Cai, Y.; Hu, Y.; Song, L.; Kong, Q.; Yang, R.; Zhang, Y.; Chen, Z.; Fan, W. Preparation and flammability of high density poly-ethylene/paraffin/organophilic montmorillonite hybrids as a form stable phase change material. Energy Convers. Manag. 2007, 48, 462–469. [Google Scholar] [CrossRef]
  60. Cai, Y.; Wei, Q.; Huang, F.; Gao, W. Preparation and properties studies of halogen-free flame retardant form-stable phase change materials based on paraffin/high density polyethylene composites. Appl. Energy 2008, 85, 765–775. [Google Scholar] [CrossRef]
  61. Fan, M.; Fu, F. Advanced High Strength Natural Fibre Composites in Construction; Woodhead Publishing: Sawston, UK, 2017; ISBN 978-0-08-100411-1. [Google Scholar] [CrossRef]
  62. Palacios, A.; De Gracia, A.; Haurie, L.; Cabeza, L.F.; Fernández, A.I.; Barreneche, C. Study of the Thermal Properties and the Fire Performance of Flame Retardant-Organic PCM in Bulk Form. Materials 2018, 11, 117. [Google Scholar] [CrossRef] [PubMed]
  63. UNE-23727:1990; Ensayos de Reacción al Fuego de los Materiales de Construcción. Clasificación de los Materiales Utilizados en la Construcción. Asociacion Espanola de Normalizacion: Madrid, Spain, 1990.
  64. Palacios, A.; de Gracia, A.; Cabeza, L.F.; Julià, E.; Fernández, A.I.; Barreneche, C. New formulation and characterization of enhanced bulk-organic phase change materials. Energy Build. 2018, 167, 38–48. [Google Scholar] [CrossRef]
  65. Zhang, Y.; Jia, Z.; Hai, A.M.; Zhang, S.; Tang, B. Shape-stabilization micromechanisms of form-stable phase change materials-A review. Compos. Part A: Appl. Sci. Manuf. 2022, 160, 107047. [Google Scholar] [CrossRef]
  66. Wang, J.; Wang, Y.; Yang, R. Flame retardance property of shape-stabilized phase change materials. Sol. Energy Mater. Sol. Cells 2015, 140, 439–445. [Google Scholar] [CrossRef]
  67. He, H.; Liu, J.; Wang, Y.; Zhao, Y.; Qin, Y.; Zhu, Z.; Yu, Z.; Wang, J. An Ultralight Self-Powered Fire Alarm e-Textile Based on Conductive Aerogel Fiber with Repeatable Temperature Monitoring Performance Used in Firefighting Clothing. ACS Nano 2022, 16, 2953–2967. [Google Scholar] [CrossRef]
  68. Regulation (EU) 2016/425 of the European Parliament and of the Council of 9 March 2016 on Personal Protective Equipment and Repealing Council Directive 89/686/EEC; EU: Brussels, Belgium, 2016.
  69. EN ISO 11612:2015; Protective Clothing—Clothing to Protect against Heat and Flame—Minimum Performance Requirements. ISO: Geneva, Switzerland, 2015.
  70. Su, Y.; Fan, Y.; Ma, Y.; Wang, Y.; Liu, G. Flame-retardant phase change material (PCM) for thermal protective application in firefighting protective clothing. Int. J. Therm. Sci. 2023, 185, 108075. [Google Scholar] [CrossRef]
  71. Wang, Y.; Ma, Y.; Chen, R.; Su, Y. Thermal protective performance of firefighting protective clothing incorporated with phase change material in fire environments. Fire Mater. 2020, 45, 250–260. [Google Scholar] [CrossRef]
  72. Yin, G.-Z.; Yang, X.-M.; Hobson, J.; López, A.M.; Wang, D.-Y. Bio-based poly (glycerol-itaconic acid)/PEG/APP as form stable and flame-retardant phase change materials. Compos. Commun. 2022, 30, 101057. [Google Scholar] [CrossRef]
  73. Zhang, P.; Hu, Y.; Song, L.; Ni, J.; Xing, W.; Wang, J. Effect of expanded graphite on properties of high-density polyethylene/paraffin composite with intumescent flame retardant as a shape-stabilized phase change material. Sol. Energy Mater. Sol. Cells 2010, 94, 360–365. [Google Scholar] [CrossRef]
  74. Huang, J.; Su, J.; Xu, W.; Lin, J.; Weng, M.; Liu, Y.; Min, Y. High enthalpy efficiency lignin-polyimide porous hybrid aerogel composite phase change material with flame retardancy for superior solar-to-thermal energy conversion and storage. Sol. Energy Mater. Sol. Cells 2022, 248, 112036. [Google Scholar] [CrossRef]
  75. Xue, F.; Huang, C.-H.; Qi, X.-D.; Yang, J.-H.; Zhao, C.-S.; Lei, Y.-Z.; Wang, Y. Largely improved thermal conductivity and flame resistance of phase change materials based on three-dimensional melamine foam/phosphorous cellulose/graphite nanoplatelets network with multiple energy transition abilities. Compos. Part A 2022, 156, 106898. [Google Scholar] [CrossRef]
  76. Zhou, R.; Ming, Z.; He, J.; Ding, Y.; Jiang, J. Effect of Magnesium Hydroxide and Aluminum Hydroxide on the Thermal Stability, Latent Heat and Flammability Properties of Paraffin/HDPE Phase Change Blends. Polymers 2020, 12, 180. [Google Scholar] [CrossRef] [PubMed]
  77. Pan, H.; Qian, X.; Ma, L.; Song, L.; Hu, Y.; Liew, K.M. Preparation of a novel biobased flame retardant containing phosphorus and nitrogen and its performance on the flame retardancy and thermal stability of poly(vinyl alcohol). Polym. Degrad. Stab. 2014, 106, 47–53. [Google Scholar] [CrossRef]
  78. Zhang, P.; Hu, Y.; Song, L.; Lu, H.; Wang, J.; Liu, Q. Synergistic effect of iron and intumescent flame retardant on shape-stabilized phase change material. Thermochim. Acta 2009, 487, 74–79. [Google Scholar] [CrossRef]
  79. Zhang, J.; Li, X.; Zhang, G.; Wu, H.; Rao, Z.; Guo, J.; Zhou, D. Experimental investigation of the flame retardant and form-stable composite phase change materials for a power battery thermal management system. J. Power Sources 2020, 480, 229116. [Google Scholar] [CrossRef]
  80. Li, Y.; Wang, T.; Li, X.; Zhang, G.; Chen, K.; Yang, W. Experimental investigation on thermal management system with flame retardant flexible phase change material for retired battery module. Appl. Energy 2022, 327, 120109. [Google Scholar] [CrossRef]
  81. Alkhazaleh, A.H.; Almanaseer, W.; Alkhazali, A. Experimental investigation on thermal properties and fire performance of lauric acid/diphenyl phosphate/expanded perlite as a flame retardant phase change material for latent heat storage applications. Sustain. Energy Technol. Assessments 2023, 56, 103059. [Google Scholar] [CrossRef]
  82. Tanwar, S.; Kaur, R. Fabrication and investigation on influence of metal oxide nanoparticles on thermal, flammability and UV characteristics of polyethylene glycol based phase change materials. J. Energy Storage 2022, 54, 105318. [Google Scholar] [CrossRef]
  83. Li, L.; Wang, G.; Guo, C. Influence of intumescent flame retardant on thermal and flame retardancy of eutectic mixed paraffin/polypropylene form-stable phase change materials. Appl. Energy 2016, 162, 428–434. [Google Scholar] [CrossRef]
  84. Huang, Q.; Li, X.; Zhang, G.; Weng, J.; Wang, Y.; Deng, J. Innovative thermal management and thermal runaway suppression for battery module with flame retardant flexible composite phase change material. J. Clean. Prod. 2021, 330, 129718. [Google Scholar] [CrossRef]
  85. Salgado-Pizarro, R.; Martín, M.; Svobodova-Sedlackova, A.; Calderón, A.; Haurie, L.; Fernández, A.I.; Barreneche, C. Manufacturing of nano-enhanced shape stabilized phase change materials with montmorillonite by Banbury oval rotor mixer for buildings applications. J. Energy Storage 2022, 55, 105289. [Google Scholar] [CrossRef]
  86. Yin, G.-Z.; Yang, X.-M.; Palencia, J.L.D.; Hobson, J.; López, A.M.; Wang, D.-Y. Phytic acid as a biomass flame retardant for polyrotaxane based phase change materials. J. Energy Storage 2022, 56, 105853. [Google Scholar] [CrossRef]
  87. Song, G.; Ma, S.; Tang, G.; Yin, Z.; Wang, X. Preparation and characterization of flame retardant form-stable phase change materials composed by EPDM, paraffin and nano magnesium hydroxide. Energy 2010, 35, 2179–2183. [Google Scholar] [CrossRef]
  88. Ma, T.; Li, L.; Wang, Q.; Guo, C. High-performance flame retarded paraffin/epoxy resin form-stable phase change material. J. Mater. Sci. 2018, 54, 875–885. [Google Scholar] [CrossRef]
  89. Huang, Y.; Stonehouse, A.; Abeykoon, C. Encapsulation methods for phase change materials – A critical review. Int. J. Heat Mass Transf. 2023, 200, 123458. [Google Scholar] [CrossRef]
  90. Zhang, Z.; Liu, Y.; Du, W.; Liang, Z.; Li, F.; Yong, Y.; Li, Z. Construction of layered double hydroxide-modified silica integrated multilayer shell phase change capsule with flame retardancy and highly efficient thermoregulation performance. J. Colloid Interface Sci. 2023, 632, 311–325. [Google Scholar] [CrossRef] [PubMed]
  91. Kang, M.; Liu, Y.; Liang, C.; Lin, W.; Wang, C.; Li, C.; Zhang, F.; Cheng, J. Phase change material microcapsules with DOPO/Cu modified halloysite nanotubes for thermal controlling of buildings: Thermophysical properties, flame retardant performance and thermal comfort levels. Int. J. Heat Mass Transf. 2023, 207, 124045. [Google Scholar] [CrossRef]
  92. Liao, H.; Duan, W.; Liu, Y.; Wang, Q.; Wen, H. Flame retardant and leaking preventable phase change materials for thermal energy storage and thermal regulation. J. Energy Storage 2021, 35, 102248. [Google Scholar] [CrossRef]
  93. Qiu, X.; Lu, L.; Chen, Z. Preparation and characterization of flame retardant phase change materials by microencapsulated paraffin and diethyl ethylphosphonate with poly(methacrylic acid-co -ethyl methacrylate) shell. J. Appl. Polym. Sci. 2015, 132, 41880. [Google Scholar] [CrossRef]
  94. Demirbağ, S.; Aksoy, S.A. Encapsulation of phase change materials by complex coacervation to improve thermal performances and flame retardant properties of the cotton fabrics. Fibers Polym. 2016, 17, 408–417. [Google Scholar] [CrossRef]
  95. Du, X.; Fang, Y.; Cheng, X.; Du, Z.; Zhou, M.; Wang, H. Fabrication and Characterization of Flame-Retardant Nanoencapsulated n-Octadecane with Melamine–Formaldehyde Shell for Thermal Energy Storage. ACS Sustain. Chem. Eng. 2018, 6, 15541–15549. [Google Scholar] [CrossRef]
  96. Kosny, J.; Kossecka, E.; Brzezinski, A.; Tleoubaev, A.; Yarbrough, D. Dynamic thermal performance analysis of fiber insulations containing bio-based phase change materials (PCMs). Energy Build. 2012, 52, 122–131. [Google Scholar] [CrossRef]
  97. Du, X.; Wang, S.; Du, Z.; Cheng, X.; Wang, H. Preparation and characterization of flame-retardant nanoencapsulated phase change materials with poly(methylmethacrylate) shells for thermal energy storage. J. Mater. Chem. A 2018, 6, 17519–17529. [Google Scholar] [CrossRef]
  98. Kazanci, B.; Cellat, K.; Paksoy, H. Preparation, characterization, and thermal properties of novel fire-resistant microencapsulated phase change materials based on paraffin and a polystyrene shell. RSC Adv. 2020, 10, 24134–24144. [Google Scholar] [CrossRef] [PubMed]
  99. Amaral, C.; Vicente, R.; Eisenblätter, J.; Marques, P. Thermal characterization of polyurethane foams with phase change material. Ciência Tecnol. Dos Mater. 2017, 29, 1–7. [Google Scholar] [CrossRef]
  100. Szczotok, A.M.; Carmona, M.; Serrano, A.; Kjøniksen, A.L.; Rodriguez, J.F. Development of thermoregulating microcapsules with cyclotriphosphazene as a flame retardant agent. IOP Conf. Series Mater. Sci. Eng. 2017, 251, 012120. [Google Scholar] [CrossRef]
  101. Kang, M.; Liu, Y.; Lin, W.; Liang, C.; Cheng, J. The thermal behavior and flame retardant performance of phase change material microcapsules with halloysite nanotube. J. Energy Storage 2023, 60, 106632. [Google Scholar] [CrossRef]
  102. Xu, L.; Liu, X.; An, Z.; Yang, R. EG-based coatings for flame retardance of shape stabilized phase change materials. Polym. Degrad. Stab. 2019, 161, 114–120. [Google Scholar] [CrossRef]
  103. Xu, L.; Wang, J.; Yang, R. A new flame retardance strategy for shape stabilized phase change materials by surface coating. Sol. Energy Mater. Sol. Cells 2017, 170, 87–94. [Google Scholar] [CrossRef]
  104. Huang, Y.-H.; Cheng, Y.-X.; Zhao, R.; Cheng, W.-L. A high heat storage capacity form-stable composite phase change material with enhanced flame retardancy. Appl. Energy 2020, 262, 114536. [Google Scholar] [CrossRef]
  105. Jiang, Y.; Yan, P.; Wang, Y.; Zhou, C.; Lei, J. Form-stable phase change materials with enhanced thermal stability and fire resistance via the incorporation of phosphorus and silicon. Mater. Des. 2018, 160, 763–771. [Google Scholar] [CrossRef]
  106. Xu, L.; Liu, X.; Yang, R. Flame Retardant Paraffin-Based Shape-Stabilized Phase Change Material via Expandable Graphite-Based Flame-Retardant Coating. Molecules 2020, 25, 2408. [Google Scholar] [CrossRef] [PubMed]
  107. Zhang, Y.; Tang, B.; Wang, L.; Lu, R.; Zhao, D.; Zhang, S. Novel hybrid form-stable polyether phase change materials with good fire resistance. Energy Storage Mater. 2017, 6, 46–52. [Google Scholar] [CrossRef]
  108. Chen, R.; Huang, X.; Zheng, R.; Xie, D.; Mei, Y.; Zou, R. Flame-retardancy and thermal properties of a novel phosphorus-modified PCM for thermal energy storage. Chem. Eng. J. 2020, 380, 122500. [Google Scholar] [CrossRef]
  109. Thakur, A.K.; Prabakaran, R.; Elkadeem, M.; Sharshir, S.W.; Arıcı, M.; Wang, C.; Zhao, W.; Hwang, J.-Y.; Saidur, R. A state of art review and future viewpoint on advance cooling techniques for Lithium–ion battery system of electric vehicles. J. Energy Storage 2020, 32, 101771. [Google Scholar] [CrossRef]
  110. Lamb, J.; Orendorff, C.J.; Steele, L.A.M.; Spangler, S.W. Failure propagation in multi-cell lithium ion batteries. J. Power Sources 2015, 283, 517–523. [Google Scholar] [CrossRef]
  111. Cui, Y.; Chen, Y.; Zhao, L.; Zhu, F.; Li, L.; Kong, Q.; Chen, M. Investigation on the Properties of Flame-Retardant Phase Change Material and Its Application in Battery Thermal Management. Energies 2023, 16, 521. [Google Scholar] [CrossRef]
  112. Weng, J.; Xiao, C.; Ouyang, D.; Yang, X.; Chen, M.; Zhang, G.; Yuen, R.K.K.; Wang, J. Mitigation effects on thermal runaway propagation of structure-enhanced phase change material modules with flame retardant additives. Energy 2021, 239, 122087. [Google Scholar] [CrossRef]
  113. Xu, Z.; Chen, W.; Wu, T.; Wang, C.; Liang, Z. Thermal management system study of flame retardant solid–solid phase change material battery. Surfaces Interfaces 2023, 36, 102558. [Google Scholar] [CrossRef]
  114. Haurie, L.; Mazo, J.; Delgado, M.; Zalba, B. Fire behaviour of a mortar with different mass fractions of phase change material for use in radiant floor systems. Energy Build. 2014, 84, 86–93. [Google Scholar] [CrossRef]
  115. UNE 23725; Reaction to Fire Tests of Building Materials. Dripping Test with Electrical Radiator Used for Melting Materials (Complementary Test). Spanish Association for Standardization and Certification (AENOR): Madrid, Spain, 1990.
Figure 1. Schematic representation of the combustion process physical mechanism.
Fire 06 00175 g001
Figure 2. Left: Combustion time for pure PCM and PCM-EG samples. Right: HRR for pure PCM and PCM treated with flame retardant. Reproduced from [66] with permission from Elsevier.
Fire 06 00175 g002
Figure 3. (a) The PGI/PEG preparation process by polycondensation; (b) vinyl and hydroxyl group precursor; (c) BPO and APP FR at 80 °C induced cross-linked precursor; (d) the reversible phase transition process; (e) photo of a PCM sample exposed to flame. Reproduced from [72] with permission from Elsevier.
Fire 06 00175 g003
Figure 4. Photos of UL–94 test: (a) sample PCM–0; (b) sample PCM–15%; (c) LOI index values; (d) HRR curves; (e) peak of the HRR curves; (f) THR curves; (g) THR values based on the THR curves; (h) PCM samples after cone calorimetry test. Reproduced from [72] with permission from Elsevier.
Fire 06 00175 g004
Figure 5. (a) DSC curves for the pure PCM and PCMs with varying values of the APP content; (b) the melting enthalpy derived from the DSC analysis; (c) test results for form stability; (d) IR images showing the heat response; (e,f) heating and cooling curves; (g) PCM–15%, DSC cycling curves. Reproduced from [72] with permission from Elsevier.
Fire 06 00175 g005
Figure 6. The cone calorimetry test results. Reproduced from [73] with permission from Elsevier.
Fire 06 00175 g006
Figure 7. The stages of the SS composite PCM. Reproduced from [74] with permission from Elsevier.
Fire 06 00175 g007
Figure 8. Aerogels and composite PCMs SEM photos: (a,b) PI; (c) PI@PEG; (d,e) ZrP-PI-1; (f) ZrP-PI-1@PEG. Reproduced from [74] with permission from Elsevier.
Fire 06 00175 g008
Figure 9. Cone calorimetry test results: (a) HRR curves; (b) THR curves. Reproduced from [74] with permission from Elsevier.
Fire 06 00175 g009
Figure 10. SEM images of the paraffin/HDPE/IFR/iron shape-stabilized PCM samples: (a) sample 1; (b) sample 3; (c) the char residue on the surface of sample 1; (d) internal view of sample 1; (e) surface view of sample 3; (f) inner view of sample 3. Reproduced from [78] with permission from Elsevier.
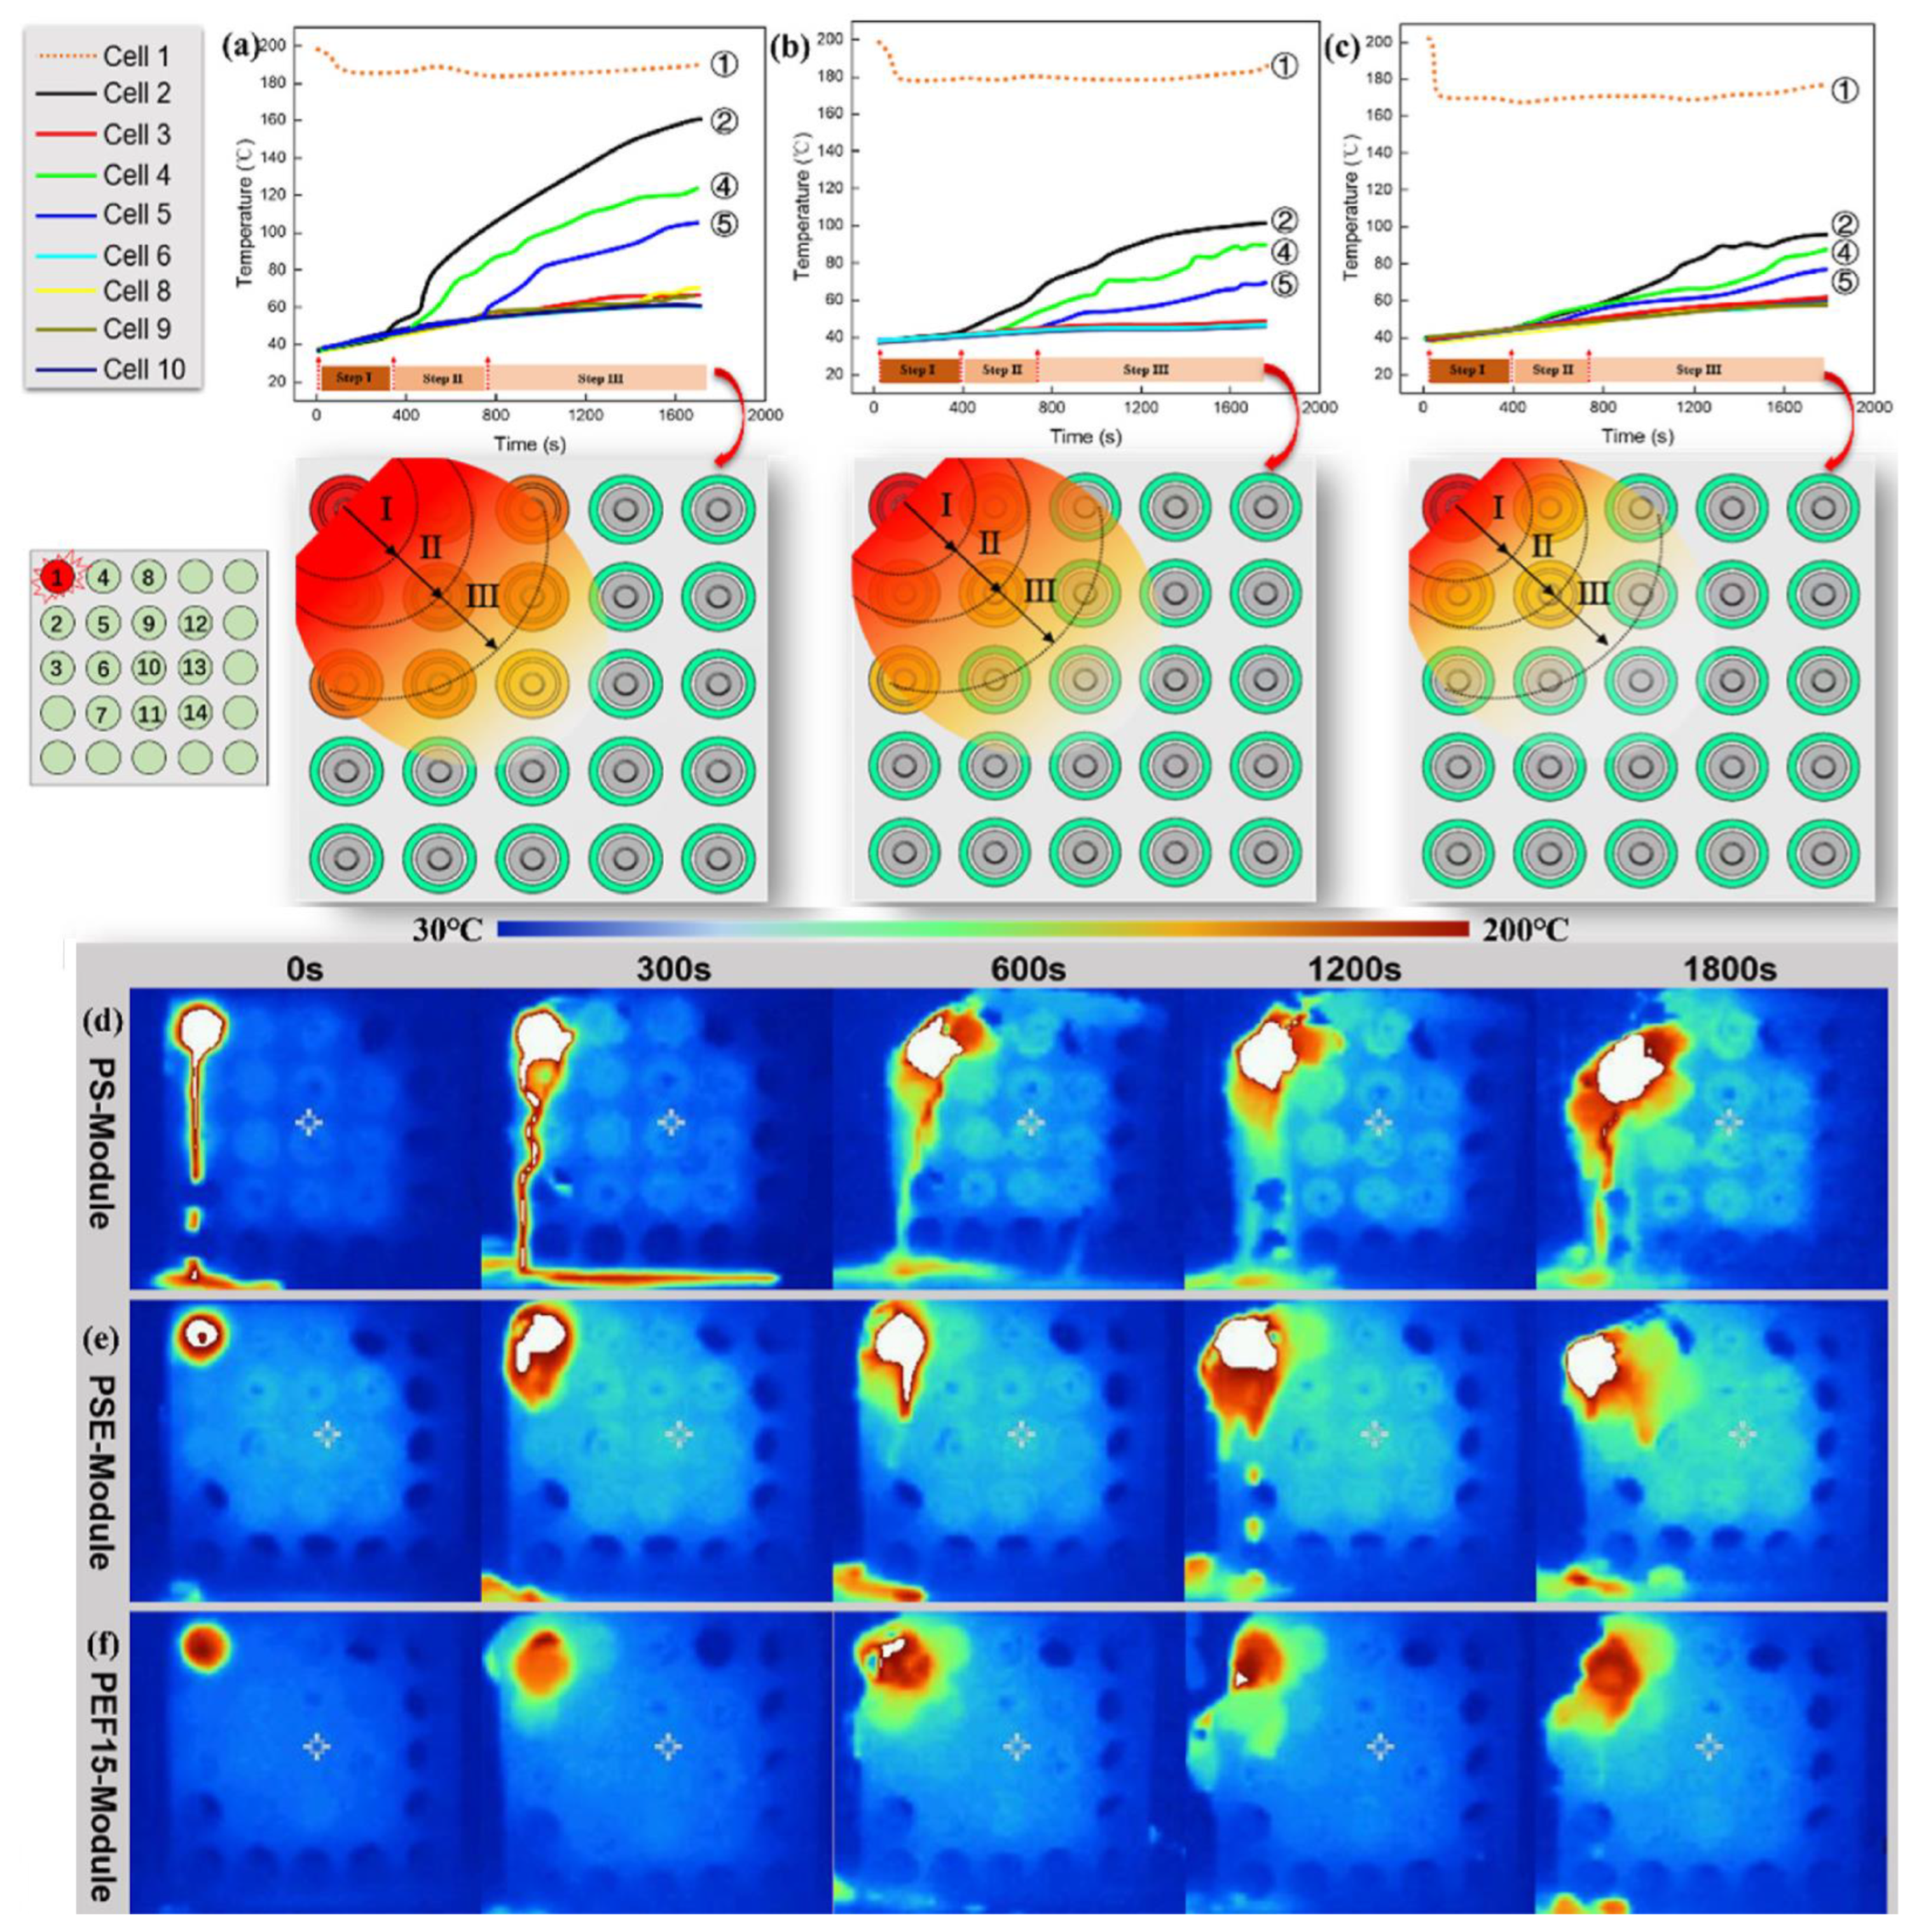
Fire 06 00175 g010
Figure 11. HRR curves. Reproduced from [78] with permission from Elsevier.
Fire 06 00175 g011
Figure 12. Char formation reaction mechanisms occurring during the paraffin/HDPE/IFR/iron combustion. Reproduced from [78] with permission from Elsevier.
Fire 06 00175 g012
Figure 13. The multi-layer capsule structure and the preparation of the M–EPCM. Reproduced from [90] with permission from Elsevier.
Fire 06 00175 g013
Figure 14. Images taken during the self-extinguishing test: (a1a3) PW; (b1b3) EPCM; (c1c3) M-EPCM-5; heating test at high temperature: (d1d3) PW; (e1e3) EPCM; (f1f3) M-EMCP-5. Reproduced from [90] with permission from Elsevier.
Fire 06 00175 g014
Figure 15. UL-94 test images: (a) sample SRF/E; (b) sample SRF/M1; (c) sample SRF/M2; (d) sample SRF/M3; (e) sample SRF/M4; (f) sample SRF/M5. Reproduced from [90] with permission from Elsevier.
Fire 06 00175 g015
Figure 16. TEM photos: (a) HNTs; (b) Cu nanoparticle-modified HNTs; (c) PCM microcapsules; (d) c-HNT-modified PCM microcapsules. Reproduced from [91] with permission from Elsevier.
Fire 06 00175 g016
Figure 17. Materials and preparation method for flame-retardant, shape-stabilized PCMs [92]. Reproduced with permission from Elsevier.
Fire 06 00175 g017
Figure 18. Photos of the samples before and after heating from 25 °C to 90 °C, demonstrating the leakage behavior. Reproduced from [92] with permission from Elsevier.
Fire 06 00175 g018
Figure 19. Cone calorimetry test results: (a) HRR curves; (b) THR curves; (c) SPR curves; (d) TSP curves. Reproduced from [92] with permission from Elsevier.
Fire 06 00175 g019
Figure 20. Images of the specimen strips during UL-94 test: (a) sample PCM/OMMT; (b) sample PCM/OMMT-A; (c) sample PCM/OMMT-B; (d) sample PCM/OMMT-C. Reproduced from [102] with permission from Elsevier.
Fire 06 00175 g020
Figure 21. HRR values for PCM/OMMT (without coating) and with coatings. Reproduced from [102] with permission from Elsevier.
Fire 06 00175 g021
Figure 22. Residues after cone calorimetry tests: (a) sample PCM/OMMT; (b) sample PCM/OMMT-A; (c) sample PCM/OMMT-B; (d) sample PCM/OMMT-C. Reproduced from [104] with permission from Elsevier.
Fire 06 00175 g022
Figure 23. Left—The appearance of the SS PCMs after cone calorimetry test: (a) sample PCM/OMMT; (b) sample PCM/OMMT-A; (c) sample PCM-OMMT-B; (d) sample PCM/OMMT/EG; (e) sample PCM/OMMT/EG/RP. Right—FESEM images of the coatings: (a) sample A—before combustion; (b) sample A following combustion; (c) sample B prior to combustion; (d) sample B following combustion. Reproduced from [103] with permission from Elsevier.
Fire 06 00175 g023
Figure 24. The composite PCM–fiber glass layered structure proposed in [104]. Reproduced with permission from Elsevier.
Fire 06 00175 g024
Figure 25. Cone calorimetry (a) HRR curves; (b) THR curves [104]. Reproduced with permission from Elsevier.
Fire 06 00175 g025
Figure 26. Test specimens after cone calorimetry test: (a) sample CPCM-1; (b) sample CPCM-2; (c) sample CPCM-3. Reproduced from [104] with permission from Elsevier.
Fire 06 00175 g026
Figure 27. The synthetic route of shape-stabilized PCM described in [105]. Reproduced with permission from Elsevier.
Fire 06 00175 g027
Figure 28. (a) Macroscopic examination of the samples following the thermal treatment; (b) FT—IR spectra; (c) char resulting from PCMs after thermal treatment—SEM images. Reproduced from [105] with permission from Elsevier.
Fire 06 00175 g028
Figure 29. The synthetic route for the phase change composite. (a) Chemical synthesis; (b) Physical process. Reproduced from [107] with permission from Elsevier.
Fire 06 00175 g029
Figure 30. The synthesis route for the FRPCM [108]. Reproduced with permission from Elsevier.
Fire 06 00175 g030
Figure 31. Photos of the samples prior to (left column) and following cone calorimetry test (right column): (a,b)—hexadecanol; (c,d)—sample G; (e,f)—sample G20; (g,h)—sample P20. Reproduced from [108] with permission from Elsevier.
Fire 06 00175 g031
Figure 32. Photos taken during the self-extinguishing test. Reproduced from [108] with permission from Elsevier.
Fire 06 00175 g032
Figure 33. (a) UL-94 test photos; (b) cone calorimetry HRR curve; (c) cone calorimetry THR curve; (d) cone calorimetry SPR curve; (e) cone calorimetry TSP curve. Reproduced from [80] with permission from Elsevier.
Fire 06 00175 g033
Figure 34. Photos of the composite PCMs after cone test: (a) sample PE; (b) sample PEE; (c) sample MPCM; (d) sample MTPCM3; (e) sample TPCM; char residues-SEM images: (f) sample PE; (g) sample PEE; (h) sample MPCM; (i) sample MTPCM3; (j) sample TPCM; (k) the flame retardancy mechanism of action. Reproduced from [80] with permission from Elsevier.
Fire 06 00175 g034
Figure 35. The flame retardancy mechanisms for PE (top), MTPCM3 (middle), and TPCM (bottom). Reproduced from [80] with permission from Elsevier.
Fire 06 00175 g035
Figure 36. UL–94 test photos: (a) PE; (b) PSE; (c) PEF15; cone calorimetry curves: (d) HRR curves; (e) THR curve; (f) SPR curve; (g) TSP curve. Reproduced from [86] with permission from Elsevier.
Fire 06 00175 g036
Figure 37. Temperature variation in the heating element at different positions upon triggering the thermal runaway at the central region. (a) PS; (b) PSE; (c) PEF15; IR images of the modules at the center region: (d) PS; (e) PSE; (f) PEF15. Reproduced from [86] with permission from Elsevier.
Fire 06 00175 g037
Figure 38. Temperature variation in the heating element at different positions upon triggering the TR at the edge region. (a) PS; (b) PSE; (c) PEF15; IR images of different modules at the center region: (d) PS; (e) PSE; (f) PEF15. Reproduced from [86] with permission from Elsevier.
Fire 06 00175 g038
Figure 39. Temperature variation in the cells during the TR propagation: (a) module with a blank cell; (b) module with composite PCM; (c) comparative plots. Reproduced from [112] with permission from Elsevier.
Fire 06 00175 g039
Figure 40. Images of the composite PCM samples during the UL-94 test. Reproduced from [112] with permission from Elsevier.
Fire 06 00175 g040
Figure 41. Cone calorimetry test. Reproduced from [112] with permission from Elsevier.
Fire 06 00175 g041
Figure 42. The synthesis route for the composite FR PCM: (a) preparation of microcapsule-coated ammonium polyphosphate; (b) Composite PCM solid-solid FR preparation. Reproduced from [113] with permission from Elsevier.
Fire 06 00175 g042
Figure 43. (a) The DSC curves of the nine samples; (b) thermal conductivity; (c) TGA curves; (d) leakage characteristics of PEG and CPCM–5. Reproduced from [113] with permission from Elsevier.
Fire 06 00175 g043
Figure 44. Cone calorimetry test results. (a) HRR; (b) THR; (c) SPR; (d) TSP; before, after, and SEM photos: (e) CPCM1; (f) CPCM5; (g) CPCM8. Reproduced from [113] with permission from Elsevier.
Fire 06 00175 g044
Table 1. Common PCMs: composition and flammability data.
PCMComposition/Chemical FormulaFlammability Data
Paraffins Mixtures   of   different   types   of   hydrocarbons   with   the   chemical   formula   C n H 2 n + 2 FP: 200–240 °C
Fatty acidsCarboxylic acids with an aliphatic chainFP: >200 °C
May be ignited by heat, sparks, and flame
EstersAn acid in which the hydrogen atom of at least one acidic hydroxyl group of that acid is replaced by an organyl groupHighly flammable, low FP values
Polyethylene-Glycol Polyether   compound   C 2 n H 4 n + 2 O n + 1 FP: 279 °C
Explosive in presence of oxidizing materials
Polybutadiene Polymer   formed   from   the   polymerization   of   the   monomer   1 , 3 - butadiene .   C 4 H 6 x FP: 113 °C
PolyalcoholAlcohol containing 2+ hydroxyl groups:
D-mannitol
D-sorbitol
Xylitol
Meso-erythrol

TTI: 108 s [23]
TTI: 104 s [23]
TTI: 77 s [23]
TTI: 72 s [23]
Table 2. Assessment of the UL94 Vertical Burning Test.
Test CriteriaV-0V-1V-2
Test specimen burning time (s)≤10≤30≤30
Total burning time measured after the flame was applied 10 times (s)≤50≤250≤250
Burning and afterglow time measured after second flame application (s)≤30≤60≤60
Occurrence of dripping in burning specimensNoNoYes
Complete combustion to the holding clampNoNoNo
Table 3. Dripping test results for the composite PCMs described in [64].
SampleTTI [s]Ignitions CountCombustion Time [s]
Paraffin RT-21261300
60% paraffin + 1% EG + 40% APP25921
CA + MA191200
50% (CA/MA) + 1% EG + 50% Mg(OH)222214
CA/PA121224
50% (CA/PA) + 1% EG + 50% Mg(OH)225275
Table 4. The samples investigated in [66]: composition and density.
SampleComponentsComponents Weight RatioDensity [kg/m3]
PCMSBS/HDPE/paraffin30/10/60840
PCM-E4PCM/EG4100/20930
PCM-E5PCM/EG5100/20930
PCM-E6PCM/EG6100/20930
PCM-E7PCM/EG7100/20930
PCM-E8PCM/EG8100/20930
PCM-MPCM/OMMT100/20890
PCM-M-TPCM/OMMT/THBP100/20/1930
PCM-E4-MPCM/OMMT/EG4100/10/1910
PCM-E4-M-TPCM/OMMT/EG4/THBP100/10/10/1890
Table 5. The structure of the fabric system described in [70].
Outside
OSOSOS
MBMBPCM-coated fabric
TL + Comfort layerPCM-coated fabricMB
PCM-coated fabricTL + Comfort layerTL + Comfort layer
Inside
Table 6. The main properties of the two substrate fabrics considered in [70].
NotationFiber ContentFabric TypeSpecific Mass [g/m2]Thickness [mm]
F150% Nomex/50% flame-resistant viscosePlain124.50.31
F2Nomex IIIATwill228.50.49
Table 7. FR additives recipe components and percentages, cone calorimetry test results [73].
Sample Recipe ComponentsMass Weight
[%]
TTI
[s]
THR
MJ/m2
THR/Mass Lost
[MJ/m2g]
Peak HRR
[kW/m2]
Average HRR
[kW/m2s]
TC
[W/mK]
PCM1Paraffin
HDPE
60
40
58101.14.471133.8504.860.28
PCM2Paraffin
HDPE
APP + PER + MMA
40
20
20
2790.44.09627.25368.420.29
PCM3Paraffin
HDPE
APP + PER + MMA
60
15
25
2688.84.02569.19348.060.34
PCM4Paraffin
HDPE
APP+PER+MMA
EG
60
20
15
5
3480.43.79501.48314.900.51
PCM5Paraffin
HDPE
APP+PER+MMA
EG
60
15
20
5
3881.03.78430.36293.970.85
Table 8. Shape-stabilized, flame-retardant PCM recipes prepared in [76].
SampleParaffin
[g]
HDPE
[g]
EG
[g]
Al(OH)3
[g]
Mg(OH)2
[g]
Antioxidant [g]
SS-FR-PCM12812.00000.12
SS-FR-PCM22410.26000.12
SS-FR-PCM3187.86080.12
SS-FR-PCM4187.86260.12
SS-FR-PCM5187.86440.12
SS-FR-PCM6187.86620.12
SS-FR-PCM7187.86800.12
Table 9. The cone calorimetry test results presented in [76].
SamplePHRR
[kW/m2]
THR
[MJ/m2]
TTI
[s]
tPHRR
[s]
MLR
[g/s]
SS-FR-PCM1157012125860.30
SS-FR-PCM21098109281080.20
SS-FR-PCM386010830980.17
SS-FR-PCM482811231940.15
SS-FR-PCM576311034960.14
SS-FR-PCM665610338900.13
SS-FR-PCM770310629860.16
Table 10. PCMs and flame retardants. Shape stabilization methods, flammability test, and preparation.
RefPCMTCE/SSFlame RetardantTest MethodPreparation
Zhang [79]Paraffin
MP: 48 °C
LH: 223 kJ/kg
TC: 0.24 W/m·K
EG/-APP
Red phosphorus (RP)
Epoxy resin (ER)
Cone
UL-94
LOI
Mixing and dispersion.
Li [80]ParaffinEG/Maleic anhydride copolymersEG/Melamine/Triphenyl phosphateCone
UL 94
Mixing, pouring into molds.
Alkhazaleh [81]Dodecanoic acid (90%)
MP: 40–45 °C
EG/Expanded perliteResorcinol bis(diphenyl phosphate) (10%)ConeMagnetic stirring.
Tanwar [82]PEG-/Polyvinyl AlcoholTitanium Dioxide NanoparticlesLOIStirring, casting, drying.
Li [83]Solid paraffin wax/liquid paraffin (mineral oil)—Eutectic mixture-/PPTriazine char-forming agent
APP
Cone
TGA
LOI
UL 94
Ultrasonic vibration (eutectic PCM), impregnation into matrix material, cut into sheets.
Huang [84]Paraffin
MP: 45 °C
EG/SBSAPP/PA/ZnO with the mass ratio 50/45/5%, respectivelyUL 94
Cone
LOI
Physical mixing, magnetic stirring, pouring into molds.
S.Pizzaro [85]Palmitic acid
MP: 60.45 °C
LH: 221 kJ/kg
-/Ethylene propylene diene monomer, MMTMMTLOI
Radiation test
Heating and mixing in a Banbury oval rotor mixer.
Yin [86]Polyrotaxane-/-Phytic acidCone
LOI
UL 94
PEO was dissolved in water then α-Cyclodextrin was added, followed by prolonged stirring.
Song [87]Paraffin
MP: 55–60 °C
LH: 171.55 J/g
-/Nano structured magnesium hydroxideRPLOINano-MH synthesized from MgCl2 6H2O and NaOH (precipitation). Raw materials were mixed and then shaped into a mold.
Ma [88]Paraffin-/Epoxy resinTrimellitic anhydride reacted 2,6,7-trioxa-1-phosphabicyclo-[2.2.2]-octane-4-methanol
Melamine cyanurate
UL94(V0 for IFR loading above 24%) ConeMixing, dispersion.
Table 11. The recipes for preparing the multi-layer shell of M_EPCMs [90].
SampleNitrate (Total) [g]Tannic Acid [g]Poly Vinyl Alcohol [g]
Sample M-EPCM-10.81.61.6
Sample M-EPCM-21.61.21.2
Sample M-EPCM-32.01.01.0
Sample M-EPCM-42.40.80.8
Sample M-EPCM-53.20.40.4
Table 12. The cone calorimetry test main parameters [91].
SamplePeak HRR [kW/m2]THR [MJ/m2]TSP [m2]TTI [s]
EP82511128.149.0
EP/MPCM92311730.739.0
EP/h-MPCM72010325.561.0
EP/c-MPCM5759124.059.0
Table 13. The recipes for the PCMs described in [92].
Sample Reference1-Octadecanol [g]Tween 80 [g]PA (50% wt)MgCl2 [g]
FRPCM-12027.923.42
FRPCM-220213.25.7
FRPCM-320219.88.55
Table 14. Experimental reports of methods and materials for developing microencapsulated PCMs with low flammability.
RefPCMShellPreparation/SizeFire RetardantTest Method/Results
Qiu [93]ParaffinUncrosslinked and crosslinked poly (methacrylic acid-co-ethyl methacrylate Suspension - like   polymerization / / ~ 10 6 mDiethyl ethylphosphonateLOI/LOI value increased by 6–9%
Demirbağ [94]n-eicosaneGelatin/sodium alginateComplex coacervation/1.37 ÷ 1.6 μ mClay nanoparticlesIgnition time for the treated textiles with 25–50% longer
Du [95]n-octadecanePNDA-modified melamine-formaldehyde In   situ   polymerization / ~ 10 9 mPNDACone, LOI
PHRR dropped by 32.8%
Kosny [96]Methyl esterNot providedCoating applied on the microcapsules/Not providedNot providedNot provided
Du [97]n-octadecanePoly (methyl methacrylate) Miniemulsion   polymerization / ~ 10 9 mCrosslinking agent: Diethyl bis (2-hydroxyethyl acrylate) amino methyl phosphonateCone, LOI:
PHHR   dropped   ~ 40 %
THR dropped ~ 18 %
TSP dropped ~ 12 %
LOI increased from 19.5% to 25.1%
Kazanci [98]Paraffin 42–44Styrene monomerEmulsion polymerization/Not providedOrtho-Phosphoric acid
PER
Gross heat of combustion (QPCS)
Non-combustibility test ISO 1182: mass loss 6.2%
ISO 11925-2: Single-flame source: “d0” class according to EN 13501-1
Amaral [99]Micronal®DS 5001XPMMANot provided/Not providedMelamine
APP
EG
Airbus test AITM 2002 F2
Szczotok [100]Rubitherm®RT27Styrene
divinylbenzene
Suspension - like   polymerization / 10 6 ÷ 10 4 mHexa(methacryloylethylenedioxy) cyclotriphosphazeneThermal degradation
Kang [101]CAPMMAPMMA polymerizationHalloysite nanotubeCone
PHRR decreased by 20% and 33% compared to EP and PCM-EP
Table 15. The composite PCMs recipes described in [104].
SampleParaffin
[wt%]
OBC
[wt%]
EG
[wt%]
CP, AT
[wt%]
GFModified GF
CPCM-17013512
CPCM-27013512
CPCM-35713525
CPCM-47013512
☐—Component not included in the recipe; ☒—Component included in the recipe
Table 16. The LOI index for the two PCM composites [107].
SamplePCM/TBBP-A CompositePCM/TBBP-A/DBDPE Composite
TBBP-A [%]LOI [%]TBBP-A [%]DBDPE [%]LOI [%]
1016.020019.3
21016.915519.9
31518.7101020.3
42019.351521.3
52520.202021.9
Table 17. Cone calorimetry test results for pure hexadecanol, P20 (reference), and two G-type samples [108].
SamplePHRR [kW/m2]TTI [s]FPI [m2s/kW]THR [MJ/m2]
Hexadecanol15511160.075354
G1362910.067239
G-206791420.209125
P-2010881160.107239
Table 18. Self-extinguishing test results [108].
SamplePCM [g]PEPA [g]Burning Time [s]Residual Weight [g]
Hexadecanol10.00.0110.00.05
P208.02.090.02.33
G 10.00.03.59.76
G20 8.02.02.59.92
Table 19. FR composite PCM recipes prepared in [80].
SampleParaffin
[%]
EVA-g-MAH
[%]
EG
[%]
ML
[%]
TPH
[%]
Melting Point
[°C]
Latent Heat
[J/g]
PE6040---47.3122.5
PEE6036.53.5--47.6109.9
MPCM6011.53.525-48.2115.6
MTPCM16011.53.520547.8117.5
MTPCM26011.53.5151046.9118.4
MTPCM36011.53.5101547.5125.7
MTPCM46011.53.552047.3130.0
TPCM6011.53.5-2547.3130.6
Paraffin-----48.8225.7
TPH---- 50.782.4
Table 20. UL-94 test results [80].
SampleUL-94
Grading
PHRR
[kW/m2]
THR
[MJ/m2]
PSPR
[m2/s]
TSP
[m2]
PEV22029.4240.10.1336.0
PEEV2754.9236.10.1013.6
MPCMV2696.5226.90.0611.7
MTPCM3V0499.4193.80.037.8
TPCMV0688.1193.80.0411.2
Table 21. The component proportions and the flammability tests results reported in [86].
SampleComponent RatioFlammability Tests Results
Paraffin
[%]
SBS
[%]
EG [%]FR
[%]
LOI
[%]
UL-94 GradingTotal Duration of the Residual Flame [s]
PS70300018.3V233.2
PSE70273021.0V229.0
PEF570223522.3V217.1
PEF10701731025.9V012.5
PEF15701231535.9V07.5
PEF2070732024.4V216.2
Table 22. The composite flame-retardant PCMs developed in [112].
SampleOA [g]HDDA [g]BPO [g]EG [g]Al(OH)3 [g]Total [g]
CPCM037774120 (0%)400
CPCM10338641240 (10%)400
CPCM15318641260 (15%)400
Table 23. The components of the composite PCM samples prepared in [113].
SampleEG [%]MFAPP [%]LOI [%]UL-94 Grading
CPCM-00017.8-
CPCM-13019.2-
CPCM-231327.3-
CPCM-331529.0V2
CPCM-431730.8V1
CPCM-531932.6V0
CPCM-632135.1V0
CPCM-732338.6V0
CPCM-832543.2V0
Disclaimer/Publisher’s Note: The statements, opinions and data contained in all publications are solely those of the individual author(s) and contributor(s) and not of MDPI and/or the editor(s). MDPI and/or the editor(s) disclaim responsibility for any injury to people or property resulting from any ideas, methods, instructions or products referred to in the content.