Article

Impact of Pipe Diameter on the Discharge Process of Halon1301 in a Fire Extinguishing System with Horizontal Straight Pipe

1
State Key Laboratory of Fire Science, University of Science and Technology of China, Hefei 230026, China
2
AECC Commercial Aircraft Engine Co., Ltd., Shanghai 200241, China
*
Authors to whom correspondence should be addressed.
Fire 2023, 6(8), 287; https://doi.org/10.3390/fire6080287
Submission received: 29 June 2023 / Revised: 23 July 2023 / Accepted: 25 July 2023 / Published: 28 July 2023

Abstract

:
In aviation fire extinguishing systems, the extinguishing agent is stored in a bottle, which is pressurized by nitrogen. When fire occurs, the agent is discharged via pipe and nozzle to the target compartment. The geometry of the pipe has a significant impact on the discharge process, and merits study. In this study of the discharge process of halon1301 using pipes of different diameters, the pressure distribution was significantly influenced by varying pipe diameter. Contributions to pressure drops through the valve/pipe/nozzle were approximately 2%, 8%, and 90%, respectively, when the pipe diameter was larger than the nozzle diameter. The contribution through the pipe increased, and the contribution through the nozzle decreased, as the pipe diameter became smaller. When the pipe diameter was decreased to the nozzle diameter, pressure drops through the valve/pipe/nozzle were 10%, 45%, and 45%, respectively; there was an increased pressure drop through the pipe. Distinctions in pressure distribution led to temperature differences; when there were more pressure drops through the nozzle, the temperature in the pipe was lower.

1. Introduction

Fire extinguishing systems are commonly used to protect aircraft engines and APUs [1,2,3]. Systems are composed of a bottle, pipes, and a connection component, such as a valve or tee. A fire extinguishing agent is stored in the bottle, which is pressurized by nitrogen to, for example, 4.3 MPa or 5.2 MPa. When fire occurs, the valve between the bottle and the pipe is actuated, and the pressure in the bottle drives the agent/nitrogen mixture through the pipe to the target compartment. Regulations require that the volume concentration should be larger than 6% for at least 0.5 s, and that the agent should be discharged as quickly as possible [4].
The efficiency of fire extinguishing is determined by the discharge process of the agent from the bottle to the outlet nozzle. Significant effort has been devoted to the study of the discharge process of the agent. Studies show that the agent’s flow in the bottle and pipe is complicated due to its transient, compressible, and two-phase nature [5]. The duration of the discharge process is between 1 s and 10 s, depending on the pipe length and diameter, and branching [6]. For halon fire extinguishing systems, the process can be divided into three stages [7]. At the first stage, the pressure in the bottle is above the saturation pressure of halon, and the halon is liquid, with a certain amount of dissolved nitrogen [8,9,10,11,12]. In this stage, the liquid in the bottom moves from the bottle to the pipe. At the second stage, the dissolved nitrogen releases from the liquid [13,14,15,16,17,18,19,20]. The released nitrogen forms bubbles, and increases the gas volume fraction of the outflow. At the final stage, the liquid phase in the bottle is extinguished (due to advection and flashing), and the outflow is now purely gaseous. However, there are more subtleties if we closely examine the bottle and the pipe.
During depressurization of the bottle, the gas temperature in the upper layer of the bottle drops due to expansion; the dropping rate, due to higher compressibility and low density (and, therefore, lower heat capacity), is larger than the dropping rate in the lower layer. The temperature drop is less than 5 °C [12] during this phase. However, when the pressure drops below the saturation pressure, the liquid flashes and the temperature drops sharply. The temperature drop caused by flashing is 10 °C, which is larger than the drop caused by gas expansion. When the liquid is exhausted, the temperature starts to rise due to convection generated by the large temperature difference inside and outside the system.
The influence of the bottle condition on the discharge process was studied by Li Q. et al. [13,14]. It was found that as the initial bottle pressure increased, the discharge time decreased exponentially and nitrogen bubbles occurred earlier. The gasification ratio of the extinguishing agent was found to decrease as initial pressure increased. It was also found that the VOF method combined with the Hertz–Knudsen phase transition model provided precise prediction of pressure changes in the bottle [14].
High pressure from the bottle compresses air in the pipes, and the temperature in the pipe increases sharply. However, the increase has a short duration, because the liquid agent is advected from the bottle to the pipe. As the pressure in the pipe is below the saturation pressure of halon, the liquid halon flashes, and the temperature sharply drops until the pipe pressure rises to the saturation pressure [21,22,23,24,25,26]. When the flashing stops, the pressure in the pipe is still under development [5], which means the pressure distribution is unstable; temperature rises under the unstable pressure distribution. When the pressure development finishes, the pressure gradient in the whole pipe is negative, which accelerates the fluid along the pipe. The energy of the increased velocity comes from enthalpy decrease, which leads to pipe temperature drops. However, the dropping rate is mild, because the liquid phase has a higher density, and therefore a higher heat capacity. When the liquid in the bottle is nearly extinguished, the gas fraction of the flow increases, which significantly decreases the density, and the temperature drops more sharply. The pipe temperature drops by 20~30 °C in this phase. As the pressure decreases in the discharge system, the impact of pressure is diminished. When the magnitude of the pipe wall convection flux exceeds the changes facilitated by pressure, the temperature starts to rise. The temperature continues rising until till the end of discharge.
Research efforts have been devoted to studying the impact of pipeline parameters. Changyu Yuan et al. conducted a numerical study using Peng–Robinson EOS and a one-dimensional model [15]. It showed that the discharge time increases as the pipe’s roughness increases, and that in a branching pipe setting, branch pipe parameters have less impact on the discharge time than those of the main pipe. Li Q. et al. conducted a numerical analysis of pipe geometry [8,9] and also found a negative impact of roughness on discharge time. However, their results further indicated that the impact of roughness is weaker than the impact of the pipe diameter and pipe length, and that increases in the pipeline diameter, the liquid release time, and the total release time of the extinguishing agent all decrease significantly, while the gasification ratio of the extinguishing agent decreases at first and then increases [18]. However, these results were obtained solely from numerical computation, and detailed experimental analysis is required.
In this study, the flow behavior of halon1301 at different pipe diameters was examined using experimental data from a discharge system with a horizontal straight pipe. The analysis focused on pressure distribution. It was shown that pressure distribution has distinct characteristics under different pipe diameters.

2. Materials and Methods

The experiment’s apparatus is depicted in Figure 1. It was composed of a bottle, a valve, a pipe, and a nozzle. Locations of sensors are depicted by yellow dots.
The bottle is shown in Figure 2a. It was welded using two pieces of steel, and had a volume of 3.89 L. Three screw holes penetrating the bottle wall were used to host the sensors. The pipe is shown in Figure 2b. Eight screw holes were used to host the sensors, which were divided into 4 groups and evenly distributed along the pipe. The convergent nozzle was welded to the pipe to avoid geometric intrusion of the pipe’s connection apparatus, which disturbed the flow near the nozzle.
Between the bottle and the pipe, the valve was used to shut or open the flow path. The operational procedure of the valve is depicted in Figure 3. There is an air chamber underneath the pistol, where a hole penetrates the bottom. A membrane is used to block the hole. When the valve is closed, the path from the bottle to the pipe is blocked by the pistol. There is a hole in the top of the pistol, which allows pressure in the air chamber to be equal to the bottle pressure, so that there is no pressure difference above and beneath the pistol. Gravity is balanced by friction, and the pistol stays in its position. There is a filling entrance above the pistol, which can be closed or opened using a one-way valve. While the nitrogen or extinguishing agent is slowly added, the hole in the pistol keeps the pressure balanced, so that the pistol does not move. When an open signal is sent from the control unit, an electrically-controlled needle pierces the membrane, and the membrane breaks under the large pressure difference between the air chamber and the ambient air pressure. The hole on the bottom is large enough that the pressure instantly balances with the ambient pressure. Meanwhile, the beads shown in Figure 3 are driven by the flow and block the hole in the pistol, so that the pressure in the bottle cannot propagate to the air chamber. Now, the pressure above the pistol is high (4.3 MPa) and the pressure below the pistol is low (0.1 MPa). The pistol, driven by pressure, moves downward and opens the path from the bottle to the pipe; the liquid flows out of the bottle into the pipe.
Sensors were fixed to the bottle and pipe via screws (Figure 4). The position and length of screws were designed so that the tips of the sensors were just on the inner surface of the pipe, without further intrusion into flow area. The sample frequency was set to 4096 Hz. The working range of the sensors was 0~10 MPa for the pressure sensor and −40~100 °C for temperature sensors, which covered the ranges encountered in our experiments. The naming convention of data measured at different locations is shown in Figure 1.
Pipes with different diameters were used in the experiments, as listed in Table 1.
Before each experiment, the bottle was pumped to a vacuum. Halon1301 was then added to the bottle, which raised the pressure to approximately 1500~2500 kPa. Nitrogen was then added until the bottle’s pressure was 4300 kPa, which finished the preparation. At the beginning of each experiment, the monitor system was started, which received and processed signals from the sensors. Next, the valve was actuated, and the agent/nitrogen mixture in the bottle was driven into the pipe, and, finally, to the outside. The discharge process spanned 3/3.2/5.2 s for experiments #1/#2/#3, respectively.
Repeatability and validity were verified by repeating #1. The experiment was conducted 5 times. The bottle pressure variation is shown on the left graph of Figure 5, and deviations at different pipe locations are shown on the right graph of Figure 5 (measured as the standard deviation divided by mean value). Data show that the experiment had good repeatability and validity.

3. Results and Discussion

3.1. Discharge Time

The discharge process ended when the bottle pressure (gauge pressure) dropped to zero. As can be seen in Figure 6, increasing the pipe diameter decreased the end time of the discharge process. The end times of discharges for #1/#2/#3 mm were 3.0/3.2/5.2 s, respectively. The pipe diameter in #3 was equal to the nozzle diameter, and the discharge time was 60% later than it was in the other two experiments. This implies that the convergence nozzle accelerated the discharge rate and better achieved the goal of fast discharge. Comparing these results with simulations in [18], where the nozzle was omitted, the discharge time was shown to be less impacted by varying pipe diameter for #1 and #2. This indicated that the delaying effect of the nozzle was larger than that of the pipe diameter.
The bottle was divided into two layers, with the gas phase in the upper layer and the liquid phase in the lower layer. The gas phase was compressible and had lower density (nitrogen: 1.1   kg / m 3 under 1 × 10 5   Pa , and 48.3   kg / m 3 under 1 × 10 6   Pa ) during the depressurization process; the temperature of the gas phase decreased under gas expansion. In our experiment, the temperature dropped from 36.5 °C to approximately 28 °C (left, Figure 7). As the pressure decreased, the magnitude of expansion (in other words, work facilitated by the pressure) decreased. Next, at 1.5 s, the magnitude of convection exceeded the magnitude of expansion, and the temperature stopped decreasing and began rising, according to the first thermal dynamic law (Equation (1), where Q is the convection flux and p Δ V is the work of expansion).
Δ U = T T + Δ T C p d T = Q p Δ V
As shown in Figure 7, the characteristics of bottle temperature variation for #1 and #2 were very different from that of #3. Temperatures of the bottle for #1 and #2 were indistinguishable. However, for #3, the temperature drop rate was slower and the minimal upper bottle temperature was 2 °C lower than it was for the other two experiments.
In conclusion, when the pipe diameter was larger than the nozzle diameter, decreasing the pipe diameter slightly prolonged the discharge time. When the pipe diameter was decreased to the nozzle diameter (as in #3), the discharge time was 60% longer.

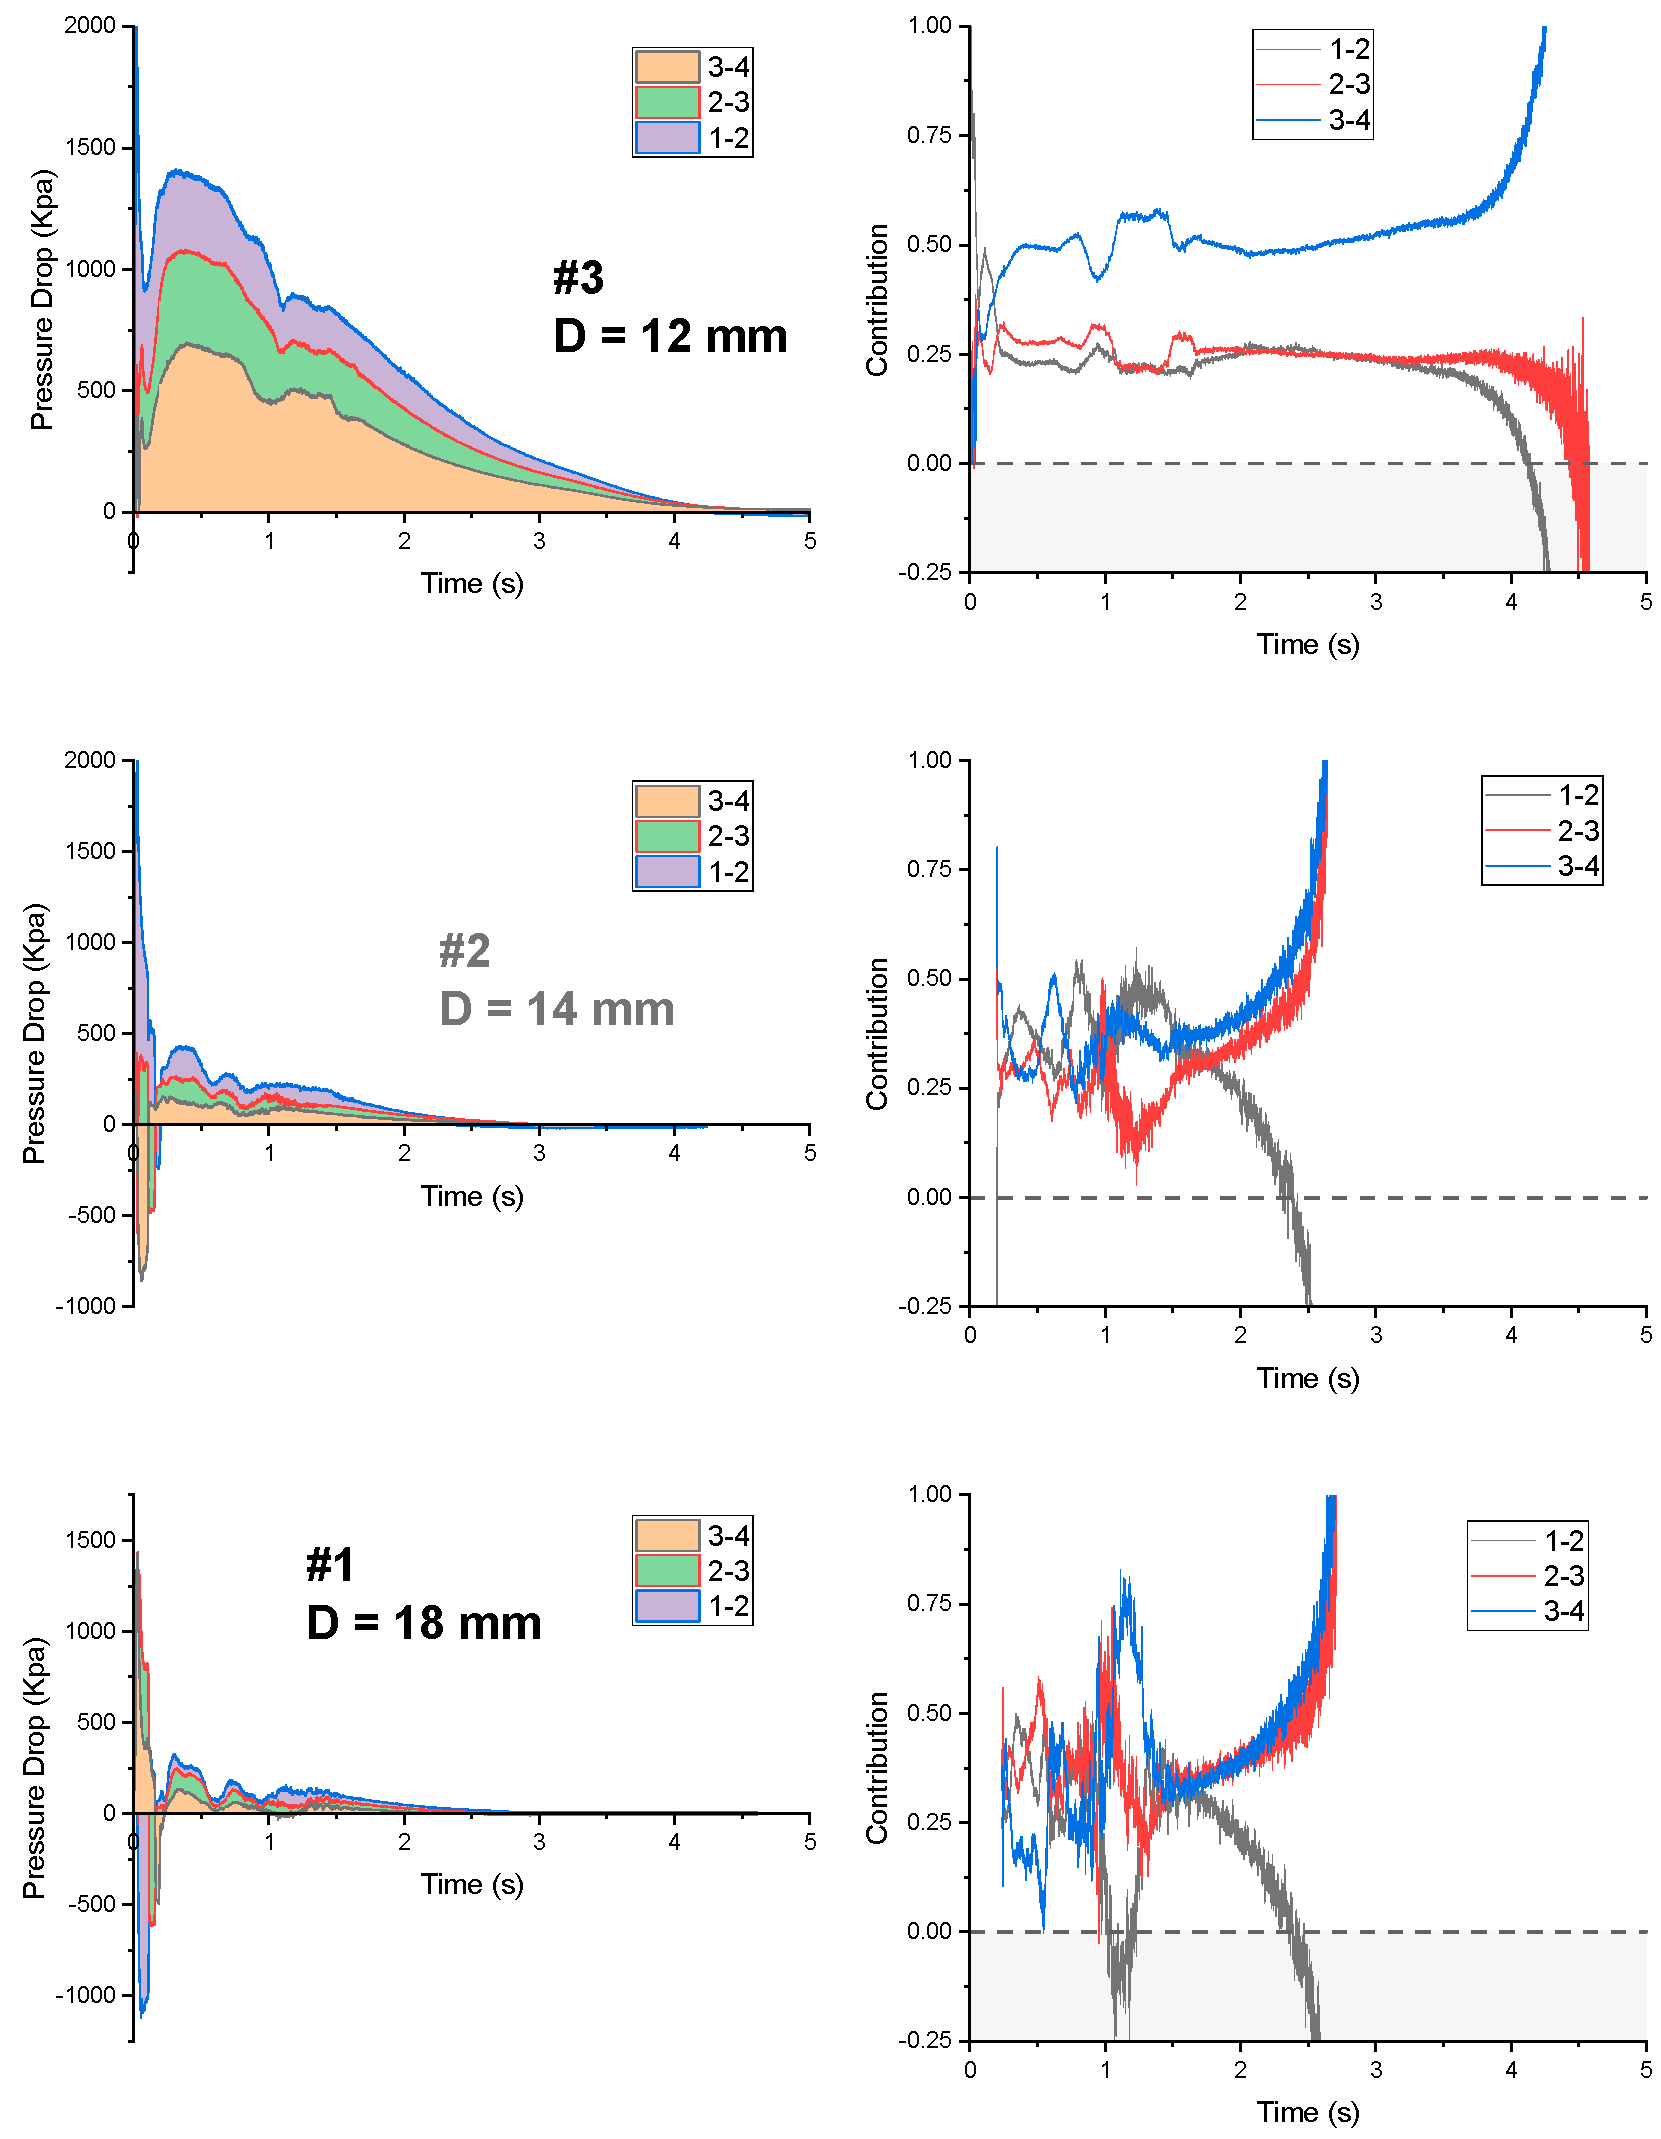
3.2. Pressure Distribution

When flow velocity is subsonic, the pressure wave generated by a disturbance at the nozzle propagates backward, and the overall pressure distribution is thus influenced [27]. For clarity during analysis, we defined pressure drops through the valve/pipe/nozzle as follows:
Δ p v a l v e = p b p 1
Δ p p i p e = p 1 p 4
Δ p n o z z l e = p 1 p a m b i e n t
where p a m b i e n t is the atmosphere pressure; the meaning of the remaining variables are depicted in Figure 1. To compare the relative magnitude of pressure drops, we defined contributions as:
C v a l v e = Δ p v a l v e p b p a m b i e n t
C p i p e = Δ p p i p e p b p a m b i e n t
C n o z z l e = Δ p n o z z l e p b p a m b i e n t
Pressure drops through the valve, pipe, and nozzle are shown in Figure 8.
As can be seen, when the pipe diameter was equal to the nozzle diameter (#3 in Figure 8), the pressure dropped mostly through the pipe and nozzle. The contribution to pressure drops through the valve were large at the beginning, but decreased to less than 10% after 0.25 s. In the time between 0.25 s and 3 s, pressure drops though the pipe and the nozzle were almost equal, and collectively contributed more than 90% of the overall pressure drop. After 3 s, the pressure drop through pipe contributed 90%. Note that the pressure decreased all along the path (no pressure increase was observed).
Pressure drops were significantly different when the pipe diameter was larger than the nozzle diameter (#2 and #1 in Figure 8). Except at the beginning, when pressure drops through the valve contributed the most to overall pressure drops, pressure drops through the nozzle contributed more than 80% during the remaining discharge time. Pressure drops through pipe were below 10% of overall pressure drops. Note that a positive pressure gradient was observed, which can be seen during the negative pipe pressure drop (at 0.1 s for experiment #1 in Figure 8). This occurred because the high pressure generated by the obstacle at the convergent nozzle (Figure 9) was propagated backward. As the flow evolved, the pressure gradient became negative.
Differences in pressure distribution caused the flow in #3 to be driven by the pressure gradient, whereas the flows in #1 and #2 were driven by pressure and expansion. In #1 and #2, because 90% of total pressure drops occurred through the nozzle, the flow at the nozzle was driven by pressure. In the remainder of the discharge system, the pressure gradient was small, and the flow was dragged by the velocity at the nozzle, and expanded. So, there were more temperature drops due to liquid expansion in #1 and #2. This is verified in Figure 10, which shows that #1 and #2 had lower pipe temperatures than #3 did.
Pressure distributions in different segments of pipe are shown in Figure 11; the contribution of pressure drops through each segment is plotted on the right side. On the right side of Figure 11, two sets of data are omitted, as follows. (1) Data from the beginning to the first measurement time, when the pressure was strictly increasing along the pipe, were omitted because the pressure distribution was still under development and was unstable [6,12]. (2) Data when the pipe pressure drop was below 100 kPa (gauge pressure) were omitted, because the overall pressure, which was the denominator in calculating pressure drop contribution, was so close to zero that the calculated numbers tended towards infinity.
As stated previously, the total pressure drop though the pipe for #3 was much larger than it was for the other two experiments, the magnitude of which was 10 3   KPa when the pipe pressure reached its maximum (at approximately 0.5 s). Segment 3-4 contributed to 50% of the pipe pressure drop, while segments 1-2 and 2-3 evenly contributed to the remaining 50%.
In #1 and #2, the magnitude was only 10 2   KPa . The contribution of each segment varied between 0.5 and 0.25, and showed less stability. The process in the pipes of #1 and #2 could be divided into two stages. In the first stage, the pressure in the pipe was unstable, as can be observed at 0~0.2 s, when the pressure might rise or drop along the pipe. In the second stage, the pressure distribution became stable. The pressure did not drop through the whole pipe, which provided momentum to the flow.

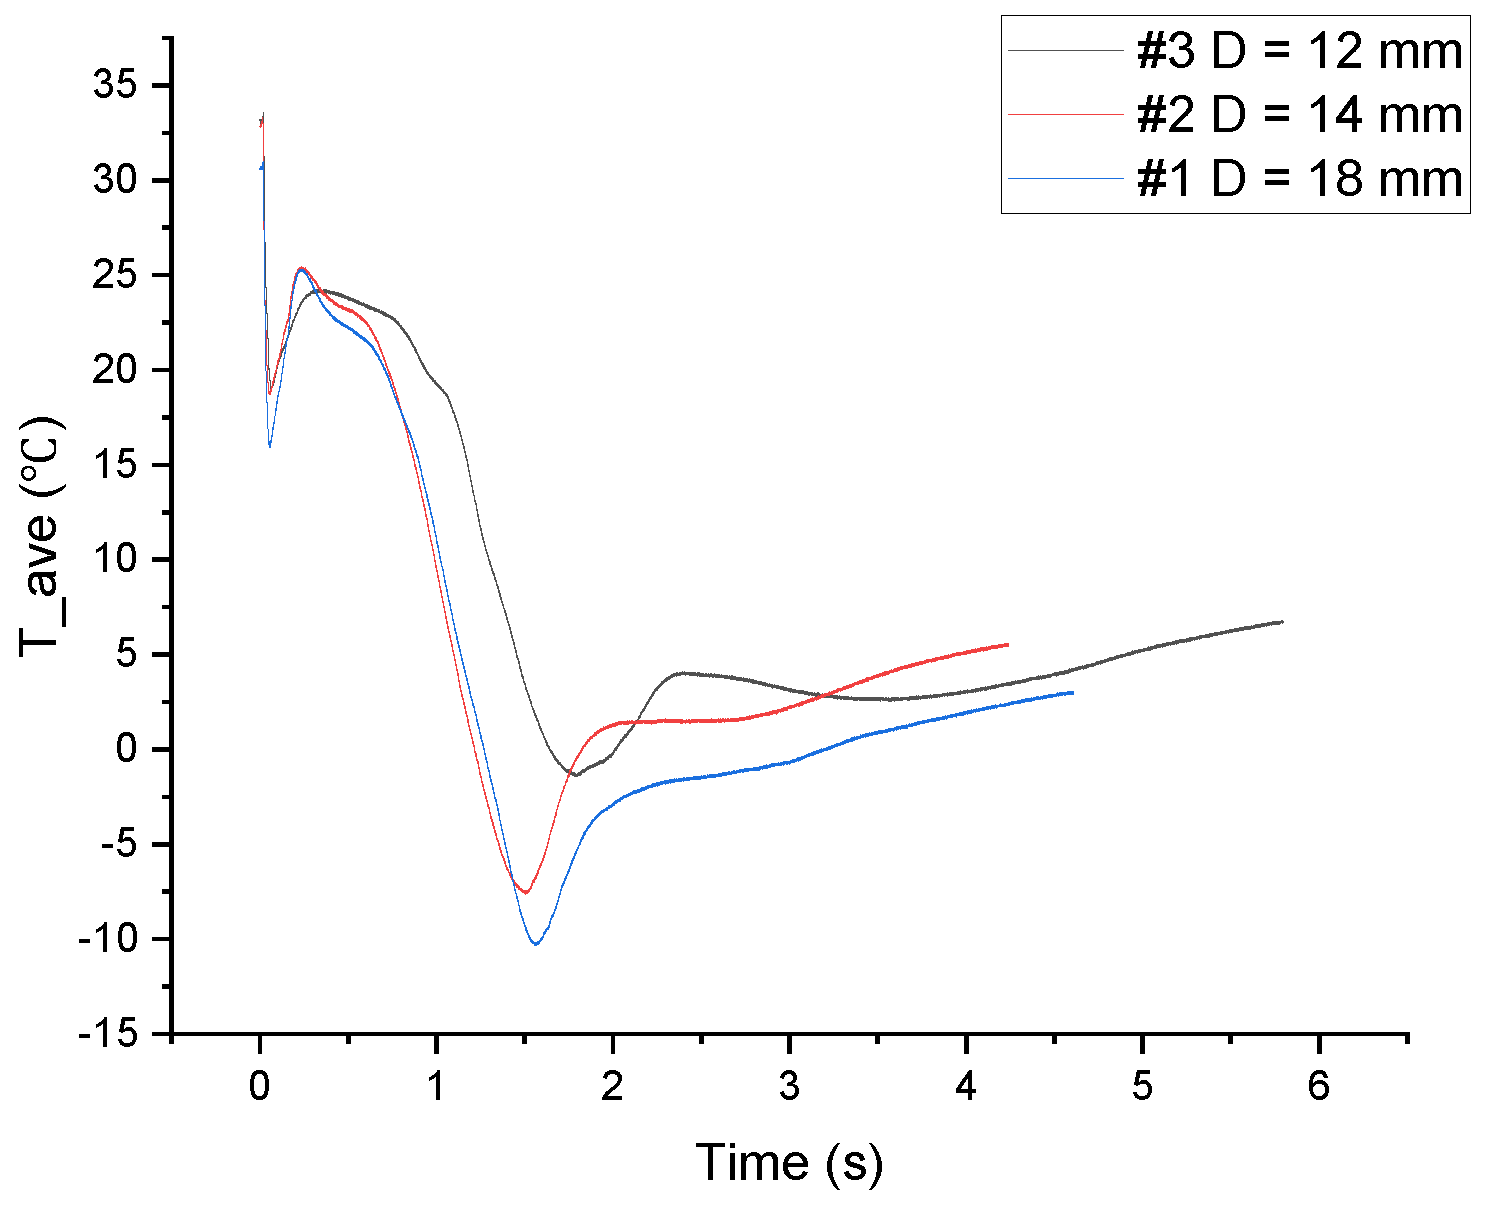
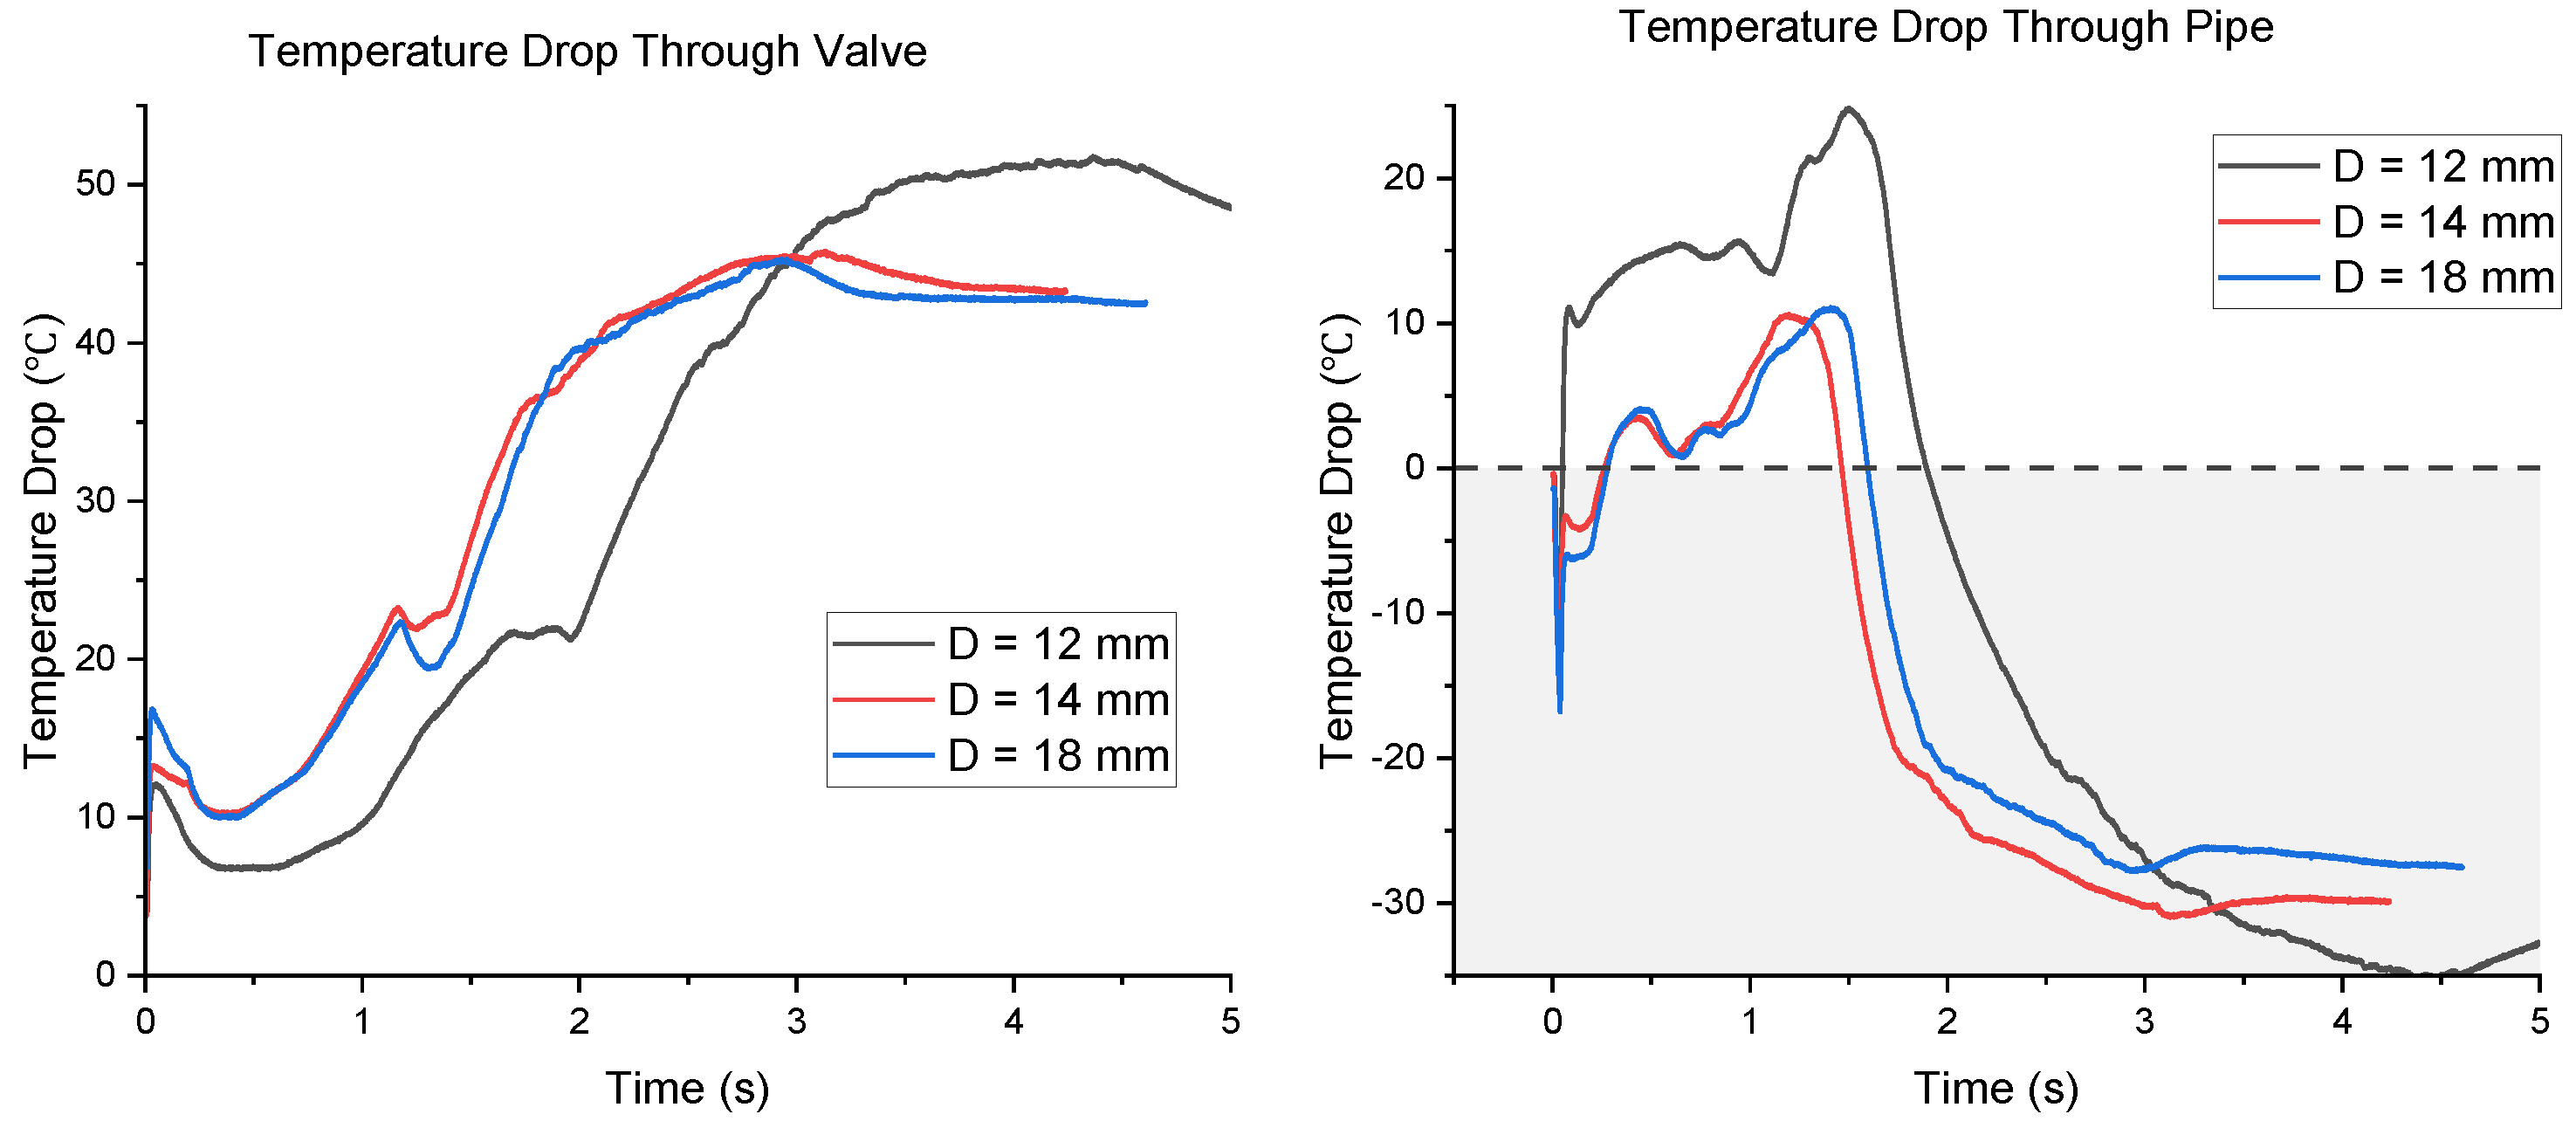
3.3. Pipe Temperature

The average temperatures of the pipes were defined using Equation (8), and are shown in Figure 10.
T a v e = 1 L T d x 1 3 × T 1 2 + T 2 + T 3 + T 4 2
At the beginning, the temperature sharply dropped (Figure 10). This was because of the sharp pressure difference from the bottle to the pipe, which led to the agent liquid flashing. When the pressure in the pipe rose above the saturation pressure, the temperature stopped dropping, and rose. Next, slightly after the pipe pressure reached its maximum (at approximately 0.5 s), the temperature started to drop, which can be explained using Equations (9) and (10). According to Equation (9), a pressure drop along the pipe accelerates the fluid. As the magnitude of the pressure drop was high, the convection from the pipe wall was comparatively negligible (that is, q ˙ 0 in Equation (10)); therefore, the kinetic energy came mainly from a decrease in enthalpy, which was observed as a temperature drop (starting at approximately 0.7 s). However, as the pressure drop decreased (as shown in Figure 8), energy changes caused by the pressure drop became smaller, and the heat from pipe wall convection became significant. Next, as shown in the turning point at approximately 1.5 s in Figure 10, the temperature started to rise under the impact of convection. When the discharge stopped, the average pipe temperature was 0~5 °C. Note that when the temperature started to rise, the energy from the pressure work was smaller than it was from the convection heat, which means that the flow was driven by both pressure and heat.
d 1 2 u 2 ρ + d p = 0
d h + d 1 2 u 2 = q ˙         q ˙ 0 ,   b e f o r e   1.5   s
As can be seen in Figure 10, the point where convection started to dominate in #2 was earlier than it was for #1. The reason for this lies in the geometry of the pipe. The ratio of pipe wall to pipe volume is π D L / π L D 2 4 = 4 / D . Decreasing the pipe diameter increases the ratio, which means the ratio of convection heat to the capacity of fluid increases. So, for D = 14 mm, the influence of convection to temperature was larger than D = 18 mm.
The average pipe temperature of #3 was distinct from #1 and #2. As can been seen in Figure 10, the average pipe temperature of #3 was higher than the average pipe temperatures of #1 and #2 were. This was due to pressure distributions (Figure 8). In #1 and #2, 90% of the total pressure drops occurred through the nozzle; the flow at the nozzle was driven by pressure. In the rest of the discharge system, the pressure gradient was small, and the flow was dragged by velocity at the nozzle, and expanded. Thus, in #1 and #2, there were more temperature drops due to liquid expansion than there were in #3, where the flow in the pipe was driven by the pressure gradient.
Temperature drops through the valve and the pipe were defined in a similar way as the pressure drop in previous sections, and is depicted in Figure 12. As the left figure shows, during the whole discharge process, temperature dropped through the valve, and the magnitude of this temperature drop increased until the discharge process ended (at 3.0/3.2/5.2 s for #3/#2/#1, respectively). For #1 and #2, decreasing the pipe diameter slightly increased temperature drops though the valve. For #3, the temperature dropped less through the valve than it did in the other two experiments.
As for temperature drop through the pipe (right of Figure 12), there was a period when the pipe temperature drop was positive. This period started when the pressure distribution stabilized, and ended when convection started to dominate temperature variation. As can be seen from the figure, for #1 and #2, decreasing the pipe diameter slightly increased the temperature drop. In addition, decreasing the pipe diameter also shortened the temperature drop’s duration, as can be seen at the zero points on the temperature curves. The zero point of #2 was 0.2 s earlier than the intersection of #1. The reason for this is as previously stated: decreasing the pipe diameter increased the ratio of pipe surface to pipe volume, which resulted in more convection and/or less heat capacity. For #3, the magnitude of the temperature drop was much larger than it was for the other two experiments. This was because the pressure gradient in the pipe was much larger than it was in #1 and #2.

4. Conclusions

In this study, the discharge process of halon1301 in a discharge system with varying pipe diameter was examined, focusing on pressure distribution. Data show that when the pipe diameter was larger than the nozzle diameter, flow characteristics were distinctly different than they were when the pipe diameter equaled the nozzle diameter.
When the pipe diameter was larger than the nozzle diameter, the discharge time decreased as the pipe diameter increased, and the contribution to the pressure drop through the pipe increased as the pipe diameter decreased. However, the contribution through valve/pipe/nozzle was approximately 2%/8%/90%, respectively. As most of the pressure was released through the path from the nozzle to the outside, the flow at the nozzle was mainly driven by pressure, while in the remaining sections, due to the limited pressure gradient, flow was driven by continuity of mass (intuitively, dragged by the high-speed flow at the nozzle). Thus, there was significantly more temperature loss due to fluid expansion. As our data show, pipe temperatures of #1 and #2 were 10 °C lower than #3’s were, on average.
When the pipe diameter was decreased to the nozzle diameter, the pressure distribution significantly changed. In #3, pressure drops through the valve/pipe/nozzle were approximately 10%/45%/45%, respectively. The magnitude of the pressure gradient in the pipe was much larger. Unlike #1 and #2, where the flow in the pipe was driven by continuity of mass, the pipe flow in #3 was driven by the pressure gradient.
Distinctions in pressure distributions imply completely different flow natures. However, due to limitations in measurements, it was difficult to obtain information regarding flow rate, speed, and component fractions. More advanced measurement technology is required to further explore the nature of the two-phase, compressible, and transient flow in extinguishing systems.

Author Contributions

Conceptualization, S.L. and J.W.; data curation, Y.C., Q.H. and X.N.; formal analysis, X.N.; methodology, Y.C., C.Z. and Q.H.; supervision, J.W.; validation, C.Z. and J.H.; writing—review and editing, Y.C. All authors have read and agreed to the published version of the manuscript.

Funding

This study was supported by the National Science and Technology Major Project (J2019-VIII-0010-0171), and the National Natural Science Foundation of China (U1933126).

Institutional Review Board Statement

Not applicable.

Informed Consent Statement

Not applicable.

Data Availability Statement

Data sharing not applicable.

Conflicts of Interest

The authors declare no conflict of interest.

References

  1. Hariram, S.; Philipp, P.; Dummeyer, D. Fire protection: Engines and Auxiliary power units. Aero Q. 2010, 10, 15. [Google Scholar]
  2. Hariram, S.S. Fire Protection on Airplanes; SAE: Warrendale, PA, USA, 2005. [Google Scholar]
  3. Lee, J. Simulation method for the fire suppression process inside the engine core and APU compartments. In Proceedings of the Fourth Triennial International Aircraft Fire and Cabin Safety Research Conference, Lisabon, Portugal, 21–23 May 2004. [Google Scholar]
  4. DElliott, G.; Garrison, P.W.; Klein, G.A.; Moran, K.M.; Zydowicz, M.P. Flow of Nitrogen-Pressurized Halon 1301 in Fire Extinguishing Systems; JPL Publication: Pasadena, CA, USA, 1984; Volume 84, p. 62. [Google Scholar]
  5. Ni, X.; Chen, Y.; Huang, Q.; Zhao, C.; Li, S.; Huang, J.; Wang, J. An Experimental Study on the Transportation Characteristics of Perfluoro(2-methyl-3-pentanone) in a Straight Pipe. Fire 2023, 6, 156. [Google Scholar] [CrossRef]
  6. Jiang, Y.; Hua, M.; Yan, P.; Zhang, H.; Li, Q.; Pan, X. The transport and diffusion characteristics of superheated fire extinguish agent released via different nozzles in a confined space. Saf. Sci. 2020, 129, 104787. [Google Scholar] [CrossRef]
  7. Yuan, C.; Wang, Y.; Li, H.; Dai, C.; Lu, S.; Zhang, H. ‘Simulation study of filling conditions for aircraft fire suppression systems’. In Proceedings of the IET Conference Proceedings, Nanchang, China, 17–20 August 2022; pp. 1172–1178. [Google Scholar]
  8. Robinson, D.B.; Peng, D.Y. A New Two-Constant Equation of State Industrial and Engineering Chemistry: Fundamentals. Ind. Eng. Chem. Fundam. 1976, 15, 59–64. [Google Scholar]
  9. Huber, M.L.; Ely, J.F. A predictive extended corresponding states model for pure and mixed refrigerants including an equation of state for R134a. Int. J. Refrig. 1994, 17, 18–31. [Google Scholar] [CrossRef]
  10. Yang, J.C.; Huber, M.L.; Boyer, C.I. Model for Calculating Alternative Agent/Nitrogen Thermodynamic Properties; NIST: Gaithersburg, MD, USA, 1995. [Google Scholar]
  11. Duan, Q.; Xiao, H.; Gao, W.; Shen, X.; Wang, Q.; Sun, J. Experimental investigation on shock waves generated by pressurized gas release through a tube. J. Loss Prev. Process. Ind. 2015, 36, 39–44. [Google Scholar] [CrossRef]
  12. Li, Q.; Ge, H.; Pan, R.; Zhang, Z.; Chen, R. Numerical Study on Flow and Release Characteristics of Gas Extinguishing Agent under Different Filling Pressure and Amount Conditions. Processes 2021, 9, 1683. [Google Scholar] [CrossRef]
  13. Jin, J.; Pan, R.; Chen, R.; Xu, X.; Li, Q. Flow and Diffusion Characteristics of Typical Halon Extinguishing Agent Substitute under Different Release Pressures. Processes 2020, 8, 1684. [Google Scholar] [CrossRef]
  14. Tuzla, K.; Palmer, T.; Chen, J.C.; Sundaram, R.K.; Yeung, W.S. Development of Computer Program for Fire Supressant Fluid Flow; Lehigh University & Duke Engineering and Services, Inc.: Bethlehem, PA, USA, 2000. [Google Scholar]
  15. Liu, R.; Yuan, C.; Ma, W.; Liu, S.; Lu, S.; Zhang, H.; Gong, J. Simulation Study on Aircraft Fire Extinguishing Pipeline with Different Filling Conditions and Pipeline Characteristics. Fire 2022, 5, 86. [Google Scholar] [CrossRef]
  16. Amatriain, A.; Parra, I.; Rubio, G. Study of bubble growth in a multicomponent mixture at high pressure. In Proceedings of the 4th World Congress on Momentum, Heat and Mass Transfer, Roma, Italy, 10–12 April 2019. [Google Scholar]
  17. Li, Q.; Li, Z.; Chen, R.; Zhang, Z.; Ge, H.; Zhou, X.; Pan, R. Numerical Study on Effects of Pipeline Geometric Parameters on Release Characteristics of Gas Extinguishing Agent. Symmetry 2021, 13, 1766. [Google Scholar] [CrossRef]
  18. Li, Q.; He, X.; Chen, Y.; Lin, J.; Zhang, Y.; Chen, R.; Zhou, X. Numerical Study on Effects of Geometric Parameters on the Release Characteristics of Straight Sudden Expansion Gas Extinguishing Nozzles. Symmetry 2021, 13, 2440. [Google Scholar] [CrossRef]
  19. Blander, M. Bubble nucleation in liquids. Adv. Colloid Interface Sci. 1979, 10, 1–32. [Google Scholar] [CrossRef]
  20. Forest, T.W.; Ward, C.A. Homogeneous nucleation of bubbles in solutions at pressures above the vapor pressure of the pure liquid. J. Chem. Phys. 1978, 69, 2221–2230. [Google Scholar] [CrossRef]
  21. Wallis, G. Critical two-phase flow. Int. J. Multiph. Flow 1980, 6, 97–112. [Google Scholar] [CrossRef]
  22. Bartak, J. A study of the rapid depressurization of hot water and the dynamics of vapour bubble generation in superheated water. Int. J. Multiph. Flow 1990, 16, 789–798. [Google Scholar]
  23. Brockett, G.; Curet, H.; Heiselmann, H.W. Experimental Investigations of Reactor System Blowdown; Technical Report; Idaho Nuclear Corp.: Idaho Falls, ID, USA, 1970. [Google Scholar]
  24. Liao, Y.; Lucas, D. A review on numerical modelling of flashing flow with application to nuclear safety analysis. Appl. Therm. Eng. 2021, 182, 116002. [Google Scholar]
  25. Amatriain, A.; Rubio, G.; Parra, I.; Valero, E.; Andreu, D.; Martín, P.M. Mathematical modeling of nitrogen-pressurized Halon flow in fire extinguishing systems. Fire Saf. J. 2021, 122, 103356. [Google Scholar] [CrossRef]
  26. Chen, M.; Xie, Y.; Wu, H.; Shi, S.; Yu, J. Modeling solubility of nitrogen in clean fire extinguishing agent by Peng-Robinson equation of state and a correlation of Henry’s law constants. Appl. Therm. Eng. 2017, 110, 457–468. [Google Scholar] [CrossRef] [Green Version]
  27. Ockendon, H.; Ockendon, J.R. Waves and Compressible Flow; Springer: New York, NY, USA, 2016; pp. 23–25. [Google Scholar]
Figure 1. Experiment apparatus.
Fire 06 00287 g001
Figure 2. Structure of the bottle (a) and the pipe (b).
Fire 06 00287 g002
Figure 3. Structure of the valve.
Fire 06 00287 g003
Figure 4. Sensors and data processing system.
Fire 06 00287 g004
Figure 5. Repetitions of experiment #1: bottle pressure (left) and standard deviation at 4 pipe sensor locations (right).
Fire 06 00287 g005
Figure 6. Pressure in the bottle.
Fire 06 00287 g006
Figure 7. Bottle temperatures at the top (left) and at the bottom (right).
Fire 06 00287 g007
Figure 8. Pressure drops through the nozzle, pipe, and valve.
Fire 06 00287 g008
Figure 9. Backward propagation of pressure (waves).
Fire 06 00287 g009
Figure 10. Average temperatures of the pipes.
Fire 06 00287 g010
Figure 11. Pressure drops though different segments of pipe.
Fire 06 00287 g011
Figure 12. Temperature drops through the valve and the pipe.
Fire 06 00287 g012
Table 1. Experiment settings.
ExperimentPipe Diameter
(mm)
Nozzle Diameter
(mm)
Pipe Length
(m)
Initial Pressure
(KPa)
Halon Mass
(kg)
#11812443002.5
#21412443002.5
#31212443002.5
Disclaimer/Publisher’s Note: The statements, opinions and data contained in all publications are solely those of the individual author(s) and contributor(s) and not of MDPI and/or the editor(s). MDPI and/or the editor(s) disclaim responsibility for any injury to people or property resulting from any ideas, methods, instructions or products referred to in the content.

