Article

Regional High-Rise Building Fire Risk Assessment Based on the Spatial Markov Chain Model and an Indicator System

1
Tianjin Fire Science and Technology Research Institute of MEM, Tianjin 300381, China
2
School of Emergency Management and Safety Engineering, China University of Mining and Technology, Beijing 100084, China
*
Author to whom correspondence should be addressed.
Submission received: 8 December 2023 / Revised: 28 December 2023 / Accepted: 31 December 2023 / Published: 3 January 2024

Abstract

:
High-rise buildings (HRBs) are prone to high fire hazards due to their high occupant density, limited evacuation routes, and high fire load. The indicator system method, as a systematic evaluation method, is widely applied to assess HRB fire risk. However, the method is subjective because the determination of the indicator weights mainly relies on expert experience. In order to reduce the subjectivity of the indicator system method in assessing the fire risk of HRBs, this study proposes a new assessment method by combining the spatial Markov chain model and the indicator system method. In this new method, fire occurrence probability is calculated by the spatial Markov chain model using historical HRB fire accident data. An indicator system is built to characterize the fire consequence by the structure entropy weight method. Subsequently, HRBs in Beijing are used as a case to illustrate the practicality of this approach. Firstly, the spatial Markov chain model is trained and validated using the chi-square goodness-of-fit test based on fire accident data from 2018 to 2023 in Beijing. It was found that the best performance was achieved with the monthly period and the four-state. Then, the distribution of regional fire occurrence probability in April was predicted based on fire accident data in March 2023 in Beijing. It showed that areas with higher fire occurrence probability are mainly located in the central region, especially in the I District. Then, the indicator system was used to evaluate the HRB fire consequence in the I District. The assessment results showed that the areas with more severe fire consequences are mainly located in the II and IV Districts, due to the poor performance of the fire system or the absence of fire protection systems. Coupling the fire occurrence probability and its consequences shows that HRBs with higher fire risk are mainly located in area II and should be carefully supervised for fire management. This developed method can provide some insights into the fire safety management of HRBs and the layout of the fire stations.

1. Introduction

With the rapid progress of urbanization, the number of high-rise buildings (HRBs) increases continually due to the land shortage in highly populated cities [1]. HRBs refer to high-rise civil buildings, including high-rise residential buildings (with a building height greater than 27 m) and high-rise public buildings (with a building height greater than 24 m) [2]. Up to 2017, there were 347,000 HRBs in China, and the number of HRBs was the largest in the world [3]. HRBs have become an important part of the city, playing an important role in urban development [4]. However, HRB fire accidents have occurred frequently in recent years, causing a large number of casualties and economic losses, which has hindered the sustainable development of cities. In 2022, 17,000 HRB fire accidents were reported in China, they resulted in 260 deaths and 252 injuries [5]. HRB fires involve multiple factors, including building characteristics, human factors, fire management, and so on. For example, in May 2023, a fire caused by a cable line fault broke out in a high-rise residential building in Shanxi Province, China, resulting in five deaths and a direct economic loss of CNY 8.4 million. In this accident, the rapid spread of smoke through the unclosed fire doors was the main cause of death [6]. Consequently, it is of significant importance to conduct an HRB fire risk assessment for fire management from a systematic perspective.
Some scholars have conducted relevant research on the fire risk assessment of HRBs. Rahardjo et al. [7] built an indicator system based on five aspects, such as site planning, exit road, etc., and then analyzed 50 HRBs by combining the analytic hierarchy, objective matrix, and traffic light system methods. They found that the unavailability of access for fire officers, poor roads, and inadequate fire system designs were the main reasons that caused the severe fire losses. Kumar et al. [8] built an indicator system for public high-rise residential buildings of older adults. Subsequently, they analyzed the apartment fire risk by the Delphi, analytic hierarchy process, and fuzzy comprehensive evaluation methods. It was shown that the existing fire systems and fire management systems could not meet the evacuation needs of the elderly. Kang et al. [9] focused on the impact of building status and safety management systems on fire risk. An indicator system and fuzzy set theory were combined to quantify each indicator. Wang et al. [10] used the fire risk analysis method for engineering (FRAME) with BIM technology to assess a building’s fire risk. Then they employed this method to assess a postal office building’s fire risk and found that this method can rapidly and reliably assess fire risk. Nimlyat et al. [11] evaluated the fire awareness of occupants in two high-rise residential buildings by an on-site investigation and questionnaire survey. They found that 88% of the respondents were aware of fire safety measures in buildings. The aforementioned studies demonstrate that the indicator system method is widely used to assess high-rise building fire risk systematically. In addition, some indicators such as building characteristics, active fire protection systems, passive fire protection systems, evacuation systems, and fire management are provided by some scholars. However, on the one hand, the indicator system method is subjective because the calculation of indicator weights mainly relies on expert experience. On the other hand, this method only considers the impact of building features on fire risk, and some historical fire accidents are not considered. In fact, it is evident that fire risk is closely associated with historical fire accidents. Moreover, a large number of historical fire accident data have been collected by the fire departments in recent years, which lays a solid foundation for the analysis of accident data.
The Markov chain model, as a dynamic predictive model, has been widely applied in quantitative risk assessment. Jiang et al. [12] proposed an assessment model for a transmission line based on the Markov chain model and the indicator system method. Then, they took the 39-Bus New England test system as a case to validate the effectiveness of the model. Huang et al. [13] evaluated the IEEE-RTS79 test system operation risk by the Markov chain model and the two-point estimation method. Then, they concluded that this method can be used to assist the dispatcher in making dispatching decisions. Wang et al. [14] obtained a financial pressure index by an early warning indicator system. Then, the financial risk state (two states: low state and high state) was predicted by the Markov chain model, and the results showed that China was in a low financial risk state from 2014 to 2015. Moreover, the spatial Markov chain model, as the extended model of the Markov chain, is used to characterize the temporal and spatial distribution characteristics of some parameters in the study area. For example, Alyousifi et al. [15] analyzed the potential impact of spatial dependence on air pollution distribution in the Malaysian peninsular based on the spatial Markov chain model, and they found that the distribution of air pollution had a strong spatial correlation. Ardianto et al. [16] established a dynamic model to analyze the spatial and temporal relationship of urban residential fire distribution in Melbourne by the Markov chain model. The results showed that the spatial Markov chain model did provide a good fit to the residential fire data and predicted residential building fire occurrence accurately. By analysis of the above studies, it can be found that the combination of the Markov chain model and an indicator system is an effective method to assess the future risk of fire. In addition, the spatial Markov chain model can effectively characterize the distribution of residential fire and predict residential fire occurrence accurately. However, an HRB fire risk assessment using the spatial Markov chain model and indicator system method has not been conducted. In fact, the fire risk is determined by both the fire occurrence probability and the fire consequence [17]. Consequently, it is worth studying the application of the spatial Markov chain model to quantify HRB fire occurrence probability, reducing the subjectivity of the indicator system method in the process of an HRB fire risk assessment.
To this end, in order to reduce the subjectivity of the indicator system method in the process of an HRB fire risk assessment, a new method combining the indicator system method and the spatial Markov chain model is developed. In this method, fire occurrence probability is predicted by the spatial Markov chain model. And the fire consequence is mainly evaluated by the indicator system method. Subsequently, the fire risk can be determined by coupling the fire occurrence probability and the fire consequence. Finally, HRBs in Beijing are used as a case to illustrate the practicality of the method.
The remainder of this paper is organized as follows: Section 2 introduces the analysis framework of the HRB fire risk; Section 3 illustrates the application of the method by using HRBs in Beijing; Section 4 summarizes the main conclusion of this paper.

2. Methodology and Model

2.1. Spatial Markov Chain Model

The Markov chain is a mathematical analysis tool to analyze the stochastic process [15]. This method treats the evolution of a system or phenomenon at different times as a Markov process, characterizing the dynamic changes in a system or phenomenon by using the transfer probability matrix [18,19]. Compared with the analysis methods of spatial and temporal distribution characteristics of elements, such as Thiel index, Sill coefficient, and kernel density estimation [20], the Markov chain model can reflect the dynamic change in elements and predict future distribution [21]. The Markov chain has been widely applied in the fields of prediction of indoor airborne contaminant distribution [22], land cover prediction [23], human activity sequence generation [24], fault diagnosis [25], etc. The spatial Markov chain model introduces the concept of spatial lag based on the traditional Markov chain model, which means that the spatial transfer probability matrix can characterize the influence of certain parameters of nearby locations on the study location under a given time period [26,27]. In this study, time period is defined as discrete units (week, month). The specific steps in predicting the HRB fire occurrence probability using the spatial Markov chain model are as follows.
(1) Determination of grid size.
To establish a spatial Markov chain model, the research area is first divided into equally sized grids. Subsequently, the global Moran’s I test is employed to determine the proper grid size in which the spatial clustering of fire accidents can be reflected. The Moran’s I test is conducted based on the ArcGIS 10.8 software.
(2) Establishment of initial fire data matrix.
For each grid in the research area, the spatial lag value can be calculated as Equation (1):
L a g i , t = j = 1 n Y j , t W i j
where L a g i , t is the spatial lag value of grid i at time t, Y j , t is the number of fire occurrences of the grid j at time t, n is the grid number, and W i j is the spatial weight matrix between grids i and j. In this study, the adjacency matrix is selected as the spatial weight matrix.
(3) Classification of fire data state.
The traditional classified method, such as the quantile grading method, cannot be employed to classify the fire data state in this study due to the infinite number of fire occurrences on a grid. Thus, the fire data state is divided by referring to the research of Ardianto et al. [16]. The description of the fire data state is shown in Table 1.
(4) Establishment of the spatial transfer probability matrix.
M k = p 11 | S 1 t p 12 | S 1 t p 1 j | S 1 t p 21 | S 1 t p 22 | S 1 t p 2 j | S 1 t p i 1 | S 1 t p i 2 | S 1 t p i j | S 1 t p 11 | S n t p 12 | S n t p 1 j | S n t p 21 | S n t p 22 | S n t p 2 j | S n t p i 1 | S n t p i 2 | S n t p i j | S n t = f 11 t j = 1 m f 1 j t | S 1 f 12 t j = 1 m f 1 j t | S 1 f 1 j t j = 1 m f 1 j t | S 1 f 21 t j = 1 m f 2 j t | S 1 f 22 t j = 1 m f 2 j t | S 1 f 2 j t j = 1 m f 2 j t | S 1 f i 1 t j = 1 m f i j t | S 1 f i 2 t j = 1 m f i j t | S 1 f i j t j = 1 m f i j t | S 1 f 11 t j = 1 m f 1 j t | S n f 12 t j = 1 m f 1 j t | S n f 1 j t j = 1 m f 1 j t | S n f 21 t j = 1 m f 2 j t | S n f 22 t j = 1 m f 2 j t | S n f 2 j t j = 1 m f 2 j t | S n f i 1 t j = 1 m f i j t | S n f i 2 t j = 1 m f i j t | S n f i j t j = 1 m f i j t | S n
where M k is the spatial transfer probability matrix of grid k, p i j | S n t is the transfer probability of the fire data state i to state j at time t when the fire data state of neighborhood is S n , f i j t is the number of the fire data state i to state j at time t when the fire data state of neighborhood is S n , and j = 1 m f i j t is the number of the fire data state i to any state at time t when the fire data state of neighborhood is S n .
Finally, the chi-square goodness-of-fit test is used to select the appropriate model. During the process, the fire accident data are divided into the training set and the validation set. And then the chi-square goodness-of-fit test is used to assess the validation results. In the chi-square goodness-of-fit test, the predicted results can be accepted as the p-value is larger than 0.05 [16].

2.2. Indicator System Method

2.2.1. Construction of the Indicator System

An indicator system method is widely used in an HRB fire risk assessment because it is related to many factors [28]. Based on the characteristics of HRBs and previous studies [7,8,9,10,11,29,30], building codes [2,31,32], and related regulations [33], the developed indicator system in this study is divided into five aspects: building characteristics, building firefighting extinguishing capacity, external firefighting extinguishing capacity, personnel characteristics, and the fire management. The constructed indicator system is shown in Table 2.

2.2.2. Indicator Weight Calculation

The subjective weighting method and the objective weighting method are widely used to calculate the indicator weights [34]. The subjective weighting method heavily relies on expert experience but has a strong interpretability, while the objective weighting method has the advantage of strong mathematical theory, but data acquisition is difficult in some cases [35]. Therefore, this study employs the Delphi method and the structural entropy weight (SEW) method to determine the indicator weights. This method combines the advantages of subjective and objective methods and includes qualitative and quantitative analyses [36]. The specific calculation steps are as follows:
(1) Collection of expert opinions and formation of a typical ranking
To begin with, a questionnaire is designed based on the indicator system. Secondly, a panel of experts who are knowledgeable and experienced in HRB fire risk is selected. These invited experts mainly come from research institutions, universities, and fire departments. Subsequently, they are invited to anonymously complete the questionnaire following the requirements of the Delphi method. The ranking of indicators is determined using natural numbers, where “1” represents “the most important”, “2” represents “the relatively important”, and so forth. Finally, the opinions of all experts are summarized to form a typical ranking, as detailed in Table 3.
(2) Blind analysis
Expert opinions often contain noise and uncertainty [37]. Therefore, it is necessary to calculate the entropy value of the questionnaire results using entropy theory to reduce the uncertainty in expert rankings. The specific method is as follows:
Assuming that m experts are invited to complete the questionnaire, and the m sets of questionnaire responses are collected. The questionnaire results are represented as U, where U = U 1 , U 2 , , U m , and U m represents the mth set of questionnaire results. U m can be represented as a m 1 , a m 2 , , a m n , where a m n denotes the ranking of the nth indicator in the mth set of questionnaire results. Therefore, the ranking matrix A formed by the m sets of questionnaire results is represented as A ( A = ( a i j ) m × n , i = 1,2 , , m ; j = 1,2 , , n ) . The details are as follows:
A = a 11 a 12 a 1 n a 21 a 22 a 2 n a m 1 a m 2 a m n
The qualitative rankings should be converted into quantitative values, using the membership function, the details are as follows:
χ I = λ P n I ln P n ( I )
where P n I = k I k 1 , and λ = 1 ln k 1 ( k = n + 2 ) , where k represents the transformation parameter. Substituting these values into Equation (4):
χ I = 1 ln ( m 1 ) m I m 1 ln m I m 1
Dividing both sides by m I m 1 , and letting 1 χ I / m I m 1 = μ ( I ) , then:
μ I = ln ( m I ) ln ( m 1 )
where I is defined as the qualitative ranking of a specific indicator assigned by experts, while μ I represents the membership function value corresponding to the indicator.
By substituting I into Equation (6), the quantitative transformation value b i j is obtained, b i j = μ a i j represents the membership degree of ranking I. The matrix B = ( b i j ) m × n is defined as the membership matrix.
The average understanding degree b j is introduced to present the consistence degree of evaluation on the indicator u j by the m experts. Its calculation method is as follows:
b j = b 1 j + b 2 j + + b m j m
The uncertainty generated by m experts for indicator u j is defined as blindness σ j . It can be calculated as follows:
σ j = max b 1 j , b 2 j , , b m j b j + b j m i n ( b 1 j , b 2 j , , b m j ) / 2
The global understanding degree x j is defined as the overall evaluation level of the m experts on indicator u j . The calculation formula is as follows:
x j = b j ( 1 σ m )
The vector representation of the evaluations of indicator u j by the m experts is denoted as X = x 1 , x 2 , , x m .
(3) Normalized treatment
To obtain the weights of indicator u j , it is necessary to perform normalization processing on X = x 1 , x 2 , , x m . The calculation formula is as follows:
ω j = x j j = 1 m x j
where, ω j > 0 , and j = 1 m ω j = 1 . The vector ω = ω 1 , ω 2 , , ω j represents the weight vector of the indicator set U = U 1 , U 2 , , U m .

2.2.3. Scoring Method

The scoring method for indicators in this study mainly refers to the improved scoring method proposed by Liu et al. [38]. For indicators with specific requirements outlined in the standards, a “0-1-3-5” scoring method is employed. In the method, “0” indicates non-compliance. “1” indicates significantly lower than requirements. “3” indicates slightly lower than requirements, and “5” indicates full compliance with the requirements. For other indicators, a natural number scoring method is used. The scoring standard for indicators mainly refers to related standards, as shown in Table 4.
After the completion of indicator scoring, the obtained scores should be transformed into the percentage scale. The calculation formula is as follows:
S j = Z j G j × 100
where S j is the percentage score of the jth indicator, and Z j is the obtained score of the jth indicator, and G j is the maximum score of the scoring standard for the jth indicator.
Subsequently, the score for the building fire consequence can be calculated using the following formula:
R = i = 1 n ω i j = 1 m ω i j S j
where R is the building fire consequence score, ω i is the weight of the ith secondary indicator, n is the number of the secondary indicators, ω i j is the weight of the jth tertiary indicator under the ith secondary indicator, and m is the number of tertiary indicators under the ith tertiary indicator.
Finally, the fire risk is classified into high risk (red), medium risk (orange), general risk (yellow), and low risk (blue), according to the relevant government document [39]. Additionally, in order to ensure the practical significance of the assessment results, the building scores are arranged in descending order and the risk levels are divided in a ratio of 1:4:4:1 for high risk, medium risk, general risk, and low risk, respectively, as shown in Table 5.

2.3. Fire Risk Analysis Framework for HRBs

2.3.1. HRB Fire Risk Calculation

Assume that the grid Z fire state is being four-state and the state matrix at time t is calculated to be P ( t ) = p 1 , p 2 , p 3 , p 4 . Then, the fire probability of grid Z P f ( t ) can be calculated by the following formula:
P f ( t ) = 1 p 1
where p 1 is the probability that the grid is in “a no fire” state. Then, the P f ( t ) is defined as the building fire probability in this area.
In the end, the building fire risk FR can be calculated as follows:
F R = P f ( t ) × R

2.3.2. Framework of Fire Risk Assessment

The framework of the HRB fire risk assessment is illustrated in Figure 1. Firstly, the probability of HRB fire occurrence is calculated using the spatial Markov chain model, with the key parameters determined based on the historical fire accident data. Secondly, the HRB fire consequence assessment is conducted using the indicator system method. Subsequently, the HRBs of Beijing are selected as a case, and then the probability of fire occurrence and the fire consequence are calculated, respectively. In the end, the fire risk of HRBs in Beijing is determined by considering both the probability and the consequence.

3. Results and Discussion

3.1. Study Area

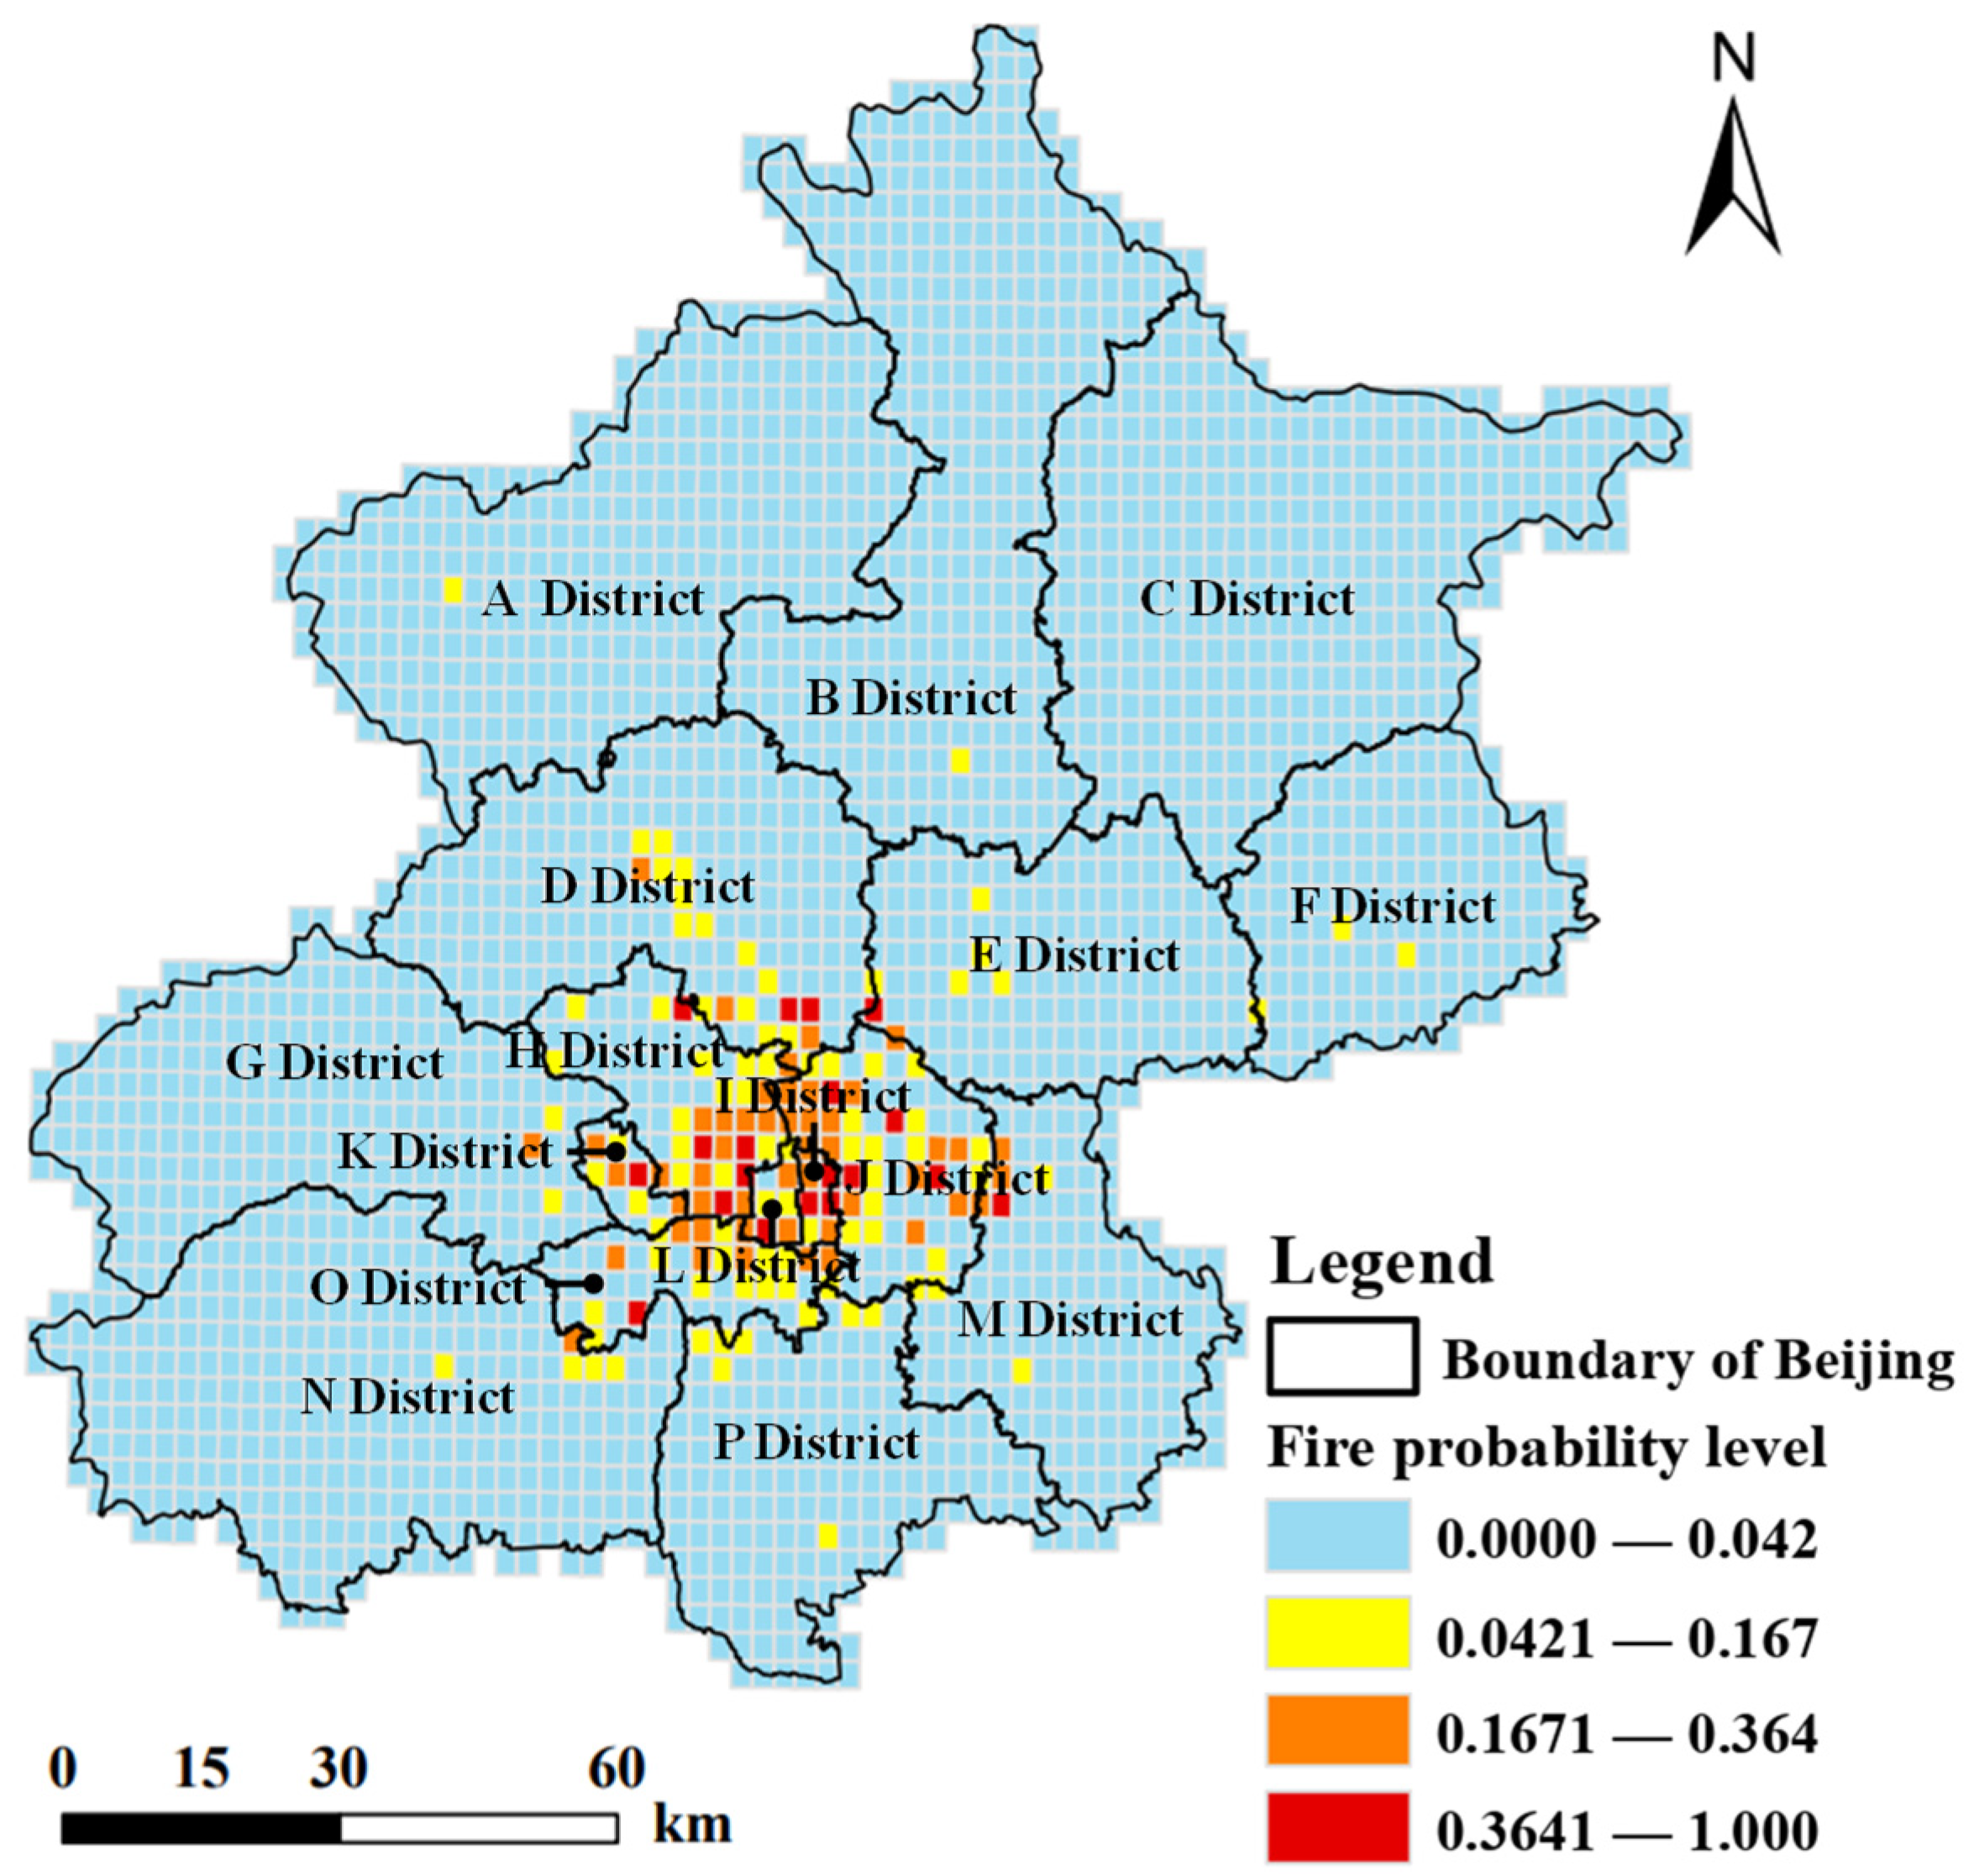
Beijing is the political and cultural center of China and is also renowned as a historical capital and a modern international city. Beijing is mainly composed of 16 administrative regions with a total area of 16,410 square kilometers, as shown in Figure 2. Moreover, the fire accident data (1962 fire accidents of HRB) from 2018 to 2023 in Beijing, provided by the Tianjin Fire Science and Technology Research Institute of MEM (TFRI), are selected. The information on each accident mainly includes the occurrence time (year, month, day, and hour), location, accident cause, etc.

3.2. Regional Fire Risk Prediction

3.2.1. Spatial Autocorrelation

The grid size of 3 km × 3 km is selected preliminarily in this study, based on the related document from The People’s Government of Beijing Municipality [40]. Subsequently, a spatial autocorrelation analysis in the ArcGIS software is performed by using the historical fire accident data. The calculated global Moran’s I value is 0.505151 (>0), meaning that the distribution of HRB fire accidents in Beijing exhibits a spatial positive correlation, i.e., the distribution of fire accidents presents a ‘cluster–cluster’ and ‘dispersion–dispersion’ pattern. Meanwhile, the p-value and z-score are 0 and 59.320478, implying with 99% confidence that the distribution of high-rise building fire accidents exhibits a spatial positive correlation [41,42]. Therefore, the divided grid size (3 km × 3 km) is effective. The spatial Markov chain model can be employed to predict the spatial distribution of HRB fire occurrence in Beijing under the grid size of 3 km × 3 km.

3.2.2. Model Validation

In order to validate the spatial Markov chain model, the fire accident data of HRBs are divided into the training and validation sets according to the ratio of 3:1 and 4:1, respectively. Subsequently, the Chi-square goodness-of-fit test is applied to assess the fitting effect of the spatial Markov chain model for different fire states and time periods. The results are presented in Table 6.
Based on the results presented in Table 6, it can be seen that the p-value of the monthly period exceeds the significance level of 0.05, higher than that of the weekly period. Consequently, the monthly period is selected as the appropriate time frame. Furthermore, it also shows that the p-value of the four-state is the highest compared to other values in Table 6, indicating that the performance of the corresponding model outperforms the other states during the monthly period. As a result, the fire state is selected as the four-state. Finally, the spatial Markov chain model with the monthly period and the four-state is selected to predict the regional fire probability distribution in Beijing.

3.2.3. Distribution of Regional Fire Probability

The fire accident data in March 2023 are used to predict the distribution of regional fire probability in Beijing in April based on the spatial Markov chain model. The results are shown in Figure 3.
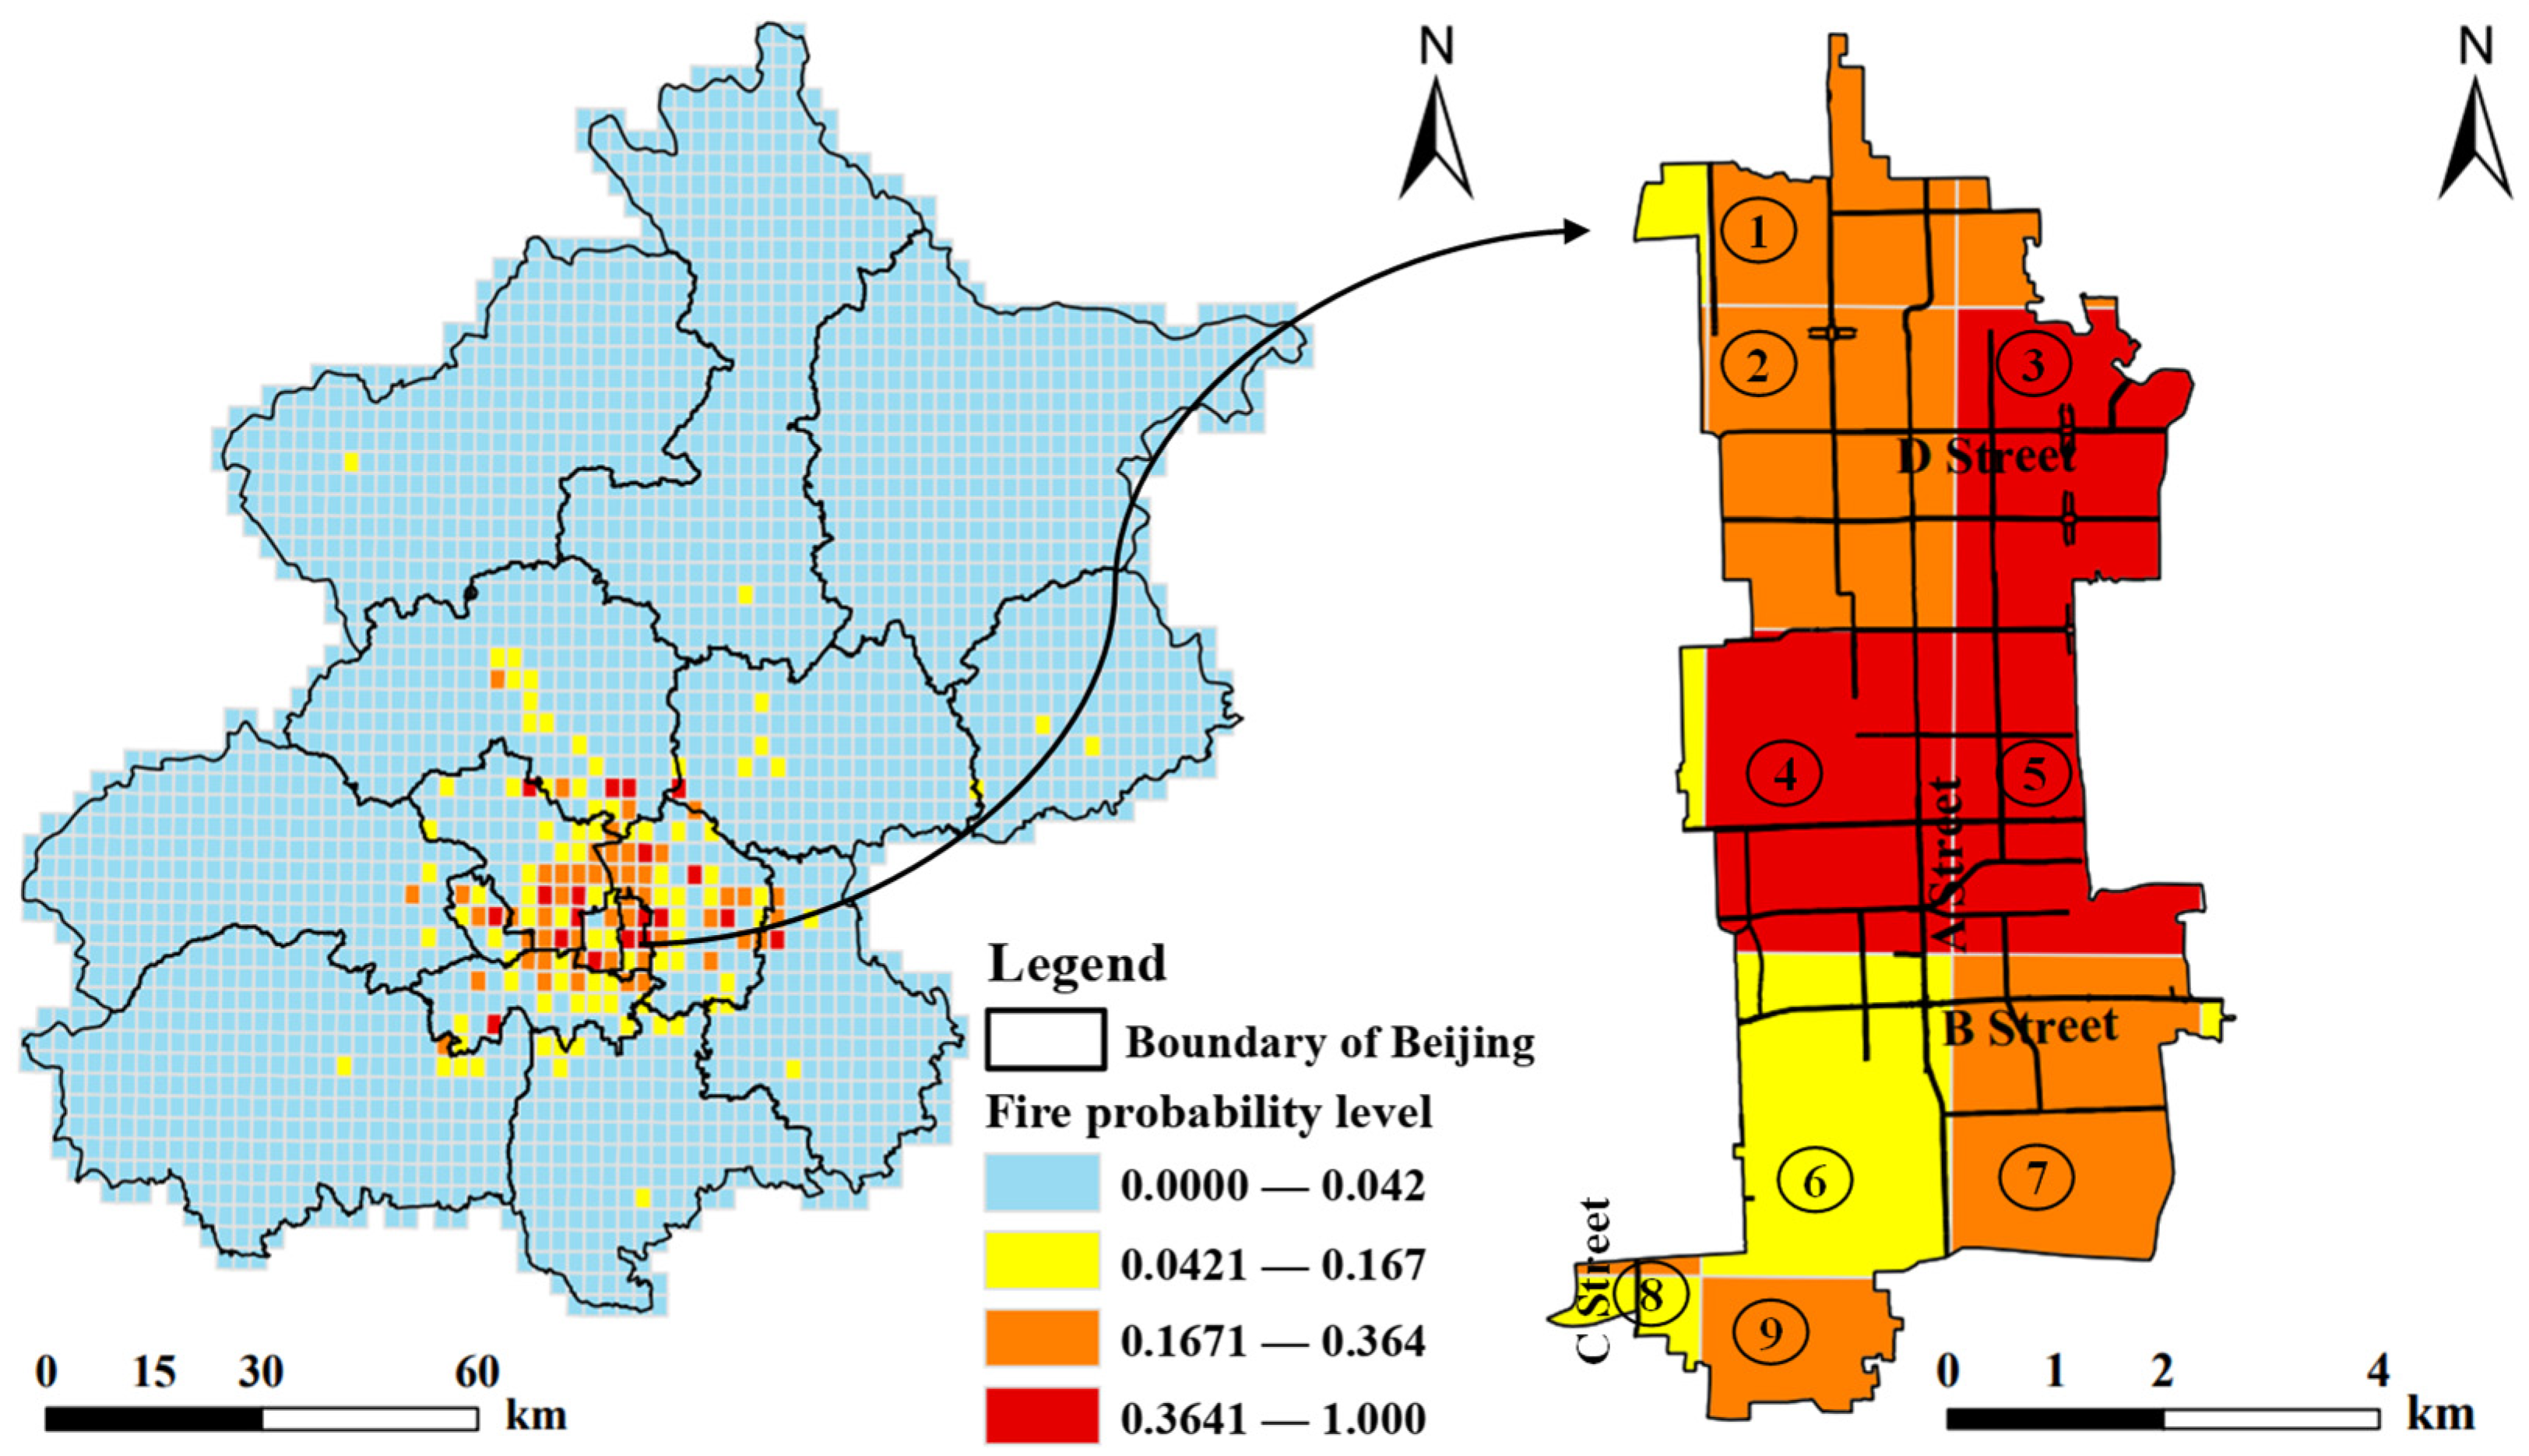
In Figure 3, it is evident that the grids with the higher fire probability primarily are located in the central region of Beijing, mainly including the I, H, J, K, L, and O Districts. This can be attributed to the two aspects. On the one hand, the population density plays a pivotal role. The population number of the central region accounts for 50.2% of the permanent population in Beijing [43]. On the other hand, there are large number of HRBs in the central region. For example, to the year of 2017, there were approximately 12,316 HRBs in the central region, constituting more than 60% of the total in Beijing [44]. In addition, it can be found that the I District has the highest probability of fire occurrence. The detailed calculated results are shown in Figure 4.
In Figure 4, it can be seen that those areas marked as ③, ④, and ⑤ exhibit a high fire probability. This can be attributed to the large number of fire accidents that occurred in neighborhoods of those areas. For instance, the number of fires that occurred in those neighborhoods was 247 from 2018 to 2023, accounting for over 57% of the total neighborhoods of the I District. In these fire accidents, the fires caused by electrical faults and carelessness are predominant by the analysis of the historical fire accident data. The main reasons can be attributed to two aspects. On the one hand, more than 800 HRBs were built before 2010, accounting for more than 80% in I District. Among them, more than 270 buildings were built earlier than 2000, based on the basic HRB data provided by the TFRI. In these old buildings, the circuit design load is usually insufficient and the power consumption is high [45]. On the other hand, the proportion of old permanent residents aged 60 and above in the I District is the largest (27%) [46], and it is common to see fires caused by the carelessness of these old persons.

3.3. HRB Fire Consequence Assessment

Due to the higher fire probability of the I District, the HRBs of this district are selected to assess the fire consequence. Furthermore, the HRBs are divided into public buildings (PBs) and residential buildings (RBs) in the assessment.

3.3.1. Indicator Weight Calculation

To determine the weight of the indicators, 23 experts from some research institutions, universities, fire departments, and relevant companies were invited to complete the questionnaire. Then, a total of 20 valid responses were collected. Subsequently, the responses were processed by the SEW Method, and the calculated results are shown in Table 7.

3.3.2. Distribution of Building Fire Consequence

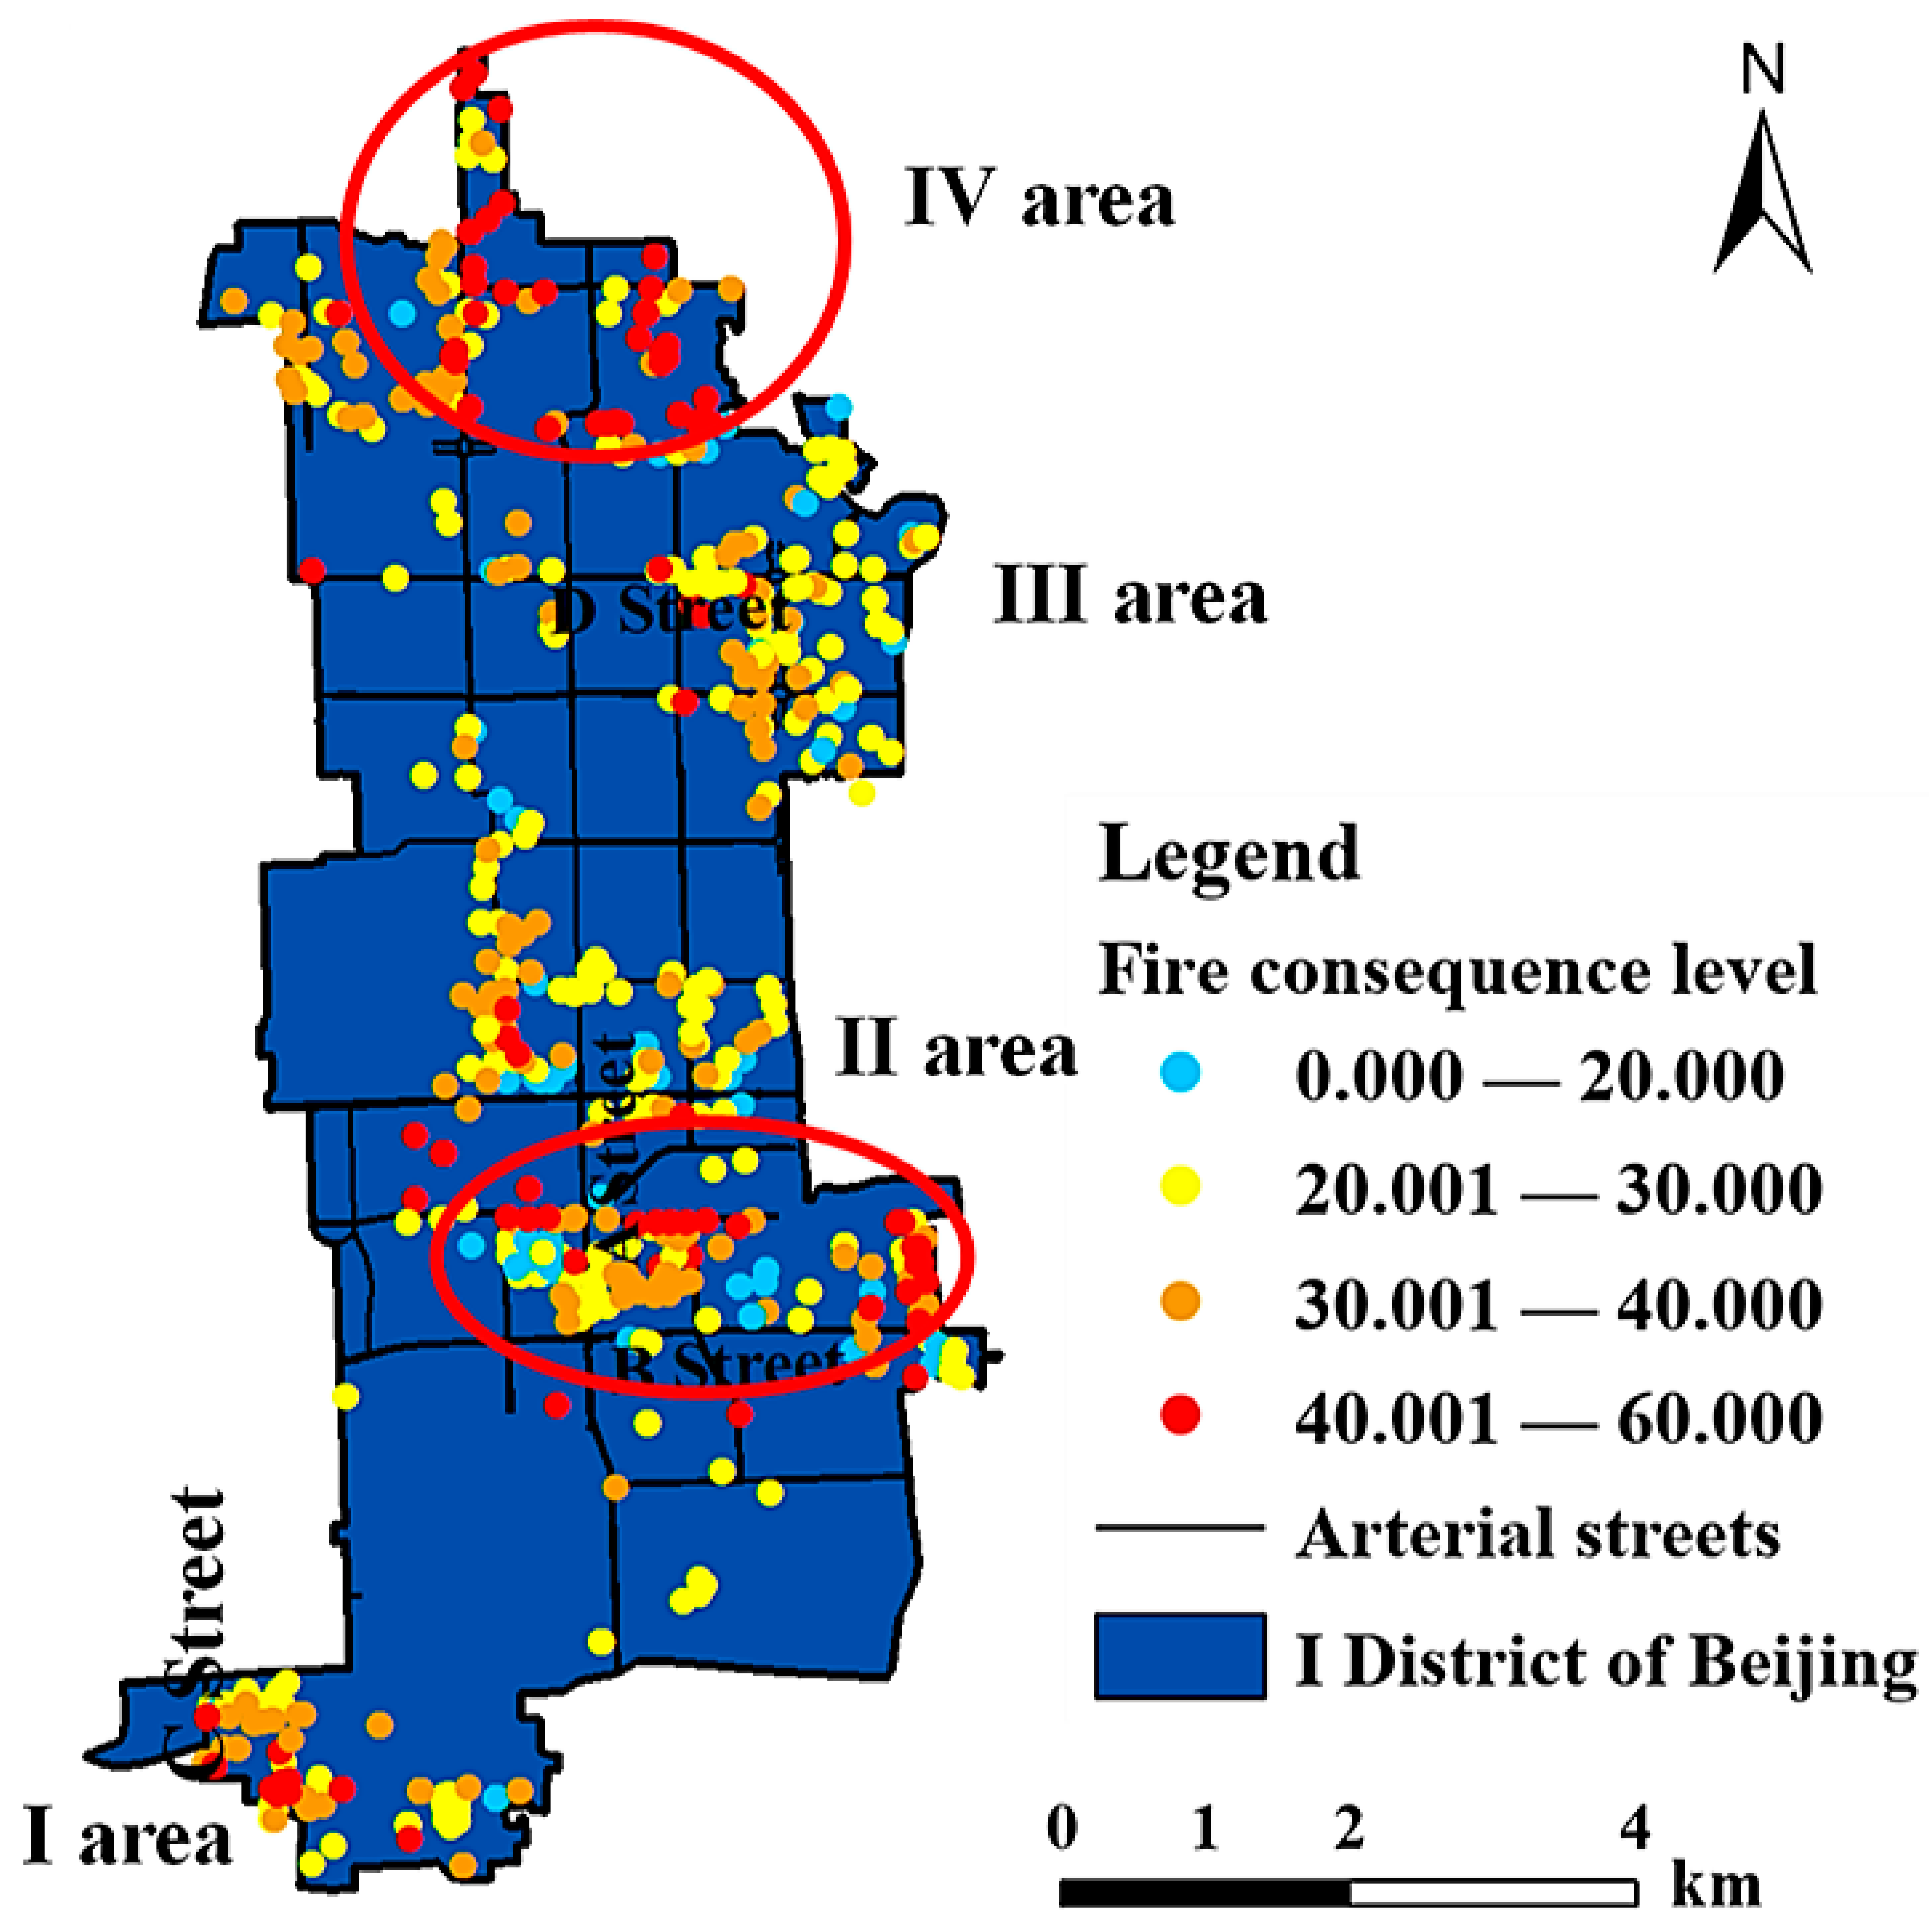
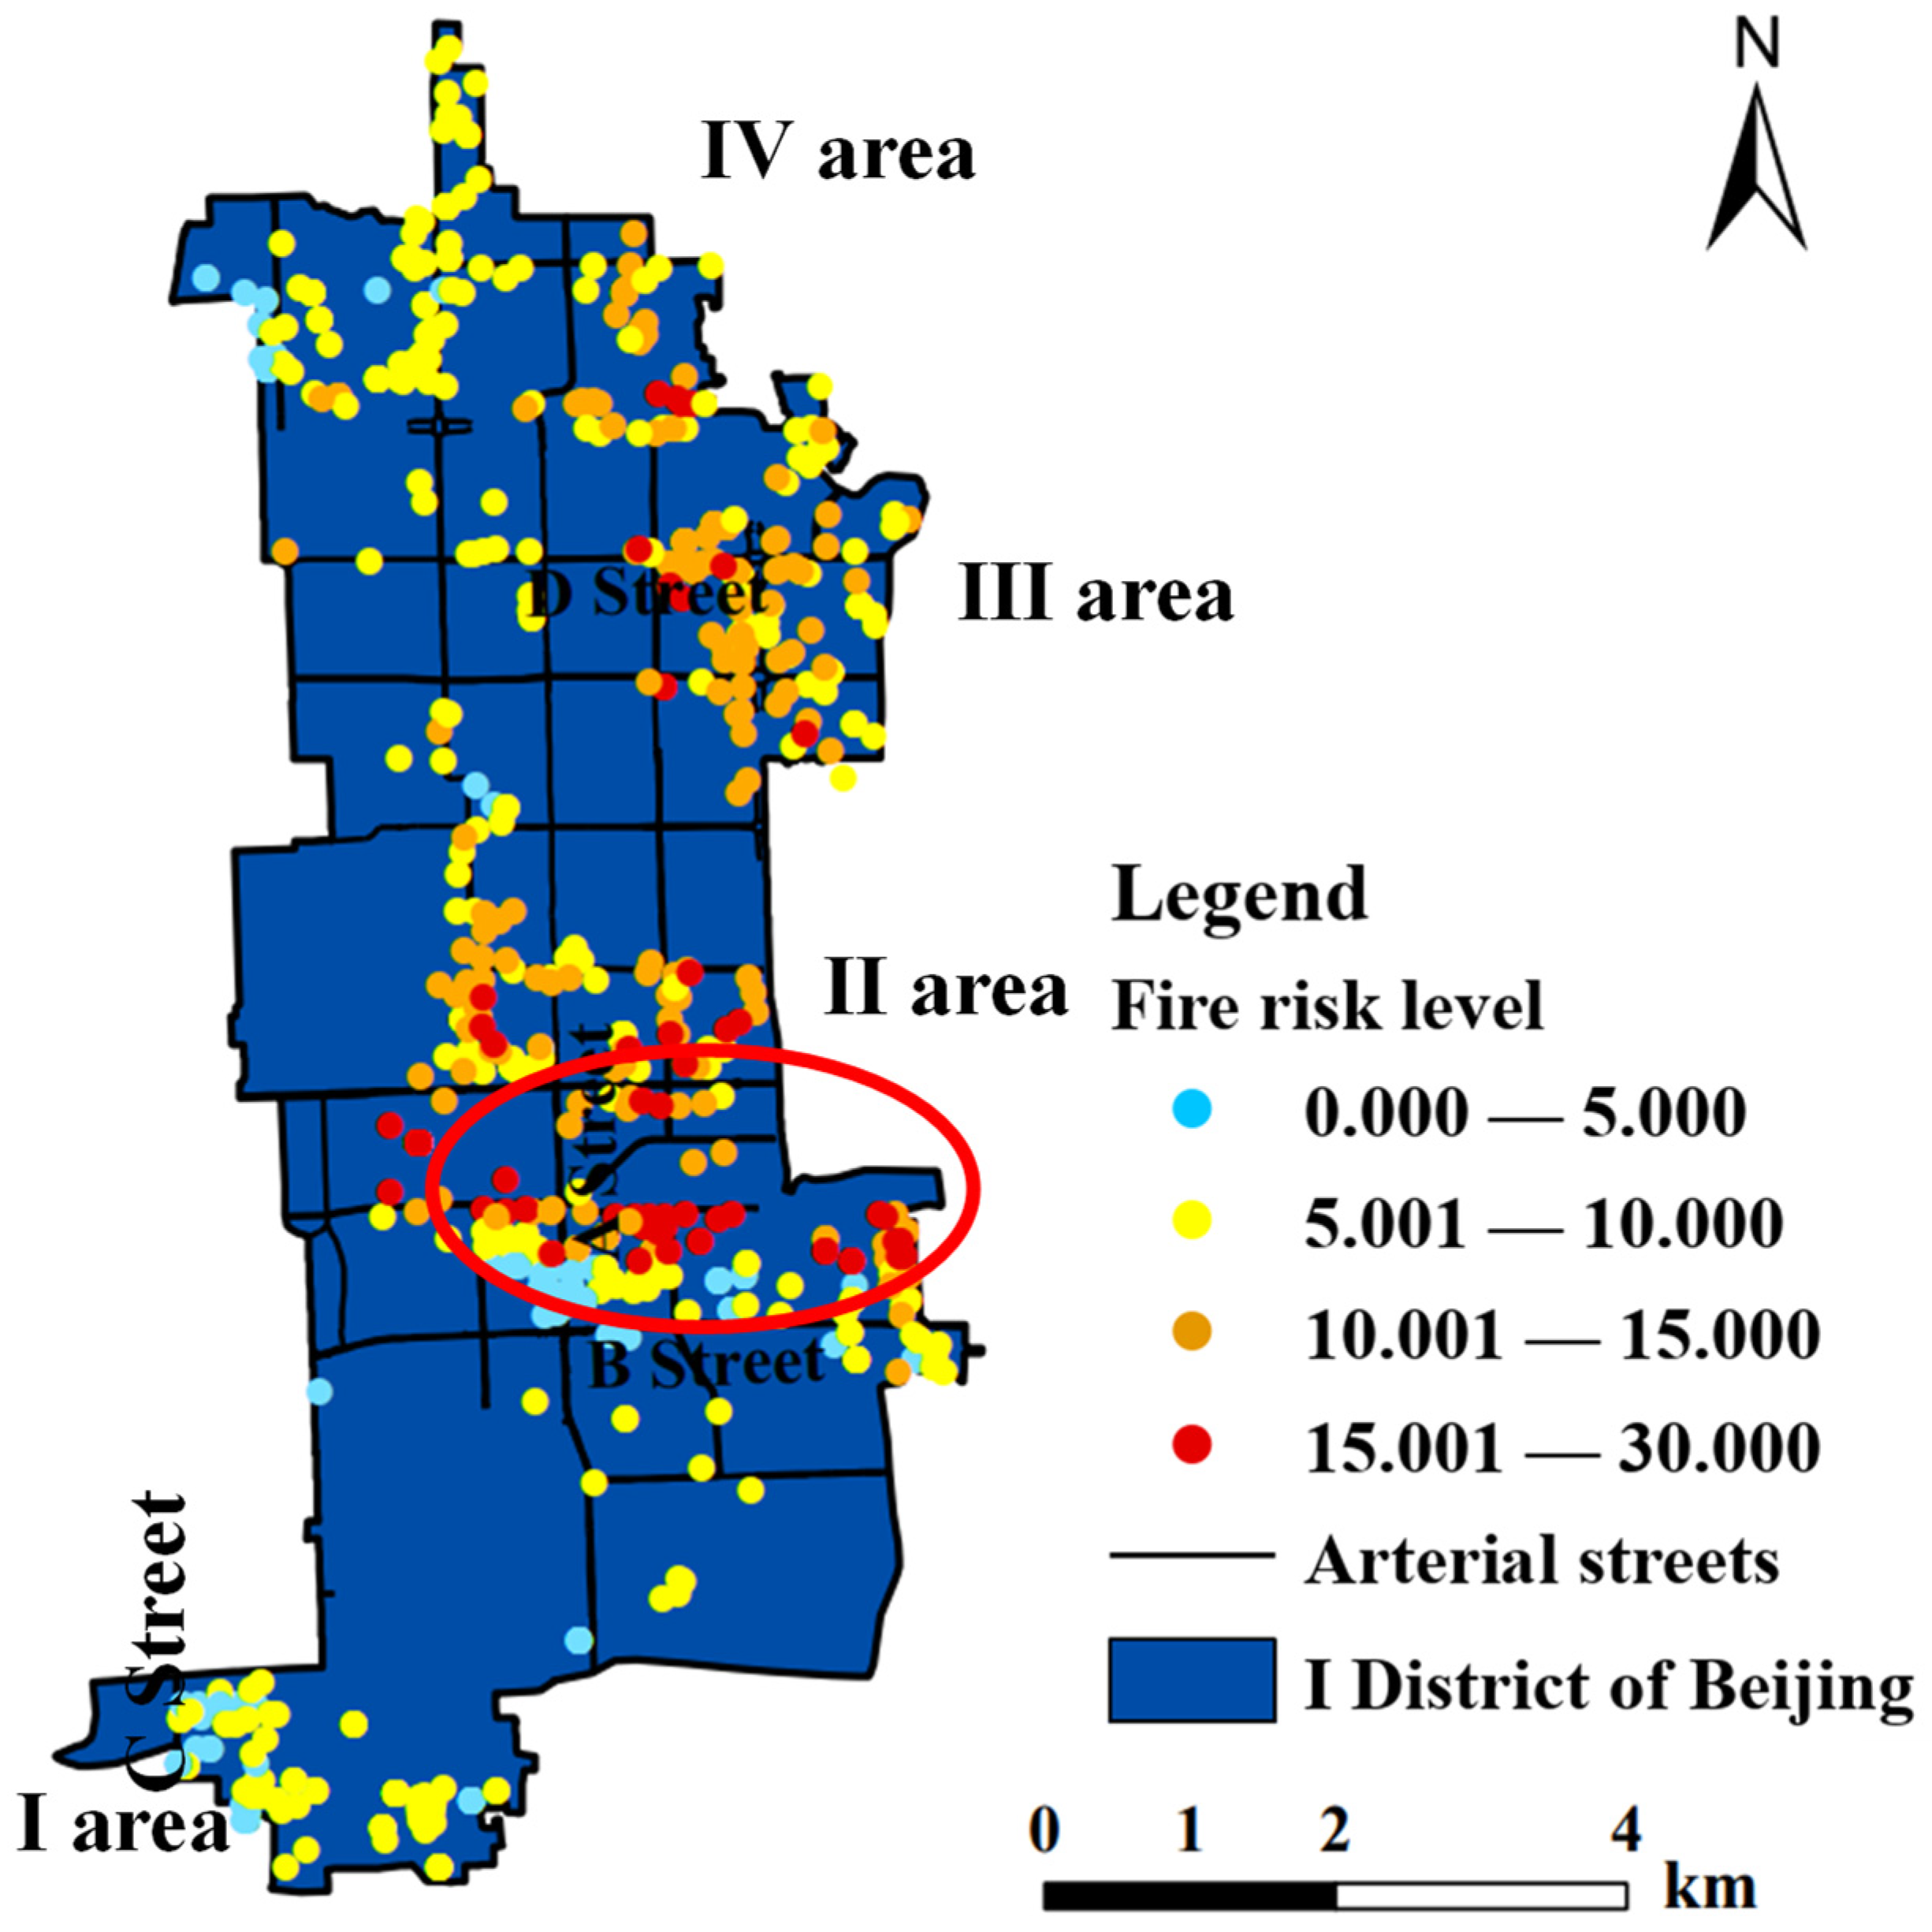
The fire consequence assessment of HRBs in the I District was conducted by combining the scoring standards as shown in Table 4. The distribution of HRB fire consequences can be found in Figure 5.
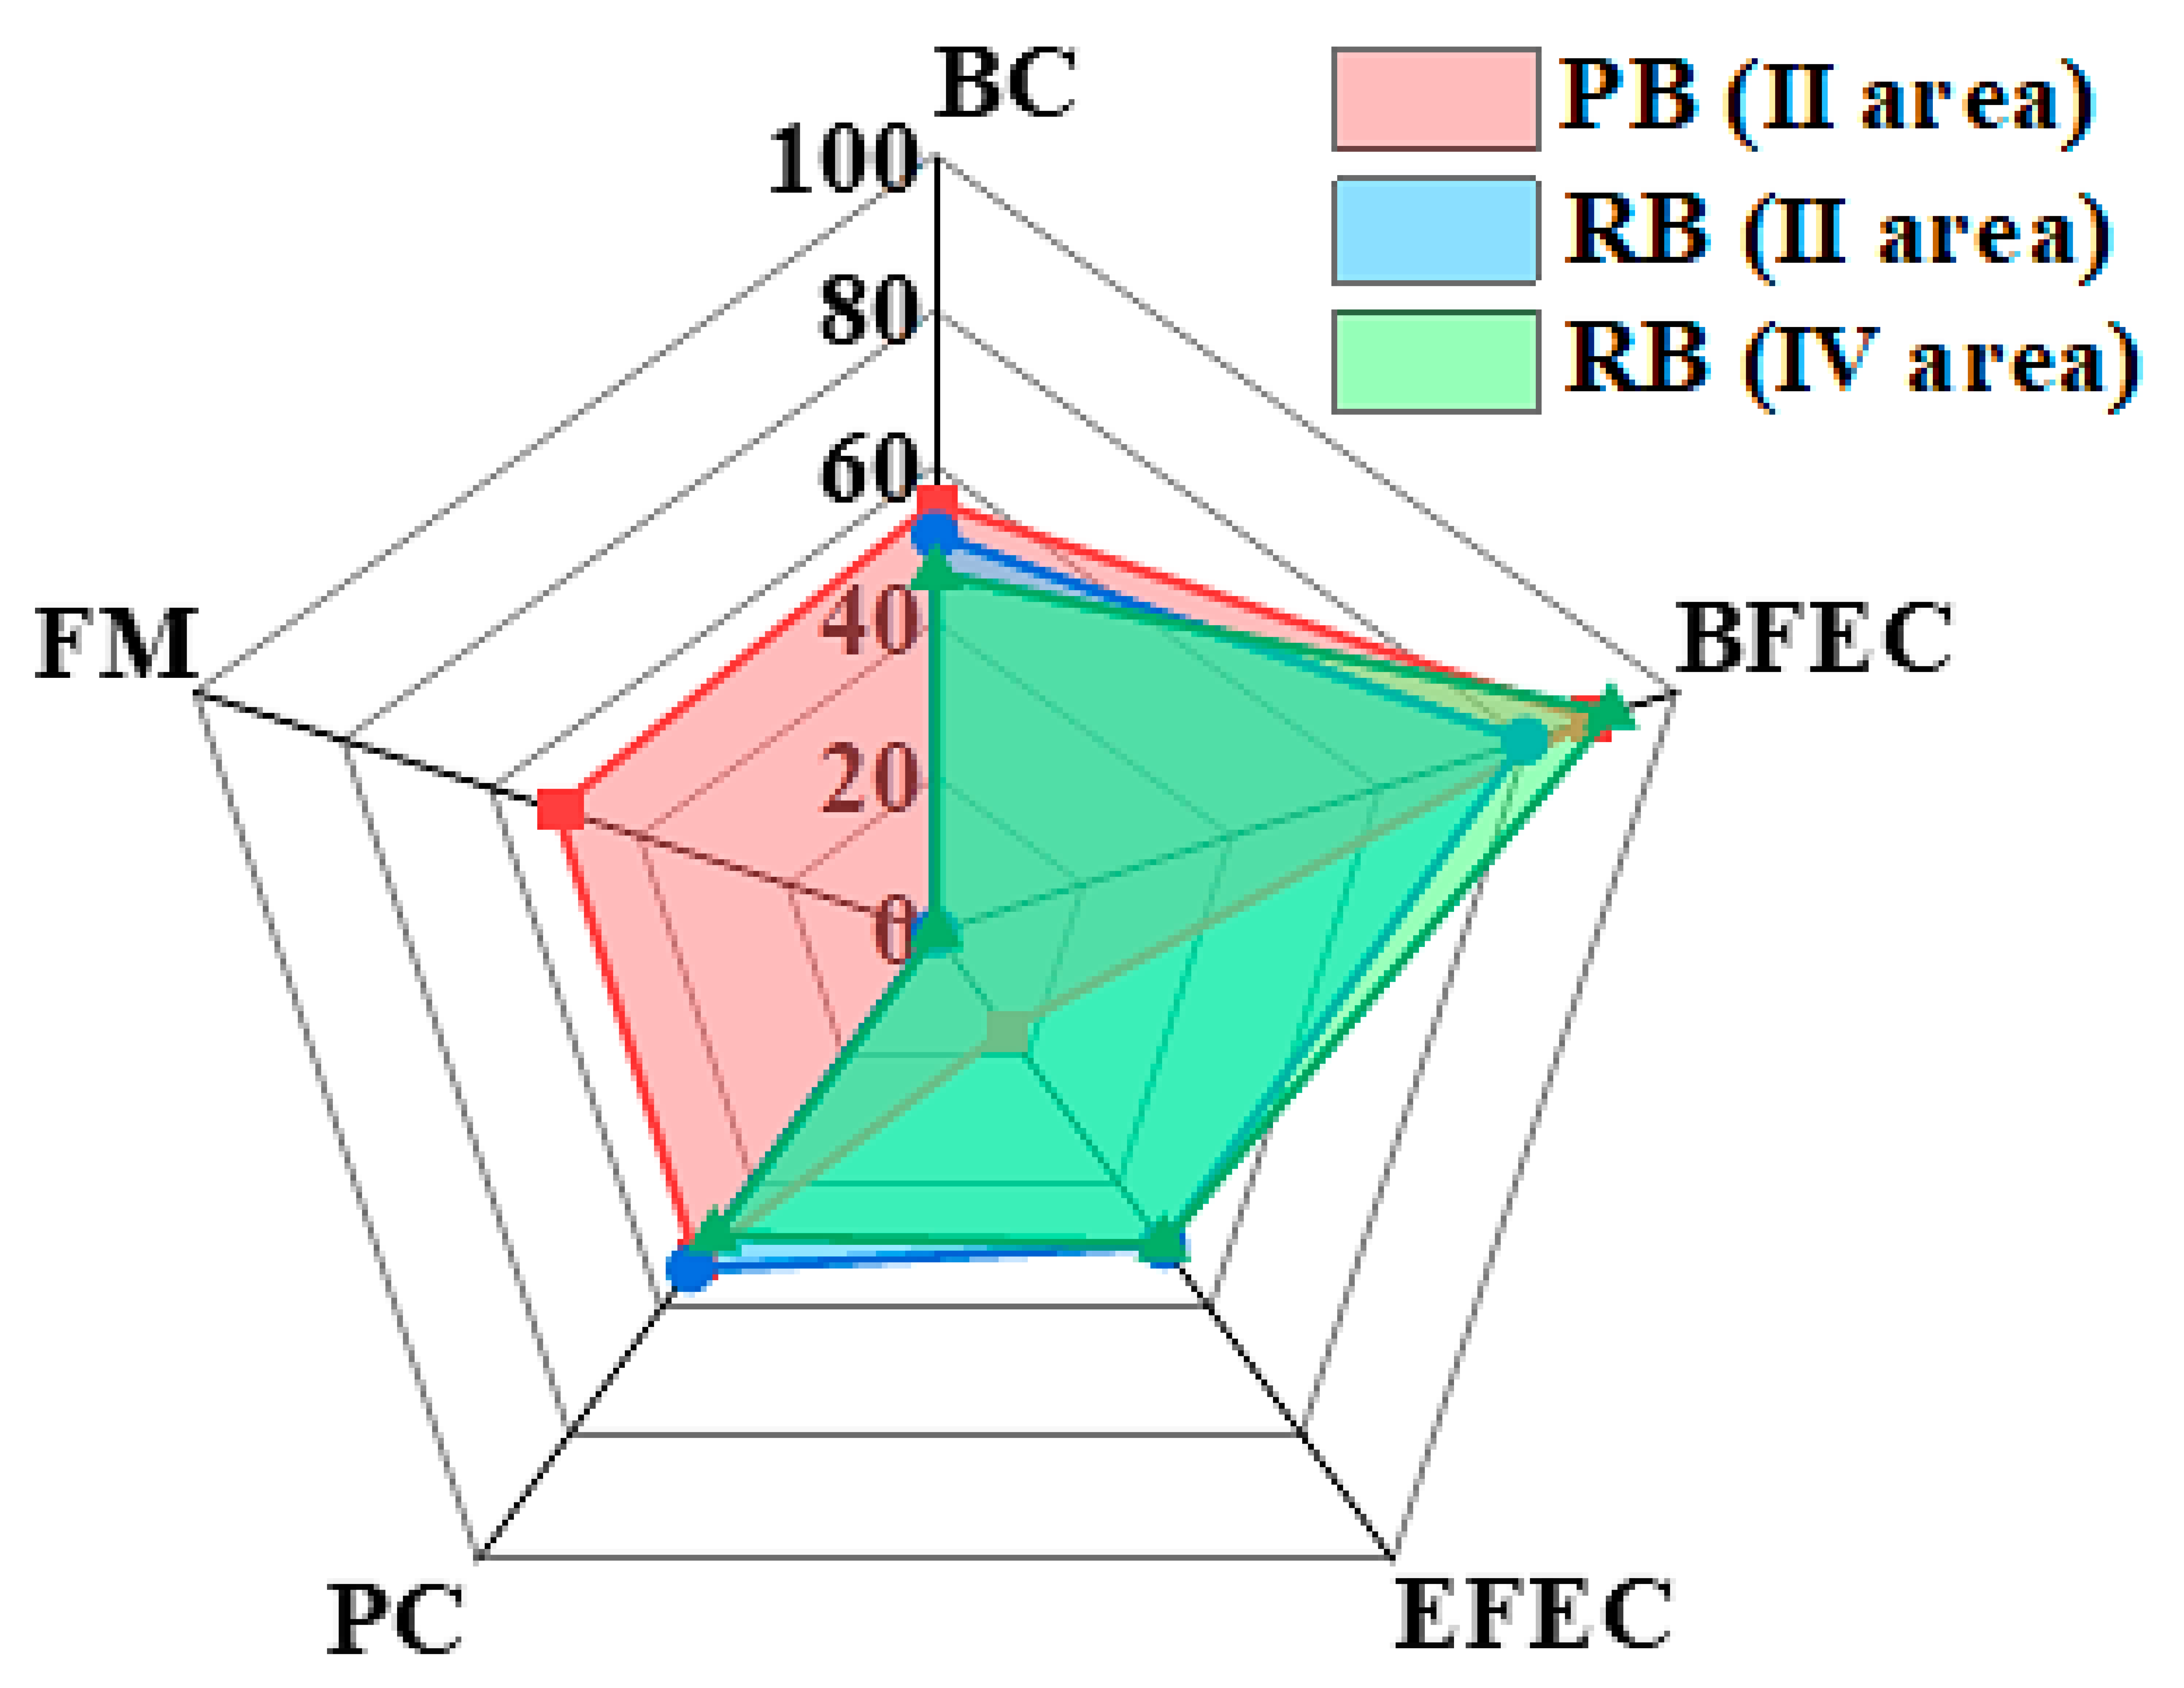
In Figure 5, it can be observed that HRBs with high fire consequence levels in the I District are predominantly located in areas II and IV, followed by area I and area III. To further clarify the specific fire risks of HRBs in areas II and IV, the average score of the secondary indicators for HRBs in areas II and IV is shown in Figure 6.
In Figure 6, it can be found that the score of the “BFEC” (Building fire extinguishing capability) is the highest for all the buildings. This explains that the “BFEC” plays an important role in the fire accidents of areas II and IV. This can be attributed to the poor performance of the fire systems or the absence of the fire protection systems in areas II and IV. For this phenomenon, it is closely related to old buildings and less manager attention [47]. Additionally, some requirements of RBs in some fire codes are lower for the fire protection system equipment compared with those for PBs. For example, the obligatory installation of automatic sprinkler systems is mandated only for residential buildings surpassing a height of 100 m [2,31]. Furthermore, it can be seen that there is a large difference in the “FM” and “EFEC” scores in PBs and RBs. The reason for the score difference in the “FM” is that the emergency drills conducted per year and the fire safety education for the PBs are stricter, compared with those for the RBs. For the “EFEC” difference, the influence of the micro-fire station setup is obvious. For many RB communities, the micro-fire station was not built in time.

3.4. Distribution of HRB Fire Risk

Figure 7 shows the distribution of the HRB fire risk, determined by the combination of the fire probability and the fire consequence.
In Figure 7, it can be seen that the risk of HRBs in area II is the largest. The main reasons can be attributed to the higher fire probability (shown in Figure 6) and the more severe fire consequence. For the higher fire probability, there are many old HRBs in area II, and electrical faults usually occur, which is the reason that fire accidents happen frequently. For example, the number of fires with a clear reason occurring in area II is 41 from 2018 to 2023. Among them, the number of fires caused by electrical faults is 17, accounting for over 40%. Other detailed reasons are illustrated in Section 3.2.3. For the more severe fire consequences, it is obvious that the fire protection infrastructures of the old HRBs are inadequate, which will lead to fire consequences expanding easily in case of a fire. Other specific reasons for the expansion of fire consequences can be referred to in Section 3.3.2.

4. Conclusions

In order to reduce the subjectivity of the indicator method, this paper proposes a novel assessment method combining the spatial Markov chain model and the indicator system method. Then, the HRBs of Beijing are selected as an example to illustrate the application of the proposed method. During the assessment, the fire accident data of HRBs in Beijing from 2018 to 2023 and the basic HRB data are used. The main conclusions are as follows:
(1) It is found that the spatial Markov chain model achieves the best performance with the monthly period and the four-state. Subsequently, we conclude that the regions with higher fire probability are located mainly in the central region of Beijing, including the I, H, J, K, L, and O Districts. In these regions, the I District has the highest fire probability, which should receive more attention in fire management.
(2) An indicator system is built to assess the fire consequence of HRBs in the I District. It shows that the HRBs with a high consequence level are located mainly in areas II and IV. The main reason is the lack of fire protection systems or poor performance because of less manager attention.
(3) Combining the fire probability and the fire consequence, the fire risk assessment results of HRBs in the I District are determined. The high-risk buildings are predominantly concentrated in the area II. This can be attributed to a large number of old buildings in this area. On the one hand, there are many old high-rise buildings in area II, and the proportion of the elderly population is relatively large. On the other hand, the fire protection systems of the old high-rise buildings have poor performance, and some residential building communities do not equip micro-fire stations. These factors make the area II more prone to fire.
This developed method can provide some insights into fire safety management. Furthermore, the method is not restricted to assessing HRB fire risk. The method also can be used to effectively assess the fire risk of other buildings by utilizing corresponding historical fire accidents and building information. This process is achieved by fine-tuning model parameters, such as the fire state of the spatial Markov chain model and the indicator system. However, it is important to note that the predicted accuracy of the spatial Markov chain model should be validated and the indicator system needs to be improved in future analysis.

Author Contributions

Conceptualization, Y.Z. and G.W.; methodology, Y.Z.; validation, X.W. and Y.Z.; formal analysis, Y.Z.; investigation, X.K. and H.J.; resources, Y.Z. and G.W.; writing—original draft preparation, Y.Z. and G.W.; writing—review and editing, G.W., Y.Z. and J.Z.; visualization, J.Z.; supervision, J.Z. and Y.Z.; project administration, J.Z.; funding acquisition, Y.Z. and J.Z. All authors have read and agreed to the published version of the manuscript.

Funding

This research was funded by the Science and Technology Program of National Fire and Rescue Administration (2022XFCX17); the Science Research Program of Tianjin Municipal Bureau of Statistics (TJ2023KY26); the National Key R&D Program of China (2021YFB3201900); the Fundamental Research Funds for the Central Universities (2023JCCXAQ05).

Institutional Review Board Statement

Not applicable.

Informed Consent Statement

Not applicable.

Data Availability Statement

The authors declare that the data supporting the findings of this study are available within the article.

Conflicts of Interest

The authors declare no conflicts of interest.

References

  1. Sha, H.; Qi, D. A review of high-rise ventilation for energy efficiency and safety. Sustain. Cities Soc. 2020, 54, 101971. [Google Scholar] [CrossRef]
  2. GB 50016-2014; Code for Fire Protection Design of Buildings (2018 Edition). Ministry of Housing and Urban-Rural Development of the People’s Republic of China: Beijing, China, 2018.
  3. Ecns.cn. What Are the Fire Hazards in the World’s Highest Number of High-Rise Buildings in China. Available online: https://www.chinanews.com.cn/sh/2017/07-11/8274146.shtml (accessed on 13 December 2022).
  4. Manzoor, B.; Othman, I.; Kang, J.M.; Geem, Z.W. Influence of building information modeling (Bim) implementation in high-rise buildings towards sustainability. Appl. Sci. 2021, 11, 7626. [Google Scholar] [CrossRef]
  5. National Fire and Rescue Administration. National Police and Fire Situation in 2022. Available online: https://www.119.gov.cn/qmxfxw/xfyw/2023/36210.shtml (accessed on 24 March 2023).
  6. The People’s Government of Lvliang City. Investigation Report on the “5.7” Major Fire Accident in Qiuhe Huayuan Community, Linquan Town, Linxian County, Lvliang City. Available online: http://www.lvliang.gov.cn/szdt/tzgg/202310/t20231027_1806850.html (accessed on 25 July 2023).
  7. Rahardjo, H.A.; Prihanton, M. The most critical issues and challenges of fire safety for building sustainability in Jakarta. J. Build. Eng. 2020, 29, 101133. [Google Scholar] [CrossRef]
  8. Kumar, A.; Khare, R.; Sankat, S.; Madhavi, P. Fire safety assessment for older adults in high-rise residential buildings in India: A comprehensive study. Int. J. Build. Pathol. Adapt. 2023, 41, 625–646. [Google Scholar] [CrossRef]
  9. Kang, Q.; Ma, B. Research on Fire-Safety Assessment of High-Rise Building Based on the Fuzzy Centralization Theory. In Proceedings of the 2010 Seventh International Conference on Fuzzy Systems and Knowledge Discovery, Yantai, China, 10–12 August 2010; pp. 1349–1354. [Google Scholar]
  10. Wang, L.; Li, W.; Feng, W.M.; Yang, R. Fire risk assessment for building operation and maintenance based on BIM technology. Build. Environ. 2021, 205, 108188. [Google Scholar] [CrossRef]
  11. Nimlyat, P.S.; Audu, A.U.; Ola-Adisa, E.O.; Gwatau, D. An evaluation of fire safety measures in high-rise buildings in Nigeria. Sustain. Cities Soc. 2017, 35, 774–785. [Google Scholar] [CrossRef]
  12. Jiang, L.; Liu, J.; Wei, Z.; Gong, H.; Lei, C.; Li, C. Running State and Its Risk Evaluation of Transmission Line Based on Markov Chain Model. Electr. Power Autom. Equip. 2015, 39, 51–57+80. [Google Scholar]
  13. Huang, J.; Chen, Y.; Ma, X.; Dong, S.; Tang, K. Risk Assessment Method for Power Grid Dispatching Operation Based on Markov Chain and Two⁃point Estimation Method. Power Capacit. React. Power Compens. 2022, 43, 127–133. [Google Scholar]
  14. Wang, C.L.; Hu, L. An Empirical Research on Early-Warming of Financial Risk in China. J. Financ. Res. 2014, 9, 99–114. [Google Scholar]
  15. Alyousifi, Y.; Ibrahim, K.; Kang, W.; Zin, W.Z.W. Modeling the spatio-temporal dynamics of air pollution index based on spatial Markov chain model. Environ. Monit. Assess. 2020, 192, 719. [Google Scholar] [CrossRef]
  16. Ardianto, R.; Chhetri, P. Modeling spatial–temporal dynamics of urban residential fire risk using a Markov chain technique. Int. J. Disaster Risk Sci. 2019, 10, 57–73. [Google Scholar] [CrossRef]
  17. Li, Y.; Spearpoint, M. Analysis of vehicle fire statistics in New Zealand parking buildings. Fire Technol. 2007, 43, 93–106. [Google Scholar] [CrossRef]
  18. Wang, Y.J.; Chen, F.Y.; Fang, W.; Yang, M.H.; Gu, X.; Sun, Q.Q.; Wang, X.R. Spatial and temporal characteristics and evolutionary prediction of urban health development efficiency in China: Based on super-efficiency SBM model and spatial Markov chain model. Ecol. Indic. 2023, 147, 109985. [Google Scholar] [CrossRef]
  19. Roshan, G.; Nastos, P.T. Assessment of extreme heat stress probabilities in Iran’s urban settlements, using first order Markov chain model. Sustain. Cities Soc. 2018, 36, 302–310. [Google Scholar] [CrossRef]
  20. Wang, K.L.; Xu, R.Y.; Zhang, F.Q.; Miao, Z.; Peng, G. Spatiotemporal heterogeneity and driving factors of PM2.5 reduction efficiency: An empirical analysis of three urban agglomerations in the Yangtze River Economic Belt, China. Ecol. Indic. 2021, 132, 108308. [Google Scholar] [CrossRef]
  21. Du, Q.; Deng, Y.; Zhou, J.; Wu, J.; Pang, Q.Y. Spatial spillover effect of carbon emission efficiency in the construction industry of China. Environ. Sci. Pollut. Res. 2022, 29, 2466–2479. [Google Scholar] [CrossRef] [PubMed]
  22. Ding, X.X.; Zhang, H.T.; Zhang, W.R.; Xuan, Y.L. Non-uniform state-based Markov chain model to improve the accuracy of transient contaminant transport prediction. Build. Environ. 2023, 245, 110977. [Google Scholar] [CrossRef]
  23. Purwanto; Latifah, S.; Yonariza; Akhsani, F.; Sofiana, E.I.; Ferdiansah, M.R. Land cover change assessment using random forest and CA markov from remote sensing images in the protected forest of South Malang, Indonesia. Remote Sens. Appl. Soc. Environ. 2023, 32, 101061. [Google Scholar] [CrossRef]
  24. Xia, C.; Hu, Y.Q.; Chen, J.L. Community time-activity trajectory modeling based on Markov chain simulation and Dirichlet regression. Comput. Environ. Urban Syst. 2023, 100, 101933. [Google Scholar] [CrossRef]
  25. Wang, K.J.; Wang, W.Q.; Zhao, Y.B.; Yuan, B.D.; Xiang, Z.R. Multisensor fault diagnosis via Markov chain and Evidence theory. Eng. Appl. Artif. Intell. 2023, 126, 106851. [Google Scholar] [CrossRef]
  26. Liu, P.; Zhu, B. Temporal-spatial evolution of green total factor productivity in China’s coastal cities under carbon emission constraints. Sustain. Cities Soc. 2022, 87, 104231. [Google Scholar] [CrossRef]
  27. Agovino, M.; Crociata, A.; Sacco, P.L. Proximity effects in obesity rates in the US: A Spatial Markov Chains approach. Soc. Sci. Med. 2019, 220, 301–311. [Google Scholar] [CrossRef] [PubMed]
  28. Wang, Y.J.; Hou, L.Z.; Li, M.; Zheng, R.X. A novel fire risk assessment approach for large-scale commercial and high-rise buildings based on fuzzy analytic hierarchy process (Fahp) and coupling revision. Int. J. Environ. Res. Public Health 2021, 18, 7187. [Google Scholar] [CrossRef]
  29. Zhang, X.; Mehaffey, J.; Hadjisophocleous, G. Life risks due to fire in mid-and high-rise, combustible and non-combustible residential buildings. J. Build. Eng. 2016, 8, 189–197. [Google Scholar] [CrossRef]
  30. Filippo, R.D.; Possidente, L.; Tondini, N.; Bursi, O.S. Quantitative integration of fire risk with life cycle analysis of building: The case of thermal insulation. J. Build. Eng. 2023, 76, 107124. [Google Scholar] [CrossRef]
  31. GB 55037-2022; General Code for Fire Protection of Buildings and Constructions. Ministry of Housing and Urban-Rural Development of the People’s Republic of China: Beijing, China, 2022.
  32. GB 50068-2018; Unified Standard for Reliability Design of Building Structures. Ministry of Housing and Urban-Rural Development of the People’s Republic of China: Beijing, China, 2019.
  33. Ministry of Emergency Management of the People’s Republic of China. Regulations on Fire Safety Management of High-Rise Civil Buildings. Available online: https://www.mem.gov.cn/gk/zfxxgkpt/fdzdgknr/202106/t20210625_389980.shtml (accessed on 4 January 2023).
  34. Liu, D.H.; Gong, W.; Xing, W.X.; Li, X.X.; Ma, X.J.; Yu, Y. Comprehensive method for determining the weights of vulnerability assessment indexes on islands and the coastal zone based on the AHP weight method and entropy weight method. Mar. Environ. Sci. 2015, 34, 462–467. [Google Scholar]
  35. Ai, L.H.; Liu, S.; Ma, L.; Huang, K.Y. A Multi-Attribute Decision Making Method Based on Combination of Subjective and Objective Weighting. In Proceedings of the 2019 5th International Conference on Control, Automation and Robotics (ICCAR), Beijing, China, 19–22 April 2019; pp. 576–580. [Google Scholar]
  36. Liang, X.B.; Liang, W.; Zhang, L.B.; Guo, X.Y. Risk assessment for long-distance gas pipelines in coal mine gobs based on structure entropy weight method and multi-step backward cloud transformation algorithm based on sampling with replacement. J. Clean. Prod. 2019, 227, 218–228. [Google Scholar] [CrossRef]
  37. Zhao, J.R.; Tian, J.D.; Meng, F.X.; Zhang, M.L.; Wu, Q. Safety assessment method for storage tank farm based on the combination of structure entropy weight method and cloud model. J. Loss Prev. Process Ind. 2022, 75, 104709. [Google Scholar] [CrossRef]
  38. Liu, F.; Zhao, S.Z.; Weng, M.C.; Liu, Y.Q. Fire risk assessment for large-scale commercial buildings based on structure entropy weight method. Saf. Sci. 2017, 94, 26–40. [Google Scholar] [CrossRef]
  39. The Central People’s Government of the People’s Republic of China. Emergency Response Law of the People’s Republic of China. Available online: https://www.gov.cn/ziliao/flfg/2007-08/30/content_732593.htm (accessed on 23 December 2023).
  40. The People’s Government of Beljing Municipality. Standards for the Establishment of Beijing Sub-District Offices (Trial). Available online: https://www.beijing.gov.cn/zhengce/zhengcefagui/202101/t20210106_2200641.html (accessed on 29 January 2023).
  41. Dong, Y.H.; Peng, F.L.; Li, H.; Men, Y.Q. Spatial autocorrelation and spatial heterogeneity of underground parking space development in Chinese megacities based on multisource open data. Appl. Geogr. 2023, 153, 102897. [Google Scholar] [CrossRef]
  42. Kumari, M.; Sarma, K.; Sharma, R. Using Moran’s I and GIS to study the spatial pattern of land surface temperature in relation to land use/cover around a thermal power plant in Singrauli district, Madhya Pradesh, India. Remote Sens. Appl. Soc. Environ. 2019, 15, 100239. [Google Scholar] [CrossRef]
  43. Beijing Municipal Bureau of Statistics. Beijing Seventh National Population Census Bulletin (No. 2). Available online: https://www.beijing.gov.cn/gongkai/shuju/sjjd/202105/t20210519_2392886.html (accessed on 10 February 2023).
  44. Zhang, X.L. Adhere to the inherent safety priority to do a good job in high-rise building fire prevention and control-from London ‘s “6·14” fire to see Beijing high-rise building fire safety work. City Disaster Reduct. 2017, 116, 8–11. [Google Scholar]
  45. Chen, W.T. Fire and Rescue Administration: After an Average of 11.2 Years of Use of High-Rise Buildings, the Probability of Fires Caused by Aging of Electrical Circuits has Increased Significantly. Available online: http://www.xinhuanet.com/yingjijiuyuan/2021-10/15/c_1211406004.htm (accessed on 20 February 2023).
  46. The People’s Government of Beijing Municipality. The Proportion of Permanent Residents aged 60 and over has Exceeded 20% for the First Time. Beijing has Entered a Moderately Aging Society. Available online: https://www.beijing.gov.cn/gongkai/shuju/sjjd/202209/t20220903_2808255.html (accessed on 29 July 2023).
  47. Wang, W. Discussion on fire safety management of high-rise building. Fire Sci. Technol. 2015, 34, 1103–1106. [Google Scholar]
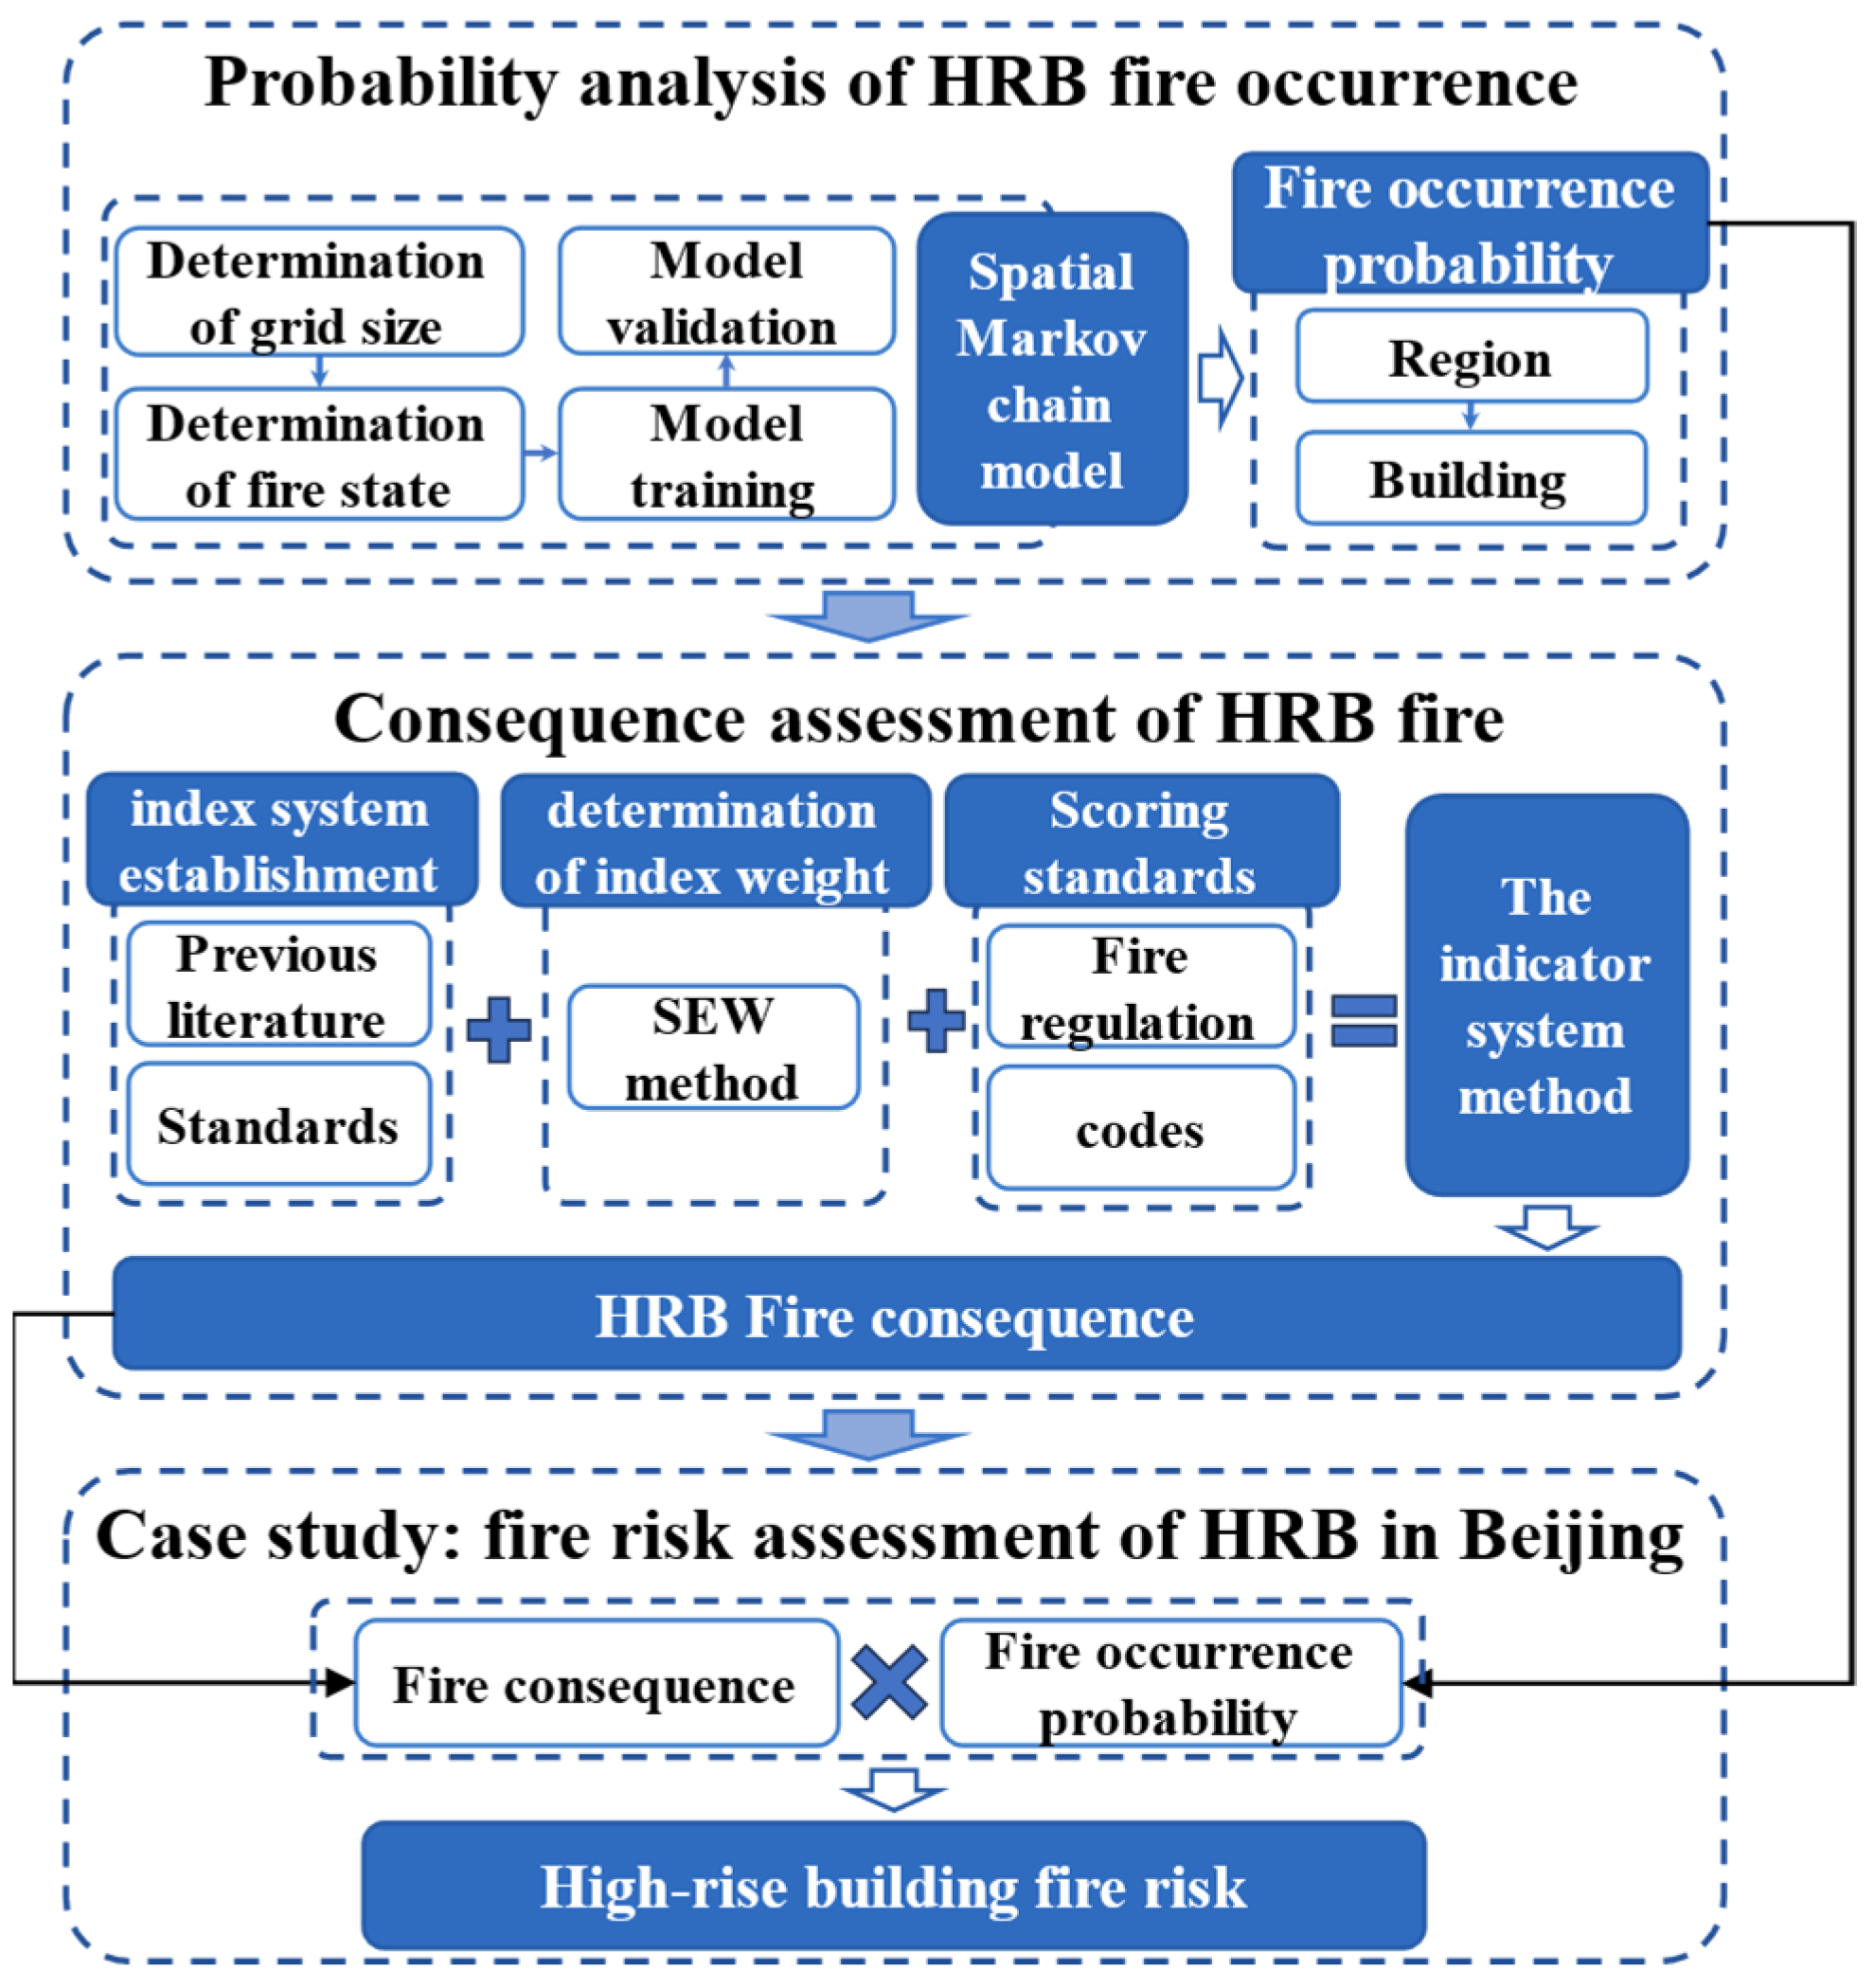
Figure 1. Research framework of HRB fire risk assessment.
Fire 07 00016 g001
Figure 2. The district map of Beijing. (A, B, C, etc. are the codes of the district of Beijing.)
Fire 07 00016 g002
Figure 3. Distribution of regional fire probability in Beijing in April.
Fire 07 00016 g003
Figure 4. Distribution of fire probability in the I District in April. (①, ②, ③, etc. represent the grids with different fire probability level of I District.)
Fire 07 00016 g004
Figure 5. Distribution of HRB fire consequence in the I District. (The red circle represents the area where the HRBs with the high fire consequence level are located).
Fire 07 00016 g005
Figure 6. The average score of the secondary indicators for HRBs in areas II and IV.
Fire 07 00016 g006
Figure 7. Distribution of HRB Fire risk in the I District. (The red circle represents the area where the HRBs with the high fire risk level are located).
Fire 07 00016 g007
Table 1. The description of the fire data state.
Fire Data StateDescription
Two-stateNo fire
At least one fire
Three-stateNo fire
One fire
Two or more fires
Four-stateNo fire
One fire
Two fires
Three or more fires
Table 2. Indicator system of HRB fire consequence assessment.
Primary IndicatorSecondary IndicatorsTertiary Indicators
Fire risk of HRBBuilding characteristics (BC)Fire compartment
Building height
Fire resistance rating
Building structure
Building fire extinguishing capacity (BFEC)Sprinkler systems
Automatic fire alarm system
Fire hydrant system
Smoke control system
External fire extinguishing ability (EFEA)Fire department arrival time
Micro fire station construction status
Personnel characteristics (PC)Population density
Population flow
Fire management (FM)Number of fire inspections
Number of fire safety education
Number of fire drills
Table 3. Survey Questionnaire.
Indicator 1Indicator 2Indicator n
Expert 1 a 11 a 12 a 1 n
Expert 2 a 21 a 22 a 2 n
Expert 3 a 31 a 32 a 3 n
20 a m 1 a m 2 a m n
Table 4. The standards used in the scoring method.
No.Codes and Regulations
1Code for fire protection design of buildings (GB50016-2014) (2018 edition) [2]
2General code for fire protection of buildings and constructions (GB55037-2022) [31]
3Unified standard for reliability design of building structures (GB50068-2008) [32]
4Regulations on fire safety management of high-rise civil buildings [33]
Table 5. Fire risk level table of HRBs.
No.Risk LevelRatio
1High risk0–10%
2Medium risk10–50%
3General risk50–90%
4Low risk90–100%
Table 6. The results of the chi-square goodness-of-fit test.
Time PeriodsFire StatesPerformance MetricsRatio of Training Set
Ratio
75%80%
MonthTwo-stateχ26.7740597436.402080914
p value0.1588803660.162542209
Three-stateχ29.1452454059.657936508
p value0.1515588680.153508278
Four-stateχ24.799158484.67874029
p value0.1923730380.175196289
WeekTwo-stateχ25.630454424.834498277
p value0.1719974920.178639024
Three-stateχ212.9480459910.90285724
p value0.0290971930.043257354
Four-stateχ211.213260499.353785163
p value0.0551881080.064072835
Table 7. The indicator weights of HRB fire consequence assessment.
Primary IndicatorSecondary IndicatorsTertiary Indicators
Fire risk of HRBBuilding characteristics (BC)
(0.2073)
Fire compartment
(0.2579)
Building height
(0.2576)
Fire resistance rating
(0.2424)
Building structure
(0.2421)
Building fire extinguishing capacity (BFEC)
(0.1790)
Sprinkler systems
(0.2571)
Automatic fire alarm system
(0.3773)
Fire hydrant system
(0.1583)
Smoke control system
(0.2073)
External fire extinguishing ability (EFEA)
(0.2070)
Fire department arrival time
(0.5015)
Micro fire station construction status
(0.4985)
Personnel characteristics (PC)
(0.1883)
Population density
(0.6856)
Population flow
(0.3144)
Fire management (FM)
(0.2184)
Number of fire inspection
(0.3479)
Number of fire safety education
(0.3479)
Number of emergency drill
(0.3042)
Disclaimer/Publisher’s Note: The statements, opinions and data contained in all publications are solely those of the individual author(s) and contributor(s) and not of MDPI and/or the editor(s). MDPI and/or the editor(s) disclaim responsibility for any injury to people or property resulting from any ideas, methods, instructions or products referred to in the content.