Abstract
Natural hazards such as wildfires have proven to be more frequent in recent years, and to minimize losses and activate emergency response, it is necessary to estimate their impact quickly and consequently identify the most affected areas. Volunteered geographic information (VGI) data, particularly from the social media platform Twitter, now X, are emerging as an accessible and near-real-time geoinformation data source about natural hazards. Our study seeks to analyze and evaluate the feasibility and limitations of using tweets in our proposed method for fire area assessment in near-real time. The methodology involves weighted barycenter calculation from tweet locations and estimating the affected area through various approaches based on data within tweet texts, including viewing angle to the fire, road segment blocking information, and distance to fire information. Case study scenarios are examined, revealing that the estimated areas align closely with fire hazard areas compared to remote sensing (RS) estimated fire areas, used as pseudo-references. The approach demonstrates reasonable accuracy with estimation areas differing by distances of 2 to 6 km between VGI and pseudo-reference centers and barycenters differing by distances of 5 km on average from pseudo-reference centers. Thus, geospatial analysis on VGI, mainly from Twitter, allows for a rapid and approximate assessment of affected areas. This capability enables emergency responders to coordinate operations and allocate resources efficiently during natural hazards.
1. Introduction
Recently, natural hazards have emerged as a significant peril to humans [1,2]. Instantaneous and precise information regarding the hazard’s location and potential impact is necessary for first responders, including rescue services, to play a critical role in mitigating and managing the potential hazards [3]. Although remote sensing (RS) data can be utilized to estimate the approximate extent of hazards like wildfires with reasonable accuracy [4], the availability of such information in (near) real-time for non-commercial satellites is scarce due to the limited overpass time of these satellites. Searching for an alternative data source, which offers the same significant advantages as satellite RS, such as broad spatial coverage, open data accessibility for anyone, and cost-effectiveness, data sources like aircraft or drone remote sensing are eliminated, but volunteered geographic information (VGI) data emerge as a promising candidate. VGI, such as Twitter, now X, can be employed as an alternative data source to promptly identify areas at risk or affected regions in almost real time [5,6].
Tweets can be viewed as data to bridge the gap in information until RS data become available for natural hazard analysis. However, the locations of tweets may be influenced by factors such as population density and, thus, can only serve as an approximate indicator of natural hazard locations. On the other hand, VGI provides additional information compared to RS data, such as more specific information available in the texts. Moreover, VGI can highlight areas affected by natural hazards where humans are predominantly impacted, which can be more valuable for rescue services than simply identifying the location of the hazard. Therefore, it can also be a complementary source of information compared to RS data.
This study evaluates the utility of VGI in the form of tweets for spatial analysis of fire hazards without RS data. The objective of this study is to provide a proof of concept for the ability of VGI data for wildfire extent assessment in high resolution, contrary to the few existing studies that leverage VGI data for natural hazard spatial analysis, e.g., [7], which are rarely focused on wildfires [8,9]. We aim to estimate the areas most likely requiring attention from first responders based on the tweet data. The developed methodological framework should be easily transferable to any wildfire hazard. The study aims to address two significant challenges associated with the use of tweets for location estimation: (1) estimating the hazard location from tweet locations while considering influencing factors and (2) estimating the hazard location and/or the area where people are affected by the hazard from the tweet text information.
The study addresses these challenges through two major approaches: (1) estimating an approximate barycenter location of the hazard through factor weighting of tweet locations and (2) estimating the approximate hazard-affected area by combining several methods that scan text for helpful information. This study compares the results to hazard locations generated from RS data.
Section 1 briefly overviews related studies that address natural hazard information extraction from VGI. We describe the study area, the data basis, and the methodology in Section 2. The methodology’s results (Section 3) on several case study examples are explained. Finally, we discuss the results (Section 4) and conclude the study (Section 5).
Related Work
We structure the related work into two major parts: first, the extraction of locations from Twitter data, which only then classifies Twitter data as VGI data, and an overview of studies dealing with the spatial analysis of VGI data.
To use Twitter data as VGI data, the extraction of locations of tweets is necessary. A variety of techniques are used for location extraction from Twitter data. The choice of these extraction techniques mainly determines the accuracy of locations. Four main categories for location extraction can be constituted:
- Inference from the user location [10,11]: These approaches assume that a user’s location is strongly related to their social network location.
- Location extraction from the posted text [12,13,14]: These studies extract names of places from the text of the messages. This task is well-known as named entity recognition (NER) as a sub-category of natural language processing (NLP). Few studies [15] also use pattern recognition with regular expressions (RegEx) for specific location name extraction. In the final step, the extracted names of places are geocoded by geoparsing.
- Direct location extraction: Locations can be directly extracted from metadata obtained with the text data when accessing VGI, e.g., via an application programming interface (API). Twitter, for example, delivers a JSON file that provides the coordinates or a place field where the tweets are created [16]. However, the user can voluntarily fill these fields, so the information is rarely available. Studies suggest that coordinates are given in about 0.2% to 1.5% of posted tweets, whereas place is given in about 2% of tweets [17,18].
- Combinations of the above: Some studies use a combined methodology of the above-mentioned possibilities for geolocation extraction [19,20].
The use of VGI data and Twitter data, more specifically, in a natural hazard context, can be categorized into three major topics: event detection, information retrieval for a specific event, and spatial analysis for approximate hazard location estimation. VGI data have been chiefly used for event detection or information retrieval in a natural hazard context (see, for example, [21,22,23]). In the following, we review only studies dealing with the spatial analysis of VGI data.
Spatial analyses for more precise natural hazard extent estimation have not been applied frequently. However, various methodological approaches exist for the spatial analysis of VGI data. Some studies rely on kernel density estimation for hurricane and fire hazards [7,8]. Furthermore, Voronoi tesselation has been applied to a rainstorm hazard [6]. A third approach is triangulation for a fire hazard [9]. In this approach, VGI images are also used, enhancing the triangulation results as the shooting angles can be included. De Albuquerque et al. [24] use a generalized additive model (GAM) to provide evidence of the association between the relevance of VGI data with proximity to and severity of flood events. Several studies for spatial analysis of natural hazards combine VGI information with other information sources like satellite imagery or other VGI, like telephone interviews [25,26,27]. In a non-hazard context, a few more studies exist for spatial analysis from VGI data: Hot spot analysis for evaluating depression among Twitter users [28] or obesity [29] has been applied. Kernel density estimation has been used for crime estimation [30] or studies on power outages [31] from VGI. Finally, some studies apply geographically weighted regression (GWR) for spatial analysis from VGI for urban crash analysis [32] or community vulnerability [33].
However, these studies have limited accuracy in estimating the actual hazard extents only by extracting, e.g., the affected city. Often, they provide probabilities for the occurrence of a hazard in coarse-resolution cells, e.g., county-wise. Furthermore, they predominantly utilize a single method, like kernel density, without integrating multiple suitable methods that could leverage the diverse information available from VGI, which limits their robustness. Although incorporating VGI images results in higher accuracies, their availability is usually scarce compared to text. Therefore, these data and image-based methodologies cannot be applied elsewhere. None of these studies consider geographical influences on VGI locations before spatial analysis execution, although these factors significantly influence hazard location estimation accuracies. Only Wang et al. [8] consider the population density in their spatial analysis. However, further available VGI information needs to be incorporated. Additionally, only two studies focus on wildfire hazards. All other studies have limited applicability to other wildfire hazards, as they are based on specific subsets of the given information, and other methods would be required in other contexts.
2. Materials and Methods
In the scope of this paper, we consider a location approximation task relying on tweet data. The model considers tweets’ date, location, and text to estimate in a time-conscious manner the approximate location of the natural hazard and the area where most people are probably affected (Figure 1). We use two major approaches: (1) estimating an approximate barycenter location of the hazard through factor weighting of tweet locations and (2) by combining several methods, estimating the approximate hazard location/human-affected area location. These methods (compared to (1)) have in common that they scan the tweets’ texts for helpful information concerning hazard locations and location information.
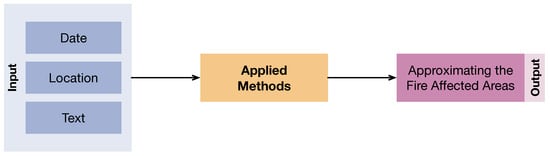
Figure 1.
Visualization of the location estimation framework for natural hazard approximation from Twitter data.
This section presents the case studies (see Section 2.1) and the input data (see Section 2.2). Then, we present all approaches (see Section 2.3).
2.1. Case Studies
Our study relies on different case studies of fire hazards in California, the United States, and France in the past years. These are the fires: Bobcat fire (I) near Los Angeles in 2020, Camp fire (II) near Paradise in 2018 (California), and the fires in the region of Var (III) in 2021 and near Landiras (IV) in 2022 (France) (see Figure 2).
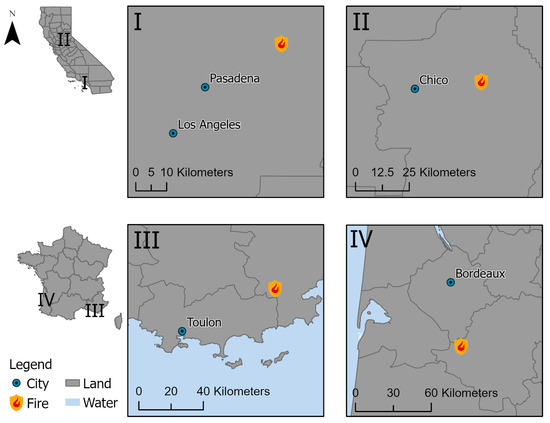
Figure 2.
Visualization of the locations of selected fires Bobcat (I) and Camp fire (II) in California, USA (top), and fires in Var (III) and near Landiras (IV), France (bottom), used as case studies for the approaches. Data basis: 2018 GADM. Projection: WGS84.
We choose these study areas considering their different constellations of parameters, as explained in Table 1, to show the possibilities and limitations of our methodology. We consider fire characteristics, like the fire’s size and spreading rate, since they influence the amount and dynamics of available tweets. Furthermore, we consider general factors that influence tweet occurrence, like land cover information, population density, general tweet behavior, and whether agencies like firefighters or road security agencies use Twitter as a medium to spread the news.

Table 1.
Overview of fire characteristics and characteristics influencing tweet data regarding the four case study areas.
2.2. Input Data
This study uses Twitter data as VGI to exploit their high usage and accessibility. The selected Twitter data are obtained through Twitter’s download API accessed via Python. The reliability of VGI data often remains a critical concern, as nonexperts generate them and can be subject to various biases and limitations. Studies have explored this reliability issue, primarily for Twitter data, revealing accurate real-time updates during large-scale events and inaccuracies for less prominent events [5,34,35,36]. Sociodemographic biases of Twitter users can skew interpretations, and efforts to understand and adjust for these biases have been made [37,38]. Geospatial factors like population density impact tweet distribution patterns [7,39], while detailed sociodemographic factors (as investigated by Adnan et al. [37]) might not be crucial for hazard-related spatial analysis. To enhance reliability, e.g., credible accounts with metadata should be considered, re-tweets avoided, and government agency accounts should be accorded a higher level of trustworthiness. These steps are considered in our framework.
The direct location extraction method obtains the most accurate locations from the tweet metadata. However, as only a limited number of tweets contain the coordinates’ information, the place field is also employed to contribute to the hazard location estimation, although with lower accuracy. Tweets with a filled place field are still helpful as they contain textual information about affected areas.
For all the case studies, we search for tweets posted before the first available RS image, e.g., for the Bobcat fire, tweets between 06/09/2020 to 10/09/2020 are used, whereas the RS image is available on 10/09/2020 at 10 p.m. (see Table 1). The tweet data containing relevant keywords and geolocation data corresponding to the timeframe of the fire occurrences preceding the retrieval of RS imagery are extracted for each case study.
Table 2 displays the number of tweet data extracted per case study. We differentiate between tweets with coordinates information and place information for location information.
Table 2.
Overview of numbers (#) of extracted tweet data.
Furthermore, Sentinel-2 RS data are utilized to extract the fire area and to compare the results obtained from VGI. Sentinel-2 RS data offer a very high resolution of 10 m. Very detailed fire perimeter information is obtained using an appropriate methodology [4] for fire area extraction from these data. The accuracy of estimation approaches is validated. The most temporally proximate available RS images to the start of the fire (as listed in Table 1) are extracted for the case studies. Whereas other wildfire datasets (e.g., from fire agencies and organizations) often only represent the final fire perimeter, the most temporally proximate fire perimeter can be extracted from RS.
Additionally, such wildfire datasets are not available worldwide (e.g., for the investigated case studies in France), but only, e.g., county-, state-, or country-wide. The use of RS data ensures operational convenience, eliminating the need to search for agency data for each case study individually. As RS data are not suitable for fire perimeter extraction of one case study (Camp fire), we rely on California Department of Forestry and Fire Protection (CalFire) agency data in this case. These data are provided in vector files, showing the extent of a fire area. Note that these RS and agency data can only serve as a pseudo-reference since they do not depict the actual ground truth of the fire extent due to the temporal delay in capturing, extending up to several days during which the fire has already progressed. Therefore, they can only be used for visual analysis.
Finally, population density and land cover data are utilized as supplementary data to account for the influences of these factors on tweet occurrence. The datasets used in this study are the following:
- Population dataset: The WorldPop population density dataset 2020 with a resolution of 30 arc-seconds (approximately 1 km at the equator) was used [40].
- Land cover dataset: The worldwide available product Copernicus Global Land Cover Layers (CGLS-LC100) Collection 3 of 2019 with a 100 m resolution was used [41].
2.3. Methods
In this section, we explain the two primary method types of approximate barycenter calculation (Section 2.3.1) and approximate location (Section 2.3.2), and the evaluation data generation (Section 2.3.3) in detail. Figure 3 displays the methods overview.
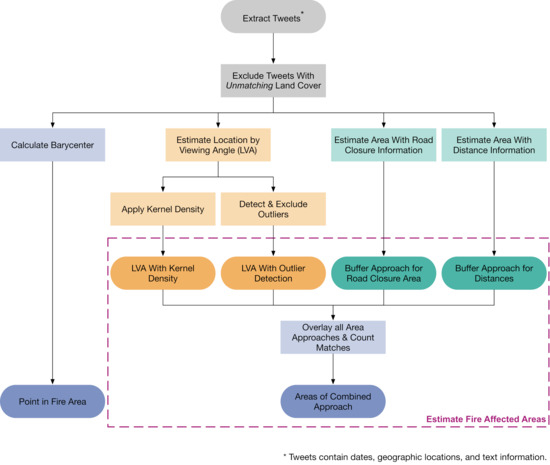
Figure 3.
Methodology overview for approximating fire-affected areas based on Twitter data.
2.3.1. Approximation of the Barycenter
When evaluating the tweet data in a geospatial manner, we first calculate the weighted barycenter location of the tweet points, considering the influencing factors, population density, and land cover. Utilizing population density and land cover as weighting factors for barycenter approximation offers significant advantages:
- Population density: More people in an area means a higher probability of someone witnessing and reporting a wildfire.
- Land cover: Land cover diversity impacts the visibility and detectability of wildfires and fire propagation.
The geospatial barycenter is calculated as follows:
where and are the coordinates for each tweet location point i, and the weight w for each tweet location point i is calculated as
where is the point density per tweet calculated by kernel density from all the tweets, is the population density according to WorldPop at the point location, and is a custom weight depending on the underlying land cover type at the point for each point i. Highly combustible land cover types like shrubs or forest have a higher weight since it is more likely for a fire to burn and continue to burn to an area with such land cover, compared to, e.g., a water land cover area.
2.3.2. Approximation of the Areal Location
Next, we estimate approximate hazard locations or affected areas with several methods according to the availability of the respective data in the tweet texts. These include the viewing angle of the fire by mentioned places in the text (1), road segment blocking information (2), and distance to the fire information (3). Figure 4 displays exemplary tweet text snippets containing the relevant information for the employed methods.
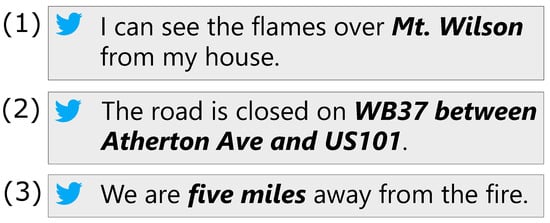
Figure 4.
Exemplary tweet text snippets from which information about approximate areal locations of natural hazards can be extracted: (1) named places, (2) road closure information, (3) distance information. The relevant text information that is considered is marked in bold text. Texts are simplified and adapted from original extracted tweet texts.
- We approximate the hazard location by considering names of places that are mentioned in the tweets’ texts talking about the respective hazard (see Figure 4, (1)). This method is therefore referred to as the Location by viewing angle (LVA) approach. We extract these mentioned places with two approaches: NER or pattern recognition by Regular Expression (RegEx) (e.g., [42,43,44]), which are NLP methods. For NER, we employ the Spacy Python library [45], an open-source NLP library. We use it to detect the entities GPE (Geopolitical Entities: Countries, cities, states) and LOC (Non-GPE locations, mountain ranges, bodies of water). We apply RegEx in addition to NER, as NER recognizes general location places, while we can extract more specific areas with RegEx. For RegEx, we employ our own developed algorithm, which consists of the two steps of name detection and geoparsing. It searches for spatial places like Mt. Wilson or Monrovia Peak, employing word search (e.g., Peak) and Regex patterns that search for associated nouns (e.g., Monrovia). After extracting place names, we geo-parse, which converts text descriptions of places into geographic identifiers like coordinates. Next, we apply a methodology to check for the viewing angle. The people might not see mentioned places in their tweet locations, as obstructions like mountains could prevent them. Therefore, we check the plausibility of the viewing angle by considering the occurrence of viewing obstructions in the line of sight from the location to the mentioned place. As a result, we obtain locations to which the speaker can view and which are probable that he is seeing the hazard there. With the obtained points, we conduct two separate methods again to get more independent results, in line with the principle that where more people think the hazard is there, the hazard is more likely to be there. These are:
- Kernel density estimation on viewing angle points: Based on the resulting points of 1, we conduct kernel density estimation as implemented in ArcGIS [46], which places a kernel (smooth, continuous function) on each datapoint and sums these kernels to create a smooth representation of the underlying probability distribution. We extract areas with a specific density and a higher probability of the hazard’s presence within those areas.
- Non-outlier estimation on viewing angle points: We use an Isolation Forest, implemented in ArcGIS [46] to detect non-outlier points. It works by isolating instances using binary splits and constructing an ensemble of decision trees. Outliers are identified as instances that require fewer splits to be isolated. We then calculate a convex hull spanned by non-outlier points in the following.
- In this step, we consider blocked road information (see Figure 4, (2)). Road authorities often post information about such an emergency or hazard cases. We search tweets mentioning such information or posted by responsible agencies and extract their locations. This method extracts the exact road locations via RegEx implemented for roads. We geo-parse and obtain points of blocked road information, mainly two road intersection information per tweet (e.g., Angeles Crest Hwy & Upper Big Tujunga Rd). We can then extract the closed road segments between those two mentioned points.
- Finally, we consider distance information in the texts (see Figure 4, (3)). We search tweets mentioning distance information and buffer their location with this distance. We obtain a circle on which the hazard seen by the speaker might lie. To account for coarse estimates by speakers, we apply a buffer around this circle with a distance of 30% of the initial space. This assumption is based on the idea that people gauge distances more accurately when hazards are closer to them. Furthermore, we limit the buffer areas by land cover plausibility, e.g., a buffered area is not considered if overlapping a land cover area that is not plausible to contain fire, e.g., water or bare rock.
With the above methodological approaches, we consequently obtain approximations of areas that could be or are perceived by tweet text speakers as hazardous areas. Finally, we cross-check all the results from these methods with land cover plausibility (areas in certain land cover areas are more likely combustible; see above). Then, we combine the single estimation method results to estimate the fire’s minimal and maximal possible affected area with a confidence interval.
2.3.3. General Information about the Evaluation of the Applied Methods
RS fire data are used to evaluate the achieved results from our applied approaches. However, note that the RS extracted fire extents are not a ground truth that our approach is supposed to match, as these fire extents are obtained from RS images that are available temporally closest to the fire date (compare Table 1). At the same time, our data are available sooner, and the fire extent can change at this time. We use RS imagery-derived extents only for a rough qualitative evaluation of our approaches.
Sentinel-2 RS data are utilized to extract the fire area and compare the VGI results. The hazard area is extracted from the respective RS image (see Table 1) according to Florath and Keller [4]. This approach differentiates between burned and fire areas, which we generalize as fire areas in this study. A few post-processing steps simplify the fire area for easy visual comparison. As RS data are not available for the Camp fire case study, we rely on California Department of Forestry and Fire Protection (CalFire) agency data in this case. However, CalFire datasets display only the most considerable fire extent, derived only after a fire event ends. Therefore, the use of RS data are generally favorable, as the generated fire extents are temporally more proximate to the tweet data capture.
3. Results
To evaluate our methodology, we provide qualitative results in maps comparing the calculated barycenter and the fire approximation areas with the RS fire extents. We refer to the latter as a pseudo-reference. Since the RS data do not provide a ground truth due to temporal misalignment, statistical measures like intersection over union (IOU) for quantitative analysis cannot be calculated.
The results and their cartographic visualization achieved based on the applied methods presented in Section 2.3 for each fire case are displayed in Figure 5. As mentioned above, the results are compared and overlaid with the RS data generated fire extents. For each map, the total number of tweets before the availability of the RS image is included in the approaches, e.g., for the Bobcat fire, tweets between 06/09/2020 to 10/09/2020 are used, whereas the RS image is available on 10/09/2020 at 10 p.m. Note that specific methods are limited by the availability of text information in the tweets (e.g., road closure information).
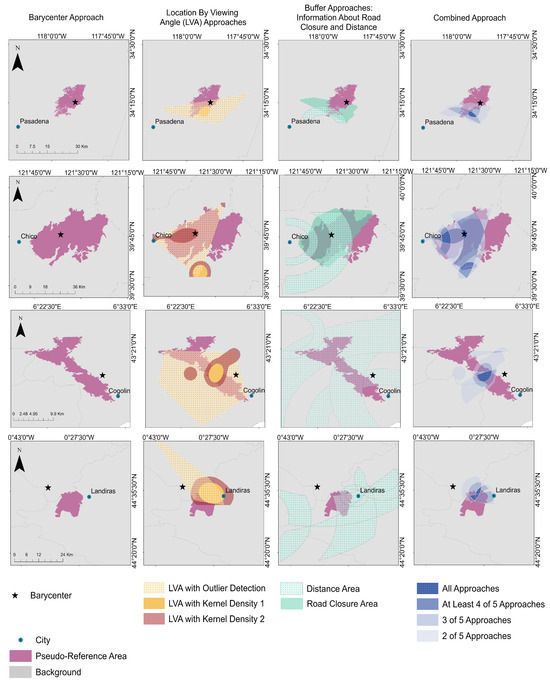
Figure 5.
Visualization of the results for the selected fires: the Bobcat fire near Los Angeles (row 1), the Camp fire near Paradise (row 2), California, United States, and the wildfires in the Var region (row 3) and near Landiras (row 4), France. The following abbreviation is used: LVA—location by viewing angle. Data basis: © 2018 GADM. Projection: WSG84.
By qualitative analysis, it can be verified that all the resulting maps agree with the RS fire pseudo-reference on a coarse level, while differences are given on a finer level. In the result obtained for the Bobcat fire (Figure 5, row 1), the barycenter corresponds with a distance of approximately 3 km to the pseudo-reference’s center well with the pseudo-reference. LVA, distance, and road closure area can be estimated and correspond primarily with the southern area of the fire area. Consequently, the overlaps as a combination of all applied approaches indicate the estimated fire area in the southern half of the pseudo-reference. The center of the VGI estimated area and the RS estimated area vary by approximately 6 km.
In the result obtained for the Camp fire (Figure 5, row 2), the barycenter also corresponds with a distance of approximately 3 km to the pseudo-reference’s center well with the agency datas’ fire area. LVA, distance, and road closure area can be estimated. LVA with outlier detection and distance area results correspond primarily to the pseudo-reference area but are located in the western part of the pseudo-reference fire area. LVA with kernel density detects three significant point cluster densities: a small one in the north, one in the south, and one on the axis from Chico and Paradise. Consequently, the overlaps as a combination of all applied approaches indicate the estimated area in the western part of the pseudo-reference area and are heterogeneous. The center of the VGI estimated area and the pseudo-reference area vary by approximately 4 km.
In the result obtained for the Var fire (Figure 5, row 3), the barycenter lies beyond the RS fire pseudo-reference. However, given the very distinct shape of the fire area, the barycenter corresponds with a distance of approximately 4 km to the pseudo-reference’s center, still well with the pseudo-reference. LVA and distance area can be estimated and correspond mainly with the central location of the fire area. Consequently, the overlap of the approaches combined shows the estimated area in the central part of the RS fire area, missing out on the upper and lower part of the very distinct fire area shape. The center of the VGI estimated area and the RS estimated area vary by less than 2 km.
In the result obtained for the Landiras fire (Figure 5, row 4), the barycenter also lies beyond the RS fire area, with a distance of approximately 10 km from the pseudo-reference’s center. However, the barycenter still approximates the course-affected area. LVA and distance area can be estimated and correspond primarily with the northern and eastern regions of the fire area, respectively. Consequently, the overlap of the approaches combined shows the estimated area in the northern half of the RS fire area. The center of the VGI estimated area and the RS estimated area vary by approximately 3 to 4 km.
4. Discussion
In this section, we discuss the presented study and the achieved results. First, we analyze the results of the different case studies overall in Section 4.1. Then, we readdress the possibilities VGI data provide for spatial analysis of natural hazards in Section 4.2. Subsequently, we investigate the limitations that restrict the use of VGI data for natural hazard location estimation in Section 4.3.
4.1. General Analysis
The case study’s findings indicate that tweets’ weighted barycenter center calculation aligns well with the fire area pseudo-reference as determined from RS imagery. It is essential to note that the barycenter is not meant to display the center of a fire area per se but should give a quick, first approximation of where the fire might be positioned. Therefore, the barycenter is still an excellent first measure to localize the approximate fire position. The presented approaches also demonstrate that the estimated minimal and maximal affected area corresponds closely to the area detected from RS. Overall, no single one of the applied methods achieves the best results for all investigated fires. All the methods give coarse estimates of the possible fire area, and the best overall visualization of the fire area situation can be achieved by the combination of the fire area estimation approaches (LVA outlier detection, LVA kernel density, distance information, and road closure information if available) and the barycenter calculation in addition. Although the methodology does not work better or worse in any case study, the results are very different and influenced by various factors.
For the Bobcat fire, the barycenter lies well within the pseudo-reference area, due to a distribution of VGI data mainly influenced by population density, whose effects we removed by weighting. The estimated area lies to the south of the RS area. This could be for several reasons, like the significantly higher population density in the city of Los Angeles, where people are more affected by the hazard. Additionally, due to the mountainous regions of the Angeles National Forest in the northern area, data are comparatively unevenly distributed. Finally, the fire developed from the south to the north, spreading in the days until RS imagery was obtained a few days later.
For the Camp fire, the barycenter also lies well within the pseudo-reference area, due to a distribution of VGI data mainly influenced by population density, whose effects we removed by weighting. Large areas of the extent overlap with the pseudo-reference. According to all approaches, fire areas of the highest likelihood are located near the most populated places, Chico and Oroville in the south and the devastated town of Paradise right in the center of the fire. Due to the location of the fire in the Sierra Nevada foothills, less information is available about the eastern area of the fire, which is located in the higher mountainous region with no significant settlements. However, the primary area of the fire corresponding with the pseudo-reference area was estimated using our approaches. As the pseudo-reference represents the final extent of the fire at the end of the fire duration, it is spatially more extensive than our estimated extent three days after the start of the fire.
For the Var fire, the barycenter lies slightly shifted from the pseudo-reference area, which can be explained by the characteristic, very narrow shape of the fire area. The narrowness of the area makes it challenging to pinpoint the actual center accurately. The correspondence of the VGI extent with the RS extent is mostly limited to the middle of the RS area. Although the number of VGI datapoints is acceptable in this case study (compare Table 2), several factors contribute to the quality of VGI data for estimating the fire area. First, the rapid spread of this fire covered the entire area in just one and a half days. Observations were hindered, as it ignited in the late afternoon and continued to propagate through the night. Additionally, the fire area was relatively small (compare Table 1), and citizens in more distant areas showed little interest, contributing to suboptimal estimation geometries. Due to the fire’s location traversing the hilly region of the Massif des Maures, visibility towards the fire was constrained to specific places, leading to a non-ideal distribution of VGI points.
For the Landiras fire, the barycenter lies outside of the pseudo-reference area and is comparatively far from the areal estimation. This occurs due to the distribution of VGI datapoints that occur very far from the actual fire area, e.g., in the city of Bordeaux, which is located approximately 30 km from the fire location. Despite the weighting of datapoints, the barycenter is shifted towards this high-density population and tweet occurrence hub. The estimated area from VGI corresponds to the northern area of the RS data area. The fire spread from the north to the south in this case study, which corresponds well with the findings. Despite a deficient amount of VGI data in this case study, the area estimation is good, as this area is generally flat, and the fire was seen from even distant places without obstruction, leading to a suitable estimation geometry. Like the Bobcat fire area, the estimated area is also closer to populated places where people might be more affected. Additionally, for Var and Landiras, the fire and road agencies responsible do not use Twitter as an information distribution tool. Consequently, the estimation of road closure areas, as outlined in the developed methodology, is unavailable in these cases.
In conclusion, the most impactful error source for estimating wildfire extents from VGI is, of course, the distribution of VGI. Even with few data (e.g., Landiras fire), the fire area can be well estimated if the viewing geometry is suitable. Factors that influence the distribution of VGI are mostly related to the visibility towards the fire (e.g., mountain obstruction, night, places very distant to fire, small fires) and are the main limiting factors to obtaining suitable information from VGI data. Moreover, utilizing distinct methodologies, specifically the barycenter and area estimation approaches, prove highly valuable. The influence of various factors affecting these analyses results in independent outcomes that mutually complement each other. For instance, in the case of the Landiras fire, the barycenter is less precise due to VGI data characteristics distant from the fire location, which is attributable to good visibility. Conversely, these characteristics contribute to highly accurate results in estimating the fire area.
Using the proposed combination of different methods yields the best results for fire area estimation from VGI data. The methodology performs satisfyingly on all investigated fire case studies. Overall, the centers of the estimated areas are located where the population is more affected by the wildfire, like the areas closer to cities (Pasadena, Chico, Paradise, Landiras). Furthermore, estimating the specific shapes of the fire areas is impossible and not the focus of our study. The estimated fire areas overlap partly with the RS imagery area estimation.
4.2. Advantages of Using VGI Data in a Hazardous Event
VGI data and, as such, Twitter data can be considered as alternative data to identify potential hazard areas. One significant advantage compared to RS data is the availability in near-real time. The time component is very critical in natural hazard analysis. It is a significant advantage of VGI data over data derived with RS that becomes available only later, depending on satellite overpass times. Tweets can be instantly crawled from the first indications of the occurrence of a hazard and can be obtained continuously during the complete period of the hazard’s duration. In addition, using continuously occurring data, the hazard locations can be obtained more and more accurately. Continuous observation of the data and changes within can also be used to indicate change in hazard location or people’s perception of hazard danger. Overall, the approximate natural hazard location can be estimated from VGI data. These estimations can be valuable for rescue services to prepare immediately or plan accordingly, especially during times when no other data source is available for first estimations.
Furthermore, VGI provides more information than RS data, such as more specific text information. Whereas RS data only provide information about the natural hazard extent, VGI data can hold additional information, e.g., about the hazard (intensity, sentiments) in the text. VGI can highlight areas affected by natural hazards where humans are predominantly impacted. This information can be more valuable for rescue services than simply identifying the location of the hazard. Additionally, VGI presents an effective method for involving the affected community and distributing information among it in general. Encouraging data contribution by citizens, especially during a natural hazard situation, could also further improve the data availability and the amount of data. More details about fire intensity, smoke production, spread rate, and other characteristics could be gained from such. Therefore, VGI can be a complementary or additional source of information compared to, e.g., RS data. However, in the absence of any other data for hazard assessment, VGI data become particularly valuable.
As shown, the developed methodology, including the overlapping of different approaches, can work well despite the possible impact of influencing factors on VGI occurrence, like demographics, by balancing the final approach on several information types.
4.3. Limitations
When critically investigating possible restrictions, it becomes apparent that estimations from VGI data can only serve as an approximate indicator of natural hazard locations. The major limitation is the absence of data in non-populated regions, e.g., on mountain tops or in densely forested areas. No tweets are posted in these areas, and, consequently, no datapoints for the spatial analysis are available. This effect contributes to a bias toward estimating the natural hazard locations closer to populated places, especially for the barycenter location calculation. In general, the region where a hazard is located plays an important role; as more or fewer tweets are posted, people tend to keep their accurate locations private, or emergency services post publicly or not on social media platforms in different regions. Therefore, the approach can be beneficial only in certain areas.
Furthermore, we rely on data with different accuracy levels: Emergency services or road agencies’ information about blocked road positions is very accurate (with coordinates). On the other hand, relying on people’s estimations of where they see the hazard or how far away they estimate it can be inaccurate and biased. We implement our viewing angle approach to account for faulty text information by validating possible lines of sight. Furthermore, the barycenter location calculations rely on the correction of several factors like population density, but, further, more specific anthropogenic factors could be influencing the occurrence of tweets. For example, people in a fire-prone area could be tweeting less about fires nearby, as they are more familiar with such and do not consider it as an exciting event to talk about. For the barycenter calculation, more weighting factors could be introduced, representing various factors’ influence on the occurrence of VGI datapoints. These could be, e.g., the closeness to roads, a region’s slope or the digital development index (DDI) [47], which is an index that measures the physical access and adoption of broadband infrastructure and the socioeconomic characteristics that limit their use. In addition, the occurrence of tweets is random and, therefore, not necessarily representative. Overall, human sensors are less accurate than technical ones, and VGI can generally be used only as a proxy and as a complementary data source.
4.4. Considerations for Practical Application
Several factors would need to be addressed to employ a tool for applying the developed methodology for wildfire management. First, the data quality and volume of VGI should be considered, as we did in this study (compare Section 2.2). Advanced data validation techniques, as proposed in a few studies [36,48], could be additionally implemented. In a tool, thresholds for, e.g., a suitable number of datapoints from which estimated areas should be integrated could be set. Of course, the use of Twitter and social media data generally varies across different regions, as we demonstrated for California and France (see Table 1). In California, more tweets are generally available. However, fewer tweets contain location information, and the opposite is true in France. Also, in France, road agencies do not use Twitter. Despite these variations, our methodology is suitable for all investigated case study scenarios. Although conclusive evidence is yet to be established, our methodology appears robust to variations in wildfire scenarios. When implementing a tool that can be used in any wildfire case, the issue of multilingualism needs to be addressed. Using English and French text information, we demonstrated that our approach works well on case study hazards in California and France.
A few adaptions to the NER and RegEx are necessary to do so. The Spacy library for NER supports many languages and is continually developed. When obtaining GPE and LOC information in other languages, trained pipelines for the respective language must be downloaded. The patterns for the RegEx need to be adapted to detect road names or place names in different languages. Furthermore, a tool should account for temporal patterns to account for the possibility of variability in tweet frequency and topic relevance over time. It could be built to consider, e.g., daily variations in social media activity talking about the specific hazard. For example, the methodology could be systematically implemented by aggregating tweets daily, subsequently combining data for two consecutive days, followed by iterative combinations for three or more consecutive days. Furthermore, we rely on location information only from users who consent to the public display of their location and anonymized data where usernames are not revealed, as legal issues might need to be considered for a tool. Further investigations of how this proof of concept could be integrated into a wildfire management system are necessary.
5. Conclusions
In this study, we propose and present an approach for natural hazard estimation from VGI, namely Twitter data. We extract tweet text and location for dates corresponding to the time of natural hazard events before usually considered data sources like RS data are available. We analyze four case studies in California, the U.S., and France with our methodological approach. The methodology consists of two primary approaches: (1) estimating the hazard location from tweet locations while considering influencing factors, and (2) estimating the hazard location and/or the area where people are affected by the hazard from tweet text information. The results indicate that the approach can approximate the hazard location and indicate where people are majorly affected by the hazard.
Despite the tweets’ limitation in location accuracy and the influence of many other factors, the estimated fire areas correspond by 2 to 6 km, and the barycenter calculations correspond by 5 km on average with the pseudo-reference results that were extracted for the temporally closest time. Due to the variety of approaches employed for barycenter and area estimation, these two methodologies complement each other effectively, frequently attaining higher accuracies in a complementary manner when one approach exhibits deficiencies. Tweets can, therefore, be considered to bridge the gap in information until RS data becomes available or if no other data are available for natural hazard analysis. Containing additional information, like people’s perception of the hazard, VGI can also be a complementary source of information compared to RS data. However, results are limited mainly by the availability of VGI data and especially its absence in specific regions.
In contrast to existing studies for spatial analysis of natural hazards from VGI, our developed methodology can be easily transferred to other wildfire case studies as demonstrated, due to the use of a variety of available information from VGI data and the use of supplementary data to account for demographic biases. Additionally, we achieve wildfire extent estimations on much higher accuracy levels with similarity to temporally close extents from other data sources within several kilometers compared to estimation using only kernel density [8].
Furthermore, similar adapted methodologies could be tested for different natural hazards, like floods, in the future. One is more likely to obtain tweet data within a more populated area in a flood scenario since floods might occur in city centers. In contrast, fire hazards occur more often in the less populated countryside or forested areas, outside city centers, and most often outside populated places. Therefore, the distribution of tweet datapoints for flood hazards could be more favorable. Instead of tweets, other text data sources like rescue service notifications could be used. Such information yields even more accurate information concerning the incident locations and categorization, e.g., severity. Furthermore, NLP for information retrieval can be used on the tweets’ texts to extract further information, e.g., on the severity of the hazard, in addition to our methodology, and map such information.
Author Contributions
Conceptualization, J.F., J.C. and S.K.; methodology, J.F., J.C. and S.K.; software, J.F. and S.K.; validation, J.F.; formal analysis, J.F.; investigation, J.F., J.C. and S.K.; resources, J.F.; data curation, J.F.; writing—original draft preparation, J.F. and S.K.; writing—review and editing, J.F. and S.K.; visualization, J.F. and S.K.; supervision, J.C. and S.K. All authors have read and agreed to the published version of the manuscript.
Funding
This work was partially supported by the AXA Research Fund and by MIAI@Grenoble Alpes (ANR-19-P3IA-0003).
Institutional Review Board Statement
Not applicable.
Informed Consent Statement
Not applicable.
Data Availability Statement
The data supporting these findings are available from the corresponding author upon reasonable request.
Acknowledgments
We thank Stefan Hinz, head of the Institute of Photogrammetry and Remote Sensing at the Karlsruhe Institute of Technology, for funding this work. We acknowledge support by the KIT-Publication Fund of the Karlsruhe Institute of Technology.
Conflicts of Interest
The authors declare no conflicts of interest.
References
- Songwathana, K. The relationship between natural disaster and economic development: A panel data analysis. Procedia Eng. 2018, 212, 1068–1074. [Google Scholar] [CrossRef]
- Wisner, B.; Blaikie, P.; Cannon, T.; Davis, I. At Risk: Natural Hazards, People’s Vulnerability and Disasters; Routledge: Oxfordshire, UK, 2014. [Google Scholar]
- Hao, H.; Wang, Y. Leveraging multimodal social media data for rapid disaster damage assessment. Int. J. Disaster Risk Reduct. 2020, 51, 101760. [Google Scholar] [CrossRef]
- Florath, J.; Keller, S. Supervised Machine Learning Approaches on Multispectral Remote Sensing Data for a Combined Detection of Fire and Burned Area. Remote Sens. 2022, 14, 657. [Google Scholar] [CrossRef]
- Dittrich, A.; Lucas, C. Is this Twitter event a disaster? In Connecting a Digital Europe through Location and Place, Proceedings of the AGILE’2014 International Conference on Geographic Information Science, Castellon, Spain, 3–6 June 2014; AGILE Digital Editions: Castellon, Spain, 2014. [Google Scholar]
- Wang, Y.; Wang, T.; Ye, X.; Zhu, J.; Lee, J. Using social media for emergency response and urban sustainability: A case study of the 2012 Beijing rainstorm. Sustainability 2016, 8, 25. [Google Scholar] [CrossRef]
- Guan, X.; Chen, C. Using social media data to understand and assess disasters. Nat. Hazards 2014, 74, 837–850. [Google Scholar] [CrossRef]
- Wang, Z.; Ye, X.; Tsou, M.H. Spatial, temporal, and content analysis of Twitter for wildfire hazards. Nat. Hazards 2016, 83, 523–540. [Google Scholar] [CrossRef]
- Panteras, G.; Wise, S.; Lu, X.; Croitoru, A.; Crooks, A.; Stefanidis, A. Triangulating social multimedia content for event localization using Flickr and Twitter. Trans. GIS 2015, 19, 694–715. [Google Scholar] [CrossRef]
- Jurgens, D.; Finethy, T.; McCorriston, J.; Xu, Y.T.; Ruths, D. Geolocation prediction in twitter using social networks: A critical analysis and review of current practice. In Proceedings of the Ninth International AAAI Conference on Web and Social Media, Oxford, UK, 26–29 May 2015. [Google Scholar]
- Davis, C.A.; Pappa, G.L.; De Oliveira, D.R.R.; Arcanjo, F.L. Inferring the location of twitter messages based on user relationships. Trans. GIS 2011, 15, 735–751. [Google Scholar] [CrossRef]
- MacEachren, A.M.; Robinson, A.C.; Jaiswal, A.; Pezanowski, S.; Savelyev, A.; Blanford, J.; Mitra, P. Geo-twitter analytics: Applications in crisis management. In Proceedings of the 25th International Cartographic Conference, Paris, France, 3–8 July 2011; pp. 3–8. [Google Scholar]
- Laylavi, F.; Rajabifard, A.; Kalantari, M. A multi-element approach to location inference of twitter: A case for emergency response. ISPRS Int. J.-Geo-Inf. 2016, 5, 56. [Google Scholar] [CrossRef]
- Huang, C.Y.; Tong, H.; He, J.; Maciejewski, R. Location Prediction for Tweets. Front. Big Data 2019, 2, 5. [Google Scholar] [CrossRef]
- Gelernter, J.; Balaji, S. An algorithm for local geoparsing of microtext. GeoInformatica 2013, 17, 635–667. [Google Scholar] [CrossRef]
- Dittrich, A. Real-Time Event Analysis and Spatial Information Extraction from Text Using Social Media Data. Ph.D. Thesis, Karlsruhe Institute of Technology, Karlsruhe, Germany, 2016. [Google Scholar]
- Burton, S.H.; Tanner, K.W.; Giraud-Carrier, C.G.; West, J.H.; Barnes, M.D. “Right time, right place” health communication on Twitter: Value and accuracy of location information. J. Med. Internet Res. 2012, 14, e2121. [Google Scholar] [CrossRef] [PubMed]
- Huang, B.; Carley, K.M. A large-scale empirical study of geotagging behavior on twitter. In Proceedings of the 2019 IEEE/ACM International Conference on Advances in Social Networks Analysis and Mining, Vancouver, BC, Canada, 27–30 August 2019; pp. 365–373. [Google Scholar]
- Ajao, O.; Hong, J.; Liu, W. A survey of location inference techniques on Twitter. J. Inf. Sci. 2015, 41, 855–864. [Google Scholar] [CrossRef]
- Kim, M.G.; Koh, J.H. Recent research trends for geospatial information explored by Twitter data. Spat. Inf. Res. 2016, 24, 65–73. [Google Scholar] [CrossRef]
- Benson, E.; Haghighi, A.; Barzilay, R. Event discovery in social media feeds. In Proceedings of the 49th Annual Meeting of the Association for Computational Linguistics: Human Language Technologies, Portland, OR, USA, 19–24 June 2011; pp. 389–398. [Google Scholar]
- Han, S.; Ciravegna, F. Rumour Detection on Social Media for Crisis Management. In Proceedings of the ISCRAM, Valencia, Spain, 19–22 May 2019. [Google Scholar]
- Imran, M.; Mitra, P.; Castillo, C. Twitter as a lifeline: Human-annotated twitter corpora for NLP of crisis-related messages. arXiv 2016, arXiv:1605.05894. [Google Scholar]
- De Albuquerque, J.P.; Herfort, B.; Brenning, A.; Zipf, A. A geographic approach for combining social media and authoritative data towards identifying useful information for disaster management. Int. J. Geogr. Inf. Sci. 2015, 29, 667–689. [Google Scholar] [CrossRef]
- Cervone, G.; Sava, E.; Huang, Q.; Schnebele, E.; Harrison, J.; Waters, N. Using Twitter for tasking remote-sensing data collection and damage assessment: 2013 Boulder flood case study. Int. J. Remote Sens. 2016, 37, 100–124. [Google Scholar] [CrossRef]
- Goffi, A.; Bordogna, G.; Stroppiana, D.; Boschetti, M.; Brivio, P.A. Knowledge and data-driven mapping of environmental status indicators from remote sensing and VGI. Remote Sens. 2020, 12, 495. [Google Scholar] [CrossRef]
- Poser, K.; Dransch, D. Volunteered geographic information for disaster management with application to rapid flood damage estimation. Geomatica 2010, 64, 89–98. [Google Scholar]
- Yang, W.; Mu, L. GIS analysis of depression among Twitter users. Appl. Geogr. 2015, 60, 217–223. [Google Scholar] [CrossRef]
- Ghosh, D.; Guha, R. What are we ‘tweeting’about obesity? Mapping tweets with topic modeling and Geographic Information System. Cartogr. Geogr. Inf. Sci. 2013, 40, 90–102. [Google Scholar] [CrossRef] [PubMed]
- Gerber, M.S. Predicting crime using Twitter and kernel density estimation. Decis. Support Syst. 2014, 61, 115–125. [Google Scholar] [CrossRef]
- Hultquist, C.; Simpson, M.; Cervone, G.; Huang, Q. Using nightlight remote sensing imagery and twitter data to study power outages. In Proceedings of the 1st ACM SIGSPATIAL International Workshop on the Use of GIS in Emergency Management, Bellevue, WA, USA, 3–6 November 2015; pp. 1–6. [Google Scholar]
- Bao, J.; Liu, P.; Yu, H.; Xu, C. Incorporating twitter-based human activity information in spatial analysis of crashes in urban areas. Accid. Anal. Prev. 2017, 106, 358–369. [Google Scholar] [CrossRef] [PubMed]
- Forati, A.M.; Ghose, R. Examining Community Vulnerabilities through multi-scale geospatial analysis of social media activity during Hurricane Irma. Int. J. Disaster Risk Reduct. 2022, 68, 102701. [Google Scholar] [CrossRef]
- Benevenuto, F.; Rodrigues, T.; Almeida, V.; Almeida, J.; Gonçalves, M. Detecting spammers and content promoters in online video social networks. In Proceedings of the 32nd International ACM SIGIR Conference on Research and Development in Information Retrieval, Boston, MA, USA, 19–23 July 2009; pp. 620–627. [Google Scholar]
- Ratkiewicz, J.; Conover, M.; Meiss, M.; Gonçalves, B.; Patil, S.; Flammini, A.; Menczer, F. Truthy: Mapping the spread of astroturf in microblog streams. In Proceedings of the 20th International Conference Companion on World Wide Web, Hyderabad, India, 28 March–1 April 2011; pp. 249–252. [Google Scholar]
- Castillo, C.; Mendoza, M.; Poblete, B. Information credibility on Twitter. In Proceedings of the 20th International Conference on World Wide Web, Hyderabad, India, 28 March–1 April 2011; pp. 675–684. [Google Scholar]
- Adnan, M.; Longley, P.A.; Khan, S.M. Social dynamics of twitter usage in London, Paris, and New York City. First Monday 2014, 19, 5. [Google Scholar] [CrossRef]
- Sloan, L. Who tweets in the United Kingdom? Profiling the Twitter population using the British social attitudes survey 2015. Soc. Media+ Soc. 2017, 3, 2056305117698981. [Google Scholar] [CrossRef]
- Ponukumati, P.; Regonda, S.K. Twitter—A New Citizen Science Solution for Urban Flood Database# Urban Floods# Flood Database. 2023. Available online: https://assets.researchsquare.com/files/rs-3045515/v1/efdd999e-3494-4ee6-b920-c657b07e36c8.pdf?c=1689058812 (accessed on 18 December 2023).
- Worldpop. 2022. Available online: https://www.worldpop.org/ (accessed on 4 September 2023).
- Buchhorn, M.; Lesiv, M.; Tsendbazar, N.E.; Herold, M.; Bertels, L.; Smets, B. Copernicus global land cover layers—collection 2. Remote Sens. 2020, 12, 1044. [Google Scholar] [CrossRef]
- Agarwal, A.; Toshniwal, D. Face off: Travel habits, road conditions and traffic city characteristics bared using twitter. IEEE Access 2019, 7, 66536–66552. [Google Scholar] [CrossRef]
- Utomo, M.N.Y.; Adji, T.B.; Ardiyanto, I. Geolocation prediction in social media data using text analysis: A review. In Proceedings of the 2018 International Conference on Information and Communications Technology (ICOIACT), Yogyakarta, Indonesia, 6–7 March 2018; pp. 84–89. [Google Scholar]
- Martínez, N.J.F.; Periñán-Pascual, C. Knowledge-based rules for the extraction of complex, fine-grained locative references from tweets. RAEL Rev. Electrón. Lingüíst. Apl. 2020, 19, 136–163. [Google Scholar]
- Explosion. spaCy—Industrial-Strength Natural Language Processing. 2023. Available online: https://spacy.io/ (accessed on 15 November 2023).
- ESRI. ArcGIS Pro. 2023. Available online: https://www.esri.com/en-us/arcgis/products/arcgis-pro/overview (accessed on 18 December 2023).
- Gallardo, R. Digital Divide Index. 2020. Available online: https://storymaps.arcgis.com/stories/8ad45c48ba5c43d8ad36240ff0ea0dc7 (accessed on 18 December 2023).
- Takahashi, T.; Igata, N. Rumor detection on twitter. In Proceedings of the 6th International Conference on Soft Computing and Intelligent Systems, and the 13th International Symposium on Advanced Intelligence Systems, Kobe, Japan, 20–24 November 2012; pp. 452–457. [Google Scholar]
Disclaimer/Publisher’s Note: The statements, opinions and data contained in all publications are solely those of the individual author(s) and contributor(s) and not of MDPI and/or the editor(s). MDPI and/or the editor(s) disclaim responsibility for any injury to people or property resulting from any ideas, methods, instructions or products referred to in the content. |
© 2023 by the authors. Licensee MDPI, Basel, Switzerland. This article is an open access article distributed under the terms and conditions of the Creative Commons Attribution (CC BY) license (https://creativecommons.org/licenses/by/4.0/).