Article

Effects of Fire Regime on Nitrogen Distribution in Marshlands of the Sanjiang Plain (NE China)

1
State Key Laboratory of Black Soils Conservation and Utilization, Northeast Institute of Geography and Agroecology, Chinese Academy of Sciences, Shengbei Street 4888, Changchun 130102, China
2
Key Laboratory of Wetland Ecology and Environment, Northeast Institute of Geography and Agroecology, Chinese Academy of Sciences, Shengbei Street 4888, Changchun 130102, China
3
Agricultural College, Jilin Agricultural University, No. 2888 Xincheng Street, Changchun 130118, China
*
Authors to whom correspondence should be addressed.
Fire 2024, 7(10), 339; https://doi.org/10.3390/fire7100339
Submission received: 3 September 2024 / Revised: 21 September 2024 / Accepted: 24 September 2024 / Published: 26 September 2024
(This article belongs to the Special Issue Patterns, Drivers, and Multiscale Impacts of Wildland Fires)

Abstract

:
Fire is a key ecological factor in marshes, significantly influencing the nitrogen (N) cycle. The impacts of different fire regimes on marshes have garnered increasing attention. This study aims to reveal the effects of fire regimes on N distribution in marshes. We conducted field experiments with fixed–point prescribed burning in typical Sanjiang Plain freshwater marshes, exploring the influences of various fire regimes on the distribution of N in marshes. We found that in the spring–burned plots, the soil ammonium ( NH 4 + N ) content increased by 318% with thrice–burned approaches compared to once–burned, and by 186% with thrice–burned compared to twice–burned. In the autumn–burned plots, NH 4 + N content increased by 168% and 190%, respectively. Similarly, the soil nitrate ( NO 3 N ) content three years subsequent to burning increased by 29.1% compared to one year since burning, and by 5.96% compared to two years since burning in the spring–burned plots (73.8% and 32.9% increases, respectively, in the autumn–burned plots). The plant stem–N content of the autumn burns increased by 30.9%, 119%, and 89.1% compared to the spring burns after one, two, and three years since burning, respectively. Our results indicate that high fire–frequency promotes marsh N cycling within the span of three years. The marsh soil conversion of NH 4 + N to NO 3 N was enhanced with increased time since burning. High fire–frequency promotes plant growth, exacerbating competition between plant populations, with this effect being more significant in autumn–burned plots than in spring–burned plots.

Graphical Abstract

1. Introduction

Marshes are ecosystems characterized by herbaceous plants and are typically wet or permanently waterlogged [1]. Marshes store significant amounts of carbon [2,3] and contribute greatly to the mitigation of global warming [4]. The formation of these carbon sinks is largely due to the properties of the long–term flooded environment in marsh soil. The long–term flooded environment of marshes leads to lower soil microbial activity and slow nitrification of marsh soil, which exacerbates nitrogen (N) limitation [5,6]. Thus, N limitation is a major factor influencing marsh carbon sinks.
With climate change and increased human activity, fires have become more frequent, which is gradually becoming a key ecological factor in marshes. Fire consumes litter, releasing large amounts of N stored in plants and accelerating the N cycle. During the burning process, some N is released into the air as N oxides, [7], resulting in N loss. The ash produced by burning plants contains high levels of inorganic N, which is directly incorporated into the soil, increasing its N content [8,9]. However, this N is easily transported to other ecosystems through marsh hydrological outputs (e.g., runoff) [10,11]. Post–fire, alterations in the physicochemical properties of the soil can also influence the N cycle. The solar radiation absorption of the soil surface is increased post–fire and the soil temperature increases [12,13]. Fire lowers the soil moisture content and causes soil crusting, reducing water infiltration and increasing soil oxygen levels [14,15,16,17]. The rises in temperature and oxygen levels boost soil microbial activity, promoting N mineralization and thus increasing N availability in soils post–fire [18,19,20].
The influence of fire regime (i.e., time since burning, burn frequency, and burn season) on marshes has gradually attracted attention. Marshes gradually self–regulate and recover within the time subsequent to burning due to their regulatory ability, though the degree of recovery depends on burn frequency and burn season [21]. Increased burn frequency can destroy ecosystems [17] and exacerbate the influences of fire on soil physicochemical properties [22]. For instance, an increase in burn frequency leads to an increase in soil pH [23] and increased soil runoff events, exacerbating nutrient loss [18,24,25]. On the other hand, autumn burns consume surface litter, leaving soil surfaces cold in winter, killing fine plant roots, and affecting nutrient uptake and plant growth during the growing season [26,27].
The Sanjiang Plain, the largest marsh area in China and an important grain production base, features Calamagrostis angustifolia (C. angustifolia) as the dominant species, with C. lasiocarpa, C. pseudo–curaica, C. meyeriana, and C. appendiculata as companion species [28,29,30]. The C. angustifolia coverage exceeds 70%, with a surface grass root layer about 10 cm thick [31]. The Sanjiang Plain has been subjected to extensive agricultural development, and numerous marshes are distributed on both sides of the farmland. Agricultural burning often takes place in the spring and autumn in the Sanjiang Plain, which usually results in fires escaping to nearby marshes. Thus, large–scale fires often occur in the marshes of the Sanjiang Plain, which affects their nutrient cycling and plant growth.
To investigate the effects of fire regimes on N distribution in marshes, we conducted field fixed–point prescribed burning experiments in typical Sanjiang Plain freshwater marshes. We studied the effects of time since burning (1–3 years post–fire), burn frequency (1–3), and burn season (spring and autumn) on N distribution over three years. This study aims to elucidate the impacts of fire regimes on marsh N distribution and the relative effects of spring and autumn burns. Our hypotheses are as follows: (1) Fire promotes the N cycle, with high fire–frequency exacerbating this effect. (2) Plant uptake of N increases with time elapsed since burning. (3) The influence of autumn burns on marsh plant recovery may be more significant than that of spring burns.

2. Materials and Methods

2.1. Study Site

The experimental site is situated within the Sanjiang Plain Experimental Station of Marsh Ecology, Chinese Academy of Sciences (47°35′ N, 133°31′ E), covering an area of 100 hm2. The climate in this region is characterized as temperate continental, with cold, lengthy winters and warm, humid summers, and the annual average temperature ranges from 1.90 to 3.90 °C [32]. The annual rainfall is 600 mm, of which 60% is concentrated in the months of June to September. The community is only flooded to the surface in years of high rainfall and during the early spring when the snow and ice melt. Since the rapid population growth in the 19th century, the area has been intensively reclaimed and cultivated by fire [33]. Consequently, straw burning is common after autumn harvests or before spring planting each year, posing a significant threat to the remaining natural marshes.

2.2. Experimental Design

In this study, nine 10 m × 15 m sites were established in the Sanjiang Plain freshwater marshes to assess the impacts of different fire regimes on soil and plant N dynamics. These sites were categorized into three groups: spring burns (S), autumn burns (A), and unburned controls (C). Each site was further divided into three plots (10 m × 4 m) that were separated by firebreaks (1 m). Throughout the experiment, each plot underwent burning at varying frequencies: once (O), twice (T), and thrice (H) (Figure 1). Sites were spaced 5 m apart, with each treatment replicated three times. Autumn burning was carried out in October in 2007, 2008, and 2009, while spring burns occurred in April in 2008, 2009, and 2010. Burning, under the supervision of firefighting personnel, occurred in segmented sections. The dry weather conditions led to complete consumption of ground vegetation during the approximately 10 min burning period. Due to the predominance of herbaceous plants used as fuel and the short burning duration, the fire intensity was low. Spring burning typically occurred under a surface snow–ice thickness of 0–5 cm, allowing the fire to consume only uncovered litter. In contrast, autumn burning, facilitated by the dry climate, led to the combustion of all the litter.

2.3. Sampling and Chemical Analysis

In each plot, six surface soil samples (0–15 cm) were collected in June and September of the second year following the fire. These samples were transported to the laboratory and passed through a 2 mm sieve for chemical analysis. Fresh soil was used to determine dissolved organic nitrogen (DON) and microbial biomass nitrogen (MBN) contents. The soil MBN was determined by the chloroform fumigation–0.5 M K2SO4 extraction method, and the extracts were subjected to the alkaline persulfate oxidation method. The soil DON was tested by extracting fresh soil with 0.5 M K2SO4 solutions at a soil–to–water ratio of 1:5, soaking for 30 min, and applying centrifugal filtration. The extracts were subjected to the alkaline persulfate oxidation method. The NH 4 + N and NO 3 N in the soil were extracted with 1 M KCl solution, and the extract was analyzed with a continuous flowing analyzer (SAN++CFA, Skalar, Netherlands) [34]. Total nitrogen (TN) in the soil was analyzed using a continuous flowing analyzer (SAN++CFA, Skalar, Netherlands) after being digested with 4 mL concentrated H2SO4.
Three 0.3 m × 0.3 m quadrats were randomly placed within each sample area to collect plant samples. Plants (i.e., stems and leaves) were cut close to the ground, separated into stems and leaves, placed in an oven at 105 °C for 1 h, and then dried at 65 °C for 47 h, after which they were weighed, and the biomass was estimated. Approximately 20 g of plant material was ground, and the N content in the stems and leaves was determined using a continuous flow analyzer (SAN++CFA, Skalar, Netherlands). Aboveground nitrogen (aboveground–N) was calculated from the plant aboveground biomass and N content data. Per–plant nitrogen (per–plant–N) content was calculated based on aboveground–N and stem density. Plant and soil samples were collected twice a year, at the beginning of the growing season (June) and at the end of the growing season (September), in 2008, 2009, and 2010.

2.4. Statistical Analysis

A three–way ANOVA was used to assess the significant differences in fire regime in the changes in soil and plant N contents in marshes (i.e., time since burning, burn frequency, and burn season). The different treatments were evaluated for variability with Tukey’s honestly significant difference (Tukey–HSD) test. Significant differences are reported at the 0.05 probability level (i.e., p < 0.05). Statistical analyses were conducted using SPSS 23.0 statistical software (SPSS Institute, Inc., Chicago, IL, USA).

3. Results

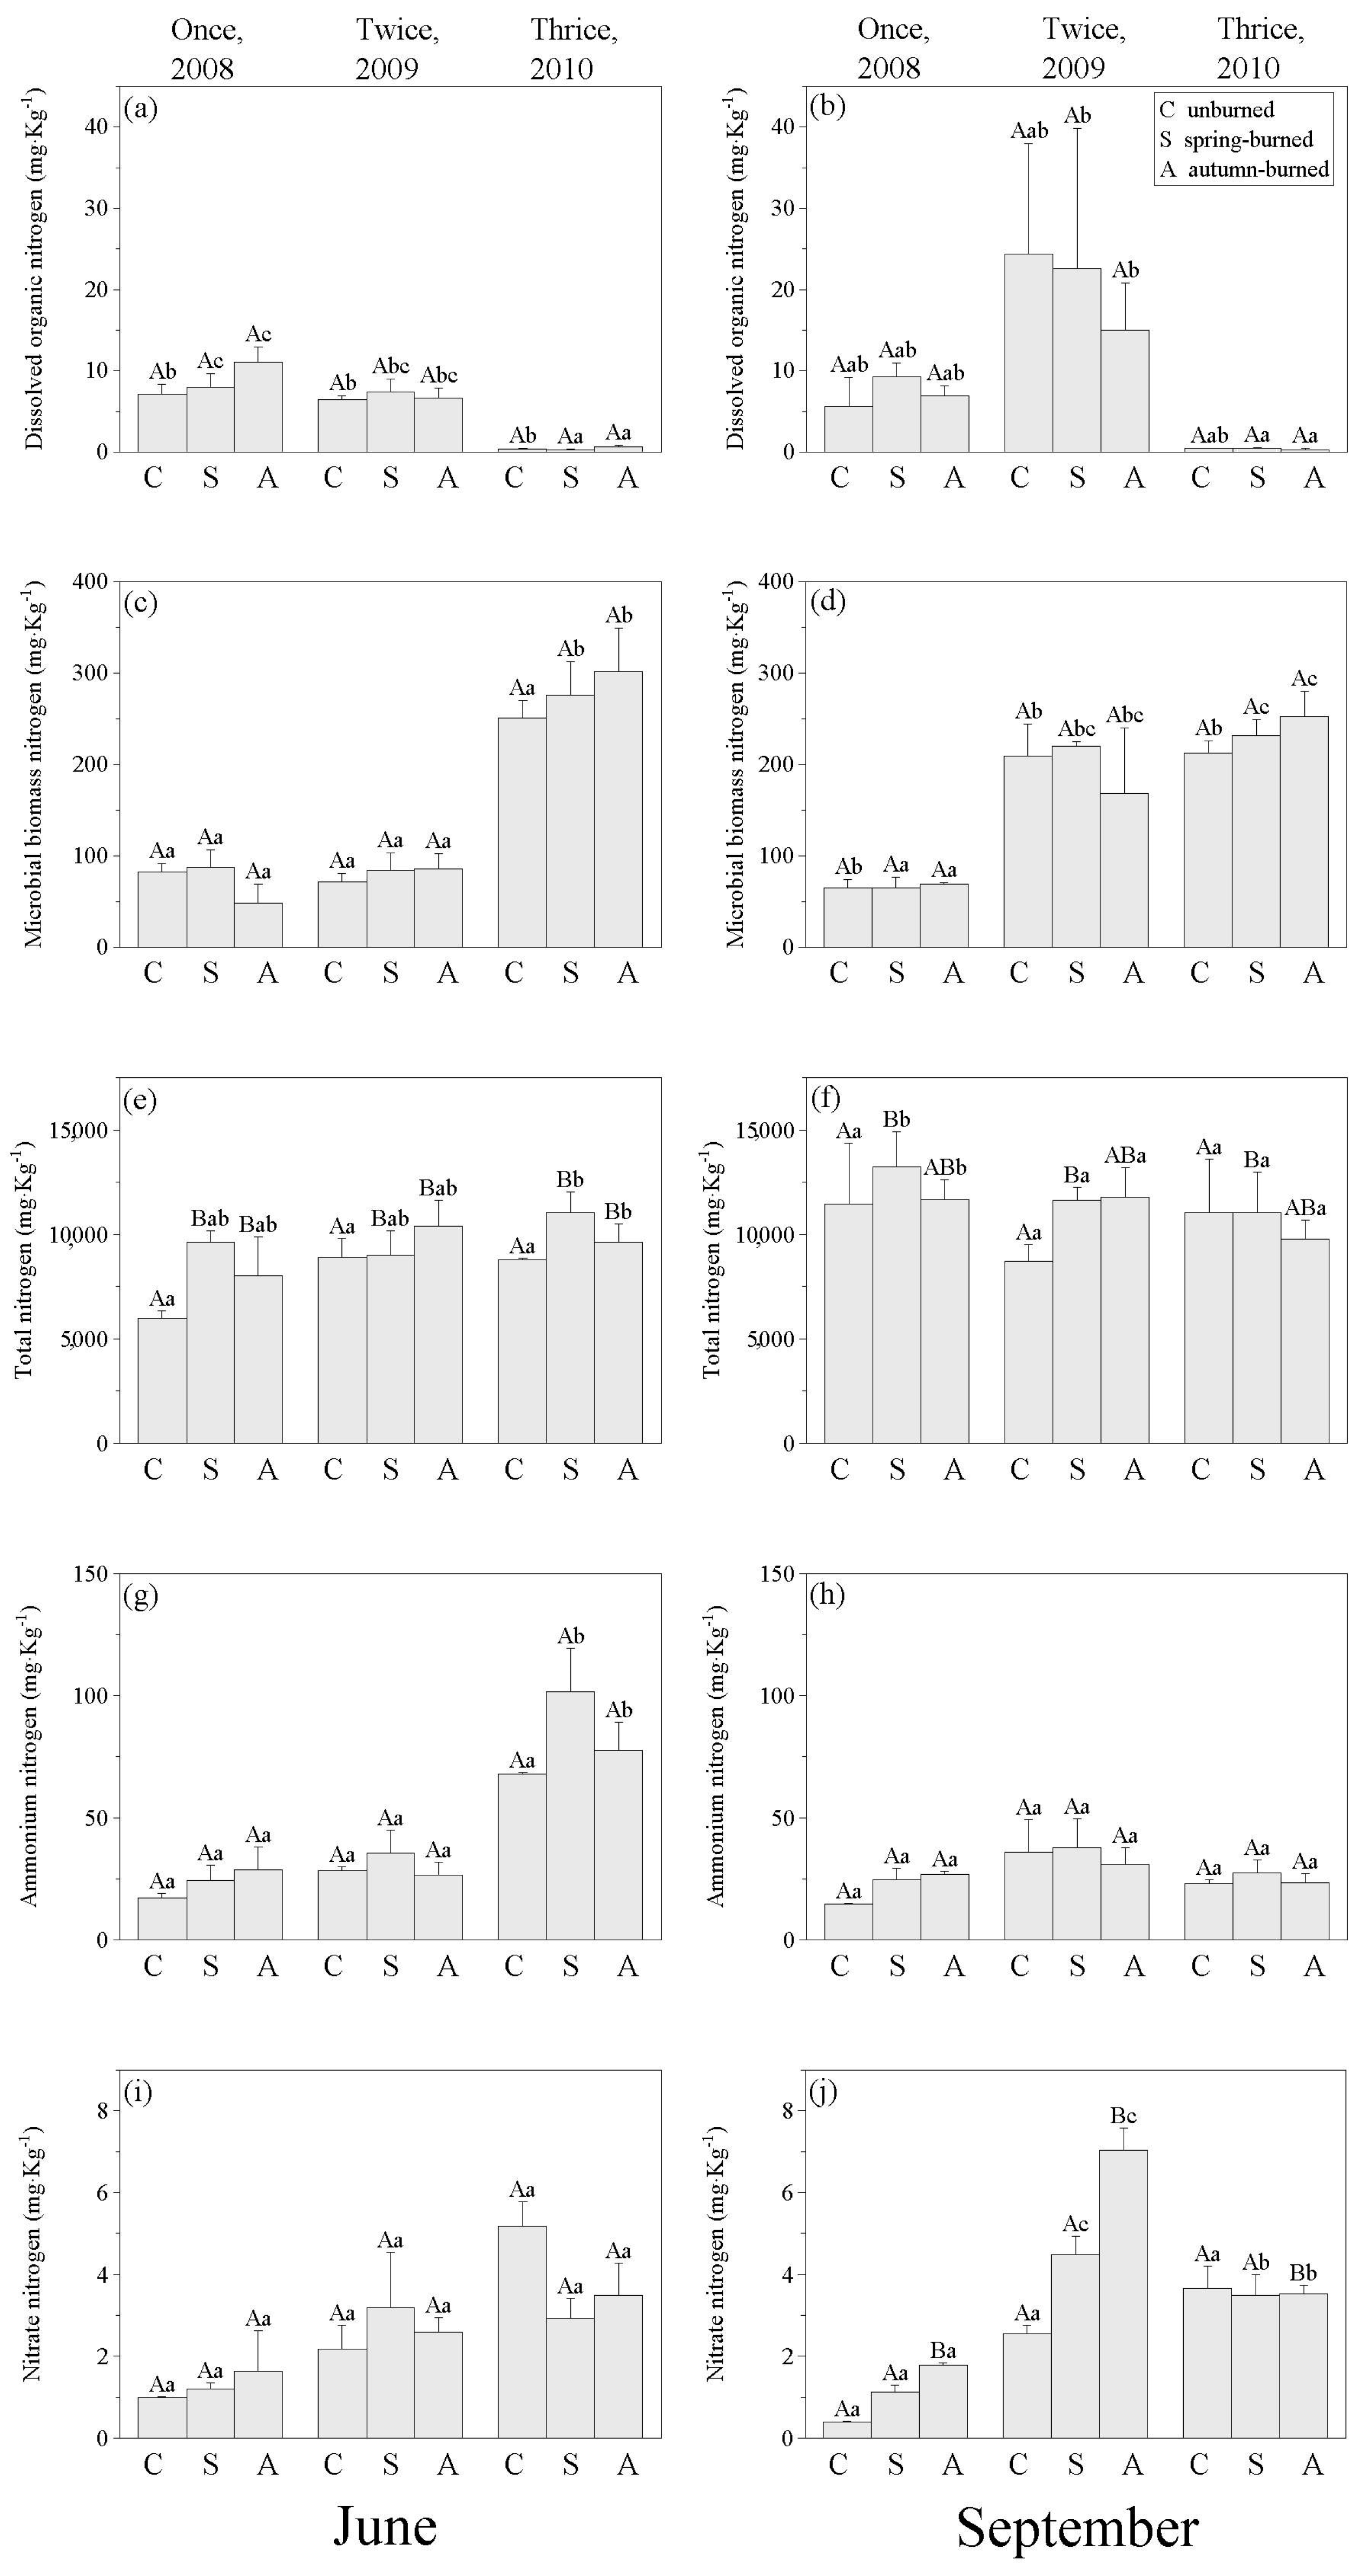
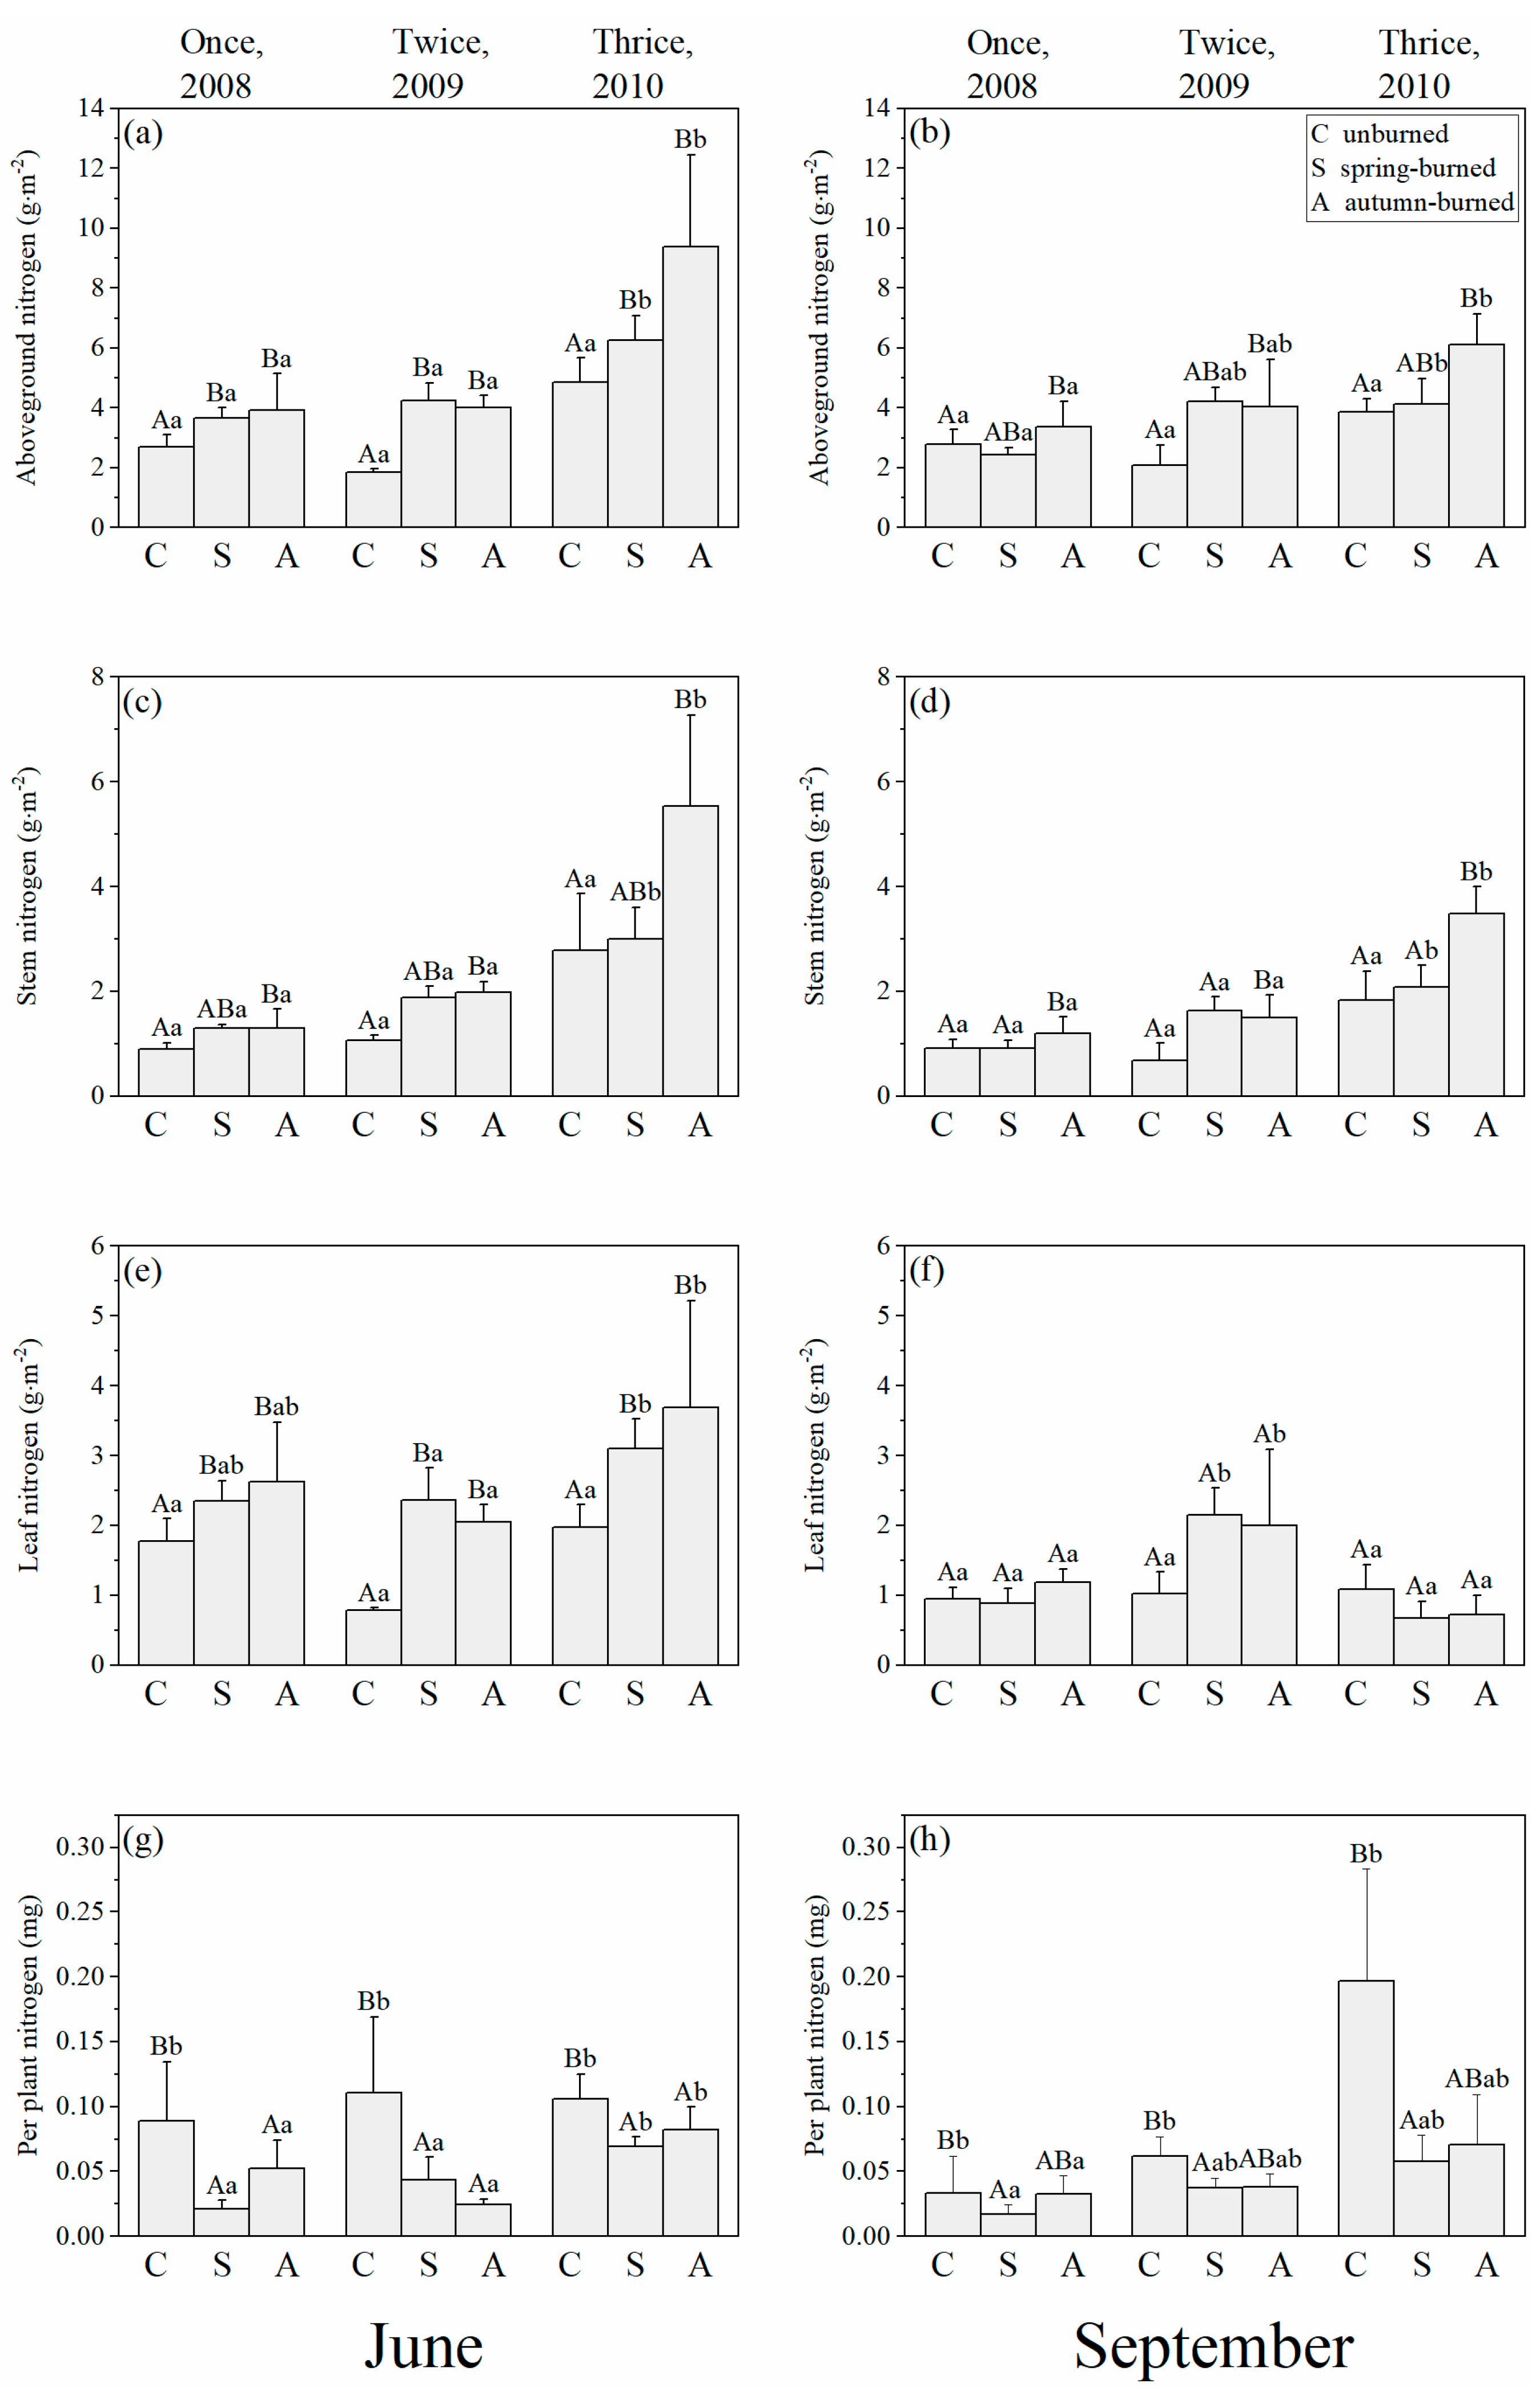
3.1. Changes in Nitrogen Distribution in Soils and Plants by Different Burn Frequency

The burn frequency significantly influenced most variables measured in the soil in June and September. The interaction between burn season and burn frequency was significant only for plant stem–N content in June and for soil NO 3 N and plant stem–N content in September (Table 1). In June, the soil NH 4 + N content increased with an increase in burn frequency in the spring–burned plots (e.g., 24.3 ± 6.24 mg/kg in once–burned plots, 35.5 ± 9.57 mg/kg in twice–burned plots, and 102 ± 17.9 mg/kg in thrice–burned plots; Figure 2g). In the autumn–burned plots, the soil NH 4 + N content in June was 77.4 ± 11.7 mg/kg for thrice–burned plots, higher than 28.9 ± 9.17 mg/kg in once–burned plots and 26.7 ± 5.19 mg/kg in twice–burned plots (Figure 2g). Although NO 3 N content showed no significant differences among the three burn frequencies in June, it gradually increased with increasing burn frequency in the autumn–burned plots (by 58.1% and 34.6%, respectively; Figure 2i). In September, the soil NO 3 N content levels of the three types of autumn burn were increased by 59.4%, 57.08%, and 1.15%, compared to spring burns (p < 0.05; Figure 2j). In the twice–burned plots, the soil NO 3 N content in September for the autumn–burned area was nearly three times that in control treatment (i.e., 7.02 ± 0.55 mg/kg in autumn–burned plots versus 2.54 ± 0.22 mg/kg in control plots; p < 0.05; Figure 2j). The soil NH 4 + N and NO 3 N content may be influenced by microbial activity. In June, soil MBN content increased with burn frequency in the autumn–burned plots, with values of 48.1 ± 20.6 mg/kg for once–burned plots, 85.6 ± 17.0 mg/kg for twice–burned plots, and 301.4 ± 47.66 mg/kg for thrice–burned plots (Figure 2c), and this trend was also observed in September.
Burn frequency significantly affected all variables measured in the plants in both June and September, except for per–plant–N in September (Table 1). In June, the plant aboveground–N content was higher in thrice–burned plots compared to once–burned and twice–burned plots, increasing by 71.6% and 47.9% in spring–burned plots and by 139% and 133.6% in autumn–burned plots (p < 0.05; Figure 3a). In September, the plant aboveground–N content of the thrice–burned area was 70.1% increased, compared to the once–burned area in the spring–burned plots, and the plant aboveground–N content of the thrice–burned area was 82.2% increased relative to the once–burned area in the autumn–burned plots (p < 0.05; Figure 3b). In June, plant stem nitrogen (stem–N) content increased with burn frequency in spring–burned plots, with values of 1.30 ± 0.06 g/m2 for once–burned plots, 1.87 ± 0.22 g/m2 for twice–burned plots, and 3.01 ± 0.6 g/m2 for thrice–burned plots (Figure 3c), and this trend was also observed in autumn–burned plots. In June, the plant stem–N content of the three–times autumn burns were increased by 44.7%, 85.4%, and 99.4% compared to the control treatment (p < 0.05; Figure 3c), and by 0.13%, 5.38%, and 84.4% compared to spring burns (Figure 3c). Although there were no significant differences between autumn and spring burns, the differences increased with burn frequency (Figure 3c).

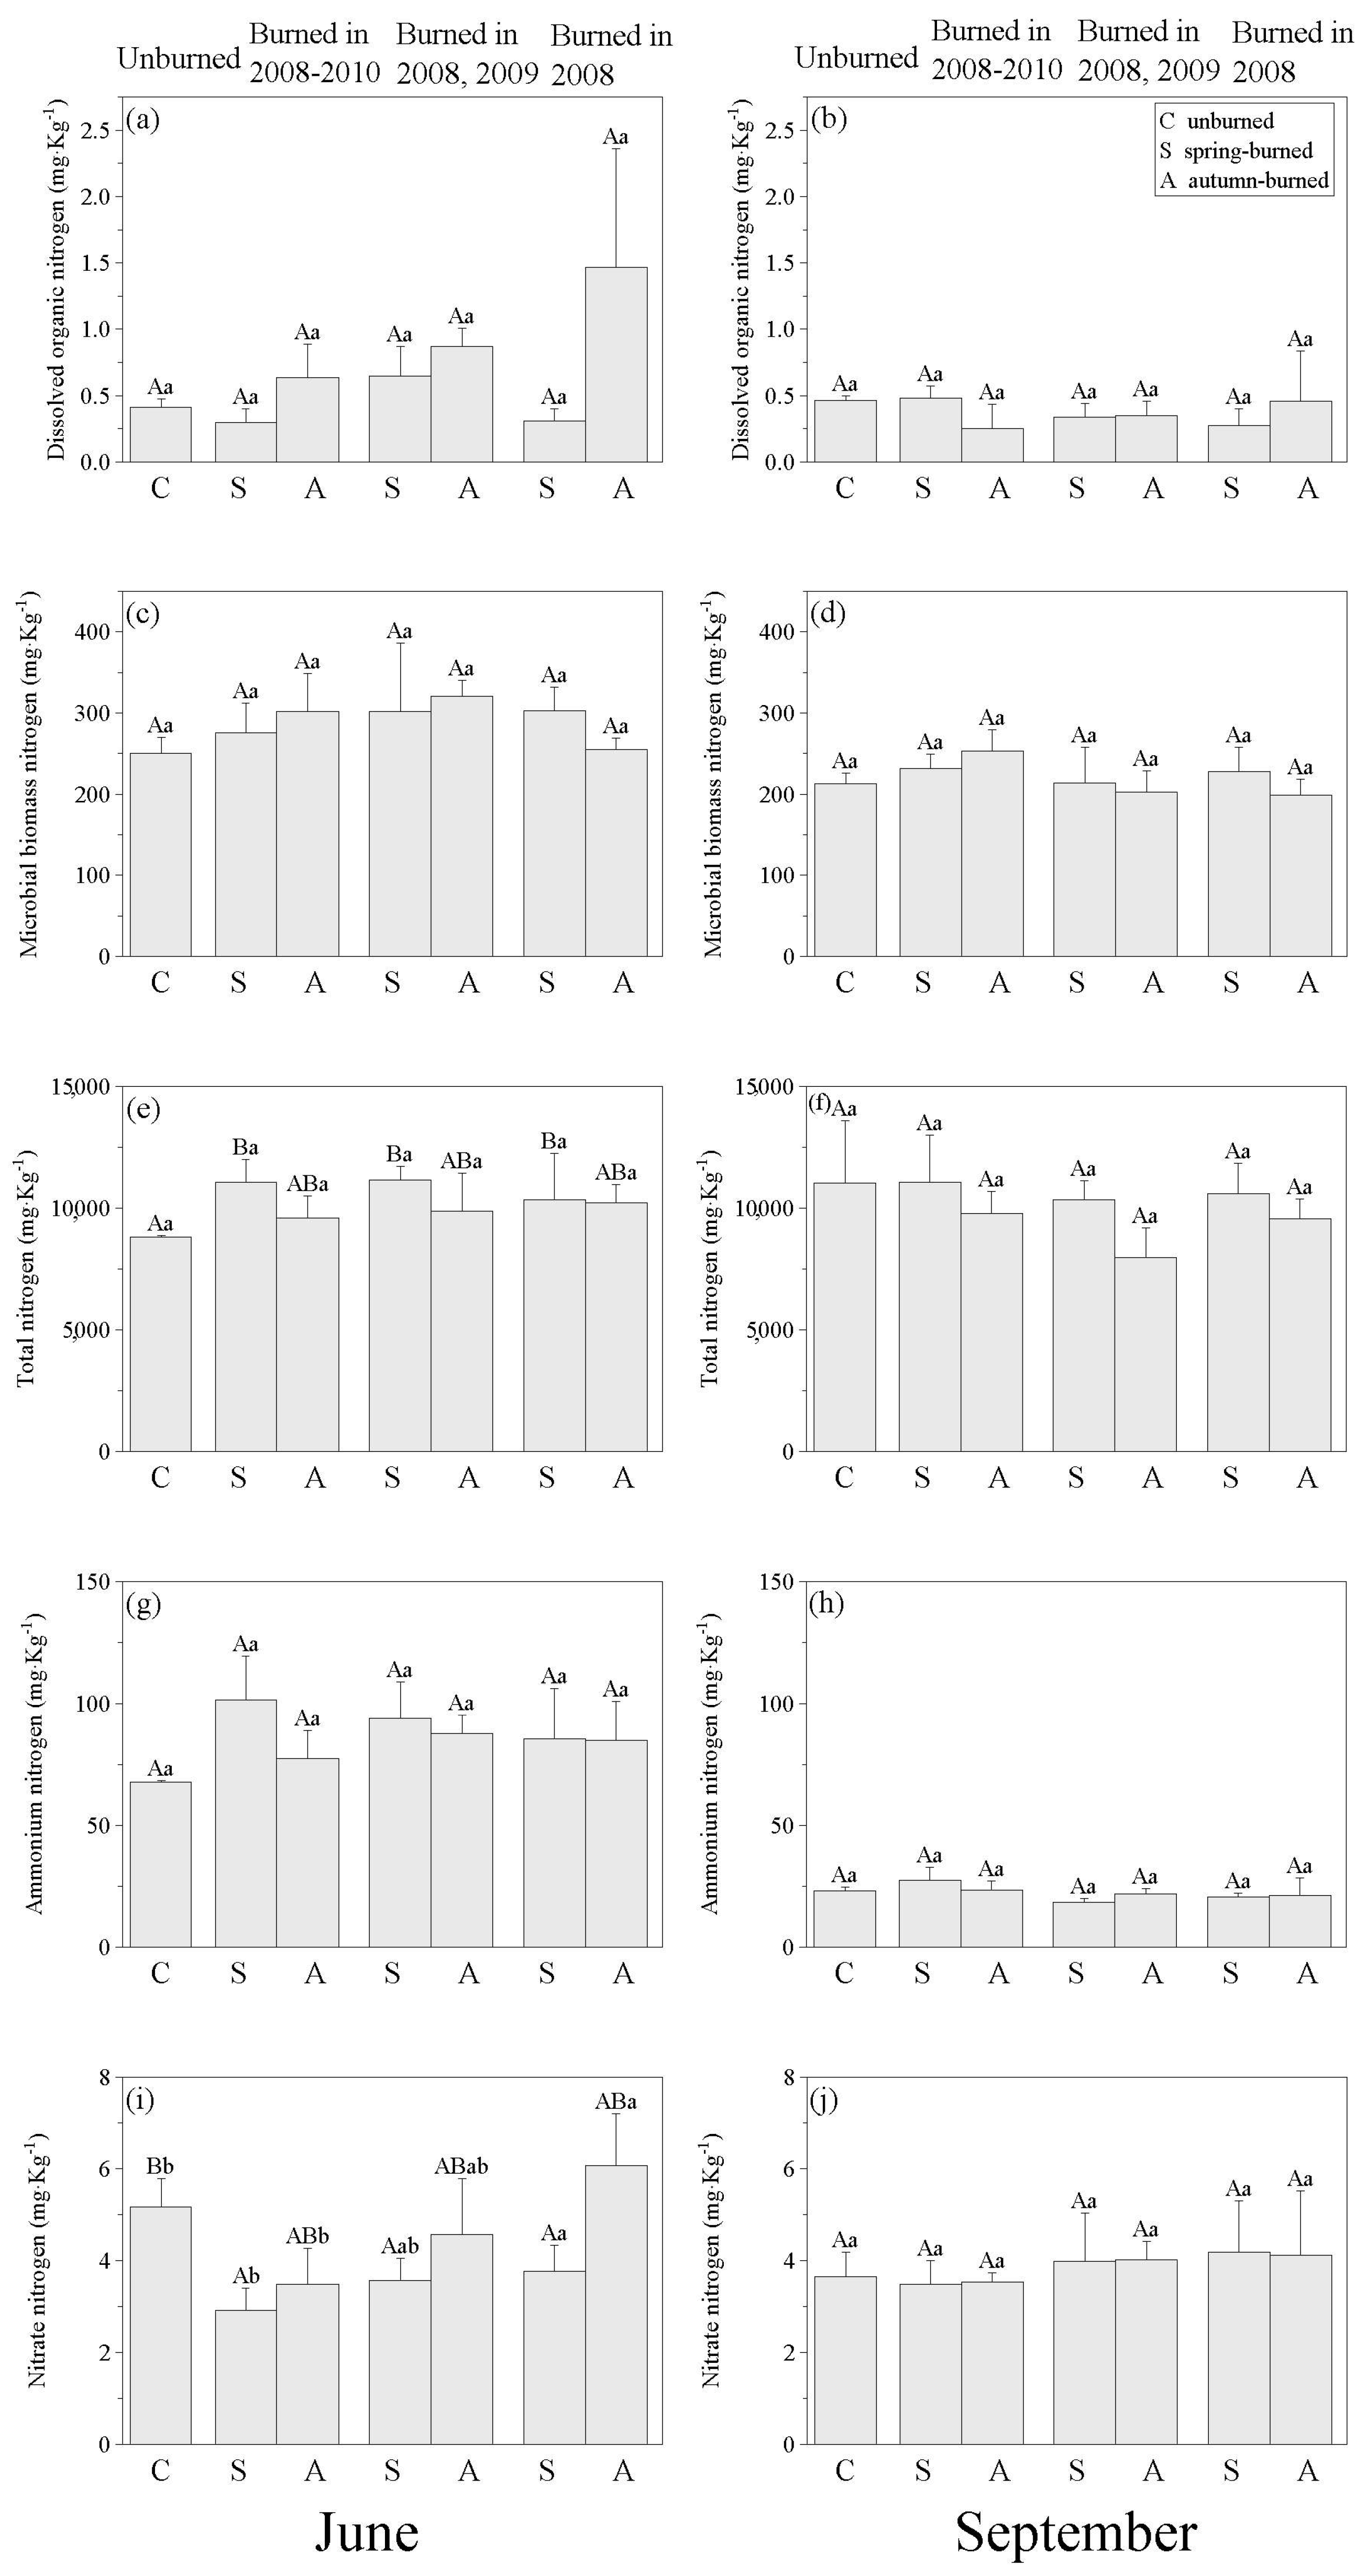
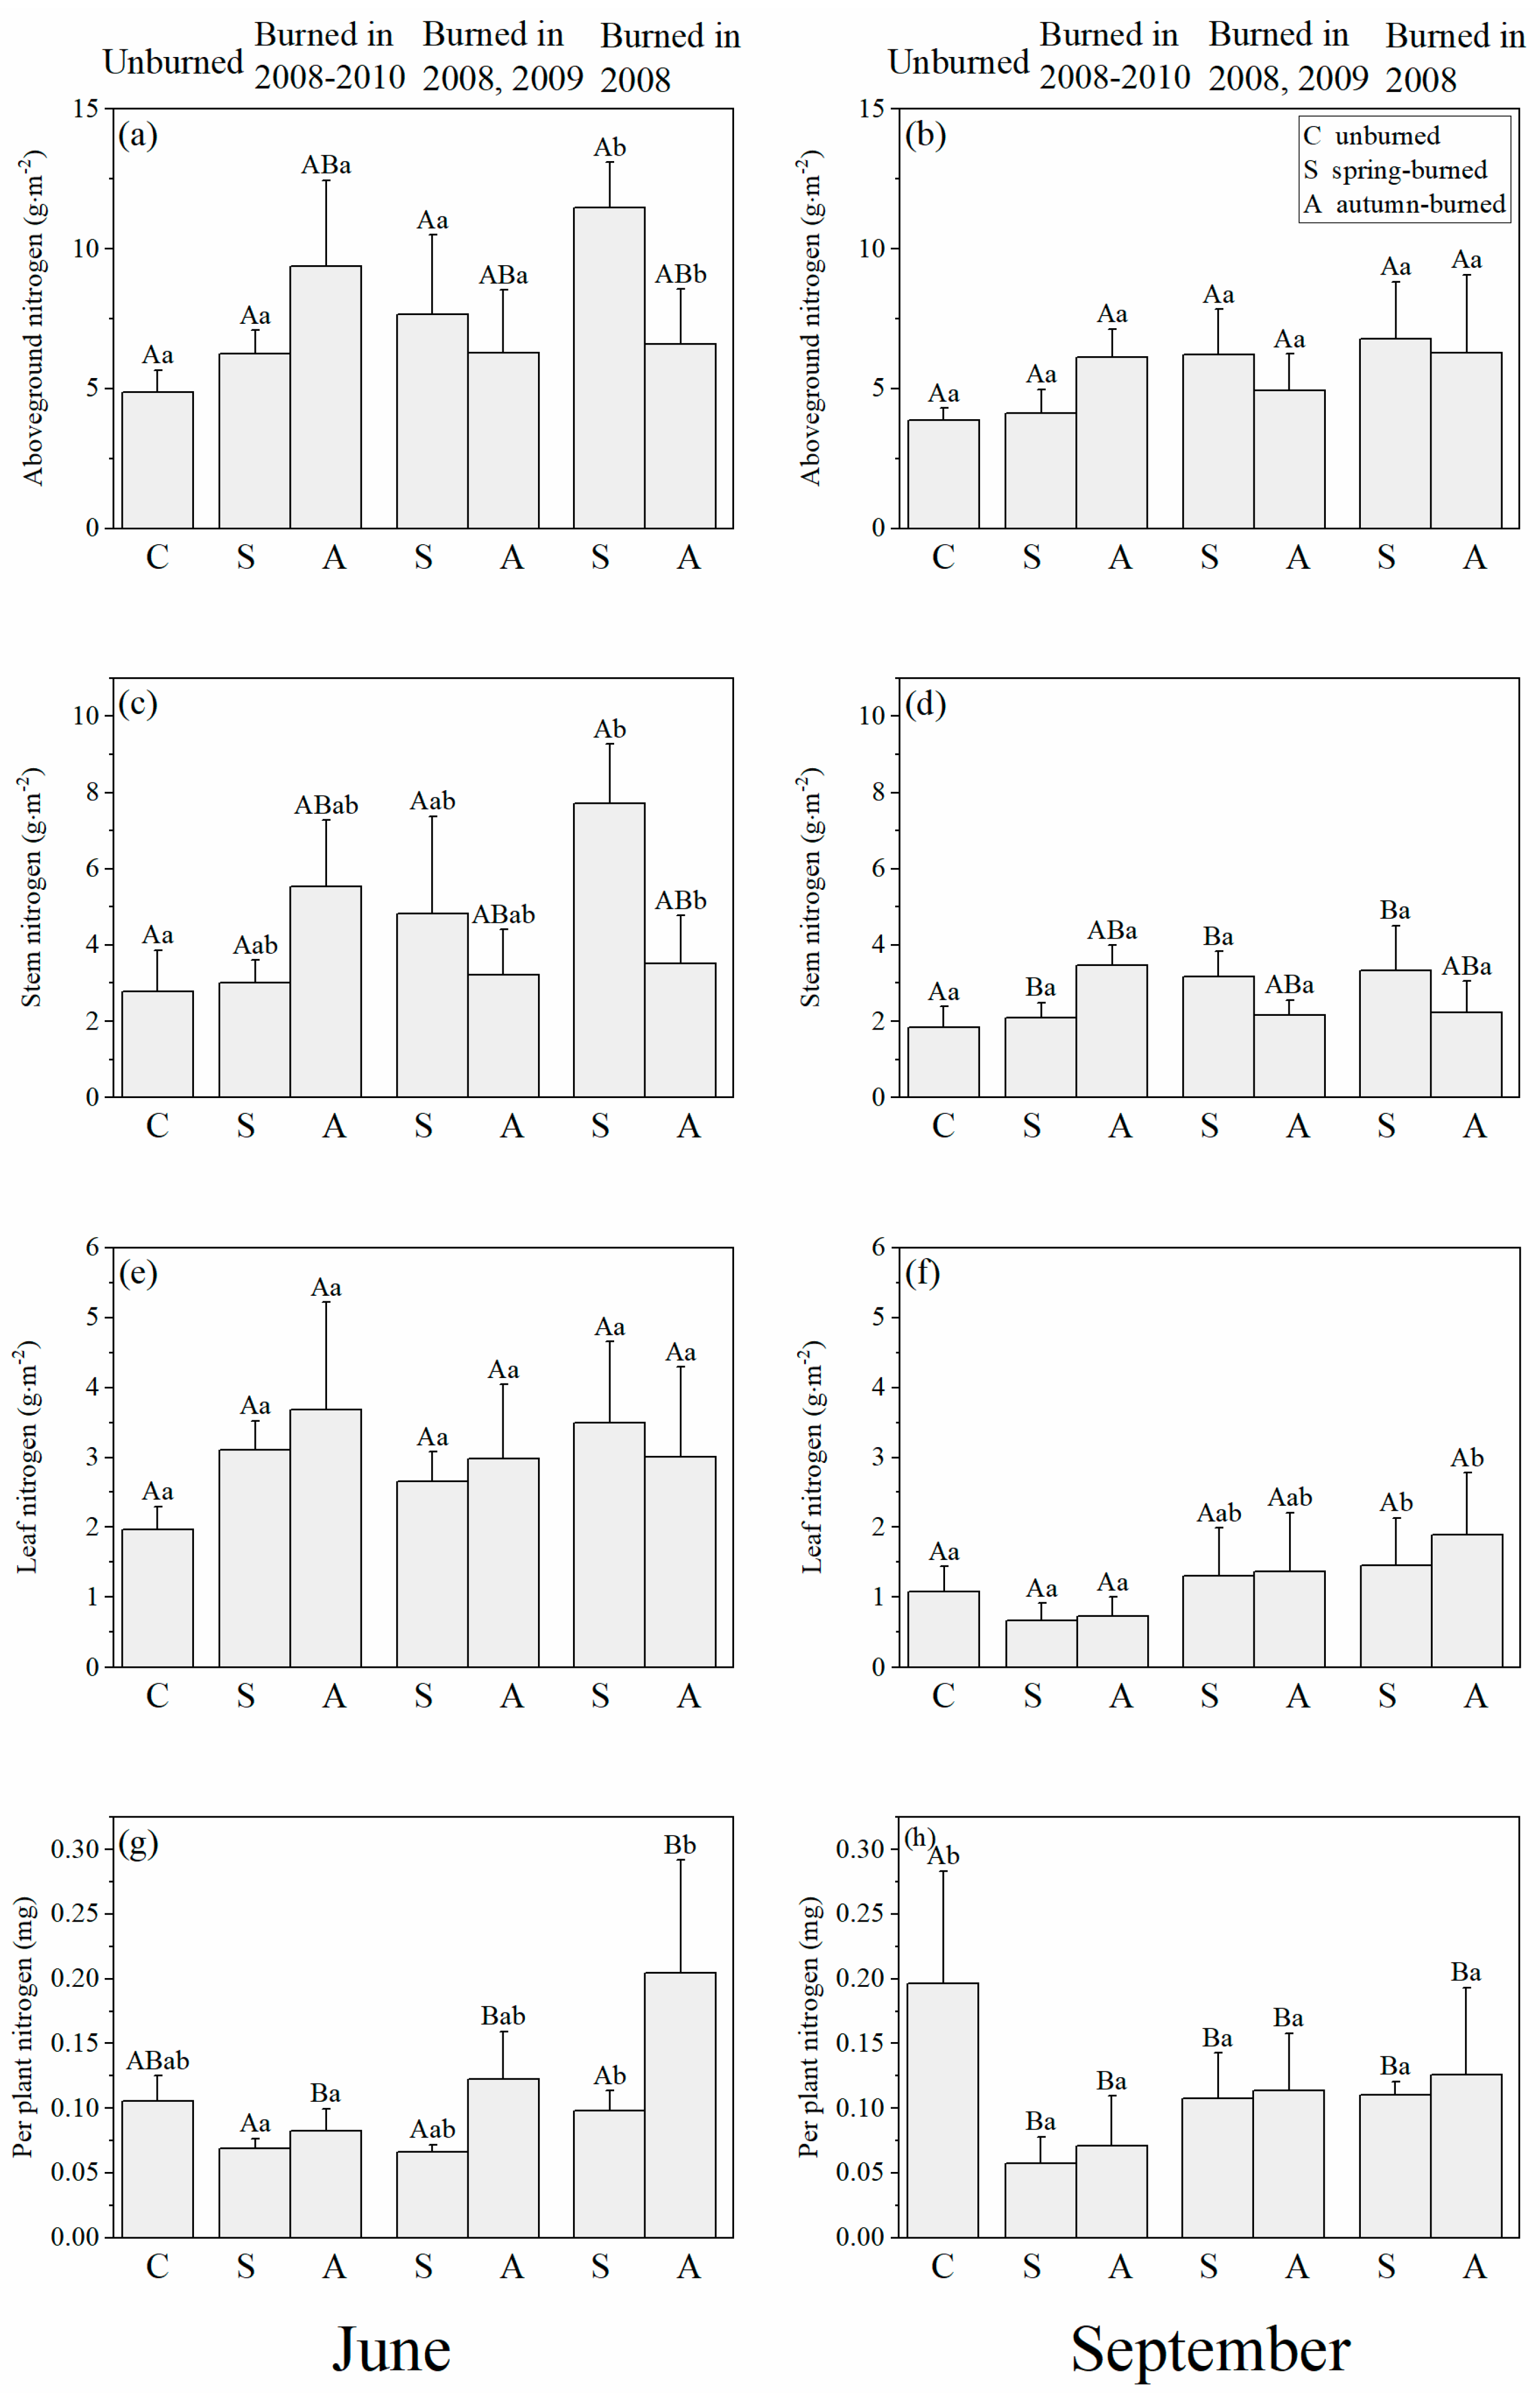
3.2. Changes in Nitrogen Distribution in Soils and Plants in Time since Burning

The time since burning significantly affected only the soil NO 3 N content in June. Additionally, the interaction between burn season and time since burning significantly affected soil NO3–N, plant aboveground–N, and stem–N in June, as well as soil DON and plant stem–N content in September (Table 1). In June, the soil NO 3 N content for spring–burned areas increased with an increase in time since burning (e.g., 2.93 ± 0.48 mg/kg after one year, 3.56 ± 0.49 mg/kg after two years, and 3.78 ± 0.55 mg/kg after three years; Figure 4i). Similarly, in autumn–burned plots, the soil NO 3 N content increased with an increase in time since burning (e.g., 3.49 ± 0.79 mg/kg after one year, 4.56 ± 1.23 mg/kg after two years, and 6.06 ± 1.13 mg/kg after three years; Figure 4i). This trend was also observed in September but without significant differences (Figure 4j). In June, the soil NO 3 N content of the three years after spring–burned areas was reduced by 43.48%, 31.2%, and 27.1%, compared to the control treatment (p < 0.05; Figure 4i). In autumn– and spring–burned plots, the soil NO 3 N content was decreased at one–year post–fire and gradually increased over the following two years (Figure 4i). Soil TN content was higher in spring–burned plots than in autumn–burned plots in both June and September, although not significantly (Figure 4e,f).
In June, the time since burning significantly affected only the per–plant–N content, and in September, it significantly affected only the plant leaf–N content (Table 1). In June, the per–plant–N content in the three years since burning was increased 42.2% and 148%, compared to one year since burning, in the spring–burned plots and autumn–burned plots, respectively (p < 0.05; Figure 5g). In both spring– and autumn–burned plots, the per–plant–N content was decreased at one year since burning compared to the control treatment, then gradually increased with time since burning in June (Figure 5g). In September, the per–plant–N content at one year since burning was reduced by 70.8% and 64.0%, compared to the control treatment in the spring– and autumn–burned plots, respectively (p < 0.05), then gradually increased with time since burning (Figure 5h). In September, the plant leaf–N content at three years since burning was increased by 34.68% and 74.82% compared to the control treatment in the spring– and autumn–burned plots, respectively (p < 0.05; Figure 5f). The plant stem–N contents of the spring–burned plots increased with increasing time since burning in June, and at three years post–fire, it increased by 178% compared to the control treatment (p < 0.05; Figure 5c). The levels of per–plant–N content in June for the autumn–burned areas were increased by 19.4%, 84.7%, and 108%, compared to the spring–burned areas in the three years post–fire, respectively (p < 0.05; Figure 5g). In September, both the spring and the autumn burn resulted in a significant decrease in per–plant–N content compared to the control (70.8%, 45.4%, and 43.9% in spring burn; 64.0%, 42.3%, and 35.9% in autumn burn; p < 0.05; Figure 5h). Moreover, per–plant–N content showed an increasing trend over time elapsed post–fire (Figure 5h).

4. Discussion

4.1. Effects of Burn Frequency on Marsh N Distribution

The NH 4 + N and NO 3 N are the main components of soil inorganic N [35] and represent the form of N that plants directly absorb and utilize from the soil; this study discovered that the soil NH 4 + N and NO 3 N contents increased with an increase in burn frequency in June (Figure 2g,i). The plant biomass tends to increase with burn frequency [30], resulting in more ash from burning. The remainder after burning contains a large amount of inorganic N [36,37], and the inorganic N content increases with an increase in ash. Additionally, post–fire ash contains substantial amounts of black carbon, the negatively charged functional groups of which can adsorb positively charged NH 4 + N [38]. The internal pores and inner surfaces of black carbon also exhibit physical adsorption capabilities for NH 4 + N [39,40], contributing to the immobilization of soil NH 4 + N . This phenomenon is a significant factor in the increased levels of both NH 4 + N and NO 3 N associated with a higher burn frequency. High fire–frequency raises soil temperature and progressively dries the soil, creating an aerobic environment that will promote microbial growth [13,31,41]. Microbial growth contributes to the conversion of organic N to inorganic N, thereby increasing the release of inorganic N [42]. This study also showed that the soil MBN content increased with increasing burn frequency. Additionally, MBC also increased with higher burn frequency in our sample plots [31]. These findings indicate that microbial biomass increases with increasing burn frequency, and soil mineralization also increases with an increase in burn frequency, converting more of the organic N to inorganic N in the soil. Consequently, soil inorganic N content rises with increasing burn frequency.
Burning altered the inorganic N content in the marsh soil, which was also reflected in the N content of the plants. Similar to the trend seen in the NH 4 + N and NO 3 N contents in the soil, the plant aboveground–N and stem–N increased with an increase in burn frequency (Figure 3a–d). The aboveground–N and stem–N content in plants reflects the dynamic N exchange between plant and the soil environment. This alteration means that the amount of N transferred from the soil to the plant increases with an increase in burn frequency. In marsh ecosystems disturbed by burning, the regeneration and maintenance of perennial plant populations rely primarily on vegetative reproduction and belowground bud banks [43,44]. High fire–frequency enhances the belowground bud bank of grass plants, promoting tillering and increasing plant stem density [45]. In our sample plots, the stem density of Calamagrostis angustifolia, the dominant species in the study area, significantly increased with higher burn frequency [30]. An increase in the stem density of Calamagrostis angustifolia will lead to competition among plant populations. High fire–frequency leads to an increased number of fine roots growing near the soil surface [46], which enhances soil N uptake by plants. Stems, the primary part of nutrient accumulation [47], store a large amount of the N taken up by roots during the competition among plant populations. Additionally, as stem density increases, plants compete for light, reducing leaf photosynthetic efficiency and causing N to accumulate in stems. Thus, plant aboveground N and stem N increased with higher burn frequency, indicating greater N absorption by plants with increasing burn frequency.

4.2. Effects of Time since Burning on Marsh N Distribution

Fire directly disrupts original plant growth patterns, and plant recovery is highly correlated with soil nutrient alterations in the years following a fire [48]. One year after burning, soil NO 3 N content was lower than in the control but gradually increased over the next two years (Figure 4i). This initial decrease in NO 3 N content is related to post–fire plant growth. The Calamagrostis angustifolia biomass increased significantly post–fire [30], and soil NO 3 N is more readily absorbed by herbaceous plants [49,50,51]. Consequently, a large amount of NO 3 N was taken up by Calamagrostis angustifolia. Additionally, there is a large amount of black carbon in ash, which, along with other components of ash that cover the soil surface, absorbs solar radiation and reduces surface albedo, which will increase the temperature in the soil [52,53,54]. At the same time, the hydrophobicity of black carbon also creates aerobic conditions for surface soil [55]. These conditions promote microbial growth and the conversion of soil NH 4 + N to NO 3 N . In this study, although NH 4 + N content did not significantly differ among the varying times since burning, it gradually decreased with time since burning (Figure 4g), which is a strong indication of the conversion of NH 4 + N to NO 3 N . Thus, marsh soil conversion of NH 4 + N to NO 3 N was enhanced over the three years following the fire.
Woody plants take longer to recover from fire effects, but herbaceous plants can recover quickly, often surpassing pre–fire biomass in the next growing season [30,56]. Compared to the control treatment, the per–plant N content of spring–burned and autumn–burned plants significantly decreased one year after burning, then gradually increased over time (Figure 5g,h). At three years since burning, the plant stem–N and leaf–N contents were higher than in the control (Figure 5c–e). Burning disturbs marsh ecosystems, altering the soil environment and causing plant injury [57]. Plant populations begin to compete for nutrients under these adverse conditions, storing large amounts of N in stems and leaves [58]. Although this is helpful for plant existence, a large amount of N stored in the plant stems and leaves also accelerates plant respiration, which slows carbon fixation and reduces plant productivity [59]. Thus, fire exacerbates competition for nutrients among marsh plant populations, and this influence of burning on marsh plants persisted for three years post–fire.

4.3. Effects of Marsh Nitrogen Distribution under Different Burn Seasons

James et al. (2018) suggests that increased fire–frequency amplifies the seasonal effects of fire [60], but research on the interaction between burn season and burn frequency in the context of marsh ecosystems remains scarce. In September, the soil NO 3 N content in spring–burned plots was lower than that in the autumn–burned plots (Figure 2j). In June, although not significantly different, the plant stem–N content in autumn–burned plots was higher than that in spring–burned plots, with this difference increasing with burn frequency (Figure 3c). Autumn burns consume plant litter, leaving no litter cover on the ground surface. At lower winter temperatures, many fine roots die due to the lack of insulation from plant litter [26,27,61], reducing plant uptake of soil NO 3 N ; for the autumn burns, this reduction is seen in the following growing season. Additionally, the snow and ice cover the ground during spring burning at a thickness of 0–5 cm, leading to incomplete litter consumption. Therefore, the soil NO 3 N released in spring burns is lower than that released in autumn burns. The difference between autumn and spring burns is also reflected in the plants. The source of N uptake for plant growth is NO 3 N . Since soil NO 3 N content is higher in autumn–burned plots, plants in these plots uptake more N than those in spring–burned plots. Meanwhile, intense competition among plant populations post–fire leads to increased biomass allocation to stems, which contributes to N being stored in the stems [58]. This explains why plant stem–N concentration in autumn–burned plots is higher than the levels in spring–burned plots. With increasing burn frequency, soil NO3–N increases in autumn–burned plots, and plant biomass also increases [62], enhancing plant N uptake. Additionally, with increasing burn frequency, plant stem density increased in both autumn and spring burns [30], intensifying competition among plant populations [63]. Thus, the difference in plant stem–N between autumn and spring burns increases with burn frequency. Under high–frequency burning, this difference in plant stem–N indicates more intense competition in autumn–burned plots compared to spring–burned plots. Although both spring and autumn burns impact marsh plant growth, autumn burns may have a more significant effect under high–frequency burning.
Differences in nutrient release and plant effects between burn seasons affect the extent of marsh recovery. Per–plant–N content in autumn–burned plots was higher than in spring–burned plots, with this difference increasing over time, as measured in June and September (Figure 5g,h). The dry climate during autumn burns consumes most of the litter, releasing a large amount of the N directly available to plants. In contrast, litter is incompletely consumed after spring burns, retaining N in unburned litter on the soil surface. Thus, N uptake by plants in spring burns was lower than in autumn burns, and TN content of surface soil in spring burns was higher than in autumn burns. Autumn burns release more N than spring burns and loses less due to long–term ice and snow cover post–fire. During spring burns, the site is covered in ice and snow, and post–fire melting causes N loss through runoff. Therefore, the NO 3 N available for plant uptake is higher in autumn–burned plots than in spring–burned plots. During the regrowth of plants in spring–burned plots, because of the low soil NO 3 N , plants uptake less N. Conversely, there is sufficient available N in autumn–burned plots, the plants of which absorb more N. Thus, the difference in per–plant–N between autumn– and spring–burned plots increases over time. Compared to spring burns, per–plant–N content increases more rapidly with time after autumn burns. Thus, in the short term, per–plant–N content responds more significantly to autumn burns than to spring burns.

5. Conclusions and Management Implications

The results of this study clearly demonstrate that fire regimes significantly affect N distribution in marshes within three years. The soil NH 4 + N and NO 3 N content, along with plant aboveground–N and stem–N content, increased with an increase in burn frequency. This result indicates that in the short term, the marsh inorganic N content and N absorption by plants increases with increasing burn frequency. Consequently, high fire–frequency can enhance marsh N cycling. In this study, the conversion of NH 4 + N to NO 3 N was found to increase with time since burning. Fire also intensifies competition for nutrients among marsh plant populations, with the effects persisting for three years post–fire. Utilizing fire to reduce fuel is an effective and economical management tool; however, the season of burning significantly impacts marshes. This study shows that plant stem–N content is higher after autumn burns compared to spring burns, and this difference is amplified with increasing burn frequency. This suggests that autumn burns may have a more substantial impact on marsh plant growth, compared to spring burns, under high fire–frequency. This study found that three years of burning had a significant impact on N distribution in marshes. Changes in marsh soil N content affect carbon storage, so the long–term monitoring of the effects of fire regimes on N distribution is necessary. This study provides a theoretical basis and reference value for research on marsh burning regimes and carbon storage.

Author Contributions

S.J.: Data curation, Investigation, Visualization, Writing—original draft. H.Z.: Conceptualization, Writing—review and editing. G.W.: Resources, Supervision. J.C.: Supervision, Writing—review and editing. G.L.: Methodology, Software. D.H.: Writing—review and editing. C.G.: Investigation, Resources, Project administration, Funding acquisition. All authors have read and agreed to the published version of the manuscript.

Funding

The authors gratefully acknowledge the assistance of the Analysis and Test Center of the Northeast Institute of Geography and Agroecology, Chinese Academy of Sciences. This research was funded by the National Natural Science Foundation of China (Nos. 42171103, 42101108), the National Key R&D Program of China (2023YFF0807201), and the Young Scientist Group Project of Northeast Institute of Geography and Agroecology, Chinese Academy of Sciences (2022QNXZ01). The APC was funded by [Nos. 42171103].

Institutional Review Board Statement

Not applicable.

Informed Consent Statement

Not applicable.

Data Availability Statement

The datasets are available from the corresponding author on request.

Conflicts of Interest

The authors declare no conflicts of interest.

References

  1. Penfound, W.T. Southern swamps and marshes. Bot. Rev. 1952, 18, 413–446. [Google Scholar] [CrossRef]
  2. Delle Grazie, F.M.; Gill, L.W. Review of the ecosystem services of temperate wetlands and their valuation tools. Water 2022, 14, 1345. [Google Scholar] [CrossRef]
  3. Kayranli, B.; Scholz, M.; Mustafa, A.; Hedmark, Å. Carbon storage and fluxes within freshwater wetlands: A critical review. Wetlands 2009, 30, 111–124. [Google Scholar] [CrossRef]
  4. Lolu, A.J.; Ahluwalia, A.S.; Sidhu, M.C.; Reshi, Z.A.; Shah, M.A.; Lolu, S.J. Wetlands: An imbroglio of interlinked carbon pools. Trop. Ecol. 2018, 59, 383–395. [Google Scholar]
  5. Wang, M.; Moore, T.R. Carbon, Nitrogen, Phosphorus, and Potassium Stoichiometry in an Ombrotrophic Peatland Reflects Plant Functional Type. Ecosystems 2014, 17, 673–684. [Google Scholar] [CrossRef]
  6. Wang, M.; Talbot, J.; Moore, T.R. Drainage and fertilization effects on nutrient availability in an ombrotrophic peatland. Sci. Total Environ. 2018, 621, 1255–1263. [Google Scholar] [CrossRef]
  7. Qian, Y.; Miao, S.L.; Gu, B.; Li, Y.C. Estimation of postfire nutrient loss in the Florida Everglades. J. Environ. Qual. 2009, 38, 1812–1820. [Google Scholar] [CrossRef]
  8. Hogue, B.A.; Inglett, P.W. Nutrient release from combustion residues of two contrasting herbaceous vegetation types. Sci. Total Environ. 2012, 431, 9–19. [Google Scholar] [CrossRef]
  9. Liao, X.; Inglett, P.W.; Inglett, K.S. Fire effects on nitrogen cycling in Native and Restored Calcareous Wetlands. Fire Ecol. 2013, 9, 6–20. [Google Scholar] [CrossRef]
  10. Salvia, M.; Ceballos, D.; Grings, F.; Karszenbaum, H.; Kandus, P. Post-fire effects in wetland environments:landscape assessment of plant coverage and soil recovery in the Paraná River Delta Marshes, Argentina. Fire Ecol. 2012, 8, 17–37. [Google Scholar] [CrossRef]
  11. Heim, R.J.; Heim, W.; Darman, G.F.; Heinken, T.; Smirenski, S.M.; Holzel, N. Litter removal through fire—A key process for wetland vegetation and ecosystem dynamics. Sci. Total Environ. 2021, 755, 142659. [Google Scholar] [CrossRef]
  12. Weltzin, J.F.; Keller, J.K.; Bridgham, S.D.; Pastor, J.; Allen, P.B.; Chen, J. Litter controls plant community composition in a northern fen. Oikos 2005, 110, 537–546. [Google Scholar] [CrossRef]
  13. Zhang, G.; Yu, X.; Li, Y.; Liu, Y.; Zhang, H.; Jia, Y.; Xia, S. Effects of burning on carbon utilization of soil microorganisms and plant growth of Carex brevicuspis communities at Lake Poyang Wetlands, China. Wetlands 2018, 39, 1–15. [Google Scholar] [CrossRef]
  14. Van Beest, C.; Petrone, R.; Nwaishi, F.; Waddington, J.M.; Macrae, M. Increased peatland nutrient availability following the fort McMurray Horse River wildfire. Diversity 2019, 11, 142. [Google Scholar] [CrossRef]
  15. DeBano, L.F. The role of fire and soil heating on water repellency in wildland environments: A review. J. Hydrol. 2000, 231, 195–206. [Google Scholar] [CrossRef]
  16. Mills, A.J.; Fey, M.V. Frequent fires intensify soil crusting: Physicochemical feedback in the pedoderm of long-term burn experiments in South Africa. Geoderma 2004, 121, 45–64. [Google Scholar] [CrossRef]
  17. Kotze, D.C. The effects of fire on wetland structure and functioning. Afr. J. Aquat. Sci. 2013, 38, 237–247. [Google Scholar] [CrossRef]
  18. Certini, G. Effects of fire on properties of forest soils: A review. Oecologia 2005, 143, 1–10. [Google Scholar] [CrossRef]
  19. Esque, T.C.; Kaye, J.P.; Eckert, S.E.; Defalco, L.A.; Tracy, C.R. Short-term soil inorganic N pulse after experimental fire alters invasive and native annual plant production in a Mojave Desert shrubland. Oecologia 2010, 164, 253–263. [Google Scholar] [CrossRef]
  20. Nelson, J.D.J.; Schoenau, J.J.; Malhi, S.S.; Gill, K.S. Burning and cultivation effects on greenhouse gas emissions and nutrients in wetland soils from Saskatchewan, Canada. Nutr. Cycl. Agroecosys. 2007, 78, 291–303. [Google Scholar] [CrossRef]
  21. Xu, T.; Weng, B.; Yan, D.; Wang, K.; Li, X.; Bi, W.; Li, M.; Cheng, X.; Liu, Y. Wetlands of international importance: Status, threats, and future protection. Int. J. Environ. Res. Public. Health 2019, 16, 1818. [Google Scholar] [CrossRef]
  22. Nichols, L.; Shinneman, D.J.; McIlroy, S.K.; de Graaff, M.-A. Fire frequency impacts soil properties and processes in sagebrush steppe ecosystems of the Columbia Basin. Appl. Soil Ecol. 2021, 165, 103967. [Google Scholar] [CrossRef]
  23. Hernandez, D.L.; Hobbie, S. Effects of fire frequency on oak litter decomposition and nitrogen dynamics. Oecologia 2008, 158, 535–543. [Google Scholar] [CrossRef]
  24. Carbone, L.M.; Aguilar, R. Contrasting effects of fire frequency on plant traits of three dominant perennial herbs from Chaco Serrano. Austral Ecol. 2016, 41, 778–790. [Google Scholar] [CrossRef]
  25. González-Pelayo, O.; Gimeno-García, E.; Ferreira, C.S.S.; Ferreira, A.J.D.; Keizer, J.J.; Andreu, V.; Rubio, J.L. Water repellency of air-dried and sieved samples from limestone soils in central Portugal collected before and after prescribed fire. Plant Soil 2015, 394, 199–214. [Google Scholar] [CrossRef]
  26. Cleavitt, N.L.; Fahey, T.J.; Groffman, P.M.; Hardy, J.P.; Henry, K.S.; Driscoll, C.T. Effects of soil freezing on fine roots in a northern hardwood forest. Can. J. Forest Res. 2008, 38, 82–91. [Google Scholar] [CrossRef]
  27. Tierney, G.L.; Fahey, T.J.; Groffman, P.M.; Hardy, J.P.; Fitzhugh, R.D.; Driscoll, C.T. Soil freezing alters fine root dynamics in a northern hardwood forest. Biogeochemistry 2001, 56, 175–190. [Google Scholar] [CrossRef]
  28. Guo, H.; Sun, Q.; Wu, Z.; Lu, C.; Qin, Z. Study on suitable rice planting scale based on balance of groundwater recharge and discharge in Sanjiang Plain. Water 2023, 15, 547. [Google Scholar] [CrossRef]
  29. Liu, Y.; Shen, X.; Zhang, J.; Wang, Y.; Wu, L.; Ma, R.; Lu, X.; Jiang, M. Spatiotemporal variation in vegetation phenology and its response to climate change in marshes of Sanjiang Plain, China. Ecol. Evol. 2023, 13, e9755. [Google Scholar] [CrossRef]
  30. Gao, C.; Wang, G.; Santin, C.; Doerr, S.H.; Cong, J.; Zhao, H. Response of Calamagrostis angustifolia to burn frequency and seasonality in the Sanjiang Plain wetlands (Northeast China). J. Environ. Manag. 2021, 300, 113759. [Google Scholar] [CrossRef]
  31. Zhao, H.; Tong, D.Q.; Lin, Q.; Lu, X.; Wang, G. Effect of fires on soil organic carbon pool and mineralization in a Northeastern China wetland. Geoderma 2012, 189–190, 532–539. [Google Scholar] [CrossRef]
  32. Wang, G.-P.; Liu, J.-S.; Wang, J.-D.; Yu, J.-B. Soil phosphorus forms and their variations in depressional and riparian freshwater wetlands (Sanjiang Plain, Northeast China). Geoderma 2006, 132, 59–74. [Google Scholar] [CrossRef]
  33. Gao, C.; Lin, Q.; Zhang, S.; He, J.; Lu, X.; Wang, G. Historical trends of atmospheric black carbon on Sanjiang Plain as reconstructed from a 150-year peat record. Sci. Rep. 2014, 4, 5723. [Google Scholar] [CrossRef]
  34. Recous, S.; Robin, D.; Darwis, D.; Mary, B. Soil inorganic N availability: Effect on maize residue decomposition. Soil Biol. Biochem. 1995, 27, 1529–1538. [Google Scholar] [CrossRef]
  35. Yin, Q.; Zhang, B.; Wang, R.; Zhao, Z. Biochar as an adsorbent for inorganic nitrogen and phosphorus removal from water: A review. Environ. Sci. Pollut. Res. Int. 2017, 24, 26297–26309. [Google Scholar] [CrossRef]
  36. Raison, R.J. Modification of the soil environment by vegetation fires, with particular reference to nitrogen transformations: A review. Plant Soil 1979, 51, 73–108. [Google Scholar] [CrossRef]
  37. Prober, S.M.; Lunt, I.D.; Thiele, K.R. Effects of fire frequency and mowing on a temperate, derived grassland soil in south-eastern Australia. Int. J. Wildland Fire 2008, 17, 586–594. [Google Scholar] [CrossRef]
  38. Montes-Morán, M.A.; Suárez, D.; Menéndez, J.A.; Fuente, E. On the nature of basic sites on carbon surfaces: An overview. Carbon 2004, 42, 1219–1225. [Google Scholar] [CrossRef]
  39. Clough, T.; Condron, L.; Kammann, C.; Müller, C. A Review of Biochar and Soil Nitrogen Dynamics. Agronomy 2013, 3, 275–293. [Google Scholar] [CrossRef]
  40. Schmidt, M.W.I.; Noack, A.G. Black carbon in soils and sediments: Analysis, distribution, implications, and current challenges. Glob. Biogeochem. Cycles 2000, 14, 777–793. [Google Scholar] [CrossRef]
  41. De Marco, A.; Gentile, A.E.; Arena, C.; De Santo, A.V. Organic matter, nutrient content and biological activity in burned and unburned soils of a Mediterranean maquis area of southern Italy. Int. J. Wildland Fire 2005, 14, 365–377. [Google Scholar] [CrossRef]
  42. Zhang, S.; Zheng, Q.; Noll, L.; Hu, Y.; Wanek, W. Environmental effects on soil microbial nitrogen use efficiency are controlled by allocation of organic nitrogen to microbial growth and regulate gross N mineralization. Soil Biol. Biochem. 2019, 135, 304–315. [Google Scholar] [CrossRef] [PubMed]
  43. Benson, E.J.; Hartnett, D.C. The role of seed and vegetative reproduction in plant recruitment and demography in tallgrass prairie. Plant Ecol. 2006, 187, 163–178. [Google Scholar] [CrossRef]
  44. Benson, E.J.; Hartnett, D.C.; Mann, K.H. Belowground bud banks and meristem limitation in tallgrass prairie plant populations. Am. J. Bot. 2004, 91, 416–421. [Google Scholar] [CrossRef]
  45. Dalgleish, H.J.; Hartnett, D.C. The effects of fire frequency and grazing on tallgrass prairie productivity and plant composition are mediated through bud bank demography. Plant Ecol. 2008, 201, 411–420. [Google Scholar] [CrossRef]
  46. Oliveras, I.; Meirelles, S.T.; Hirakuri, V.L.; Freitas, C.R.; Miranda, H.S.; Pivello, V.R. Effects of fire regimes on herbaceous biomass and nutrient dynamics in the Brazilian savanna. Int. J. Wildland Fire 2013, 22, 368–380. [Google Scholar] [CrossRef]
  47. Groves, R.H.; Hocking, P.J.; McMahon, A. Distribution of biomass, nitrogen, phosphorus and other nutrients in Banksia marginata and B. ornata Shoots of different ages after fire. Aust. J. Bot. 1986, 34, 709–725. [Google Scholar] [CrossRef]
  48. Rau, B.M.; Blank, R.R.; Chambers, J.C.; Johnson, D.W. Prescribed fire in a Great Basin sagebrush ecosystem: Dynamics of soil extractable nitrogen and phosphorus. J. Arid. Environ. 2007, 71, 362–375. [Google Scholar] [CrossRef]
  49. Kronzucker, H.J.; Siddiqi, M.Y.; Glass, A.D.M. Conifer root discrimination against soil nitrate and the ecology of forest succession. Nature 1997, 385, 59–61. [Google Scholar] [CrossRef]
  50. Persson, J.; Hogberg, P.; Ekblad, A.; Hogberg, M.N.; Nordgren, A.; Nasholm, T. Nitrogen acquisition from inorganic and organic sources by boreal forest plants in the field. Oecologia 2003, 137, 252–257. [Google Scholar] [CrossRef]
  51. Mackenzie, M.; Deluca, T.; Sala, A. Fire exclusion and nitrogen mineralization in low elevation forests of western Montana. Soil Biol. Biochem. 2006, 38, 952–961. [Google Scholar] [CrossRef]
  52. Jacobson, M.Z. Control of fossil-fuel particulate black carbon and organic matter, possibly the most effective method of slowing global warming. J. Geophys. Res. 2002, 107, ACH-16. [Google Scholar] [CrossRef]
  53. Hao, W.M.; Petkov, A.; Nordgren, B.L.; Corley, R.E.; Silverstein, R.P.; Urbanski, S.P.; Evangeliou, N.; Balkanski, Y.; Kinder, B.L. Daily black carbon emissions from fires in northern Eurasia for 2002-2015. Geosci. Model Dev. 2016, 9, 4461–4474. [Google Scholar] [CrossRef]
  54. Stohl, A.; Andrews, E.; Burkhart, J.F.; Forster, C.; Herber, A.; Hoch, S.W.; Kowal, D.; Lunder, C.; Mefford, T.; Ogren, J.A.; et al. Pan-Arctic enhancements of light absorbing aerosol concentrations due to North American boreal forest fires during summer 2004. J. Geophys. Res. 2006, 111, D22214. [Google Scholar] [CrossRef]
  55. Kuhlbusch, T.A.J. Method for determining black carbon in residues of vegetation fires. Environ. Sci. Technol. 1995, 29, 2695–2702. [Google Scholar] [CrossRef] [PubMed]
  56. Cleary, M.B.; Pendall, E.; Ewers, B.E. Aboveground and Belowground Carbon Pools After Fire in Mountain Big Sagebrush Steppe. Rangeland Ecol. Manag. 2010, 63, 187–196. [Google Scholar] [CrossRef]
  57. Li, X.; Song, K.; Liu, G. Wetland fire scar monitoring and its response to changes of the Pantanal Wetland. Sensors 2020, 20, 4268. [Google Scholar] [CrossRef]
  58. Postma, J.A.; Hecht, V.L.; Hikosaka, K.; Nord, E.A.; Pons, T.L.; Poorter, H. Dividing the pie: A quantitative review on plant density responses. Plant Cell Environ. 2021, 44, 1072–1094. [Google Scholar] [CrossRef]
  59. Reich, P.B.; Tjoelker, M.G.; Pregitzer, K.S.; Wright, I.J.; Oleksyn, J.; Machado, J.L. Scaling of respiration to nitrogen in leaves, stems and roots of higher land plants. Ecol. Lett. 2008, 11, 793–801. [Google Scholar] [CrossRef]
  60. James, J.A.; Kern, C.C.; Miesel, J.R. Legacy effects of prescribed fire season and frequency on soil properties in a Pinus resinosa forest in northern Minnesota. Forest Ecol. Manag. 2018, 415–416, 47–57. [Google Scholar] [CrossRef]
  61. Dickson, T.L. Burning and mowing similarly increase prairie plant production in the spring, but not due to increased soil temperatures. Ecosphere 2019, 10, e02606. [Google Scholar] [CrossRef]
  62. Pellegrini, A.F.A.; Hedin, L.O.; Staver, A.C.; Govender, N. Fire alters ecosystem carbon and nutrients but not plant nutrient stoichiometry or composition in tropical savanna. Ecology 2015, 96, 1275–1285. [Google Scholar] [CrossRef] [PubMed]
  63. Rehling, F.; Sandner, T.M.; Matthies, D.; Hector, A. Biomass partitioning in response to intraspecific competition depends on nutrients and species characteristics: A study of 43 plant species. J. Ecol. 2021, 109, 2219–2233. [Google Scholar] [CrossRef]
Figure 1. Location of the sampling site in Sanjiang Plain (Northeast China) and the experimental design (Reprinted/adapted with permission from Ref. [31]. 2012, Hongmei Zhao). Abbreviations in the figure: AB, autumn burns; SB, spring burns; C, unburned; AO, single autumn burning; AT: autumn burning, twice; AH: autumn burning, thrice; SO, single spring burning; ST: spring burning, twice; SH: spring burning, thrice.
Fire 07 00339 g001
Figure 2. Average values for dissolved organic nitrogen (a,b), microbial biomass nitrogen (c,d), total nitrogen (e,f), ammonium nitrogen (g,h), and nitrate nitrogen (i,j) in June and September. Significant differences in burn frequency are indicated in lowercase letters, and significant differences in burn season are indicated in uppercase letters (Tukey–HSD test, ANOVA; p < 0.05; capital letters (A/B) indicate differences in burn season, while lowercase letters (a/b) represent differences in burn frequency). C: control, S: spring burns, A: autumn burns.
Fire 07 00339 g002
Figure 3. Average values for aboveground nitrogen (a,b), stem nitrogen (c,d), leaf nitrogen (e,f), and per–plant nitrogen (g,h) in June and September. Significant differences in burn frequency are indicated in lowercase letters, and significant differences in burn season are indicated in uppercase letters (Tukey–HSD test, ANOVA; p < 0.05; capital letters (A/B) indicate differences in burn season, while lowercase letters (a/b) represent differences in burn frequency). C: control, S: spring burns, A: autumn burns.
Fire 07 00339 g003
Figure 4. Average values for dissolved organic nitrogen (a,b), microbial biomass nitrogen (c,d), total nitrogen (e,f), ammonium nitrogen (g,h), and nitrate nitrogen (i,j) in June and September. Significant differences in time since burning are indicated in lowercase letters, and significant differences in burn season are indicated in uppercase letters (Tukey–HSD test, ANOVA; p < 0.05; capital letters (A/B) indicate differences in burn season, while lowercase letters (a/b) represent differences in time since burning). C: control, S: spring burns, A: autumn burns.
Fire 07 00339 g004
Figure 5. Average values for aboveground nitrogen (a,b), stem nitrogen (c,d), leaf nitrogen (e,f), and per–plant nitrogen (g,h) in June and September. Significant differences in time since burning are indicated in lowercase letters, and significant differences in burn season are indicated in uppercase letters (Tukey–HSD test, ANOVA; p < 0.05; capital letters (A/B) indicate differences in burn season, while lowercase letters (a/b) represent differences in time since burning). C: control, S: spring burns, A: autumn burns.
Fire 07 00339 g005
Table 1. Three–way ANOVA outputs for soil variables and vegetation variables in the first month (June) and last month (September) of the growing season (F represents the ratio of mean square between groups to mean square within groups, and P denotes the significance level). Soil variables include dissolved organic nitrogen, microbial biomass nitrogen, total nitrogen, ammonium nitrogen, and nitrate nitrogen; vegetation variables include aboveground nitrogen, stem nitrogen, leaf nitrogen, and per–plant nitrogen. The three independent variables are burn frequency, time since burning, and burn season, respectively.
Sampling TimeBurn Frequency
df = 2
Burn Season
df = 1
Time since Burning
df = 2
Burn Season
df = 1
Burn Frequency×Burn Season
df = 2
Time since Burning×Burn Season
df = 2
FPFPFPFPFPFP
Dissolved organic nitrogenJun.35.9020.0000.7960.3820.8980.4316.3890.0251.2390.3091.4330.274
Sep.6.4700.0070.8050.3800.0620.9400.5330.4780.3470.7114.2690.038
Microbial biomass nitrogenJun.40.4560.0000.0120.9131.3990.2820.2540.6230.5170.6030.5560.586
Sep.28.1300.0000.0060.9391.5740.2442.9760.1080.1030.9031.3910.284
Total nitrogenJun.2.1160.1440.9720.3350.0070.9932.2850.1553.2200.0590.5020.617
Sep.3.5480.0480.7310.4030.9870.3992.8390.1160.5380.5920.2870.755
Nitrate nitrogenJun.2.9620.0730.1530.69914.1310.00126.7030.0000.6070.5545.8550.015
Sep.41.6340.0007.8610.0111.7830.2070.5490.4723.5620.0470.9390.416
Ammonium nitrogenJun.37.3790.0001.2610.2740.2890.7531.1680.2991.8910.1751.5080.258
Sep.6.8650.0052.7690.1121.6450.2310.1000.7572.0590.1541.9630.180
Aboveground nitrogenJun.19.8380.0003.3720.0781.9070.1751.4420.2443.2250.0567.1720.004
Sep.11.3670.0005.5940.0261.5360.2400.0090.9262.6420.0902.1180.146
Stem nitrogenJun.25.9470.0006.1370.0202.4650.1102.9620.1015.4500.0119.5830.001
Sep.29.1430.0007.2070.0120.0610.9410.7390.4005.8300.0088.2700.002
Leaf nitrogenJun.5.9170.0080.3810.5420.7030.5070.1090.7440.7900.4650.6100.553
Sep.20.3980.0000.1420.7094.9340.0180.5140.4820.4980.6130.2370.791
Per–plant nitrogenJun.6.9340.0040.7180.4048.4380.00214.0380.0012.0620.1482.9460.076
Sep.1.2020.3170.2190.6443.0770.0680.3720.5490.0440.9570.0230.977
Disclaimer/Publisher’s Note: The statements, opinions and data contained in all publications are solely those of the individual author(s) and contributor(s) and not of MDPI and/or the editor(s). MDPI and/or the editor(s) disclaim responsibility for any injury to people or property resulting from any ideas, methods, instructions or products referred to in the content.

