The Short-Term Impacts of the 2017 Portuguese Wildfires on Human Health and Visibility: A Case Study

 , , ,
, , ,  ,
,  ,
, 
 and
and 
Abstract
:1. Introduction
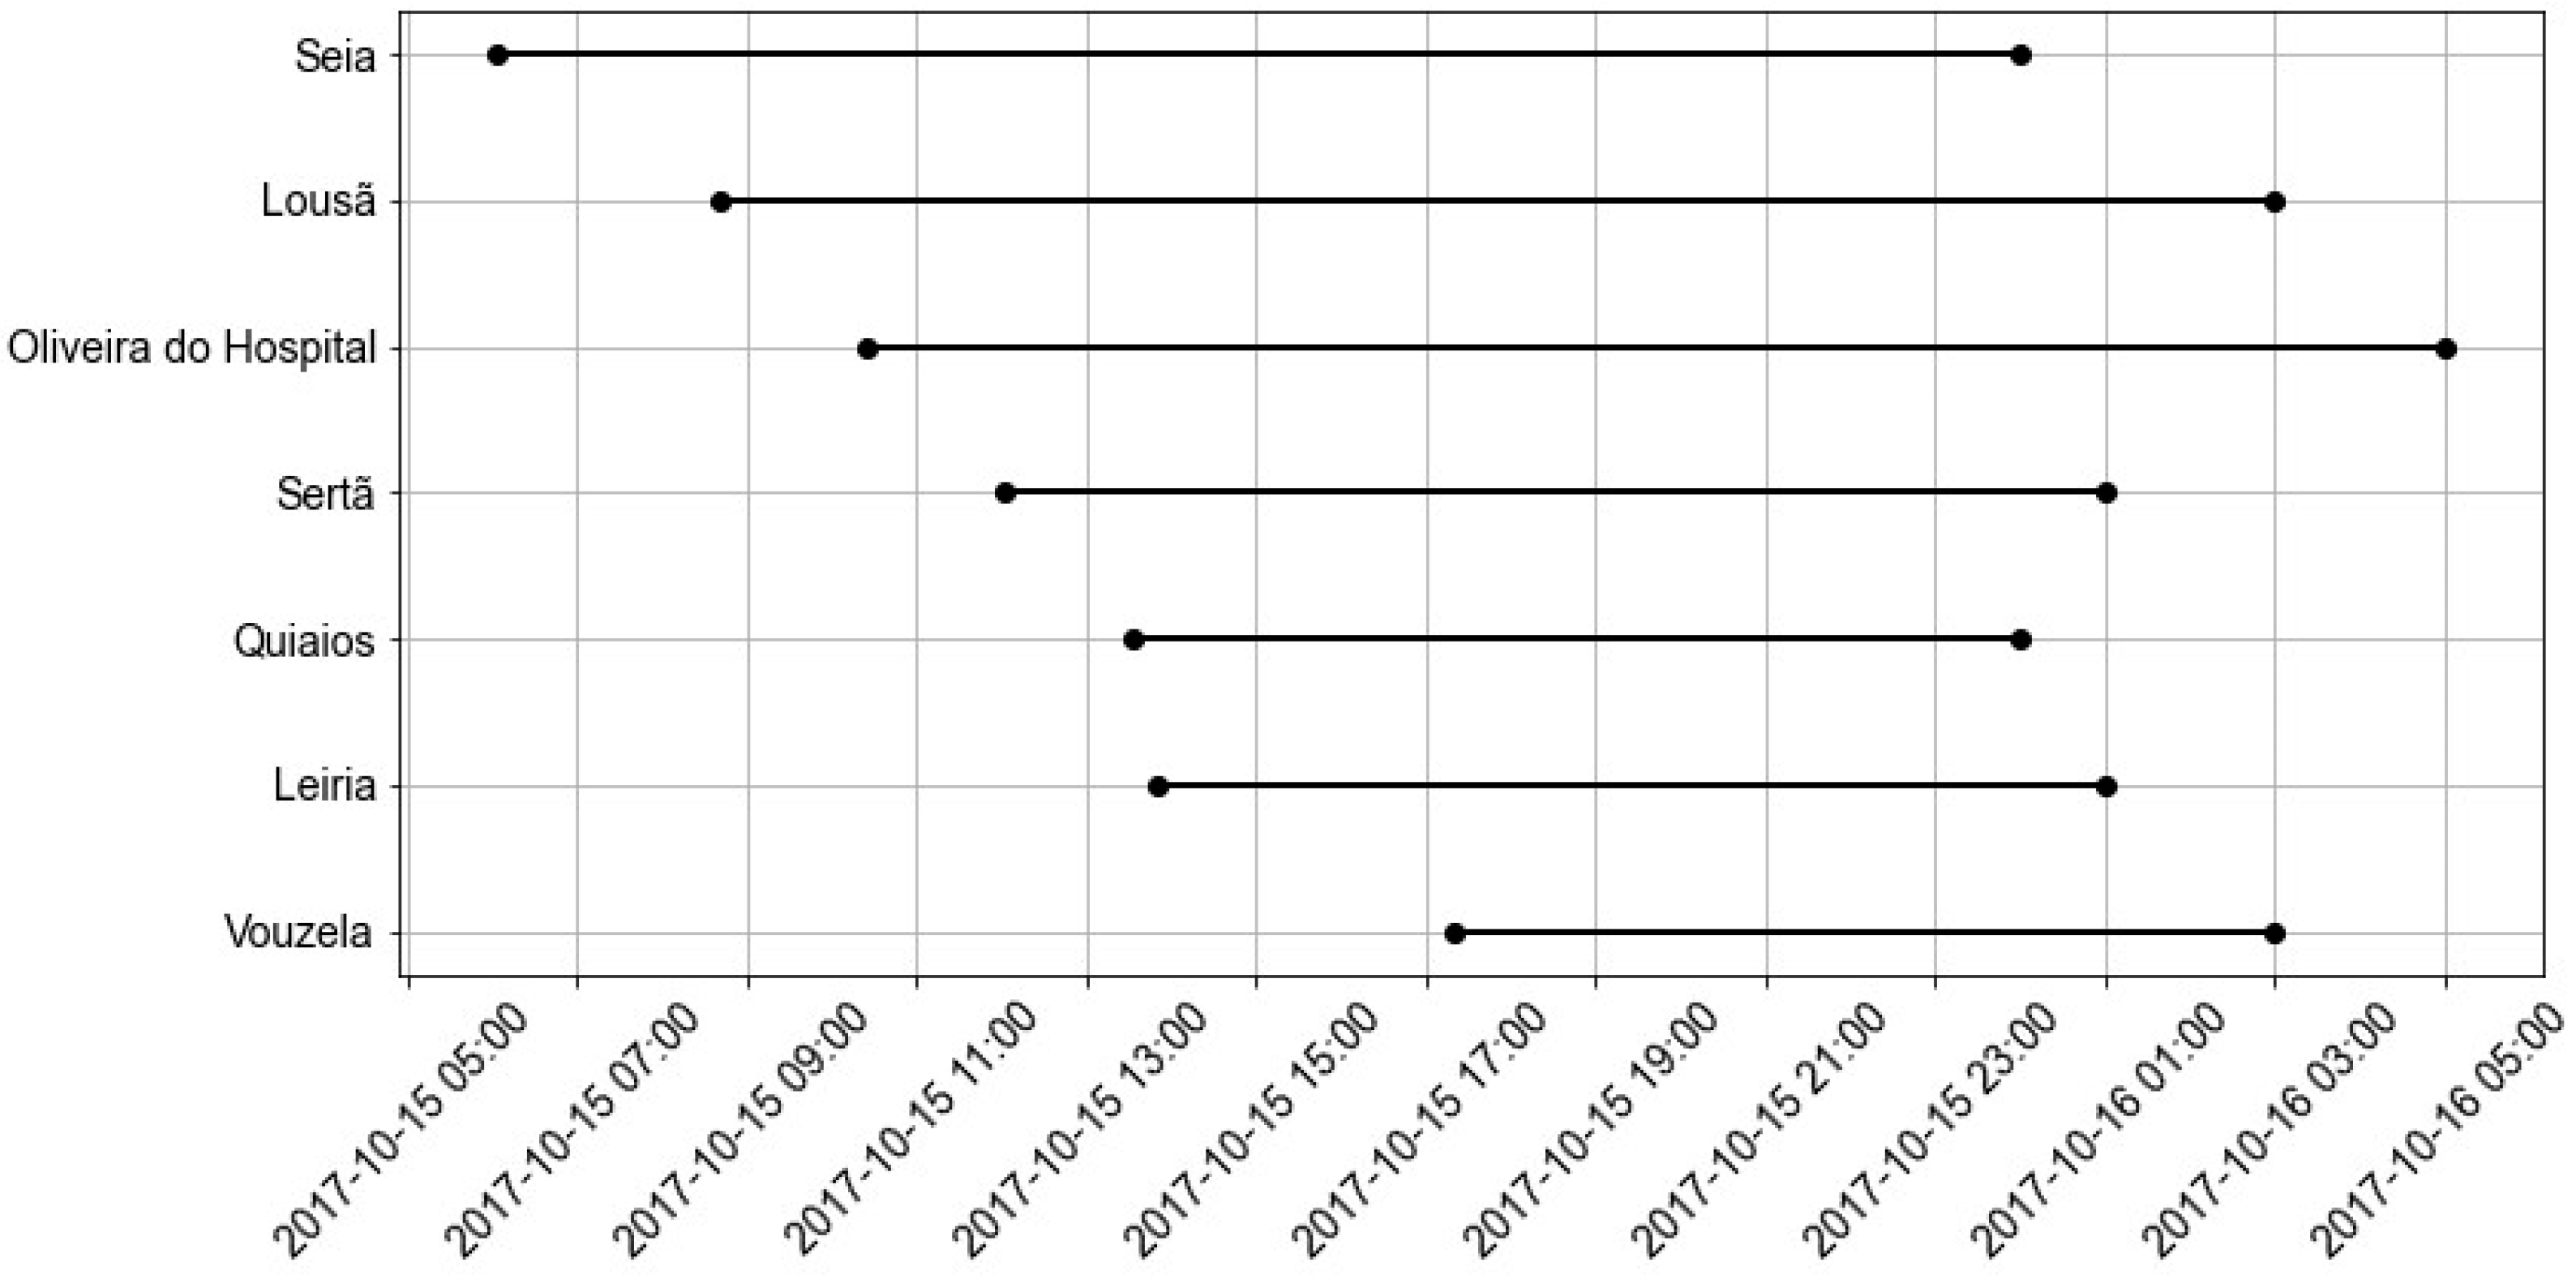
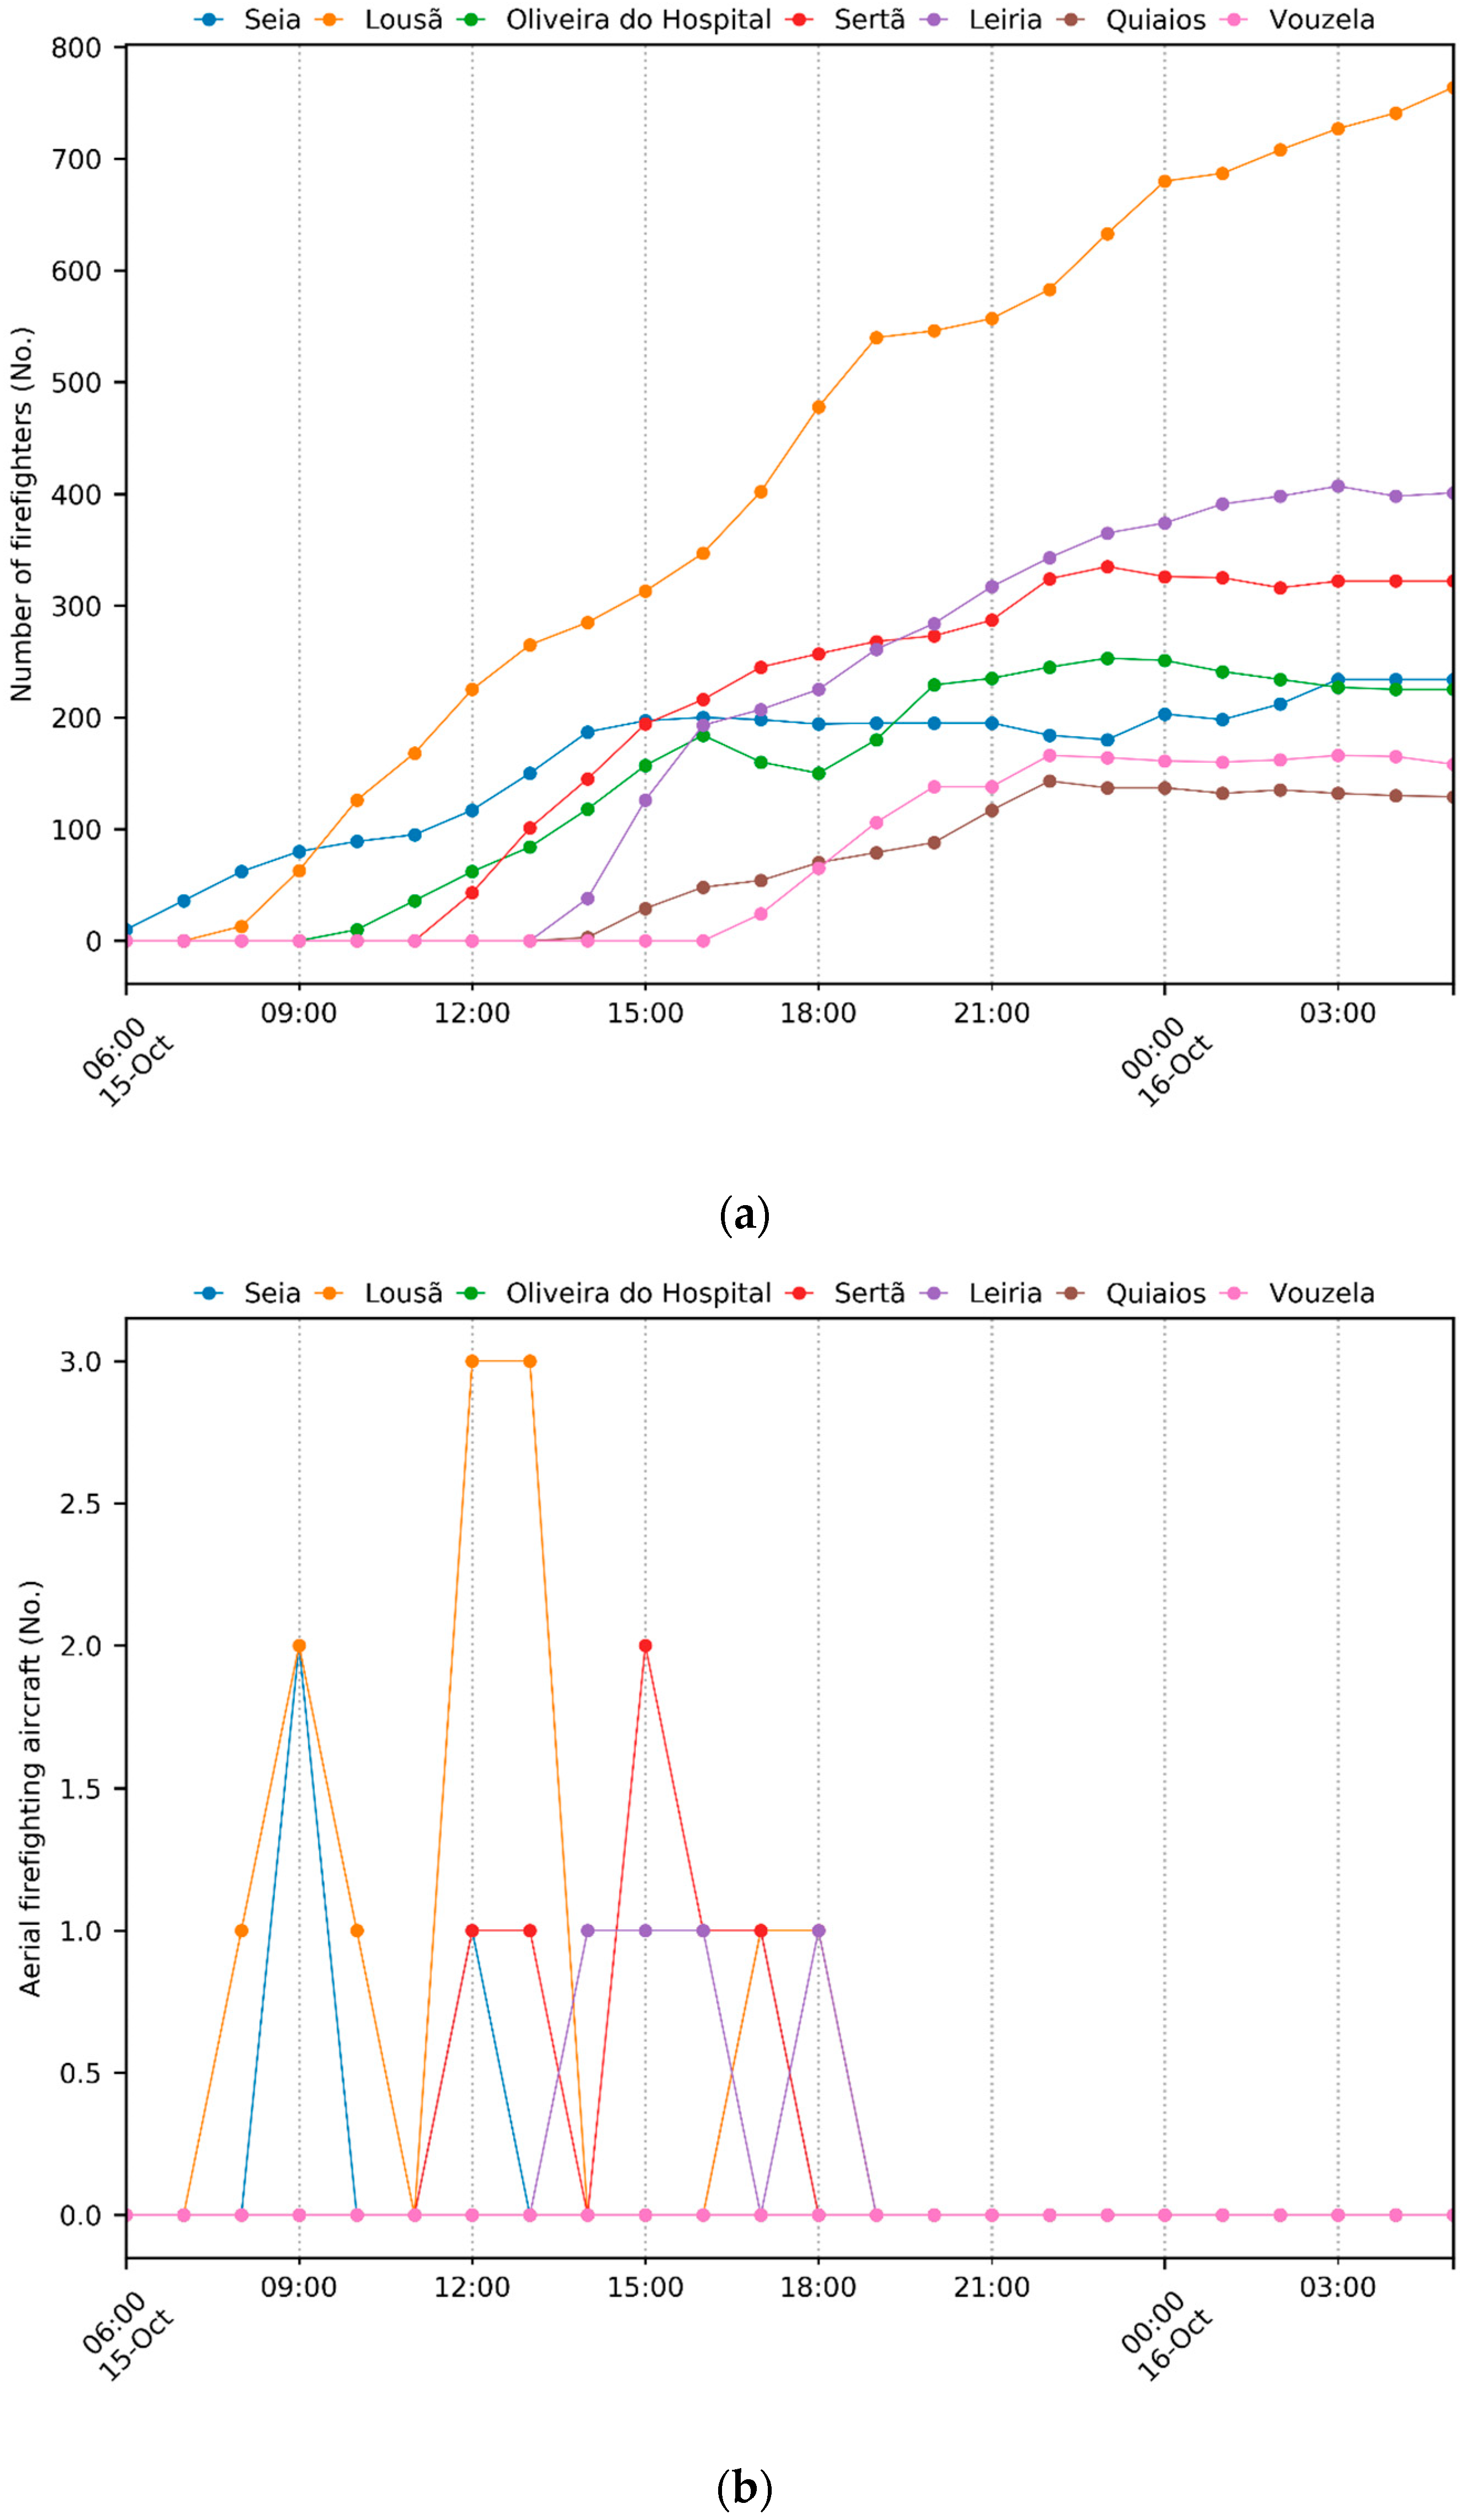
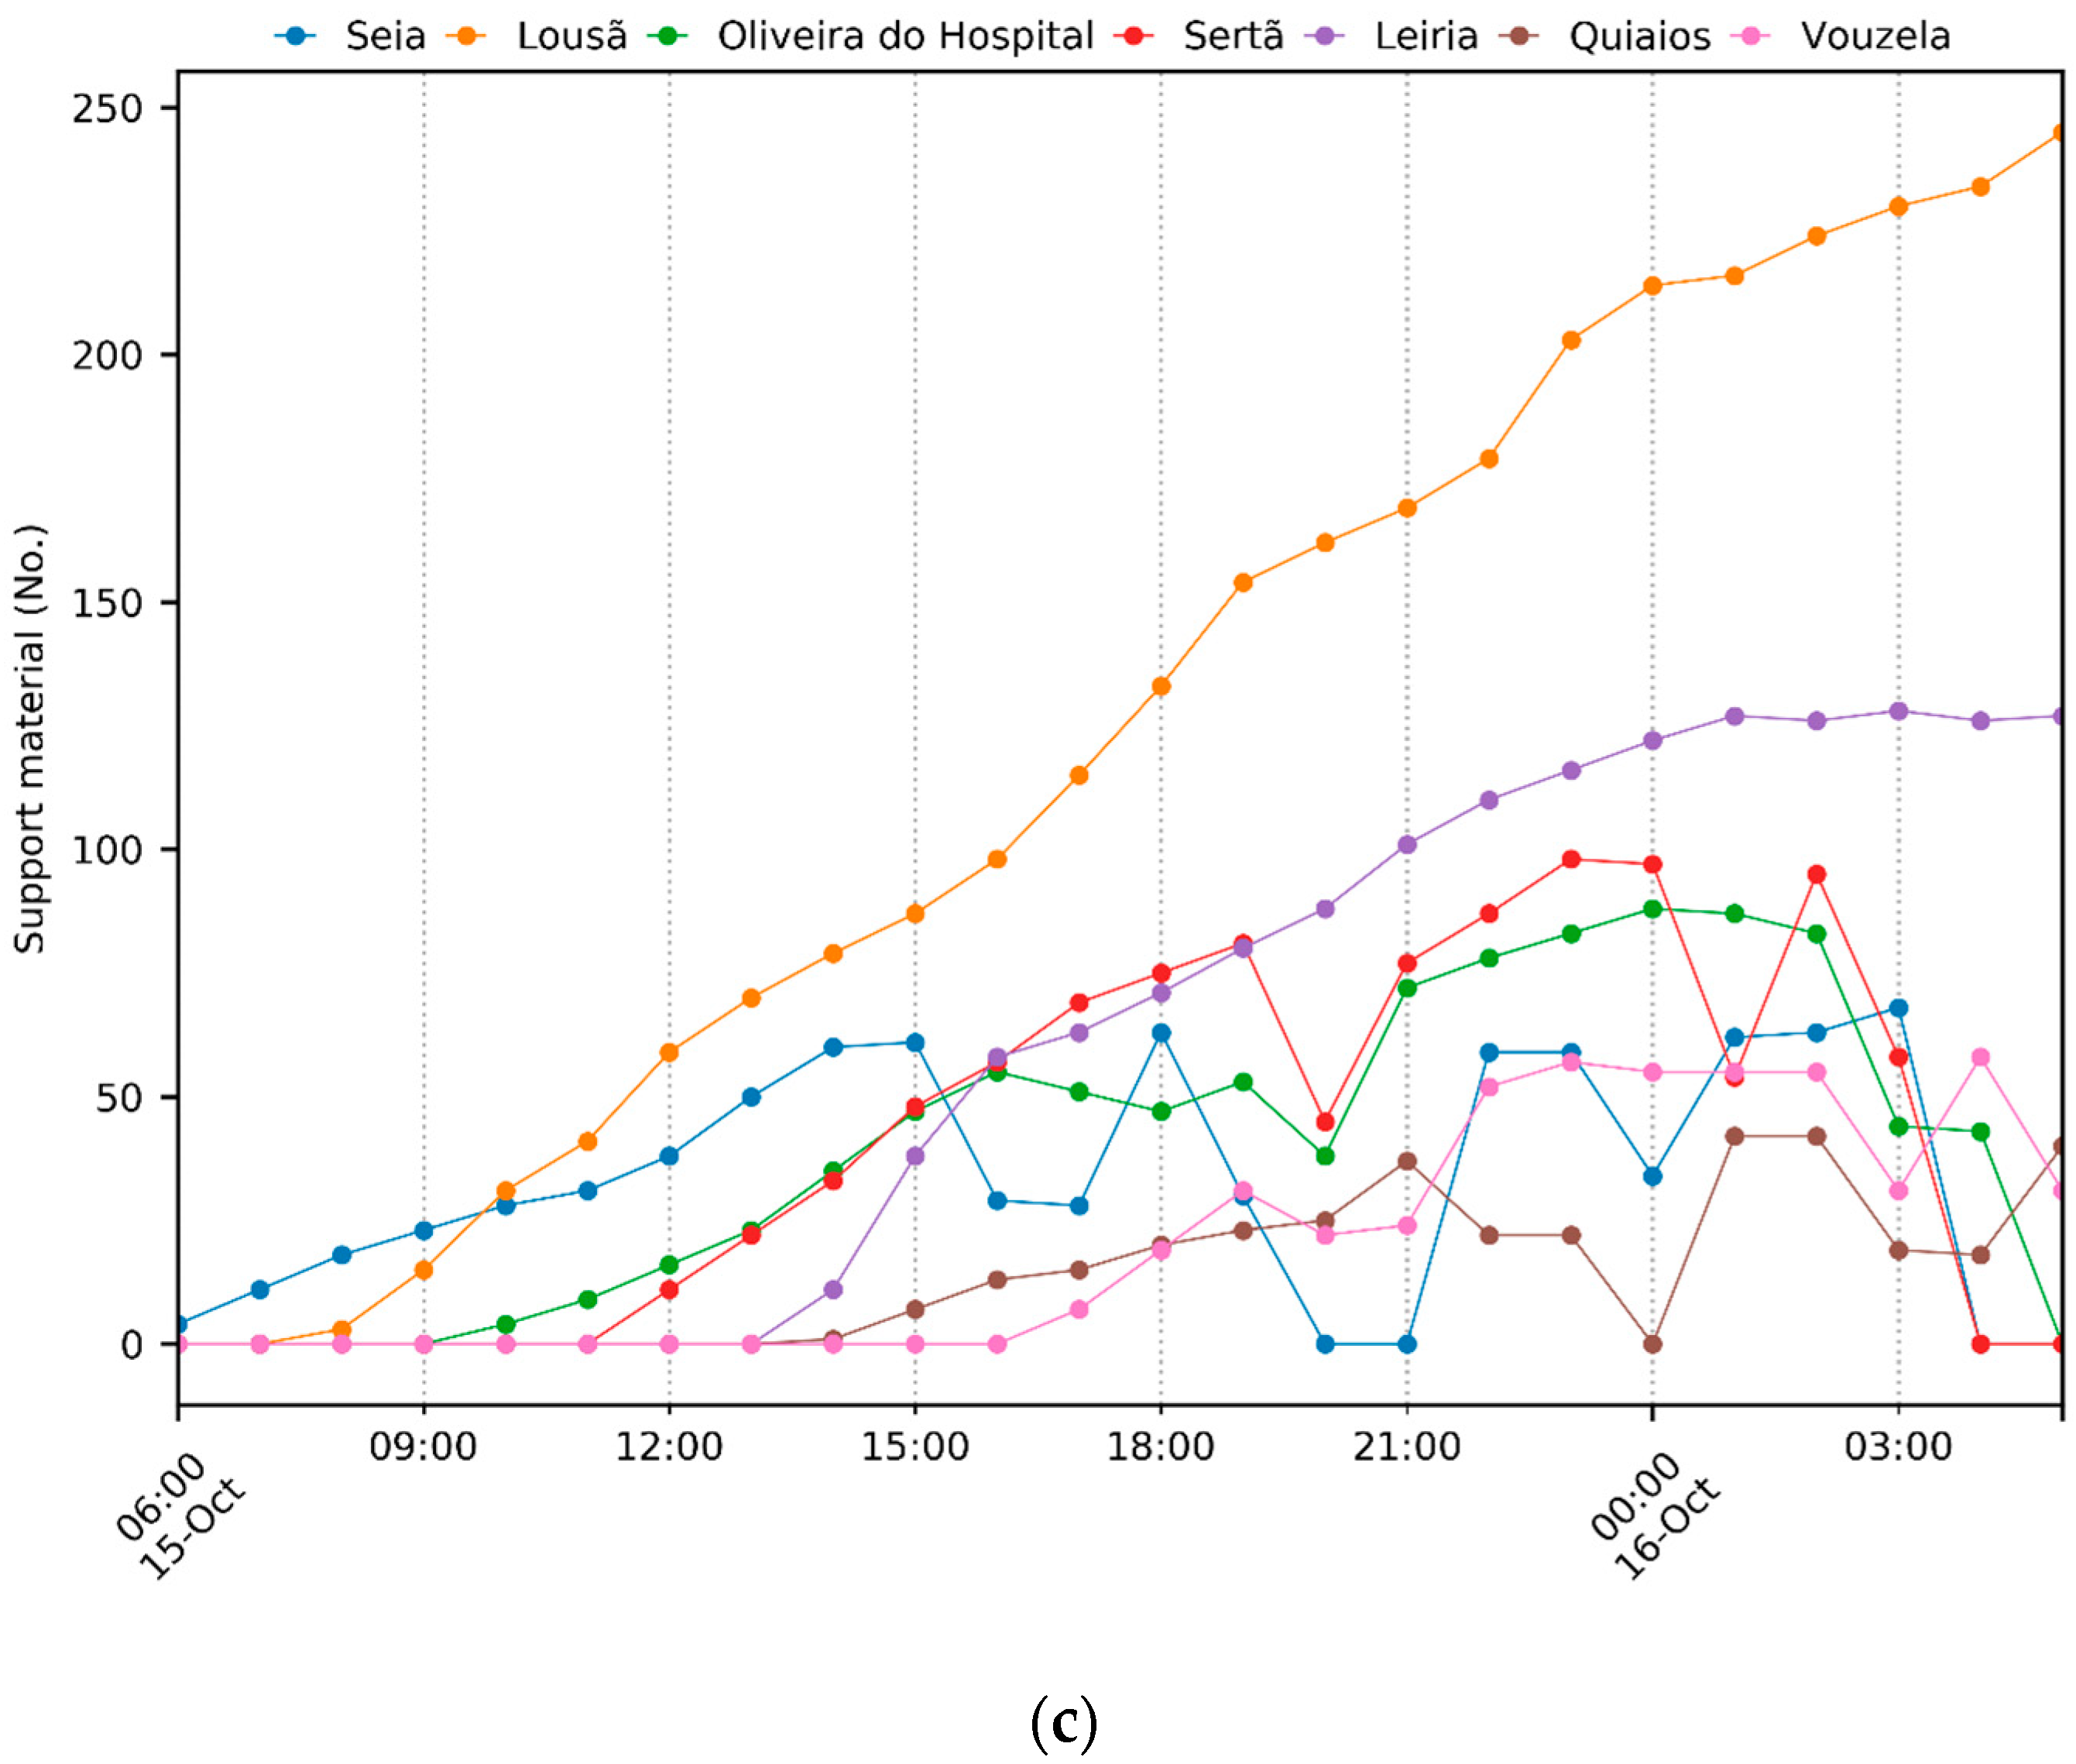
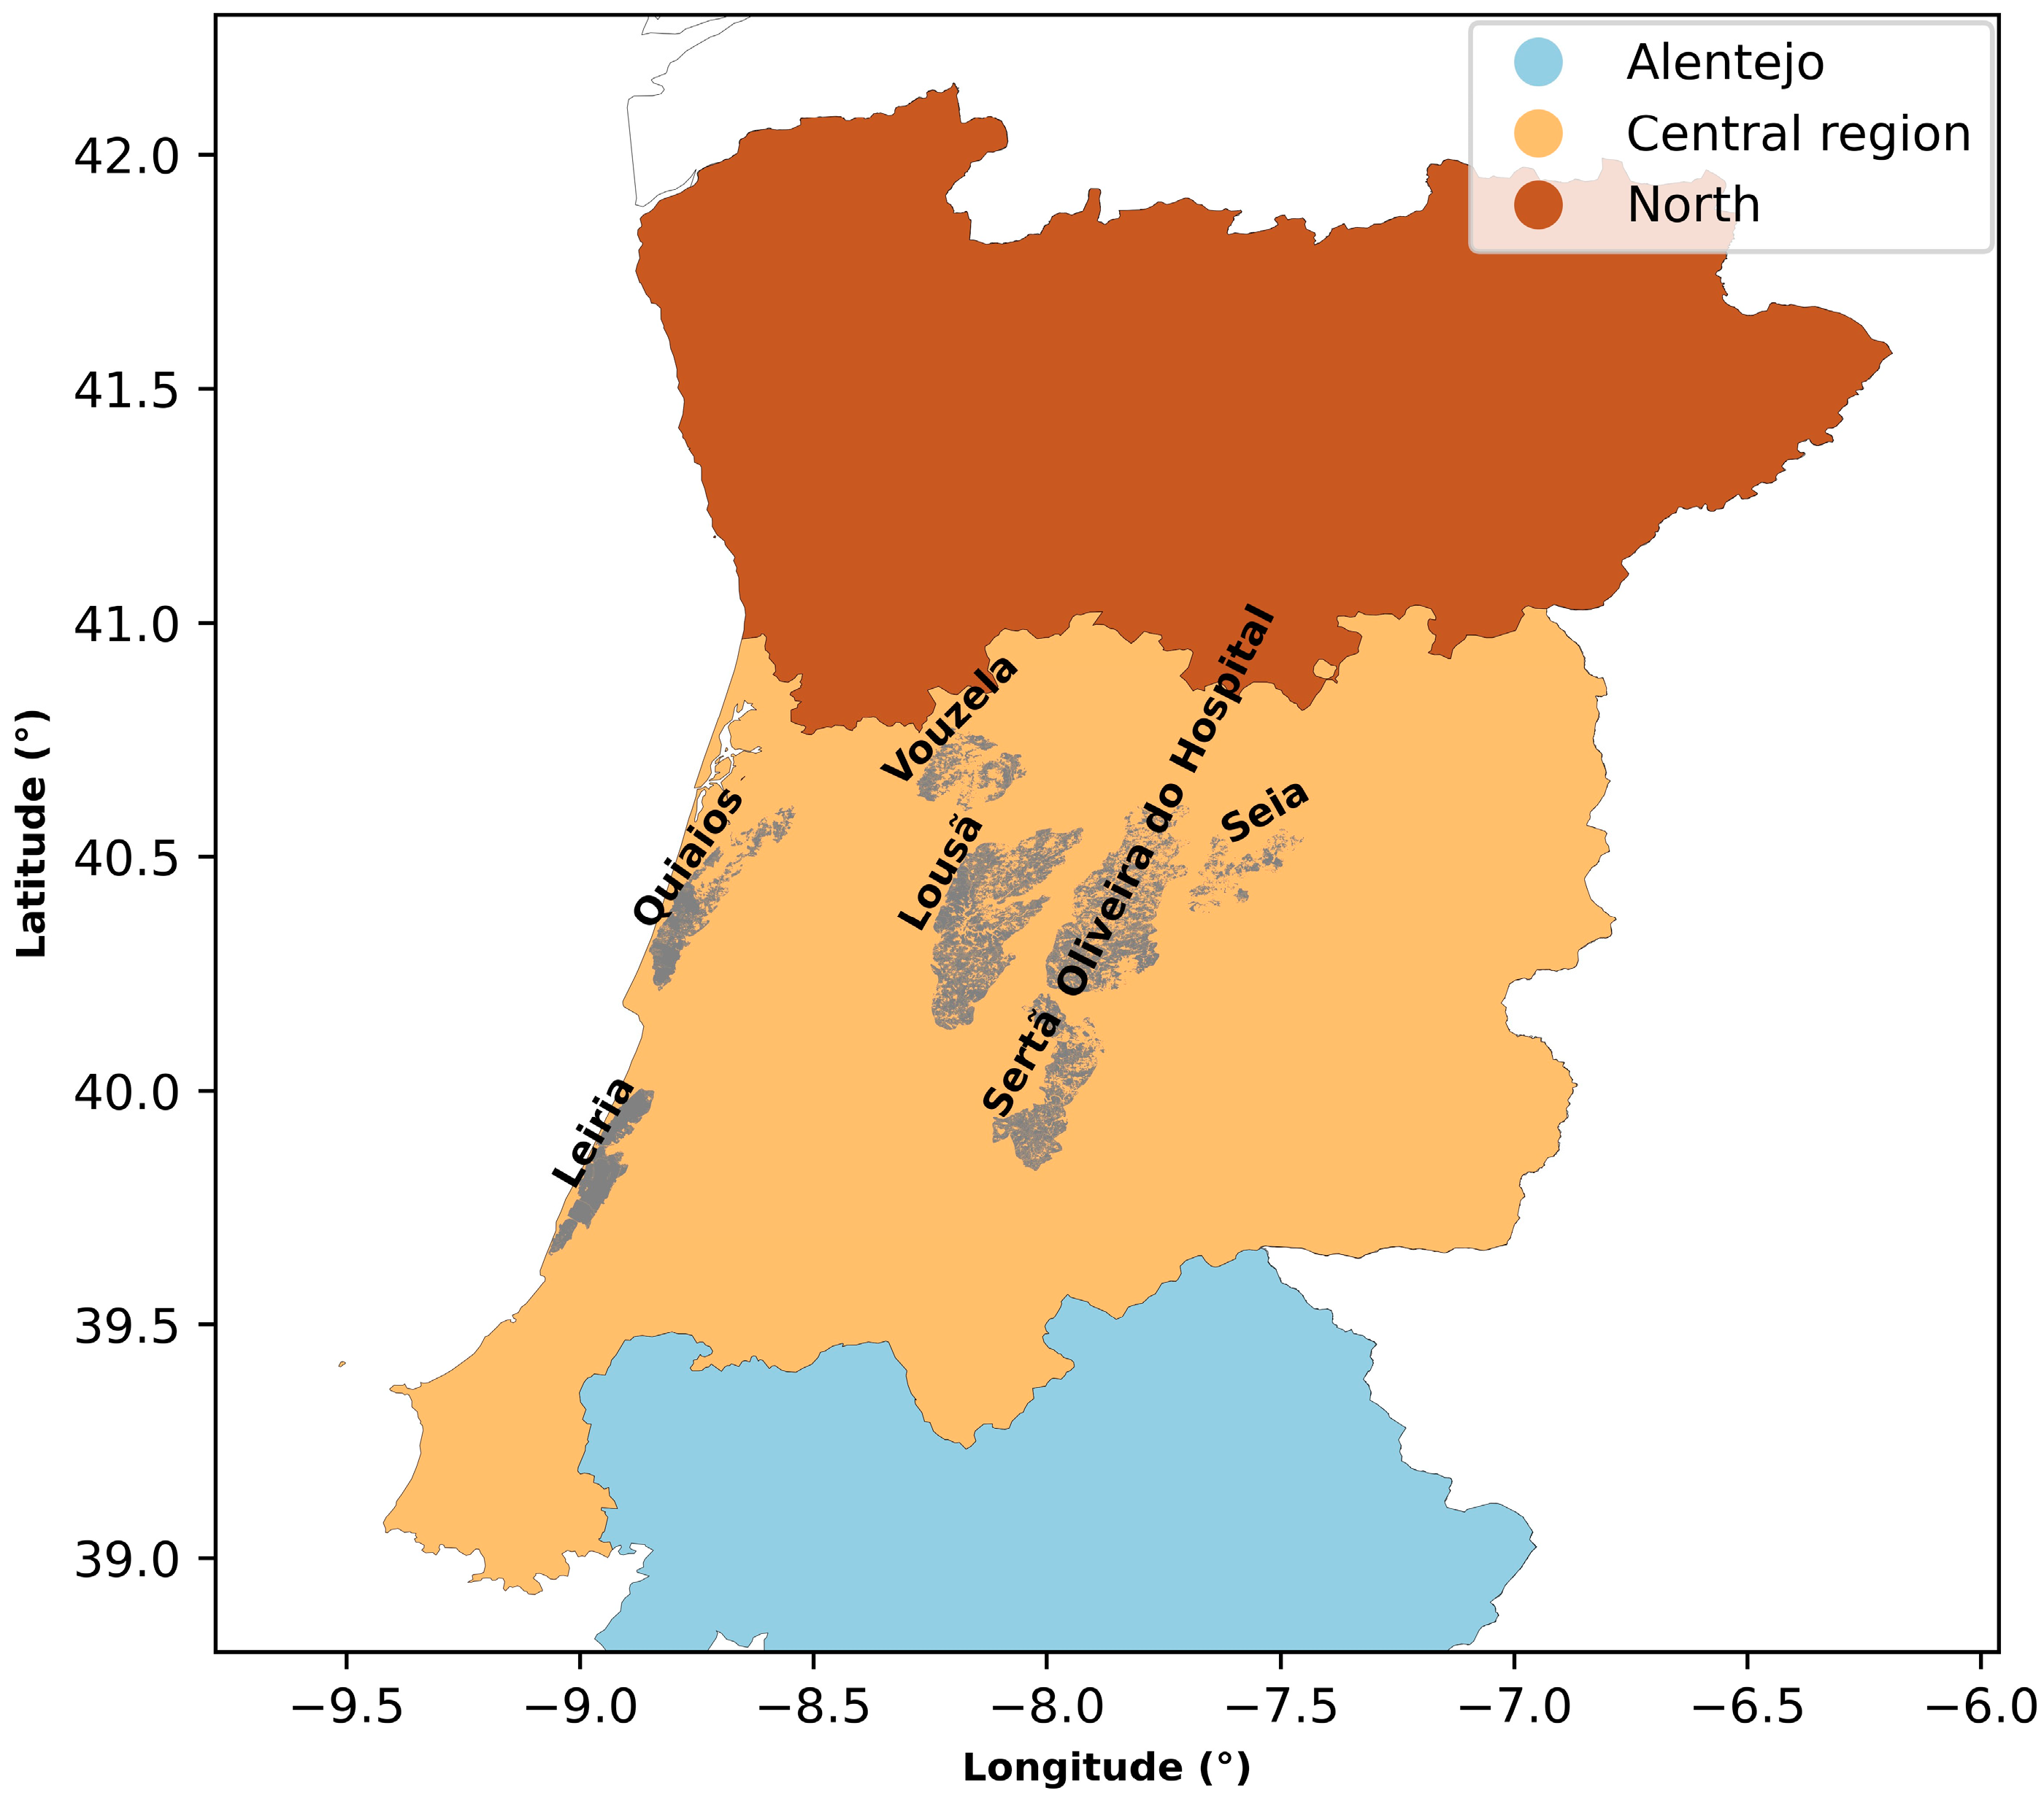
2. A Description of the Case Study
3. Material and Methods
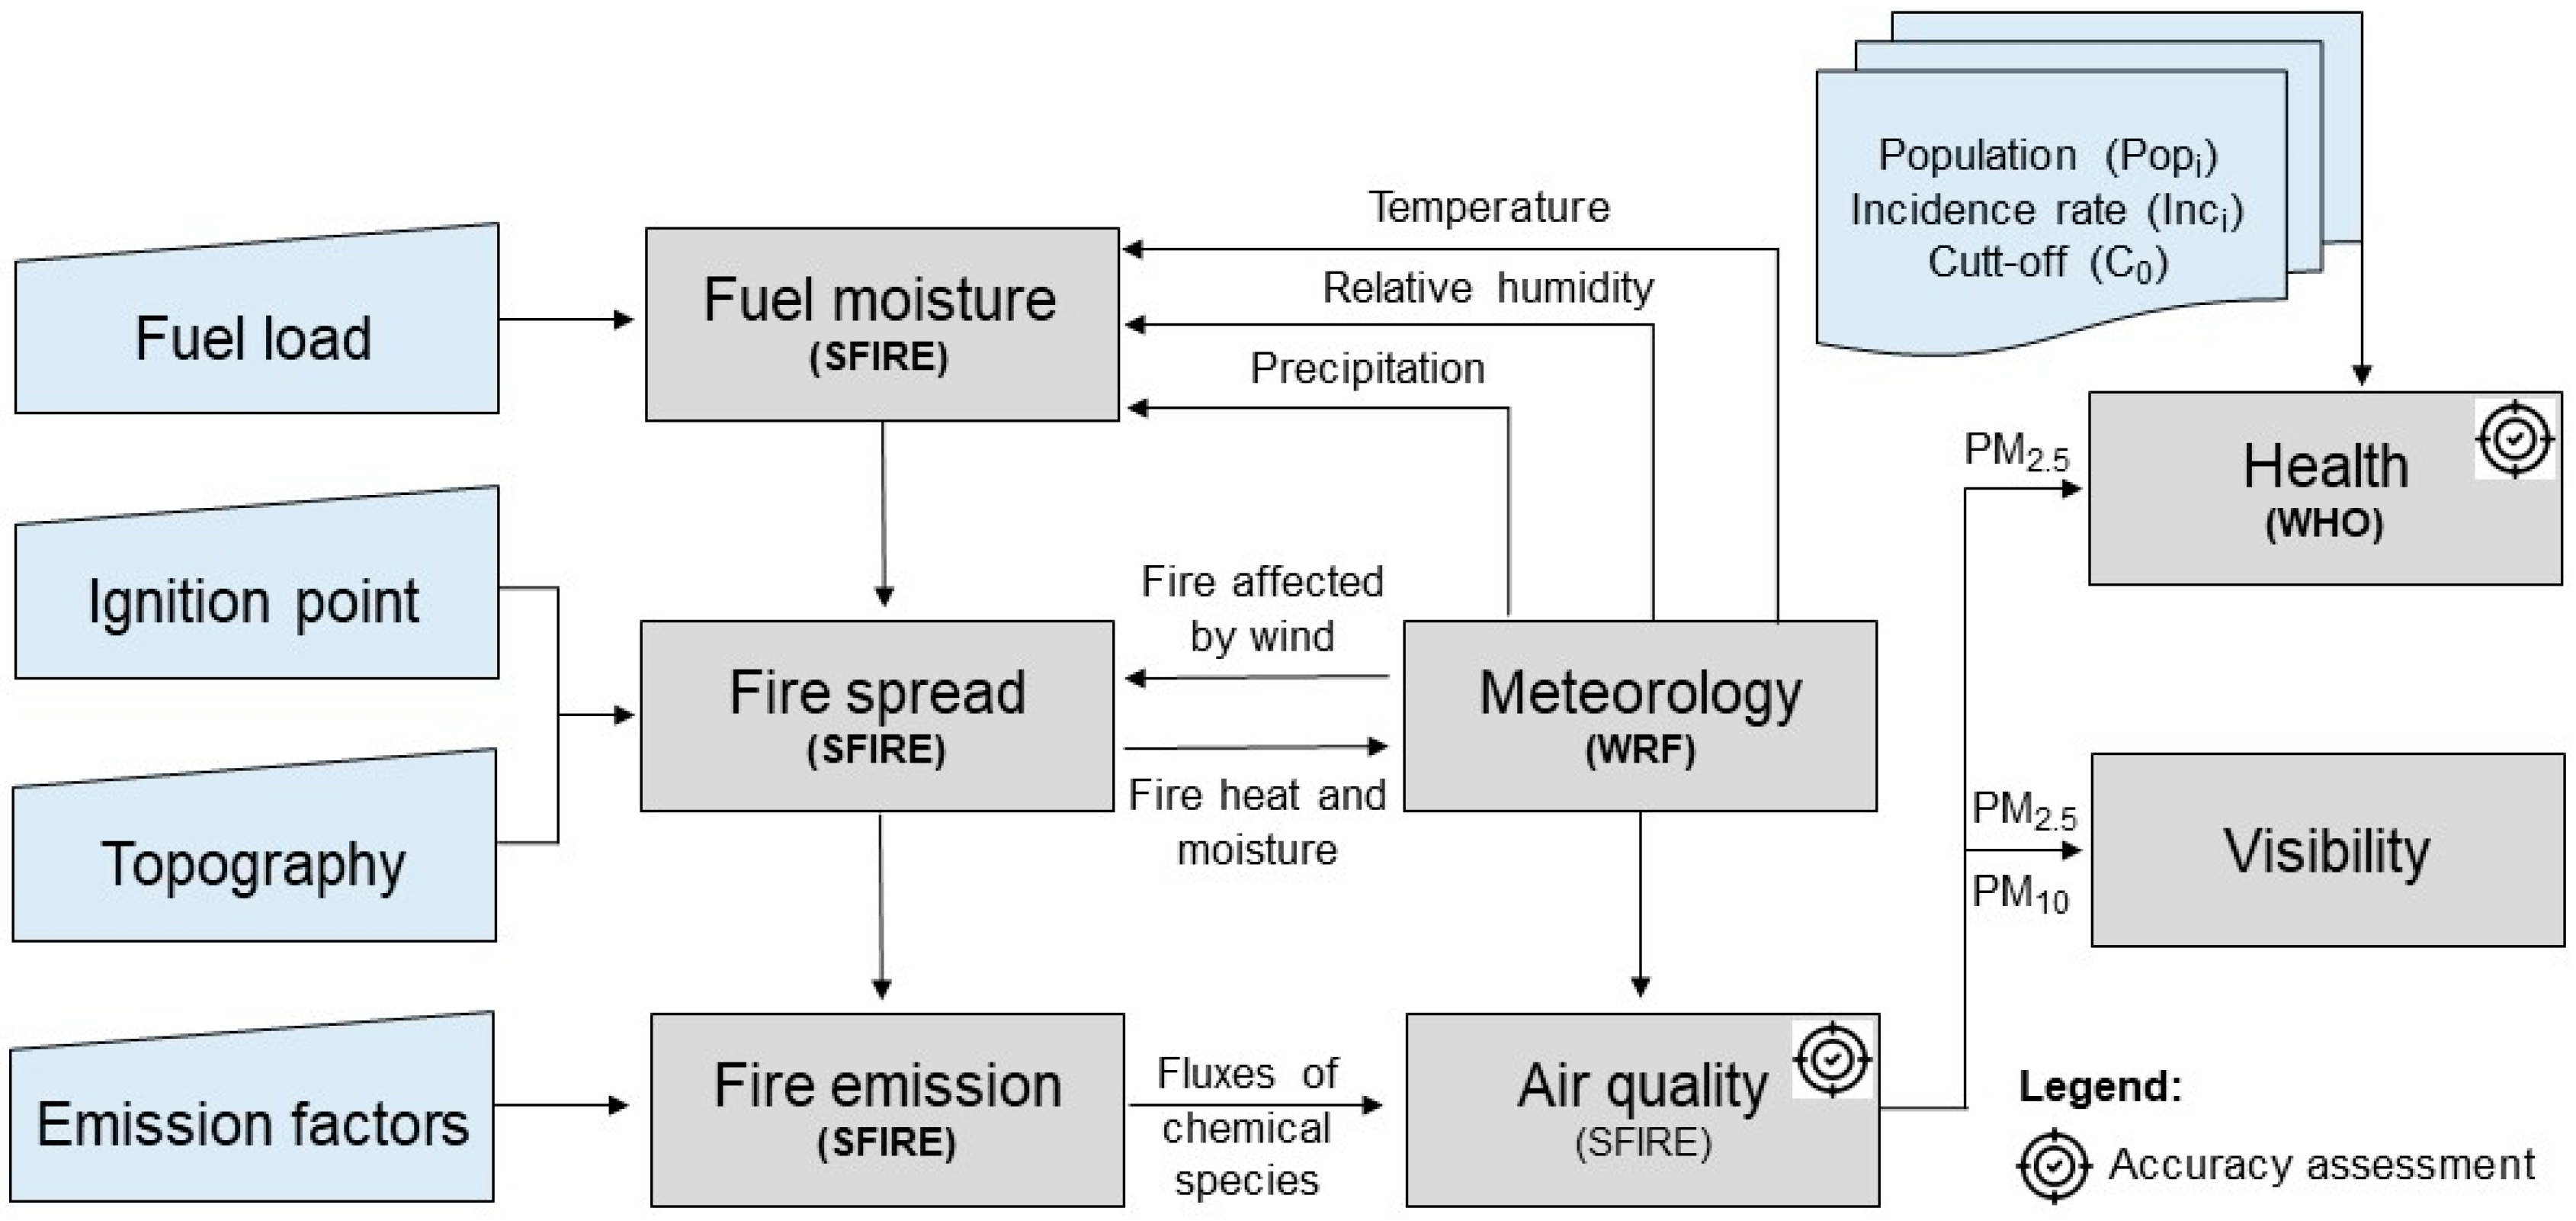
3.1. Air Pollution Modelling Setup
3.2. Human Health Impacts
3.3. Visibility Impairment
3.4. Modelling Evaluation
4. Results
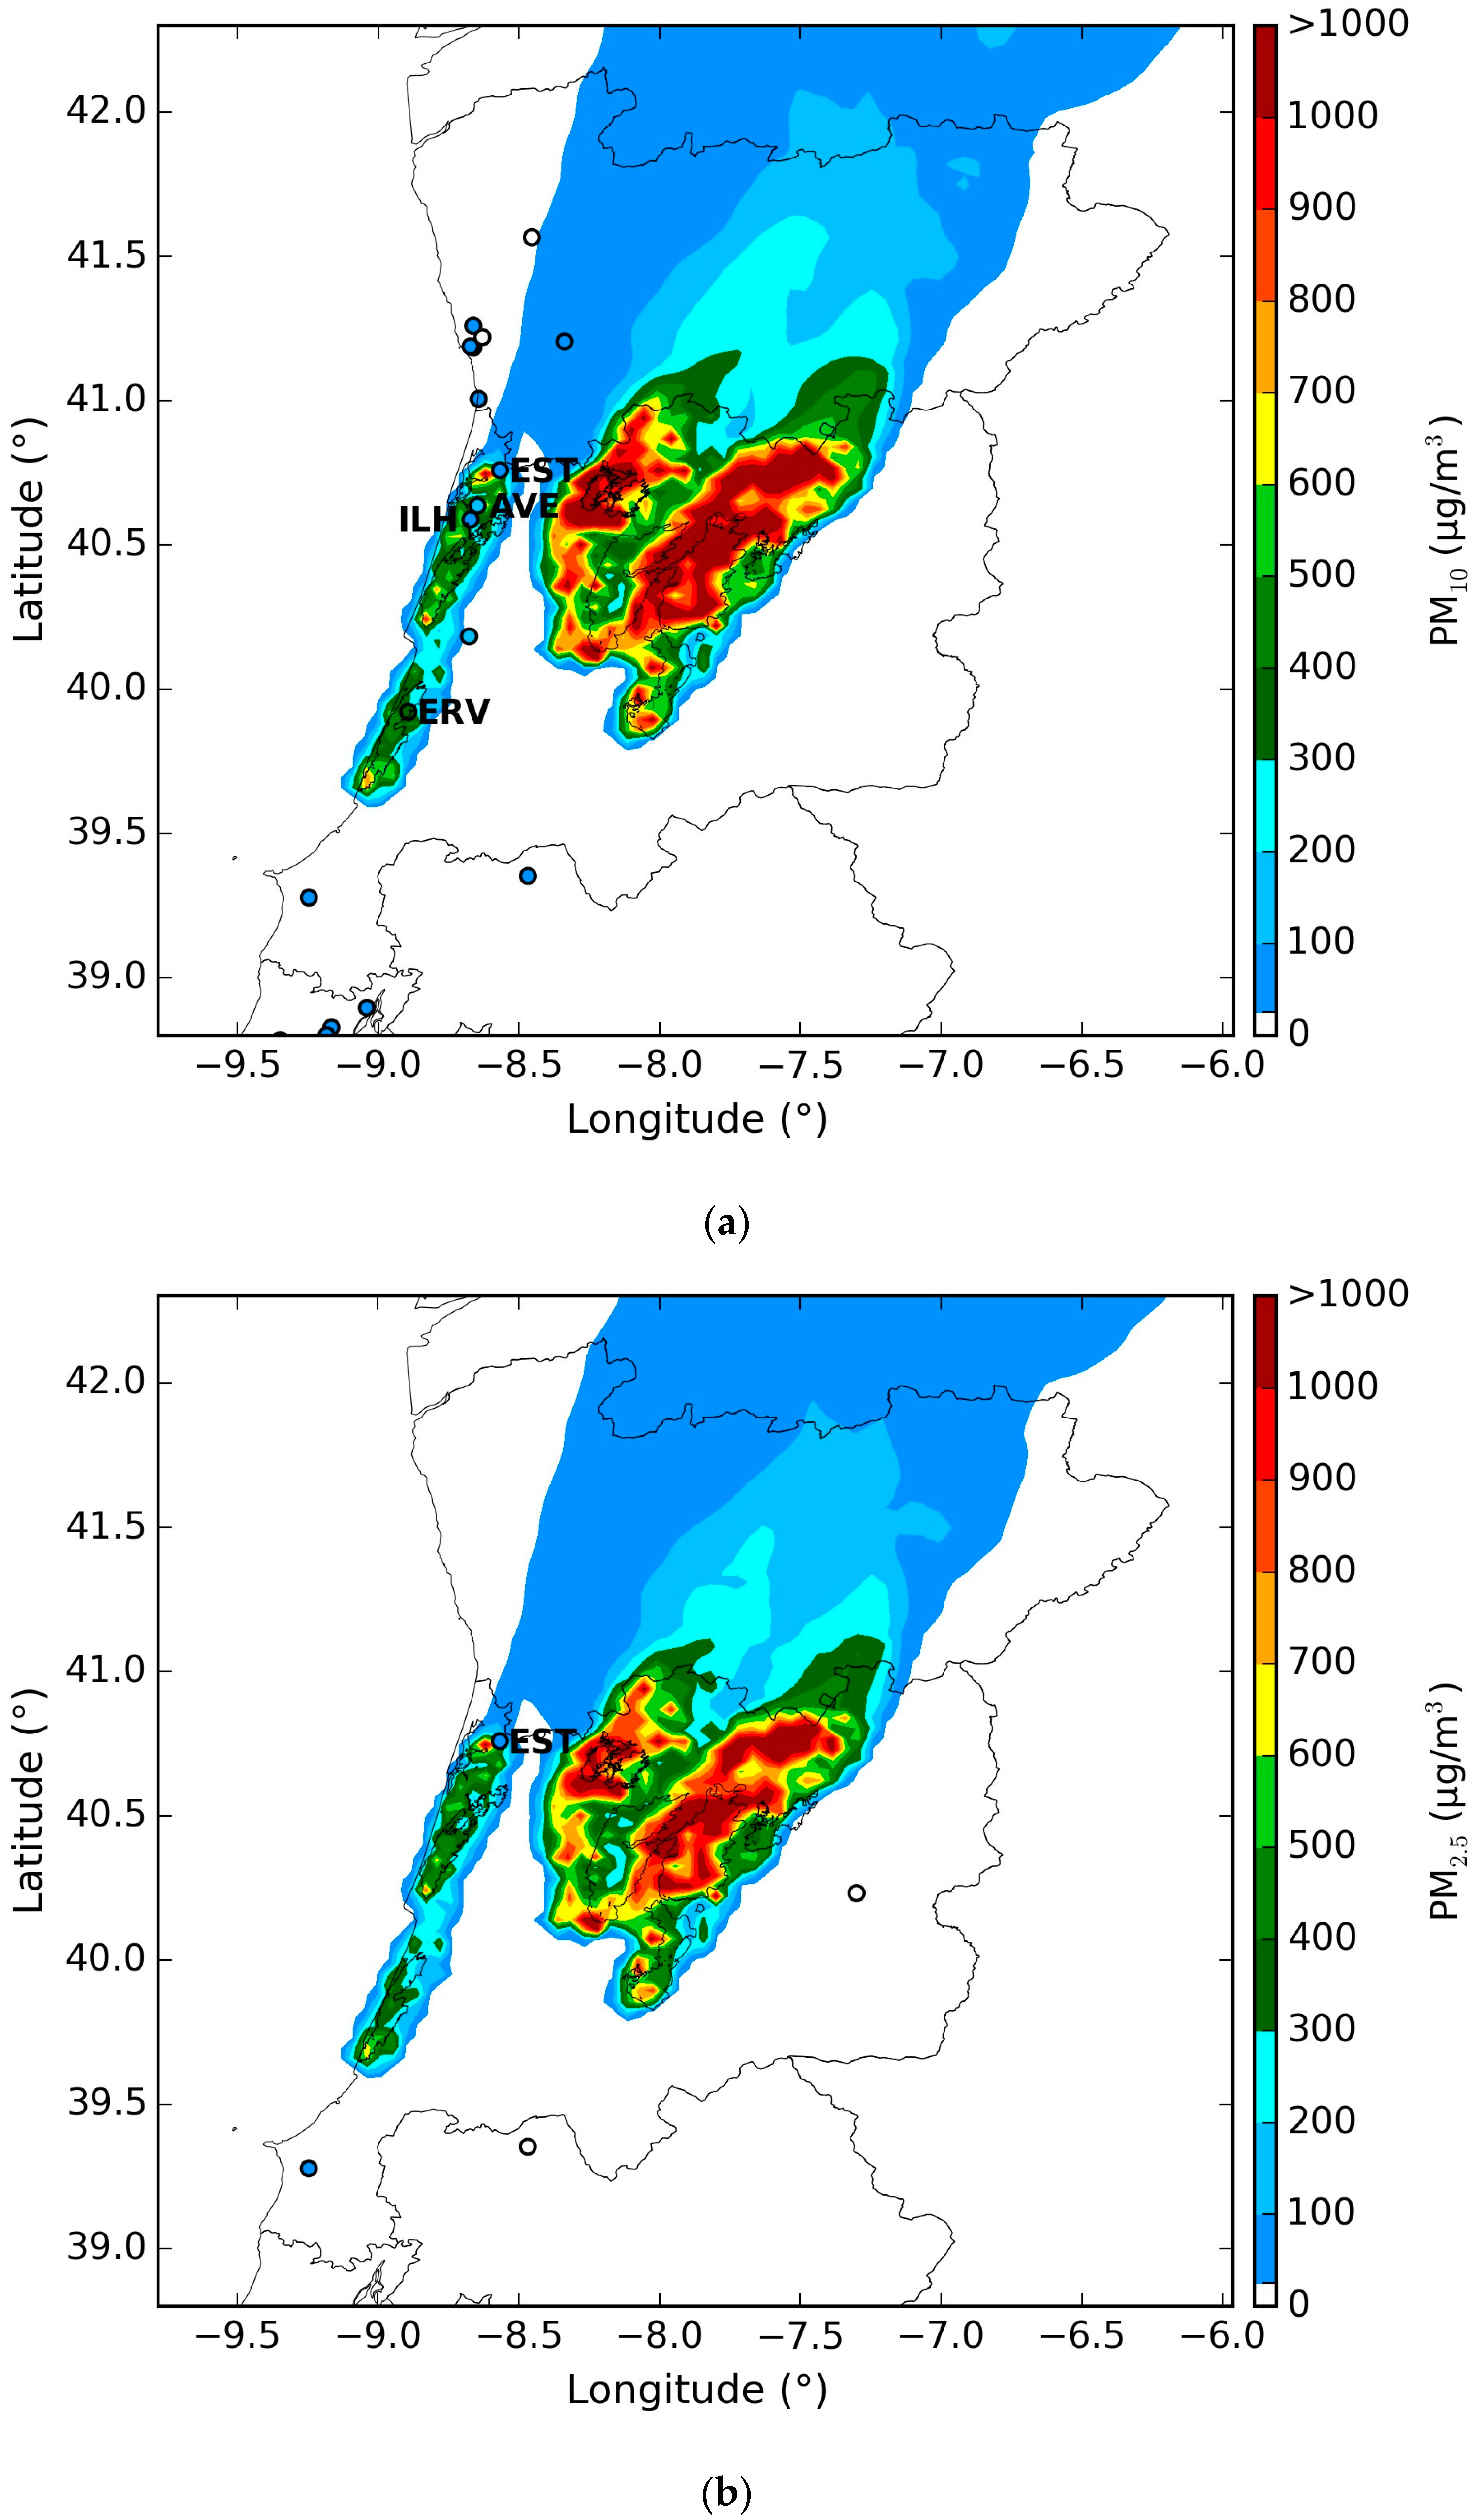
4.1. Air Quality
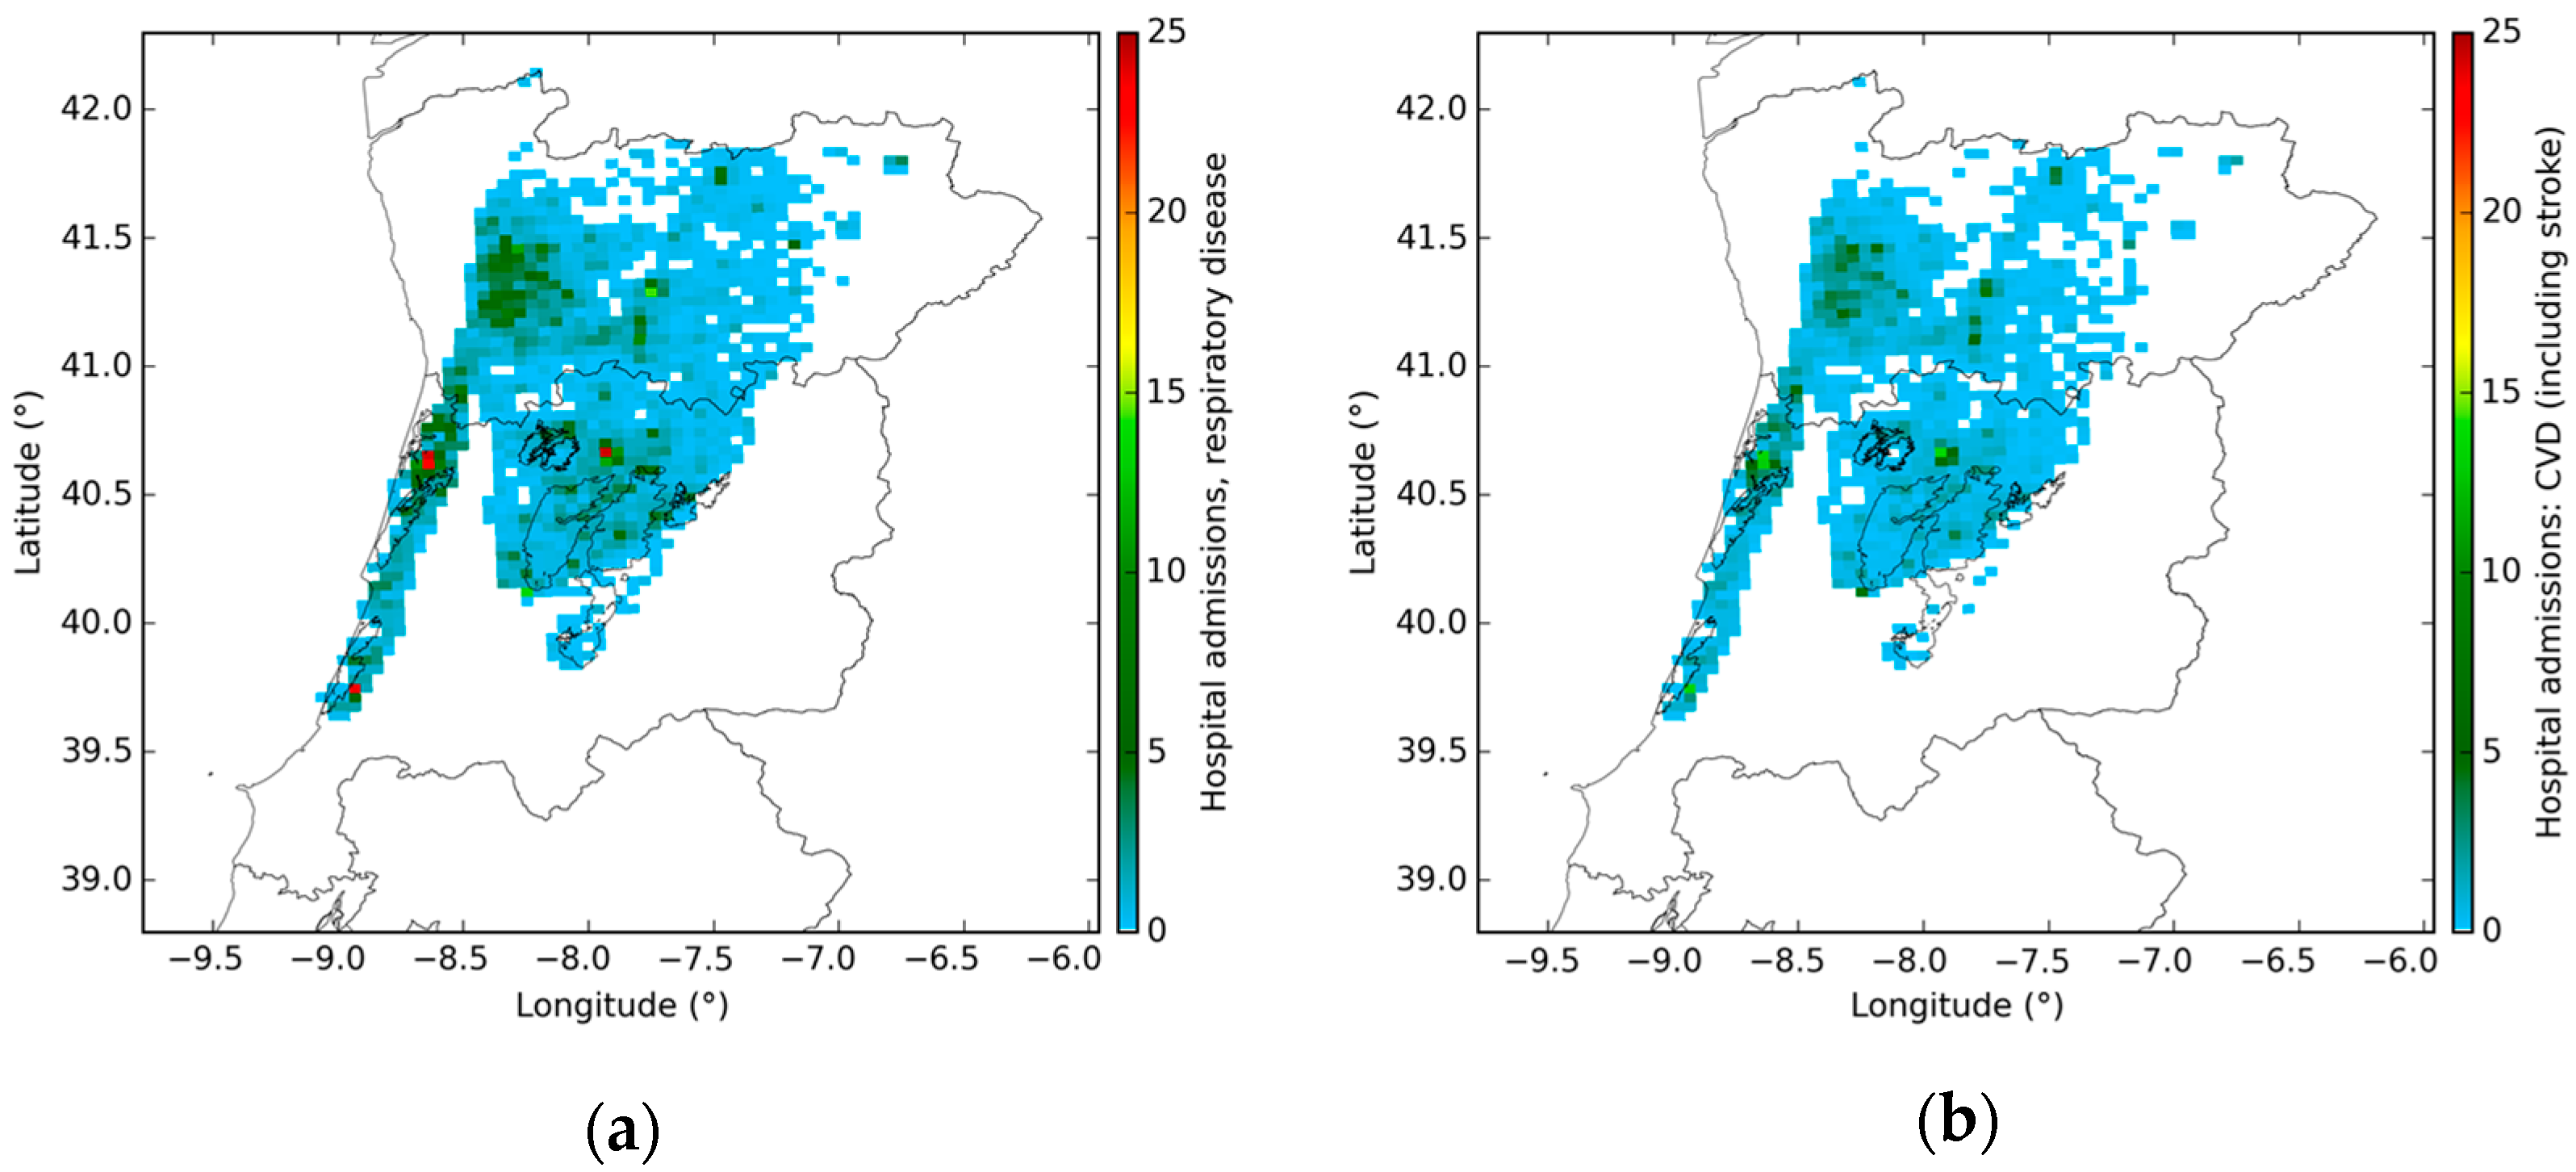
4.2. Human Health
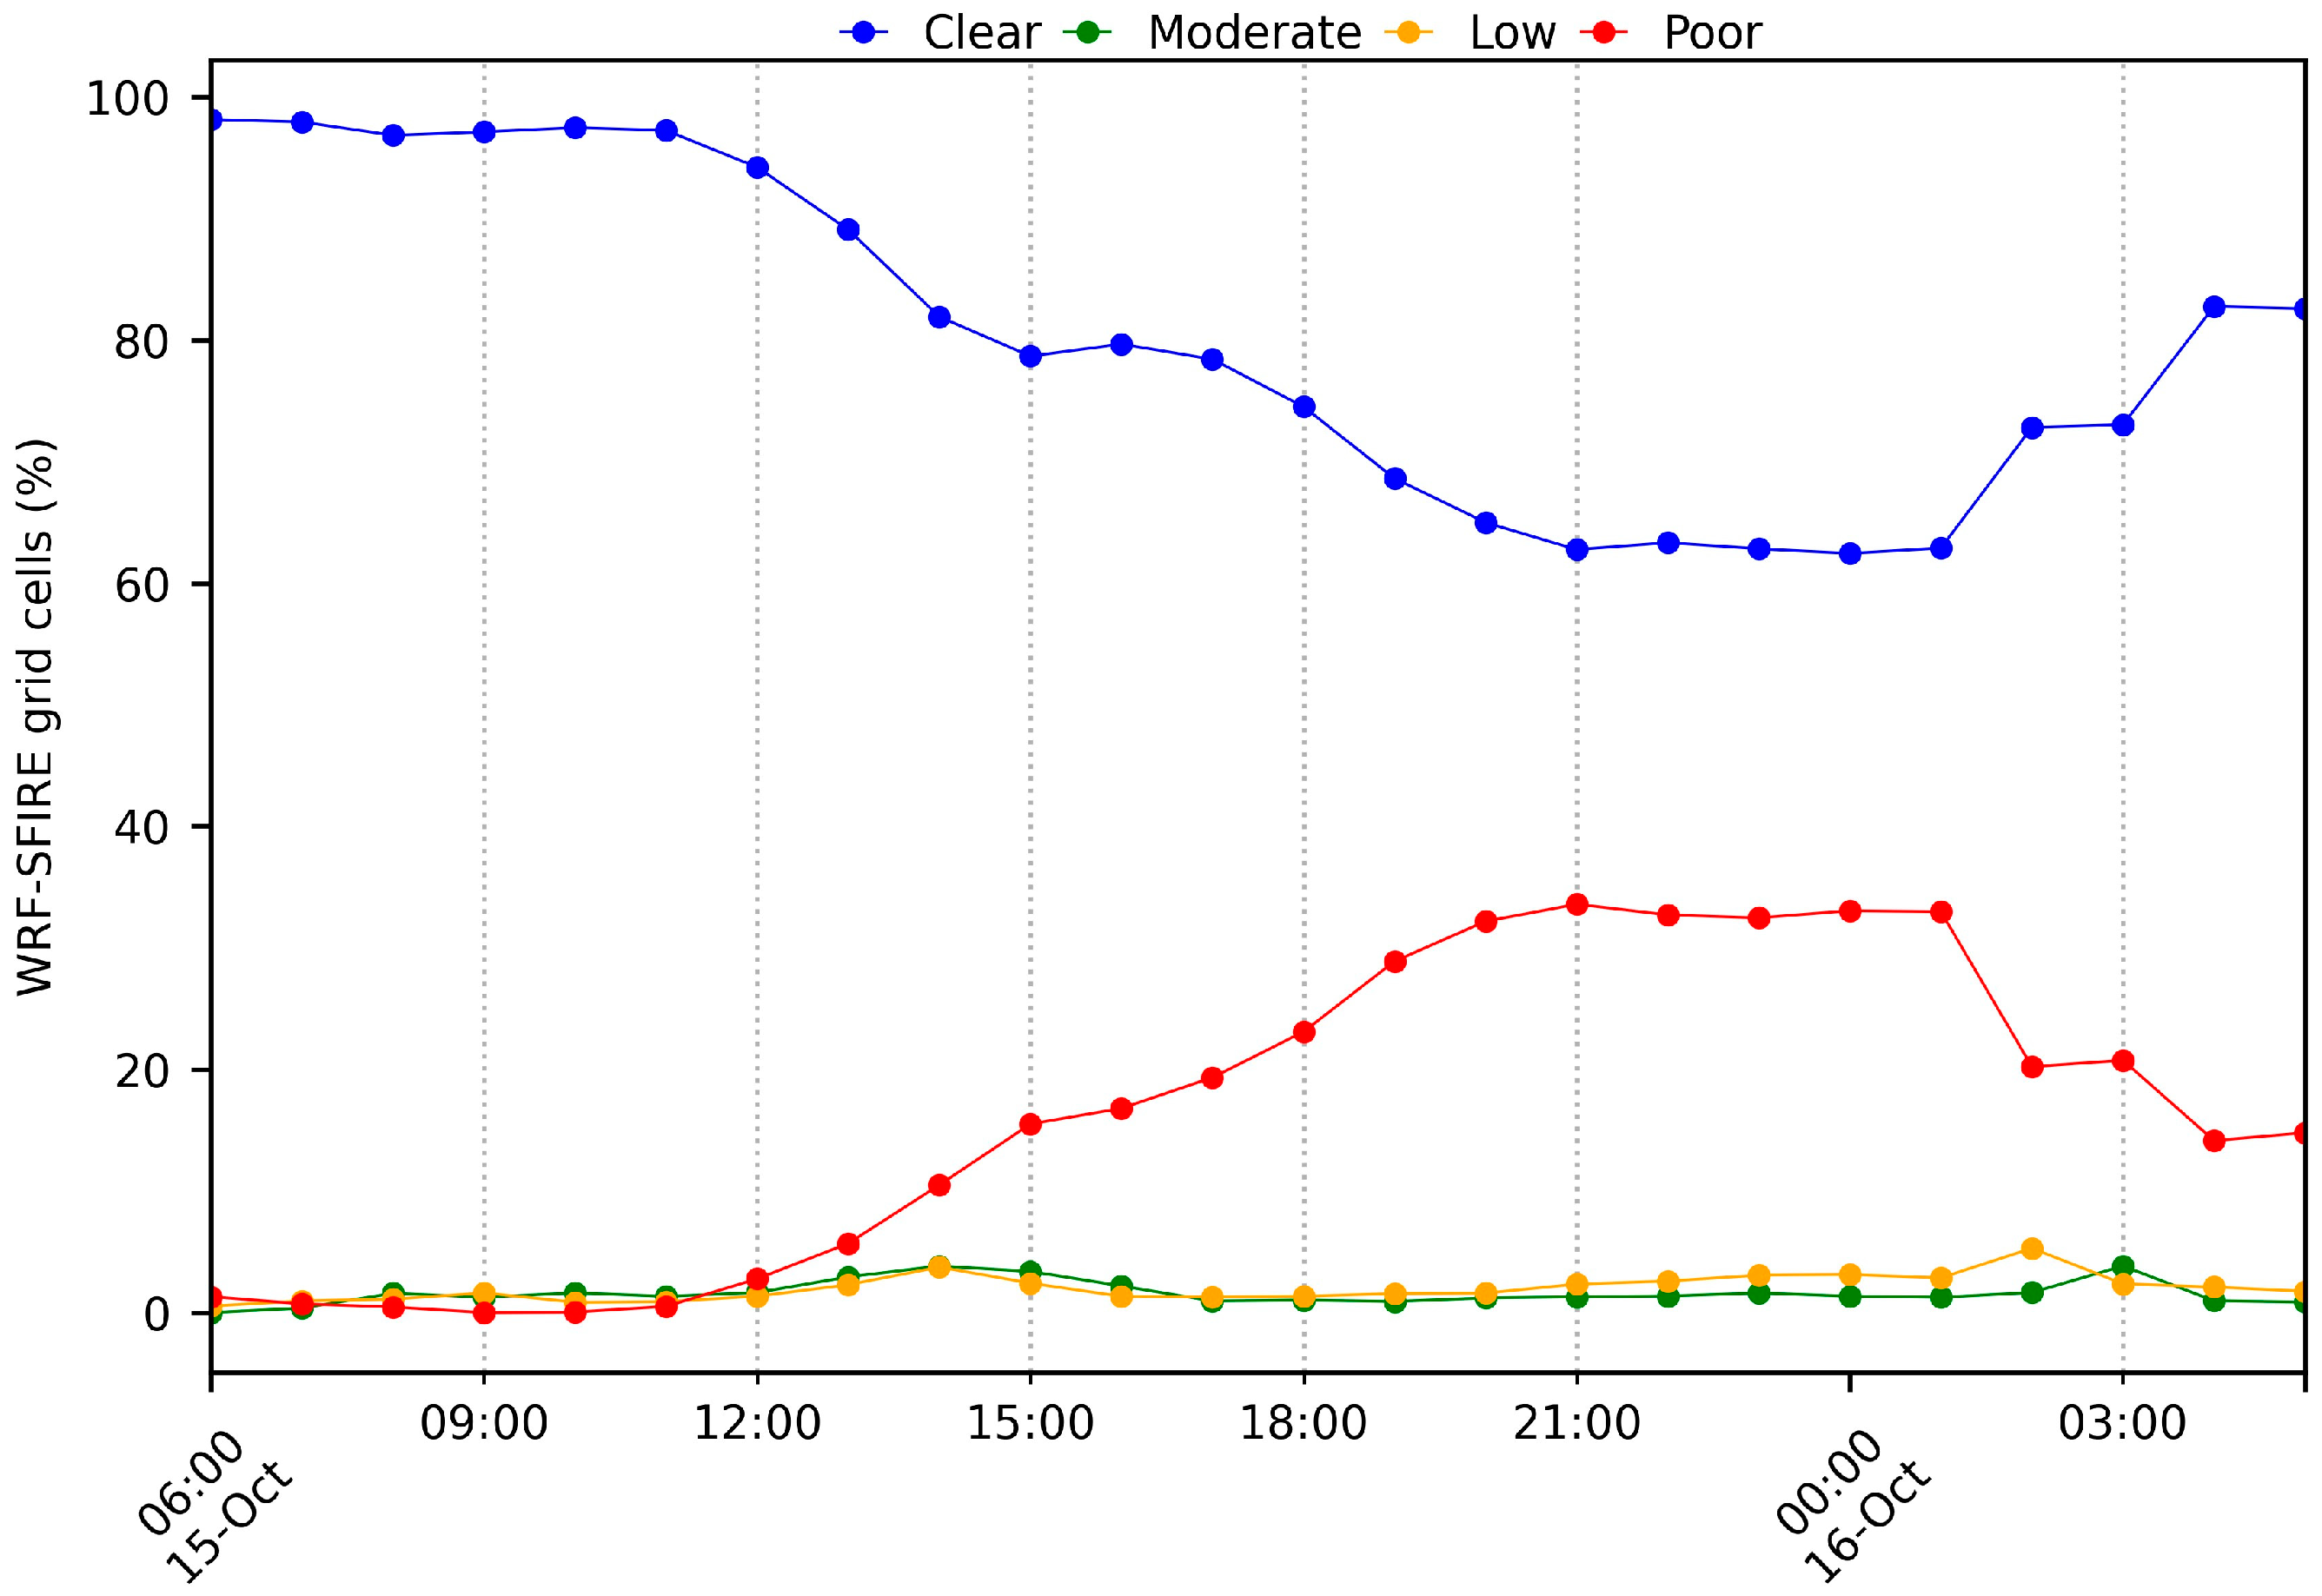
4.3. Visibility
5. Discussion
6. Conclusions
Author Contributions
Funding
Institutional Review Board Statement
Informed Consent Statement
Data Availability Statement
Conflicts of Interest
Appendix A


| Station | Ambient Environment | Influence | Altitude (m) | Longitude (°) | Latitude (°) |
|---|---|---|---|---|---|
| EST | Suburban | Background | 14 | −8.56716 | 40.7586 |
| AVE | Urban | Traffic | 16 | −8.64801 | 40.6372 |
| ILH | Suburban | Background | 14 | −8.67203 | 40.5909 |
| ERV | Rural | Background | 68 | −8.89294 | 39.9246 |
| Pollutant | r (-) | RMSE (µg/m3) | MB (µg/m3) | Average (µg/m3) | Temporal Resolution | Model | Region | Reference | |
|---|---|---|---|---|---|---|---|---|---|
| Model | Obs | ||||||||
| PM10 | - | - | - | 431–812 | 486 | Hourly | DISPERFIRE | Central Portugal | [7] |
| PM10 | - | 11.10 | −16.09 | - | - | Hourly | LOTOS-EUROS + FLUENT | Coimbra, Portugal | [12] |
| PM10 | 0.78 | 32.22 | −14.75 | - | - | - | CHIMERE | Portugal | [83] |
| PM10 | 0.63 | 15.02 | −30.35 | - | - | - | LOTOS-EUROS | Portugal | |
| PM10 | 0.88 | 70 | - | - | - | Daily | CHIMERE | Russia | [84] |
| PM10 | - | 19.3 | 29.2 | - | - | Hourly | LOTOS-EUROS | Portugal | [57] |
| PM10 | - | 17.0 | 20.7 | - | - | Hourly | LOTOS-EUROS | Portugal | [57] |
| PM2.5 | 0.40 | - | - | - | - | Daily | BlueSky | British Columbia, Canada | [85] |
| PM2.5 | 0.75 | - | - | - | - | Daily | FireWork | British Columbia, Canada | [86] |
| PM2.5 | 0.58 | - | - | - | - | Daily | BlueSky | British Columbia, Canada | |
| PM2.5 | 0.16 | - | −2.09 | 7.16 | - | Hourly | RAQDPS | North America | [82] |
| PM2.5 | 0.41 | - | −0.88 | 8.37 | - | Hourly | FireWork | North America | |
| PM2.5 | 0.19 | 11.90 | −1.80 | - | - | Hourly | ARQI | Washington State, USA | [87] |
| PM2.5 | 0.28 | 24.90 | −1.18 | - | - | Hourly | HRRR-Smoke | ||
| PM2.5 | 0.19 | 10.70 | −2.34 | - | - | Hourly | AIRPACT | ||
| PM2.5 | 0.10 | 42.90 | 3.38 | - | - | Hourly | UCLA WRF-Chem | ||
| PM2.5 | 0.09 | 33.90 | 4.66 | - | - | Hourly | UIOWA WRF-Chem | ||
| PM2.5 | 0.04 | 16.00 | 3.28 | - | - | Hourly | WISC WRF-Chem | ||
| PM2.5 | 0.35 | 10.80 | −0.32 | - | - | Hourly | FireWork | ||
| PM2.5 | 0.26 | 10.40 | 0.02 | - | - | Hourly | NAQFC | ||
| PM2.5 | 0.21 | 10.80 | −5.78 | - | - | Hourly | NCAR WRF-Chem | ||
| PM2.5 | 0.16 | 29.70 | 5.07 | - | - | Hourly | GEOS-FP | ||
| PM2.5 | 0.29 | 12.50 | 5.51 | - | - | Hourly | CAMS | ||
| PM2.5 | 0.11 | 9.80 | −0.44 | - | - | Hourly | RAQMS | ||
| PM2.5 | 0.15 | 32 | −11.1 | 12 | 23 | Daily | RAQDPS | Western Canada | [81] |
| PM2.5 | 0.57 | 101 | 21.1 | 44 | 23 | Daily | FW-Ops | ||
| PM2.5 | 0.64 | 39 | 5.8 | 29 | 23 | Daily | FW-CFFEPS | ||
| PM2.5 | 0.24 | 16 | 1.7 | 15 | 14 | Daily | RAQDPS | Eastern Canada | |
| PM2.5 | 0.26 | 16 | 2.3 | 16 | 14 | Daily | FW-Ops | ||
| PM2.5 | 0.26 | 16 | 2.9 | 17 | 14 | Daily | FW-CFFEPS | ||
| PM2.5 | 0.17 | 29 | −8.0 | 15 | 23 | Daily | RAQDPS | Western USA | |
| PM2.5 | 0.49 | 164 | 21.1 | 44 | 23 | Daily | FW-Ops | ||
| PM2.5 | 0.59 | 64 | 8.6 | 31 | 23 | Daily | FW-CFFEPS | ||
| PM2.5 | 0.23 | 14 | 1.9 | 18 | 17 | Daily | RAQDPS | Eastern USA | |
| PM2.5 | 0.23 | 14 | 2.1 | 19 | 17 | Daily | FW-Ops | ||
| PM2.5 | 0.24 | 14 | 2.8 | 19 | 17 | Daily | FW-CFFEPS | ||
References
- Turco, M.; Jerez, S.; Augusto, S.; Tarín-Carrasco, P.; Ratola, N.; Jiménez-Guerrero, P.; Trigo, R.M. Climate drivers of the 2017 devastating fires in Portugal. Sci. Rep. 2019, 9, 13886. [Google Scholar] [CrossRef] [PubMed]
- Turquety, S.; Menut, L.; Siour, G.; Mailler, S.; Hadji-Lazaro, J.; George, M.; Clerbaux, C.; Hurtmans, D.; Coheur, P.-F. APIFLAME v2.0 biomass burning emissions model: Impact of refined input parameters on atmospheric concentration in Portugal in summer 2016. Geosci. Model Dev. 2020, 13, 2981–3009. [Google Scholar] [CrossRef]
- Sebastião, R.; Sorte, S.; Valente, J.; Miranda, A.I.; Fernandes, J.M. Detecting changes in the heart rate of firefighters to prevent smoke inhalation and health effects. Evol. Syst. 2019, 10, 295–304. [Google Scholar] [CrossRef]
- D’Evelyn, S.M.; Jung, J.; Alvarado, E.; Baumgartner, J.; Caligiuri, P.; Hagmann, R.K.; Henderson, S.B.; Hessburg, P.F.; Hopkins, S.; Kasner, E.J.; et al. Wildfire, Smoke Exposure, Human Health, and Environmental Justice Need to be Integrated into Forest Restoration and Management. Curr. Environ. Health Rep. 2022, 9, 366–385. [Google Scholar] [CrossRef]
- Miranda, A.I.; Martins, V.; Cascão, P.; Amorim, J.H.; Valente, J.; Tavares, R.; Borrego, C.; Tchepel, O.; Ferreira, A.J.; Cordeiro, C.R.; et al. Monitoring of firefighters exposure to smoke during fire experiments in Portugal. Environ. Int. 2010, 36, 736–745. [Google Scholar] [CrossRef]
- Miranda, A.I.; Martins, V.; Casco, P.; Amorim, J.H.; Valente, J.; Borrego, C.; Ferreira, A.J.; Cordeiro, C.R.; Viegas, D.X.; Ottmar, R. Wildland smoke exposure values and exhaled breath indicators in firefighters. J. Toxicol. Environ. Health—Part A Curr. Issues 2012, 75, 831–843. [Google Scholar] [CrossRef]
- Valente, J.; Miranda, A.I.; Lopes, A.G.; Borrego, C.; Viegas, D.X.; Lopes, M. Local-scale modelling system to simulate smoke dispersion. Int. J. Wildl. Fire 2007, 16, 196–203. [Google Scholar] [CrossRef]
- Hyslop, N.P. Impaired visibility: The air pollution people see. Atmos. Environ. 2009, 43, 182–195. [Google Scholar] [CrossRef]
- Andreae, A.O.; Merlet, P. Emission of trace gases and aerosols from biomass burning. Glob. Biogeochem. Cycles 2001, 15, 955–966. [Google Scholar] [CrossRef]
- Crutzen, P.J.; Heidt, L.E.; Krasnec, J.P.; Pollock, W.H.; Seiler, W. Biomass burning as a source of atmospheric gases CO, H2, N2O, NO, CH3Cl and COS. Nature 1979, 282, 253–256. [Google Scholar] [CrossRef]
- (World Health Organization) WHO. Health Guidelines for Vegetation Fire Events; WHO: Geneva, Switzerland, 1999; Available online: https://gfmc.online/wp-content/uploads/WHO-Guidelines-Vegetation-Fire-Events-1999.pdf (accessed on 22 September 2024).
- Miranda, A.I.; Amorim, J.H.; Martins, V.; Pimentel, C.; Rodrigues, R.; Tavares, R.; Borrego, C. Numerical modelling of the impact of wildland-urban interface fires on Coimbra air quality. In WIT Transactions on Ecology and the Environment; WIT Press: Southampton, UK, 2008; Volume 119, pp. 333–342. [Google Scholar]
- Ager, A.A.; Palaiologou, P.; Evers, C.R.; Day, M.A.; Ringo, C.; Short, K. Wildfire exposure to the wildland urban interface in the western US. Appl. Geogr. 2019, 111, 102059. [Google Scholar] [CrossRef]
- Elliott, C.T.; Henderson, S.B.; Wan, V. Time series analysis of fine particulate matter and asthma reliever dispensations in populations affected by forest fires. Environ. Health A Glob. Access Sci. Source 2013, 12, 11. [Google Scholar] [CrossRef]
- Cascio, W.E. Wildland fire smoke and human health. Sci. Total Environ. 2018, 624, 586–595. [Google Scholar] [CrossRef]
- Haikerwal, A.; Akram, M.; Sim, M.R.; Meyer, M.; Abramson, M.J.; Dennekamp, M. Fine particulate matter (PM2.5) exposure during a prolonged wildfire period and emergency department visits for asthma. Respirology 2016, 21, 88–94. [Google Scholar] [CrossRef]
- Reid, C.E.; Brauer, M.; Johnston, F.H.; Jerrett, M.; Balmes, J.R.; Elliott, C.T. Critical review of health impacts of wildfire smoke exposure. Environ. Health Perspect. 2016, 124, 1334–1343. [Google Scholar] [CrossRef]
- Black, C.; Tesfaigzi, Y.; Bassein, J.A.; Miller, L.A. Wildfire smoke exposure and human health: Significant gaps in research for a growing public health issue. Environ. Toxicol. Pharmacol. 2017, 55, 186–195. [Google Scholar] [CrossRef]
- Haikerwal, A.; Akram, M.; Del Monaco, A.; Smith, K.; Sim, M.R.; Meyer, M.; Tonkin, A.M.; Abramson, M.J.; Dennekamp, M. Impact of fine particulate matter (PM2.5) exposure during wildfires on cardiovascular health outcomes. J. Am. Heart Assoc. 2015, 4, e001653. [Google Scholar] [CrossRef]
- Wettstein, Z.S.; Hoshiko, S.; Fahimi, J.; Harrison, R.J.; Cascio, W.E.; Rappold, A.G. Cardiovascular and cerebrovascular emergency department visits associated with wildfire smoke exposure in California in 2015. J. Am. Heart Assoc. 2018, 7, e007492. [Google Scholar] [CrossRef]
- Yao, J.; Eyamie, J.; Henderson, S.B. Evaluation of a spatially resolved forest fire smoke model for population-based epidemiologic exposure assessment. J. Expo. Sci. Environ. Epidemiol. 2016, 26, 233–240. [Google Scholar] [CrossRef]
- Pope, C.A.; Dockery, D.W. Health effects of fine particulate air pollution: Lines that connect. J. Air Waste Manag. Assoc. 2006, 56, 709–742. [Google Scholar] [CrossRef]
- Brook, R.D.; Rajagopalan, S.; Pope, C.A.; Brook, J.R.; Bhatnagar, A.; Diez-Roux, A.V.; Holguin, F.; Hong, Y.; Luepker, R.V.; Mittleman, M.A.; et al. Particulate matter air pollution and cardiovascular disease: An update to the scientific statement from the american heart association. Circulation 2010, 121, 2331–2378. [Google Scholar] [CrossRef] [PubMed]
- Suh, H.H.; Zanobetti, A.; Schwartz, J.; Coull, B.A. Chemical properties of air pollutants and cause-specific hospital admissions among the elderly in Atlanta, Georgia. Environ. Health Perspect. 2011, 119, 1421–1428. [Google Scholar] [CrossRef] [PubMed]
- Wegesser, T.C.; Pinkerton, K.E.; Last, J.A. California wildfires of 2008: Coarse and fine particulate matter toxicity. Environ. Health Perspect. 2009, 117, 893–897. [Google Scholar] [CrossRef]
- Zanobetti, A.; Schwartz, J. The effect of fine and coarse particulate air pollution on mortality: A national analysis. Environ. Health Perspect. 2009, 117, 898–903. [Google Scholar] [CrossRef]
- Martinelli, N.; Olivieri, O.; Girelli, D. Air particulate matter and cardiovascular disease: A narrative review. Eur. J. Intern. Med. 2013, 24, 295–302. [Google Scholar] [CrossRef]
- Sun, Q.; Hong, X.; Wold, L.E. Cardiovascular effects of ambient particulate air pollution exposure. Circulation 2010, 121, 2755–2765. [Google Scholar] [CrossRef]
- Hassing, C.; Twickler, M.; Brunekreef, B.; Cassee, F.; Doevendans, P.; Kastelein, J.; Cramer, M.J. Particulate air pollution, coronary heart disease and individual risk assessment: A general overview. Eur. J. Prev. Cardiol. 2009, 16, 10–15. [Google Scholar] [CrossRef]
- Gold, D.R.; Mittleman, M.A. New insights into pollution and the cardiovascular system: 2010 to 2012. Circulation 2013, 127, 1903–1913. [Google Scholar] [CrossRef]
- Rappold, A.G.; Reyes, J.; Pouliot, G.; Cascio, W.E.; Diaz-Sanchez, D. Community Vulnerability to Health Impacts of Wildland Fire Smoke Exposure. Environ. Sci. Technol. 2017, 51, 6674–6682. [Google Scholar] [CrossRef]
- Miranda, A.I. An integrated numerical system to estimate air quality effects of forest fires. Int. J. Wildl. Fire 2004, 13, 217–226. [Google Scholar] [CrossRef]
- Fernandes, A.P.; Lopes, D.; Sorte, S.; Monteiro, A.; Gama, C.; Reis, J.; Menezes, I.; Osswald, T.; Borrego, C.; Almeida, M.; et al. Smoke emissions from the extreme wildfire events in central Portugal in October 2017. Int. J. Wildl. Fire 2022, 31, 989–1001. [Google Scholar] [CrossRef]
- Barbosa, J.V.; Nunes, R.A.O.; Alvim-Ferraz, M.C.M.; Martins, F.G.; Sousa, S.I.V. Health and Economic Burden of the 2017 Portuguese Extreme Wildland Fires on Children. Int. J. Environ. Res. Public Health 2022, 19, 593. [Google Scholar] [CrossRef] [PubMed]
- Augusto, S.; Ratola, N.; Tarín-Carrasco, P.; Jiménez-Guerrero, P.; Turco, M.; Schuhmacher, M.; Costa, S.; Teixeira, J.P.; Costa, C. Population exposure to particulate-matter and related mortality due to the Portuguese wildfires in October 2017 driven by storm Ophelia. Environ. Int. 2020, 144, 106056. [Google Scholar] [CrossRef] [PubMed]
- (Agência Portuguesa do Ambiente) APA. Identificação e Avaliação da Ocorrência de Eventos Naturais em Portugal em 2017. 2018. Available online: https://apambiente.pt/sites/default/files/_Ar_Ruido/Ar/QualidadeAr/RelatoriosEventos/Relatorio_Eventos%20Naturais_2017.pdf (accessed on 22 September 2024).
- Viegas, D.X.; Almeida, M.A.; Ribeiro, L.M.; Raposo, J.; Viegas, M.T.; Oliveira, R.; Alves, D.; Pinto, C.; Rodrigues, A.; Ribeiro, C.; et al. Análise dos Incêndios Florestais Ocorridos a 15 de Outubro de 2017. 2019. Available online: https://www.portugal.gov.pt/pt/gc21/comunicacao/documento?i=analise-dos-incendios-florestais-ocorridos-a-15-de-outubro-de-2017 (accessed on 22 September 2024).
- Viegas, X.; Almeida, M.F.; Ribeiro, L.M.; Raposo, J.; Viegas, M.T.; Oliveira, R.; Alves, D.; Pinto, C.; Humberto, J.; Rodrigues, A.; et al. O Complexo De Incêndios De Pedrógão Grande E Concelhos Limítrofes, Iniciado a 17 De Junho De 2017. 2017. Available online: https://www.portugal.gov.pt/pt/gc21/comunicacao/documento?i=o-complexo-de-incendios-de-pedrogao-grande-e-concelhos-limitrofes-iniciado-a-17-de-junho-de-2017 (accessed on 22 September 2024).
- Tarín-Carrasco, P.; Augusto, S.; Palacios-Penã, L.; Ratola, N.; Jiménez-Guerrero, P. Impact of large wildfires on PM10 levels and human mortality in Portugal. Nat. Hazards Earth Syst. Sci. 2021, 21, 2867–2880. [Google Scholar] [CrossRef]
- Guerreiro, J.; Fonseca, C.; Salgueiro, A.; Fernandes, P.; Lopez, I.E.; de Neufville, D.; Mateus, F.; Castellnou, R.M.; Sande, S.J.; Moura, J.M.; et al. Avaliação dos Incêndios Ocorridos Entre 14 e 16 de Outubro de 2017 em Portugal Continental; 2018. Available online: https://www.portugal.gov.pt/download-ficheiros/ficheiro.aspx?v=%3d%3dBAAAAB%2bLCAAAAAAABAAzMzQ2AABaoh8DBAAAAA%3d%3d (accessed on 22 September 2024).
- Change, N.C. Spreading like wildfire. Nat. Clim. Chang. 2017, 7, 755. [Google Scholar] [CrossRef]
- Sánchez-Benítez, A.; García-Herrera, R.; Barriopedro, D.; Sousa, P.M.; Trigo, R.M. June 2017: The Earliest European Summer Mega-heatwave of Reanalysis Period. Geophys. Res. Lett. 2018, 45, 1955–1962. [Google Scholar] [CrossRef]
- Skamarock, W.C.; Klemp, J.B.; Dudhi, J.; Gill, D.O.; Barker, D.M.; Duda, M.G.; Huang, X.-Y.; Wang, W.; Powers, J.G. A Description of the Advanced Research WRF Version 3; UCAR: Boulder, CO, USA, 2008. [Google Scholar] [CrossRef]
- Mandel, J.; Beezley, J.D.; Kochanski, A.K. Coupled atmosphere-wildland fire modeling with WRF 3.3 and SFIRE 2011. Geosci. Model Dev. 2011, 4, 591–610. [Google Scholar] [CrossRef]
- Monteiro, A.; Ferreira, J.; Ribeiro, I.; Fernandes, A.P.; Martins, H.; Gama, C.; Miranda, A.I. Air quality over Portugal in 2020. Atmos. Pollut. Res. 2015, 6, 788–796. [Google Scholar] [CrossRef]
- Carvalho, D.; Rocha, A.; Gómez-Gesteira, M.; Santos, C. A sensitivity study of the WRF model in wind simulation for an area of high wind energy. Environ. Model. Softw. 2012, 33, 23–34. [Google Scholar] [CrossRef]
- Morrison, H.; Thompson, G.; Tatarskii, V. Impact of cloud microphysics on the development of trailing stratiform precipitation in a simulated squall line: Comparison of one- and two-moment schemes. Mon. Weather Rev. 2009, 137, 991–1007. [Google Scholar] [CrossRef]
- Mlawer, E.J.; Taubman, S.J.; Brown, P.D.; Iacono, M.J.; Clough, S.A. Radiative transfer for inhomogeneous atmospheres: RRTM, a validated correlated-k model for the longwave. J. Geophys. Res. 1997, 102, 16663. [Google Scholar] [CrossRef]
- Zhang, D.; Anthes, R.A. A high-resolution model of the planetary boundary layer—Sensitivity tests and comparisons with SESAME-79 data. J. Appl. Meteorol. 1982, 21, 1594–1609. [Google Scholar] [CrossRef]
- Chen, F.; Dudhia, J. Coupling an Advanced Land Surface–Hydrology Model with the Penn State–NCAR MM5 Modeling System. Part I: Model Implementation and Sensitivity. Mon. Weather Rev. 2001, 129, 587–604. [Google Scholar] [CrossRef]
- Mellor, G.L.; Yamada, T. Development of a turbulence closure model for geophysical fluid problems. Rev. Geophys. 1982, 20, 851–875. [Google Scholar] [CrossRef]
- Grell, G.A.; Freitas, S.R. A scale and aerosol aware stochastic convective parameterization for weather and air quality modeling. Atmos. Chem. Phys. 2014, 14, 5233–5250. [Google Scholar] [CrossRef]
- (European Centre for Medium-Range Weather Forecasts) ECMWF. European Centre for Medium-Range Weather Forecasts Re-Analysis Interim Model Data. 2019. Available online: https://www.ecmwf.int/en/forecasts/datasets/reanalysis-datasets/era-interim (accessed on 2 November 2019).
- (Instituto da Conservação da Natureza e das Florestas) ICNF. IFN6—Inventário Florestal Nacional 6. 2019. Available online: https://www.icnf.pt/florestas/flestudosdocumentosestatisticasindicadores (accessed on 5 December 2019).
- Alves, C.; Vicente, A.; Nunes, T.; Gonçalves, C.; Fernandes, A.P.; Mirante, F.; Tarelho, L.; Sánchez de la Campa, A.M.; Querol, X.; Caseiro, A.; et al. Summer 2009 wildfires in Portugal: Emission of trace gases and aerosol composition. Atmos. Environ. 2011, 45, 641–649. [Google Scholar] [CrossRef]
- van der Werf, G.R.; Randerson, J.T.; Giglio, L.; Collatz, G.J.; Mu, M.; Kasibhatla, P.S.; Morton, D.C.; Defries, R.S.; Jin, Y.; Van Leeuwen, T.T. Global fire emissions and the contribution of deforestation, savanna, forest, agricultural, and peat fires (1997–2009). Atmos. Chem. Phys. 2010, 10, 11707–11735. [Google Scholar] [CrossRef]
- Martins, V.; Miranda, A.I.; Carvalho, A.; Schaap, M.; Borrego, C.; Sá, E. Impact of forest fires on particulate matter and ozone levels during the 2003, 2004 and 2005 fire seasons in portugal. Sci. Total Environ. 2012, 414, 53–62. [Google Scholar] [CrossRef]
- Vicente, A.; Alves, C.; Monteiro, C.; Nunes, T.; Mirante, F.; Cerqueira, M.; Calvo, A.; Pio, C. Organic speciation of aerosols from wildfires in central Portugal during summer 2009. Atmos. Environ. 2012, 57, 186–196. [Google Scholar] [CrossRef]
- Vicente, A.; Calvo, A.; Fernandes, A.P.; Nunes, T.; Monteiro, C.; Pio, C.; Alves, C. Hydrocarbons in particulate samples from wildfire events in central Portugal in summer 2010. J. Environ. Sci. 2017, 53, 122–131. [Google Scholar] [CrossRef]
- Costa, S.; Ferreira, J.; Silveira, C.; Costa, C.; Lopes, D.; Relvas, H.; Borrego, C.; Roebeling, P.; Miranda, A.I.; Paulo Teixeira, J. Integrating health on air quality assessment—Review report on health risks of two major european outdoor air pollutants: PM and NO2. J. Toxicol. Environ. Health—Part B Crit. Rev. 2014, 17, 307–340. [Google Scholar] [CrossRef] [PubMed]
- Breysse, P.N.; Delfino, R.J.; Dominici, F.; Elder, A.C.P.; Frampton, M.W.; Froines, J.R.; Geyh, A.S.; Godleski, J.J.; Gold, D.R.; Hopke, P.K.; et al. US EPA particulate matter research centers: Summary of research results for 2005-2011. Air Qual. Atmos. Health 2013, 6, 333–355. [Google Scholar] [CrossRef]
- Seethaler, R.K.; Künzli, N.; Sommer, H.; Chanel, O.; Herry, M.; Masson, S.; Vernaud, J.-C.; Filliger, P.; Horak, F.J.; Kaiser, R.; et al. Economic costs of air pollution-related health impacts: An impact assessment project of Austria, France and Switzerland. Clean Air Environ. Qual. 2003, 37, 35–43. [Google Scholar]
- WHO. New Emerging Risks to Health from Air Pollution—Results from the Survey of Experts, Health Risks of Air Pollution in Europe—HRAPIE Project; World Health Organization: Copenhagen, Denmark, 2013. [Google Scholar]
- Rückerl, R.; Schneider, A.; Breitner, S.; Cyrys, J.; Peters, A. Health effects of particulate air pollution: A review of epidemiological evidence. Inhal. Toxicol. 2011, 23, 555–592. [Google Scholar] [CrossRef]
- Héroux, M.-E.; Anderson, H.R.; Atkinson, R.; Brunekreef, B.; Cohen, A.; Forastiere, F.; Hurley, F.; Katsouyanni, K.; Krewski, D.; Krzyzanowski, M.; et al. Quantifying the health impacts of ambient air pollutants: Recommendations of a WHO/Europe project. Int. J. Public Health 2015, 60, 619–627. [Google Scholar] [CrossRef]
- WHO. Recommendations for Concentration—Response Functions for Cost–Benefit Analysis of Particulate Matter, Ozone and Nitrogen Dioxide, Health Risks of Air Pollution in Europe—HRAPIE Project; World Health Organization: Copenhagen, Denmark, 2013. [Google Scholar]
- (World Health Organization) WHO. Health Risks of Air Pollution in Europe—HRAPIE Project; World Health Organization: Copenhagen, Denmark, 2013. [Google Scholar] [CrossRef]
- (National Health Service) NHS. Morbilidade e Mortalidade Hospitalar por Instituição. 2022. Available online: https://transparencia.sns.gov.pt/explore/dataset/morbilidade-e-mortalidade-hospitalar/table/?sort=periodo (accessed on 18 October 2022).
- (Instituto Nacional de Estatística) INE. Statistics Portugal, 2011. CENSUS, 2011—Statistical Data for Portugal. 2011. Available online: http://censos.ine.pt (accessed on 10 December 2020).
- (World Health Organization) WHO. AirQ+: Software Tool for Health Risk Assessment of Air Pollution. 2022. Available online: https://www.who.int/europe/tools-and-toolkits/airq---software-tool-for-health-risk-assessment-of-air-pollution (accessed on 18 October 2022).
- Cheng, Y.C.; Liang, C.S.; Syu, J.Y.; Chang, Y.Y.; Yan, Y.L.; Chen, S.J.; Chen, C.C.; Lin, W.Y. Characteristics of aerosol extinction coefficient in Taipei metropolitan atmosphere. Aerosol Air Qual. Res. 2015, 15, 1823–1835. [Google Scholar] [CrossRef]
- Eidels-Dubovoi, S. Aerosol impacts on visible light extinction in the atmosphere of Mexico City. Sci. Total Environ. 2002, 287, 213–220. [Google Scholar] [CrossRef]
- Heisler, S.L. Visibility Impairment in Phoenix; ENSR Document 0493-018-23; Arizona Department of Environmental Quality: Phoenix, AZ, USA, 2002. [Google Scholar]
- Pitchford, M.L.; Malm, W.C. Development and applications of a standard visual index. Atmos. Environ. 1994, 28, 1049–1054. [Google Scholar] [CrossRef]
- Qu, W.J.; Wang, J.; Zhang, X.Y.; Wang, D.; Sheng, L.F. Influence of relative humidity on aerosol composition: Impacts on light extinction and visibility impairment at two sites in coastal area of China. Atmos. Res. 2015, 153, 500–511. [Google Scholar] [CrossRef]
- Li, L.; Chen, C.H.; Fu, J.S.; Huang, C.; Streets, D.G.; Huang, H.Y.; Zhang, G.F.; Wang, Y.J.; Jang, C.J.; Wang, H.L.; et al. Air quality and emissions in the Yangtze River Delta, China. Atmos. Chem. Phys. 2011, 11, 1621–1639. [Google Scholar] [CrossRef]
- Brunner, J.; Pierce, R.B.; Lenzen, A. Development and validation of satellite-based estimates of surface visibility. Atmos. Meas. Tech. 2016, 9, 409–422. [Google Scholar] [CrossRef]
- (Agência Portuguesa do Ambiente) APA. QUALAR—Informação Sobre Qualidade do ar. 2017. Available online: https://qualar.apambiente.pt/ (accessed on 18 January 2023).
- Bossioli, E.; Peter, B.; Bruce, D.; Deserti, M.; John, D.; Fay, B.; Geertsema, G.; Marko, K.; Labancz, K.; Volker, M.; et al. Overview of Tools and Methods for Meteorological and Air Pollution Mesoscale Model Evaluation and User Training. Join Rep. COST Action 2008, 728, 25–26. [Google Scholar]
- (Serviço Nacional de Saúde) SNS. Morbilidade e Mortalidade Hospitalar por Instituição. 2017. Available online: https://transparencia.sns.gov.pt/ (accessed on 27 July 2021).
- Chen, J.; Anderson, K.; Pavlovic, R.; Moran, M.D.; Englefield, P.; Thompson, D.K.; Munoz-Alpizar, R.; Landry, H. The FireWork v2.0 air quality forecast system with biomass burning emissions from the Canadian Forest Fire Emissions Prediction System v2.03. Geosci. Model Dev. 2019, 12, 3283–3310. [Google Scholar] [CrossRef]
- Pavlovic, R.; Chen, J.; Anderson, K.; Moran, M.D.; Beaulieu, P.A.; Davignon, D.; Cousineau, S. The FireWork air quality forecast system with near-real-time biomass burning emissions: Recent developments and evaluation of performance for the 2015 North American wildfire season. J. Air Waste Manag. Assoc. 2016, 66, 819–841. [Google Scholar] [CrossRef]
- Miranda, A.I.; Monteiro, A.; Martins, V.; Carvalho, A.; Schaap, M.; Builtjes, P.; Borrego, C. Forest fires impact on air quality over Portugal. In NATO Science for Peace and Security Series C: Environmental Security; Springer: Berlin/Heidelberg, Germany, 2008; pp. 190–198. [Google Scholar] [CrossRef]
- Konovalov, I.B.; Beekmann, M.; Kuznetsova, I.N.; Yurova, A.; Zvyagintsev, A.M. Atmospheric impacts of the 2010 Russian wildfires: Integrating modelling and measurements of an extreme air pollution episode in the Moscow region. Atmos. Chem. Phys. 2011, 11, 10031–10056. [Google Scholar] [CrossRef]
- Yao, J.; Brauer, M.; Henderson, S.B. Evaluation of a wildfire smoke forecasting system as a tool for public health protection. Environ. Health Perspect. 2013, 121, 1142–1147. [Google Scholar] [CrossRef]
- Yuchi, W.; Yao, J.; McLean, K.E.; Stull, R.; Pavlovic, R.; Davignon, D.; Moran, M.D.; Henderson, S.B. Blending forest fire smoke forecasts with observed data can improve their utility for public health applications. Atmos. Environ. 2016, 145, 308–317. [Google Scholar] [CrossRef]
- Ye, X.; Arab, P.; Ahmadov, R.; James, E.; Grell, G.A.; Pierce, B.; Kumar, A.; Makar, P.; Chen, J.; Davignon, D.; et al. Evaluation and intercomparison of wildfire smoke forecasts from multiple modeling systems for the 2019 Williams Flats fire. Atmos. Chem. Phys. 2021, 21, 14427–14469. [Google Scholar] [CrossRef]
- Arregocés, H.A.; Rojano, R.; Restrepo, G. Health risk assessment for particulate matter: Application of AirQ+ model in the northern Caribbean region of Colombia. Air Qual. Atmos. Health 2023, 16, 897–912. [Google Scholar] [CrossRef]
- Zhao, X.; Wu, T.; Zhou, W.; Han, L.; Neophytou, A.M. Reducing air pollution does not necessarily reduce related adults’ mortality burden: Variations in 177 countries with different economic levels. Sci. Total Environ. 2024, 933, 173037. [Google Scholar] [CrossRef]
- Gouveia, N.; Rodriguez-Hernandez, J.L.; Kephart, J.L.; Ortigoza, A.; Betancourt, R.M.; Sangrador, J.L.T.; Rodriguez, D.A.; Diez Roux, A.V.; Sanchez, B.; Yamada, G. Short-term associations between fine particulate air pollution and cardiovascular and respiratory mortality in 337 cities in Latin America. Sci. Total Environ. 2024, 920, 171073. [Google Scholar] [CrossRef]
| Pollutant | Health Endpoint | C0 | β (95% CI) per 10 µg/m3 |
|---|---|---|---|
| PM2.5 | Hospital admissions, respiratory disease, 0+ years | >25 µg/m3 | 2.91 × 10⁻² (95% CI: 0–6.10 × 10⁻²) |
| Hospital admissions: CVD (including stroke), 0+ years | 1.40 × 10⁻² (95% CI: 2.63 × 10⁻³–2.55 × 10⁻²) |
| Deciviews (dV) | Visibility Classes | Visual Range (km) |
|---|---|---|
| ≤25 dV | Clear | ≥30 km |
| 25 < dV ≤ 36 | Moderate | 10 ≤ km < 30 |
| 36 < dV ≤ 52 | Low | 2 ≤ km < 10 |
| >52 dV | Poor | <2 km |
| Pollutant | Station | r (-) | RMSE (µg/m3) | MB (µg/m3) | Average (µg/m3) | |
|---|---|---|---|---|---|---|
| WRF-SFIRE | Obs | |||||
| PM10 | EST | 0.54 | 215 | 17 | 114 | 97 |
| AVE | 0.30 | 300 | 52 | 160 | 108 | |
| ILH | 0.76 | 327 | 113 | 172 | 59 | |
| ERV | 0.35 | 418 | −194 | 124 | 318 | |
| PM2.5 | EST | 0.68 | 219 | 59 | 111 | 52 |
| NUTSII | Hospital Admissions (95% CI) | |||
|---|---|---|---|---|
| Respiratory Diseases | CVDs (Including Stroke) | |||
| This Study | SNS | This Study | SNS | |
| Northern region | 681 (95% CI: 0–1465) | 2613 | 387 (95% CI: 72–709) | 2970 |
| Central region | 766 (95% CI: 0–1691) | 1558 | 429 (95% CI: 79–795) | 1895 |
| Alentejo | 0 (95% CI: 0–0) | 290 | 0 (95% CI: 0–0) | 432 |
| Total | 1447 (95% CI: 0–3156) | 4461 | 816 (95% CI: 151–1504) | 5297 |
Disclaimer/Publisher’s Note: The statements, opinions and data contained in all publications are solely those of the individual author(s) and contributor(s) and not of MDPI and/or the editor(s). MDPI and/or the editor(s) disclaim responsibility for any injury to people or property resulting from any ideas, methods, instructions or products referred to in the content. |
© 2024 by the authors. Licensee MDPI, Basel, Switzerland. This article is an open access article distributed under the terms and conditions of the Creative Commons Attribution (CC BY) license (https://creativecommons.org/licenses/by/4.0/).
Share and Cite
Lopes, D.; Menezes, I.C.; Reis, J.; Coelho, S.; Almeida, M.; Viegas, D.X.; Borrego, C.; Miranda, A.I. The Short-Term Impacts of the 2017 Portuguese Wildfires on Human Health and Visibility: A Case Study. Fire 2024, 7, 342. https://doi.org/10.3390/fire7100342
Lopes D, Menezes IC, Reis J, Coelho S, Almeida M, Viegas DX, Borrego C, Miranda AI. The Short-Term Impacts of the 2017 Portuguese Wildfires on Human Health and Visibility: A Case Study. Fire. 2024; 7(10):342. https://doi.org/10.3390/fire7100342
Chicago/Turabian StyleLopes, Diogo, Isilda Cunha Menezes, Johnny Reis, Sílvia Coelho, Miguel Almeida, Domingos Xavier Viegas, Carlos Borrego, and Ana Isabel Miranda. 2024. "The Short-Term Impacts of the 2017 Portuguese Wildfires on Human Health and Visibility: A Case Study" Fire 7, no. 10: 342. https://doi.org/10.3390/fire7100342