Article

Path Planning of Multiple UAVs for the Early Detection of Wildfires in the National Park of Kotychi and Strofylia Wetlands

by
Georgia Kritikou
1,
Panteleimon Xofis
2,
Konstantinos Souflas
3,* and
Vassilis Moulianitis
1
1
Department of Mechanical Engineering, University of Peloponnese, 26334 Patras, Greece
2
Department of Forestry and Natural Environment Sciences, Democritus University of Thrace, 66100 Drama, Greece
3
Department of Mechanical Engineering and Aeronautics, University of Patras, 26504 Patras, Greece
*
Author to whom correspondence should be addressed.
Fire 2024, 7(12), 444; https://doi.org/10.3390/fire7120444
Submission received: 18 October 2024 / Revised: 18 November 2024 / Accepted: 27 November 2024 / Published: 29 November 2024
(This article belongs to the Special Issue Drone Applications Supporting Fire Management)

Abstract

:
The surveillance of the National Park Kotychi and Strofylia Wetlands in southwest Greece with Unmanned Aerial Vehicles (UAVs) is studied in this work. As comprehensive coverage of the region cannot be attained with just stationary ground cameras, multiple parallel moving UAVs are utilized. The region is divided into squares, which are further subdivided into regular grids with nodes whose weights are calculated based on the fire risk of the corresponding region. Heuristic methods are proposed for selecting the UAVs’ start and goal graph nodes. The graph with the start and goal nodes serves as input to the A* algorithm, which computes offline short paths that direct the UAVs to cross areas with the highest fire risk. The number of UAVs is progressively increased as the coverage of the previous detections proves insufficient. The authors determine the number of UAVs needed for each section of the divided area. They also demonstrate that the UAVs can scan simultaneously without collisions, as each UAV follows a unique path inaccessible to the others. Finally, the presented computations and results show that the proposed method can effectively contribute to fire scanning in the area.

1. Introduction

Forests provide a diversity of ecosystem services, including regulation of climate, carbon sink, and conversion of carbon dioxide into oxygen, and also serve as sources of timber products and recreation. Wildfires are the major threat to forests, with serious environmental consequences, including biodiversity loss, soil degradation and greenhouse gas emissions. Wildfires in Greece burned 1800 km2, causing 28 deaths and more than 75 injuries in 2023 [1]. A lot of structures have been destroyed with an estimated damage of €600 million.
Early detection of wildfires is very important for forest protection, preservation of biodiversity, and protection of human life and property. Conventional forest monitoring is mainly based on fire watchtowers manned by permanent or temporary staff during the summer period, aerial and ground patrols, as well as public reporting [2].
Recent advances in Unmanned Aerial Vehicles (UAVs), vision systems and machine learning offer a new approach in the early detection of wildfires. Various review papers for wildfire detection and prediction using UAVs and machine learning techniques have been published recently [2,3,4,5]. In those review papers, several works were assessed that used machine and deep learning (such as NN, MLP, CNN, RF, DT, LR, SVM etc.), as well as computer vision techniques (such as classification, segmentation and object detection). YOLO and MobileNet models, which are based on deep learning network architectures are the most frequently adopted methods for forest fire detection [3,4]. In addition, machine-learning methods (decision tree and logistic regression) are preferred versus deep learning methods (multilayer perceptron and convolution neural network) for fire prediction [4]. Various deep learning techniques have been reviewed and it was found that they are more accurate than the traditional methods. In addition, the ability of UAVs to obtain high resolution images, as well as to locate the fire accurately, was noted. The matching of requirements, abilities and enabling technologies of forest fire monitoring systems have been presented [6]. It was found that the schemes based on UAVs are found to be the most promising solutions for early forest fire detection.
Autonomous networks of UAVs and a variety of other sensors, as well as using 5G networks, to support firefighters during wildfires have been developed [7,8,9]. Deep learning object recognition, including YOLO, Faster R-CNN and UAVs, have been used for forest fire monitoring [10]. The minimization of false positives of wildfires is achieved by a system based on convolutional neural network and UAV imagery [11]. One or multiple UAVs have been proposed for monitoring route planning problems in transportation, freight delivery, road construction, and remote sensing [12]. Nowadays, traffic monitoring is implemented using multiple UAVs [13] or through collaboration between UAVs and trucks [12]. In [14], the mission-oriented monitoring path planning method using one or multiple UAVs is based on autonomous UAVs making the decision to complete scanning tasks or to avoid collision with moving or static obstacles. A path planning optimization algorithm aimed at reducing flight time and increasing battery life has been proposed for repelling birds from farms [15].
Path planning of UAVs is a key element for successful surveillance of forest conservation and early wildfire detection. As a scheduler for various drones, plenty of algorithms have been tested in Australia’s Daintree Forest. It was found that the proposed two-group clustering algorithm was the most efficient [11]. A method for probabilistic path planning based on risk assessment for multiple UAVs have been developed [16].
In this work, the surveillance of the National Park Kotychi and Strofylia Wetlands in southwest Greece using multiple UAVs is studied. This is a region of high ecological importance due to its biodiversity and aesthetic value [17] and has been identified as a part of the Mediterranean area with a high wildfire risk [18,19]. Mapping the Fire Danger Index (FDI) of the area has revealed the region’s evaluated risks [19], highlighting the need for timely detection. While stationary cameras can be placed on specific checkpoints, they cannot provide complete coverage of the entire area [20].
To identify the high fire risk regions of the National Park Kotychi and Strofylia Wetlands, a grid-based scanning method [21] using multiple UAVs equipped with vision cameras is proposed. The method divides the region’s FDI map into square areas, and for each square, the path of a single UAV is computed using the A* algorithm [22], considering the highest fire risk regions and the camera’s field of view. Specifically, the algorithm searches for a short path that guides the UAV from a start to a goal position while simultaneously covering the areas of highest fire risk.
Multiple UAVs are estimated to enable parallel scanning, with the maximum number depending on the remaining unscanned area and the unoccupied region for their parallel motion without collisions. The suggested approach seeks to completely avoid wildfires by obtaining extensive aerial coverage of the region in conjunction with the fixed cameras. The computations for parallel scanning of high fire risk areas using multiple UAVs, while avoiding collisions between them, are presented and discussed.

2. Materials and Methods

2.1. Study Area

The study is conducted in the National Park of Kotychi and Strofylia Wetlands, in the region of Peloponnese in southwest Greece (38°6′4″ N, 21°21′32″ E; Figure 1). The high ecological importance of the area, due mainly to its high biodiversity and aesthetic value, has led to several different designations as a protected area. It is part of the Natura2000 Network of protected areas with three designations, namely: Limnothalassa Kotychi—Alyki Lechainon (GR2330009) Special Protection Area (SPA), Ygrotopoi Kalogrias-Lamias kai Dasos Strofylias (GR2320011) SPA and Limnothalassa Kalogrias, and Dasos Strofylias kai Elos Lamias, Araxos (GR2320001) Special Area for Conservation (SAC). At least 27 bird species, six reptiles, one mammal, one freshwater fish, and 16 habitats are protected in the area, despite its relatively small size. The vegetation consists of forested areas dominated by Pinus halepensis, Pinus pinea and Quercus aegilops, shrublands dominated by Juniperus phoenicea, wet meadows, and vegetation typical of sand dunes and halophytic habitats. The climate is typical Mediterranean with mild winters and warm, dry summers. The average annual precipitation is 688 mm, with the driest month being July, where the recorded rainfall does not exceed 3.6 mm. The average annual temperature is 17.8 °C, with the hottest month being August where the recorded mean temperature is 26.8 °C. The arid conditions that prevail during summer in combination with the presence of highly flammable pines and shrubs, and the high human presence, makes the area particularly vulnerable to wildfires.

2.2. Data Sources and Fuel Type Identification

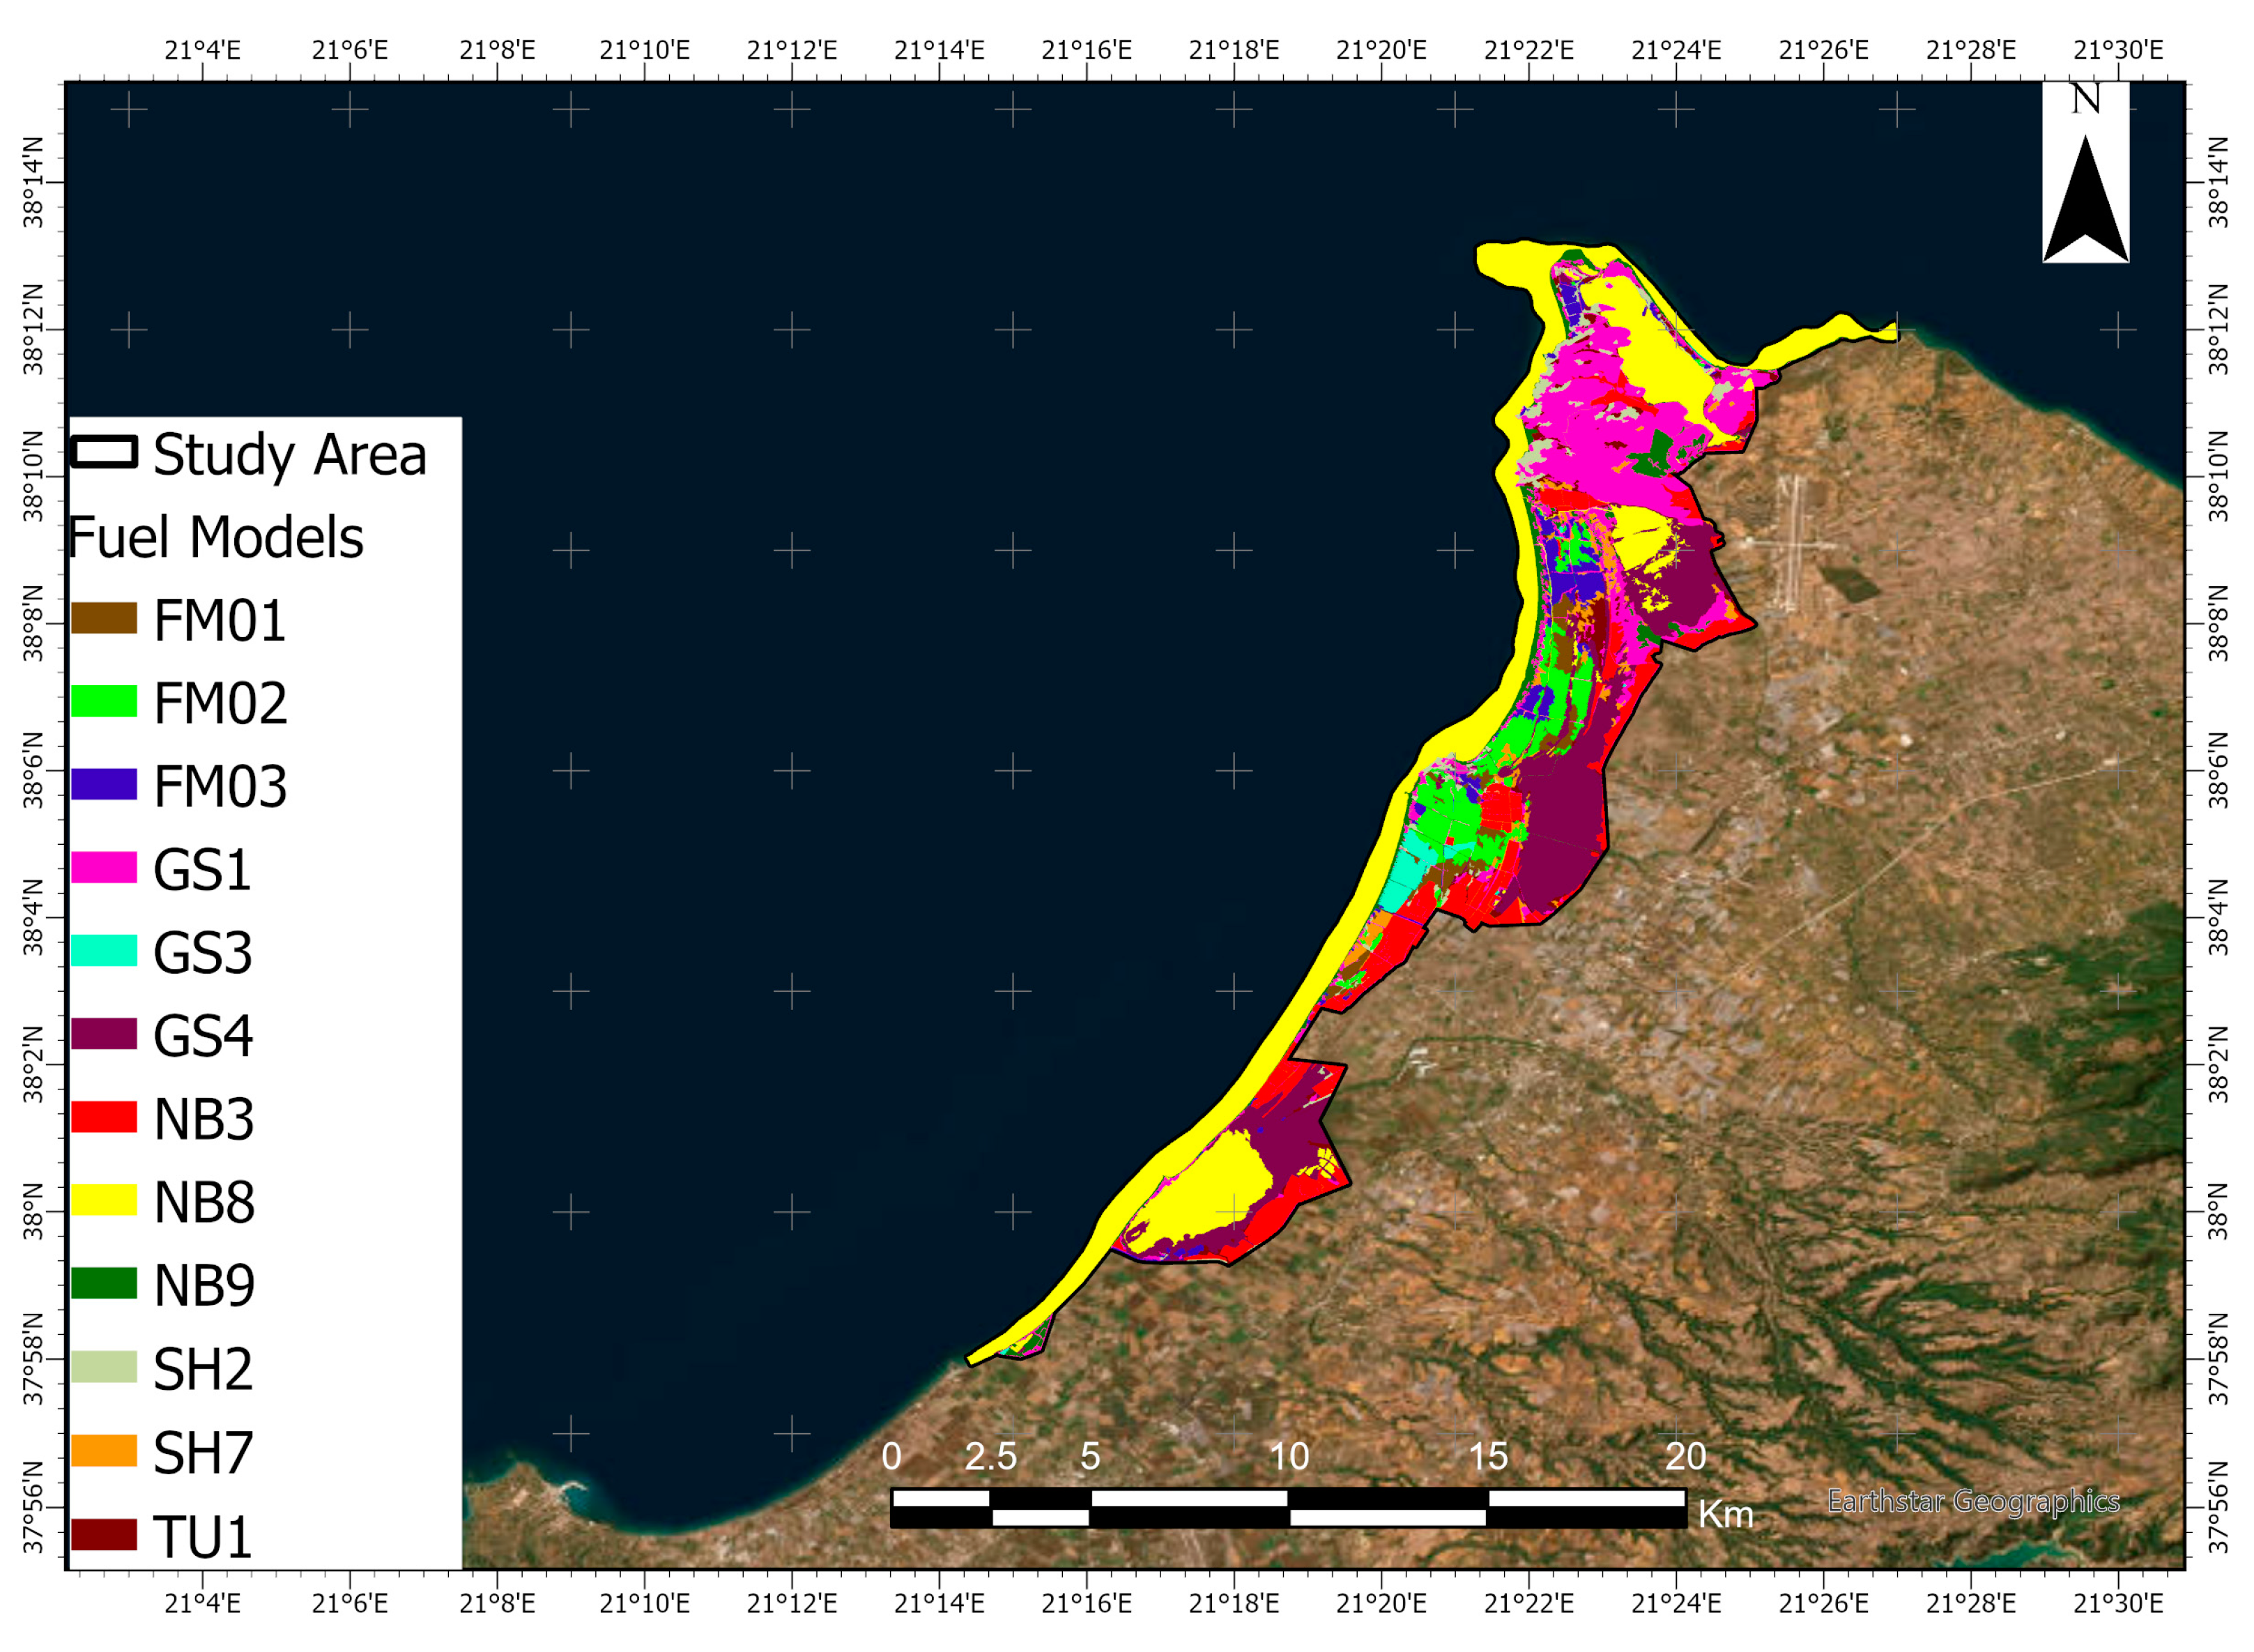
The identification of fuel types and their mapping is a critical step in identifying wildfire risk. A vegetation map was generated by integrating a set of time series Sentinel-2 Images of 10 and 20 m spatial resolution, a very high-resolution aerial photograph of 0.25 m spatial resolution and in situ collected data in an Object Based Image Analysis (OBIA) environment, using the software eCognition 9.3 [23]. The analysis resulted in the identification of 11 vegetation and landcover types with an overall classification accuracy of 89% and a Kappa statistic of 0.88 [20]. To identify the appropriate fuel model to be assigned to a specific vegetation and landcover type, the data collected in situ of stand characteristics were employed, which were used in allometric equations to estimate fuel load. The 11 vegetation and landcover types were eventually assigned to 12 fuel models (including 3 non-burnable ones) and the generation of the fuel map was done using a nearest neighbor spatial interpolation method. Nine of the identified fuel models are included in the standard fuel models of Scott and Burgan [24] and three were custom models presented in the literature for study areas like the one in the current study. Table 1 provides a detailed description of the various fuel models and corresponding landcover types while Figure 2 presents the final fuel map used in the process of fire simulation.

2.3. Fire Danger Index Calculation

The Fire Danger Index (FDI), developed by Xofis et al. [20,26], was employed for the estimation of fire risk in the area. The FDI is calculated using the following formula:
FDI = 0.5 × FI + 0.2 × ROS + 0.2 × HI + 0.1 × PH,
where: FI = Fire-line Intensity Index, ROS = Rate of Spread Index, HI = Human Index, PH = Pyric History Index.
A detailed description of the steps involved in the calculation of the FDI can be found in Xofis et al. [20], where the index was originally developed, so only a brief description will be provided here. The first two components of the formula above (FI and ROS) result from a fire behavior simulation, using the software Flammap 6.0 [27]. Flammap employs Rothermel’s surface fire spread model [28], and estimates several fire behavior parameters, including Fireline Intensity, Rate of Spread, Flame Length, Crown Fire Activity etc., under a specific burning scenario of a prevailing weather condition. It is a static model which allows for the identification of areas with high potential of a high intensity fire, irrespectively of the fluctuations in the burning conditions, which is the case in an actual fire event. The simulation was performed assuming a west wind of 6 Beaufort velocity and a dry fuel scenario of 3, 4, 5, 30 and 60% moisture content for 1-h, 10-h and 100-h in dead fuel and live woody and live herbaceous fuels, respectively. The raster datasets of Canopy Height, Canopy Cover and Canopy Base Height, which are required for the Fammap simulation, were calculated for the entire study area using a spatial interpolation method based on the data collected in situ and the nearest neighbor approach, considering the Fuel Models classification which had been completed in the previous step. A Digital Elevation Model of 2 m spatial resolution (resampled at 10 m) was used for the calculation of the rest of the layers required for the simulation which are an elevation, an aspect and a slope layer (Xofis et al. [20]).
The fire simulation using Flammap resulted in the estimation of the Fireline Intensity and the Rate of Spread under the specific scenario. The estimated Fire-line Intensity in Kw/m was rescaled to a scale of 0 to 1 by dividing the estimated values with the maximum estimated value, to calculate the FI component of the formula 1. Similarly, the estimated Rate of Spread in m/sec was rescaled to a scale of 0 to 1 by dividing the estimated values with the maximum estimated value, to calculate the ROS component of the formula.
The HI of formula 1 was calculated based on the distance from roads and settlements because both have been found to be positively associated with the possibility of a fire ignition [29]. The maximum distance of 500 m was selected, beyond which no effect is considered. Areas at immediate proximity to roads and settlements scored a value of one which was decreasing linearly as the distance increases to the value of 500 m, where the score was zero. Finally, the PH was calculated based on the existing records of fire incidents over the last 40 years. A Kernel Density Estimation Function was employed to convert the point data of fire records into a raster dataset with estimated values for the entire study area. The estimated values were again converted to a scale between 0 and 1 by dividing the estimated values with the maximum estimated values. The four components of the FDI formula were then used to calculate the FDI of the entire study area and generate the FDI map (Figure 3).

2.4. The Fire Detection of the National Park of Kotychi and Strofylia Wetlands Using UAVs Equipped with Vision Cameras
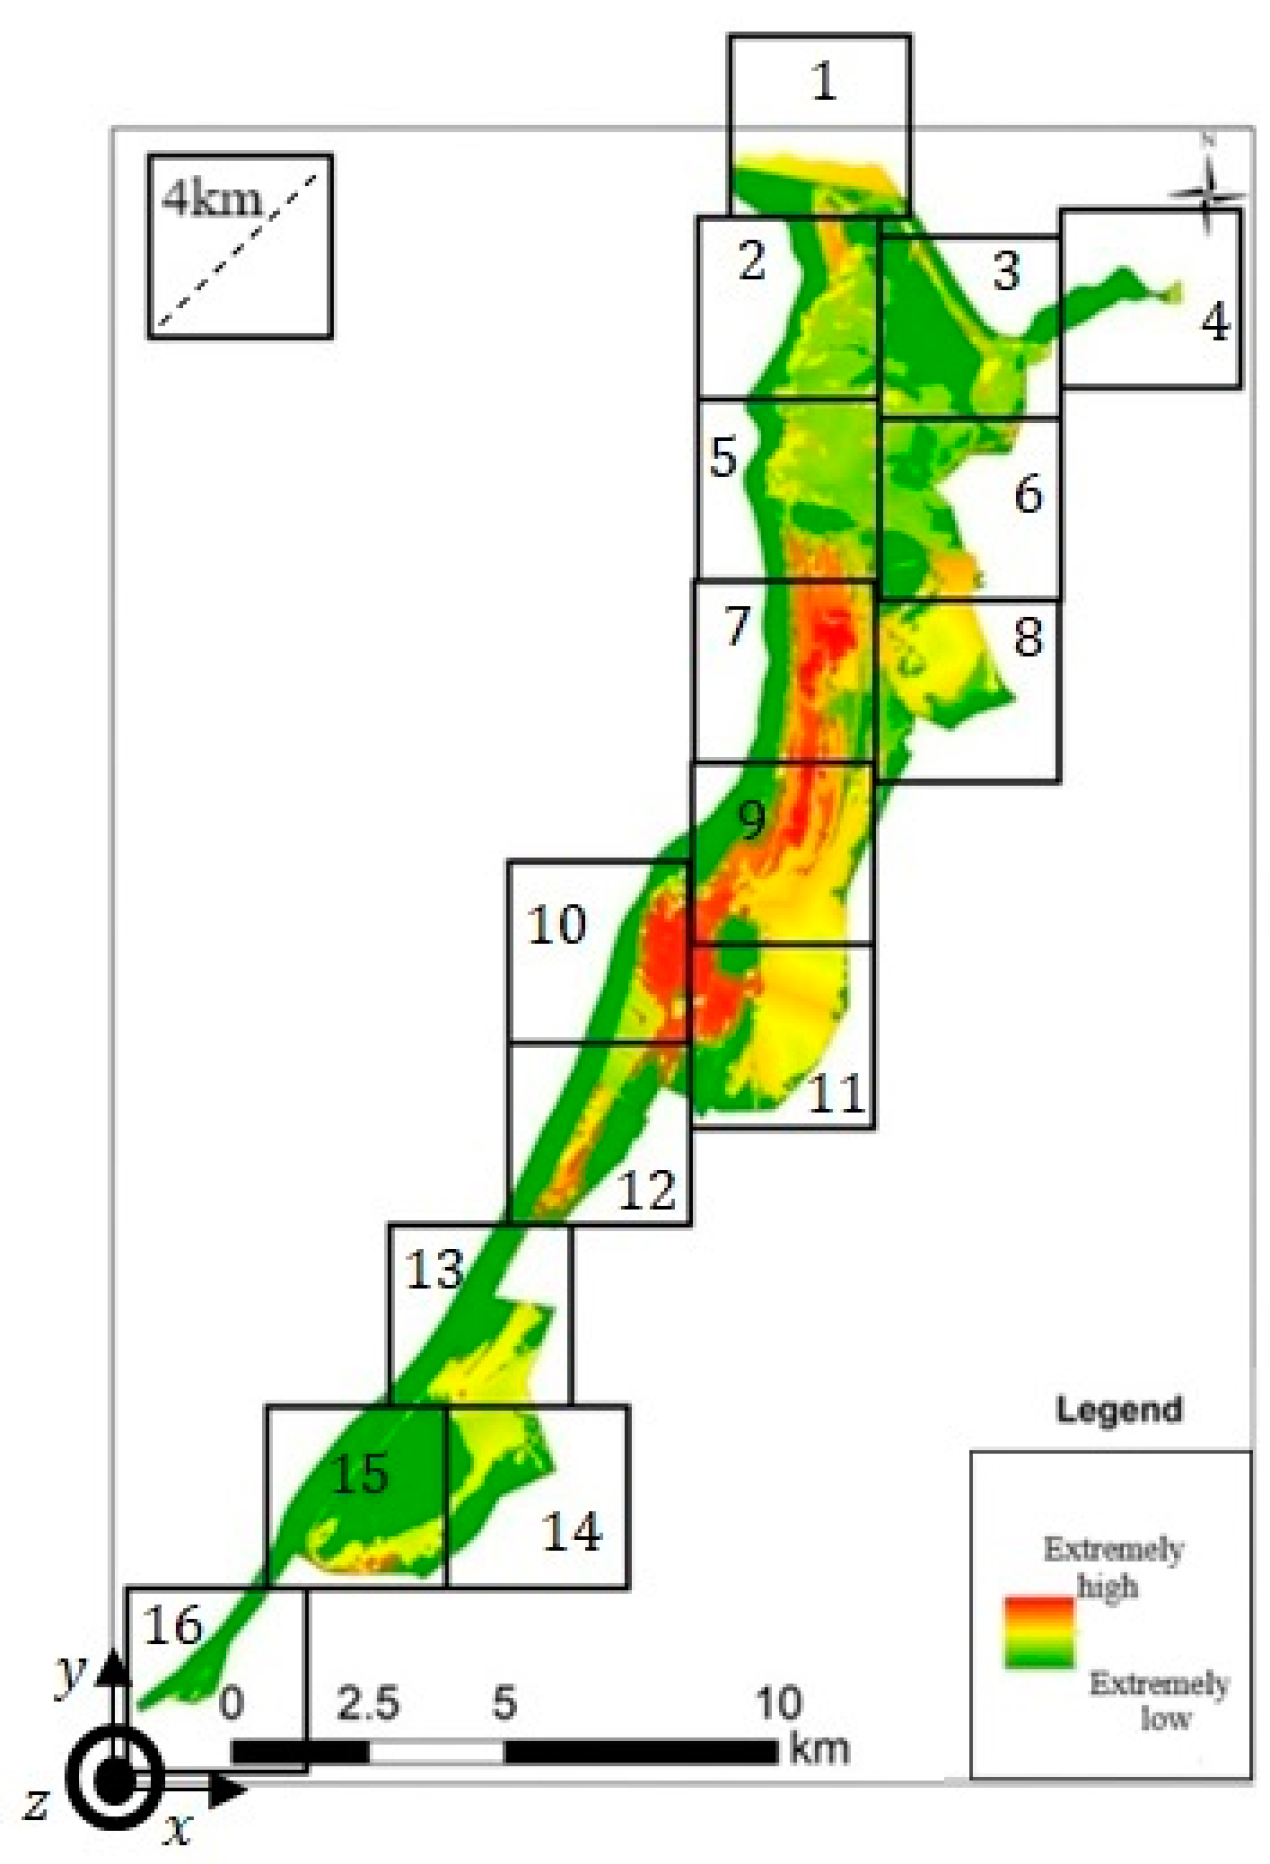
A grid-based method [30] for detecting forest fires using one or, when necessary, multiple UAVs, is proposed. The method is developed by considering the Fire Danger Index (FDI) map (Figure 3), as well as the technical specifications of the UAV and its thermal camera. The National Park of Kotychi and Strofylia Wetlands map is divided into square areas based on the maximum Euclidean distance the UAV can traverse. Each square is then subdivided into a regular n × n grid, with weights assigned to the grid nodes, calculated based on the forest’s FDI map. The graph for the UAV’s path planning is created by considering both the n × n grid and its camera’s field of view.
Figure 3. The FDI map is divided empirically using squares whose length is equal to 2 2   k m and as a result its diagonal is equal to 4 km (maximum permitted distance for the UAV from its base). Such empirical square division contributes to covering the whole area of the forest while also considering the UAV’s return function activation.
Fire 07 00444 g003
The UAV’s path is computed offline using the A* algorithm, with the graph and each UAV’s start and goal positions as input. A heuristic method is proposed for determining the pair of start and goal nodes for the UAV, encouraging it to scan a large region within the square while simultaneously passing through areas of the Strofylia forest with higher fire risk. At the end of the UAV’s path computation the percentage of high fire risk regions scanned is calculated. If a single UAV is insufficient for thoroughly scanning the area, the path for a second is computed for parallel scanning. If scanning with two UAVs still does not cover the high-risk regions adequately, a third UAV is introduced and so on.
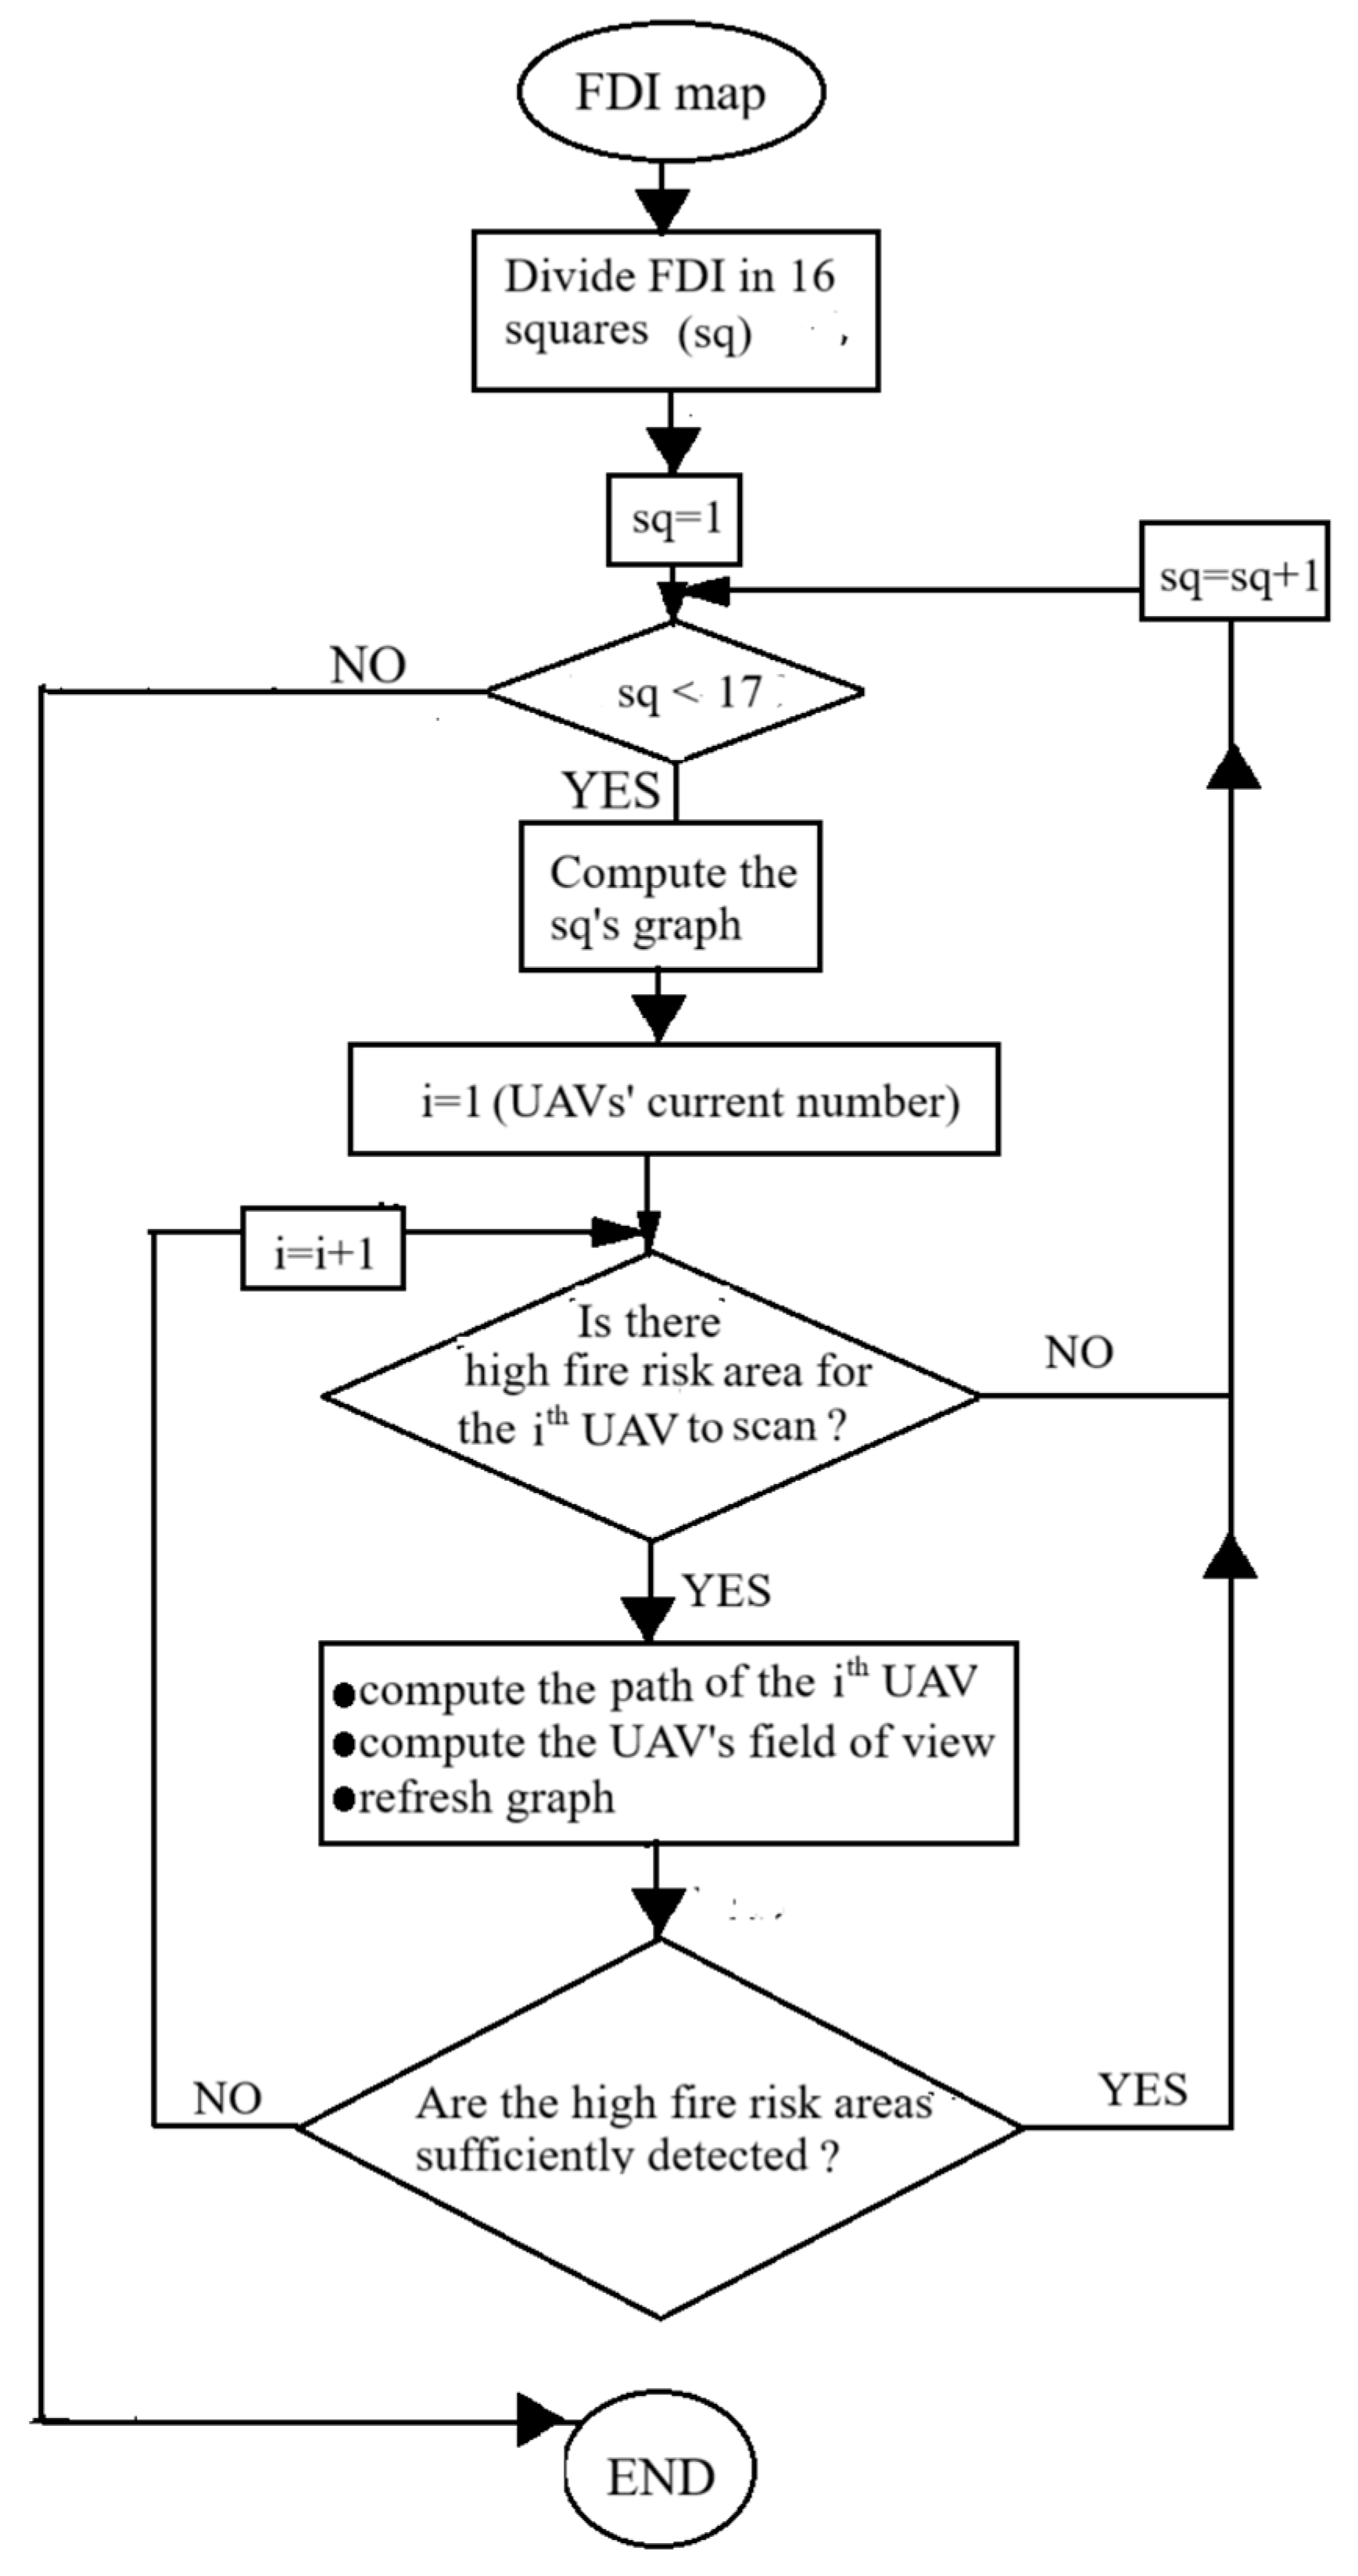
Collisions between parallel-moving UAVs are avoided by ensuring that each UAV follows a unique path that is inaccessible to the others. The scanning process is terminated when the high fire risk areas are sufficiently detected or when there is no more space for additional UAVs to scan. Figure 4 illustrates a flowchart of the scanning method which is described in detail in the remainder of the paper.

2.4.1. Dividing the Strofylia Forest Using the UAV’s Technical Properties

The UAV dimensions are 0.5   m × 0.5   m × 0.4   m and its flight height (z-coordinate in Figure 3) has been constant at H = 65   m above sea level (approximately 35 m above tree level [18]) and can follow any direction in the horizontal plane. The UAVs’ set up has been chosen according to authors’ experimental results shown in [21]. Specifically, a UAV can cover 9   k m in 10 min with a constant velocity of 0.9   k m / m i n using   80 %   of the battery’s capacity. Moreover, at 4   k m from its base it loses its communication, and the return-home function is activated. The battery recharging is time-consuming and is avoided during an ongoing process.
The activation of the return function is an important parameter that is highly considered in the UAV’s path planning. Therefore, the FDI is divided into square areas whose diagonal distance is equal to   d = 4   k m ; hence, the length of each square is equal to   a = 2 2   k m . The squares are empirically positioned to cover the entire Strofylia’s FDI map area. It is considered that it is feasible to use at least one UAV in each one of these squares.

2.4.2. Building the UAVs’ Graph Based on the FDI Map and the Camera’s Field of View

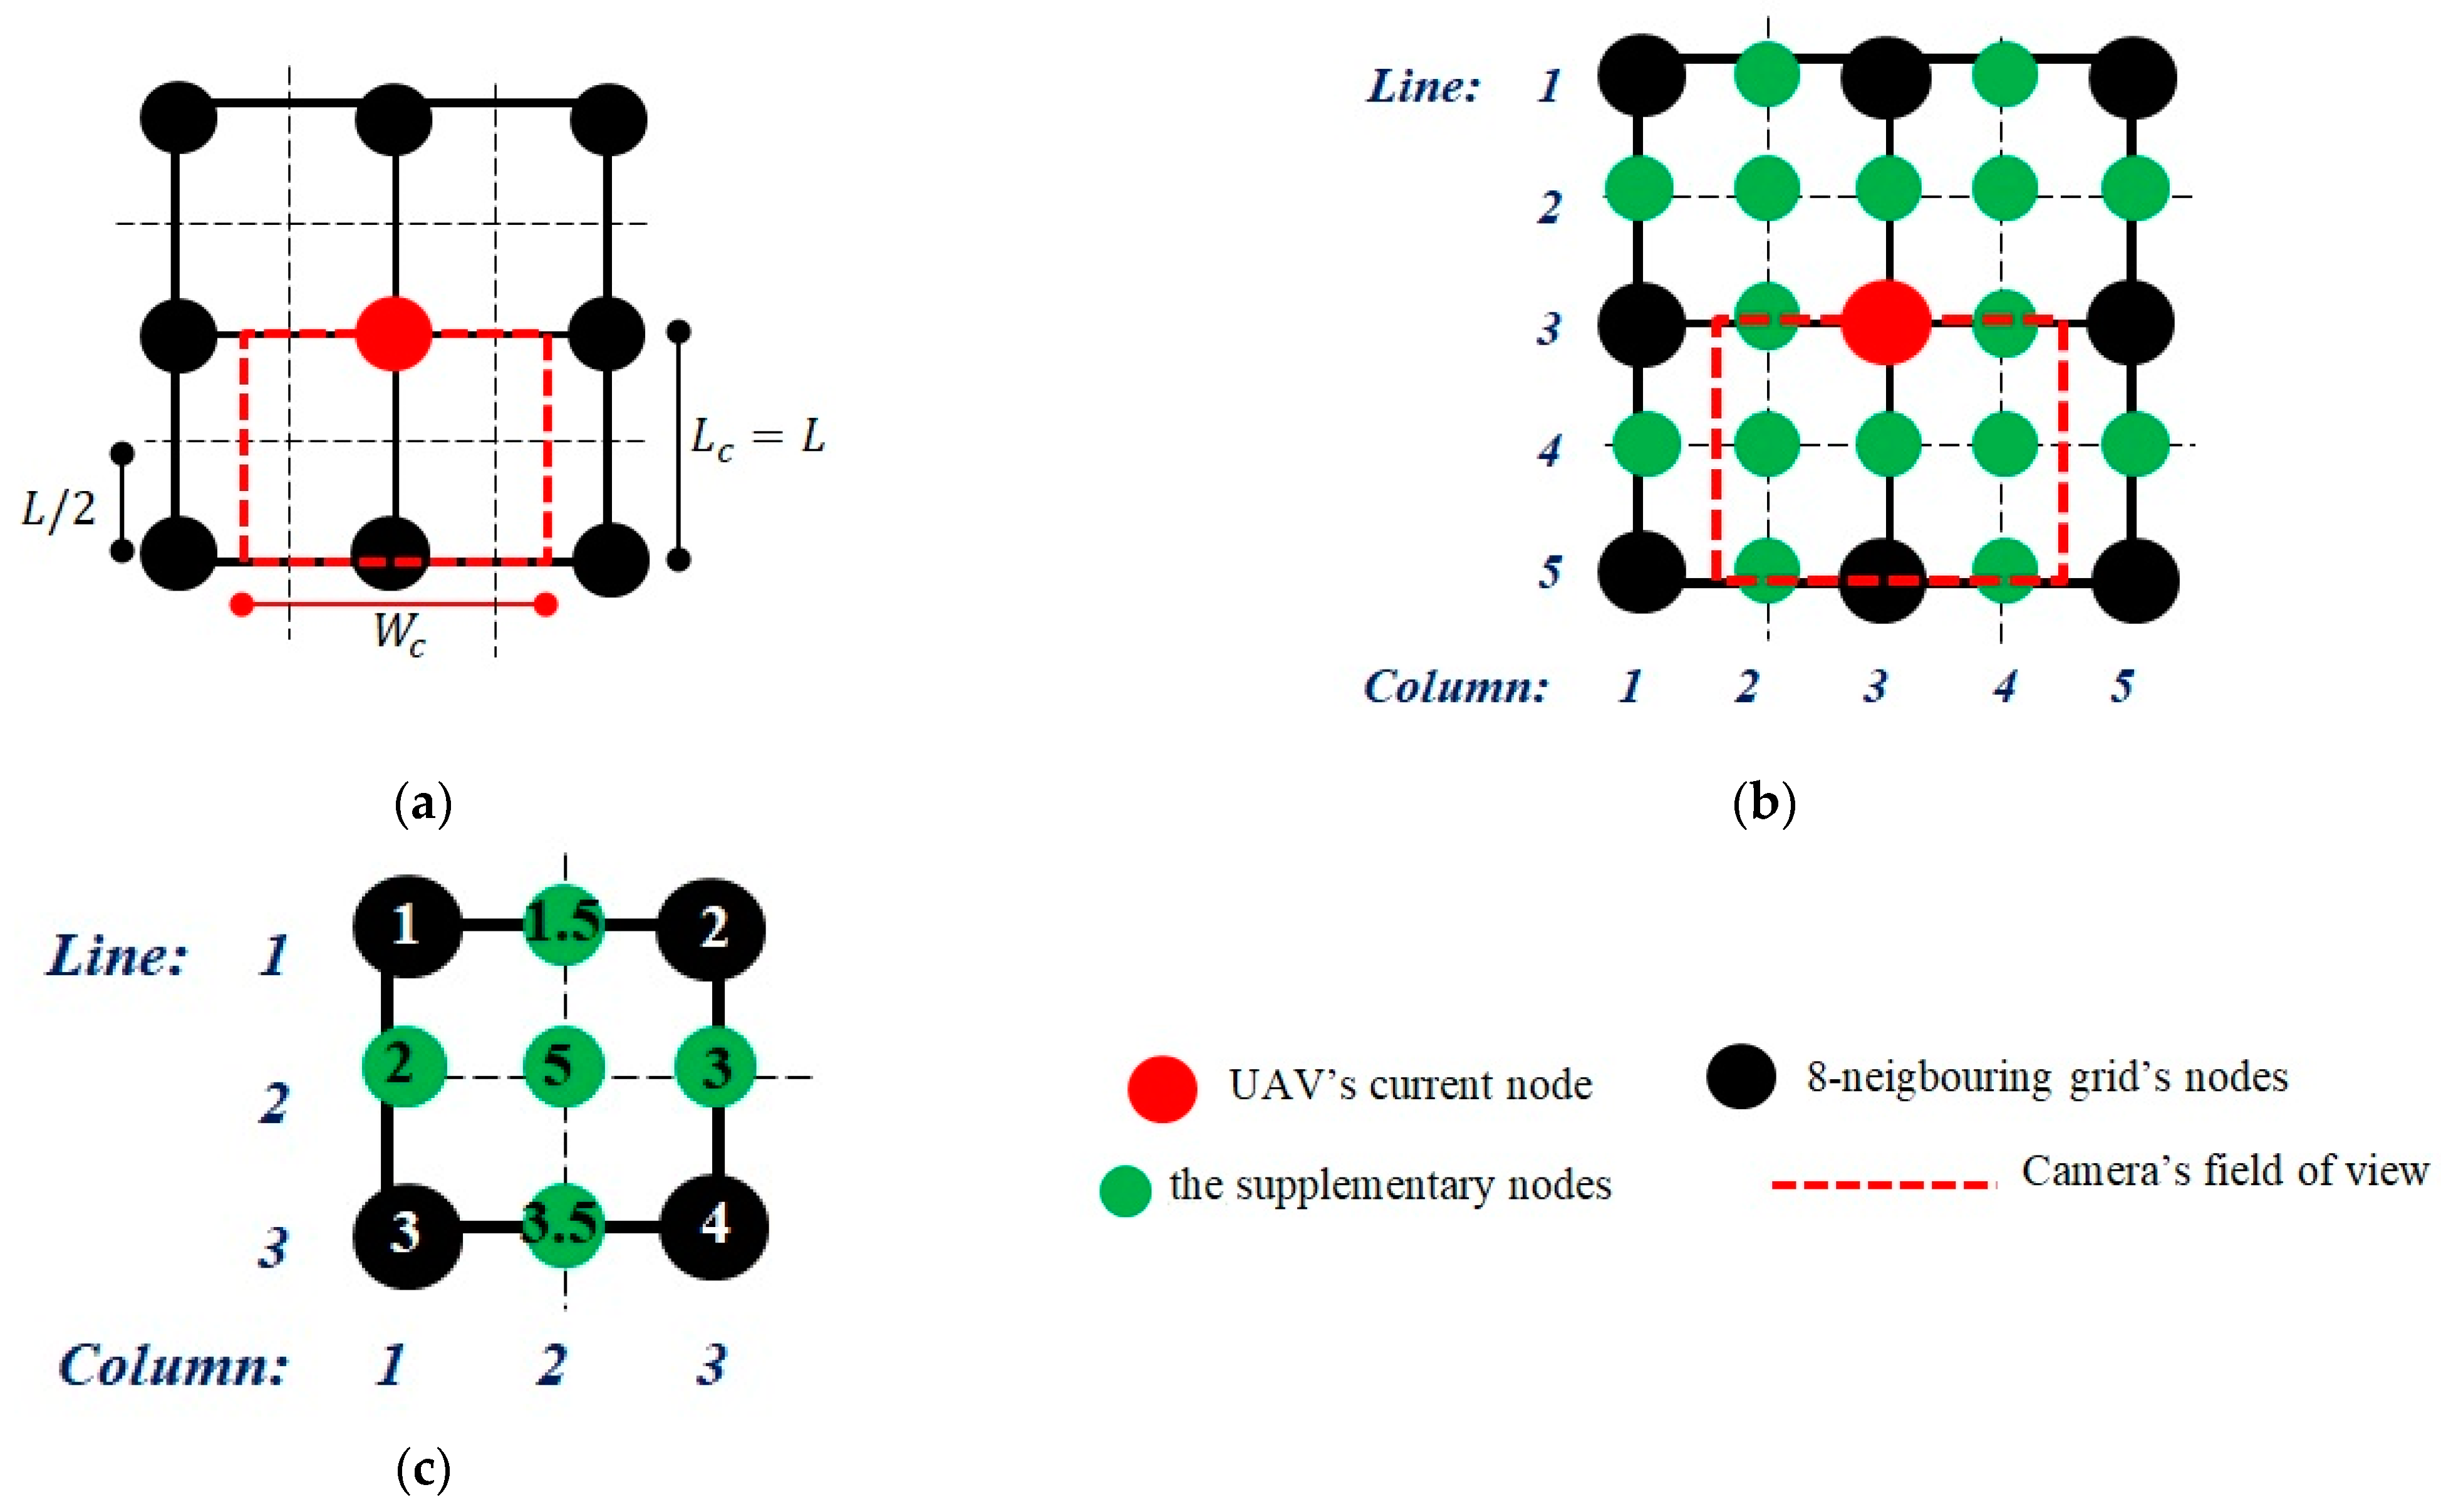
Each square area of the FDI map is analyzed using the RGB method [31] and the resulting n × n × 3 matrices are used to build the n×n grid. Since the length of the squares is equal to α , the grid’s cell length is equal to   a n = L . The grid’s node weights are computed using RGB analysis, with each node corresponding to a pixel that is transformed using the one-to-twelve scaling described in the legend in Figure 5. Higher weights are assigned to green areas (low fire danger) and lower weights to red areas (high fire danger). A very high weight significantly greater than 12 is assigned to white areas representing regions outside the Strofylia forest.
The ZENMUSE X5R vision camera [32] is used for fire detection with an AR = 4:3 and diagonal   F O V = 72 o . At a camera height of   H = 65   m , the length ( L c ) and the width ( W c ) of the detected area are approximately L c 30   m and W c 40   m [32].
The RGB analysis is applied to the sixteen (16) square areas with identical dimensions, scale, and zooms to result in square grids with n = 94; that contribute to having L = 2 2 k m 94 30.1   m L c < W c . As a result, the camera’s field of view exceeds the cell’s length (L) (Figure 5a).
To compute the path of a UAV, a graph is required, which is constructed by considering both the n × n grid of the square area that the UAV scans and the camera’s field of view. To find routes that traverse the fire risk regions while simultaneously avoiding the double scanning, a ( 2 n 1 ) × ( 2 n 1 ) node graph is built (Figure 5b). In this graph, supplementary nodes are added between the nodes of the RGB grid to help define the camera’s field of view.
As shown in Figure 5b, since the UAV is positioned at node ( 3,3 ) and needs to move to a node where l > 3   and c = 3 (where ( l , c ) represent the coordinates, with l   as the line number and c as the column number), the nodes ( 3,2 ) , ( 3,4 ) , ( 4,2 ) , ( 4,3 ) , ( 4,4 )   ( 5,2 ) , ( 5,3 ) and ( 5,4 )   are considered as detected. Each supplementary graph node weight is equal to the average value of the neighboring n × n grid nodes. Figure 5c shows an example of the graph nodes weights computation where the nodes ( 1,1 )   ( 1,3 ) , ( 3,1 ) and ( 3,3 ) are from the 2 × 2 RGB grid with randomly chosen weights 1,2 , 3 and 4 , respectively, and the nodes ( 1,2 ) , ( 2,1 ) , ( 2,2 ) , ( 2,3 ) and ( 3,2 ) are the ( 2 · 2 1 ) × ( 2 · 2 1 ) graph’s supplementary where their weights are equal to ( 1 + 2 ) / 2 = 1.5 ,   ( 1 + 3 ) / 2 = 2 ,   ( 1 + 2 + 3 + 4 ) / 2 = 5 , ( 2 + 4 ) / 2 = 3 and 3 + 4 2 = 3.5 , respectively. To approach a motion of the UAV that avoids the double scanning its Action Space that describes its motion between two nodes is equal to:
U = 2,0 , 0,2 , 2,0 , 0 , 2 , 2,2 , 2,2 , 2 , 2 , 2 , 2 ,

2.4.3. Collision-Free Path Planning for Multiple UAVs: Two Heuristic Methods for Start and Goal Selection

The path computation for each UAV is performed offline using the A* algorithm, which is based on its cost function calculations, and finds the shortest path between two nodes in a graph commonly structured as a regular grid [22]. In this work, the weights of the graph’s nodes are adjusted according to the FDI map, influencing the A* cost function and guiding the UAV to navigate from a start node to a goal node, through the most fire-prone areas of the FDI map.
It is assumed that R UAVs must fly in parallel, since a single UAV cannot effectively scan the high fire risk regions. Each UAV has a priority for its path computation, where i is their priority indicator. The i = 1 corresponds to the UAV with the highest priority, and i = R to the lowest.
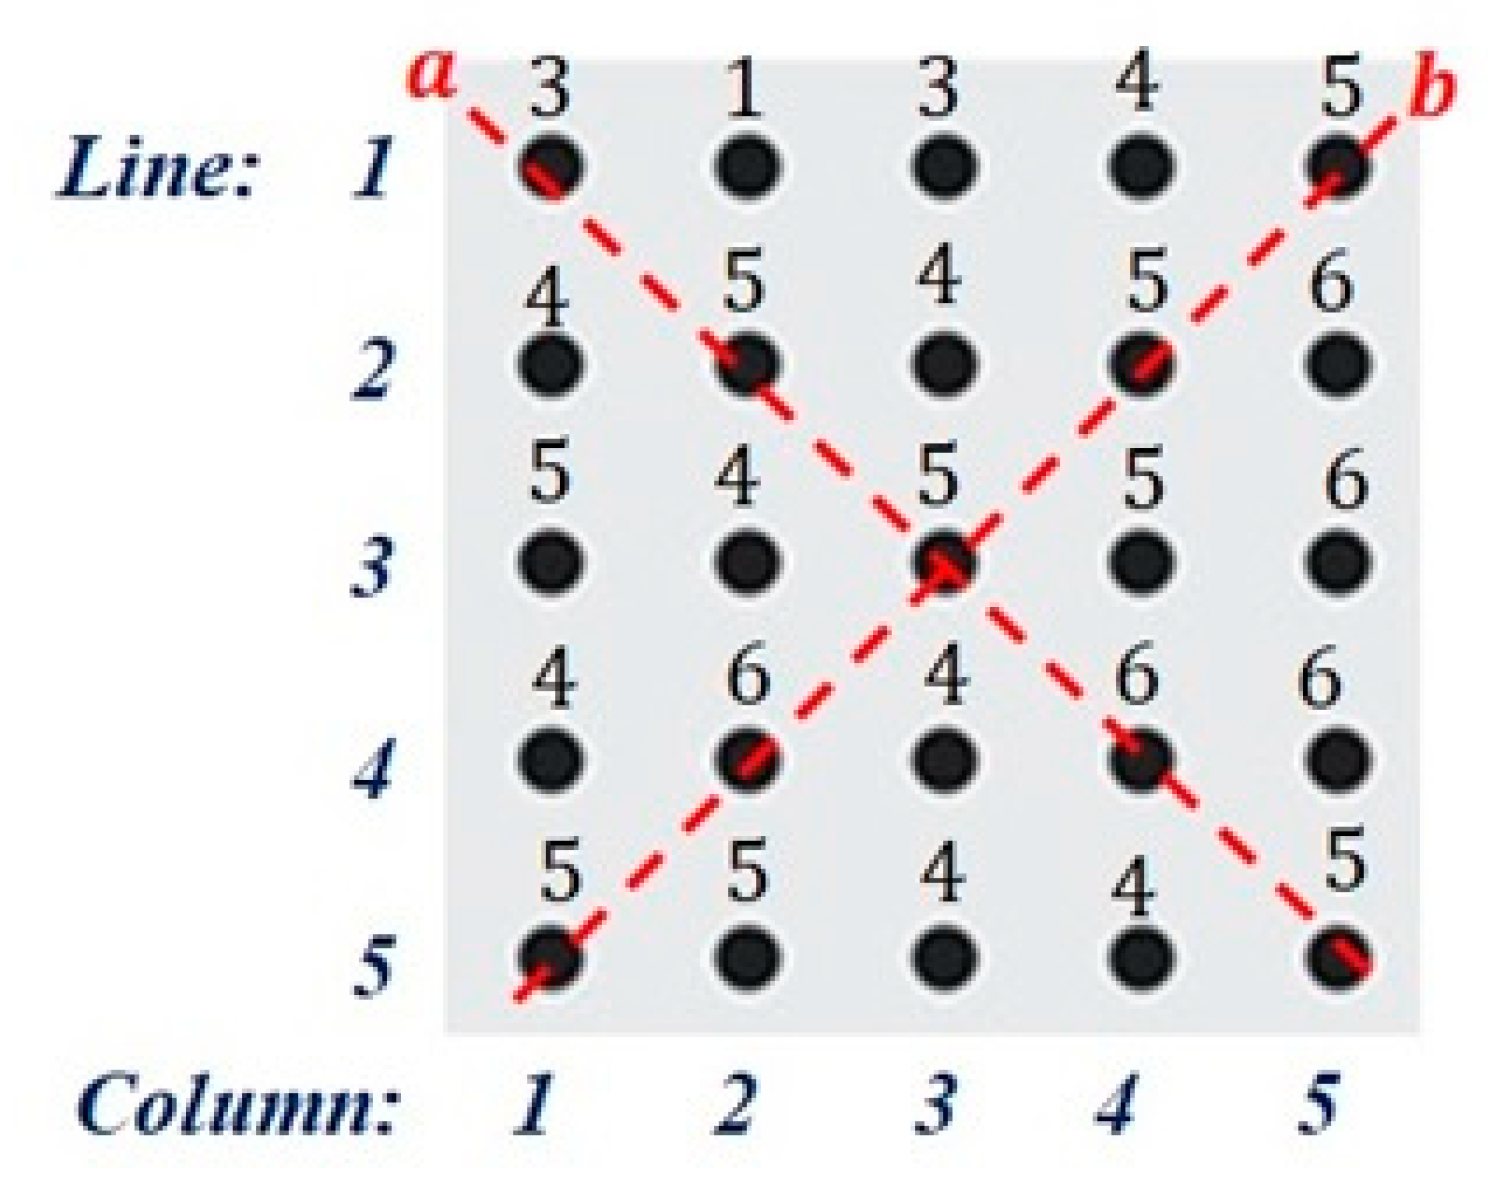
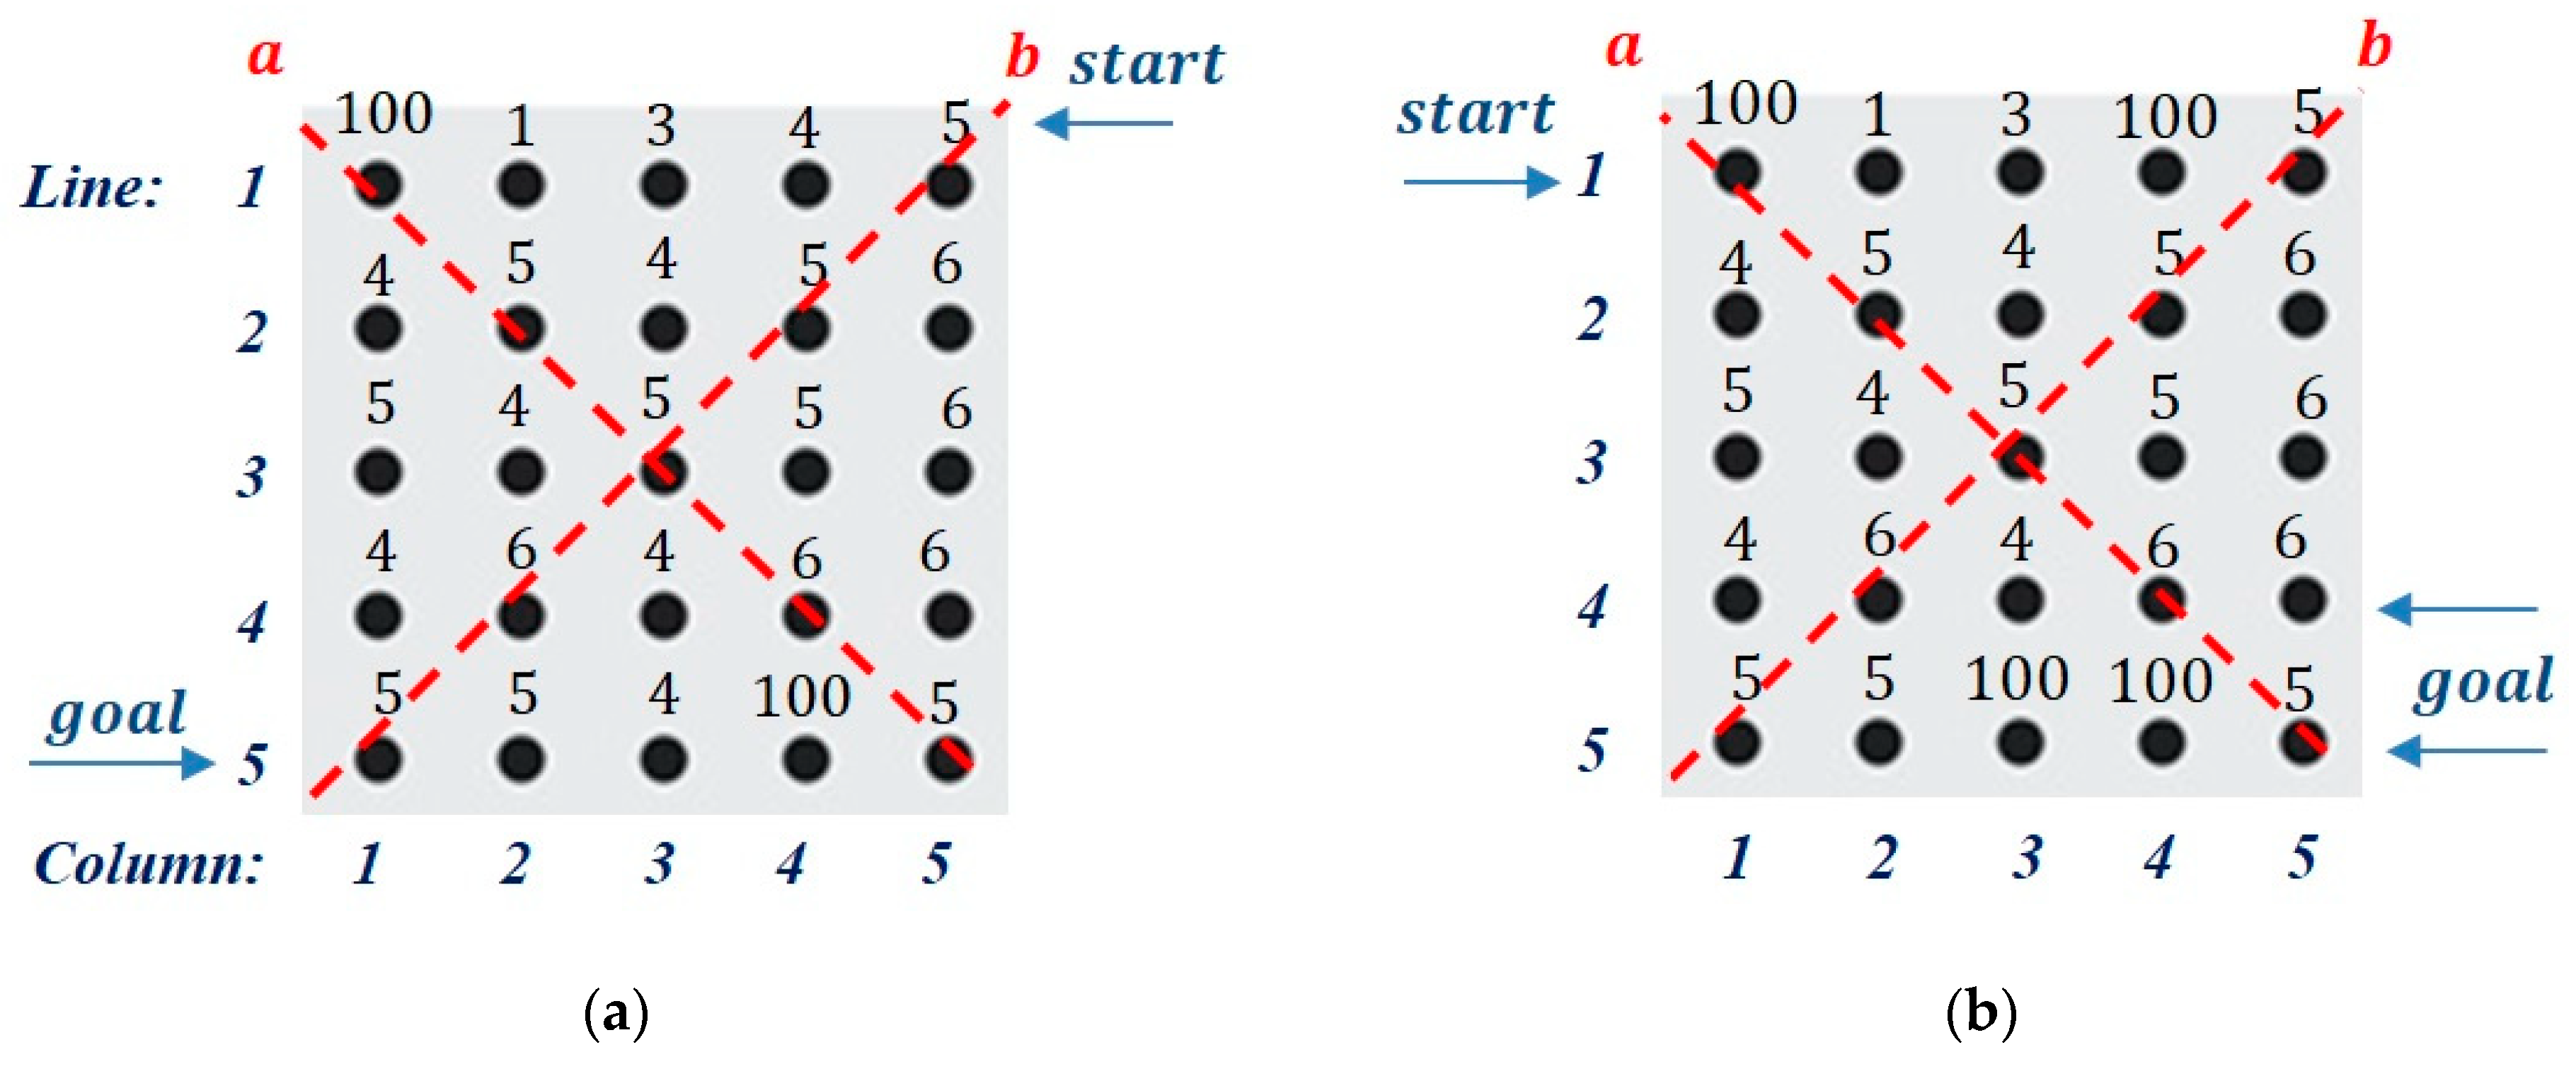
If i = 1 the start and goal nodes are chosen as two nodes with weights less than or equal to four (4) that are closest to the opposite ends (antidiametric nodes) of the square’s biggest distance that is equal to its diagonal. Since there are more than two pairs of nodes that meet these criteria, the pair with the biggest Euclidean distance is selected. From this selected pair, the node with coordinate l n 2 is designated as the start and the node with l n 2 becomes the goal node.
In Figure 6, for instance, nodes ( 1,1 ) and (5,4) are closer to diagonal “a”, while nodes ( 1,4 ) and ( 4,1 ) are closer to diagonal “b”. However, the pair ( 1,1 )     ( 5,4 ) is chosen since their distance ( 1 5 2 + 1 4 2 )   is bigger than ( 1 4 2 + 4 1 2 ) and ( 1,1 )   is the start node and ( 5,4 ) the goal node. This method contributes to pushing the UAV to follow the biggest distance in the square area crossing simultaneously the higher fire risk regions.
Since the first scanning with a single UAV does not cover more than a specific percentage in the high fire risk regions (w < 2 ), more than one UAV is needed. The distance between the eight neighboring nodes on the graph is at least L 2 15   m , while the UAV’s dimensions are 0.5   m × 0.5   m . Therefore, collisions between UAVs moving in parallel can be avoided, since they do not occupy the same node simultaneously.
At the end of each UAV’s path computation, the nodes on its path have w   12 , rendering them unavailable for selection by the next UAV with a lower priority. If i 2   the heuristic below is applied:
  • The search for the start and goal is conducted line by line, beginning from line 1 for the start node and from line n for the goal.
  • The search starts from the corresponding nodes on the diagonal that were not selected for the path of the (i – 1)th UAV.
  • The first nodes with w ≤ 4 are selected as the start and goal nodes.
Figure 7 illustrates an example of this heuristic for the second UAV ( i = 2 ) if nodes ( 1,1 ) and   ( 5,4 ) on the 5 × 5   grid were selected as the start and goal nodes for the UAV with i = 1 . Therefore, the search for the second UAV starts from nodes ( 1,5 )   and ( 5,1 ) for the start and goal, respectively. The selected pair of nodes is ( 1,4 ) as the start and ( 5,3 ) as the goal. Since a third UAV is needed, the heuristic is applied again from the opposite side and nodes ( 1,2 ) and ( 4,3 ) are selected as the start and goal, respectively. This method helps in selecting pairs of nodes in high fire danger regions that are far apart, to scan as much area as is feasible with the fewest number of UAVs.

3. Results

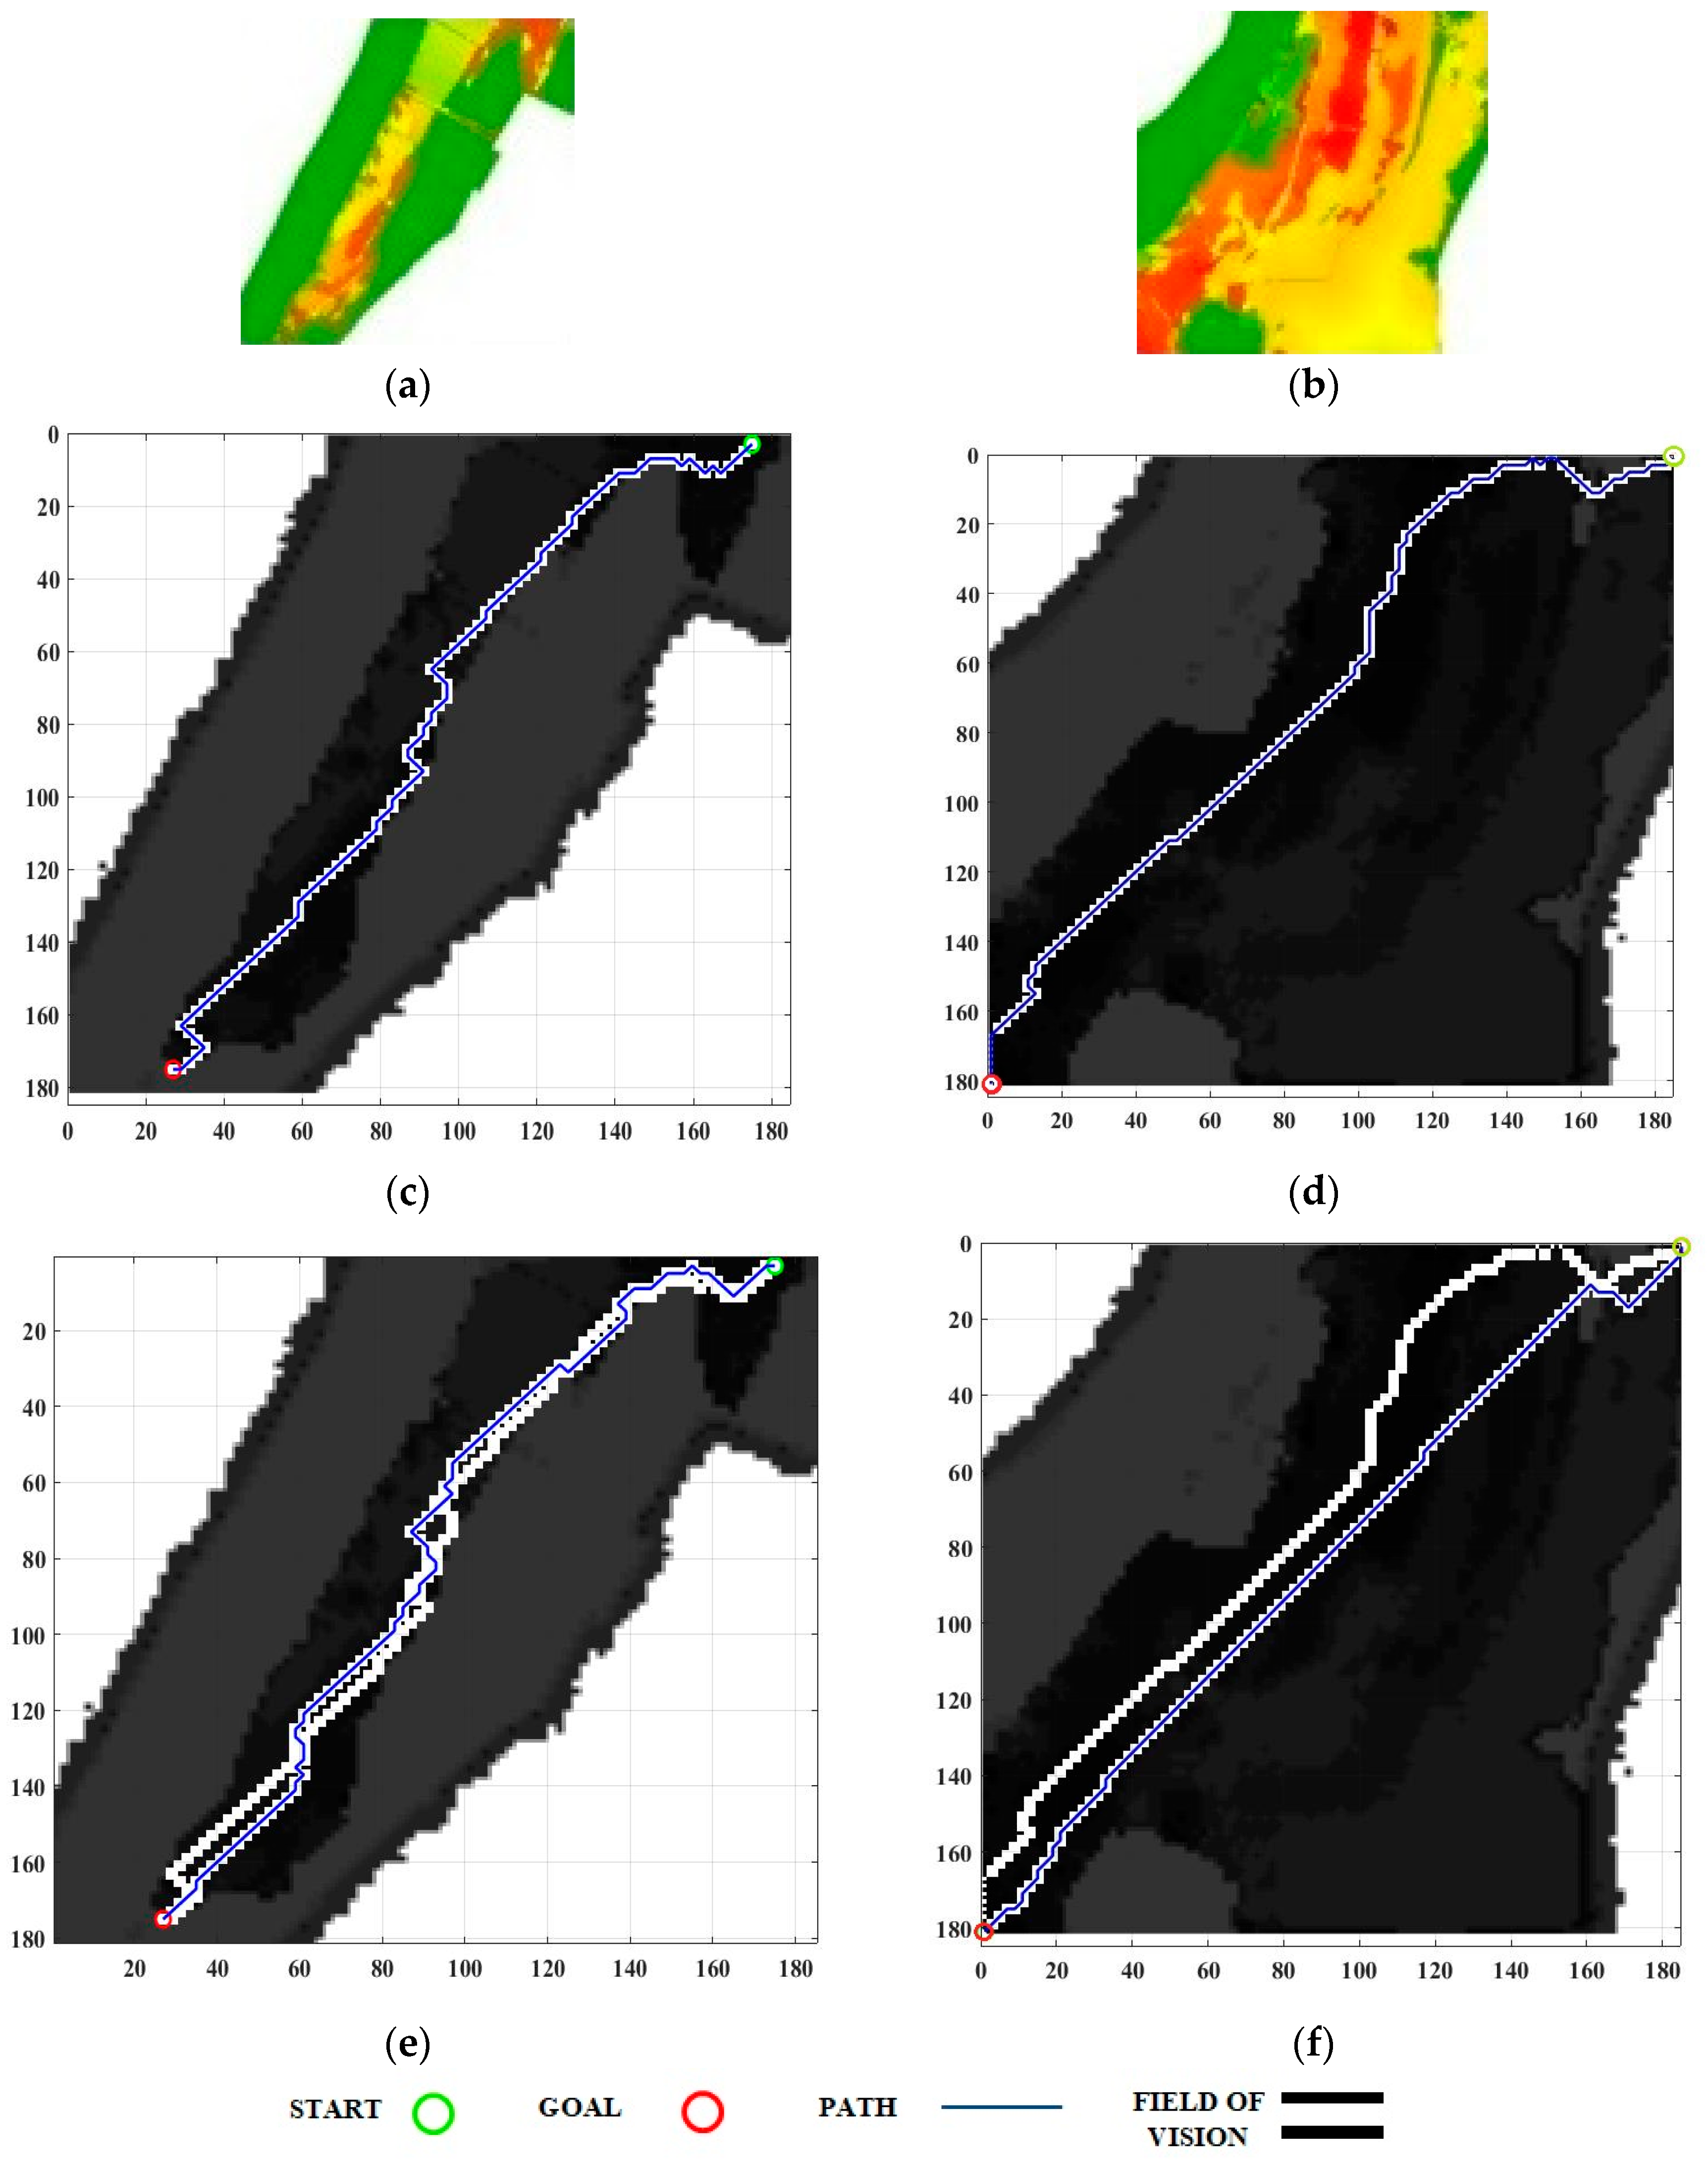
In this section, the results of the path planning method applied to the 16 square areas shown in Figure 3 are presented. Figure 8a,b show the square areas numbered 12 and 9, respectively (Figure 3). Figure 8a is covered by a small area of high fire danger (≈0.5% weights (w)   2 ,   5 %  w    4 and 12 %   w   < 7 ), while Figure 8b is mostly covered by areas of high fire danger ( 5.3 % with w    2 ,   23 % with w   4 and 44 % of the area is covered by regions with w  < 7 ). Figure 8c,d present the square areas in grayscale where each pixel corresponds to a graph’s node. The coordinates of the UAVs start nodes are equal to ( 3,175 ) and ( 1,185 ) —marked by a green circle—and moving towards the   175,27   and 181,1 , marked by the red circle. The blue line represents the A* path, while the bold white line Indicates the camera’s field of vision.
The path calculations show that the graph’s node weights push the UAV to traverse areas of each square with higher fire danger. As a result, even though the start-to-goal Euclidean distance is less than 4 km, the UAV must cover approximately 4.1 km (Figure 8c) and 4.5   k m   (Figure 8d). The return of the UAV to its base is exploited by recalculating a new route, where nodes already scanned are deleted from the return graph to avoid the double scanning.
At the end of the UAV’s motion in the square area No. 12, 0% of the extremely high fire risk regions remains unscanned > 3 % of the high fire risk (weights ( w ) 4 ) and >9% of the areas with w < 7 . On the other hand, the square area No. 9, 4.5% of the extremely high fire risk regions remains unscanned 20% of the high fire risk (w ≤ 4) and 40% of the areas with w < 7 . Therefore, for area No. 12 a single UAV sufficiently covers the extremely high and highly dangerous area. However, in area No. 9 a large region with high fire danger remains unscanned, indicating that a single UAV is insufficient and multiple UAVs are required for adequate scanning.
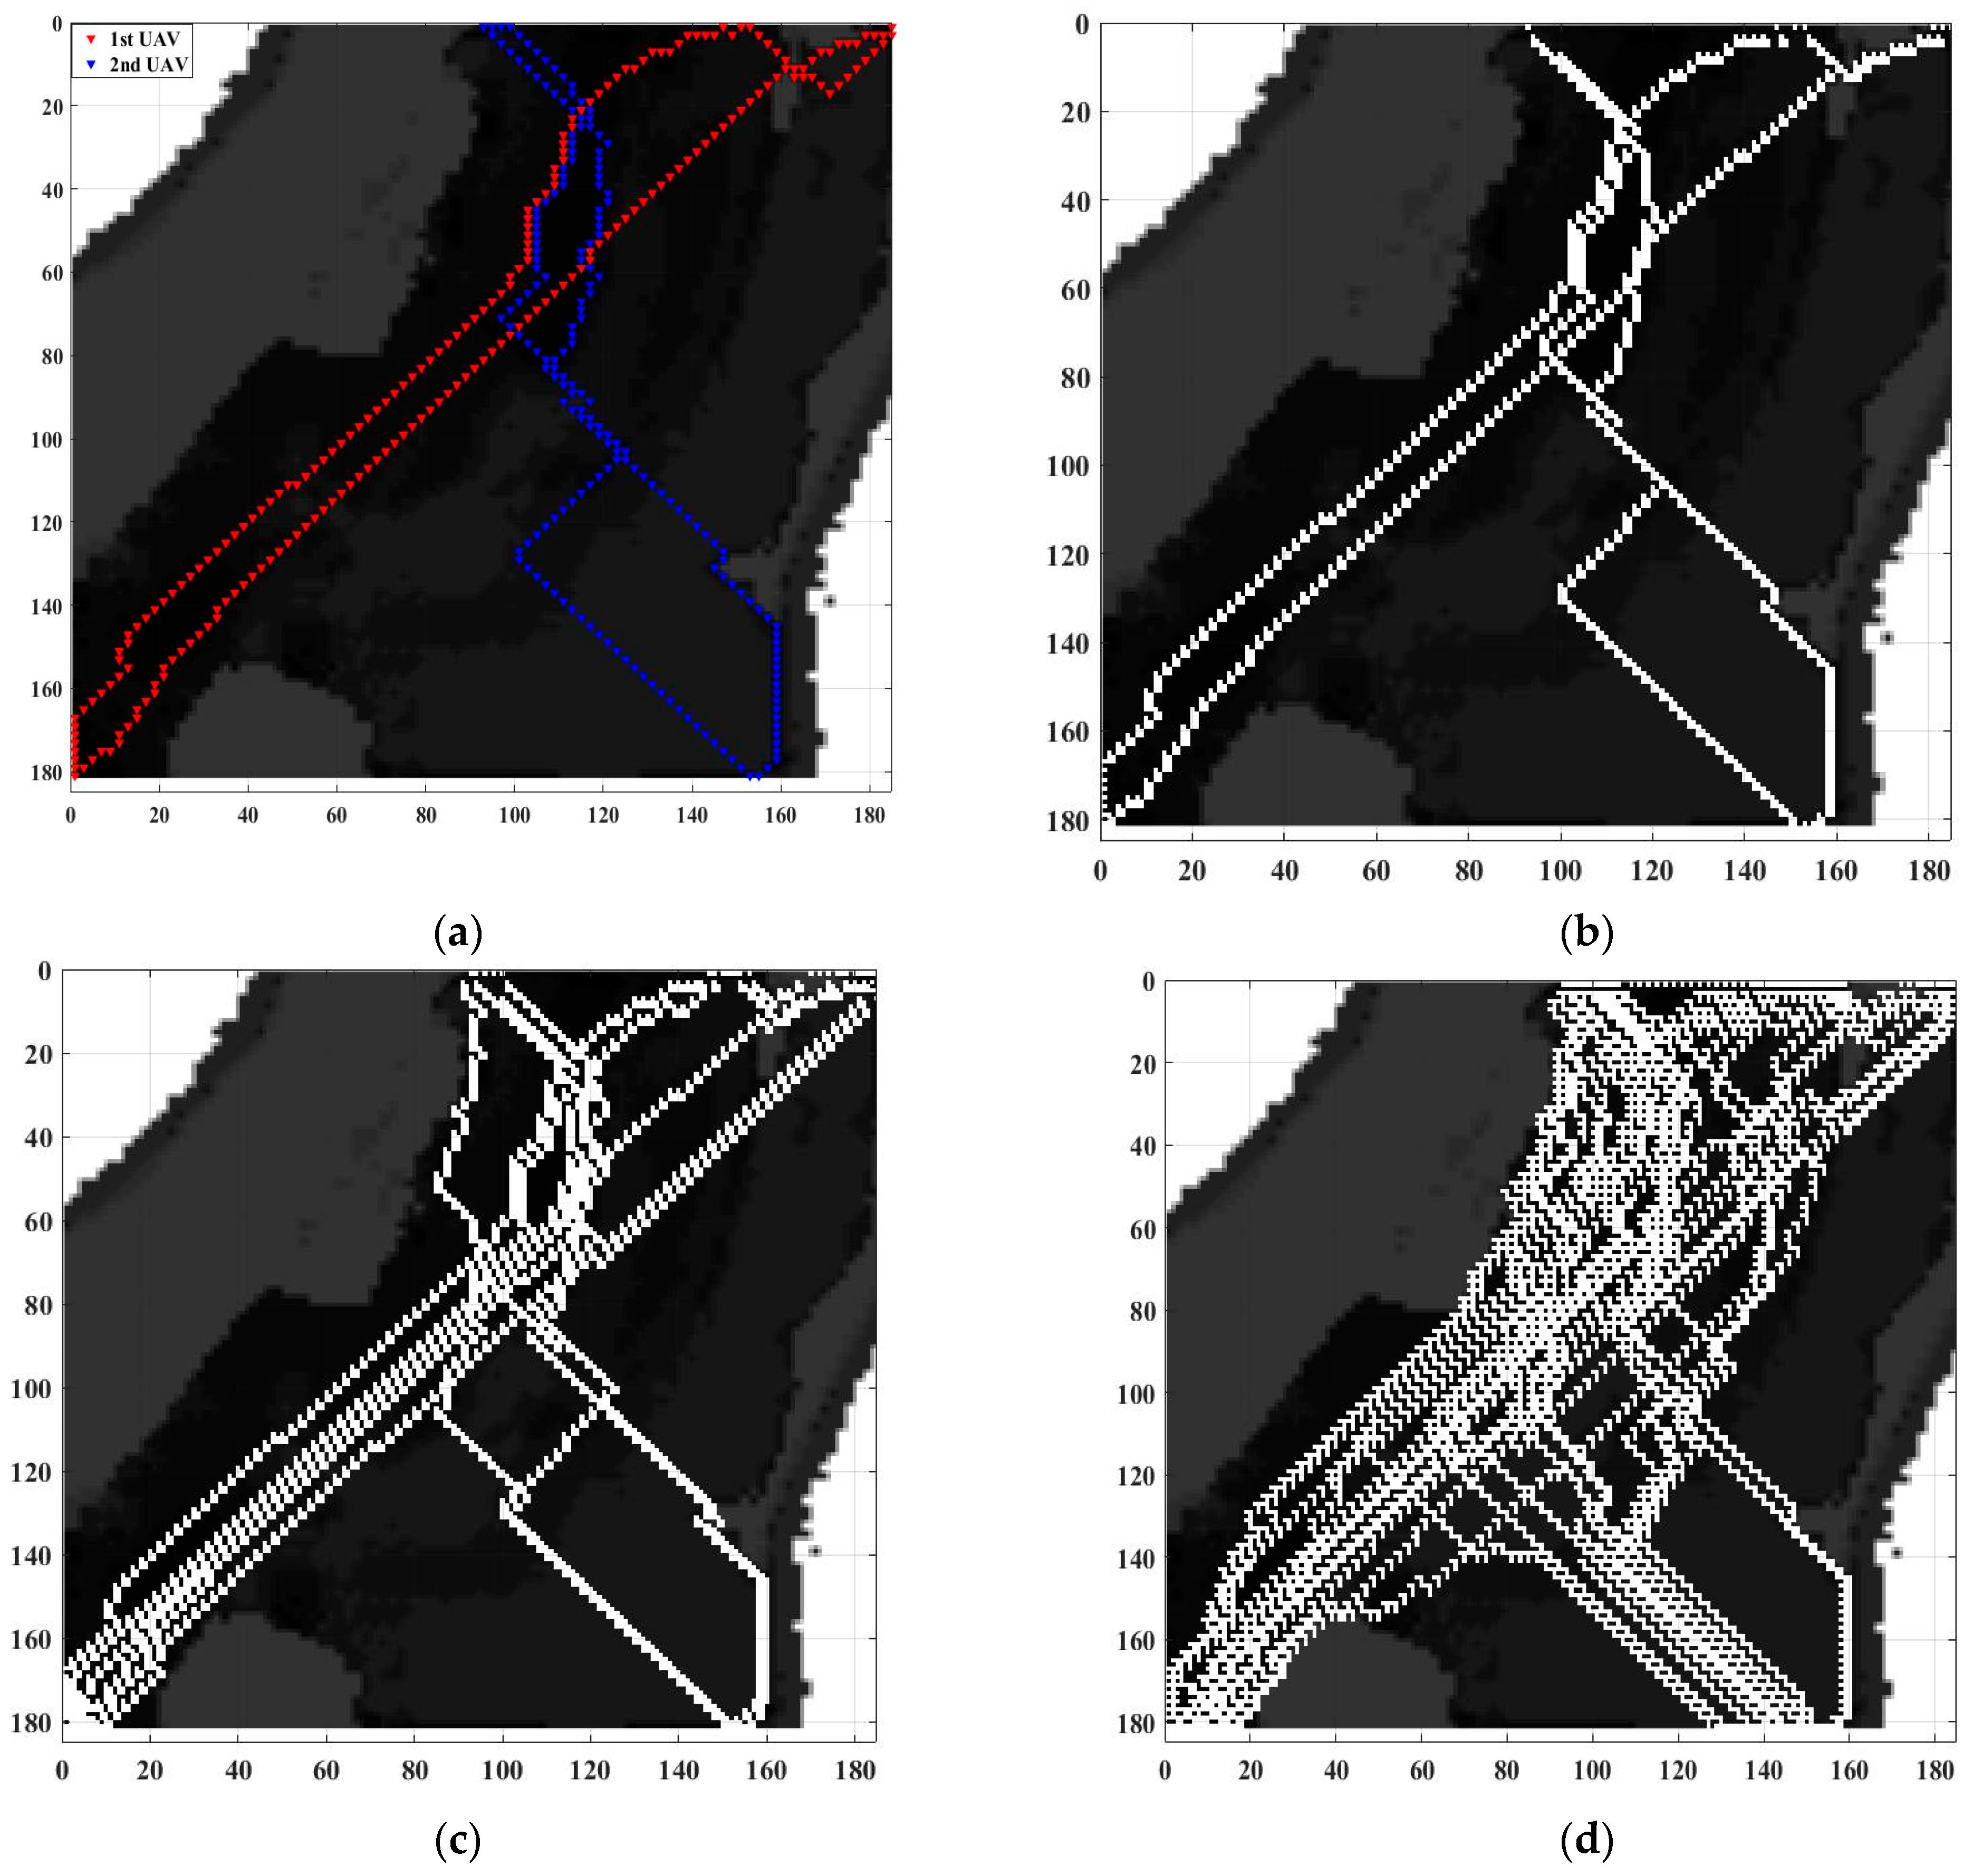
Figure 9 illustrates the scanning of square region No. 9 using multiple UAVs. For the second UAV ( i = 2 ) the heuristic computed start and goal nodes the pair ( 1,93 )   and   ( 182,2 ) . The refreshed graph computed at the end of the first UAV’s path computation excludes the nodes already visited by it. This exclusion allows the second UAV to navigate through unvisited nodes in the high fire risk areas while avoiding collisions between them. Figure 9a demonstrates this hypothesis, showing the two UAVs followed distinct paths. Figure 9b–d illustrate how the number of the UAVs increased progressively, approaching the desired scanning coverage of Area No. 9. Figure 9d shows that the process was completed when routes were computed for eight ( R = 8 ) UAVs performing parallel scanning.
At the end of the scanning process using two ( i = 2 ) UAVs, approximately 3.5 % of the extremely high fire risk regions, 19 % of the high fire risk areas, and 38 % of regions with fire risk w  < 7 remain unscanned. Scanning more than 50 % of the extremely high fire risk regions and 30 % of the high fire risk areas, leaving approximately 2% and 15 % of these areas unscanned, can be achieved using at least five ( i = 5 ) UAVs (Figure 9c). Finally, Figure 9d shows the scanned area using eight ( i = 8 = R ) UAVs where approximately 99 % of the extremely high fire risk regions (w 2 ) have been scanned, along with 50 % of the high fire risk areas (w   4 ) and 35 % of the regions with w < 7 . Although less than half of the high fire regions were covered, the method terminated path computations as no more free routes were available for additional UAVs. However, the extremely high-risk regions were fully covered with a significant portion of the high fire risk regions.
Scanning of all the sixteen (16) square areas of the FDI map is implemented using the proposed method, and Table 2 presents the results of the calculations. For each square region, the percentage covered by high fire risk areas is determined. Then, the percentage of extremely high and high fire risk regions covered by a single UAV during scanning is presented. Finally, the maximum number of UAVs that can simultaneously scan each area, while achieving acceptable coverage of the square’s high fire risk regions, is reported. The results of Table 2 show that 10 out of 16 areas could be fully scanned using a single UAV while 2 out of 16 required no scanning. However, 4 out of 16 areas could not be adequately scanned with a single UAV, so a second one was used for parallel scanning.
Figure 10 depicts the four square regions where more than one UAV is required for better scanning. All four figures demonstrate the efficiency of the graph weights in guiding the UAVs through regions with higher fire risk. Additionally, the method for selecting start–goal node pairs enhance the coverage of a large portion of the region. In squares No. 7, 10 and 11 (Figure 10a–d, respectively), the extremely high fire risk areas are concentrated in specific parts of the region, whereas in square No. 9 these areas are more dispersed. Consequently, in squares No. 7, 10 and 11, the algorithm eventually stops finding free routes, as there are no more connected graph nodes to traverse due to the updates made for collision avoidance. Nevertheless, all four figures demonstrate that the proposed method effectively contributes to scanning significant portions of each square, reaching numerous positions in areas of extremely high fire risk.

4. Discussion

Wildfires continue to constitute a major environmental issue despite the increased number of resources allocated to fire suppression and recently to fire prevention. The combined action of increased summer temperatures and decreased precipitation during the summer months, and the increased biomass that has been concentrated in the European forests because of socioeconomic changes create a fire friendly environment. Only one year ago Europe experienced the largest fire ever recorded, in northeastern Greece. There is no doubt that this trend will continue with the fires becoming increasingly severe and catastrophic, often costing losses of human life and important infrastructures [33,34]. The currently applied wildfire management strategy, which relies primarily on fire suppression using aerial firefighting has reached its limit of success [35], while at the same time has a significant economic cost. Any attempt to ensure cost efficient and effective monitoring of fire prone areas and a quickfire detection, and as a result quick initial attack, is expected to provide significant solutions towards more efficient wildfire management.
In the current study, a method for the surveillance of the National Park of Kotychi and Strofylia Wetlands, located in the Peloponnese region of the southwest Greece using UAVs, is presented. Kotychi and Strofylia are areas of high biodiversity and aesthetic value, with regions at an extremely high risk of wildfires. The primary challenge addressed in this work is the UAV monitoring route planning. The efficacy of the monitoring heavily depends on the technology used, including battery life, sensor quality and GPS stability.
In this work, the authors developed their method based on prior experimental experience where they utilized a battery capable of supporting a 9 km flight lasting at least 10 min and employed the ZENMUSE X5R vision camera. However, the UAV cannot travel more than 4 km from its base because the return-to-home function is then activated. Consequently, the proposed path planning method relies on dividing the forest’s FDI map into 16 (sixteen) equal square areas, where the diagonal of each square equals 4 km. Considering that limited battery life typically restricts the duration and extent of surveillance missions in large areas, the proposed method ensures that a UAV can traverse the shortest route of the square region (its diagonal), both front and back, without the risk of running out of energy. However, if different technical specifications are used for the UAV, its camera or its battery, an alternative division method for the FDI can be applied.
The path planning method is designed with the assumption that UAVs fly at a constant altitude which helps avoid collisions with trees. For the offline route computation in each square, the A* algorithm was used with inputs from the graph of the corresponding area and the UAV’s start and goal positions. To build the graph the authors analyzed each square using the RGB method, applying color mapping from the RGB grids and the UAVs’ camera field of view to build graphs for each square. Additionally, they proposed two heuristic methods to search for the start and goal positions of the UAVs. The “Results” show that the computed graph, and start/goal nodes, helped the UAVs to follow short paths that simultaneously crossed the regions with the highest fire risk. Initially, the authors scanned the areas with a single UAV, but when its scanning was insufficient, multiple UAVs were deployed. The “Results” indicate that UAV collisions were avoided by ensuring each UAV followed a unique path that was not accessible to the other UAVs operating in parallel.
Despite the important operational advantages in airborne monitoring using UAVs that the proposed method conveys, there are still several limitations and challenges that need to be addressed in developing an effective wildfire management strategy. Collecting vast amounts of data can lead to challenges in data processing and analysis, making it difficult to extract actionable insights quickly. Apart from the challenges that are related to the robustness of the equipment involved, UAV operations can also be significantly affected by adverse weather conditions, such as strong winds, rain, fog and smoke, which could limit their effectiveness. Therefore, the proposed UAV based surveillance method can be supported by a network of ground cameras that can be installed in forest regions with high and extremely high fire risk. Combined with stationary ground cameras, the proposed UAV monitoring and path planning method can significantly enhance forest wildfire protection

5. Conclusions—Future Work

A new effective method for the protection of the National Park of Kotychi and Strofylia Wetlands was presented in the previous sections of this work. Wildfires in Greece are responsible for significant ecological disasters that severely harm the country’s unique natural environment. The National Park of Kotychi and Strofylia Wetlands is one such area, where early fire detection is crucial for its protection. The process of forest mapping, building FDI maps and collecting data was outlined. The authors proposed a method that enables efficient collision-free offline path computation for scanning using either a single or multiple UAVs.
As a future work, the collaboration between the network of stationary ground cameras and UAVs can be extensively studied to improve the proposed detection method. For instance, the graphs for the path computation could be reconstructed to also consider the ground cameras’ fields of vision. Furthermore, the proposed path planning method could be applied to the FDI map of the National Park of Kotychi and Strofylia Wetlands or to other Greek forests using different equipment (e.g., UAVs, batteries, cameras, etc.).

Author Contributions

Conceptualization, G.K., K.S. and V.M.; methodology, G.K.; software, G.K.; validation, G.K. and V.M.; formal analysis, G.K. and V.M.; resources, G.K., P.X., K.S. and V.M.; data curation, G.K.; writing—original draft preparation, G.K. and P.X.; writing—review and editing, G.K., K.S. and V.M.; visualization, G.K.; supervision, V.M. All authors have read and agreed to the published version of the manuscript.

Funding

This research received no external funding.

Institutional Review Board Statement

Not applicable.

Informed Consent Statement

Not applicable.

Data Availability Statement

The raw data supporting the conclusions of this article will be made available by the authors on request.

Acknowledgments

Τhis paper has been financed by the funding program “MEDICUS”, of the University of Patras.

Conflicts of Interest

The authors declare no conflicts of interest.

References

  1. 2023 Greece Wildfires. Available online: https://en.wikipedia.org/wiki/2023_Greece_wildfires (accessed on 8 November 2024).
  2. Alkhatib, A.A.A. A review on forest fire detection techniques. Int. J. Distrib. Sens. Netw. 2014, 10, 597368. [Google Scholar] [CrossRef]
  3. Yandouzi, M.; Grari, M.; Idrissi, I.; Moussaoui, O.; Azizi, M.; Ghoumid, K.; Elmiad, A.K. Review on forest fires detection and prediction using deep learning and drones. J. Theor. Appl. Inf. Technol. 2022, 100, 4565–4576. [Google Scholar]
  4. Kolluru, V.K.; Chintakunta, A.N.; Nuthakki, Y.; Koganti, S. Advancements in Wildfire Prediction and Detection: A Systematic Review. Int. J. Multidiscip. Res. 2022, 4, 1–30. [Google Scholar]
  5. Bailon-Ruiz, R.; Lacroix, S. Wildfire remote sensing with UAVs: A Review from The Autonomy Point of View. In Proceedings of the 2020 International Conference on Unmanned Aircraft Systems, ICUAS, Athens, Greece, 1–4 September 2020; pp. 412–420. [Google Scholar]
  6. Moulianitis, V.C.; Thanellas, G.; Xanthopoulos, N.; Aspragathos, N.A. Evaluation of UAV Based Schemes for Forest Fire Monitoring. In Advances in Service and Industrial Robotics Proceedings of the 27th International Conference on Robotics in Alpe-Adria Danube Region, RAAD, Patras, Greece, 6–8 June 2018; Springer International Publishing: Berlin/Heidelberg, Germany, 2019; pp. 143–150. [Google Scholar]
  7. Simoes, D.; Rodrigues, A.; Reis, A.B.; Sargento, S. Forest Fire Monitoring Through a Network of Aerial Drones and Sensors. In Proceedings of the 2020 IEEE International Conference on Pervasive Computing and Communications Workshops, PerCom Workshops, Austin, TX, USA, 23 March 2020; pp. 1–6. [Google Scholar]
  8. Sharma, A.; Singh, P.K. UAV-based framework for effective data analysis of forest fire detection using 5G networks: An effective approach towards smart cities solutions. Int. J. Commun. Syst. 2021, e4826. [Google Scholar] [CrossRef]
  9. Sungheetha, A.; Sharma, R. Real time monitoring and fire detection using internet of things and cloud based drones. J. Soft Comput. Paradig. 2020, 2, 168–174. [Google Scholar] [CrossRef]
  10. Yandouzi, M.; Grari, M.; Berrahal, M.; Idrissi, I.; Moussaoui, O.; Azizi, M.; Ghoumid, K.; Elmiad, A.K. Investigation of combining deep learning object recognition with drones for forest fire detection and monitoring. Int. J. Adv. Comput. Sci. Appl. 2023, 14, 377–384. [Google Scholar] [CrossRef]
  11. Georgiev, G.D.; Hristov, G.; Zahariev, P.; Kinaneva, D. Forest Monitoring System for Early Fire Detection Based on Convolutional Neural Network and Uav Imagery. In Proceedings of the 2020 28th National Conference with International Participation, TELECOM, Sofia, Bulgaria, 29–30 October 2020; pp. 57–60. [Google Scholar]
  12. Macrina, G.; Di Puglia Pugliese, L.; Guerriero, F.; Laporte, G. Drone-aided routing: A literature review. Transp. Res. Part C Emerg. Technol. 2020, 120, 102762. [Google Scholar] [CrossRef]
  13. Christodoulou, C.; Kolios, P. Optimized Tour Planning for Drone-Based Urban Traffic Monitoring. In Proceedings of the 2020 IEEE 91st Vehicular Technology Conference, VTC2020-Spring, Antwerp, Belgium, 25–28 May 2020; pp. 1–5. [Google Scholar] [CrossRef]
  14. Islam, S.; Razi, A. A Path Planning Algorithm for Collective Monitoring Using Autonomous Drones. In Proceedings of the 2019 53rd Annual Conference on Information Sciences and Systems, CISS, Baltimore, MD, USA, 20–22 March 2019; pp. 1–6. [Google Scholar] [CrossRef]
  15. Mesquita, R.; Gaspar, P.D. A Novel Path Planning Optimization Algorithm Based on Particle Swarm Optimization for UAVs for Bird Monitoring and Repelling. Processes 2022, 10, 62. [Google Scholar] [CrossRef]
  16. Melhim LK, B.; Jemmali, M.; Boulila, W.; Alazab, M.; Rani, S.; Campbell, H.; Amdouni, H. Leveraging Drone-Assisted Surveillance for Effective Forest Conservation: A Case Study in Australia’s Daintree Rainforest. IEEE Internet Things J. 2024, 11, 31167–31179. [Google Scholar] [CrossRef]
  17. Wang, Y.; Gao, F.; Li, M. Probabilistic Path Planning for UAVs in Forest Fire Monitoring: Enhancing Patrol Efficiency through Risk Assessment. Fire 2024, 7, 254. [Google Scholar] [CrossRef]
  18. Dimopoulos, V.; Tourkolias, C.; Mirasgedis, S. Valuing Natural Ecosystems: The Case of National Park Kotychi-Strofilia in Peloponnese, Greece. IOP Conf. Series Earth Environ. Sci. 2022, 2022, 1123. [Google Scholar] [CrossRef]
  19. Nastos, P.T.; Dalezios, N.R.; Faraslis, I.N.; Mitrakopoulos, K.; Blanta, A.; Spiliotopoulos, M.; Sakellariou, S.; Sidiropoulos, P.; Tarquis, A.M. Review article: Risk management framework of environmental hazards and extremes in Mediterranean ecosystems. Nat. Hazards Earth Syst. Sci. 2021, 21, 1935–1954. [Google Scholar] [CrossRef]
  20. Xofis, P.; Tsiourlis, G.; Konstantinidis, P. A Fire Danger Index for the early detection of areas vulnerable to wildfires in the Eastern Mediterranean region. Euro-Mediterranean J. Environ. Integr. 2020, 5, 1–13. [Google Scholar] [CrossRef]
  21. Aspragathos, N.; Dogkas, E.; Koutmos, P.; Paterakis, G.; Souflas, K.; Thanellas, G.; Moulianitis, V.C. THEASIS System for Early Detection of Wildfires in Greece: Preliminary Results from its Laboratory and Small Scale Tests. In Proceedings of the 2019 29th Annual Conference of the European Association for Education in Electrical and Information Engineering, EAEEIE, Ruse, Bulgaria, 4–6 September 2019; pp. 1–6. [Google Scholar]
  22. Aggarwal; Shubhani; Kumar, N. Path planning techniques for unmanned aerial vehicles: A review, solutions, and challenges. Comput. Commun. 2020, 149, 270–299. [Google Scholar] [CrossRef]
  23. Trimble Inc. eCognition Developer Reference Book; Trimble Inc.: Munich, Germany, 2014. [Google Scholar]
  24. Scott, J.H.; Burgan, R.E. Standard Fire Behaviour Fuel Models: A Comprehensive Set for Use with Rothermel’s Surface Fire Spread Model. General Technical Report RMRS-GTR-153; Rocky Mountain Research Station: Fort Collins, CO, USA, 2005; p. 72. [Google Scholar]
  25. Palaiologou, P. Design of Fire Behaviour Prediction and Assessment with the Use of Geoinformation. Ph.D. Thesis, University of the Aegean, Lesbos, Greece, 2015. [Google Scholar]
  26. Xofis, P.; Konstantinidis, P.; Papadopoulos, I.; Tsiourlis, G. Integrating Remote Sensing Methods and Fire Simulation Models to Estimate Fire Hazard in a South-East Mediterranean Protected Area. Fire 2020, 3, 31. [Google Scholar] [CrossRef]
  27. Finney, M.A. An overview of FlamMap Fire Modeling Capabilities; USDA Forest Service Proceedings RMRS-P-41; Rocky Mountain Research Station: Fort Collins, CO, USA, 2006. [Google Scholar]
  28. Rothermel, R.C. A Mathematical Model for Predicting Fire Spread in Wildland Fuels. Research Paper INT-115; Department of Agriculture, Forest Service, Intermountain Forest and Range Experiment Station: Ogden, UT, USA, 1972; p. 40. [Google Scholar]
  29. Catry, F.X.; Rego, F.C.; Bacao, F.; Moreira, F. Modeling and mapping wildfire ignition risk in Portugal. Int. J. Wildland Fire 2009, 18, 921–931. [Google Scholar] [CrossRef]
  30. Qin, H.; Shao, S.; Wang, T.; Yu, X.; Jiang, Y.; Cao, Z. Review of Autonomous Path Planning Algorithms for Mobile Robots. Drones 2023, 7, 211. [Google Scholar] [CrossRef]
  31. Liu; Guo, J.; Mason, P.J. Image Processing and GIS for Remote Sensing: Techniques and Applications; John and Wiley and Sons: Hoboken, NJ, USA, 2024. [Google Scholar]
  32. Barnhart, I.H.; Lancaster, S.; Goodin, D.; Spotanski, J.; Dille, J.A. Use of open-source object detection algorithms to detect Palmer amaranth (Amaranthus palmeri) in soybean. Weed Sci. 2022, 70, 648–662. [Google Scholar] [CrossRef]
  33. Tolika, K.; Maheras, P.; Tegoulias, I. Extreme temperatures in Greece during 2007: Could this be a “return to the future”? Geophys. Res. Lett. 2009, 36, 10. [Google Scholar] [CrossRef]
  34. Founda, D.; Giannakopoulos, C. The exceptionally hot summer of 2007 in Athens, Greece—A typical summer in the future climate? Glob. Planet. Chang. 2009, 67, 227–236. [Google Scholar] [CrossRef]
  35. Kontoes, C.; Keramitsoglou, I.; Papoutsis, I.; Sifakis, N.I.; Xofis, P. National scale operational mapping of burnt areas as a tool for the better understanding of contemporary wildfire patterns and regimes. Sensors 2013, 13, 11146–11166. [Google Scholar] [CrossRef] [PubMed]
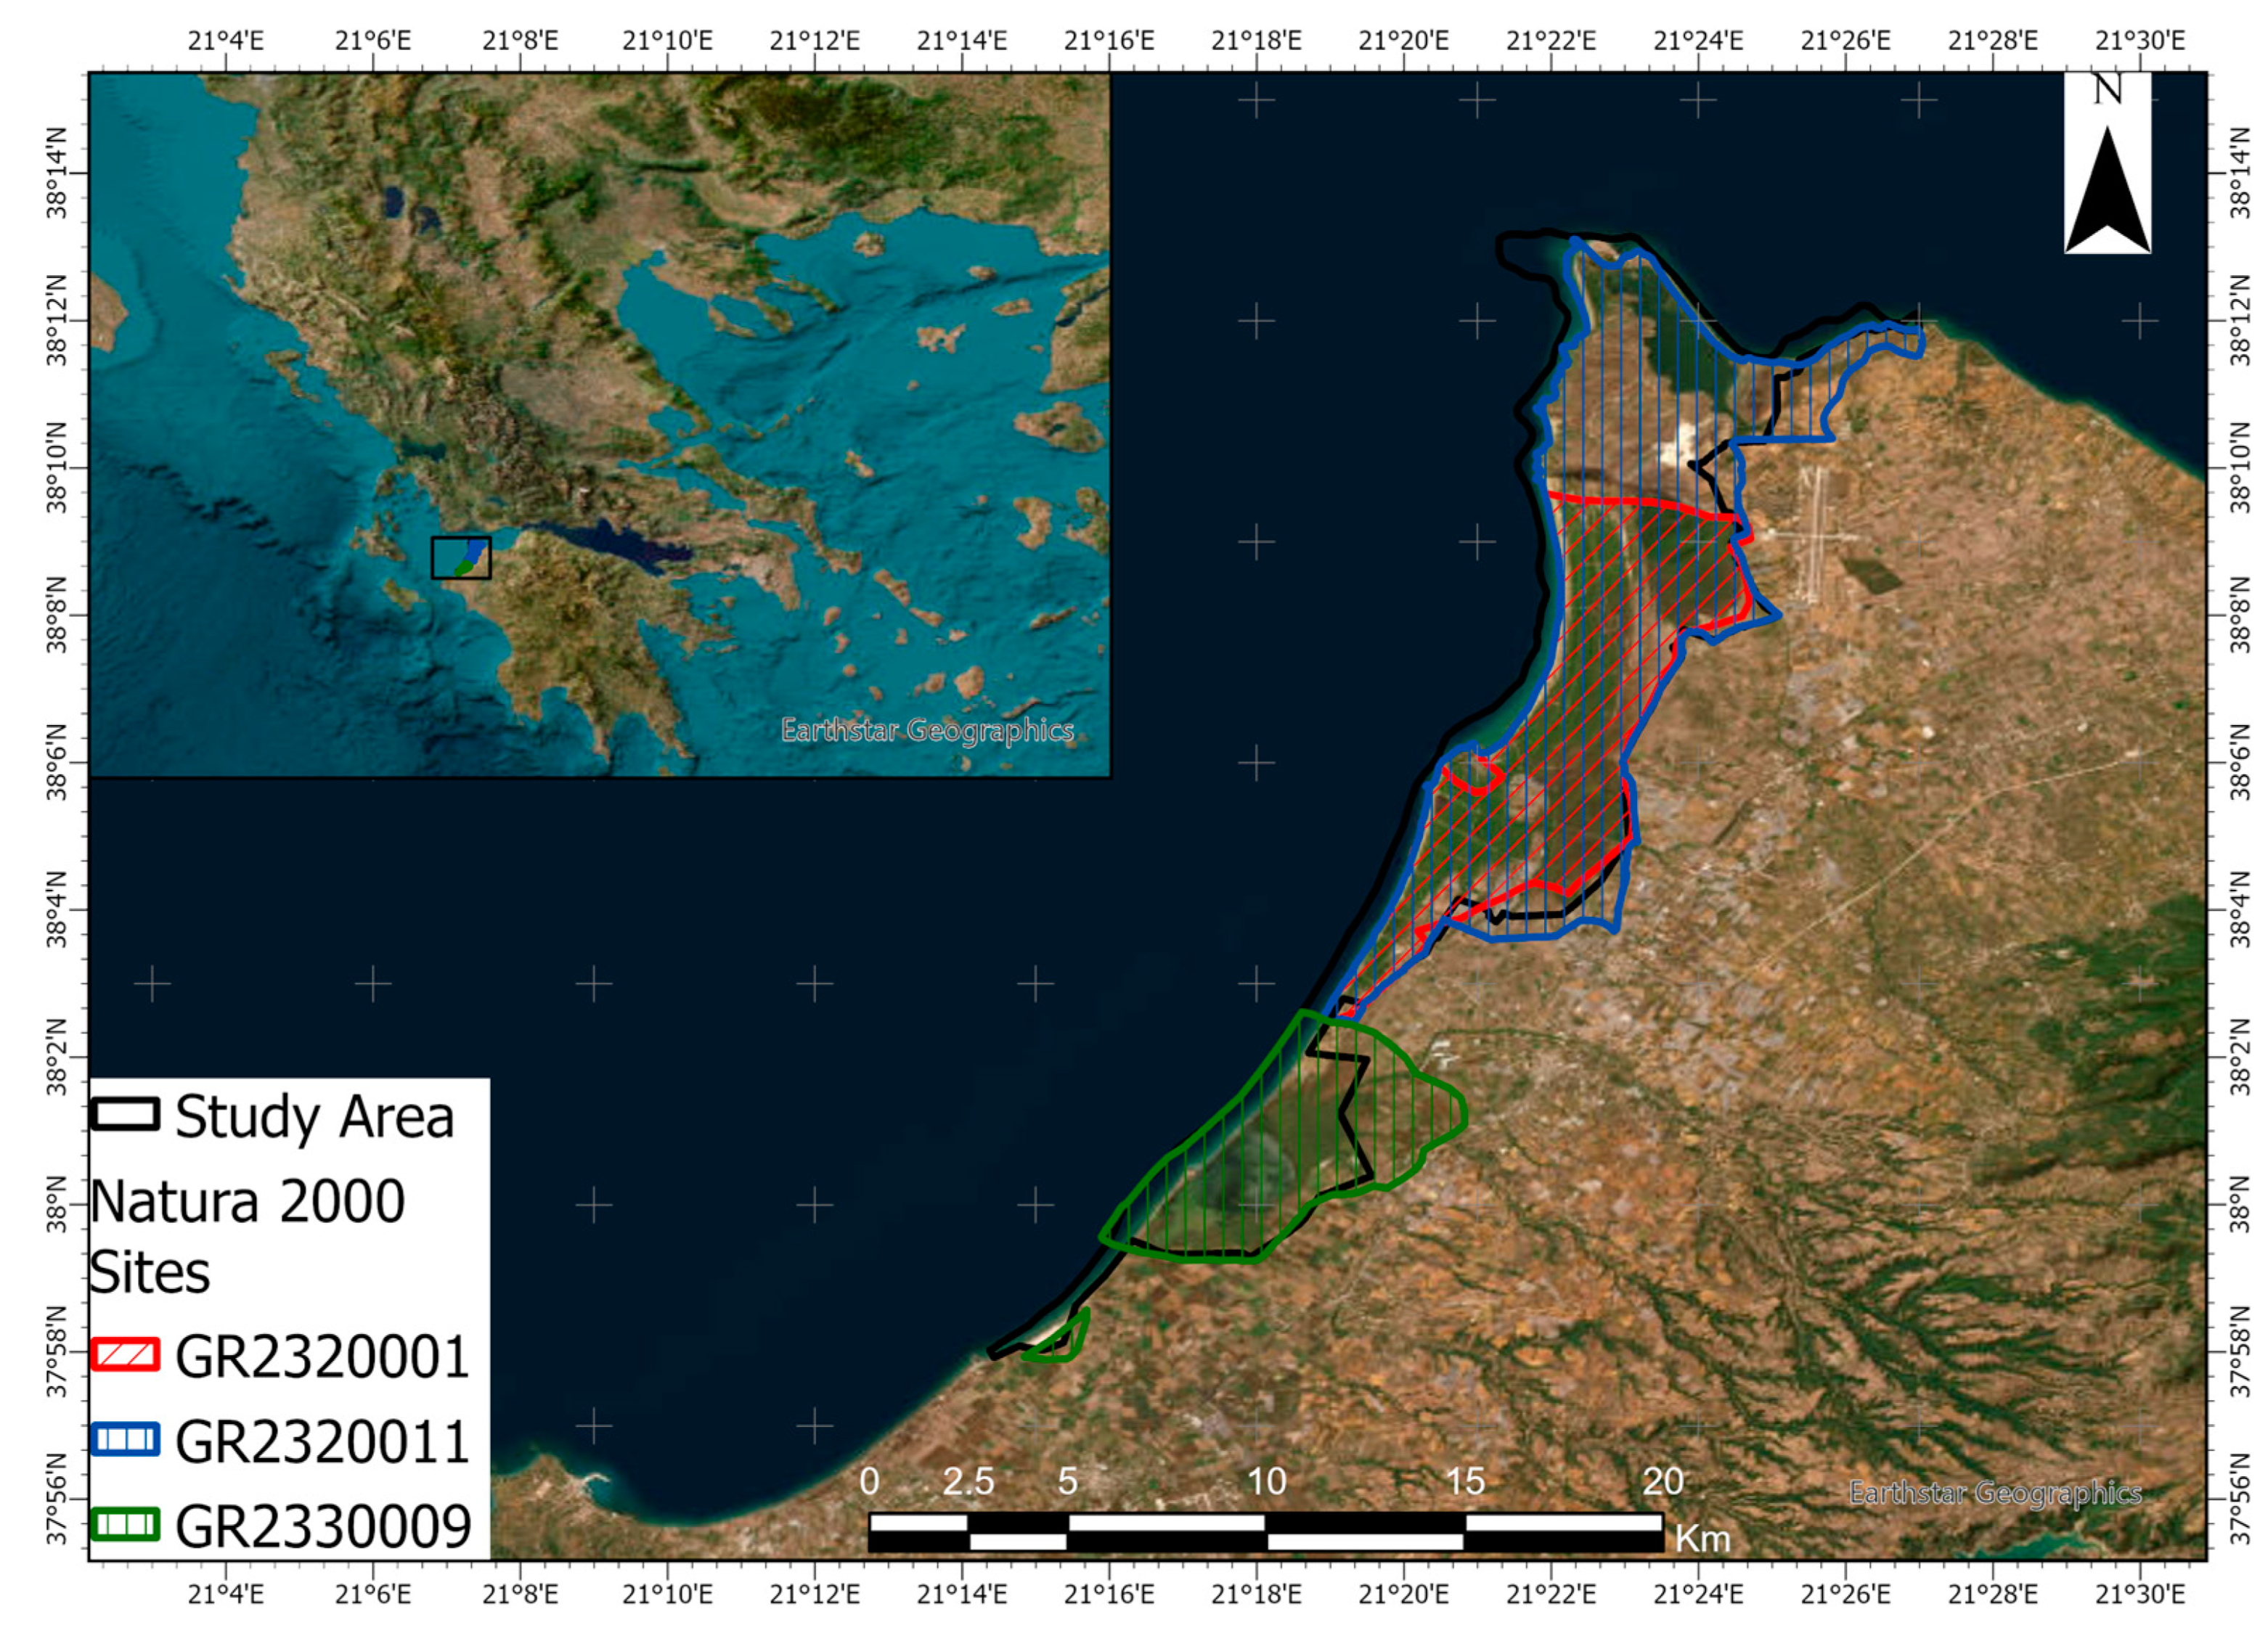
Figure 1. The study area.
Fire 07 00444 g001
Figure 2. Fuel types identified in the study area (Adapted from Xofis et al. [20]).
Fire 07 00444 g002
Figure 4. Flowchart of the path planning method for fire detection in Strofyllia forest.
Fire 07 00444 g004
Figure 5. (a) the UAV’s 8 neighbours in the 3 × 3 RGB grid and the camera’s field of view; (b) the (2∙3 − 1) × (2∙3 − 1)graph based on the 3 × 3 RGB grid; (c) example of the weights calculation of a (2∙2 − 1) × (2∙2 − 1) graph.
Fire 07 00444 g005
Figure 6. Example for the heuristic method to select a pair of start–goal nodes.
Fire 07 00444 g006
Figure 7. Example of the heuristic method to find a pair of start and goal nodes for the parallel flights of multiple UAVs. (a) searching for the UAV with i = 2, and (b) searching for the UAV with i = 3.
Fire 07 00444 g007
Figure 8. (a) square region No.12 covered by of regions with ≈0.5% weights (w)   2 , 5 %  w   4 and 12 %   w < 7 ; (b) square region No. 9 covered by of regions with >5.6% weights ≤ 2, 23% w ≤ 4 and 44% w < 7; (c) start-to-goal A* path and vision of a UAV in (a); (d) start-to-goal A* path and vision of a UAV in (b); (e) start-to-goal A* return path and vision of a UAV in (a); and (f) start-to-goal A* return path and vision of a UAV in (b).
Fire 07 00444 g008
Figure 9. The scanning of the square area No.9 using 2 UAVs, 5.3% of the area is covered by regions with weights ≤ 2, 23% with weights ≤ 4 and 44% with weights < 7. (a) The 2 UAVs paths’ computation node by node, the UAVs come close but the collision between them is avoided; (b) the scanned area using 2 UAVs leaving unscanned 3.5% of the areas with weights ≤ 2, 19% with weights ≤ 4 and 38% with weights < 7; (c) Scanned area using five UAVs, leaving unscanned 2.5% of the areas with weights ≤ 2, 15% with weights ≤ 4 and 25% with weights < 7; and (d) Scanned area using eight UAVs, ≈99% of the areas with weights ≤ 2 is scanned 50% of the regions with weights ≤ 4 and 30% with weights < 7.
Fire 07 00444 g009
Figure 10. Scanned areas of the four square regions that need more than one UAV. (a) square No. 7, UAVs, >65% coverage of the extremely high fire risk regions; (b) square No. 9, 8 UAVs, 99% coverage of the extremely high fire risk regions; (c) square No.10, 4 UAVs, >70% coverage of the extremely high fire risk regions; and (d) square No.11, 4 UAVs, >65% of the extremely high fire risk regions.
Fire 07 00444 g010
Table 1. Fuel models used in the study for the identified landcover types (Source: Xofis et al. [20]).
FM CodeDescriptionCorresponding Landcover Type(s)Source
FM01Pine forests with shrub understory at more than 50% of the areaPure or mixed stands with P. pinea and P. halepensisPalaiologou [25]
FM02Pine forests with shrub understory at less than 50% of the areaPure or mixed stands with P. pinea and P. halepensisPalaiologou [25]
FM03Pine forests with occasional shrub understoryPure or mixed stands with P. pinea and P. halepensisPalaiologou [25]
GS1Low Load, Dry Climate Grass–ShrubGrasslandsScott and Burgan [24]
GS3Moderate Load, Humid Climate Grass–Shrub (Dynamic)Recently burned areasScott and Burgan [24]
GS4High Load, Humid Climate Grass–Shrub (Dynamic)Wet MeadowsScott and Burgan [24]
SH2Moderate Load Dry Climate ShrubJ. phoenicea shrublands (moderate density)Scott and Burgan [24]
SH7Very High Load, Dry Climate ShrubJ. phoenicea shrublands (high density), Artificially regenerated stands of P. halepensis and P. pinea not exceeding 8 m heightScott and Burgan [24]
TU1Low Load Dry Climate Timber–Grass–Shrub (Dynamic)Q. aegilops standsScott and Burgan [24]
NB3Agricultural areasAgricultural areasScott and Burgan [24]
NB8Open waterSea and inland waterScott and Burgan [24]
NB9Bare groundBare groundScott and Burgan [24]
Table 2. Results showing (a) the high fire risk areas in the 16 square regions of the FDI map, (b) the areas detected using a single UAV, and (c) how many UAVs are needed for each of the 16 squares.
Number of the Square AreaPercentage of the Square Area That Is Covered by Extremely High and High Fire Danger Risk RegionsPercentage of the Extremely High and High Fire Risk Regions That Are Scanned Using a Single UAVMaximum Number of UAVs That Can Scan Simultaneously the Region
w ≤ 2w ≤ 4w ≤ 2w ≤ 4
10%10%-70%1
20%<0.1%-100%1
30%<0.1%-100%1
40%0%NO SCANNING IS NEEDED
50%3.5%0%0%1
60%0.7%0%0%1
77.5%24.1%14%9%6
80%0.4%-100%1
95.3%23%13%8%8
109.4%15.5%12%10%4
116.7%11.6%20%16%4
120.5%2.5%99%95%1
130%<0.1%-100%1
140%<0.1%-100%1
15<0.1%1.5%100%100%1
160%0%NO SCANNING IS NEEDED
Disclaimer/Publisher’s Note: The statements, opinions and data contained in all publications are solely those of the individual author(s) and contributor(s) and not of MDPI and/or the editor(s). MDPI and/or the editor(s) disclaim responsibility for any injury to people or property resulting from any ideas, methods, instructions or products referred to in the content.