Article

Soil Burn Severity Assessment Using Sentinel-2 and Radiometric Measurements

by
Rafael Llorens
1,
José Antonio Sobrino
1,*,
Cristina Fernández
2,
José M. Fernández-Alonso
2 and
José Antonio Vega
2
1
Global Change Unit, Image Processing Laboratory, University of Valencia, E-46980 Paterna, Spain
2
Centro de Investigación Forestal de Lourizán, Xunta de Galicia, E-36156 Pontevedra, Spain
*
Author to whom correspondence should be addressed.
Fire 2024, 7(12), 487; https://doi.org/10.3390/fire7120487
Submission received: 2 December 2024 / Revised: 16 December 2024 / Accepted: 20 December 2024 / Published: 23 December 2024

Abstract

:
The objective of this article is to create soil burn severity maps to serve as field support for erosion tasks after forest fire occurrence in Spain (2017–2022). The Analytical Spectral Device (ASD) FieldSpec and the CIMEL CE-312 radiometers (optical and thermal, respectively) were used as input data to establish relationships between soil burn severity and reflectance or emissivity, respectively. Spectral indices related to popular forest fire studies and soil assessment were calculated by Sentinel-2 convolved reflectance. All the spectral indices that achieve the separability index algorithm (SI) were validated using specificity, sensitivity, accuracy (ACC), balanced accuracy (BACC), F1-score (F1), and Cohen’s kappa index (k), with 503 field plots. The results displayed the highest overall accuracy results using the Iron Oxide ratio (IOR) index: ACC = 0.71, BACC = 0.76, F1 = 0.63 and k = 0.50, respectively. In addition, IOR was the only spectral index with an acceptable k value (k = 0.50). It is demonstrated that, together with NIR and SWIR spectral bands, the use of blue spectral band reduces atmospheric interferences and improves the accuracy of soil burn severity mapping. The maps obtained in this study could be highly valuable to forest agents for soil erosion restoration tasks.

1. Introduction

Forest fires are one of the most common causes of ecosystem disturbance, such as vegetation loss, soil erosion, and runoff [1,2]. In countries such as Spain where summers are becoming hotter and drier, forest fires occur more frequently and are larger in size, causing environmental and economic losses [3].
One of the major problems encountered at the environmental level is the risk of erosion, which is closely related to the soil burn severity after fires [4,5,6,7]. Soil burn severity is defined as the level of change caused by fire at the level of organic cover, biomass burning, and mineral soil [8,9]. Both in Atlantic climates (where high levels of precipitation influence vegetation development by preventing soil monitoring) and in Mediterranean climates (where the abandonment of rural areas and the increase in temperature due to climate change led to an increase in accumulated fuel), it is considered of vital importance to assess the risk of erosion in order to prevent greater damages (increased probability of flooding, loss of flora and fauna, …) [10,11,12,13,14]. In this sense, a correct and accurate prediction of soil burn severity associated with erosion risk is necessary, although challenging [15].
The use of remote sensing is a reliable and accurate technique for the study of forest fires [16]. Satellite sensors make it possible to monitor changes quickly, easily, and remotely [17,18]. Historically, several sensors on board earth-orbiting satellites and aircrafts have been used to observe and detect forest fires [9]. One of the most widely used sensors for the study of forest fires today is the MultiSpectral Instrument (MSI) on board the Sentinel-2 satellite [19]. Due to its spatial (10–60 m) and spectral resolution (443–2190 nm), several authors recommend its use for analysis of burned areas and fire severity (vegetation + soil) [20,21,22,23,24,25,26,27,28]. Its temporal resolution (3–5 days), allows us to analyze changes in a burned area in a continuous way, except in areas with a high presence of clouds [23,29]. The spectral behavior of Sentinel-2 bands, such as near-infrared (NIR) and shortwave infrared (SWIR) spectral regions, are relevant for detecting changes in forest cover [30] and changes in landscape moisture [31], respectively. In pre-fire conditions, the NIR region shows high reflectance values related to healthy vegetation. Conversely, the SWIR region shows low reflectance due to water absorption [32]. After post-fire, the NIR reflectance decreases due to a leaf pigment and cell structure reduction [33]. In contrast, SWIR reflectance increases due to the drying effect of the fire [34]. Red-Edge spectral region allows monitoring chlorophyll content absorption in vegetation [29]. In addition, synergy between blue and red spectral regions minimizes the effects of atmospheric scattering caused by aerosols in the red channel [35].
Together with optical sensors, the thermal spectrum is also a useful source of information in forest fires applications [36,37,38,39,40]. In particular, the emissivity parameter, defined as the ratio between the object emitting capacity and that of a blackbody at the same temperature, shows changes when soil properties, such as moisture content, organic matter, and mineral composition, are affected by forest fires [41]. In contrast to temperature, emissivity remains constant allowing a homogeneous classification of the study area without depending on image acquisition time. Sensors such as the Advanced Spaceborne Thermal Emission and Reflection Radiometer (ASTER) and the Moderate Resolution Imaging Spectroradiometer (MODIS), onboard TERRA satellite and the Thermal Infrared Sensor (TIRS), and onboard Landsat-8 satellite are commonly used in multiple forest fires applications [36,37,38,39,40].
Although remote sensing is widely used in the forest fires field, there are several restrictions that impede soil burn severity estimation with the same reliability as fire severity [42]. These restrictions are due to factors such as interference between atmospheric absorption and soil absorption and the interference of burned trees shadows. Moreover, the presence of different soil burn severity levels on the field is much more heterogeneous (one pixel contains a mixture of spectral response of different canopies) compared to different fire severity levels focused on vegetation strata, where large areas of land sharing the same fire severity can be observed [43].
As a method to support remote sensing, techniques such as optical radiometers (350–2500 nm), which have proven to be useful in the study of soil properties within a forest fire [12,27], can be used. The Analytical Spectral Device (ASD) FieldSpec radiometer was used in several studies related to forest fires [44,45,46]. In addition, thermal radiometers are also useful in forest fires assessment. In this sense, CIMEL CE-312 radiometer (8–14 µm) enables the precise measurement of brightness temperature from which emissivity can be obtained for 6 different channels. In contrast to satellite or airborne sensors, optical and thermal radiometers allow repeated in situ measurements with very high spatial resolution (depending on the FOV), spectral resolution (hyperspectral sensor with a bandwidth of less than 10 nm), and minimize the atmospheric effect on the measurements.
However, for both satellite-borne sensors and radiometers, in order to choose the best areas to measure and validate the results obtained, it is important to obtain a classification that describes the soil burn severity. This classification allows an easy identification of different soil burn severity levels from visual indicators (e.g., changes in color or structure) [6,43]. One of the most widely used classifications for fire severity validation is the Composite Burned Index (CBI), which visually estimates the impact of fire on combined vegetation and soil strata. However, several authors advise the need to split the assessment of fire severity into vegetation and soil, pointing out the different fire behavior for both canopies and for different vegetation types [47,48,49,50]). Other widely used methods, such as the classification proposed by [6], focus the classification exclusively on the damage suffered by the ground, focusing on those areas where the vegetation has been completely consumed (high fire severity).
The aim of this article is to create soil burn severity maps to serve as field support for forest agents in charge of eroded soil rehabilitation after forest fire occurrence in Spain (2017–2022). Due to the heterogeneity of soil burn severity levels found on small surfaces (less than pixel size) and the few methods that focus on the study of soil burn severity (non-vegetation), the main challenges encountered throughout this study are the following: (1) Determining the spectral region that best discriminates between soil burn severity levels; (2) Analyzing the correlation between radiometric measurements and reflectance obtained with satellite sensors; (3) Choosing the classification map that obtains the most accurate statistical results.

2. Materials and Methods

2.1. Study Area

This study is focused on large forest fires (>500 Ha) that occurred in Spain between 2017 and 2022 (Figure 1). Forest fires studied involve two climatic regions: Mediterranean and Atlantic [51,52]. The Mediterranean region has mean temperatures and rainfall round 3–10 °C and 100 mm, respectively, and hot summers (mean temperatures and rainfall round 20–25 °C and 25–50 mm, respectively). The Atlantic climate has abundant rainfall (>750 mm) and an average temperature between 9 and 15 °C during the whole year. The mean temperature (9–11 °C) increases in the mainland hilly regions (12–15 °C). Burned areas analyzed cover over 100,000 Ha, classified mainly as Pinus sylvestris L., Pinus pinea L., Pinus pinaster Ait., Pinus radiata, Pinus nigra, Populus × canadensis, Populus nigra, Quercus pyrenaica, Quercus ilex, Quercus suber, Acacia dealbata, Alnus glutinosa, Fraxinus angustifolia, Juniperus oxycedrus, Juniperus communis, Castanea sativa, Salix spp., Olea europaea, Arbutus unedo, Eucalyptus nitens, Eucalyptus camaldulensis, and Eucalyptus globulus Labill. with a shrubby understory of Erica L. sp., Cistus L. sp., and Cytisus Desf. Sp. The burned affected soil is divided between Leptosols and Cambisols developed on slates and granite and gneiss with sandy loam texture.

2.2. Field Plots

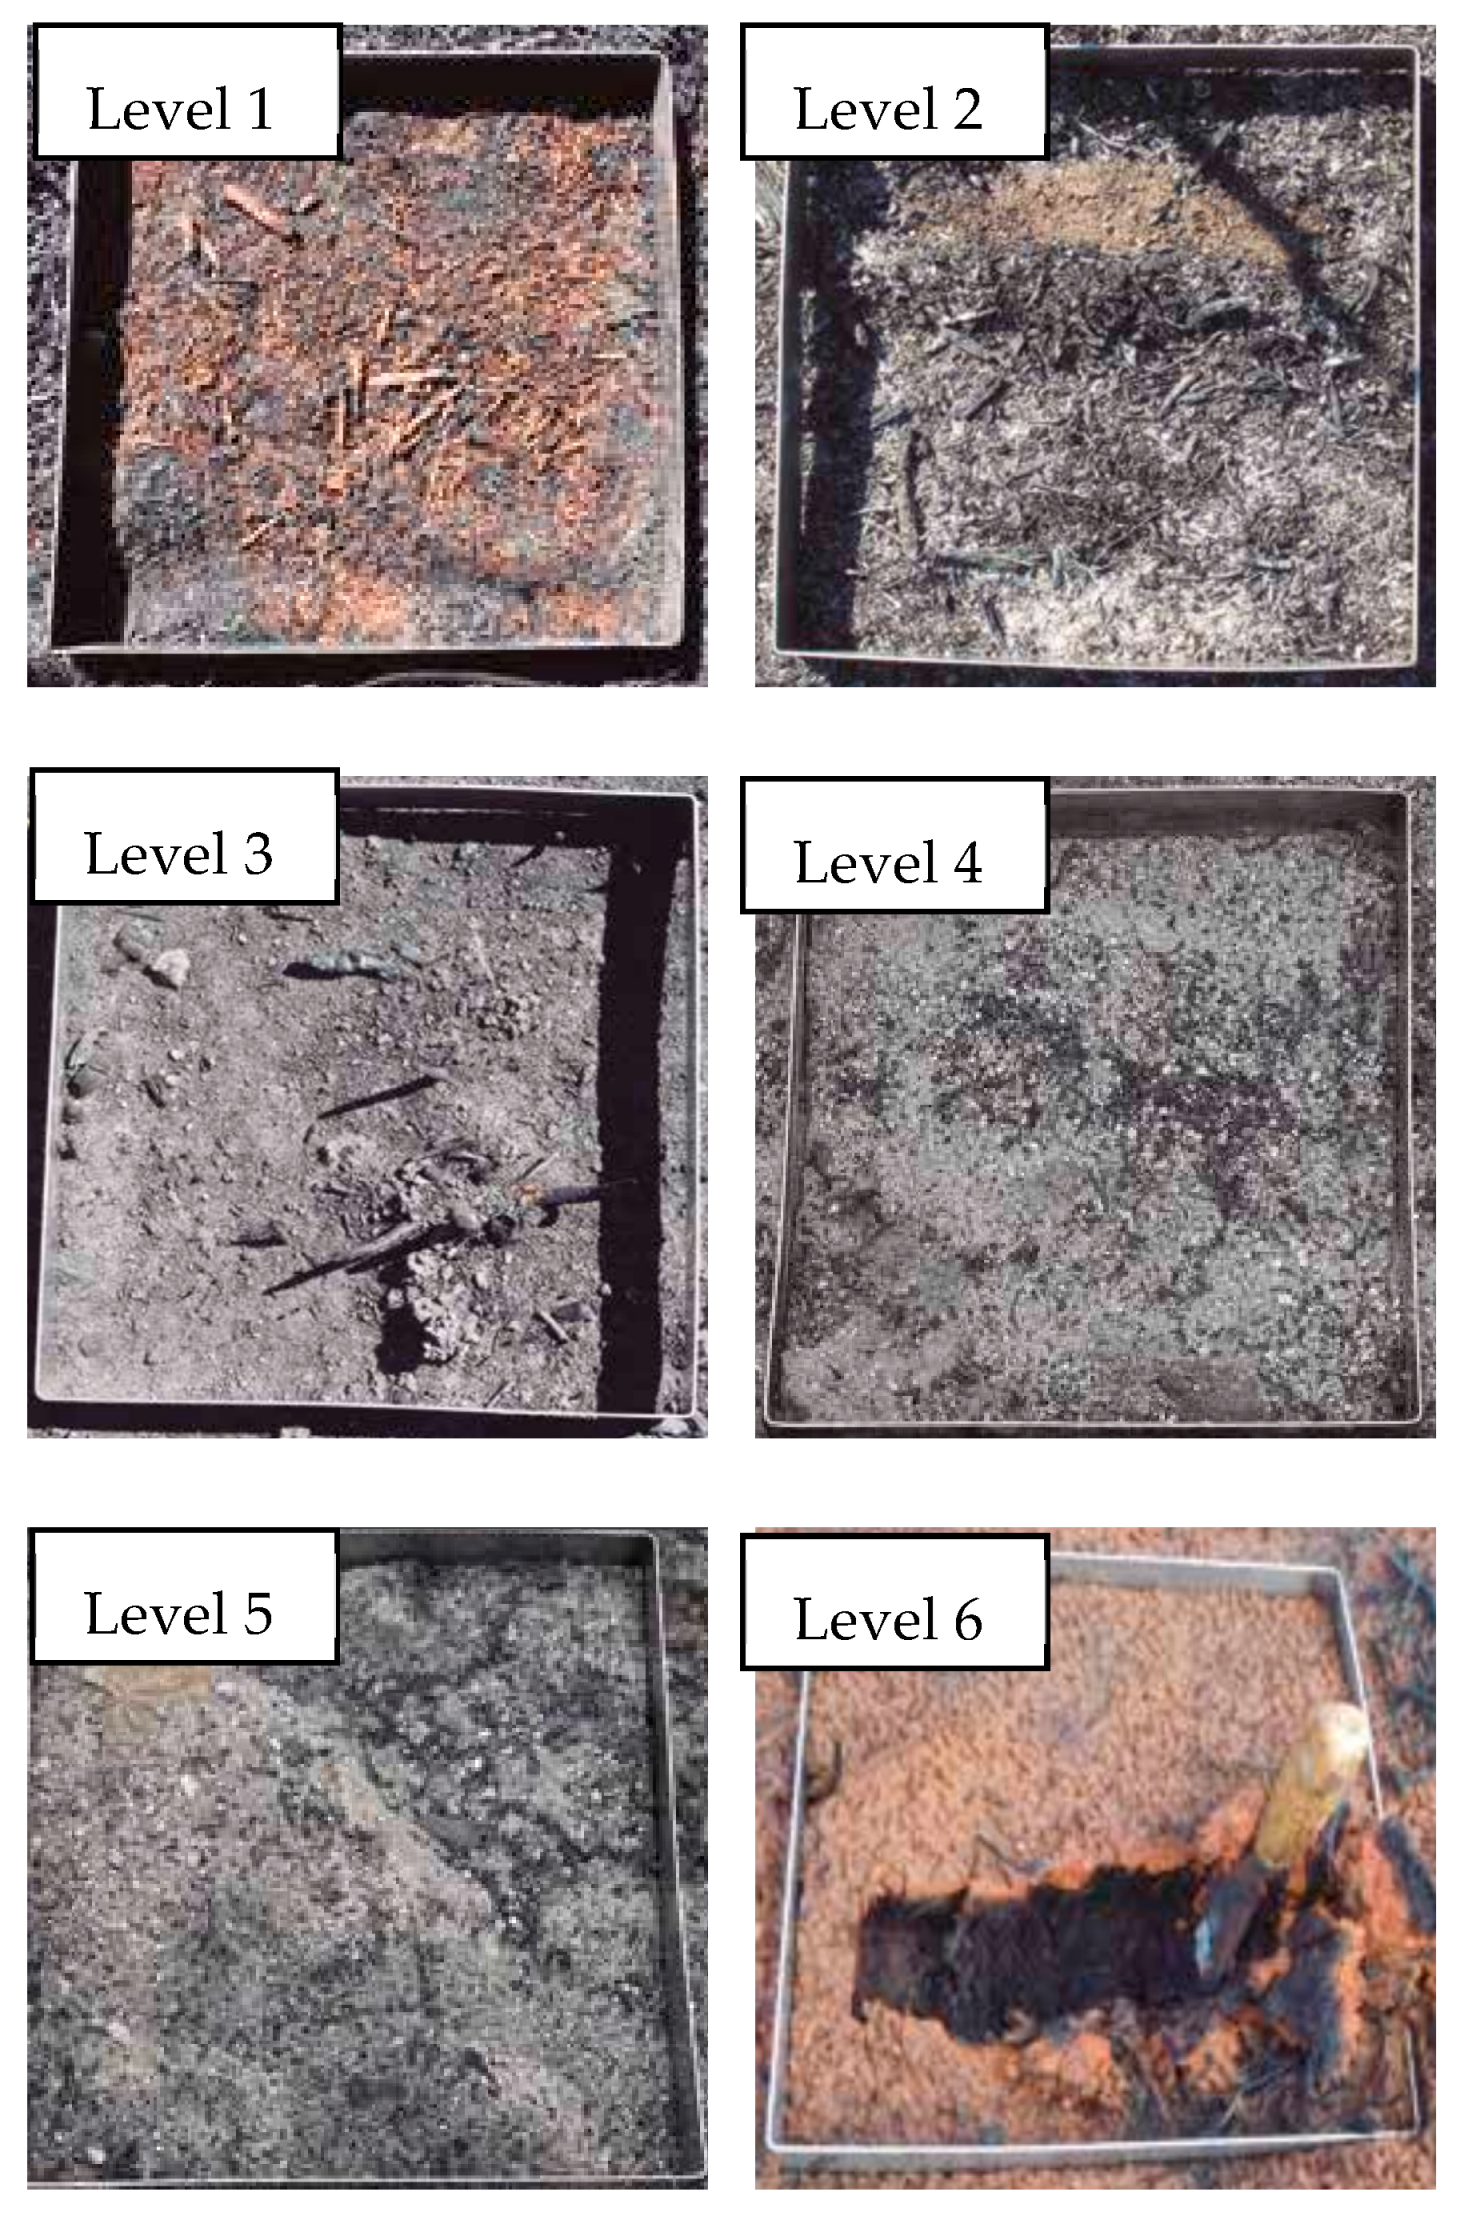
503 sampling plots were established in areas where the vegetation was fully consumed by crown fire (minimum size 60 m × 60 m) and where stone cover (particle diameter > 10 cm) was <50%. We assessed soil burn severity in plots of radius 20 m (Sentinel−2 pixel size), centered in the larger plots. The soil burn severity was assessed with the aid of a 20 cm × 20 cm quadrat, which was placed at 80 systematically selected points along two perpendicular transects. The soil in each quadrat was classified using a modified version [6] of the soil burn severity index proposed by [43]. That classification considers six soil burn severity levels: (Level 1) very low soil burn severity: burned litter (Oi) but limited duff (Oe + Oa) consumption; (Level 2) low burn severity: Oa layer totally charred and covering mineral soil, possibly some ash; (Level 3) moderate soil burn severity: forest floor (Oi + Oe + Oa layers) completely consumed (bare soil), but soil organic matter not consumed and surface soil intact; (Level 4) high soil burn severity: forest floor completely consumed, soil organic matter in Ah horizon consumed and soil structure altered within a depth of less than 1 cm; (Level 5) very high soil burn severity: same as high soil burn severity but within a soil depth equal to or greater than 1 cm; and (Level 6) the same as Levels 4 and 5 and color altered (reddish). Due to the impossibility of detecting differences in depth, soil burn severity levels 4, 5, and 6 were grouped into a single level (high severity). None of the field plots obtained were classified as Level 1. The field campaign dates and spatial distribution of soil burn severity plots are compiled in Table 1. Figure 2 shows the different soil burn severity levels classified using a modified version [6] of the soil burn severity index proposed by [43].

2.3. Radiometric Measurements

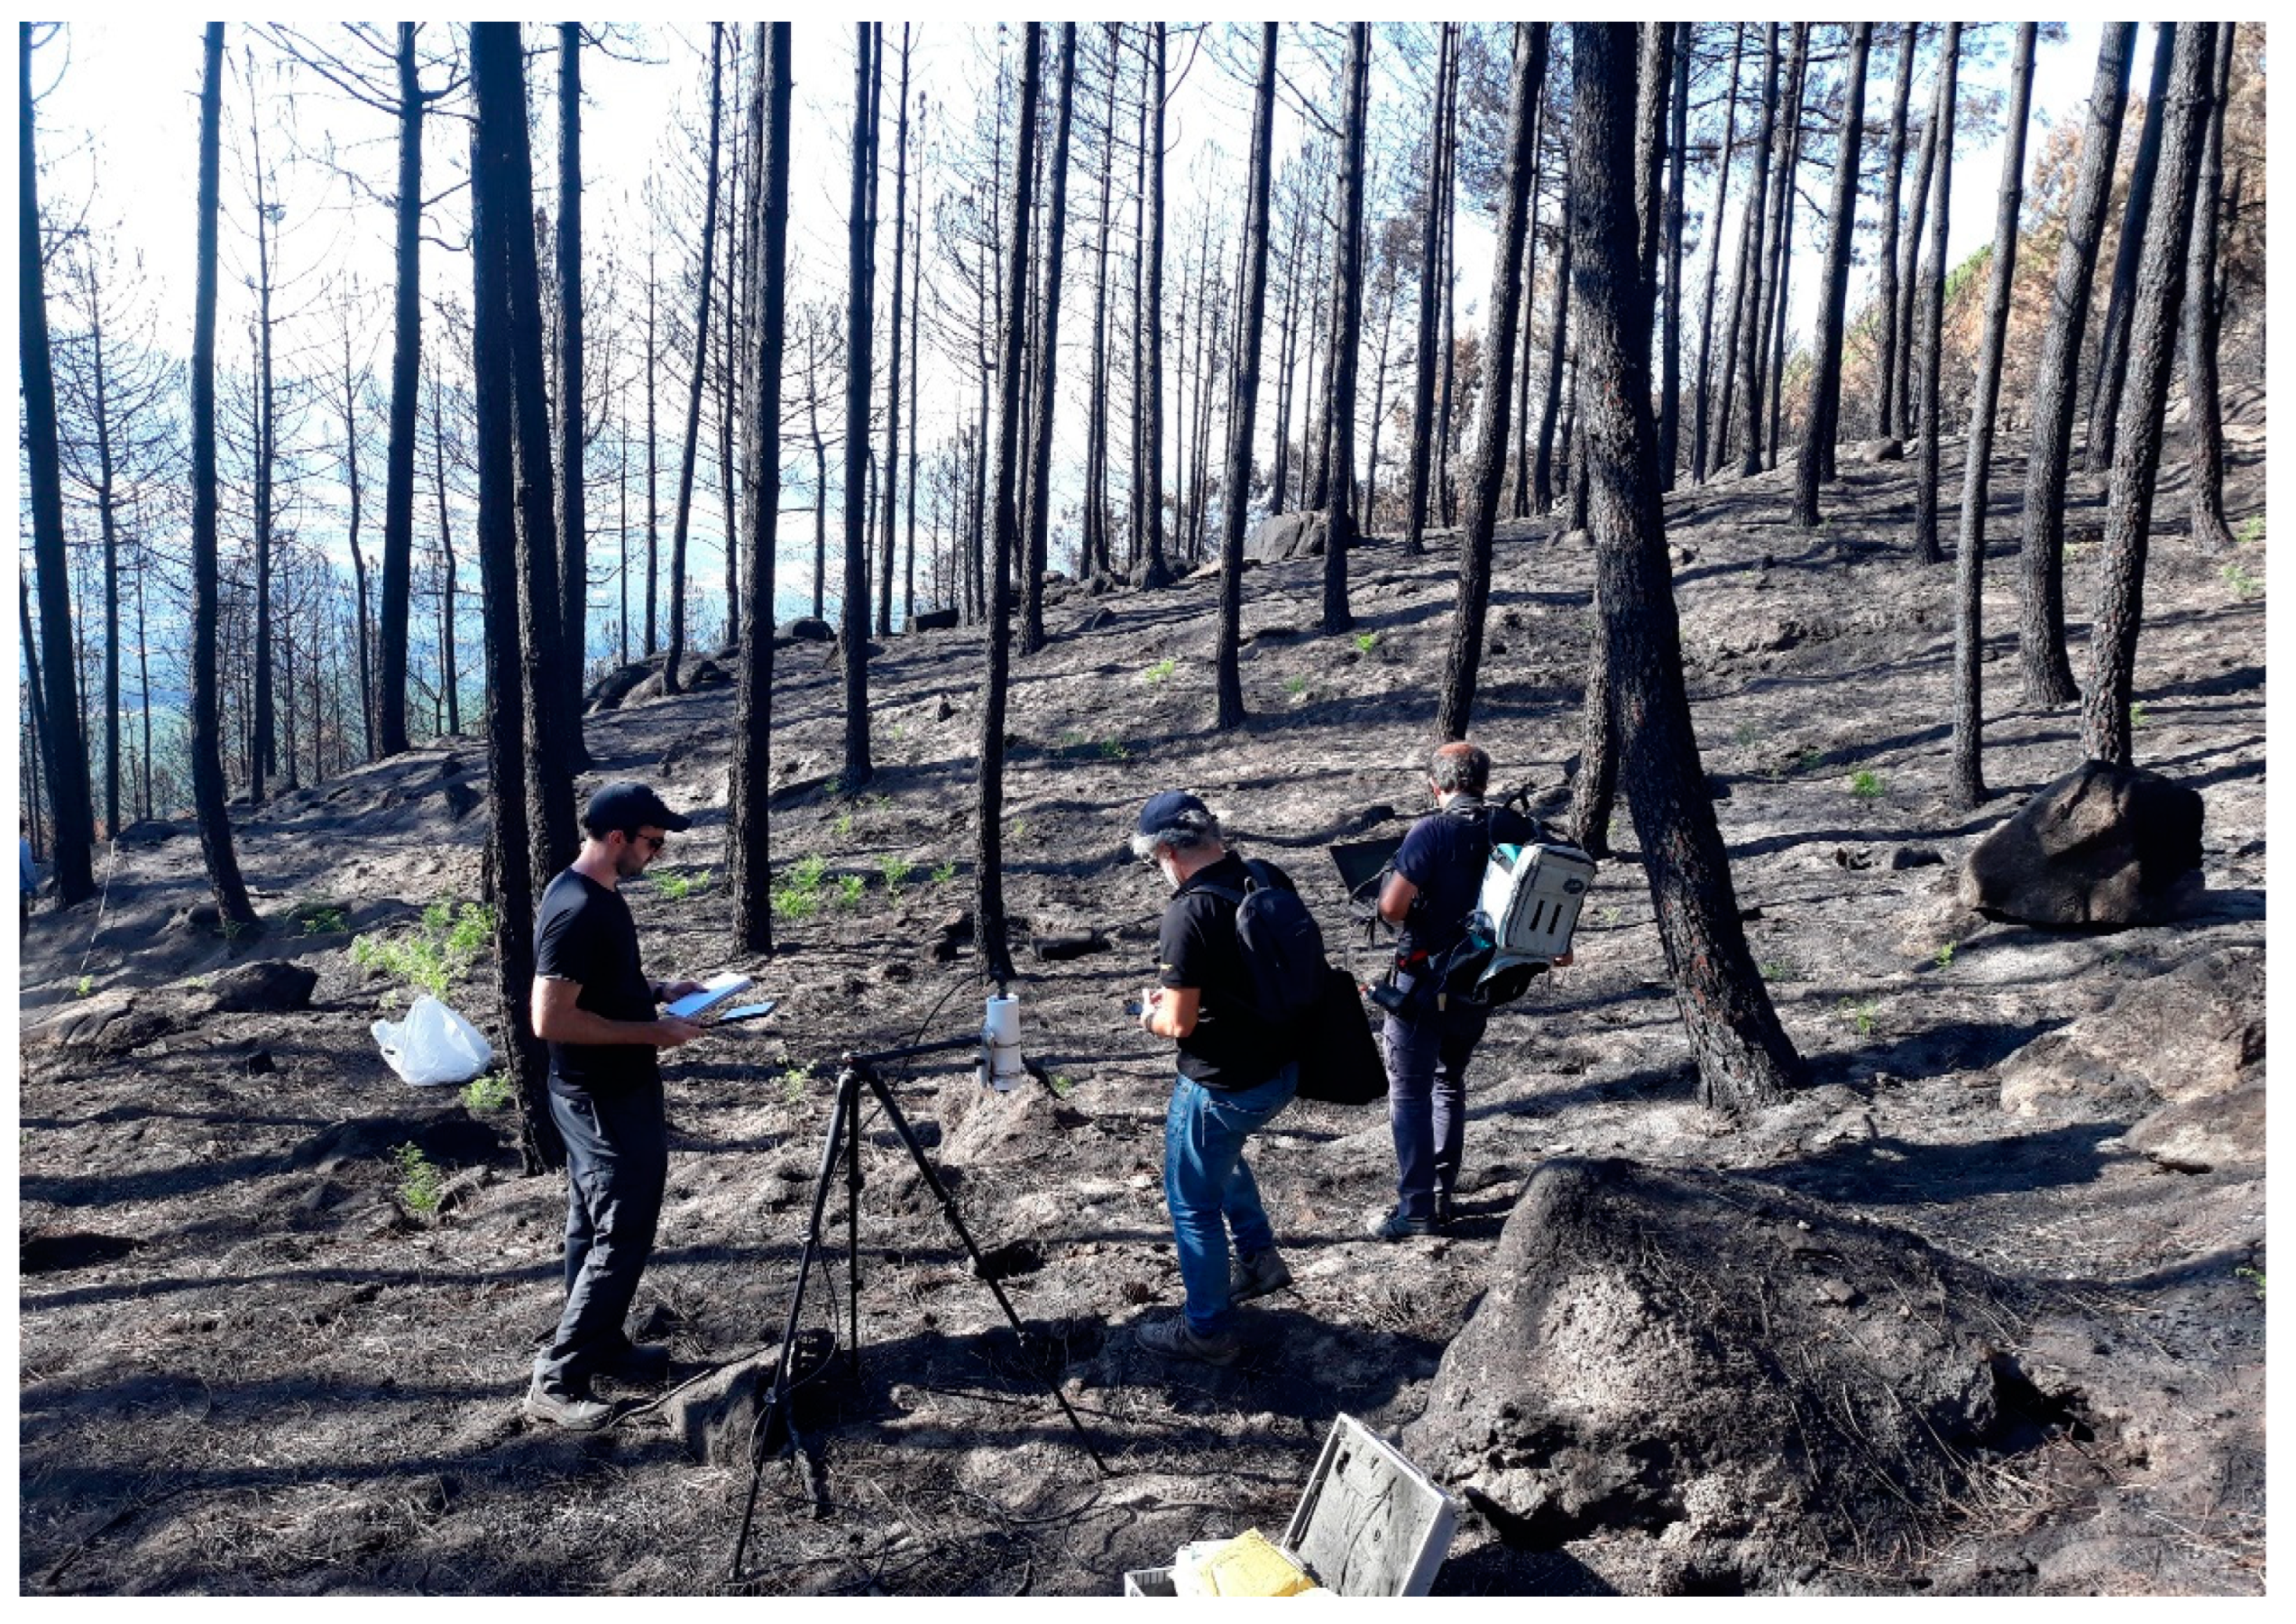
Together with the soil burn severity plots, radiometric measurements were carried out in the most homogeneous areas with the lowest percentage of tree shadows (Figure 3). The forest fires chosen for radiometric measurements were Vilaza (10 October 2018), Nerva (4 October 2018), Pedro Bernardo (2 August 2019), and Real Sitio de San Ildefonso (5 September 2019) (They were chosen by spatial proximity and good accessibility). A total of 68 radiometric measurements were taken according to the classification shown in Figure 2: 19 to low severity (Level 2), 18 to moderate severity (Level 3) and 31 to high severity (10 Level 4, 12 Level 5, and 9 Level 6).
On the one hand, the thermal radiometer CIMEL CE-312 was used on the field. This instrument is specifically designed for precise measurements of thermal infrared radiation in 6 bands (large band 8–14 µm, 8.44 µm, 8.69 µm, 9.15 µm, 10.57 µm, and 11.29 µm). CIMEL CE-312 provides real-time spectral luminance and brightness temperature measurements. The measurement procedure on the field was the following: (1) instrument installation above 1 m height tripod; (2) sky radiation correction using gold panel (perfect reflector in thermal spectral region); (3) three consecutive measurements over the same point; (4) another sky radiation correction using gold panel. Once the field measurements were performed, Land Surface Temperature (LST) and emissivity (ɛ) parameters were obtained by the temperature and emissivity separation (TES) algorithm [53]. This algorithm relies on an empirical relationship between spectral contrast and minimum emissivity, deduced from emissivity spectra obtained in both laboratory and field settings [53]. On the other hand, the optical radiometer Analytical Spectral Devices (ASD) FieldSpec® spectrometer, with a spectral resolution range between 350 and 2500 nm and a bandwidth range between 3 and 6 nm, was used. Atmospheric absorption regions from spectrum were deleted in order to avoid noise values. Measurements were carried out in two different scenarios: the first was directly on the field; the second was at the National Institute for Aerospace Technology (INTA) laboratory. All measurements were performed on the same samples independently of the scenario. In both scenarios, three measurements at nadir per sample were taken at a distance of 20 cm between the instrument and the sample, with the sky free of clouds and avoiding tree shadows. The measurements were taken between 10:30 a.m. and 14:00 p.m. on clear, sunny day. Sky radiation correction was carried out using a Spectralon (perfect reflector in optical spectral region), calibrating and converting radiance to reflectance.
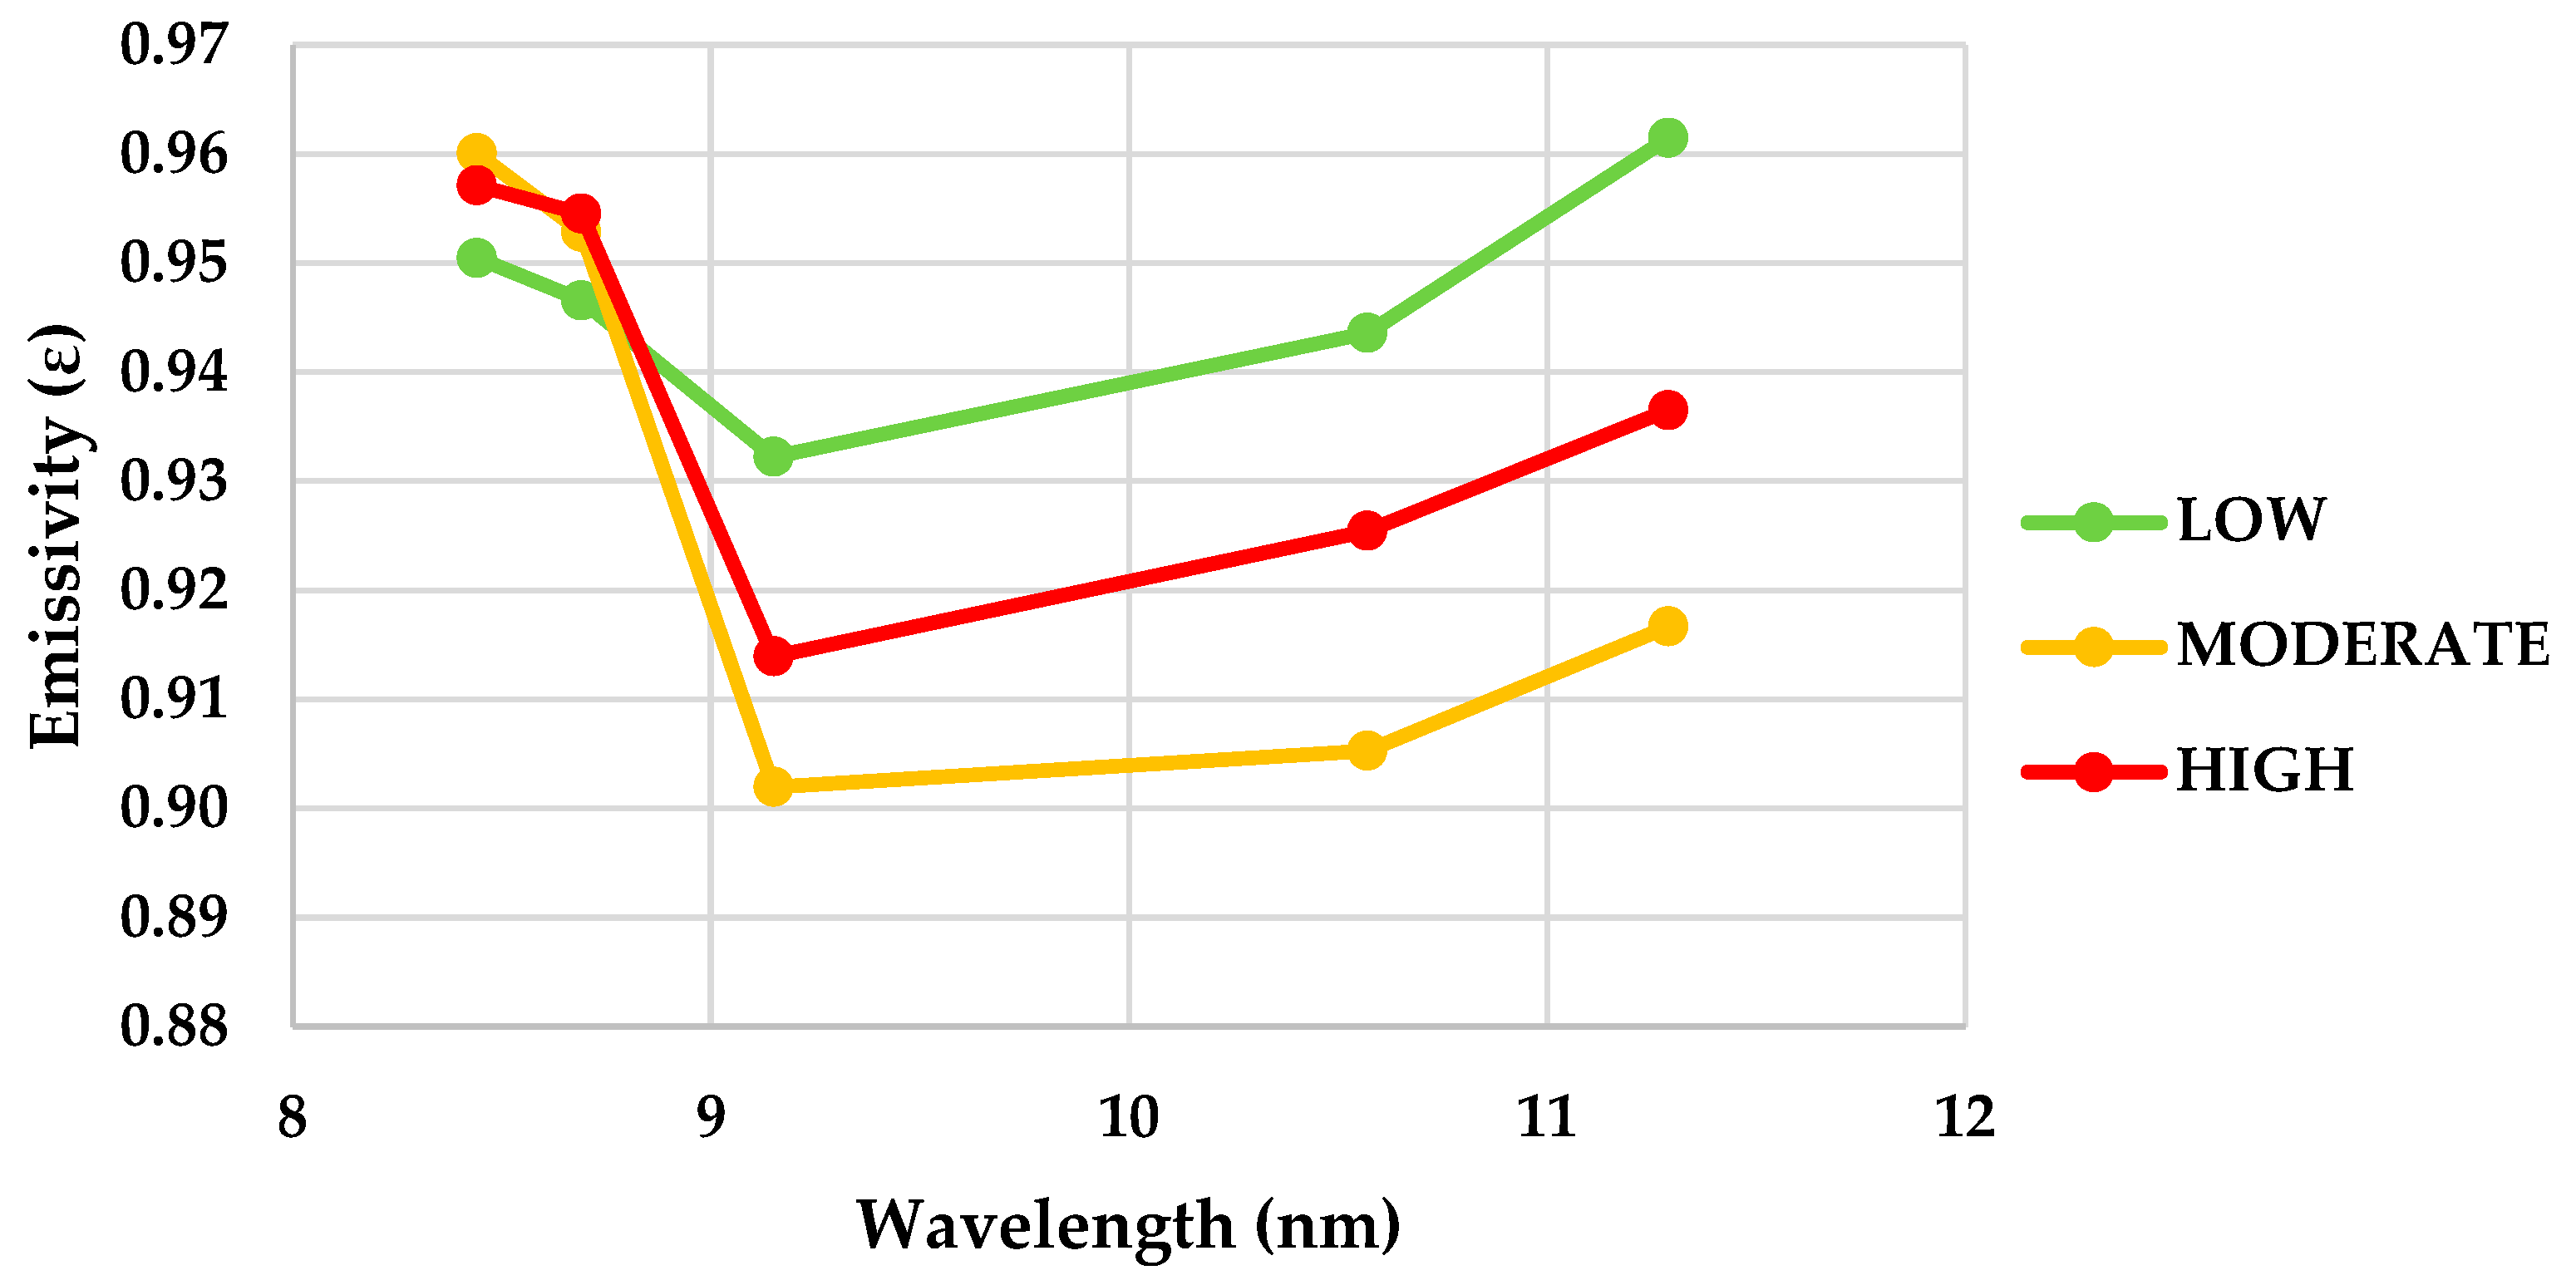
Figure 4 shows the CIMEL CE-312 emissivity data obtained after TES algorithm application. Due to the low separability among several soil burn severity levels (related to the impossibility to detect differences in soil depth), the decision was made to reclassify the measurements into three new levels: low severity (severity 2), moderate severity (3), and high severity (4, 5, and 6). Figure 5 illustrates the reclassified emissivity values.
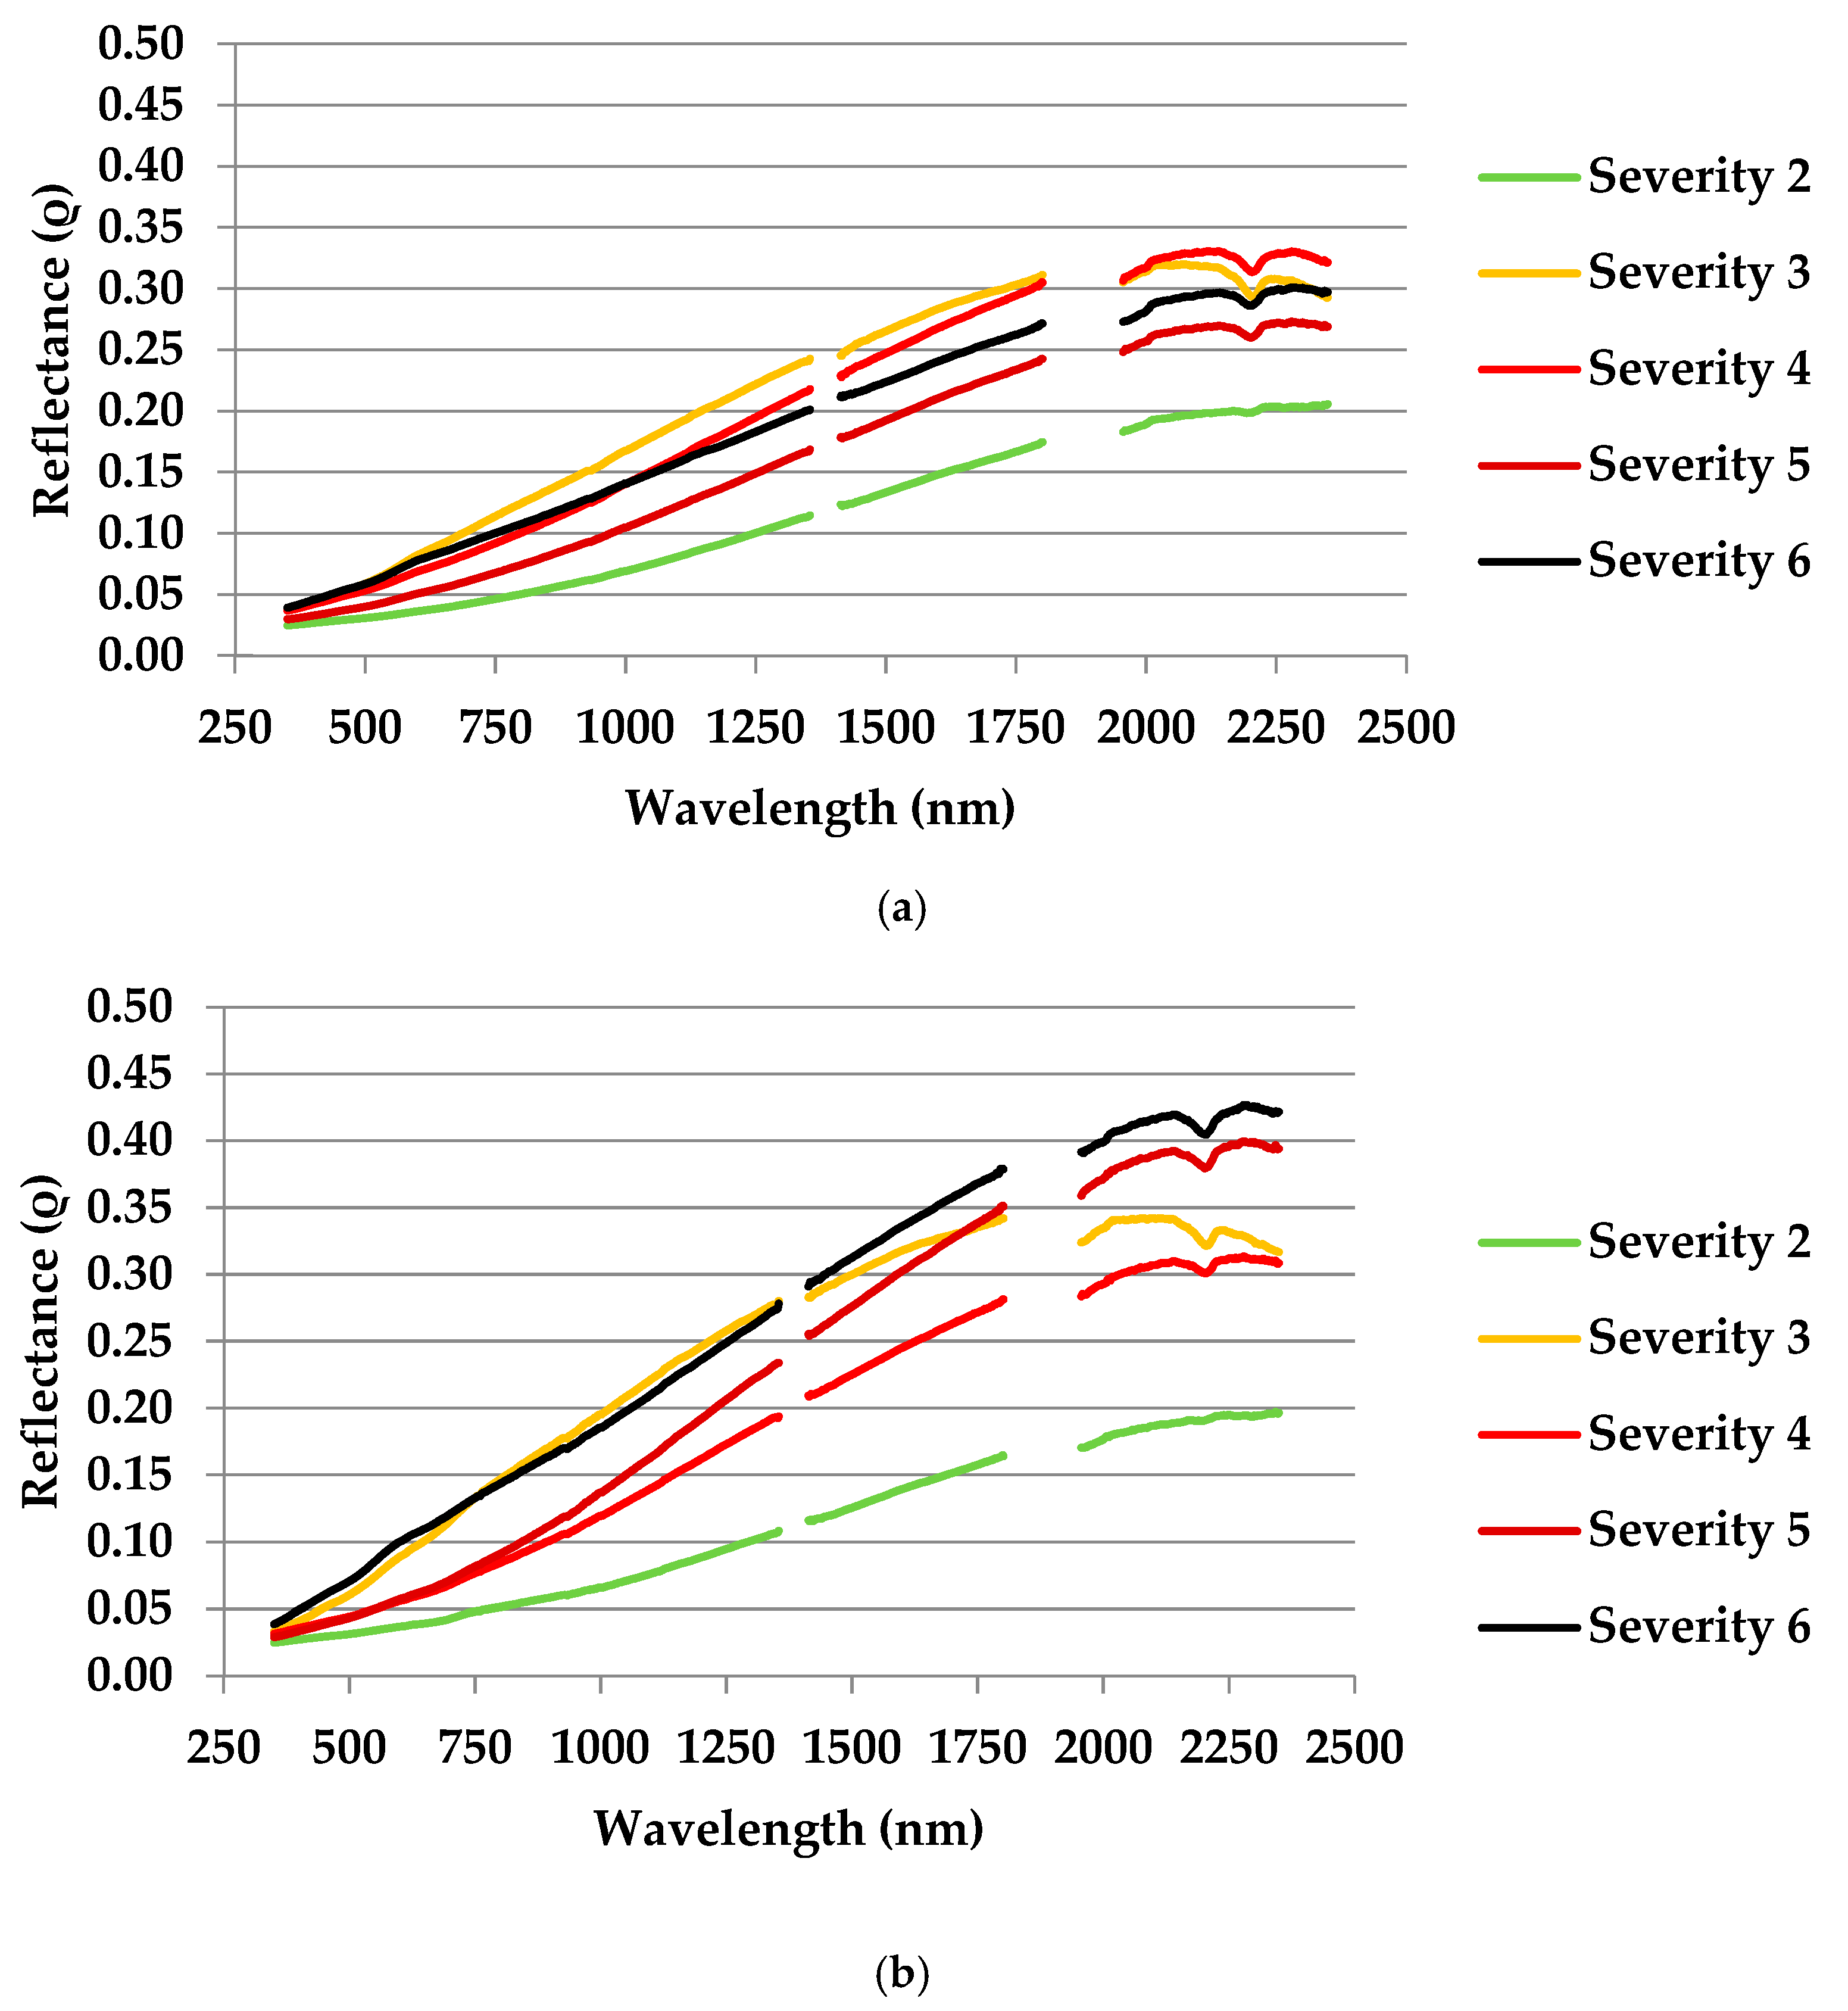
Figure 6a shows the ASD reflectance data obtained on the field and Figure 6b at laboratory. As in the case of CIMEL CE-312 graph (Figure 4), due to the low separability among several soil burn severity levels, the same reclassification of three new levels was realized (Figure 7a,b): low severity (severity 2), moderate severity (3), and high severity (4, 5, and 6).

2.4. Radiometric Measurements Conversion to Remote Sensing Data

One of the objectives of this study was to analyze the correlation between radiometric measurements and satellite images. After analyzing the emissivity and reflectance curves obtained from the radiometric measurements (Section 2.2), the characteristics of different sensors that comply the spectral and spatial requirements were studied.
In terms of thermal data, the highest CIMEL CE-312 emissivity differences were in 10.57 and 11.29 µm (Figure 5). Close to this spectral region, several sensors such as the Advanced Spaceborne Thermal Emission and Reflection Radiometer (ASTER) and the Moderate Resolution Imaging Spectroradiometer (MODIS), onboard TERRA/AQUA satellite, VIIRS (Visible Infrared Imaging Radiometer Suite, second generation of MODIS) onboard SNPP, NOAA-20, and NOAA-21 satellites and the Thermal Infrared Sensor (TIRS), onboard Landsat-8/9 satellite, are commonly used in multiple forest fires applications [36,37,38,39,40]. However, TIRS only has two bands in thermal infrared region whose emissivity is impossible to retrieve (at least three separate TIR bands are required) [39,53]. ASTER and MODIS are characterized to have several bands located in similar spectral region than CIMEL CE-312 (≈8–14 µm). Despite the good spectral correlation of both sensors with CIMEL CE-312, the low spatial resolution in TIR bands (ASTER = 70 m; MODIS = 1000 m) compared to the size of the field plots (20 m) hinders proper results validation. Considering these factors, we decided to decline thermal sensors in order to assess soil burn severity in this study.
Regarding optical data, the highest ASD reflectance (measured on the field and INTA facilities) differences were between NIR (780 nm to 1400 nm) and SWIR (1400 to 3000 nm) spectral regions (Figure 7a,b). RGB spectral regions are useful in order to mitigate the impact of atmospheric scattering due to aerosols [35]. The Red Edge and near-infrared (NIR) show low reflectance values related to vegetation decrease after forest fire [29,30,33]. Furthermore, shortwave infrared (SWIR) spectral regions show increased reflectance in the presence of ash and charred materials, providing insights into the severity of soil burn and the extent of fire-induced changes [32,34,54].
The MultiSpectral Instrument (MSI), on board the Sentinel-2A and B satellites, and the Operational Land Imagery (OLI) sensor (Landsat-8 and 9 satellites) provide images in the same spectrum. Many authors published scientific papers used one or both sensors for forest fires applications [28,55,56,57]. Although the OLI sensor is widely used, some limitations were found in this soil burn severity study. The spatial resolution was a little bit larger (30 m) than the size plot (20 m). In terms of temporal resolution, the revisit time is 8 days (even though Landsat-9 launch change revisit time to 8 days, all images before February 2022 have a revisit time of 16 days). Finally, the spectral resolution is restricted with only one band in NIR region. In contrast, MSI is characterized for having bands in the visible, near-infrared, and short-wave infrared ranges (Table 2). The temporal resolution is 5 days (3 days when tiles are overlapped) and spatial resolution is the same or higher than field plots (20 m). Considering the comparison between both sensors (spatial, temporal and spectral resolutions), MSI was chosen. All MSI bands used on this study have been resampled (from 10 to 20 m) in order to have the same extent as field plots. Cloud correction was carried out using the Scene Classification Image (SCL) mask [58].
ASD measurements were convolved to Sentinel-2 spectral bands configuration using the spectral response function of Sentinel-2 [59]. The reflectance obtained using spectral response function is equivalent to in situ measurements using the MSI sensor instead of ASD. Figure 8a (field) and Figure 8b (laboratory) display ASD reflectance after Sentinel-2 spectral response function.

2.5. Spectral Indices and Statistical Analysis

From the MSI reflectance obtained as ASD measurements and Sentinel-2 convolution (Section 2.4), some of the most widely used spectral indices in the study of forest fires were obtained: Burned Area Index for Sentinel-2 (BAIS2) [20], Mid-Infrared Burn Index (MIRBI) [31], Normalized Burn Ratio (NBR) [60], and Normalized Burn Ratio 2 (NBR2) [33]. In addition, related to soil assessment, several spectral indices were also used: Clay Ratio (CR) [61] and Iron Oxide ratio (IOR) [62]. Due to the impossibility of conducting radiometric measurements before the fire, all spectral indices were calculated using post-fire imagery as close as possible to the extinction dates. The algorithms of all the spectral indices described before are summarized in Table 3.
Spectral indices (Table 3) were assessed using the separability index (Equation (1)) [63]. This algorithm describes the separability between two classes being one the minimum value recommended (if the value of this ratio is greater than or equal to 1, the two distributions are considered reasonably separated because the distance between the means is at least equal to the magnitude of the dispersion) [64].
S I = μ 1 μ 2 σ 1 + σ 2
where μ1 and μ2 are the mean values, and σ1 and σ2 are the standard deviation values of each soil burn severity level, respectively, measured by ASD. Numerous authors use SI as a statistical analysis method in considering the same importance for all classes analyzed [20,39]. In this study, high severity distinction is considered crucial as being closely related to future erosion risks [49]. For this reason, different weights were applied depending on the soil burn severity level (the higher level, the higher weight) [49]. Equation (2) shows the weighted separability index (SIw) with the different weights considered for each severity class.
S I w = ( S I L M 0.4 ) + ( S I M H 0.6 )
S I L M and S I M H are the separability index (Equation (1)) between low and moderate severity and moderate and high severity, respectively. All the spectral indices whose value were higher than one were considered potential soil burn severity predictors. Furthermore, histogram graphs of spectral indices values were generated considering the lines match the optimal thresholds [65].
Soil burn severity maps obtained by the spectral indices optimal thresholds were validated using the field plots summarized in Table 1. Different metrics which are derived from the confusion matrix such as sensitivity, specificity, accuracy, balanced accuracy, F1-score and Cohen kappa index, were applied in this study [65]. Sensitivity (opposite to omission errors) and specificity (opposite to commission errors) represent the percentage of true positives and negatives, respectively [66]. Accuracy (ACC), one of the most popular statistic metrics used, is defined as a ratio between the correctly classified samples to the total number of samples. However, ACC is sensible to imbalanced data. In this sense and due to the impossibility of finding balanced data on field campaigns, the metrics F1-score and balanced accuracy (BACC) were also used. F1-score represents the harmonic mean of precision and sensitivity and BACC the mean of sensitivity and specificity [65]. Finally, the Cohen kappa index (k) was obtained to assess the classification concordance level [67,68]. The higher the k, the stronger the concordance [69,70]. All statistical metrics were conducted using the caret package by R [71].

3. Results

Moderate soil burn severity was always the highest reflectance in the whole region of the optical spectrum (350–2500 nm), except in the laboratory measurements, where high severity was slightly higher in part of the Short Wave Infrared region (≈2000–2400 nm). Low soil burn severity always showed the lowest reflectance values. Laboratory measurements showed higher separability between soil burn severity levels than field measurements. Focusing on the emissivity graphs, for 8.44 and 8.69 µm bands, the order was similar to reflectance measurements (highest emissivity for the moderate soil burn severity, followed by high and low soil burn severity, respectively). However, for bands 9.15, 10.57, and 11.29 µm, the opposite occurred (highest emissivity in the low soil burn severity, followed by high and moderate soil burn severity, respectively).
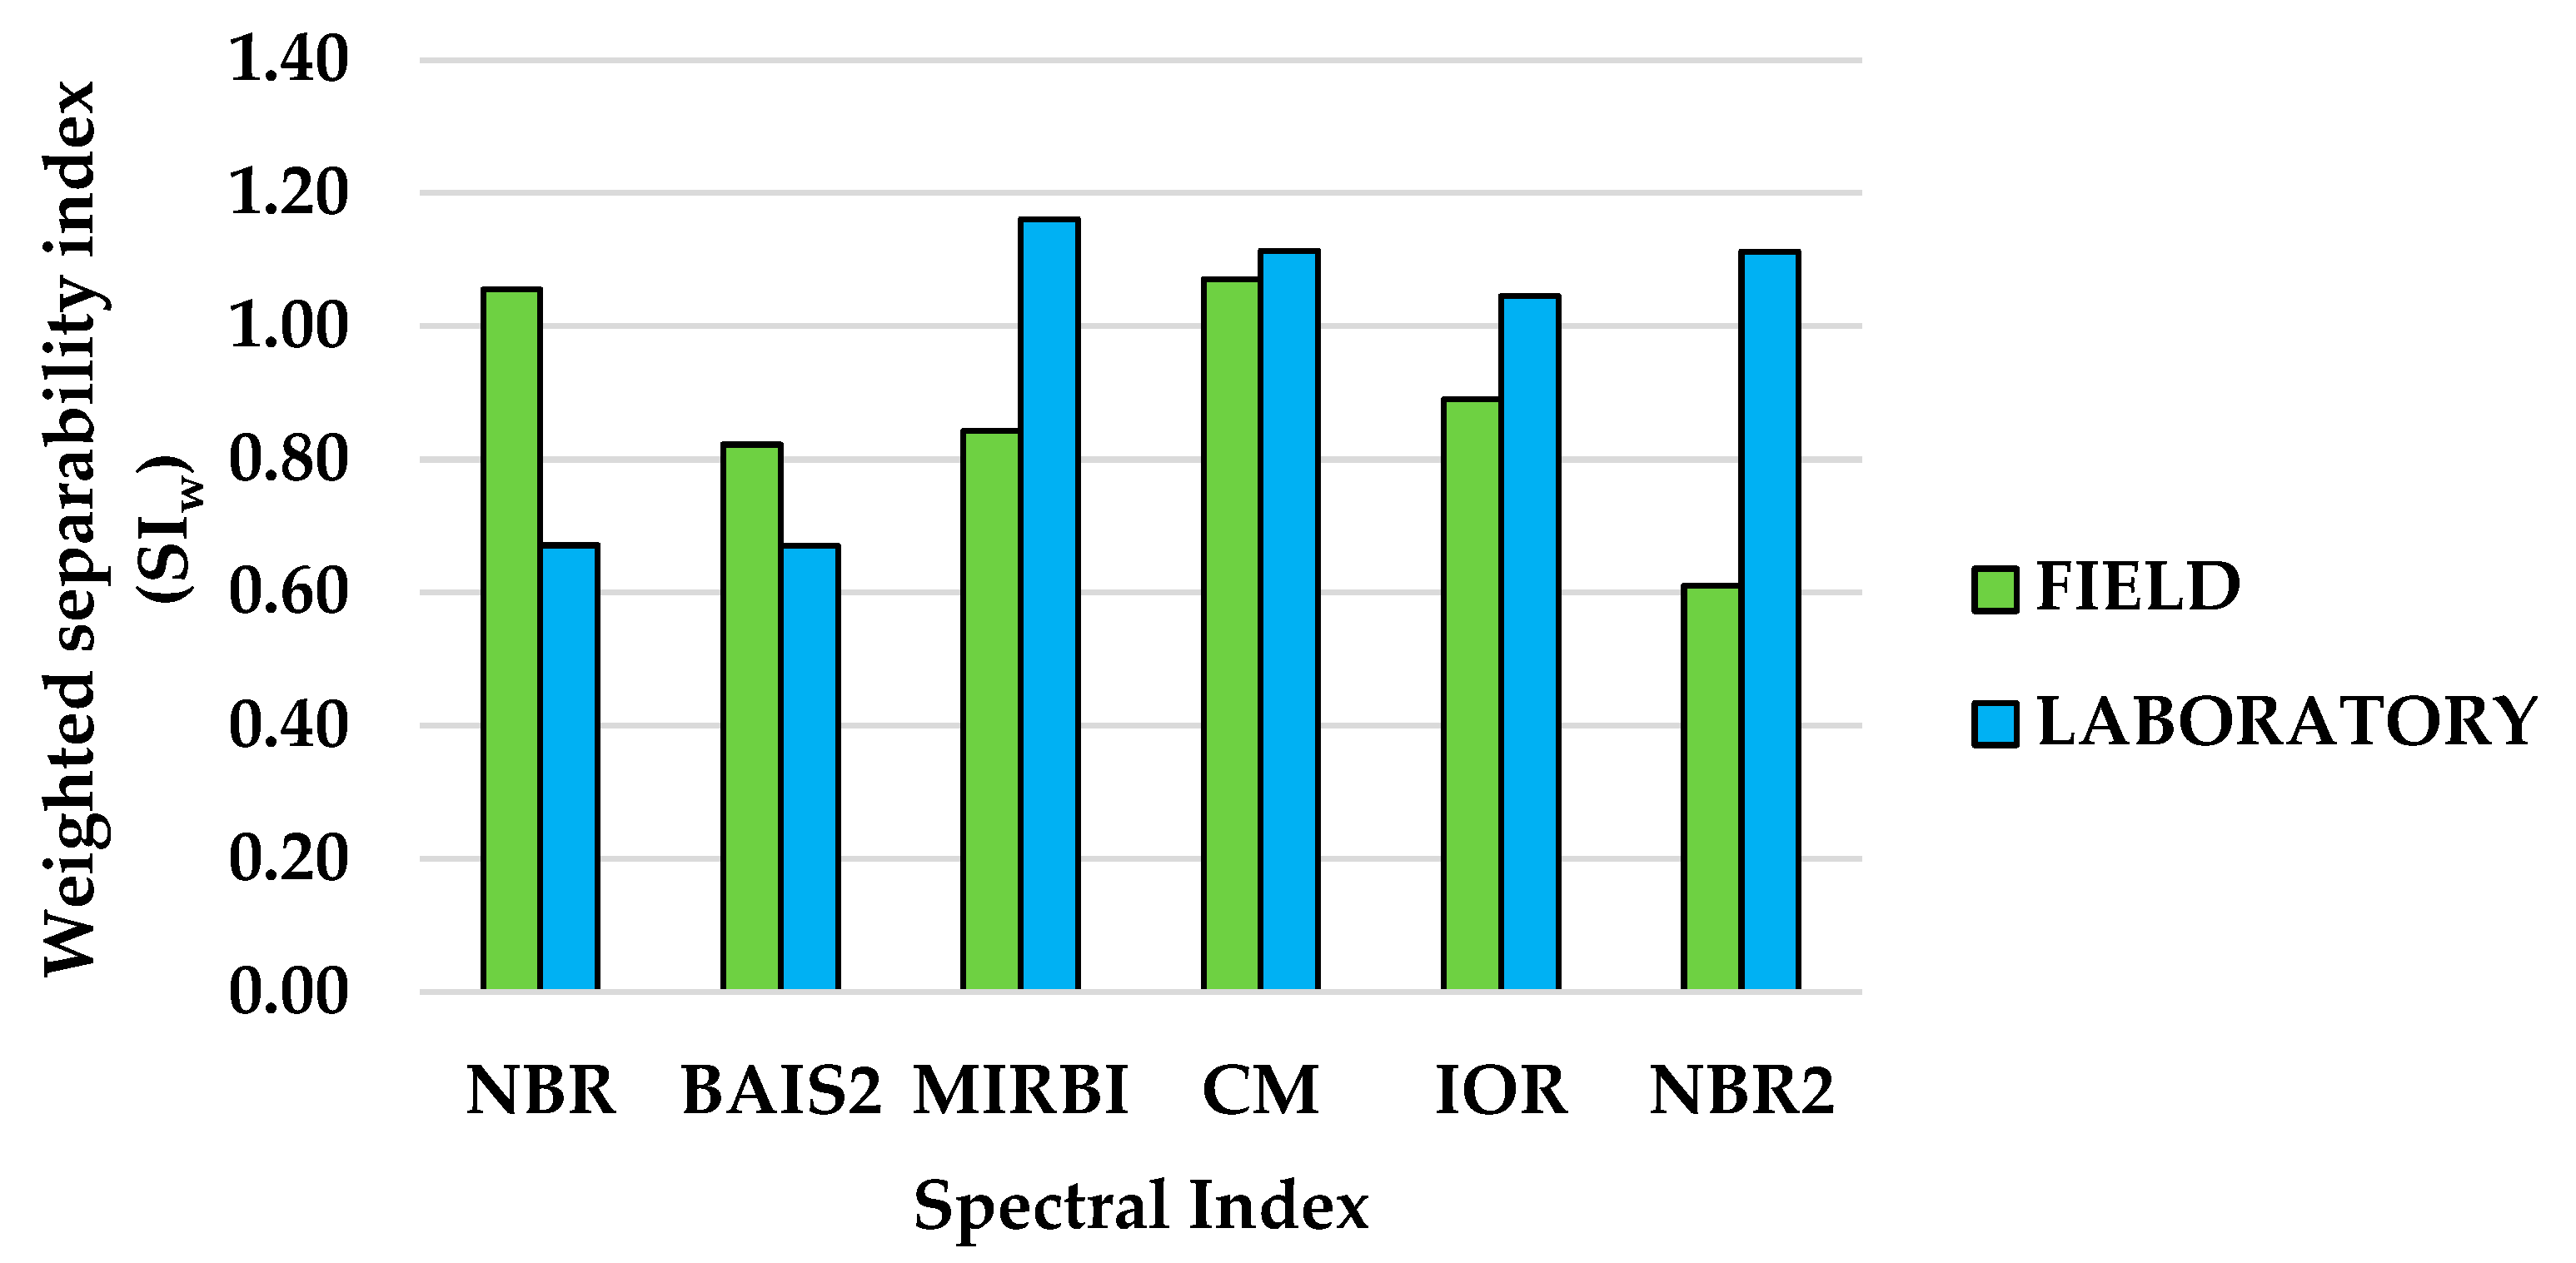
Regarding spectral indices results, Figure 9 displays the weighted separability index (SIw) obtained for all spectral indices used in this study (Table 3). The green color represents SIw for all soil burn severity levels measured by ASD on the field. The blue color represents SIw for all soil burn severity levels measured by ASD on laboratory. NBR (1.06) and CM (1.07), using field measurements, and MIRBI (1.16), CM (1.11), IOR (1.05), and NBR2 (1.11), using INTA facilities measurements, reach a SIw equal or higher to 1. Based on this criterion, BAIS2 was discarded as potential soil burn severity classifier (SIw lower to 1).
Table 4 shows the optimal thresholds obtained by the lines match of spectral indices histograms graphs which SIw were equal or higher than 1 (Figure 9). CM index has slightly different thresholds depending on the place where measurements were realized (field or laboratory).
Table 5 shows the results of sensitivity and specificity for each soil burn severity level obtained in this study (Low = L, Moderate = M, and High = H). Table 6 displays the overall results of accuracy (ACC), balanced accuracy (BACC), F1-score (F1), and Cohen kappa index (k). Soil burn severity levels were validated using the field plots summarized in Table 1.
IOR spectral index represents the highest overall results (Table 6) for all metrics (ACC, BACC, F1, and k). Regarding sensitivity and specificity, IOR had the highest results but with some exceptions: IOR had the lowest sensitivity value in moderate level (0.52) and the lowest specificity value in low level (0.78).
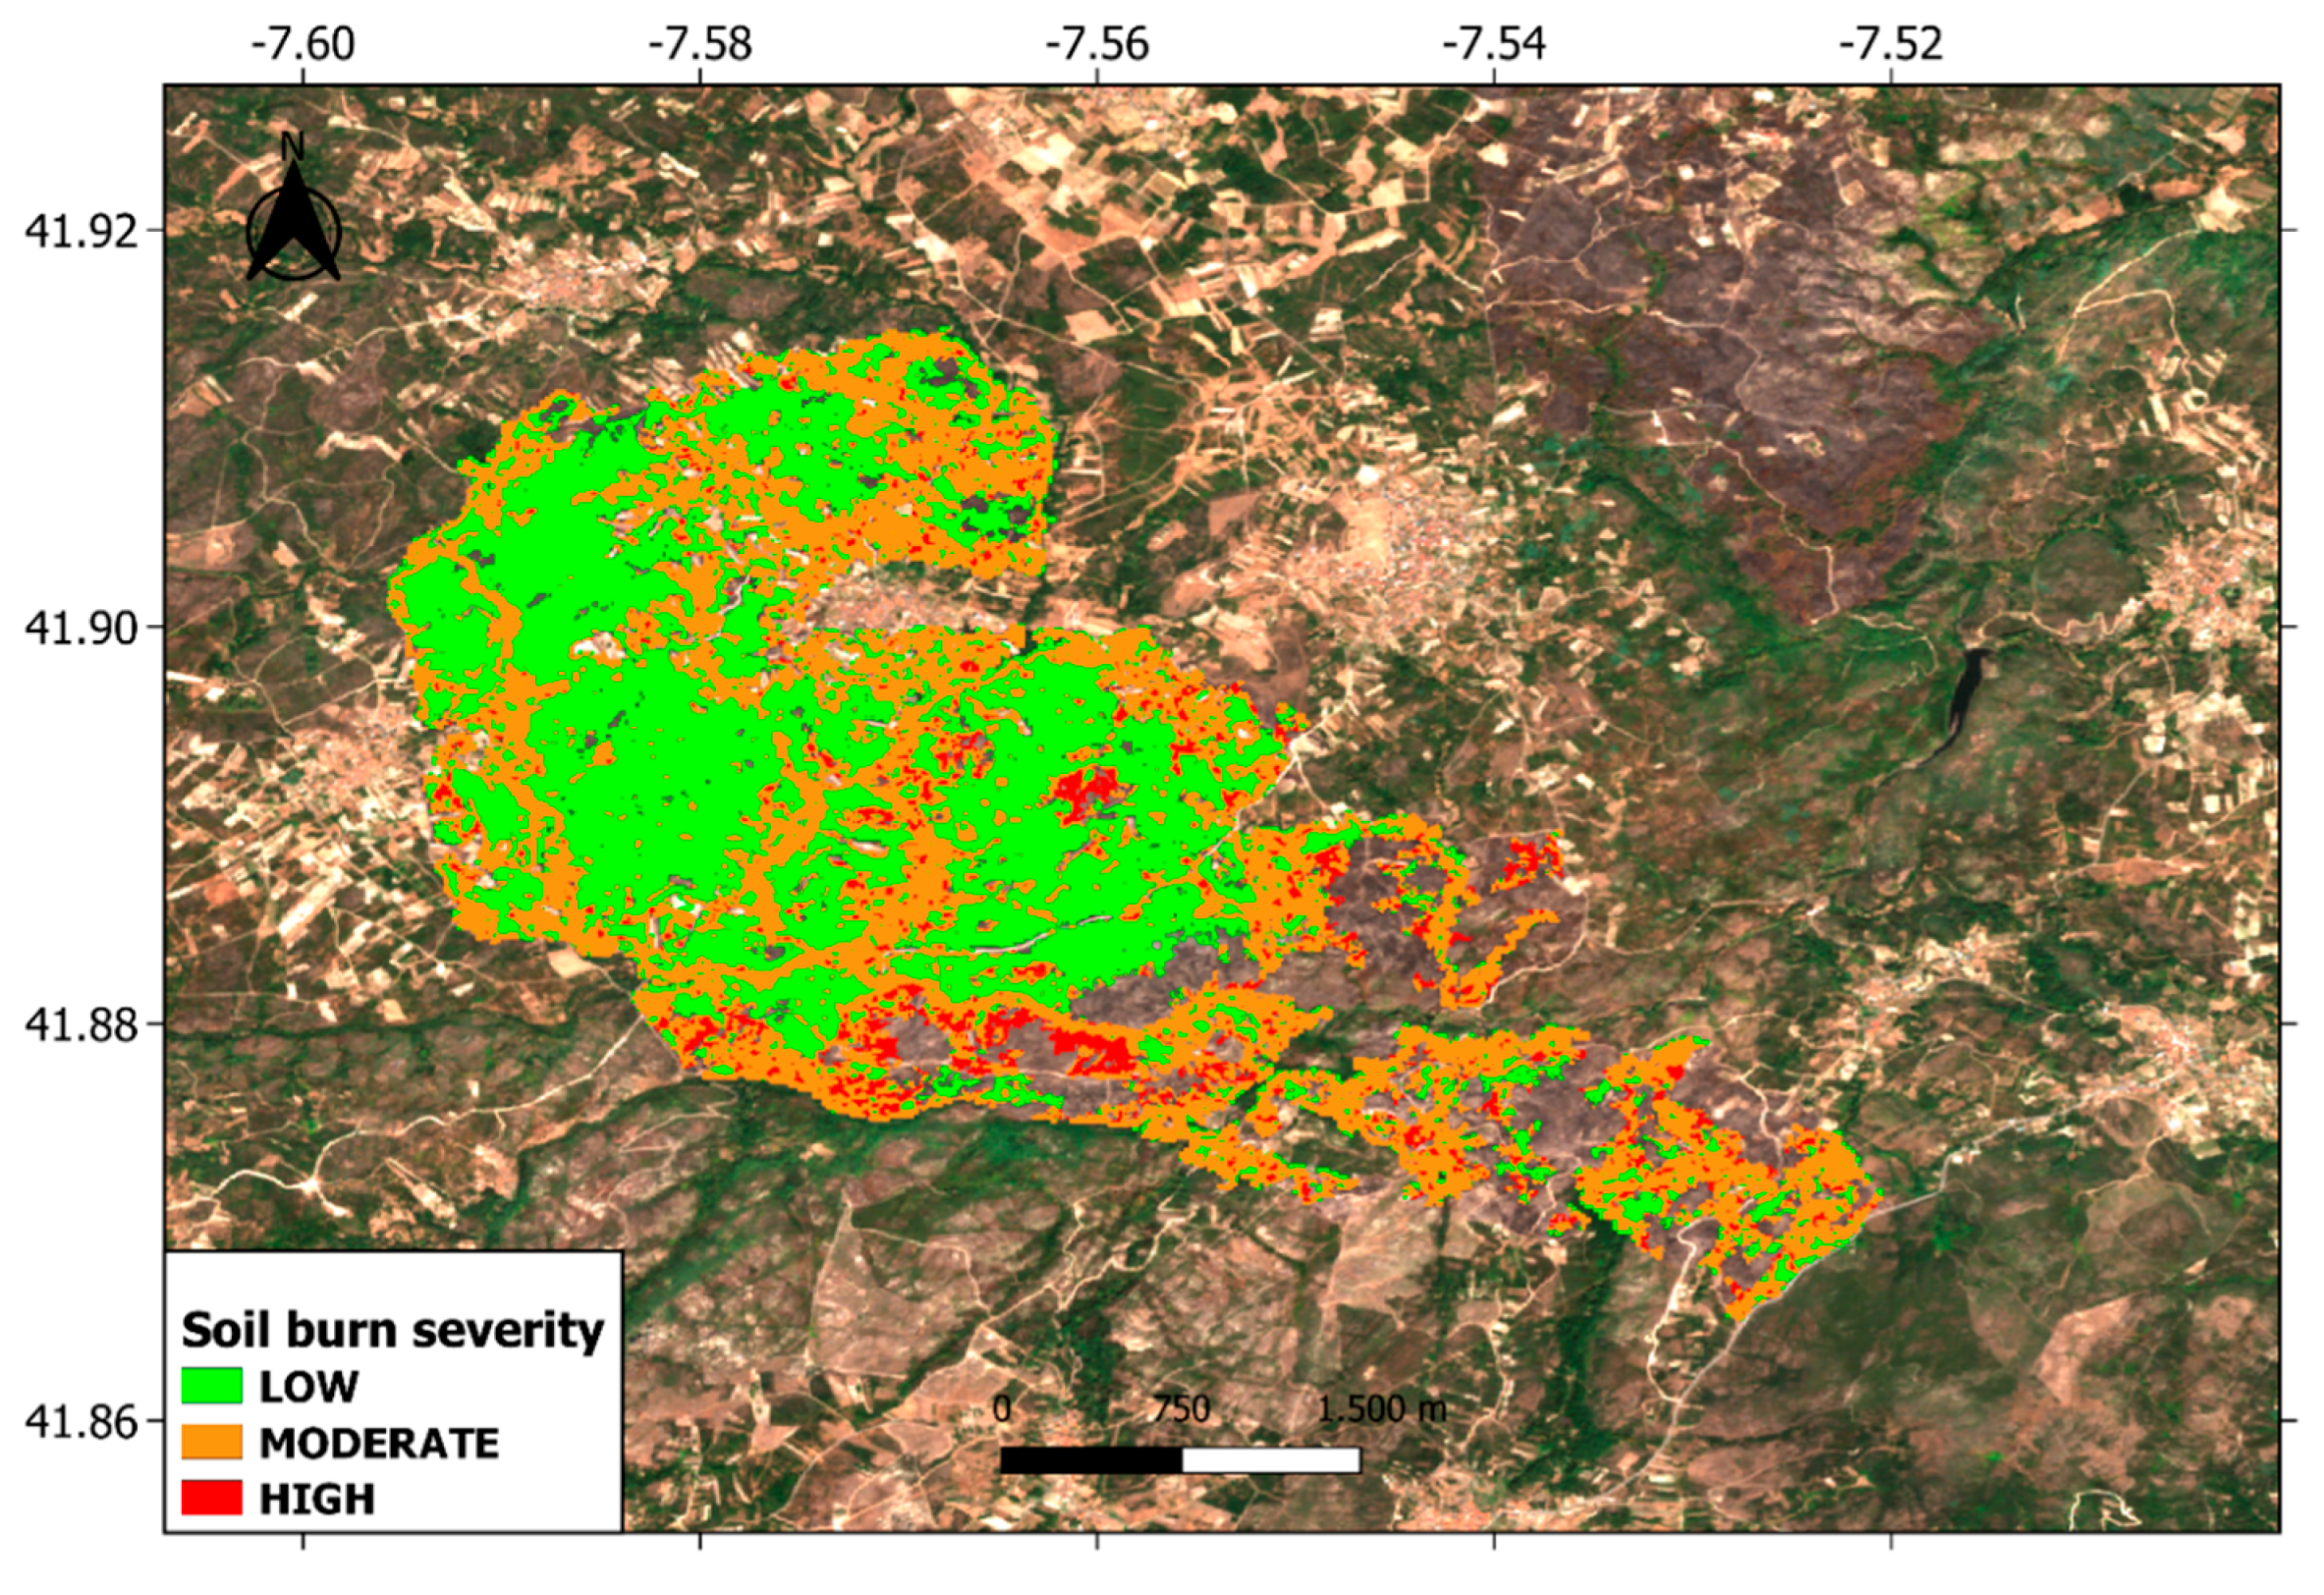
Figure 10 shows an example of a soil burn severity map obtained by the optimal thresholds (Table 4) of the IOR spectral index (spectral index with highest accuracy results shown in Table 5 and Table 6) focused on a San Millao forest fire (field date: 10 September 2020).

4. Discussion

The intensity of soil burns significantly affects forest ecosystems, facilitating the spread of invasive exotic species even at low severity levels, thereby compromising the recovery of biodiversity and native vegetation. Moreover, severe burns negatively impact key ecosystem services, such as carbon storage and soil stability, particularly in forests with fire-sensitive species like Pinus pinea. Post-fire erosion exacerbates these effects, highlighting the necessity of implementing restoration strategies that include soil carbon recovery and vegetation cover stabilization to mitigate degradation and ensure the resilience of affected ecosystems.
This study presents, for the first time, the creation of soil burn severity maps using radiometric measurements convolved to remote sensing data. The results obtained were sufficiently novel that there were hardly any studies with similar objectives and using the same input data. However, results obtained were compared with other research studies that used other sources of information such as remote sensing or unnamed aerial vehicles (UAV’s).
Respecting field plots methodology, the composite burn index (CBI) is widely used in burn severity assessments designed to relate field plots (vegetation and soil) with satellite images [60,72,73,74]. However, several authors underline the need for separate vegetation and soil assessments due to the different fire behaviors on the two surfaces [7,47,49,50]. Ref. [6] provides a new soil burn severity classification based on [43] study, which assesses forest fires damage focused on soil. This quick and operational procedure considers soil metrics such as color, depth, structure, roots condition, and water repellence.
Field plots and radiometric measurements were taken in different places, with the exception of Nerva, Pedro Bernardo, and Real Sitio de San Ildefonso forest fires, where they were carried out jointly. This was a handicap due to the fact that the radiometric measurements were mostly taken in the Mediterranean climate region (82%) and the field plots were mostly taken in the Atlantic region (84%). Studies such as the one carried out by [75] and [76], in 2018 explain the importance of climate type and climate change in forest fires behavior assessment. Moreover, due to the heterogeneity of the burned area, the field plots are unbalanced [74]. For this reason, along with the accuracy (ACC) metric, balanced accuracy (BACC), F1-score (F1), and Cohen’s kappa index (k) were calculated in order to minimize this imbalance.
Focusing on radiometric measurements results, emissivity and reflectance values were extracted using CIMEL CE-312 (after TES algorithm application) and ASD, respectively. Previous studies consider emissivity as a good predictor of vegetation decrease [41] or fire severity indicator [77]. However, only this study explores the use of emissivity as potential soil burn severity indicator. Despite the considerable emissivity differences between the different soil burn severity levels using CIMEL CE-312 and observed in Figure 5, currently the low spatial resolution of remote sensing in the thermal spectrum made it impossible to validate the results. ASTER sensor has the most similar pixel size to field plots, but it is still too large (90 m of spatial resolution). Respecting reflectance values, ASD measurements (Figure 7a,b) showed that the bands with the highest differences between soil burn severity levels were those located in the near-infrared (NIR) and short wave infrared (SWIR) regions. Several previous studies related soil alterations caused by forest fires with SWIR region [27,57,77,78,79,80,81]. Generally, the measurements made at the INTA facilities showed the highest differences between soil burn severity levels compared to those made directly on the field. ASD measurements realized at the laboratory minimized factors such as shadows, wind, slope, among others that can influence results of field measurements considerably [82]. Nevertheless, both measurements were considered acceptable for subsequent application of the Sentinel-2 convolution filter (Figure 8a,b). Sentinel-2 imagery was chosen after the comparison with Landsat satellite. Analyzing spatial, spectral, and temporal resolution, Sentinel-2 data were more suitable to field plots configuration.
After Sentinel-2 convolution filter application to ASD measurements, a list of spectral indices was obtained. This list was based on popular spectral indices applied in forest fires research studies [20,31,33,60] and soil assessment [61,62]. Despite the high quantity of research studies used spectral indices which combines NIR and SWIR regions, Blue spectral band is useful in order to reduce atmospheric interferences [83,84]. Spectral indices which use algorithms including the blue spectral band are also useful in chlorophyll change studies [84,85].
The weighted separability index (SIw) results obtained in Figure 9 was used to select those indices with good separability (SIw ≥ 1). Following this criterion, only the Burned Area Index for Sentinel-2 (BAIS2) index was discarded. Clay Ratio (CR) was the only spectral indices which SIw was equal or higher than one on field and at laboratory.
Based on the optimal thresholds in Table 4 obtained by the lines match of spectral indices histograms graphs, Sentinel-2 images were classified as soil severity maps (Figure 10) and validated with the field plots (Table 1). Analyzing soil burn severity levels individually, Table 5 displays sensitivity and specificity results for each spectral index and for each scenario. The Iron Oxide ratio (IOR) represents the highest results of specificity and sensitivity mean (0.81 in low, 0.72 in moderate, and 0.77 in high soil burn severity, respectively). However, sensitivity in moderate soil burn severity was the lowest (0.52 which corresponds to a 48% of omission error in this level). Sensitivity and specificity results obtained in this study are slightly lower than those obtained by [86] (0.94 in low, 0.73 in moderate, and 0.85 in high soil burn severity, respectively) using the Normalized Difference Water Index (NDWI) [87] validated in 80 field plots inside Villapadierna forest fire in León, Spain (2019, 88 Ha). In both studies, moderate soil burn severity had the lowest accuracy. IOR spectral index was also the best soil burn severity predictor in terms of overall metrics (ACC = 0.71, BACC = 0.76, F1 = 0.63 and k = 0.50, respectively) followed by NBR2 index (ACC = 0.57, BACC = 0.69, F1 = 0.54 and k = 0.36, respectively). In addition, IOR was the only one with acceptable k value (k = 0.50) based on [70] study table interpretation.

5. Conclusions

This study represents a novel contribution to soil burn severity assessment adding radiometric measurements combined with the use of remote sensing data. This combination provides a high accuracy and spatial representativeness, which significantly improves the assessment of soil burn severity. While satellite imagery is irreplaceable for large-scale analysis, radiometric measurements ensure accuracy and validation in local analysis. The integration of both approaches generates more robust, reliable, and useful results for environmental management and post-fire ecosystem restoration. The assessment conducted in this work enabled the fulfillment of the proposed objectives.
In thermal domain, despite the good spectral correlation of remote sensing (ASTER, MODIS) and radiometric measurements (CIMEL CE-312), the currently remote sensing low spatial resolution impedes its use. Future missions, such as The Copernicus Land Surface Temperature Monitoring (LSTM) with high spatial resolution in thermal domain, will allow new research lines in emissivity and soil burn severity correlation. In contrast, in the optical domain, Analytical Spectral Device (ASD) FieldSpec radiometer measurements are highly correlated with Sentinel-2 bands. Although measurements realized in the laboratory represent higher reflectance differences than field measurements, spectral indices were obtained in both scenarios. After Sentinel-2 filter convolution application to ASD measurements, the Iron Oxide ratio (IOR) spectral index provided the highest accuracy results: specificity and sensitivity mean (0.81 in low, 0.72 in moderate, and 0.77 in high soil burn severity, respectively), accuracy (ACC = 0.71), balanced accuracy (BACC = 0.76), F1-score (F1 = 0.63), and Cohen’s kappa index (k = 0.50). It is demonstrated that, in addition to near-infrared (NIR) and short wave infrared (SWIR) spectral bands, the use of blue bands reduce atmospheric interferences and improves the accuracy of soil burn severity mapping. Despite the difficulty and often the impracticability of organizing field campaigns on numerous occasions, future radiometric measurements should be conducted on healthy vegetation within the burned area (as representative as possible of pre-fire vegetation) allowing the analysis of change detection experienced by soil.
Classification of soil burn severity is crucial for the quantification of post-fire erosion. In this sense, the selection of a rapid, precise, and operational methodology for obtaining field plots proposed by [6], allowed for accurate soil burn severity validation. The soil burn severity maps obtained in this study could be highly valuable by forest agents for planning assessment and restoration tasks related to soil erosion effects. The methodology proposed in this work is based on freely available images and, due to its high operability (only requiring a post-fire Sentinel-2 image), can be easily adapted to any Geographic Information System (GIS).

Author Contributions

Conceptualization, J.A.S. and C.F.; Formal analysis, R.L.; Funding acquisition, J.A.S. and C.F.; Investigation, J.A.S., C.F., J.M.F.-A. and J.A.V.; Methodology, J.A.S., C.F. and J.A.V.; Project administration, J.A.S.; Resources, J.A.S.; Software, R.L.; Supervision, J.A.S., C.F. and J.A.V.; Visualization, R.L.; Writing—Original draft, J.A.S. and R.L.; Writing—Review and editing, J.A.S., R.L., C.F., J.M.F.-A. and J.A.V. All authors have read and agreed to the published version of the manuscript.

Funding

This research has been funded by the EPyRIS research project, which is part of the European Union’s Interreg SUDOE programme, project number SOE2/P5/E0811, and as IPL Contribution to the Scientific Exploitation of the LSTM Mission: Ministry of Science and Innovation. Project number: PID2020-112494RB-I00.

Institutional Review Board Statement

Not applicable.

Informed Consent Statement

Not applicable.

Data Availability Statement

The datasets presented in this article are not readily available because the data are part of an ongoing study. Requests to access the datasets should be directed to the Corresponding author.

Acknowledgments

The authors are especially grateful to the people from the Centro de Investigación Forestal de Lourizán research group who were in charge of carrying out and supplying the data from the field plots. In addition, we thank the editor-in-chief, the anonymous associate editor, and the reviewers for their systematic review and valuable comments.

Conflicts of Interest

The authors declare no conflicts of interest to publish the results.

References

  1. Chuvieco, E.; Aguado, I.; Yebra, M.; Nieto, H.; Salas, J.; Martín, M.P.; Vilar, L.; Martínez, J.; Martín, S.; Zamora, R.; et al. Development of a framework for fire risk assessment using remote sensing and geographic information system technologies. Ecol. Model. 2010, 221, 46–58. [Google Scholar] [CrossRef]
  2. Certini, G. Effects of fire on properties of forest soils: A review. Oecologia 2005, 143, 1–10. [Google Scholar] [CrossRef]
  3. Pyne, S.J. The fires this time, and next. Science 2001, 294, 1005–1006. [Google Scholar] [CrossRef]
  4. Vega, J.A.; Fernández, C.; Fonturbel, T. Throughfall, runoff and soil erosion after prescribed burning in gorse shrubland in Galicia (NW Spain). Land Degrad. Dev. 2005, 16, 37–51. [Google Scholar] [CrossRef]
  5. Shakesby, R.A.; Doerr, S.H. Wildfire as a hydrological and geomorphological agent. Earth-Sci. Rev. 2006, 74, 269–307. [Google Scholar] [CrossRef]
  6. Fernández, C.; Vega, J.A. Modelling the effect of soil burn severity on soil erosion at hillslope scale in the first year following wildfire in NW Spain. Earth Surf. Process. Landf. 2016, 41, 928–935. [Google Scholar] [CrossRef]
  7. Fernández, C.; Vega, J.A.; Fontúrbel, T. Comparison of the effectiveness of needle cast and straw helimulching for reducing soil erosion after wildfire in NW Spain. J. Soils Sediments 2020, 20, 535–541. [Google Scholar] [CrossRef]
  8. Keeley, J.E. Fire intensity, fire severity and burn severity: A brief review and suggested usage. Int. J. Wildland Fire 2009, 18, 116–126. [Google Scholar] [CrossRef]
  9. Lentile, L.B.; Holden, Z.A.; Smith, A.M.; Falkowski, M.J.; Hudak, A.T.; Morgan, P.; Lewis, S.A.; Gessler, P.E.; Benson, N.C. Remote sensing techniques to assess active fire characteristics and post-fire effects. Int. J. Wildland Fire 2006, 15, 319–345. [Google Scholar] [CrossRef]
  10. Fernández, C.; Vega, J.A.; Jiménez, E.; Fonturbel, T. Effectiveness of three post-fire treatments at reducing soil erosion in Galicia (NW Spain). Int. J. Wildland Fire 2011, 20, 104–114. [Google Scholar] [CrossRef]
  11. Fernández, C.; Vega, J.A.; Jiménez, E.; Vieira, D.C.S.; Merino, A.; Ferreiro, A.; Fonturbel, T. Seeding and mulching+ seeding effects on post-fire runoff, soil erosion and species diversity in Galicia (NW Spain). Land Degrad. Dev. 2012, 23, 150–156. [Google Scholar] [CrossRef]
  12. Peón, J.; Fernández, S.; Recondo, C.; Calleja, J.F. Evaluation of the spectral characteristics of five hyperspectral and multispectral sensors for soil organic carbon estimation in burned areas. Int. J. Wildland Fire 2017, 26, 230–239. [Google Scholar] [CrossRef]
  13. Pausas, J.G.; Vallejo, V.R. The role of fire in European Mediterranean ecosystems. In Remote Sensing of Large Wildfires: In the European Mediterranean Basin; Springer: Berlin/Heidelberg, Germany, 1999; pp. 3–16. [Google Scholar]
  14. Shakesby, R.A. Post-wildfire soil erosion in the Mediterranean: Review and future research directions. Earth-Sci. Rev. 2011, 105, 71–100. [Google Scholar] [CrossRef]
  15. Vieira, D.C.S.; Fernández, C.; Vega, J.A.; Keizer, J.J. Does soil burn severity affect the post-fire runoff and interrill erosion response? A review based on meta-analysis of field rainfall simulation data. J. Hydrol. 2015, 523, 452–464. [Google Scholar] [CrossRef]
  16. Chuvieco, E.; Congalton, R.G. Application of remote sensing and geographic information systems to forest fire hazard mapping. Remote Sens. Environ. 1989, 29, 147–159. [Google Scholar] [CrossRef]
  17. Chuvieco, E.; Riaño, D.; Van Wagtendok, J.; Morsdof, F. Fuel loads and fuel type mapping. In Wildland Fire Danger Estimation and Mapping: The Role of Remote Sensing Data. 2003, pp. 119–142. Available online: https://www.worldscientific.com/doi/abs/10.1142/9789812791177_0005 (accessed on 15 December 2024).
  18. Chuvieco, E. Global impacts of fire. In Earth Observation of Wildland Fires in Mediterranean Ecosystems; Springer: Berlin/Heidelberg, Germany, 2009; pp. 1–10. [Google Scholar]
  19. Drusch, M.; Del Bello, U.; Carlier, S.; Colin, O.; Fernandez, V.; Gascon, F.; Hoersch, B.; Isola, C.; Laberinti, P.; Bargellini, P.; et al. Sentinel-2: ESA’s optical high-resolution mission for GMES operational services. Remote Sens. Environ. 2012, 120, 25–36. [Google Scholar] [CrossRef]
  20. Filipponi, F. BAIS2: Burned area index for Sentinel-2. Proceedings 2018, 2, 364. [Google Scholar] [CrossRef]
  21. Fernández-Manso, A.; Fernández-Manso, O.; Quintano, C. SENTINEL-2A red-edge spectral indices suitability for discriminating burn severity. Int. J. Appl. Earth Obs. Geoinf. 2016, 50, 170–175. [Google Scholar] [CrossRef]
  22. Filipponi, F. Exploitation of sentinel-2 time series to map burned areas at the national level: A case study on the 2017 Italy wildfires. Remote Sens. 2019, 11, 622. [Google Scholar] [CrossRef]
  23. Roteta, E.; Bastarrika, A.; Padilla, M.; Storm, T.; Chuvieco, E.J.R.S.O.E. Development of a Sentinel-2 burned area algorithm: Generation of a small fire database for sub-Saharan Africa. Remote Sens. Environ. 2019, 222, 1–17. [Google Scholar] [CrossRef]
  24. Chuvieco, E.; Lizundia-Loiola, J.; Pettinari, M.L.; Ramo, R.; Padilla, M.; Tansey, K.; Mouillot, F.; Laurent, P.; Storm, T.; Plummer, S.; et al. Generation and analysis of a new global burned area product based on MODIS 250 m reflectance bands and thermal anomalies. Earth Syst. Sci. Data 2018, 10, 2015–2031. [Google Scholar] [CrossRef]
  25. Roy, D.P.; Huang, H.; Boschetti, L.; Giglio, L.; Yan, L.; Zhang, H.H.; Li, Z. Landsat-8 and Sentinel-2 burned area mapping-A combined sensor multi-temporal change detection approach. Remote Sens. Environ. 2019, 231, 111254. [Google Scholar] [CrossRef]
  26. Gibson, R.; Danaher, T.; Hehir, W.; Collins, L. A remote sensing approach to mapping fire severity in south-eastern Australia using sentinel 2 and random forest. Remote Sens. Environ. 2020, 240, 111702. [Google Scholar] [CrossRef]
  27. Robichaud, P.R.; Lewis, S.A.; Laes, D.Y.; Hudak, A.T.; Kokaly, R.F.; Zamudio, J.A. Postfire soil burn severity mapping with hyperspectral image unmixing. Remote Sens. Environ. 2007, 108, 467–480. [Google Scholar] [CrossRef]
  28. Mallinis, G.; Mitsopoulos, I.; Chrysafi, I. Evaluating and comparing Sentinel 2A and Landsat-8 Operational Land Imager (OLI) spectral indices for estimating fire severity in a Mediterranean pine ecosystem of Greece. GIScience Remote Sens. 2018, 55, 1–18. [Google Scholar] [CrossRef]
  29. Alcaras, E.; Costantino, D.; Guastaferro, F.; Parente, C.; Pepe, M. Normalized Burn Ratio Plus (NBR+): A new index for sentinel-2 imagery. Remote Sens. 2022, 14, 1727. [Google Scholar] [CrossRef]
  30. Silva, J.M.; Pereira, J.M.; Cabral, A.I.; Sá, A.C.; Vasconcelos, M.J.; Mota, B.; Grégoire, J.M. An estimate of the area burned in southern Africa during the 2000 dry season using SPOT-VEGETATION satellite data. J. Geophys. Res. Atmos. 2003, 108, 8498. [Google Scholar] [CrossRef]
  31. Trigg, S.; Flasse, S. An evaluation of different bi-spectral spaces for discriminating burned shrub-savannah. Int. J. Remote Sens. 2001, 22, 2641–2647. [Google Scholar] [CrossRef]
  32. Gamon, J.A.; Surfus, J.S.; Elmore, A.J. A dual-wavelength chlorophyll fluorescence kinetic model for remote sensing of photosynthesis. Remote Sens. Environ. 1995, 49, 224–233. [Google Scholar]
  33. García, M.L.; Caselles, V. Mapping burns and natural reforestation using Thematic Mapper data. Geocarto Int. 1991, 6, 31–37. [Google Scholar] [CrossRef]
  34. Trigg, S.N.; Flasse, S.P. An empirical relationship for the NIR-red reflectance ratios in terms of biomass and soil-moisture for Scottish heathlands. Int. J. Remote Sens. 2000, 21, 3031–3042. [Google Scholar]
  35. Bannari, A.; Morin, D.; Bonn, F.; Huete, A. A review of vegetation indices. Remote Sens. Rev. 1995, 13, 95–120. [Google Scholar] [CrossRef]
  36. Schroeder, W.; Prins, E.; Giglio, L.; Csiszar, I.; Schmidt, C.; Morisette, J.; Morton, D. Validation of GOES and MODIS active fire detection products using ASTER and ETM+ data. Remote Sens. Environ. 2008, 112, 2711–2726. [Google Scholar] [CrossRef]
  37. Schroeder, W.; Oliva, P.; Giglio, L.; Quayle, B.; Lorenz, E.; Morelli, F. Active fire detection using Landsat-8/OLI data. Remote Sens. Environ. 2016, 185, 210–220. [Google Scholar] [CrossRef]
  38. Morisette, J.T.; Giglio, L.; Csiszar, I.; Justice, C.O. Validation of the MODIS active fire product over Southern Africa with ASTER data. Int. J. Remote Sens. 2005, 26, 4239–4264. [Google Scholar] [CrossRef]
  39. Veraverbeke, S.; Harris, S.; Hook, S. Evaluating spectral indices for burned area discrimination using MODIS/ASTER (MASTER) airborne simulator data. Remote Sens. Environ. 2011, 115, 2702–2709. [Google Scholar] [CrossRef]
  40. Giglio, L.; Schroeder, W.; Justice, C.O. The collection 6 MODIS active fire detection algorithm and fire products. Remote Sens. Environ. 2016, 178, 31–41. [Google Scholar] [CrossRef]
  41. Vlassova, L.; Pérez-Cabello, F.; Mimbrero, M.R.; Llovería, R.M.; García-Martín, A. Analysis of the relationship between land surface temperature and wildfire severity in a series of Landsat images. Remote Sens. 2014, 6, 6136–6162. [Google Scholar] [CrossRef]
  42. Marcos, E.; Fernández-García, V.; Fernández-Manso, A.; Quintano, C.; Valbuena, L.; Tárrega, R.; Luis-Calabuig, E.; Calvo, L. Evaluation of composite burn index and land surface temperature for assessing soil burn severity in mediterranean fire-prone pine ecosystems. Forests 2018, 9, 494. [Google Scholar] [CrossRef]
  43. Vega, J.A.; Fontúrbel, T.; Merino, A.; Fernández, C.; Ferreiro, A.; Jiménez, E. Testing the ability of visual indicators of soil burn severity to reflect changes in soil chemical and microbial properties in pine forests and shrubland. Plant Soil 2013, 369, 73–91. [Google Scholar] [CrossRef]
  44. Rosero-Vlasova, O.A.; Pérez-Cabello, F.; Llovería, R.M.; Vlassova, L. Assessment of laboratory VIS-NIR-SWIR setups with different spectroscopy accessories for characterisation of soils from wildfire burns. Biosyst. Eng. 2016, 152, 51–67. [Google Scholar] [CrossRef]
  45. Sun, H.; Rong, Z.; Liu, C.; Liu, J.; Zhang, Y.; Zhang, P.; Wang, X.; Gao, W. Spectral characteristics of infrared radiation from forest fires. In Remote Sensing and Modeling of Ecosystems for Sustainability III; SPIE: Philadelphia, PA, USA, 2006; Volume 6298, pp. 64–73. [Google Scholar] [CrossRef]
  46. Gleason, K.E.; Nolin, A.W.; Roth, T.R. Charred forests increase snowmelt: Effects of burned woody debris and incoming solar radiation on snow ablation. Geophys. Res. Lett. 2013, 40, 4654–4661. [Google Scholar] [CrossRef]
  47. Lentile, L.B.; Smith, A.M.; Hudak, A.T.; Morgan, P.; Bobbitt, M.J.; Lewis, S.A.; Robichaud, P.R. Remote sensing for prediction of 1-year post-fire ecosystem condition. Int. J. Wildland Fire 2009, 18, 594–608. [Google Scholar] [CrossRef]
  48. McCarley, T.R.; Smith, A.M.; Kolden, C.A.; Kreitler, J. Evaluating the Mid-Infrared Bi-spectral Index for improved assessment of low-severity fire effects in a conifer forest. Int. J. Wildland Fire 2018, 27, 407–412. [Google Scholar] [CrossRef]
  49. Tran, B.N.; Tanase, M.A.; Bennett, L.T.; Aponte, C. Evaluation of spectral indices for assessing fire severity in Australian temperate forests. Remote Sens. 2018, 10, 1680. [Google Scholar] [CrossRef]
  50. Fernández, C.; Fernández-Alonso, J.M.; Vega, J.A.; Fontúrbel, T.; Llorens, R.; Sobrino, J.A. Exploring the use of spectral indices to assess alterations in soil properties in pine stands affected by crown fire in Spain. Fire Ecol. 2021, 17, 1–11. [Google Scholar] [CrossRef]
  51. Moreno, J.M.; Pineda, F.D.; Rivas-Martinez, S. Climate and vegetation at the Eurosiberian-Mediterranean boundary in the Iberian Peninsula. J. Veg. Sci. 1990, 1, 233–244. [Google Scholar] [CrossRef]
  52. Verdú, F.; Salas, J.; Vega-García, C. A multivariate analysis of biophysical factors and forest fires in Spain, 1991–2005. Int. J. Wildland Fire 2012, 21, 498–509. [Google Scholar] [CrossRef]
  53. Gillespie, A.; Rokugawa, S.; Matsunaga, T.; Cothern, J.S.; Hook, S.; Kahle, A.B. A temperature and emissivity separation algorithm for Advanced Spaceborne Thermal Emission and Reflection Radiometer (ASTER) images. IEEE Trans. Geosci. Remote Sens. 1998, 36, 1113–1126. [Google Scholar] [CrossRef]
  54. Chuvieco, E.; Martin, M.P.; Palacios, A. Assessment of different spectral indices in the red-near-infrared spectral domain for burned land discrimination. Int. J. Remote Sens. 2002, 23, 5103–5110. [Google Scholar] [CrossRef]
  55. Quintano, C.; Fernández-Manso, A.; Fernández-Manso, O. Combination of Landsat and Sentinel-2 MSI data for initial assessing of burn severity. Int. J. Appl. Earth Obs. Geoinf. 2018, 64, 221–225. [Google Scholar] [CrossRef]
  56. Llorens, R.; Sobrino, J.A.; Fernández, C.; Fernández-Alonso, J.M.; Vega, J.A. A methodology to estimate forest fires burned areas and burn severity degrees using Sentinel-2 data. Application to the October 2017 fires in the Iberian Peninsula. Int. J. Appl. Earth Obs. Geoinf. 2021, 95, 102243. [Google Scholar] [CrossRef]
  57. Sobrino, J.A.; Llorens, R.; Fernández, C.; Fernández-Alonso, J.M.; Vega, J.A. Relationship between soil burn severity in forest fires measured in situ and through spectral indices of remote detection. Forests 2019, 10, 457. [Google Scholar] [CrossRef]
  58. Richter, R.; Schläpfer, D. Atmospheric/topographic correction for satellite imagery. DLR Rep. DLR-IB 2005, 565. [Google Scholar]
  59. ESA. Sentinel-2 MSI Technical Guide (European Space Agency). 2023. Available online: https://sentinel.esa.int/web/sentinel/sentinel-2 (accessed on 14 November 2023).
  60. Key, C.H.; Benson, N.C. Landscape assessment (LA). In FIREMON: Fire Effects Monitoring and Inventory System. Gen. Tech. Rep. RMRS-GTR-164-CD; Lutes, D.C., Keane, R.E., Caratti, J.F., Key, C.H., Benson, N.C., Sutherland, S., Gangi, L.J., Eds.; US Department of Agriculture, Forest Service, Rocky Mountain Research Station: Fort Collins, CO, USA, 2006; p. LA-1-55, 164. [Google Scholar]
  61. Alasta, A.F. Using Remote Sensing data to identify iron deposits in central western Libya. In International Conference on Emerging Trends in Computer and Image Processing, Bangkok; December, 2011. pp. 56–61. Available online: https://www.researchgate.net/profile/Amro-Alasta-2/publication/325550303_Using_Remote_Sensing_data_to_identify_iron_deposits_in_central_western_Libya/links/5b153f800f7e9b498109a3c2/Using-Remote-Sensing-data-to-identify-iron-deposits-in-central-western-Libya.pdf (accessed on 15 December 2024).
  62. Hewson, R.D.; Cudahy, T.J.; Huntington, J.F. Geologic and alteration mapping at Mt Fitton, South Australia, using ASTER satellite-borne data. In Proceedings of the IGARSS 2001. Scanning the Present and Resolving the Future. Proceedings. IEEE 2001 International Geoscience and Remote Sensing Symposium (Cat. No. 01CH37217), Sydney, NSW, Australia, 9–13 July 2001; IEEE: Piscataway, NJ, USA, 2001; Volume 2, pp. 724–726. [Google Scholar]
  63. Kaufman, Y.J.; Remer, L.A. Detection of forests using mid-IR reflectance: An application for aerosol studies. IEEE Trans. Geosci. Remote Sens. 1994, 32, 672–683. [Google Scholar] [CrossRef]
  64. Fornacca, D.; Ren, G.; Xiao, W. Evaluating the best spectral indices for the detection of burn scars at several post-fire dates in a mountainous region of Northwest Yunnan, China. Remote Sens. 2018, 10, 1196. [Google Scholar] [CrossRef]
  65. Tharwat, A. Classification assessment methods. Appl. Comput. Inform. 2020, 17, 168–192. [Google Scholar] [CrossRef]
  66. Sokolova, M.; Japkowicz, N.; Szpakowicz, S. Beyond accuracy, F-score and ROC: A family of discriminant measures for performance evaluation. In Australasian Joint Conference on Artificial Intelligence; Springer: Berlin/Heidelberg, Germany, 2006; pp. 1015–1021. [Google Scholar]
  67. Cohen, J. A coefficient of agreement for nominal scales. Educ. Psychol. Meas. 1960, 20, 37–46. [Google Scholar] [CrossRef]
  68. Banerjee, M.; Capozzoli, M.; McSweeney, L.; Sinha, D. Beyond kappa: A review of interrater agreement measures. Can. J. Stat. 1999, 27, 3–23. [Google Scholar] [CrossRef]
  69. McHugh, M.L. Interrater reliability: The kappa statistic. Biochem. Medica 2012, 22, 276–282. [Google Scholar] [CrossRef]
  70. Landis, J.R.; Koch, G.G. The measurement of observer agreement for categorical data. Biometrics 1977, 33, 159–174. [Google Scholar] [CrossRef]
  71. Kuhn, M. Building predictive models in R using the caret package. J. Stat. Softw. 2008, 28, 1–26. [Google Scholar] [CrossRef]
  72. Miller, J.D.; Thode, A.E. Quantifying burn severity in a heterogeneous landscape with a relative version of the delta Normalized Burn Ratio (dNBR). Remote Sens. Environ. 2007, 109, 66–80. [Google Scholar] [CrossRef]
  73. Cansler, C.A.; McKenzie, D. How robust are burn severity indices when applied in a new region? Evaluation of alternate field-based and remote-sensing methods. Remote Sens. 2012, 4, 456–483. [Google Scholar] [CrossRef]
  74. Morgan, P.; Keane, R.E.; Dillon, G.K.; Jain, T.B.; Hudak, A.T.; Karau, E.C.; Strand, E.K. Challenges of assessing fire and burn severity using field measures, remote sensing and modelling. Int. J. Wildland Fire 2014, 23, 1045–1060. [Google Scholar] [CrossRef]
  75. Flannigan, M.D.; Stocks, B.J.; Wotton, B.M. Climate change and forest fires. Sci. Total Environ. 2000, 262, 221–229. [Google Scholar] [CrossRef]
  76. Fernandez-Garcia, V.; Santamarta, M.; Fernandez-Manso, A.; Quintano, C.; Marcos, E.; Calvo, L. Burn severity metrics in fire-prone pine ecosystems along a climatic gradient using Landsat imagery. Remote Sens. Environ. 2018, 206, 205–217. [Google Scholar] [CrossRef]
  77. Harris, S.; Veraverbeke, S.; Hook, S. Evaluating spectral indices for assessing fire severity in chaparral ecosystems (Southern California) using MODIS/ASTER (MASTER) airborne simulator data. Remote Sens. 2011, 3, 2403–2419. [Google Scholar] [CrossRef]
  78. Smith, A.M.; Eitel, J.U.; Hudak, A.T. Spectral analysis of charcoal on soils: Implications for wildland fire severity mapping methods. Int. J. Wildland Fire 2010, 19, 976–983. [Google Scholar] [CrossRef]
  79. Roy, D.P.; Boschetti, L.; Trigg, S.N. Remote sensing of fire severity: Assessing the performance of the normalized burn ratio. IEEE Geosci. Remote Sens. Lett. 2006, 3, 112–116. [Google Scholar] [CrossRef]
  80. Van Gerrevink, M.J.; Veraverbeke, S. Evaluating the near and mid infrared bi-spectral space for assessing fire severity and comparison with the differenced normalized burn ratio. Remote Sens. 2021, 13, 695. [Google Scholar] [CrossRef]
  81. Sobrino, J.A.; Llorens, R.; Fernández, C.; Fernández-Alonso, J.M.; Vega, J.A. Methodology for burned areas delimitation and fire severity assessment using Sentinel-2 data. A case study of forest fires occurred in Spain between 2018 and 2023. Recent Adv. Remote Sens. 2024, 2, 1–13. [Google Scholar] [CrossRef]
  82. Li, L.; Solana, C.; Canters, F.; Chan, J.C.W.; Kervyn, M. Impact of environmental factors on the spectral characteristics of lava surfaces: Field spectrometry of basaltic lava flows on Tenerife, Canary Islands, Spain. Remote Sens. 2015, 7, 16986–17012. [Google Scholar] [CrossRef]
  83. Zheng, Z.; Zeng, Y.; Li, S.; Huang, W. A new burn severity index based on land surface temperature and enhanced vegetation index. Int. J. Appl. Earth Obs. Geoinf. 2016, 45, 84–94. [Google Scholar] [CrossRef]
  84. Mpakairi, K.S.; Kadzunge, S.L.; Ndaimani, H. Testing the utility of the blue spectral region in burned area mapping: Insights from savanna wildfires. Remote Sens. Appl. Soc. Environ. 2020, 20, 100365. [Google Scholar] [CrossRef]
  85. Kaufman, Y.J.; Tanre, D. Atmospherically resistant vegetation index (ARVI) for EOS-MODIS. IEEE Trans. Geosci. Remote Sens. 1992, 30, 261–270. [Google Scholar] [CrossRef]
  86. Beltrán-Marcos, D.; Suárez-Seoane, S.; Fernández-Guisuraga, J.M.; Fernández-García, V.; Pinto, R.; García-Llamas, P.; Calvo, L. Mapping soil burn severity at very high spatial resolution from unmanned aerial vehicles. Forests 2021, 12, 179. [Google Scholar] [CrossRef]
  87. McFeeters, S.K. The use of the Normalized Difference Water Index (NDWI) in the delineation of open water features. Int. J. Remote Sens. 1996, 17, 1425–1432. [Google Scholar] [CrossRef]
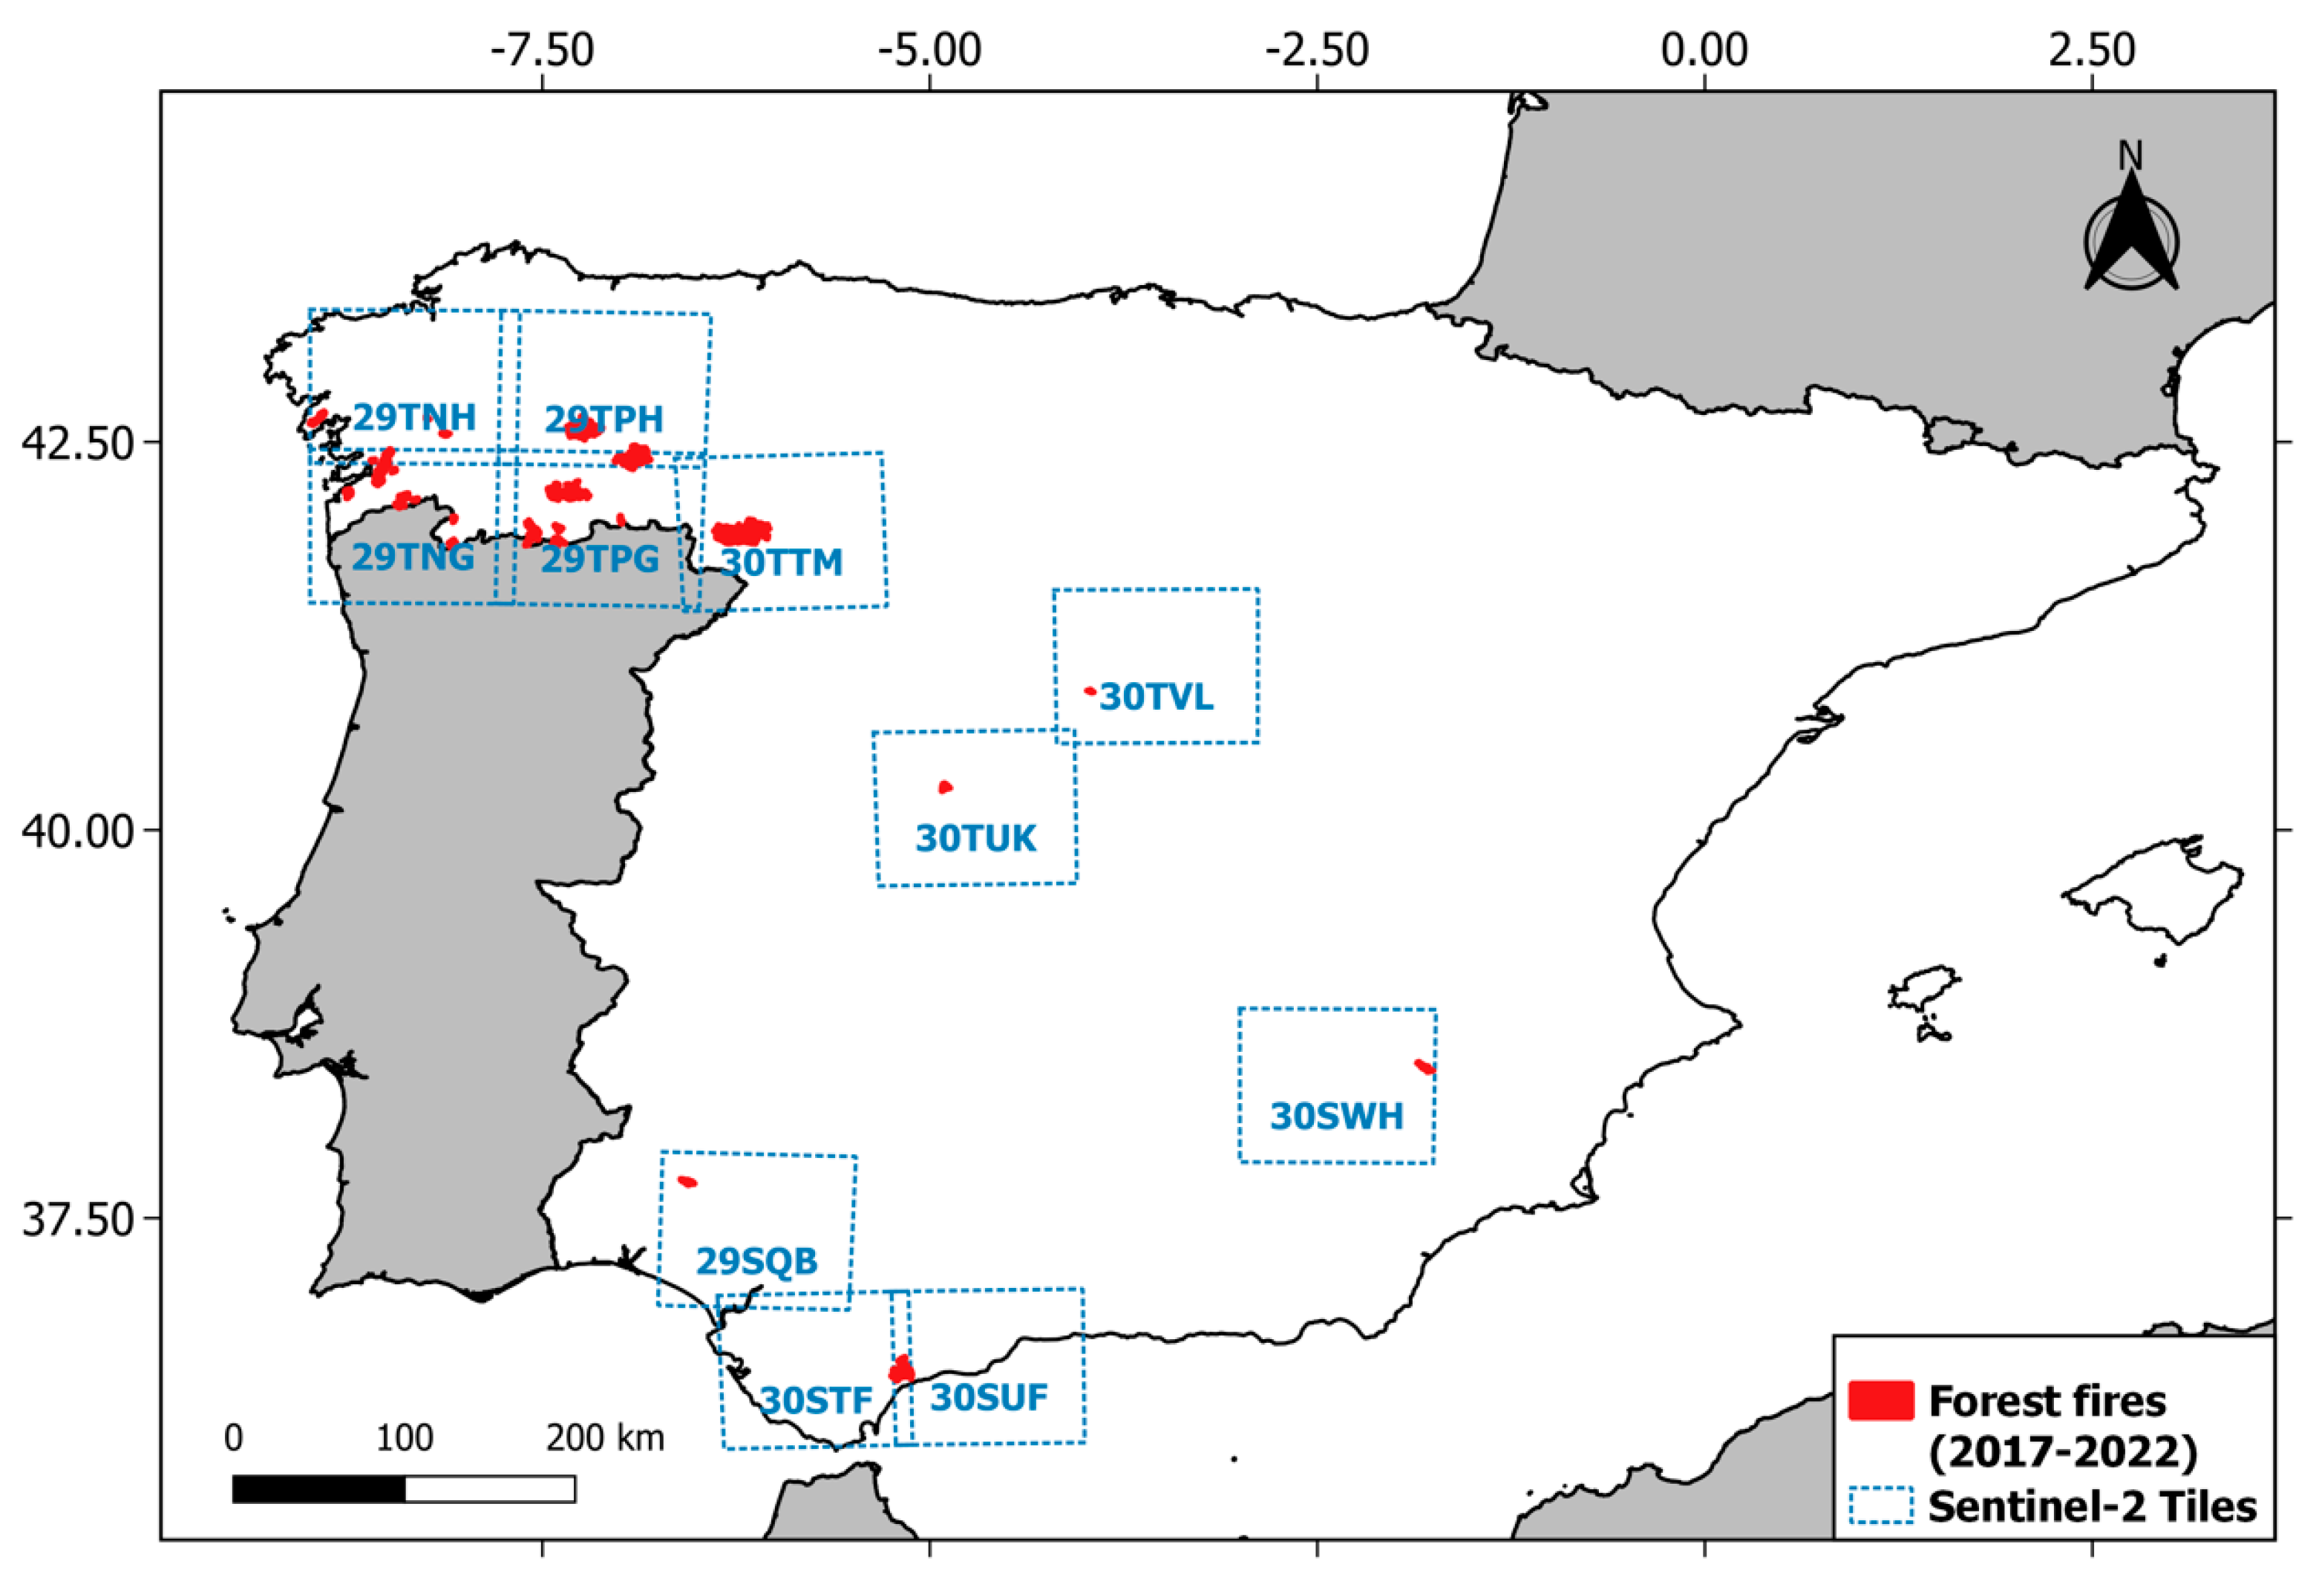
Figure 1. Study area with all the forest fires studied (red color) and Sentinel−2 tiles used (represented by discontinuous red lines. The reference coordinate system is WGS84 (EPSG: 4326).
Fire 07 00487 g001
Figure 2. Soil burn severity levels classified using a modified version [6] of the soil burn severity index proposed by [43]. Levels 1 and 2 correspond to low severity, level 3 to moderate severity, and level 4, 5, and 6 to high severity.
Fire 07 00487 g002
Figure 3. Example of optical (ASD) and thermal (CIMEL CE-312) radiometric measurements carried out during Pedro Bernardo’s field campaign (2 August 2019).
Fire 07 00487 g003
Figure 4. CIMEL CE-312 emissivity data obtained after TES algorithm for all soil burn severity levels measured on the field: Vilaza (10 October 2018), Nerva (4 October 2018), Pedro Bernardo (2 August 2019), and Real Sitio de San Ildefonso (5 September 2019).
Fire 07 00487 g004
Figure 5. Reclassification of CIMEL CE-312 emissivity data into three new soil burn severity levels (Low = severity 2; Moderate = severity 3; and High = severity 4, 5, and 6), obtained after TES algorithm for all soil burn severity levels measured on the field: Vilaza (10 October 2018), Nerva (4 October 2018), Pedro Bernardo (2 August 2019), and Real Sitio de San Ildefonso (5 September 2019).
Fire 07 00487 g005
Figure 6. (a) ASD reflectance data obtained for all soil burn severity levels measured on the field: Vilaza (10 October 2018), Nerva (4 October 2018), Pedro Bernardo (2 August 2019) and Real Sitio de San Ildefonso (5 September 2019); (b) ASD reflectance data obtained for all soil burn severity measured at the laboratory.
Fire 07 00487 g006
Figure 7. (a) Reclassification of ASD reflectance data into three new soil burn severity levels (Low = severity 2; Moderate = severity 3 and High = severity 4, 5, and 6), for all soil burn severity levels measured on the field: Vilaza (10 October 2018), Nerva (4 October 2018), Pedro Bernardo (2 August 2019), and Real Sitio de San Ildefonso (5 September 2019); (b) Reclassification of ASD reflectance data into three new soil burn severity levels (Low = severity 2; Moderate = severity 3, and High = severity 4, 5, and 6) for all soil burn severity levels measured at laboratory.
Fire 07 00487 g007
Figure 8. (a) Field ASD measurements convolved to Sentinel-2 spectral bands configuration using the spectral response function of Sentinel-2; (b) Laboratory ASD measurements convolved to Sentinel-2 spectral bands configuration using the spectral response function of Sentinel-2.
Fire 07 00487 g008
Figure 9. Weighted separability index (SIw) obtained for all spectral indices used in this study (Table 3). The green color represents SIw for all soil burn severity levels measured by ASD on the field. The blue color represents SIw for all soil burn severity levels measured by ASD in the laboratory.
Fire 07 00487 g009
Figure 10. Example of soil burn severity map obtained by the optimal thresholds (Table 4) of IOR spectral index (spectral index with highest accuracy results shown in Table 5 and Table 6) focused on a San Millao forest fire (field date: 10 September 2020).
Fire 07 00487 g010
Table 1. Forest fire date, field campaign date, and number of soil burn severity plots for each forest fire.
CommunityPlace NameForest Fire Extinction DateField Campaign DateSoil Burn Severity Plots
LowModerateHigh
AndalucíaNerva2 August 20184 October 201827-
Estepona12 September 202121 October 2021
22 October 2021
25-
Castilla La ManchaHellín25 July 202118 August 2021
19 August 2021
47-
Castilla y LeónReal Sitio de San Ildefonso4 August 20195 September 2019462
Pedro Bernardo28 June 20192 August 201913-
Zamora24 June 202215 July 202231-5
GaliciaSilleda15 October 201714 November 2017262
Nigrán15 October 201714 November 2017-1-
Soutomaior15 October 201714 November 20176173
Fornelos de Montes16 October 201714 November 201735-
As Neves15 October 201714 November 2017214-
Flariz24 July 202031 July 2020
27 August 2020
1391
San Millao29 July 20204 August 2020
3 September 2020
10 September 2020
12161
Verín 122 July 2020
4 August 2022
9 September 2020
22 August 2022
23 August 2022
125-
Lobios12 September 202021 September 2020
28 September 2020
1153
Vilariño13 September 202022 September 2020533
Cualedro13 September 202025 September 2020
26 September 2020
63-
Chandrexa13 September 202029 September 202023-
Cernado14 September 202029 September 20203-2
Cadavos14 September 202030 September 2020123
Arbo31 July 202222 August 2022312
Baltar6 August 202216 August 20225--
Boiro6 August 202210 August 2022
12 August 2022
16-5
Carballeda de Valdeorras22 July 20222 August 2022
3 August 2022
27563
Folgoso do Courel23 July 202227 July 2022
28 July 2022
29 July 2022
4 August 2022
471230
Irixo11 August 202229 August 20223-4
Laza-Chandrexa15 August 202218 August 20223--
Lobeira26 August 20226 September 20223--
Oimbra-Rabal21 July 202218 August 2022
23 August 2022
1112
Oimbra-Videferre19 July 202223 August 20223--
Vilariño de Conso24 July 202218 August 20222--
Global- -24518771
1 Two forest fires occurred in the same area but in different years (July, 2020; August, 2022).
Table 2. Sentinel-2 bands with their respective central wavelengths and spatial resolutions. In bold font the spectral bands used in this study.
Sentinel-2 BandsCentral Wavelength (μm)Resolution (m)
B1—Coastal aerosol0.43360
B2—Blue0.49010
B3—Green0.56010
Band 4—Red0.66510
B5—Vegetation Red Edge0.70520
B6—Vegetation Red Edge0.74020
B7—Vegetation Red Edge0.78320
B8—NIR0.84210
B8A—Vegetation Red Edge0.86520
B9—Water Vapor0.94560
B10—SWIR—Cirrus1.37560
B11—SWIR 11.61020
B12—SWIR 22.19020
Table 3. Spectral indices for soil burn severity assessment used in this study. Sentinel-2 bands are described in Table 2.
Spectral IndexAlgorithmReference
Normalized Burn Ratio (NBR) N B R = ( B 8 B 12 ) ( B 8 + B 12 ) [60]
Normalized Burn Ratio 2 (NBR2) N B R 2 = ( B 11 B 12 ) ( B 11 + B 12 ) [33]
Mid-Infrared Burn Index (MIRBI) M I R B I = 10 B 11 9.8 B 12 [31]
Burned Area Index for Sentinel-2 (BAIS2)     B A I S 2 = 1 B 6 B 7 B 8 A B 4 B 12 B 8 A B 12 B 8 A + 1 [20]
Clay Ratio (CR) C R = B 11 B 12 [61]
Iron Oxide Ratio (IOR) I O R = B 4 B 2 [62]
Table 4. Optimal thresholds obtained by the lines match spectral indices histograms graphs which SIw were equal or higher than 1 (Figure 9).
ScenarioSpectral IndexOptimal Thresholds
LowModerateHigh
FieldNBRNBR < −0.55NBR > −0.49−0.49 ≥ NBR ≥ −0.55
CMCM < 0.74CM > 0.850.85 ≥ CM ≥ 0.74
LaboratoryIORIOR < 1.39IOR > 1.691.69 ≥ IOR ≥ 1.39
CMCM < 0.74CM > 0.890.89 ≥ CM ≥ 0.74
NBR2NBR2 < −0.15NBR2 > −0.06−0.06 ≥ NBR2 ≥ −0.15
MIRBI−0.31 ≥ MIRBI ≥ −0.62MIRBI > −0.31MIRBI < −0.62
Table 5. Results of sensitivity and specificity for each soil burn severity level obtained in this study (Low = L, Moderate = M, and High = H). Soil burn severity levels were validated using the field plots summarized in Table 1. In bold, the three highest results and in red, the highest result for each soil burn severity level and metric.
ScenarioSpectral IndexSensitivitySpecificityMean (Sensitivity and
Specificity)
LMHLMHLMH
FieldNBR0.550.830.240.910.480.970.730.660.61
CM0.460.820.341.000.540.840.730.680.59
LaboratoryIOR0.830.520.700.780.920.840.810.720.77
CM0.460.670.591.000.660.730.730.670.66
NBR20.460.710.560.980.640.770.720.680.67
MIRBI0.570.810.000.870.460.970.720.640.49
Table 6. Overall results of accuracy (ACC), balanced accuracy (BACC), F1-score (F1), and Cohen kappa index (k). In bold, the three highest results and in red, the highest result for each soil burn severity level and metric.
ScenarioSpectral IndexAccuracy
(ACC)
Balanced
Accuracy
(BACC)
F1-Score
(F1)
Cohen’s Kappa
index (k)
FieldNBR0.610.660.540.35
CM0.580.660.520.34
LaboratoryIOR0.710.760.630.50
CM0.560.680.540.35
NBR20.570.690.540.36
MIRBI0.570.610.420.28
Disclaimer/Publisher’s Note: The statements, opinions and data contained in all publications are solely those of the individual author(s) and contributor(s) and not of MDPI and/or the editor(s). MDPI and/or the editor(s) disclaim responsibility for any injury to people or property resulting from any ideas, methods, instructions or products referred to in the content.