Abstract
Induction and reaction times of hydrogen–air mixtures (ϕ = 0.5–2) have been measured behind reflected shock waves at temperatures of 1000–1600 K, pressures of 0.1, 0.3, 0.6 MPa in the domain of the extended second explosion limit. The measurements were performed in the shock tube with a completely transparent test section of 0.5 m long, which provides pressure, ion current, OH and high-speed chemiluminescence observations. The experimental induction time plots demonstrate a clear increasing of the global activation energy from high- to low temperature post-shock conditions. This trend is strongly pronounced at higher post-shock pressures. For a high-temperature range of T > 1200 K, induction time measurements show an activation energy for the global reaction rate of hydrogen oxidation of 64–83 kJ/mole. Detected reaction times exhibit a big scatter and a weak temperature dependence. The minimum reaction time value was nearly 2 µs. Obtained induction time data were compared with calculations carried out in accordance with the known kinetic mechanisms. For current and former shock-tube experiments within a pressure range of 0.1–2 MPa, critical temperatures required for strong (1000–1100 K), transient and weak auto-ignition modes behind reflected shock waves were identified by means of the pressure and ion-probe measurements in stoichiometric hydrogen-air mixture. The transfer from the strong volumetric self-ignition near the reflecting wall to the hot spot ignition (transient) was established and visualized below <1200 K with a post-shock temperature decreasing.
1. Introduction
Nowadays, hydrogen is widely used as ecological fuel in many technical applications. To increase the efficiency of its use and application in new fields, it is important to understand clearly the processes of hydrogen oxidation in different conditions, including extremely high temperatures and pressures. The studies of self-ignition of hydrogen mixtures have been conducted for many years [1,2,3,4,5,6,7], but still currently, because most data were not obtained for extreme conditions and for diluted mixtures. The data of such studies are also important for a more complete understanding of the kinetics of hydrogen oxidation under various conditions.
The critical conditions and mechanisms of hydrogen oxidation are explained in the theory of chain reactions by the competition of the reactions of branching and termination of chains [8,9,10,11]. One of the most important consequences of this theory is the existence of hydrogen–oxygen explosion limits in a temperature–pressure plane [9] and the complex functional dependence of the ignition delay time on the pressure and temperature of the reaction mixture [12].
The reaction rates of hydrogen oxidation (T > 800 K) at low post-shock pressures (>0.2 MPa) have been thoroughly studied and validated with the use of a large amount of shock-tube experiments behind incident and reflected shock waves in mixtures highly diluted with argon. In these conditions, the ignition delay usually is inversely proportional to the oxygen partial pressure and decreases when increasing the initial pressure. Therefore, for the low-pressure range fast chain branching reactions with the participation of H, OH, and O radicals [8,9,10,11] dominate in the reaction mechanism of hydrogen oxidation.
The growing of initial pressures (>0.2 MPa) increases the role of the chain branching reactions with the participation of HO2 molecules formed due to trimolecular reactionH + O2 + M = HO2 + M and favors the removal of active hydrogen atoms from the fast chain branching determining the ignition at low pressures. The branched cycle, in which HO2 molecules are formed, consists of a number of slow reactions increasing the characteristic time of hydrogen oxidation and the ignition delay time. The functional behavior of induction time on temperature and pressure is extremely important for hydrogen oxidation at elevated pressures and is usually established by using detailed numerical simulations [4,13] or empirical temperature approximations for induction times on the basis of low-pressure measurements. Moreover, existing kinetic schemes of hydrogen oxidation are not validated extensively by experimental measurements at high pressures. Only a few works [5,7,14,15,16,17,18] were devoted to studies of high-temperature hydrogen auto-ignitions at elevated pressures of 0.2–0.9 MPa.
Thus, the ranges of pressures of 0.2–2 MPa and temperatures of 1000–1600 K, characterized by a change in the hydrogen–oxygen chain reaction mechanism, have practically not been investigated. The present work gives results of experimental studies of ignition and reaction times of hydrogen–air mixtures at pressures of 0.1–0.6 MPa, temperatures of 1000–1600 K, and equivalence ratios of 0.5–2.
2. Experimental Setup
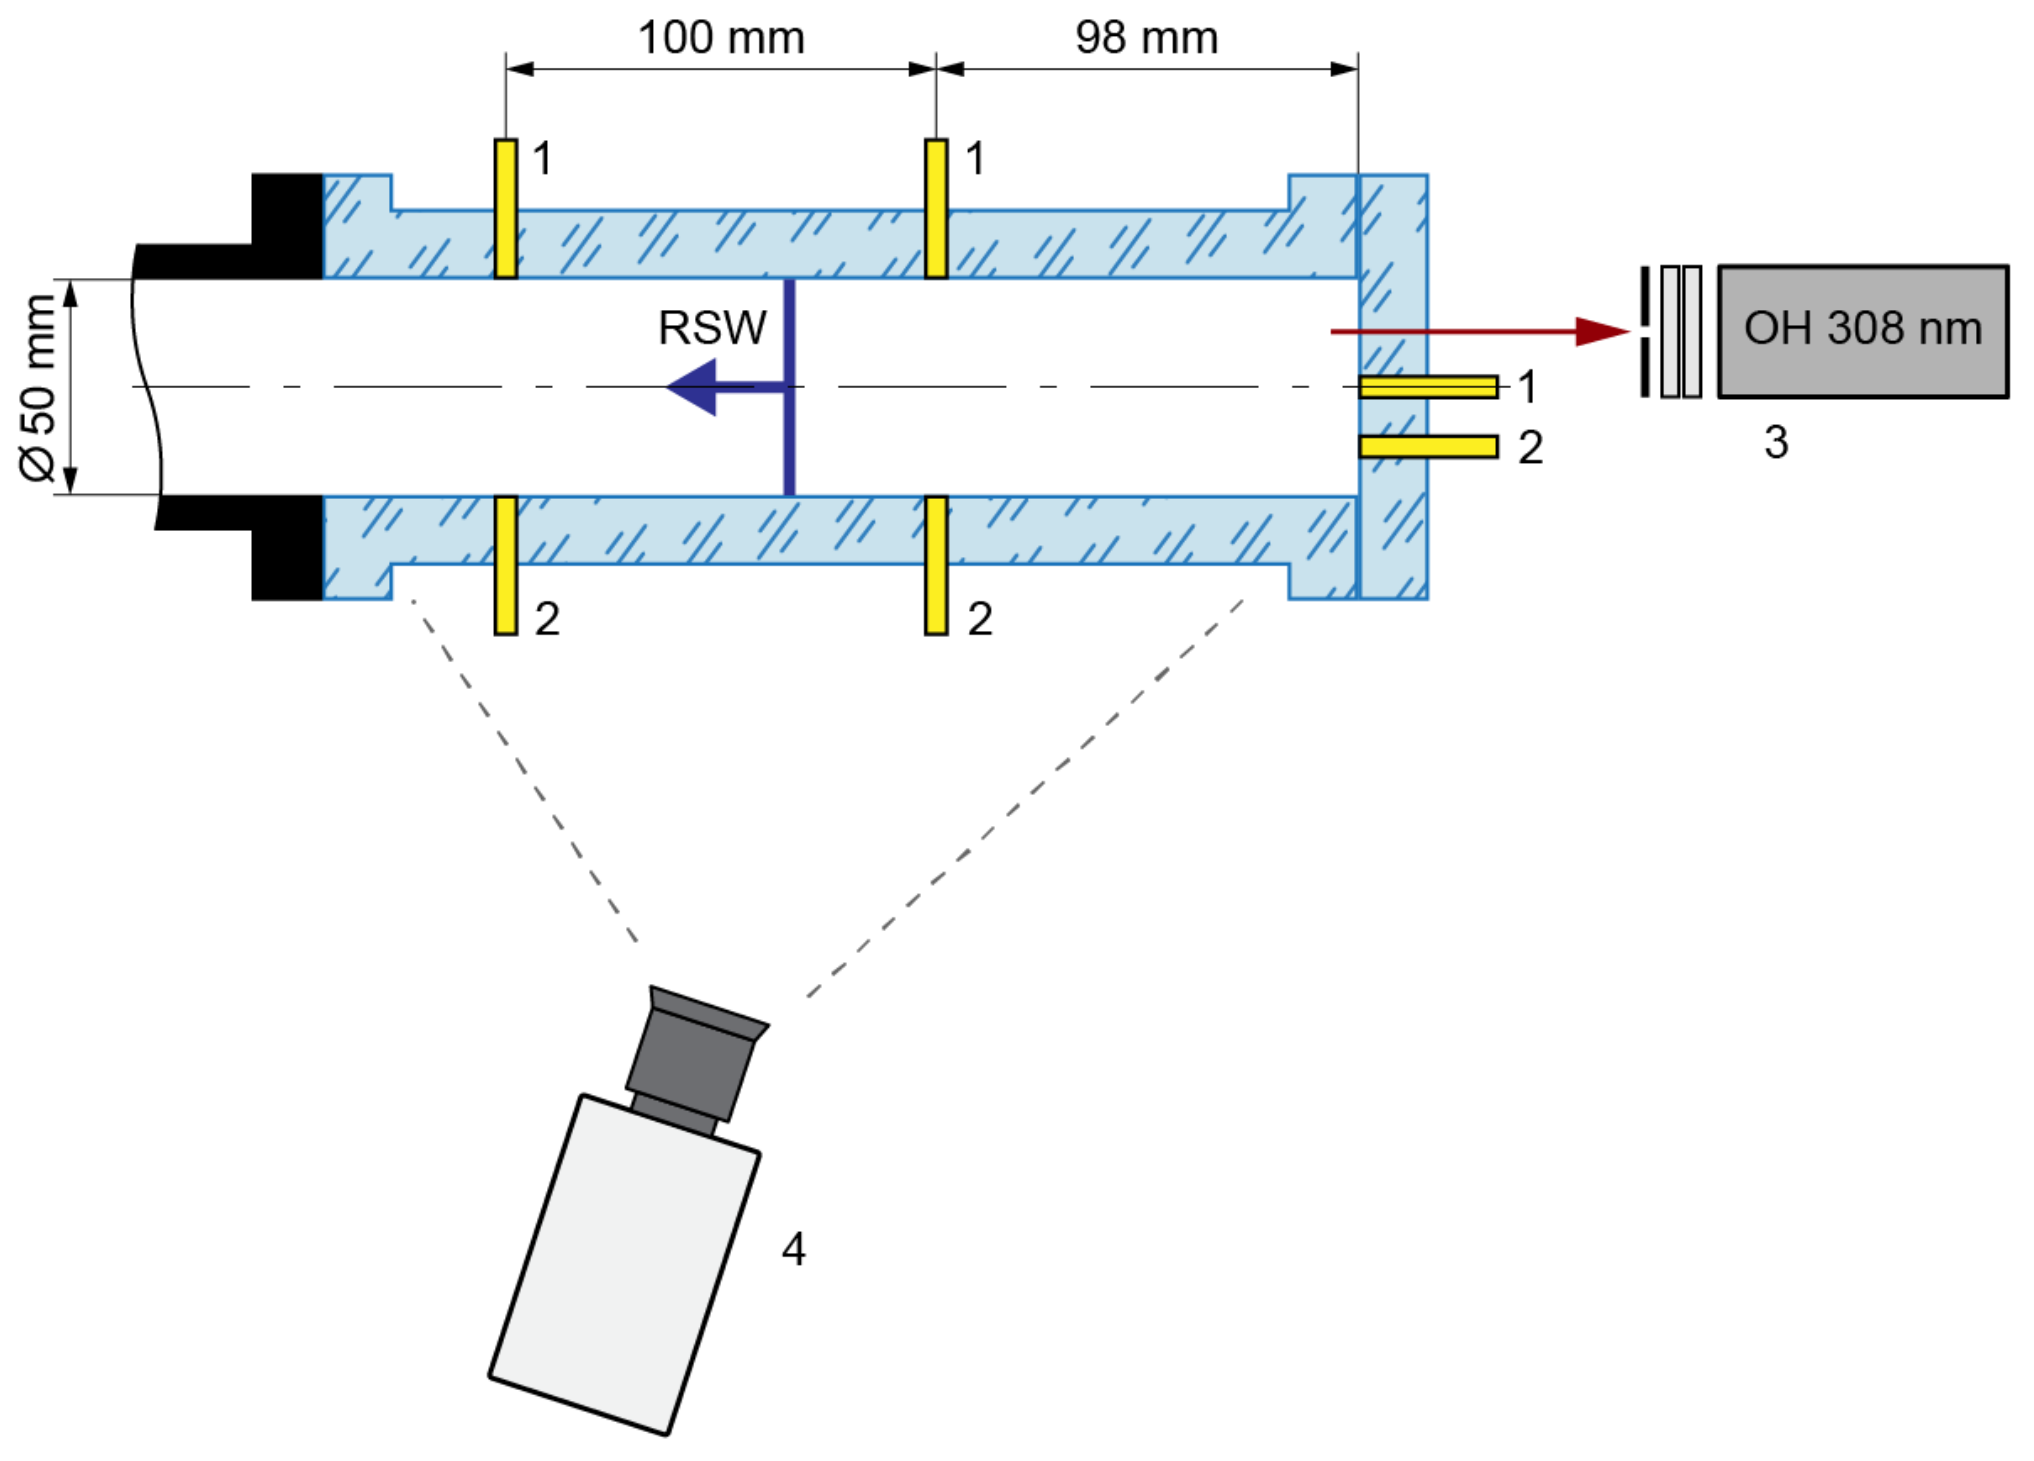
The study of the self-ignition process was carried out in a stainless-steel round shock tube. The inner diameter of the tube was 50 mm and the length was 8.5 m. The measurements were made behind the reflected shock wave. The test section of the shock tube (Figure 1) was manufactured from a single piece of transparent organic glass to observe the self-ignition process. The inner diameter of the round test section was 50 mm, and the cross-section of the external wall was rectangular. The reflecting surface of the shock tube (the end of the test section) was also manufactured from transparent organic glass.

Figure 1.
Schematic of the test section in the shock tube: 1—high-frequency pressure sensors, 2—ion current sensors, 3—photomultiplier with diaphragm and double narrowband filter, 4—high-speed video camera.
Two measuring cross-sections were located in the test section at distances of 98 mm and 198 mm from the reflecting wall. Each measuring cross-section consisted of PCB 113B24 high-frequency piezoelectric pressure sensor and an ion current sensor. The pressure sensor was installed at the bottom point of the measuring cross-section. The ion current sensor was installed at an angle of 45° to the pressure sensor. One pressure and one ion current sensor were mounted onto the transparent reflecting wall. The first one was in the center and the second one below, so that the distance between the sensor bodies was 10 mm. All applied sensors were connected to high-frequency digital oscilloscopes. The registered signals were displayed on a personal computer.
The chemiluminescence during autoignition and reaction front propagation was recorded through the transparent reflecting wall using a photomultiplier with a diaphragm and double narrowband interferometric filters (Figure 1). We registered the chemiluminescence of the OH radical transition (A2Σ − X2Π) at a wavelength of λ = 308.9 nm.
High-speed chemiluminescence imaging of self-ignition and combustion of the gas mixture in the shock tube was carried out through the sidewall of the test section. A Photron FAST CAM SA-Z high-speed camera was used. The camera was located at a distance ~0.63 m from the axis of the test section and not exactly perpendicular to it, but with a slight deviation of ~10°. Therefore, we could monitor the inner volume of the test section over the length of 0.29 m and the surface of the reflecting wall simultaneously. This could be useful for finding the self-ignition point. The frame rate of the camera was 224000 fps and the exposure was 1/0.35 μs.
The induction times (ignition delays) of the studied hydrogen-air mixtures were determined from the end wall pressure and ion current measurements, the photomultiplier registration of chemiluminescence of the OH exited molecules, and high-speed camera imaging of reaction volume of the shock tube.
In the first case, the induction time (τpressure) was the time interval between the arrival of the incident shock wave at the reflecting wall and the subsequent pressure increase associated with self-ignition of the mixture behind the reflected wave. In the second case, the induction time (τion) was the time interval between the arrival of the incident shock wave at the reflecting wall and the appearance of the signal (increased by 5% of its peak level) of the ion current probe mounted onto the reflecting wall. In the third case, the induction time (τOH) was the time interval between the arrival of the incident shock wave at the reflecting wall and the appearance of the chemiluminescence of the OH molecules (increased photomultiplier signal by 5% of its peak level). In the fourth case, the induction time (τcam) was the time interval between the arrival of the incident shock wave at the reflecting wall and the appearance of the luminescence in the tube volume registered by the high-speed camera.
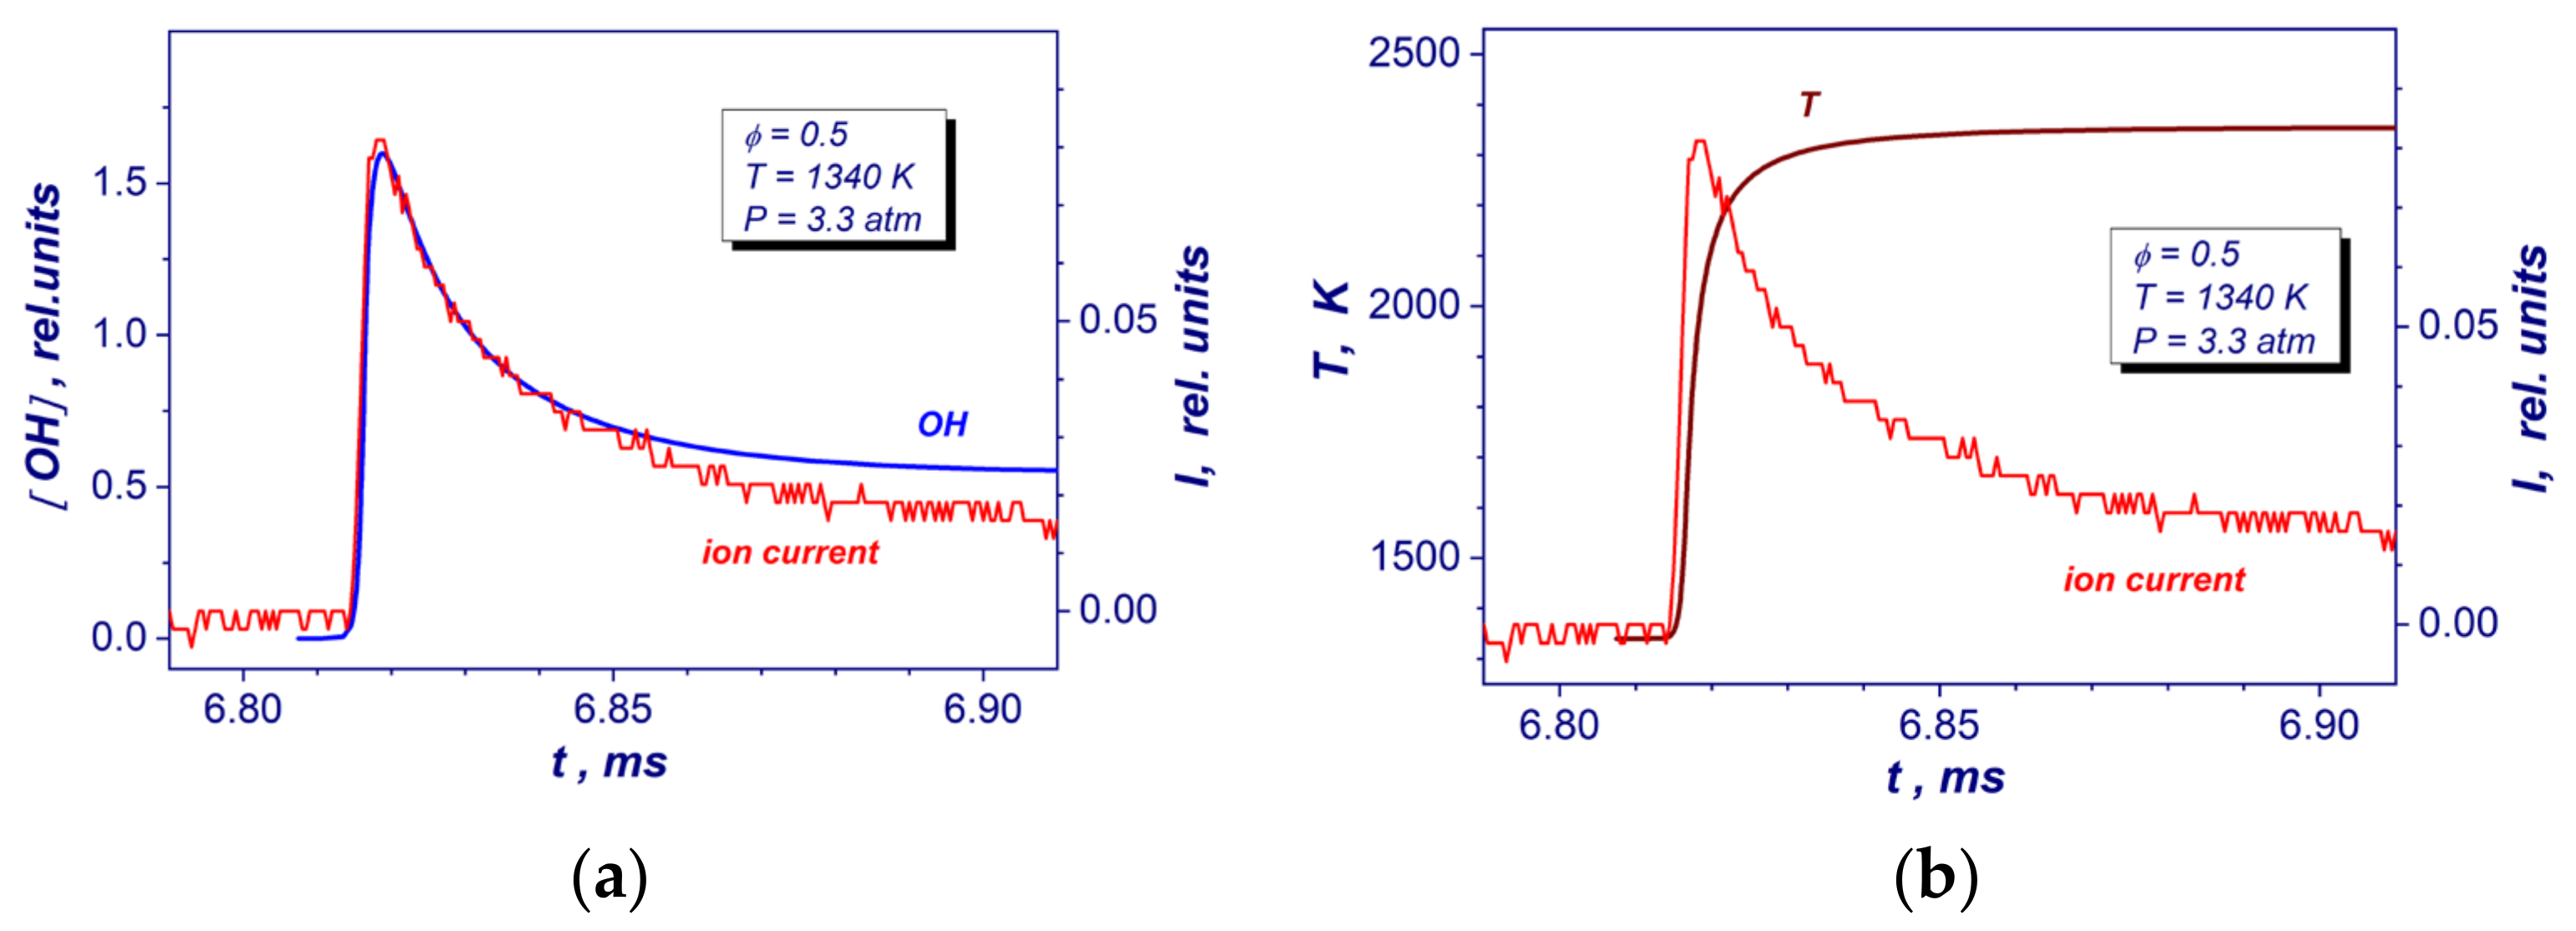
Reaction times of the studied mixture (τreaction) were detected by means of ion current measurements from the ion probe installed to the reflecting wall. The spacing between positive and negative electrodes of the ion current sensor was 0.3 mm. The head of the sensor was mounted flush with a surface of the end wall. Figure 2 shows comparisons of experimental ion current with a relative concentration of OH molecules and gas temperature obtained from the GRI Mech 3.0 reaction mechanism [19] at the same post-shock conditions. As one can see from the Figure 2a, the peak of ion current correlates well with a maximum production of OH radicals. Moreover, the peak value corresponds to the time of reaching 85–90% of maximal temperature during autoignition at a constant pressure (Figure 2b). Based on these measurements, the reaction time was defined as the time interval between the appearance of the ion current (increased by 5% of its peak level) and its peak level (Figure 2).
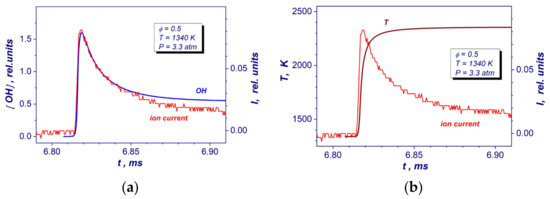
Figure 2.
Comparisons of the experimental end wall ion current record with OH yield (a) and gas temperature (b) temporary profiles deduced from detailed GRI Mech 3.0 reaction mechanism at auto-ignition of the lean stoichiometric hydrogen–air mixture at similar post-shock conditions.
The combined measurements of absolute velocity of the reflected shock wave in a frame of reference attached to gas flow behind the incident shock wave, post-shock pressures at different locations from the reflecting wall, and a high-speed camera imaging all together allow determining different auto-ignition modes of hydrogen-air mixtures (strong, transient and weak) in the compressed and stagnated gas behind the reflected shock wave [17,20,21,22]. For strong auto-ignition, the volumetric explosion of the mixture across the whole cross-section of the tube produces steady or overdriven detonations, which were observed at a distance of 198 mm from the reflecting wall. For transient modes, the flame acceleration from localized ignition kernels behind the reflected shock wave led to the onset of detonation upstream of the end wall. For weak ignitions, no visible changes in velocities of reflected shock wave propagation or sharp pressure spikes in compressed gas volume are observed during experiments. In this regime, the rate of energy release in preheated gas mixture did not result in flame acceleration and transition to detonation. The absolute velocity in the test section of the tube was defined as V = V5 + u, where V5 is visible speed of reflected shock wave, and u is velocity of incoming flow behind the incident shock wave. Visible speed is calculated by processing shock-arrival times at pressure sensors along the test section. Figure 3 illustrates a typical temperature dependence of the absolute reflected shock wave velocity for stoichiometric hydrogen/air mixture at a mean post-shock pressure of 0.29 MPa and the position of the strong explosion limit. The velocity data was taken from the experiments of Martynenko et.al [18] for setup, which is very close to experimental conditions of this study. The reflected shock wave velocity measurements were performed by the pressure sensors located at 81.2, 181.2 and 280.7 mm upstream the end wall of the shock tube in [18] (Figure 3), and at 98, 198 mm for this study respectively. The post-shock temperature corresponding to the breakpoint of velocity curve on the first measuring base was selected as the critical temperature for strong ignition limit. At this point, a mean propagation velocity of the leading shock wave measured at the first pressure sensor upstream the end wall begins exceeding a normal velocity of the reflected shock wave. For such strong auto-ignitions, the reaction front formed near the end-wall pass the reflected shock wave and results in the overdriven detonation at the second and third pressure sensors (Figure 3). Transient and weak ignition modes were established by means of the comparative analysis of pressure, ion current and luminosity records at different cross-sections of the shock tube.
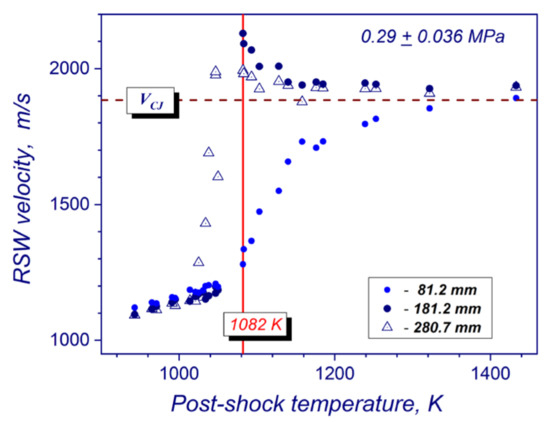
Figure 3.
Criterion for definition of the critical temperature for strong ignition mode in stoichiometric hydrogen–air mixture at 0.29 ± 0.036 MPa using a temperature dependence of the velocity of reflected shock wave.
The study was carried out for the following mixtures:
29.58% H2 + 14.79% O2 + 55.63% N2 (stoichiometric hydrogen–air mixture with ϕ = 1);
45.652% H2 + 11,413% O2 + 42,935% N2 (rich hydrogen–air mixture with ϕ = 2);
14.79% H2 + 14.79% O2 + 70.42% N2 (lean hydrogen–air mixture with ϕ = 0.5 diluted with 15% N2).
The test mixtures were prepared by the method of partial pressures. Gas parameters of the mixtures behind incident and reflected shock waves were computed by using the shock-adiabatic curve assuming frozen chemistry, known temperature dependence of heat capacity, and shock wave velocity measurements with accuracy ±0.5% at different locations along the tube. The Chapman–Jouguet detonation velocity VCJ in preheated gas flow behind the incident shock wave was calculated using laboratory-developed thermochemical equilibrium computer code. To study the temperature dependence of self-ignition delay and activation energy, all comparative experimental runs were carried out in stoichiometric, lean, and rich mixtures at constant post-shock pressures (~0.1, ~0.3, and ~0.6 MPa) behind the reflected shock wave.
The main errors in our experimental measurements were caused by two main reasons. The first is the error in measuring the velocity of the incident shock wave of ~0.5%. It led to an error in measuring temperature, pressure, and density of ~0.75%; ~1.5%; ~0.7%, respectively. The second is the error in measuring induction time. It was 10–15% for all studied parameter ranges.
3. Results
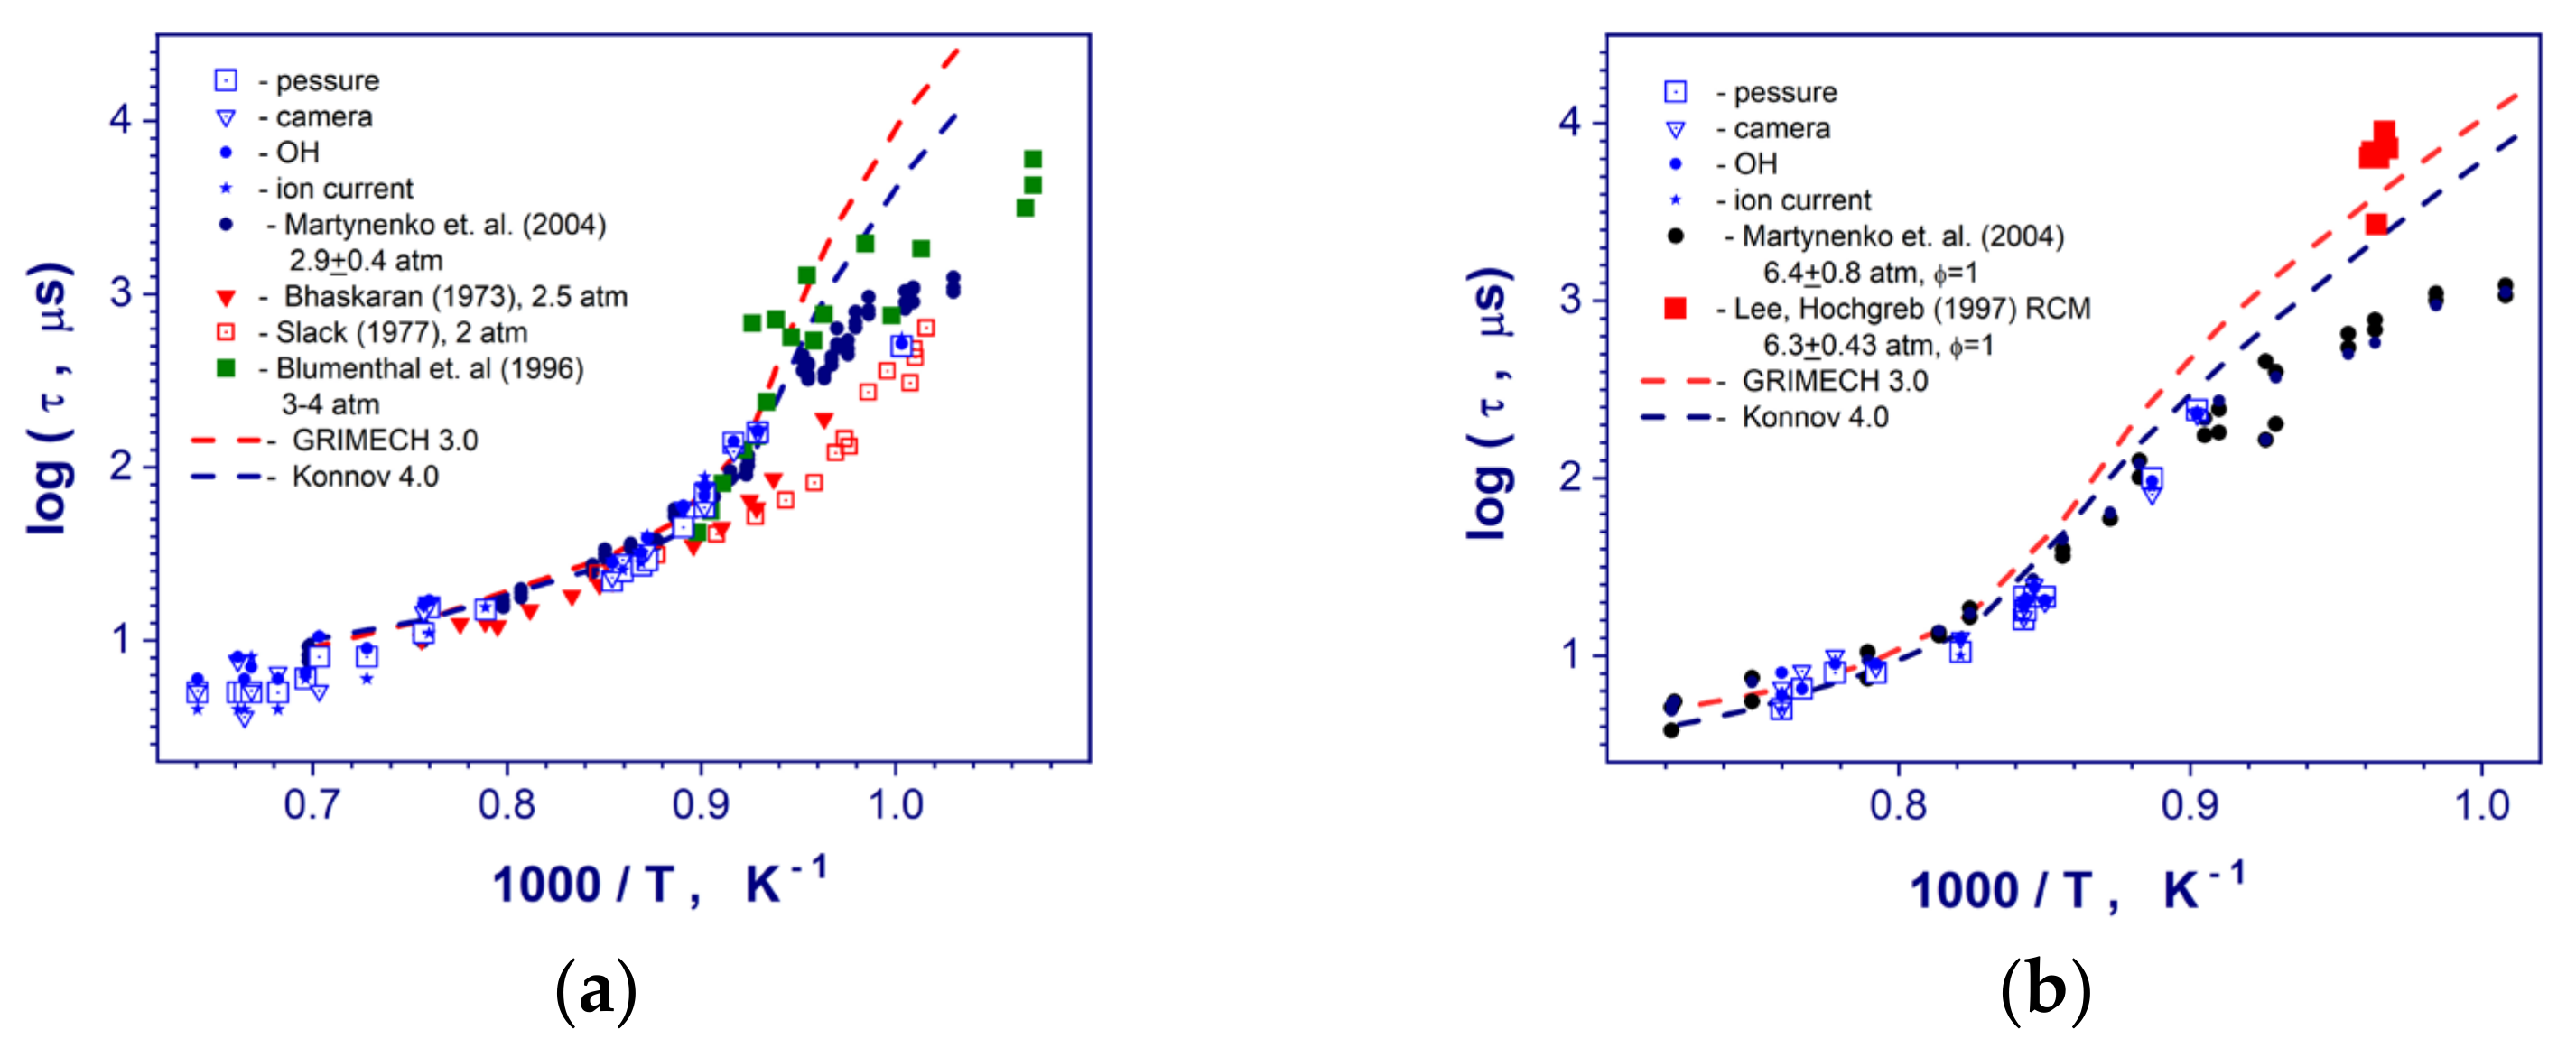
The auto-ignition of studied hydrogen–air mixtures occurred behind reflected shock wave upstream the end wall of the shock tube. The reaction zone was detected and flame front (detonation) propagation was recorded with a high temporal resolution. The induction (ignition delay) and reaction times of the stoichiometric, rich, and lean (with 15% N2 dilution) hydrogen–air mixtures at high temperatures (900–1600 K) and pressures (0.1–0.6 MPa) have been measured carefully. Comparisons of the measured induction times with the existing shock-tube and rapid compressed machine data [3,5,7,23] for stoichiometric hydrogen-air mixtures at similar conditions are presented in the Figure 4. As one can see for the all studied range of post-shock conditions our measurements correlate pretty well with the data of Martynenko et. al. [18] got from end-wall pressure and OH chemiluminescence observations in the same diaphragmed less shock tube facility. These data combine both axial and boundary layer OH self-emission measurements. For mean post-shock pressure of 3.1 atm (Figure 4a) and high temperatures > 1100 K current ignition delay times exhibit a good coincidence with the data of Bhaskaran & Gupta [3] and Slack [23] obtained at slightly lower pressure 2.5 atm and 2.0 atm correspondingly. These measurements used the end-wall pressure and visible light emission observations [3] as well as a side-wall pressure and OH emission recordings at a distance of 3 mm from reflecting wall [23]. At the same time, for temperatures below 1100 K, these measurements reveal a big discrepancy in comparison with our former and current diaphragmed less shock tube results (Figure 4a). These scatters can be explained by the different level of inhomogeneities in the post-shock flow behind the incident shock wave in diaphragmed and diaphragmed less shock tubes. Generally speaking, a process of diaphragm opening produces much stronger transvers perturbations in a post-shock flow behind the incident shock wave in comparison with a diaphragmed less shock tube facility. These perturbations affect more strongly on autoignition of hydrogen-air mixtures and can reduce drastically the local induction times at lower temperatures behind the reflected shock waves. Thus, for induction times more than 200–300 μs experimental data obtained in different facilities should be compared taking into account individual constructive peculiarities of the shock tubes. Formally, longer induction time at the same post-shock temperature and pressure can be considered as the obvious indication of the weaker influence of local flow perturbations on induction time measurements. For lower temperature range > 1100 K and mean pressure of 3.1 MPa (Figure 4a), our results show a good correlation with the data of Blumenthal et. al. [5]. All presented ignition delay times at temperatures below 1070 K (Figure 4) demonstrates relatively big systematic and random scatters in comparison each other. Such deviations depend on from different post-shock flow nonuniformities because of increased boundary layer growing in hydrogen-air mixture in contrast to test gas mixtures with a high argon dilution. In addition, the presence of contaminated particles in the shock tube volume can induce local auto-ignitions of the mixture for measurement time more than several hundred microseconds [24]. Probably, these low temperature ignition delay times are very questionable for using at kinetic analysis. And the data very strongly depend on individual design and peculiarities of the shock tube facilities. One can see that for high temperatures > 1100 K kinetic mechanisms of GRI Mech 3.0 [19] and A.A. Konnov [25] demonstrate relatively good predictions of the measured induction times. For temperatures less than 1070 K, kinetic simulations overpredict significantly all shock tube data points and correlate only with not numerous RCM data of Lee and Hochgreb [7].
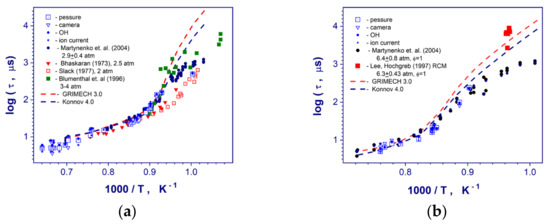
Figure 4.
Comparison of the measured induction times in stoichiometric hydrogen–air mixture at post-shock pressures 0.31 (a), and 0.57 (b) MPa with existing literature data at similar conditions [3,5,7,18,23].
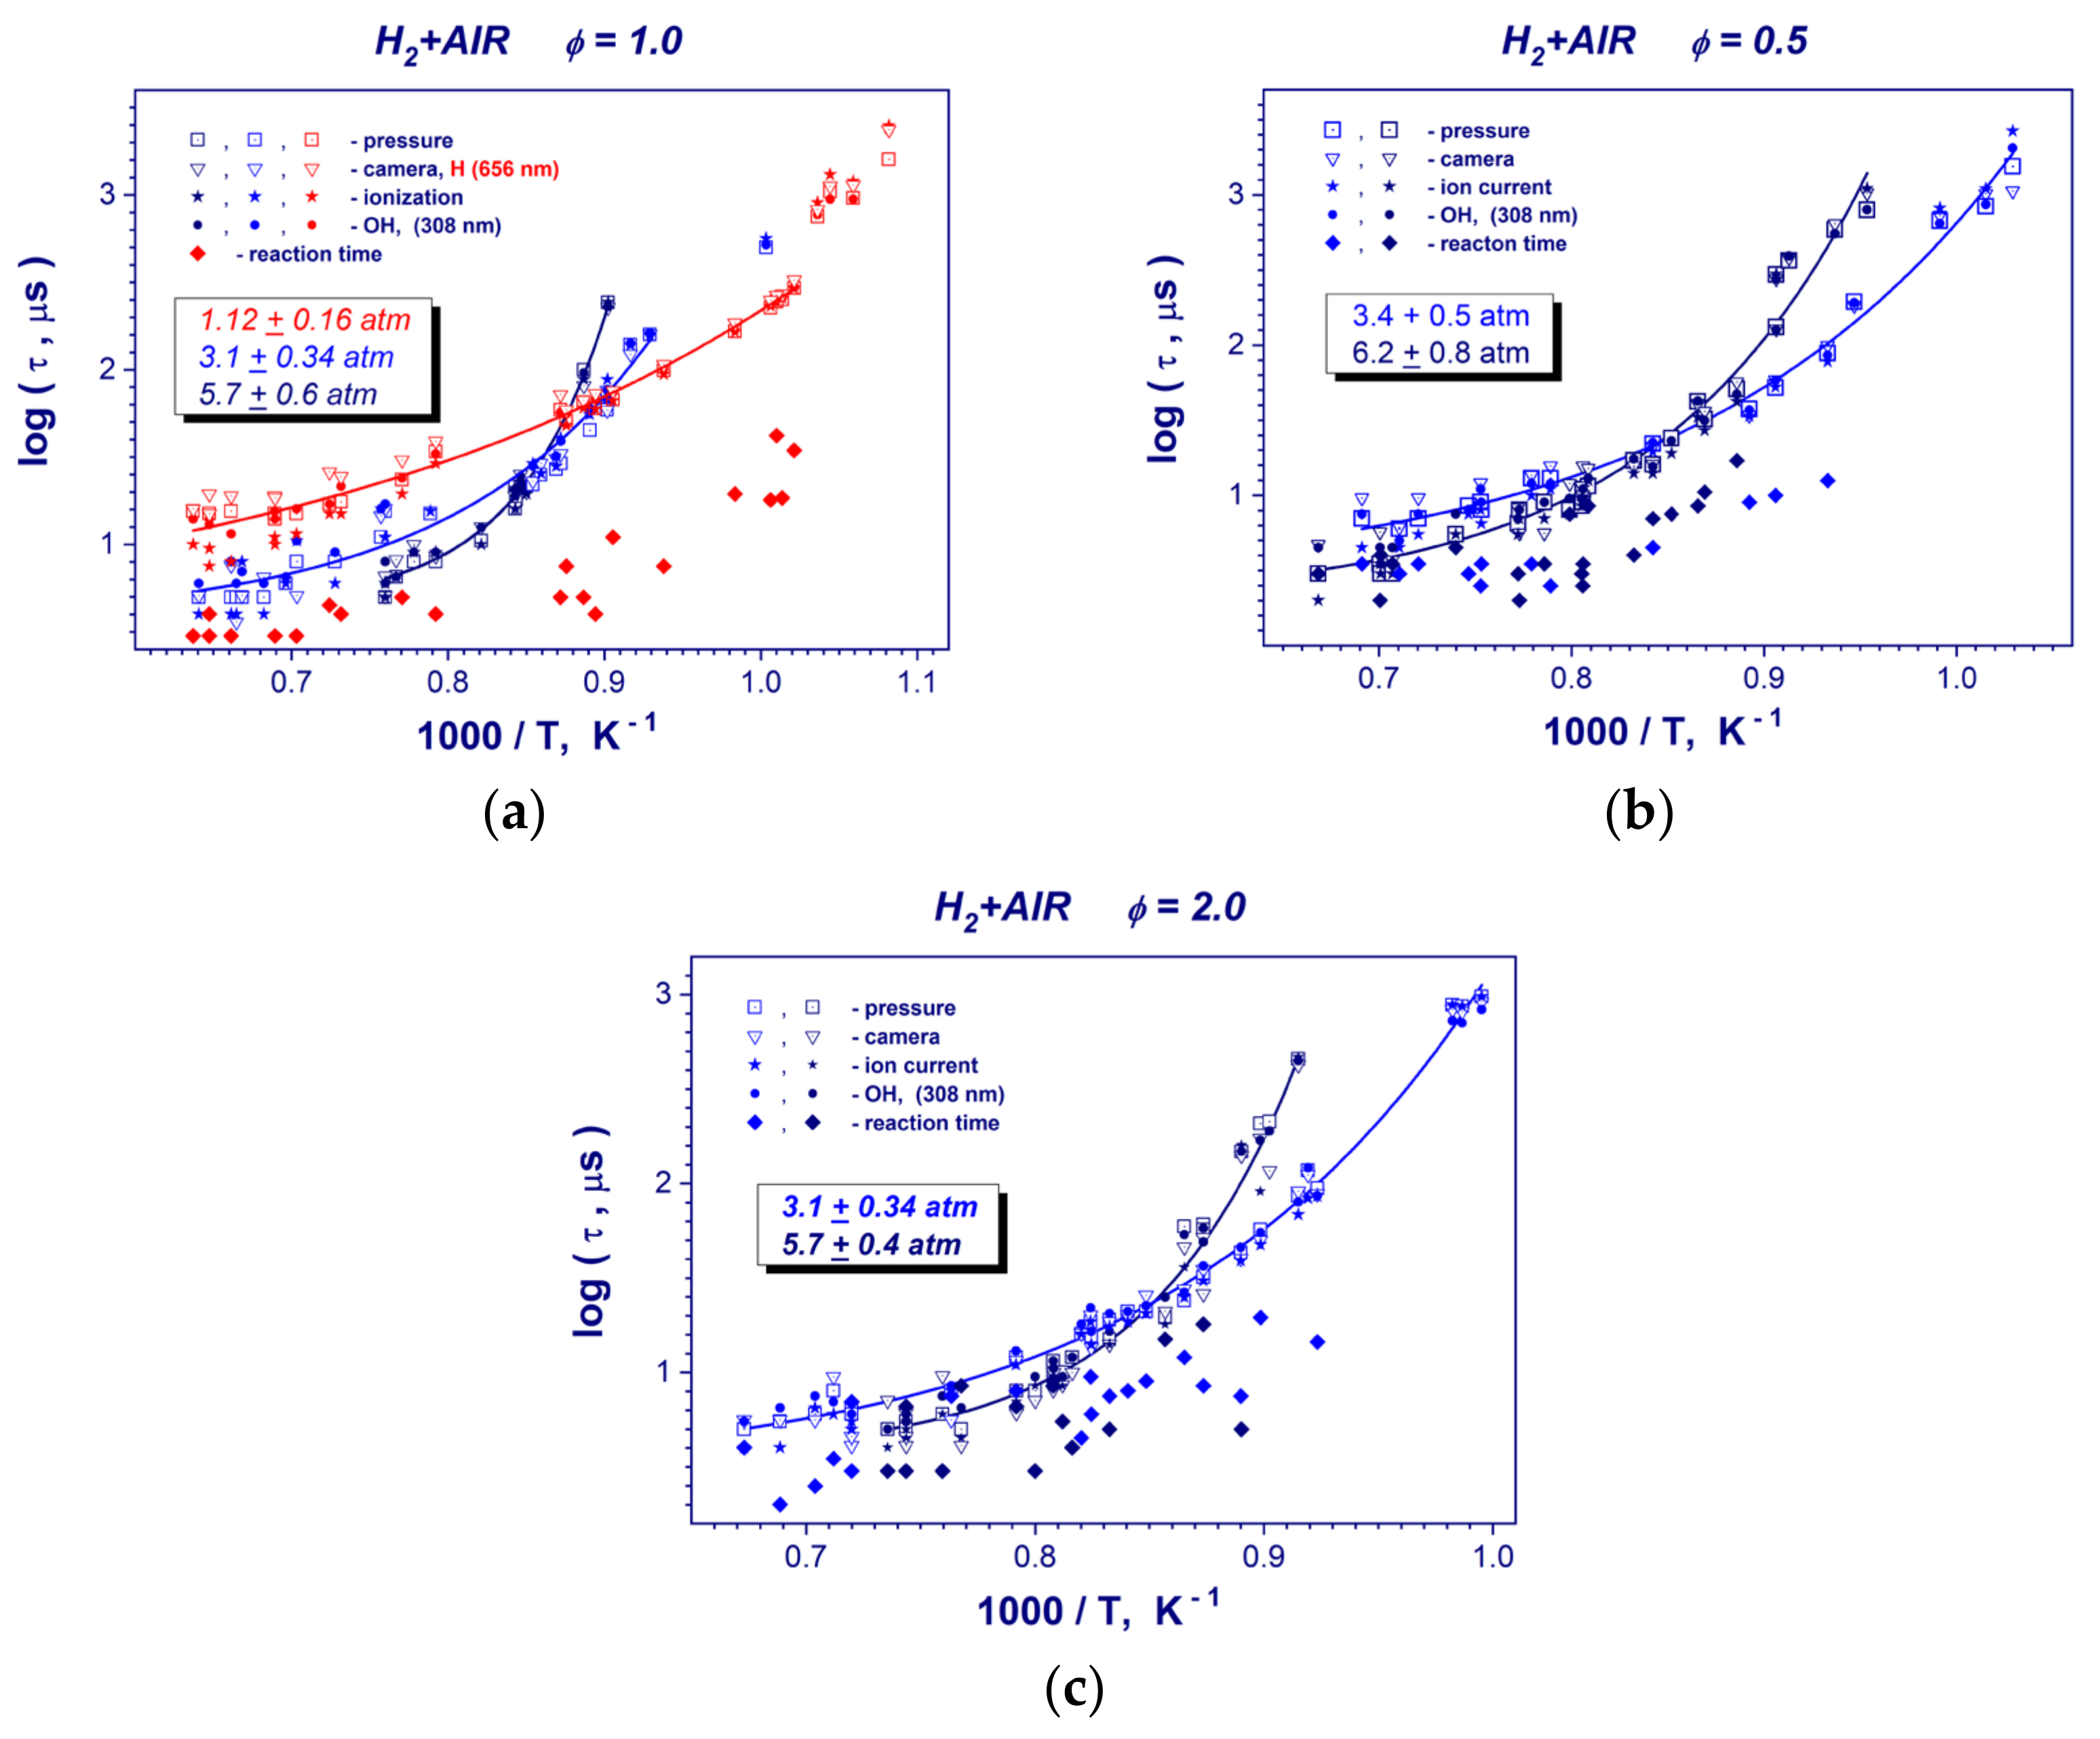
Experimental plots of induction and reaction times for the hydrogen-air mixtures obtained by using different methods and performed evaluations of different kinetic parameters of the process are presented in the Figure 5 and Table 1. Table 2 demonstrates some representative induction times measurements for studied stoichiometries of hydrogen-air mixture. With the temperature increasing, the self-ignition delays decreased dramatically from hundreds to several µs. The minimal measured ignition delay time was 2 µs. The different methods of induction time measurement correlated well and complemented each other. In the chosen coordinate system, the reciprocal temperature dependence of the induction time was not linear, but for high- and low temperature curve pieces of induction time plots linear segments can be identified for all studied mixtures. We focused on the high-temperature segment. Therefore, to obtain the correlation equation between the induction time and the reciprocal temperature and to evaluate the activation energies (Table 1) in studied mixtures, the high-temperature range of obtained data was linearly approximated. It can be seen that detected values were mainly in the interval 64–83 kJ/mole and varied <6 kJ/mole with pressure changes. This result is in good agreement with activation energy of 70.3 kJ/mole [4] for the reaction O2 + H OH + O.

Figure 5.
Induction and reaction times vs. reciprocal temperature in stoichiometric (ϕ = 1) (a), lean (ϕ = 0.5) with 15% N2 dilution (b) and rich (ϕ = 2) (c) hydrogen–air mixtures at mean post-shock pressures of 0.31–0.34 and 0.57–0.62 MPa.

Table 1.
The post-shock conditions and measurement results for studied mixtures.
Table 2.
Representative induction times measurements for studied mixture.
Experimental ignition delay times were compared with calculated data. The process of high-temperature oxidation of hydrogen behind the reflected shock wave was considered with the use of the mathematical model of adiabatic ignition of an ideal gas at a constant pressure. The kinetic schemes of GRI Mech 3.0 [19] and A.A. Konnov [25] including 28 chemical reactions with the participation of hydrogen and its derivatives were used in the calculations. The calculated and experimental data on the self-ignition delay were compared by 5% of the peak level production of the OH radical in the reaction of hydrogen oxidation under conditions corresponding most closely to the experimental ones. In all simulations, the estimated ignition delay time for the kinetic mechanism of A.A. Konnov is lower than for the GRI Mech 3.0 mechanism. In the high-temperature region (>1100 K), the behavior of temperature dependence for the calculated data is in agreement with that of the experimental data. However, both kinetic mechanisms exhibit shorter induction times, in some cases, the difference could be 2–3-fold. At a temperature near 1100 K, calculated ignition delay times begin to exceed the experimental ones. A further temperature decreasing led to a significant difference between calculations and experiments. It is impossible to use these kinetic schemes. At low temperatures, the self-ignition mode is changed and the local flow parameters of the mixture are not uniform and could differ.
For all studied stoichiometries of hydrogen-air mixture, the induction time plots demonstrate a clear increasing of the global activation energy from high- to low temperature regions (Figure 5). This trend is strongly pronounced at higher pressures of hydrogen-air mixtures. Such behavior of hydrogen oxidation evidences about the changing reaction kinetics mechanism, which starts to be a pressure dependent. For stoichiometric hydrogen- oxygen mixture at low pressure of 0.112 MPa (Figure 5a), the induction time plot exhibits almost linear dependence on post-shock temperature. A group of the data points having a long ignition delay time of around 1 ms at low temperatures (Figure 5a) cannot take into account because of the possible problems with flow homogeneity for such significant measurement time behind a reflected shock wave. At temperature range of T > 1200 K the kinetic behavior is a standard, higher pressure results in the growing of the reaction rate and, consequently, shortening of the induction time (Figure 5a–c). For lower post-shock temperatures T < 1200 K, the global reaction rate decelerates with the pressure increasing. And, as one can see, the velocity of deceleration is faster with a temperature reducing for higher post-shock pressures. Finally, for higher pressures of 0.057 MPa (ϕ =1), 0.62 MPa (ϕ = 0.5) and 0.57 MPa (ϕ = 2), the induction time begins to exceed low pressure data below the cross-over temperature of 1175 K.
Reaction times of studied hydrogen-air mixtures (Figure 5) show a big scatter and a weak temperature dependence. The minimum detected reaction time value was nearly 2 µs. As one can see from reaction time measurements, it is very questionable to deduce any pressure dependence from the reaction time measurements (Figure 5b,c).
Figure 6 presents collections of induction time measurements for the stoichiometry range of ϕ = 0.5–2 of hydrogen–air mixtures at constant post-shock pressures. One can see that in contrast to other hydrocarbon fuels at constant post-shock pressures of 0.32 and 0.59 MPa, hydrogen induction times (global reaction rate of hydrogen oxidation) do not depends on the stoichiometry of the mixture within the scatter of experimental data. This trend is obvious for the high temperature range of T > 1100 K. Only at lower temperatures do the ignition delay times for a lean and diluted mixture (ϕ = 0.5) under predict the corresponding values for stoichiometric (ϕ = 1) and rich (ϕ = 2.0) hydrogen–air mixtures (Figure 6a,b).
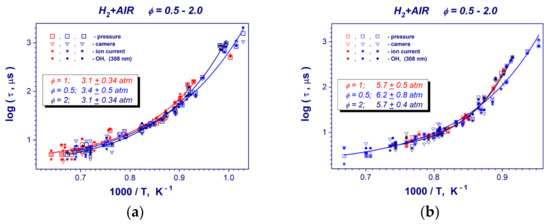
Figure 6.
Collections of ignition delay data points in stoichiometric (ϕ = 1), lean (ϕ = 0.5) and rich (ϕ = 2) hydrogen-air mixture at mean post-shock pressures of 0.31–0.34 MPa (a) and 0.57–0.62 MPa (b).
The evaluations of the critical temperature of required for observing strong auto-ignition of hydrogen-air mixtures show that these temperatures are in the interval of 1000–1100 K (Table 1). It can be seen that these values are quite close to the temperatures at which the activation energy of mixtures changes (Figure 5).
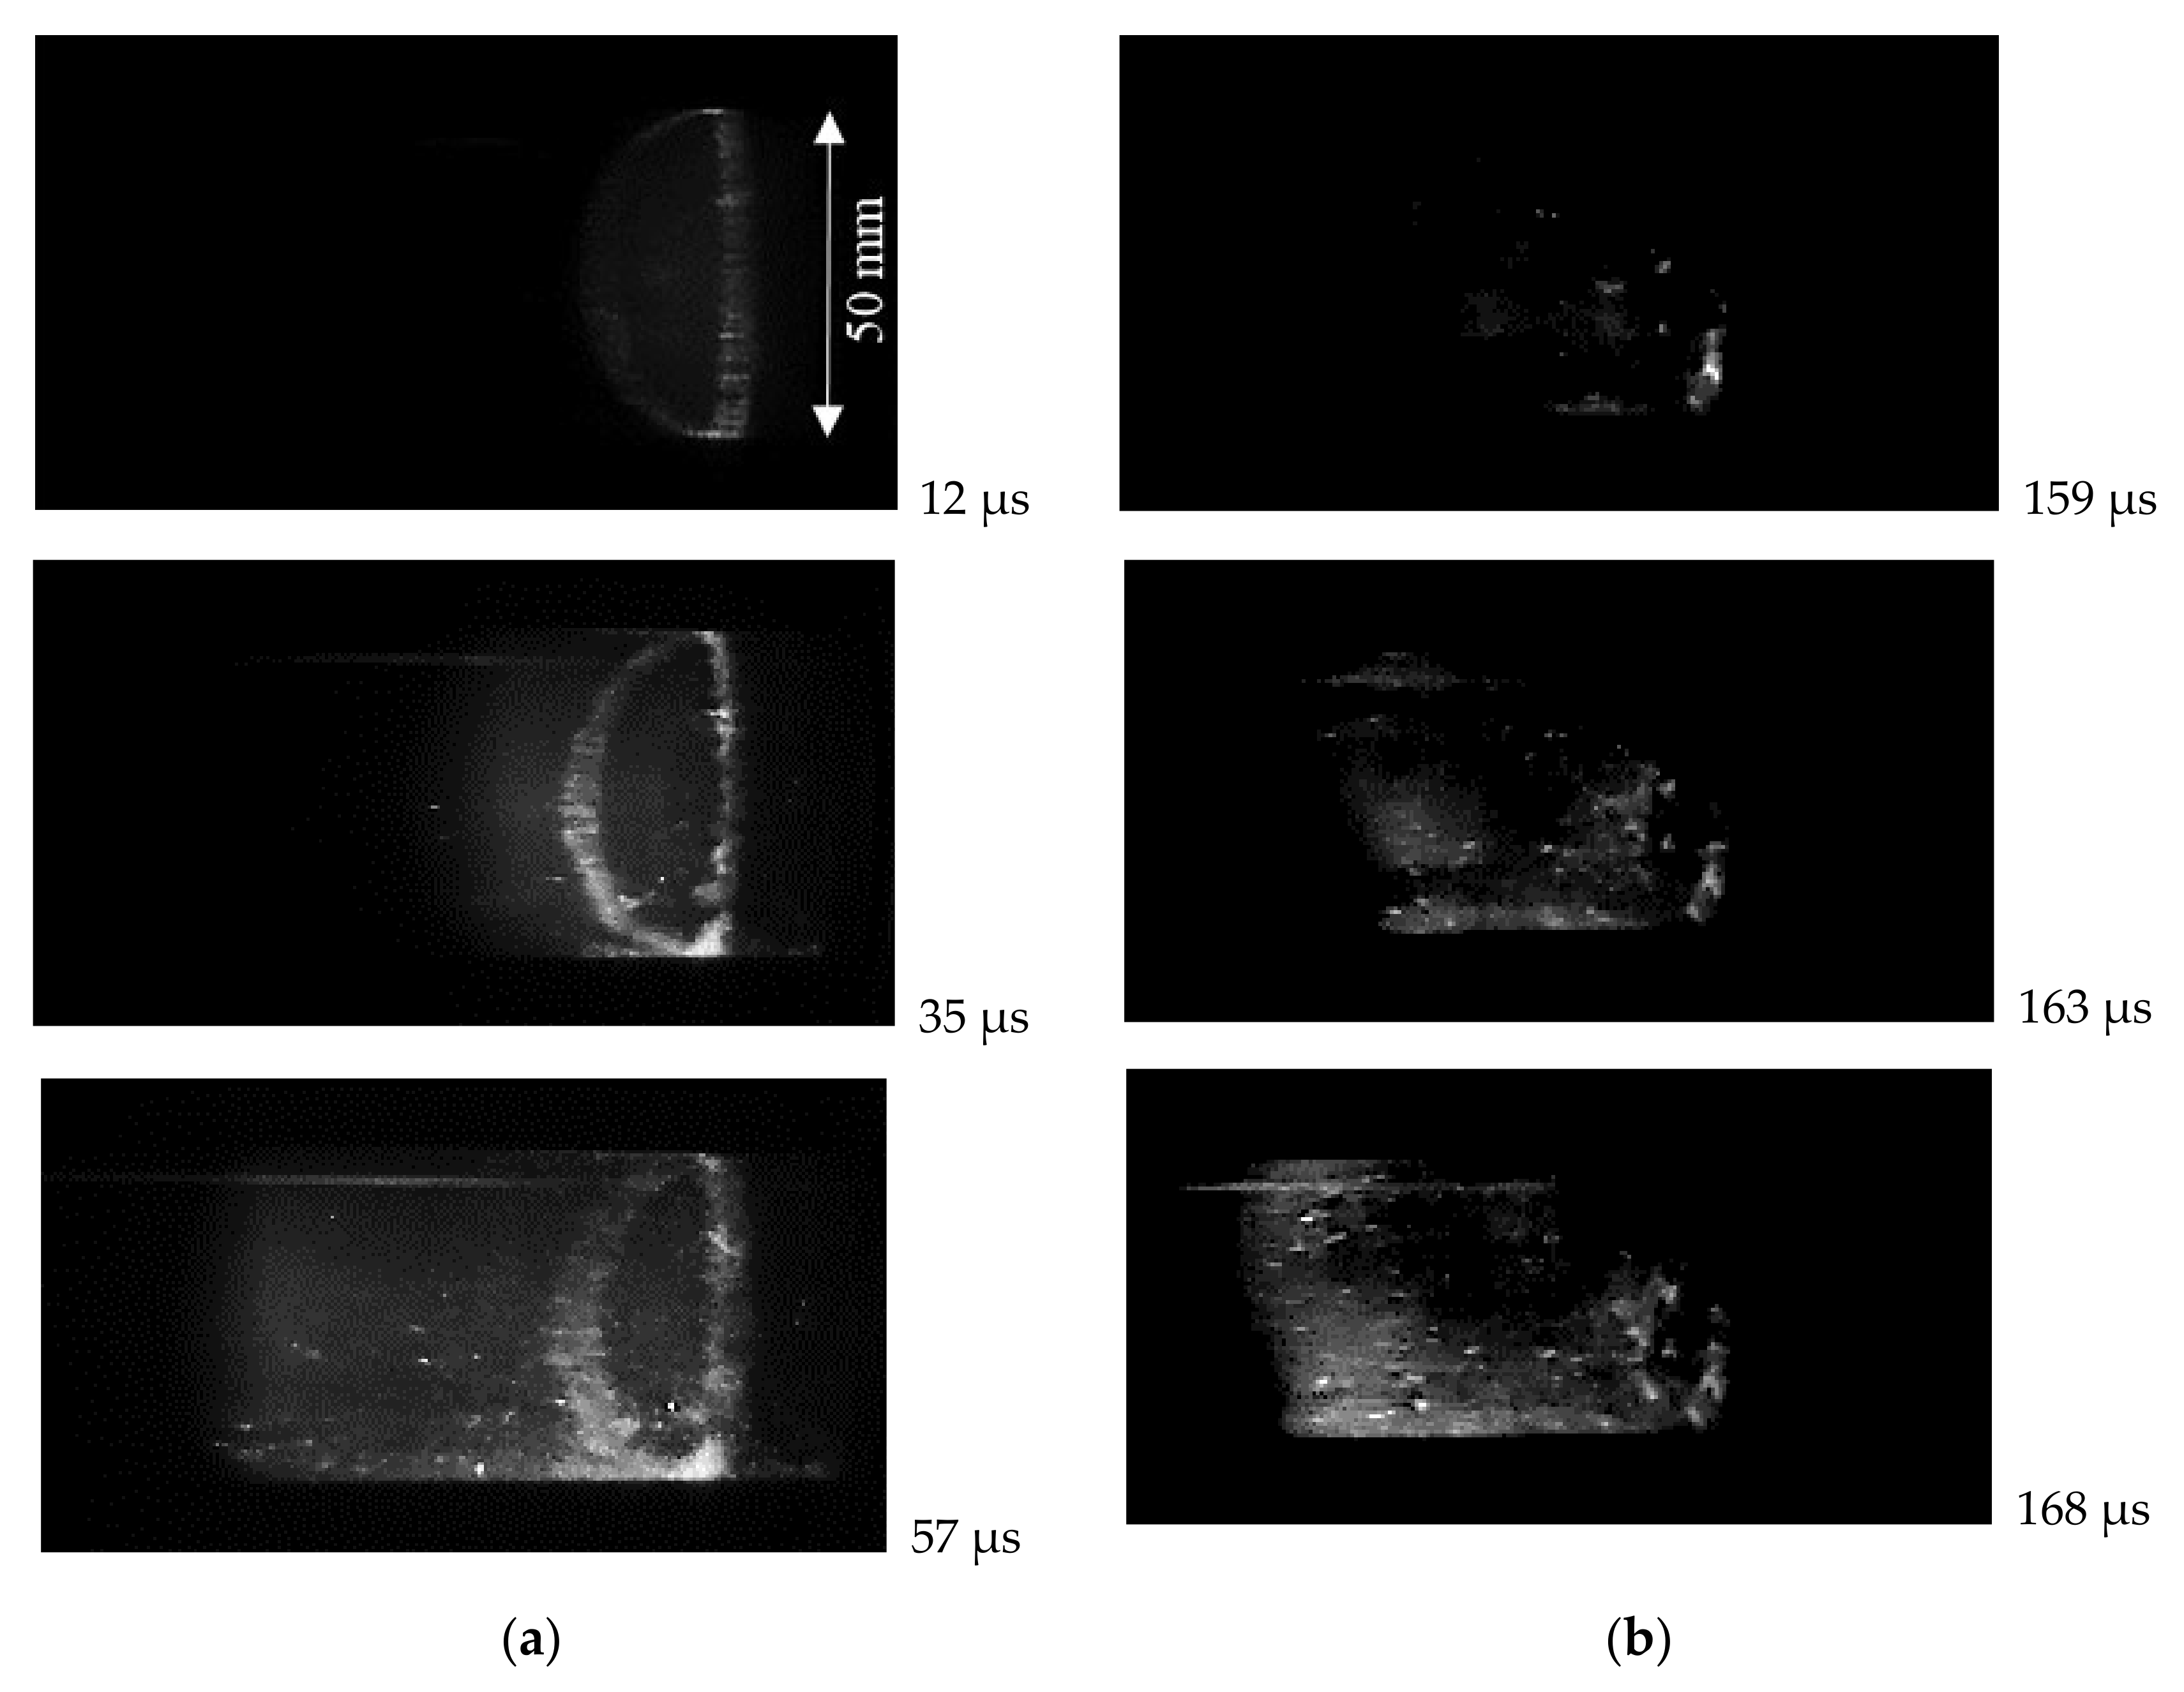
Received high-speed photos of the test volume of the tube confirm that the changing in self-ignition mode occurs at a temperature range of 1000–1200 K. At higher temperatures, the strong volumetric ignition of hydrogen-air mixtures resulting in detonation occurs near the end wall. This mode is clearly seen in Figure 7a. In the first frame, the appearance of luminescence of the auto-ignition process is clearly visible in the vicinity of the end wall. The bright uneven ring is the place (with increased parameters) where the reflecting wall and measuring section join. The further frames show a relatively flat reaction front propagation (detonation wave formation) along the tube. At lower temperatures, the appearance of hot spots was observed, as shown in Figure 7b. They formed near the reflecting wall or at some distance from it, but close to the side wall of the tube. Then, the non-flat reaction region propagated with subsequent acceleration and deflagration to detonation transition (DDT) occurred. In this case, the near-wall effects (boundary layer and its interaction with additional compression waves) can influence the self-ignition and DDT [26,27].

Figure 7.
High-speed video observation of self-ignition in stoichiometric hydrogen–air mixture: (a) volumetric self-ignition near the reflecting wall at 1230 K and 0.53 MPa; (b) self-ignition with hot spot formation at 1100 K and 0.31 MPa.
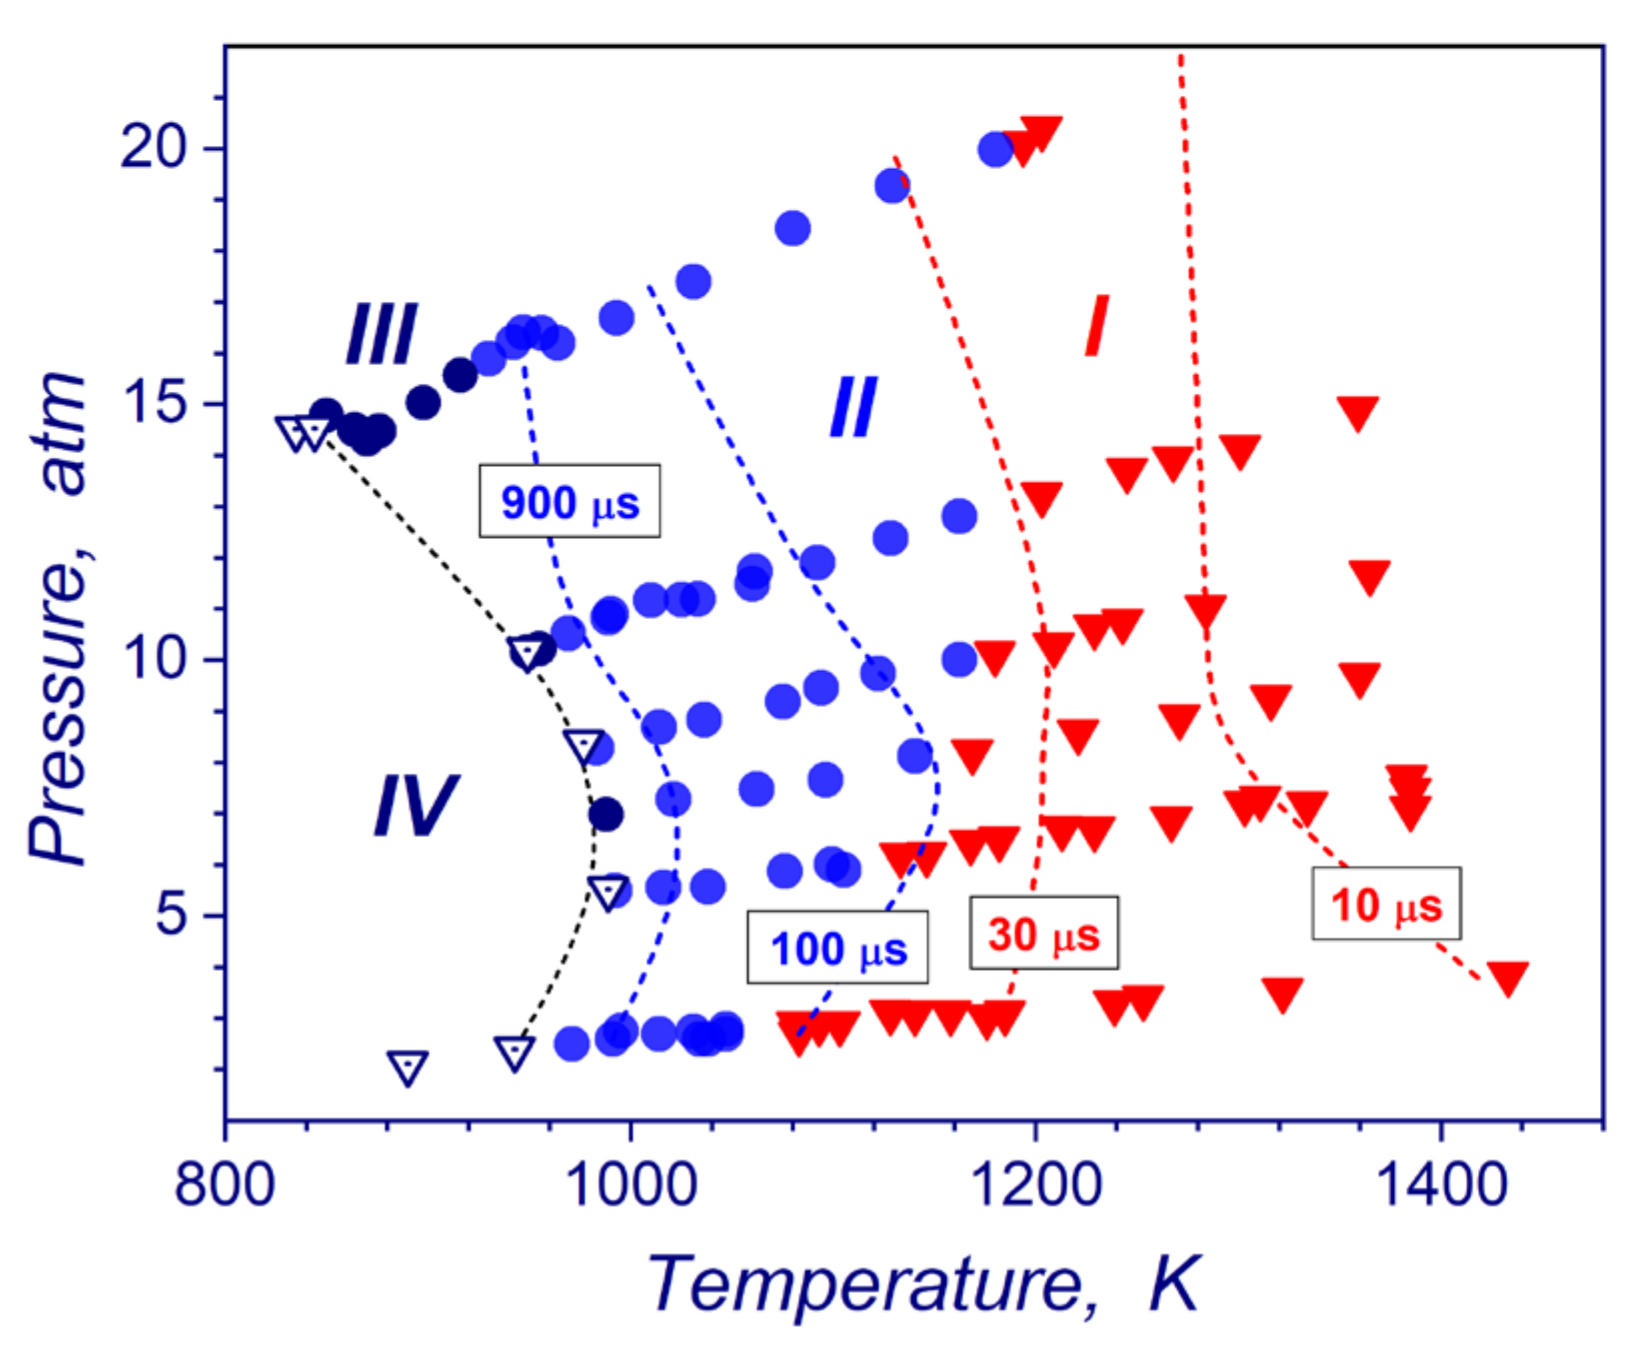
The flow dynamic analysis based on pressure and ion current measurements allows building the parametric diagram of occurrences of hydrogen ignition modes (strong, transient, weak, no ignition regime) in a temperature-pressure plane (Figure 8). The diagram combines all reflected shock-tube measurements performed in this study and in our later work [18] for pressures from 0.1 to 2 MPa. Experimental lines of the constant induction times are also presented. As one can see in Figure 8, almost all studied pressure-temperature zone of post-shock conditions (pressures and temperatures of stoichiometric hydrogen-air mixture) are occupied by the data points corresponding to strong (zone I) and transient ignition (zone II) modes. Weak ignitions (zone III) can be observed only in a narrow range of post-shock parameters near the ignition limits for these shock-tube experiments. No ignition domain (zone IV) in Figure 8 relates to post-shock conditions, where ignitions of hydrogen–air mixtures were not detected at all for significant period of tens millisecond after completion of the shock wave reflection. It is necessary to mention that the existence of extended detonability domain on the P-T diagram (transient and strong modes) obviously depends on experimental peculiarities of the shock-wave compression of the gas upstream the end wall. Since, the reflected shock wave traveling creates a temperature gradient of the induction time in compressed mixture and, consequently, necessary conditions for development of spontaneous reaction wave amplifications because of Zeldovich gradient ignition mechanism [28]. The P-T diagram provides a very convenient tool for understanding possible scenarios of the reaction wave evolution at different flow and boundary conditions.
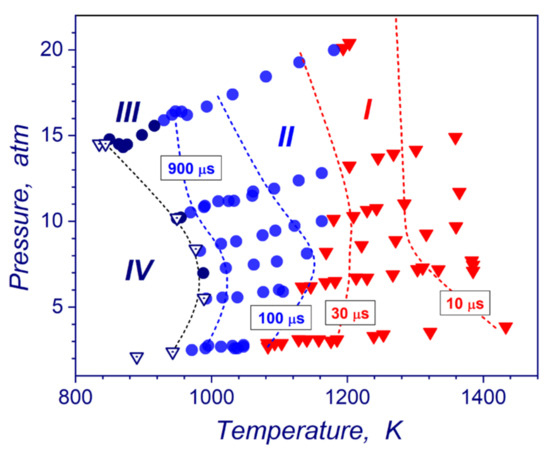
Figure 8.
Autoignition domain in stoichiometric hydrogen-air mixture in a P-T plane: I—strong ignition; II—transient ignition; III—weak ignition; IV—no ignition and lines of the constant induction times.
4. Conclusions
Induction and reaction times of hydrogen–air mixtures have been accurately studied with different methods behind reflected shock waves at extremely high temperatures and pressures of 0.1, 0.3, and 0.6 MPa. Experiments were carried out at the temperature range of 1000–1600 K and equivalence ratios of ϕ = 0.5–2. The focus was on measurements at extremely high temperatures of 1400–1600 K to minimize the ignition delays. Such critical parameters are of interest in the development of propulsion systems operating in the mode of detonation combustion and also important for a more complete understanding of the kinetics of hydrogen oxidation under critical conditions.
The obtained temperature dependence of induction time was not linear. With the temperature increasing, the self-ignition delays decreased dramatically from hundreds to several µs. The minimum measured ignition delay time was 2 µs.
The resulting temperature dependency of induction time allowed determining for high-temperature range the activation energy of the self-ignition process (mainly 64–83 kJ/mole). Experimental data demonstrate a clear increase in the global activation energy from high- to low-temperature post-shock conditions. Experimental results were compared with calculated ones using the kinetic schemes of GRI Mech 3.0 and A.A. Konnov. The agreement was determined at a high-temperature range (>1100 K) where the local parameters of the mixture before the ignition do not differ much.
The reaction times of the mixtures were measured in the studied conditions’ ranges. The minimum detected value was nearly 2 µs. These experimental data are useful when developing combustion chambers for propulsion systems.
The critical temperature of the strong self-ignition mode was identified by the analysis of the absolute velocity of the reflected shock wave. It was close to 1000–1100 K.
Experiments were performed in the shock tube with a completely transparent test section of 0.5 m long to visualize the self-ignition process. It allowed visualizing the transition from volumetric self-ignition near the reflecting wall to hot spot ignition with decreasing temperature (<1200 K).
Based on the performed experimental measurements, it can be noted that for the studied hydrogen–air mixtures, the ignition mode changes at the temperature range of 1000–1200 K.
Author Contributions
Conceptualization and methodology, O.P.; investigation, O.P., V.K. and K.S.; writing—review and editing, Y.B. and O.P.; project administration, O.P. All authors have read and agreed to the published version of the manuscript.
Funding
This research was supported by state scientific research program «Energy and nuclear processes and technologies 2.12» (2021–2025).
Institutional Review Board Statement
Not applicable.
Informed Consent Statement
Not applicable.
Data Availability Statement
Data are contained within the article.
Conflicts of Interest
The authors declare no conflict of interest.
References
- Skinner, G.B.; Ringrose, G.H. Ignition delays of a hydrogen-oxygen-argon mixture at relatively low temperatures. J. Chem. Phys. 1965, 49, 2190–2192. [Google Scholar] [CrossRef]
- Craig, R. A Shock Tube Study of the Ignition Delay of Hydrogen-Air Mixtures Near the Second Explosion Limit; Technical Report AFAPL-TR-66-74; Air Force Aero-Propulsion Lab: Wright-Patterson, OH, USA, 1966. [Google Scholar]
- Bhaskaran, K.A.; Gupta, M.C.; Just, T. Shock tube study of the effect of unsymmetric dimethyl hydrazine on the ignition characteristics of hydrogen-air mixtures. Combust. Flame 1973, 21, 45–48. [Google Scholar] [CrossRef]
- Maas, U.; Warnatz, J. Ignition processes in hydrogen–oxygen mixtures. Combust. Flame 1988, 74, 53–69. [Google Scholar] [CrossRef]
- Blumenthal, R.K.; Fieweger, K.K.; Adomeit, G.; Gelfand, B. Self-ignition of H2-air mixtures at high pressure and low temperature. In Proceedings of the 20th International Symposium on Shock Waves, Pasadena, CA, USA, July 1995; pp. 935–940. [Google Scholar]
- Petersen, E.; Davidson, D.; Rohrig, M.; Hanson, R. High-pressure shock-tube measurements of ignition times in stoichiometric H2/O2/Ar mixtures. In Proceedings of the 20th International Symposium on Shock Waves, Pasadena, CA, USA, July 1995; pp. 941–946. [Google Scholar]
- Lee, D.; Hochgreb, S. Hydrogen autoignition at pressures above the second explosion limit (0.6–4.0 MPa). Int. J. Chem. Kinet. 1998, 30, 385–406. [Google Scholar] [CrossRef]
- Semenov, N.N. Some Problems of Chemical Kinetics and Reactivity, Izd; AN SSSR: Moscow, Russia, 1958. [Google Scholar]
- Lewis, D.; von Elbe, G. Combustion, Flames and Explosions in Gases; Academic Press: New York, NY, USA, 1961. [Google Scholar]
- Kondrat’ev, V.N.; Nikitin, E.E. Chemical Processes in Gases; Nauka: Moscow, Russia, 1981. [Google Scholar]
- Ivanova, A.N.; Andrianova, Z.S.; Azatyan, V.V. Application of the general approach to obtaining of ignition limits in the reaction of hydrogen oxidation. Khim. Fiz. 1998, 17, 91–100. [Google Scholar]
- Gelfand, B.E.; Popov, O.E.; Medvedev, S.P.; Khomik, S.V.; Agafonov, G.L.; Kusharin, A.Y. Special features of self-ignition of hydrogen–air mixtures at high pressure. Dokl. Akad. Nauk. 1993, 330, 457–459. [Google Scholar]
- Dimitrov, V.I. Simple Kinetics; Nauka: Novosibirsk, Russia, 1982. (In Russian) [Google Scholar]
- Schott, G.L.; Kinsey, J.L. Kinetic studies of hydroxyl radicals in shock waves II: Induction times in the hydrogen-oxygen reaction. J. Chem. Phys. 1958, 29, 1177–1182. [Google Scholar] [CrossRef]
- Snyder, A.D.; Robertson, J.; Zanders, D.L.; Skinner, G.B. Shock Tube Studies of Fuel-Air Ignition Characteristics; Report AFAPL-TR-65-93; Monsanto Research Corporation: Dayton, OH, USA, 1965. [Google Scholar]
- Belford, R.L.; Strehlow, R.A. Shock tube technique in chemical kinetics. Ann. Rev. Phys. Chem. 1969, 20, 247–272. [Google Scholar] [CrossRef]
- Saytzev, S.G.; Soloukhin, R.I. Study of combustion of an adiabatically-heated gas mixture. Proc. Combust. Inst. 1961, 8, 344–347. [Google Scholar] [CrossRef]
- Martynenko, V.V.; Penyaz’kov, O.G.; Ragotner, K.A.; Shabunya, S.I. High-temperature ignition of hydrogen and air at high pressures downstream of the reflected shock wave. J. Eng. Phys. Thermophys. 2004, 77, 785–793. [Google Scholar] [CrossRef]
- Smith, P.; Golden, D.; Frenklach, M.; Moriarty, N.; Eiteneer, B.; Goldenberg, M.; Bowman, C.; Hanson, R.; Song, S.; Gardiner, W.; et al. GRIMECH 3.0 Reaction Mechanism. 1999. Available online: https://www.me.berkeley.edu/gri.mech (accessed on 11 November 2018).
- Voevodsky, V.V.; Soloukhin, R.I. On the mechanism and explosion limits of hydrogen-oxygen chain self-ignition in shock waves. Proc. Combust. Inst. 1965, 10, 279–283. [Google Scholar] [CrossRef]
- Meyer, J.W.; Oppenheim, A.K. On the shock induced ignition of explosive gases. Proc. Combust. Inst. 1961, 13, 1153–1164. [Google Scholar] [CrossRef]
- Penyazkov, O.G.; Ragotner, K.A.; Dean, A.J.; Varatharajan, B. Autoignition of propane-air behind reflected shock waves. Proc. Combust. Inst. 2005, 30, 1941–1947. [Google Scholar] [CrossRef]
- Slack, M.V. Rate coefficient for H + O2 + M = HO2 + M evaluated from shock tube measurements of induction times. Combust. Flame 1977, 28, 241–249. [Google Scholar] [CrossRef]
- Leschevich, V.V.; Martynenko, V.V.; Penyazkov, O.G.; Sevrouk, K.L.; Shabunya, S.I. Autoignitions of a methane-air mixture at intermediate and high temperatures. Shock Waves 2016, 26, 657–672. [Google Scholar] [CrossRef]
- Konnov, A.A. Detailed Reaction Mechanism for Small Hydrocarbons Combustion, Release 0.4. 1998. Available online: http://homepages.vub.ac.be/~akonnov (accessed on 11 November 2018).
- Baranyshyn, Y.A.; Krivosheyev, P.N.; Penyazkov, O.G.; Sevrouk, K.L. Flame front dynamics studies at deflagration-to-detonation transition in a cylindrical tube at low-energy initiation mode. Shock Waves 2020, 30, 305–313. [Google Scholar] [CrossRef]
- Krivosheyev, P.; Penyazkov, O.; Sakalou, A. Analysis of the final stage of flame acceleration and the onset of detonation in a cylindrical tube using high-speed stereoscopic imaging. Combust. Flame 2020, 216, 146–160. [Google Scholar] [CrossRef]
- Zeldovich, Y.B. Regime classification of an exothermic reaction with nonuniform initial conditions. Combust. Flame 1980, 39, 211–214. [Google Scholar] [CrossRef]


Disclaimer/Publisher’s Note: The statements, opinions and data contained in all publications are solely those of the individual author(s) and contributor(s) and not of MDPI and/or the editor(s). MDPI and/or the editor(s) disclaim responsibility for any injury to people or property resulting from any ideas, methods, instructions or products referred to in the content. |
© 2024 by the authors. Licensee MDPI, Basel, Switzerland. This article is an open access article distributed under the terms and conditions of the Creative Commons Attribution (CC BY) license (https://creativecommons.org/licenses/by/4.0/).