Article

Site Quality Models and Fuel Load Dynamic Equation Systems Disaggregated by Size Fractions and Vegetative States in Gorse and High Heath Shrublands in Galicia (NW Spain)

by
José A. Vega
1,
Juan Gabriel Álvarez-González
2,
Stéfano Arellano-Pérez
2,3,
Cristina Fernández
1 and
Ana Daría Ruiz-González
2,*
1
Centro de Investigación Forestal de Lourizán, 36080 Pontevedra, Spain
2
Unidad de Gestión Ambiental y Forestal Sostenible (UXAFORES), Departamento de Ingeniería Agroforestal, Campus Terra, Universidad de Santiago de Compostela, Campus Universitario s/n, 27002 Lugo, Spain
3
AGRESTA Sociedad Cooperativa, c/Duque de Fernán Nuñez 2, 28012 Madrid, Spain
*
Author to whom correspondence should be addressed.
Fire 2024, 7(4), 126; https://doi.org/10.3390/fire7040126
Submission received: 22 February 2024 / Revised: 2 April 2024 / Accepted: 5 April 2024 / Published: 9 April 2024

Abstract

:
Compatible model systems were developed for estimating fuel load dynamics in Ulex europaeus (gorse) and in Erica australis (Spanish heath) dominated shrub communities at stand level. The models were based on intensive, detailed destructive field sampling and were fitted simultaneously to fulfill the additivity principle. The models enable, for the first time, estimation of the biomass dynamics of the total shrub layer, size fractions and vegetative stage, with reasonably good accuracy. The approach used addresses the high variability in shrub biomass estimates by using a site index (SI) based on biomass levels at a reference age of 10 years. Analysis of the effect of climatic variables on site index confirmed the preference of gorse for mild temperatures and the ability of high heath communities to tolerate a wider range of temperatures. In the gorse communities, SI tended to increase as summer rainfall and the mean temperature of the coldest month increased. However, in the heath communities, no relationships were observed between SI and any of the climatic variables analyzed. The study findings may be useful for assessing and monitoring fuel hazards, updating fuel mapping, planning and implementing fuel reduction treatments and predicting fire behavior, among other important ecological and biomass use-related applications.

1. Introduction

Shrublands play an important role in ecological processes that are essential for life on earth, such as carbon sequestration, nutrient recycling, hydrological regime and soil protection, and they also provide biodiversity, wildlife habitats and bioenergy for human use [1,2,3]. On a global scale, the area occupied by shrubland has increased greatly as a result of various factors, including the reduction in livestock and agricultural activities (due to rural abandonment) and more extreme temperatures and prolonged droughts associated with climate change [4,5,6,7]. The increased frequency of forest fires and the consequent transformation of forests into shrubland has also become a widespread phenomenon [8,9], of particular importance in Mediterranean ecosystems [10,11]. Many Mediterranean-type shrublands are considered fire-prone vegetation [12,13], in which fire is both a disturbance and a first-order ecological factor in the evolution and dynamics of vegetation and, therefore, of shrubs [14,15,16]. On the one hand, shrub fuels provide the energy source for wildfires while fuel attributes are determinants for fire behavior and its effects, modulating fire intensity and severity [17,18,19]. In fact, shrub productivity regulates fuel availability, driving, together with climate and ignition sources, and fire activity in shrublands [20,21], with fuel load being a determinant of fire intensity [22]. The age of the shrubland can also modify the flammability of the community through changes in fuel structure [12,23]. On the other hand, the fire regime, associated with productivity gradients, affects vegetation evolution and drives the development of adaptive traits in plants, favoring certain compositions of shrub communities [24,25]. Thus, a complex feedback process can be established between shrub fuel dynamics and fire regime [26,27].
Fire behavior is driven by the relationships between meteorological conditions, topography, human intervention and, most importantly, fuel characteristics [28]. Studying the characteristics of fuels that affect fire behavior and the impact on the ecosystem is of particular interest as these are the only landscape elements that can be managed [29,30]. Considerable efforts have thus been made in recent years to characterize fuel structure, in particular, to determine the distribution of fuel loads in different size fractions and in relation to physiological state [7,31,32].
Since fuel attributes change with age, knowledge of the dynamics of fuel load fractions of shrublands at the community level is essential to evaluate the effectiveness of fuel management treatments, prioritize fuel risk reduction actions and optimize treatment scheduling [33]. Fuel dynamics is also important to assess the influence of climate and other environmental factors on that vegetation type, for a proper estimation of climate change impacts on vegetation and fire regimes and to design adaptation strategies [34,35,36].
However, modeling fuel dynamics in shrub ecosystems at the stand level is considered a challenge [34], since most of the available fuel consists of living vegetation, comprising species of different characteristics that are often more influenced by the environmental conditions of the site than forest ecosystems. Changes in community composition with age are also common, affecting fuel properties and complicating modeling. The stand-level approach in studies of fuel load dynamics in shrublands is critical to operational objectives; since in shrubland fires, the fuel is the whole vegetation pool rather than individual plants.
Remote sensing methods provide invaluable information on biomass accumulation and growth in shrublands and are the only viable alternative for fuel mapping [32,37,38,39,40,41]. However, detailed field inventories remain critical for knowledge of fine-scale shrub structural variables and for testing and refining remote sensing-based approaches [42,43].
By adapting the classic definition of site quality in forest science [44] to the study of shrublands, this index can be defined as the net biomass productive potential of a site for a particular species or shrubland community. Any index used to define site quality must fulfill a series of basic requirements: (1) it must be quantitative so that it provides a reference point for management diagnosis and prescription; (2) it must be objective and (3) it must be easy to determine [45].
In dominant height–age curves, which are commonly used to assess site quality, especially in pure and even-aged stands, the stand site index is defined as the value of the dominant height in the specific curve for that stand at a given reference age [46]. However, the concept of dominant height is not easy to adapt to shrubland communities, especially in dense formations, in which individual measurements are difficult to carry out. Thus, the use of fuel load–age models seems a more appropriate choice in this case.
Efforts to model shrubland fuel load dynamics at the stand level have been limited, in terms of the types of shrublands examined, and have focused primarily on total fuel or some specific fraction [39,47,48,49,50,51], including in some cases live or dead fuel [35,52,53]. Dynamic models that consider total fuel load and various fuel fractions, differentiating by size and physiological state, at the stand level are even scarcer [54,55,56].
Although shrublands dominated by Ulex europaeus L. (gorse) cover an increasing area worldwide, there is a large gap in knowledge about the fuel dynamics of this species. The same also applies to Erica australis L. (Spanish heath), which is one of the main components, together with gorse, of the dry heathlands in the Iberian Peninsula (Western Europe). Both of these species play a key ecological role in this region and are involved in severe and recurrent wildfires. Gorse is considered a hazardous fuel due to its high biomass growth [1,57,58] and high aerial fuel flammability [59,60,61], favored by the production of very flammable volatile organic compounds [62]. Overall, gorse-dominated stands are qualified as very fire-prone shrublands [63], which are capable of generating intense fires [64,65,66]. Both, gorse- and high heath-dominated communities have high energy potential [67,68], and continuous stands dominated by high heath are also considered very flammable and prone to fires [69,70].
In Galicia (northwestern Spain), shrublands cover approximately one-third of the forest area [71], with gorse- and high heath-dominated communities being the most abundant with 77% of the total shrubland area. These formations are involved in approximately two-thirds of the forest fires occurring in the region [72]; so, knowledge of fuel dynamics in these communities is a priority in fire management.
In summary, the overall aim of this work was to develop site quality curves (fuel load–age relationships) for two of the main shrubland communities in NW Spain by using an extensive database derived from destructive sampling. The specific aims were as follows: to determine the site index of each sampling plot by using the previously developed curves; to evaluate the effect of topographic and climatic variables on the site quality; and, finally, to fit a compatible system of equations to estimate fuel loads disaggregated by size fractions and vegetative state (live or dead) for each shrubland community using site index and age as independent variables.

2. Material and Methods

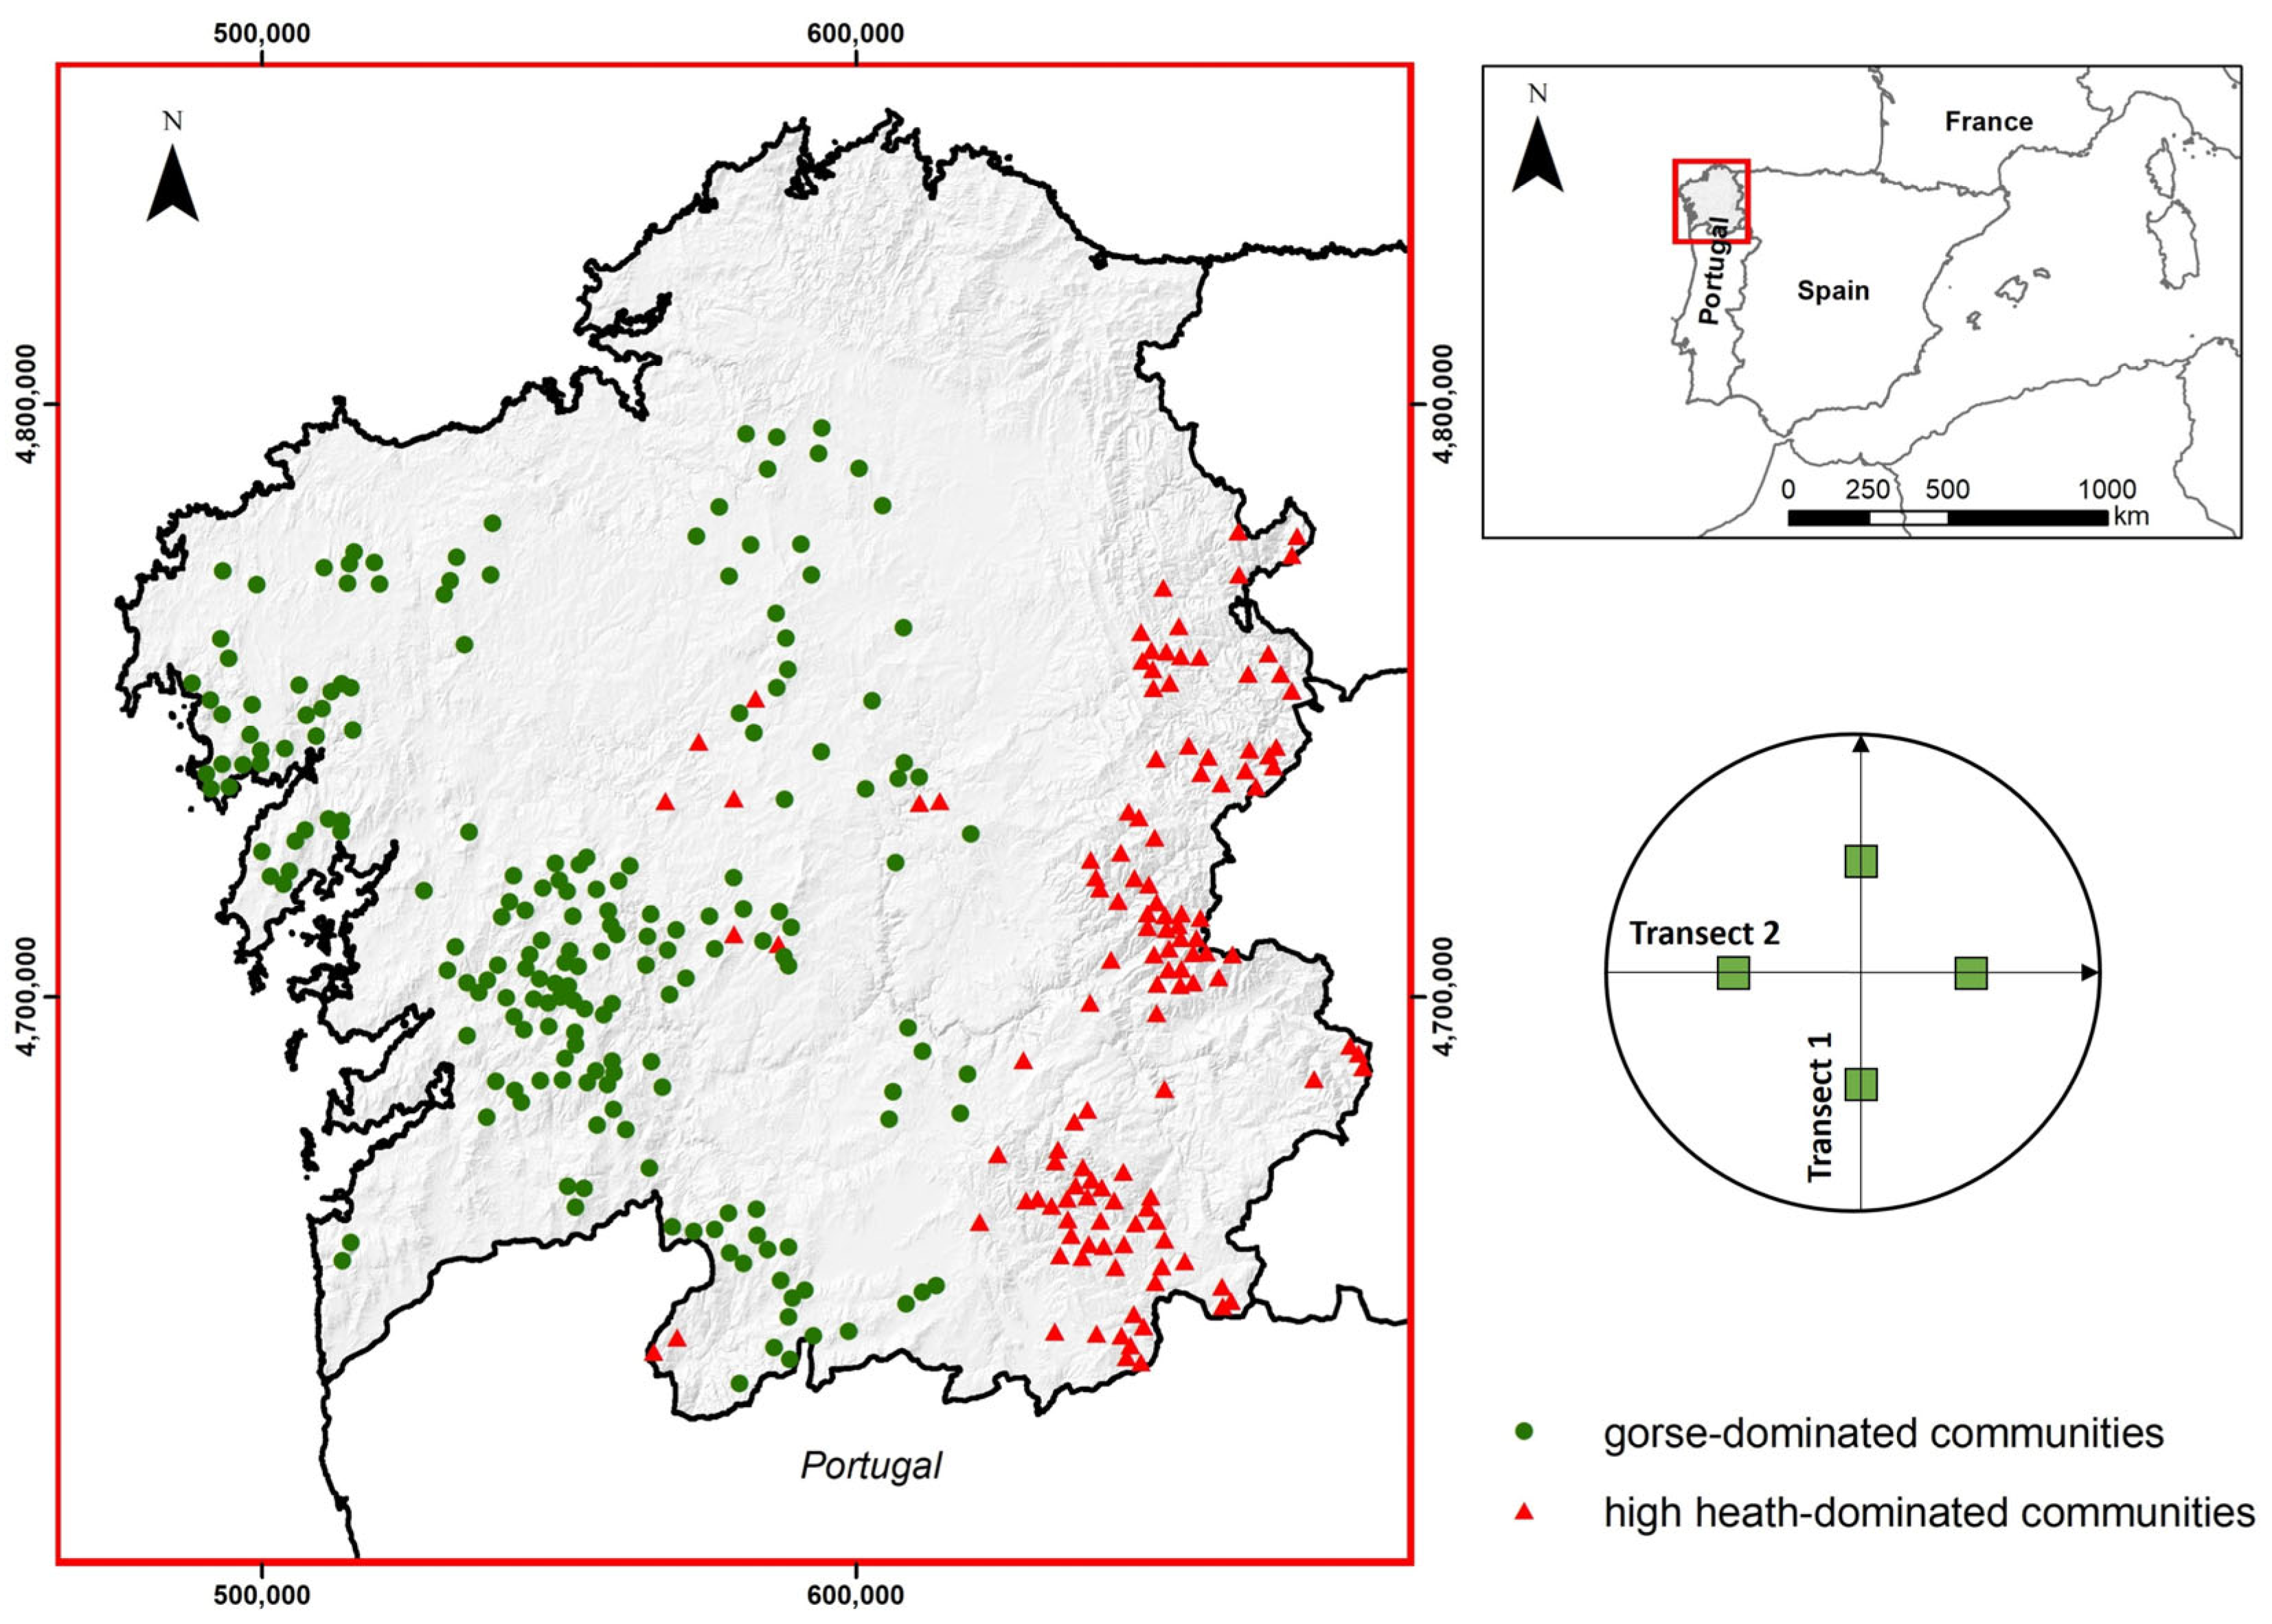
2.1. Study Area, Shrub Communities and Inventory Plots

The study was carried out in Galicia (NW Spain), where shrublands represent about 20% of the total area of land and 30% of the forest land area in the region. Most shrublands in Galicia are dry heaths [73] and are included in habitat 4030 of the European habitat classification (Council Directive 92/43 CEE), particularly in the Atlantic heathlands and Ibero-Atlantic heathlands categories. Gorse-dominated communities (Ulex sp.) cover about 55% and heath-dominated communities (Erica spp.) about 22% of the shrubland areas.
Two shrub communities were considered in the present study: a gorse-dominated community (Ue) and a high heath-dominated community (Ea). Both are primarily composed of perennial, multi-stemmed (or highly branched) evergreen woody species (shrubs and sub-bushes), which typically form dense (a large number of plants per area) and closed (high coverage) stands ranging in height from moderate to moderately high (0.5–3 m).
The dominant species in the gorse-dominated community is Ulex europaeus L., and other main secondary species are often present, such as Ulex gallii Planch., U. Minor Roth, Erica umbellata Loefle ex L., E. Cinerea L., Pteridium aquilinum (L.) Kuhn in Kersten and Pterospartum tridentatum (L.) Willk. The high heath-dominated community includes three dominant species (Erica australis L., Erica arborea L. and Erica scoparia L.) with some common structural characteristics allowing them to be grouped together. Other main secondary species frequently present in the high heath-dominated communities include Pterospartum tridentatum, Halimium alyssoides (Lam.) Greuter, Ulex europaeus and Pteridium aquilinum.
Sites occupied by these two shrub communities were randomly selected on the basis of the information on the treeless shrub-covered polygons provided in the Spanish Forest Map 1:25,000 [74]. The number of sampling sites for each shrub community was approximately proportional to the area covered by each in Galicia [74]. In each site selected, a circular sampling plot was established, and a total of 316 plots were inventoried (191 of gorse-dominated communities and 125 of high heath-dominated communities).

2.2. Biomass Sampling

From the center of each circular sample plot, a random azimuth was generated to establish one diameter (20–30 m length, depending on shrub height), and another diameter was drawn perpendicular to the first. Four destructive sampling subplots (quadrats) were located in the center of the four plot radii corresponding to the diameters (Figure 1, right). The area of each quadrat ranged from 4 to 36 m2, depending on shrub height: For shrubs smaller than 1.0 m in height, 4 m2 quadrats were destructively sampled; for shrubs taller than 1.0 m, the quadrat size varied from 3 × 3 m to 6 × 6 m.
According to the approach proposed by Pearce et al. [48] for biomass sampling in continuous dense shrub communities, each quadrat was delimited by four wooden poles, and a linear transect was laid out (with a tape) along the perimeter and one diagonal of the quadrat. The vegetation growing inside the quadrat was carefully clipped along the lateral boundaries, taking care to exclude portions of plants growing within the quadrat but hanging outside the boundary. The horizontal lengths of the intercepted crown of the standing shrub species were measured (cm) with a graduated tape, along the transect. The values were used to determine the linear cover by the shrubs in terms of the percentage of the transect length intercepted (maximum 100%). Shrub height was determined as the vertical distance (cm) between the surface of leaf litter and the top of the plant canopy and was measured with a graduated tape every 50 cm along the transect. All vegetation portions in the vertical projection of the sampling quadrat area were carefully harvested at ground level and placed in bags, which were labeled appropriately and transported to the laboratory.
The shrub and litter biometric measurements in each of the four sampling quadrats and frames, respectively, in each circular plot were averaged to obtain a value per inventory plot of shrub cover (CovShr) and mean shrub height ( h S h r ¯ ).

2.3. Laboratory Work

In the laboratory, the material of the standing shrub stratum was physically separated by size class into fine fuels (diameter < 0.6 cm, hereafter G1), medium fuels (0.6 cm ≤ diameter < 2.5 cm, hereafter G2) and coarse fuels (2.5 cm ≤ diameter < 7.5 cm, hereafter G3), with a go-no go gauge [75]. The material was further subdivided on the basis of condition (live or dead), determined by visual inspection. The size categories were selected according to their surface-to-volume ratios and, for dead fuels, because they coincide with the size ranges defined by Fosberg et al. [76], due to the contrasting water absorption and desorption rates (time lags of 1 h, 10 h and 100 h, respectively). These three size ranges have also been used to construct custom fuel models for predicting fire behavior [77,78,79,80]. Once classified, the material was weighed and dried in forced air-drying chambers (105 °C for 24 h for fine fuels and 48 h for coarse fuels) for determination of the dry biomass of each fraction. The fuel load of each fraction was obtained by dividing the dry biomass by its corresponding sampling area. Thus, five different loads of the various biomass fractions were computed: WShr_G1_dead = dead fine shrub load, WShr_G1_live = live fine shrub load, WShr_G1 = fine shrub load (dead + live), WShr_G23 = coarse shrub load and WShr = total shrub load = WShr_G1 + WShr_G23 = AGB at stand level. Fractions G2 and G3 were grouped to prevent loss of data, as fraction G3 is infrequent in the juvenile stages of these shrub communities.
The age of the shrub communities was estimated from the date of the last natural or anthropogenic disturbance that resulted in complete regeneration, corroborated by counting annual growth rings on the basal section of randomly selected stems of individual plants in each sampling plot. The basal sections were polished with fine-grade sandpaper. Those plots in which it was not possible to reliably assign an age were excluded from the analysis. Finally, a total of 267 sample plots (165 of gorse-dominated communities and 102 of high heath-dominated communities) were used in this study. The basic descriptive statistics of shrub strata for the main structural characteristics of each shrub community are given in Table 1.

2.4. Development of Total Fuel Load Growth Curves

WShr-t curves were constructed on the basis of the information obtained in the sampling plots. This type of relationship has long been used in forestry as a proxy for site productivity, mainly in forest stands, giving rise to site quality or site index curves [44,81,82]. According to Clutter et al. [44], most techniques used to construct site quality curves can be viewed as special cases of three general methods: (1) the guide-curve method, (2) the difference-equation method and (3) the parameter-prediction method. The latter two methods require remeasurement data from the sample plots; however, as we only have one measurement of WShr and t for each sample plot, the site quality curves were developed using the guide-curve method with a growth function as the base model.
Growth functions describe variations in the global size of an organism or a population with age; they can also describe the changes in a particular variable of a tree, stand or shrubland with age, in this case, total shrub load (WShr). Numerous growth functions can be used in forestry, such as the 74 documented by Kiviste et al. [83]. The following are the most important desirable attributes for site quality equations [84,85,86]: (1) polymorphism, (2) sigmoid growth pattern with an inflexion point, (3) horizontal asymptote at old ages, (4) logical behavior (e.g., WShr should be zero at age zero), (5) theoretical basis and (6) base-age invariance. Fulfillment of these attributes depends on both the construction method and the base model used to develop the curves, and it cannot always be achieved.
Multiple asymptotes are also a desirable attribute [87,88], although some of the most frequently used functions have a common asymptote. This does not appear to be of great importance, as the curves are generally suitable for the range of ages that would be used in practice, and the common asymptote is usually achieved at very old ages.
Three well-known base models used in the development of site quality equations in forestry were considered in the fitting process: the Hossfeld model (cited in [89]) (Equation (1)), the Korf model (cited in [90]) (Equation (2)) and the Bertalanffy–Richards model [91,92] (Equation (3)).
W S h r = t 2 a 0 H + a 1 H t
W S h r = e x p a 0 K + a 1 k t a 2 K
W S h r = a 0 B 1 e x p a 1 B t a 2 B
where Wshr is the total shrub load; t is the age considered as the time elapsed since the last natural or anthropic disturbance and aiH, aiK and aiB are parameters to be estimated.
In the first step, the parameters ai of each base model are estimated by non-linear regression using the entire WShr-t database, obtaining the so-called guide curve, which is the “average” line representing the data used. The same number of families of curves as there are parameters in the base model (two in the case of the Hossfeld model and three in the other two cases) can be obtained from the guide curve. The curves of a given sample plot for each family are obtained from the guide curve equation by varying one site-dependent parameter (WShr-t values of the sample plot) and holding the others constant.
Selection of the best base model and the best family of curves of this model was based on the analysis of the values of the model efficiency (ME, Equation (4)) and root mean squared error (RMSE, Equation (5)) goodness-of-fit statistics, on the fulfillment of the previously mentioned desirable attributes and on the visual inspection of the families of curves when plotted on the WShr-t data of the sampling plots.
M E = 1 i = 1 n Y i Y i ^ 2 i = 1 n Y i Y ¯ 2
R M S E = i = 1 n Y i Y ^ i 2 n 1
where Yi, Y i ^ and Y ¯ are the observed, predicted and mean values of the dependent variable, and n is the number of observations used to fit the equation.

2.5. Compatible System for the Shrub Fuel Complex

Once the equation has been fitted to obtain the total fuel load growth curve as a function of age, the next step is to obtain the equations for the remaining fractions. For this purpose, the site index (SI) of each sample plot is determined as the value of the total fuel load (kg m−2) at a reference age of 10 years.
Equations were developed for estimating the load of each of the four fractions of the shrub fuel complex (WShr_G1_dead, WShr_G1_live, WShr_G1 and WShr_G23) for each community. Allometric models ( y = b 0 · X i b i ) for estimating fuel loads were tested for all the biomass fractions by considering the site index (SI) and age (t) as independent variables to be tested.
Allometric equations must fulfill the property of additivity, i.e., the sum of biomass predictions from separate fuel fractions must equal the biomass prediction from the total biomass model (the sum of WShr_G1_dead and WShr_G1_live estimates must equal WShr_G1 estimates or the sum of WShr_G1 and WShr_G23 must equal WShr estimates). Therefore, in the first step, the equation of each fuel fraction of each shrub community was fitted separately, and the complete system of four equations (one for fraction) was then fitted simultaneously for each shrub community to guarantee additivity:
Two equations that discriminated between fine ( W S h r _ G 1 ) and coarse fuel loads ( W S h r _ G 23 ) by disaggregating W S h r equation were fitted as follows:
W S h r _ G 1 = e x p b 0 g 1 + b 1 g 1 l o g S I + b 2 g 1 l o g t
W S h r _ G 23 = e x p b 0 g 23 + b 1 g 23 l o g S I + b 2 g 23 l o g t
W S h r _ G 1 W S h r = W S h r _ G 1 W S h r _ G 1 + W S h r _ G 23 = 1 1 + W S h r _ G 23 / W S h r _ G 1
The equation for estimating the fine fuel load was then obtained as follows:
W S h r _ G 1 = W S h r 1 + e x p b 0 + b 1 l o g S I + b 2 l o g t
with bi = big23 − big1; and the equation for estimating the coarse fuel load was as follows:
W S h r _ G 23 = W S h r · e x p b 0 + b 1 l o g S I + b 2 l o g t 1 + e x p c 0 + c 1 l o g S I + c 2 l o g t
The two equations discriminating between dead fine ( W S h r _ G 1 _ d e a d ) and live fine fuel loads ( W S h r _ G 1 _ l i v e ) loads by disaggregating Equation (7) were then fitted as follows:
W S h r _ G 1 _ d e a d = e x p c 0 g 1 _ d e a d + c 1 g 1 _ d e a d l o g S I + c 2 g 1 _ d e a d l o g t
W S h r _ G 1 _ l i v e = e x p c 0 g 1 _ l i v e + c 1 g 1 _ l i v e l o g S I + c 2 g 1 _ l i v e l o g t
W S h r _ G 1 _ d e a d W S h r _ G 1 = 1 1 + W S h r _ G 1 _ l i v e / W S h r _ G 1 _ d e a d
The equation for estimating the fine dead fuel load was then obtained as follows:
W S h r _ G 1 _ d e a d = W S h r _ G 1 1 + e x p c 0 + c 1 · l o g S I + c 2 · l o g t
with ci = cig1_live − cig1_dead; and the following equation was fitted to estimate the live fine fuel load:
W S h r _ G 1 _ l i v e = W S h r _ G 1 · e x p c 0 + c 1 l o g S I + c 2 l o g t 1 + e x p c 0 + c 1 l o g S I + c 2 l o g t
The condition number was used to evaluate the presence of multicollinearity among variables in the fitted equations. According to Myers [93], values higher than 1000 indicate problems associated with multicollinearity. The presence of heteroscedasticity was analyzed by the White test [94] and by visual inspection of studentized residuals plotted against fitted values. When heteroscedasticity was detected, each observation was weighted by the inverse of its estimated variance ( σ ^ i 2 ), assuming that this variance can be modeled as a power function of the independent variables [95], i.e., σ ^ i 2 = X i k . The value of the exponential term k was optimized to provide the most homogeneous studentized residual plot by using the method proposed by Harvey [96].
The systems were fitted using the nonlinear seemingly unrelated regression (NLSUR) method, which considers the cross-equation correlations, and the cross-equation error covariance matrix obtained by ordinary least squares was used to initiate the iterative procedure. When necessary, the weighting factor for heteroscedasticity was programmed in the MODEL procedure of SAS/ETS® [97].
The accuracy of estimates was evaluated using the values of the model efficiency (ME) and root mean square error (RMSE) goodness-of-fit statistics.

2.6. Assessing the Effect of Topographic and Climatic Variables on Site Quality

An explicit relationship between site index values and site environmental conditions, defined by a set of topographic and climatic variables, was evaluated. For this purpose, the elevation and slope of each sample plot were obtained from the field sampling. Mean values of annual temperature (T), temperature of the warmest month (Twm), temperature of the coldest month (Tcm), annual precipitation (P) and summer precipitation (Ps) of each of the 267 sample plots were obtained from a climatic map (spatial resolution, 1 km) constructed by Gonzalo [98] by ordinary cokriging of data from 5426 weather stations (series 1951–1999). Moreover, mean rainfall days per month (Rd) and per summer months (Rds) were obtained for each sample plot from the climatological series database of the nearest meteorological station in Galicia (https://www.meteogalicia.gal, accessed on 14 December 2023).
Additionally, the annual aridity index (P/T) and the summer aridity index (Ps/Twm) were derived from the original data for each of the 267 sample plots (Table 2).
Elevation (m.a.s.l.); Slope (%); P annual rainfall (mm); Ps summer precipitation (mm); T annual temperature (°C), Twm mean temperature of the warmest month (°C); Tcm mean temperature of the coldest month (°C); P s ¯ mean monthly summer rainfall (mm); Rd number of rainy > 1 mm per month; Rds number of rainy days > 1 mm in summer per month. Different letters indicate significant differences in mean values (α = 0.05) between shrubland communities. The modeling approaches used should enable the development of parsimonious models, preventing overfitting and resulting in relationships, where ecological coherence can be easily assessed. The multivariate adaptive regression splines (MARS) approach was used to model the relationship. This approach has been successfully used for fitting this type of relationship to establish forest stand site quality [99,100].
MARS is a nonparametric technique based on fitting piecewise linear regressions by intervals of the independent variable space [101]. The generalized cross-validation (GCV) criterion was used to select the best set of independent variables using the earth package [102] implemented in R software 4.2.2 [103].
The climatic data correspond to mean values obtained from a long series of annual observations. Only those sample plots of age 5 years or more were therefore considered in the model development to prevent including growth data that could be affected by anomalous climatic conditions occurring during short periods of time. Finally, data from 132 sample plots of gorse-dominated communities and from 62 sample plots of hearth-dominated communities were used to develop the MARS models.

3. Results

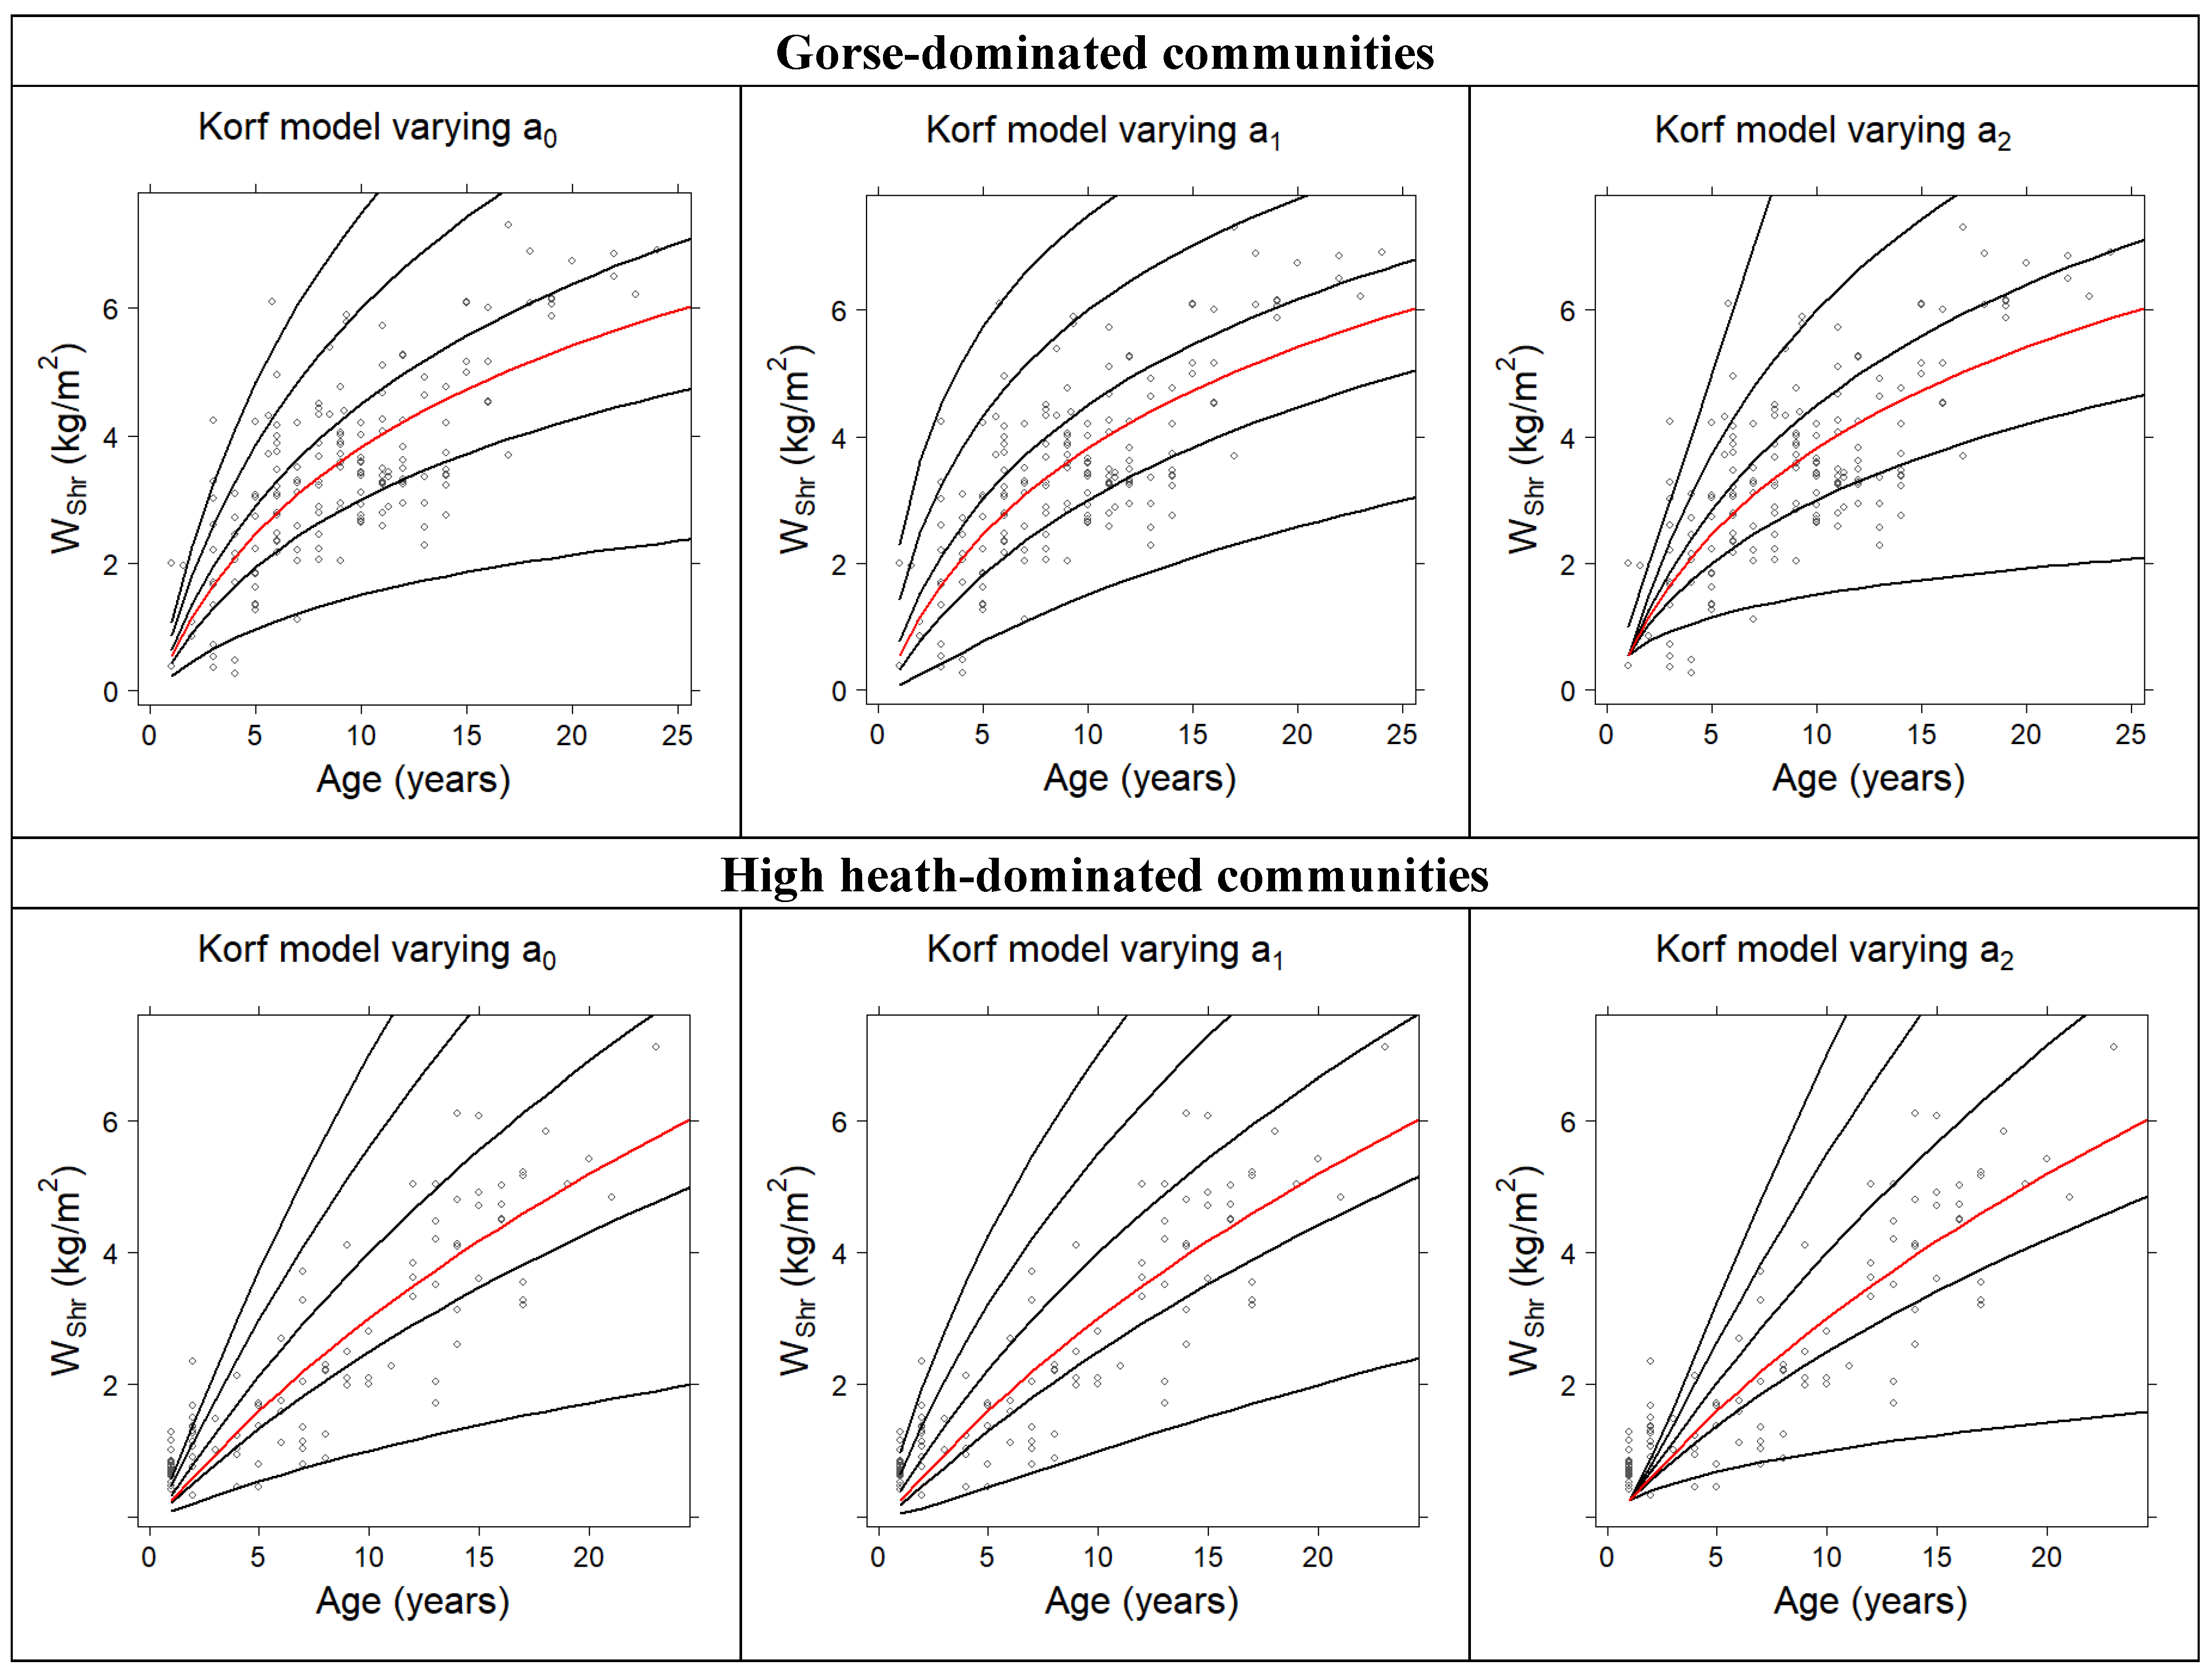
3.1. Development of Total Fuel Load Growth Curves

The parameter estimates for each base model and the goodness-of-fit statistics are given in Table 3. All parameters were found to be significant at the 5% level. The values of the goodness-of-fit statistics are very similar for the three base models in the case of both gorse-dominated and high heath-dominated communities; although in the latter case, the values indicate more accurate estimates. In both cases, the base model with the highest percentage of variability explained and the lowest RMSE was the Korf model, which was therefore selected for generating the WShr-t growth curves in both communities.
Three different families of curves can be obtained from the guide curve derived from the Korf model, depending on which parameter is considered site-dependent (a0, a1 or a2, with the other two held constant). The three families of curves for each community overlaid on the observed WShr-t data are shown in Figure 2. The curves represented correspond to WShr values of 1.5, 3, 4.5, 6 and 7.5 kg m−2 at a reference age (tref) of 10 years for gorse-dominated communities and 1, 2.5, 4, 5.5 and 7 kg m−2 at a reference age (tref) of 10 years for high heath-dominated communities.
The best family of curves was selected according to the performance of the site form curves over the data by considering the polymorphism of the resulting curves as a fundamental criterion. The family in which parameter a0 varies when considered site-dependent results in anamorphic curves with different asymptotes (Figure 2, left); when parameter a1 is considered site-dependent, the family of curves is polymorphic with a common asymptote (Figure 2, middle), and the same occurs when parameter a2 is considered site-dependent (Figure 2, right).
Considering the trends in the different families of curves in Figure 2, the most representative for both shrubland communities is that in which parameter a1 depends on the site, resulting in a polymorphic family. The mathematical expression of the curve for a sample plot, in which the total shrub fuel load (WShr_t1) at a given age (t1) is known, would thus be obtained as follows:
W S h r = e x p a 0 a 0 l o g W S h r t 1 · t 1 t a 2
In addition, the site index (SI) of that same sample plot, defined as the value of the total shrub fuel load at the reference age (tref) of 10 years, would be obtained as follows:
S I = e x p a 0 a 0 l o g W S h r t 1 · t 1 10 a 2
A reference age (tref) of 10 years was selected to improve the accuracy of predictions, reducing the prediction bias associated with sample plots, where t differs greatly from the reference tref [104].
Site index values for the gorse-dominated formations ranged from 0.84 to 8.23 kg m−2 at a reference age of 10 years, with a mean value of 3.79 kg m−2 (sd = 1.15 kg m−2), while for the high heath-dominated formations, the site index ranged from 1.01 to 8.25 kg m−2 with a mean of 3.68 kg m−2 (sd = 1.61 kg m−2).

3.2. Effect of Topographic and Climatic Variables on Site Quality

Mean values of topographic and climatic variables considered for the sampled shrubland communities dominated, respectively, by U. europaeus and E. australis in the study sites (Table 2) were significantly different, except for monthly number of rainy days < 1 mm for summer. In general, the ranges of variables were similar, except for elevation, with high heath-dominated communities having a higher elevational limit than gorse-dominated communities, while the opposite was found for Tcm. Additionally, the aridity index P/T was larger in heath than in gorse.
Preliminary analysis indicated no significant linear correlations between the physiographic and climatic variables and the site index for both communities under study. However, the results of the MARS model for gorse-dominated communities showed a significant effect of both mean summer precipitation (Ps) and the mean temperature of the coldest month (Tcm):
S I = 3.16 + 0.084 · P s 167 · I P S + 1.61 · T c m 8.5 · I T c m 1 0.22 · 8.5 T c m · I T c m 2
where SI is expressed in kg m−2, Ps in mm and Tcm in °C; IPs is a dummy variable with a value of 1 for Ps greater than 167 mm and 0 otherwise; ITcm1 is a dummy variable with a value of 1 for Tcm greater than 8.5 °C and 0 otherwise, and ITcm2 is a dummy variable with value 1 for Tcm less than 8.5 °C and 0 otherwise.
For equal values of Tcm, the threshold for summer precipitation was 167 mm, below which SI values are similar and above which SI increases at an average rate of 0.84 kg m−2 for every 10 mm increase in precipitation. In the case of Tcm, for equal Ps values, an increase in its value implies a moderate increase in SI until a threshold of 8.5 °C, beyond which SI growth increases considerably. These thresholds and growth rates should be considered with caution as the predictive capacity of the model is limited (ME = 0.11; RMSE% = 25.58%), although the model is useful from an explanatory point of view.

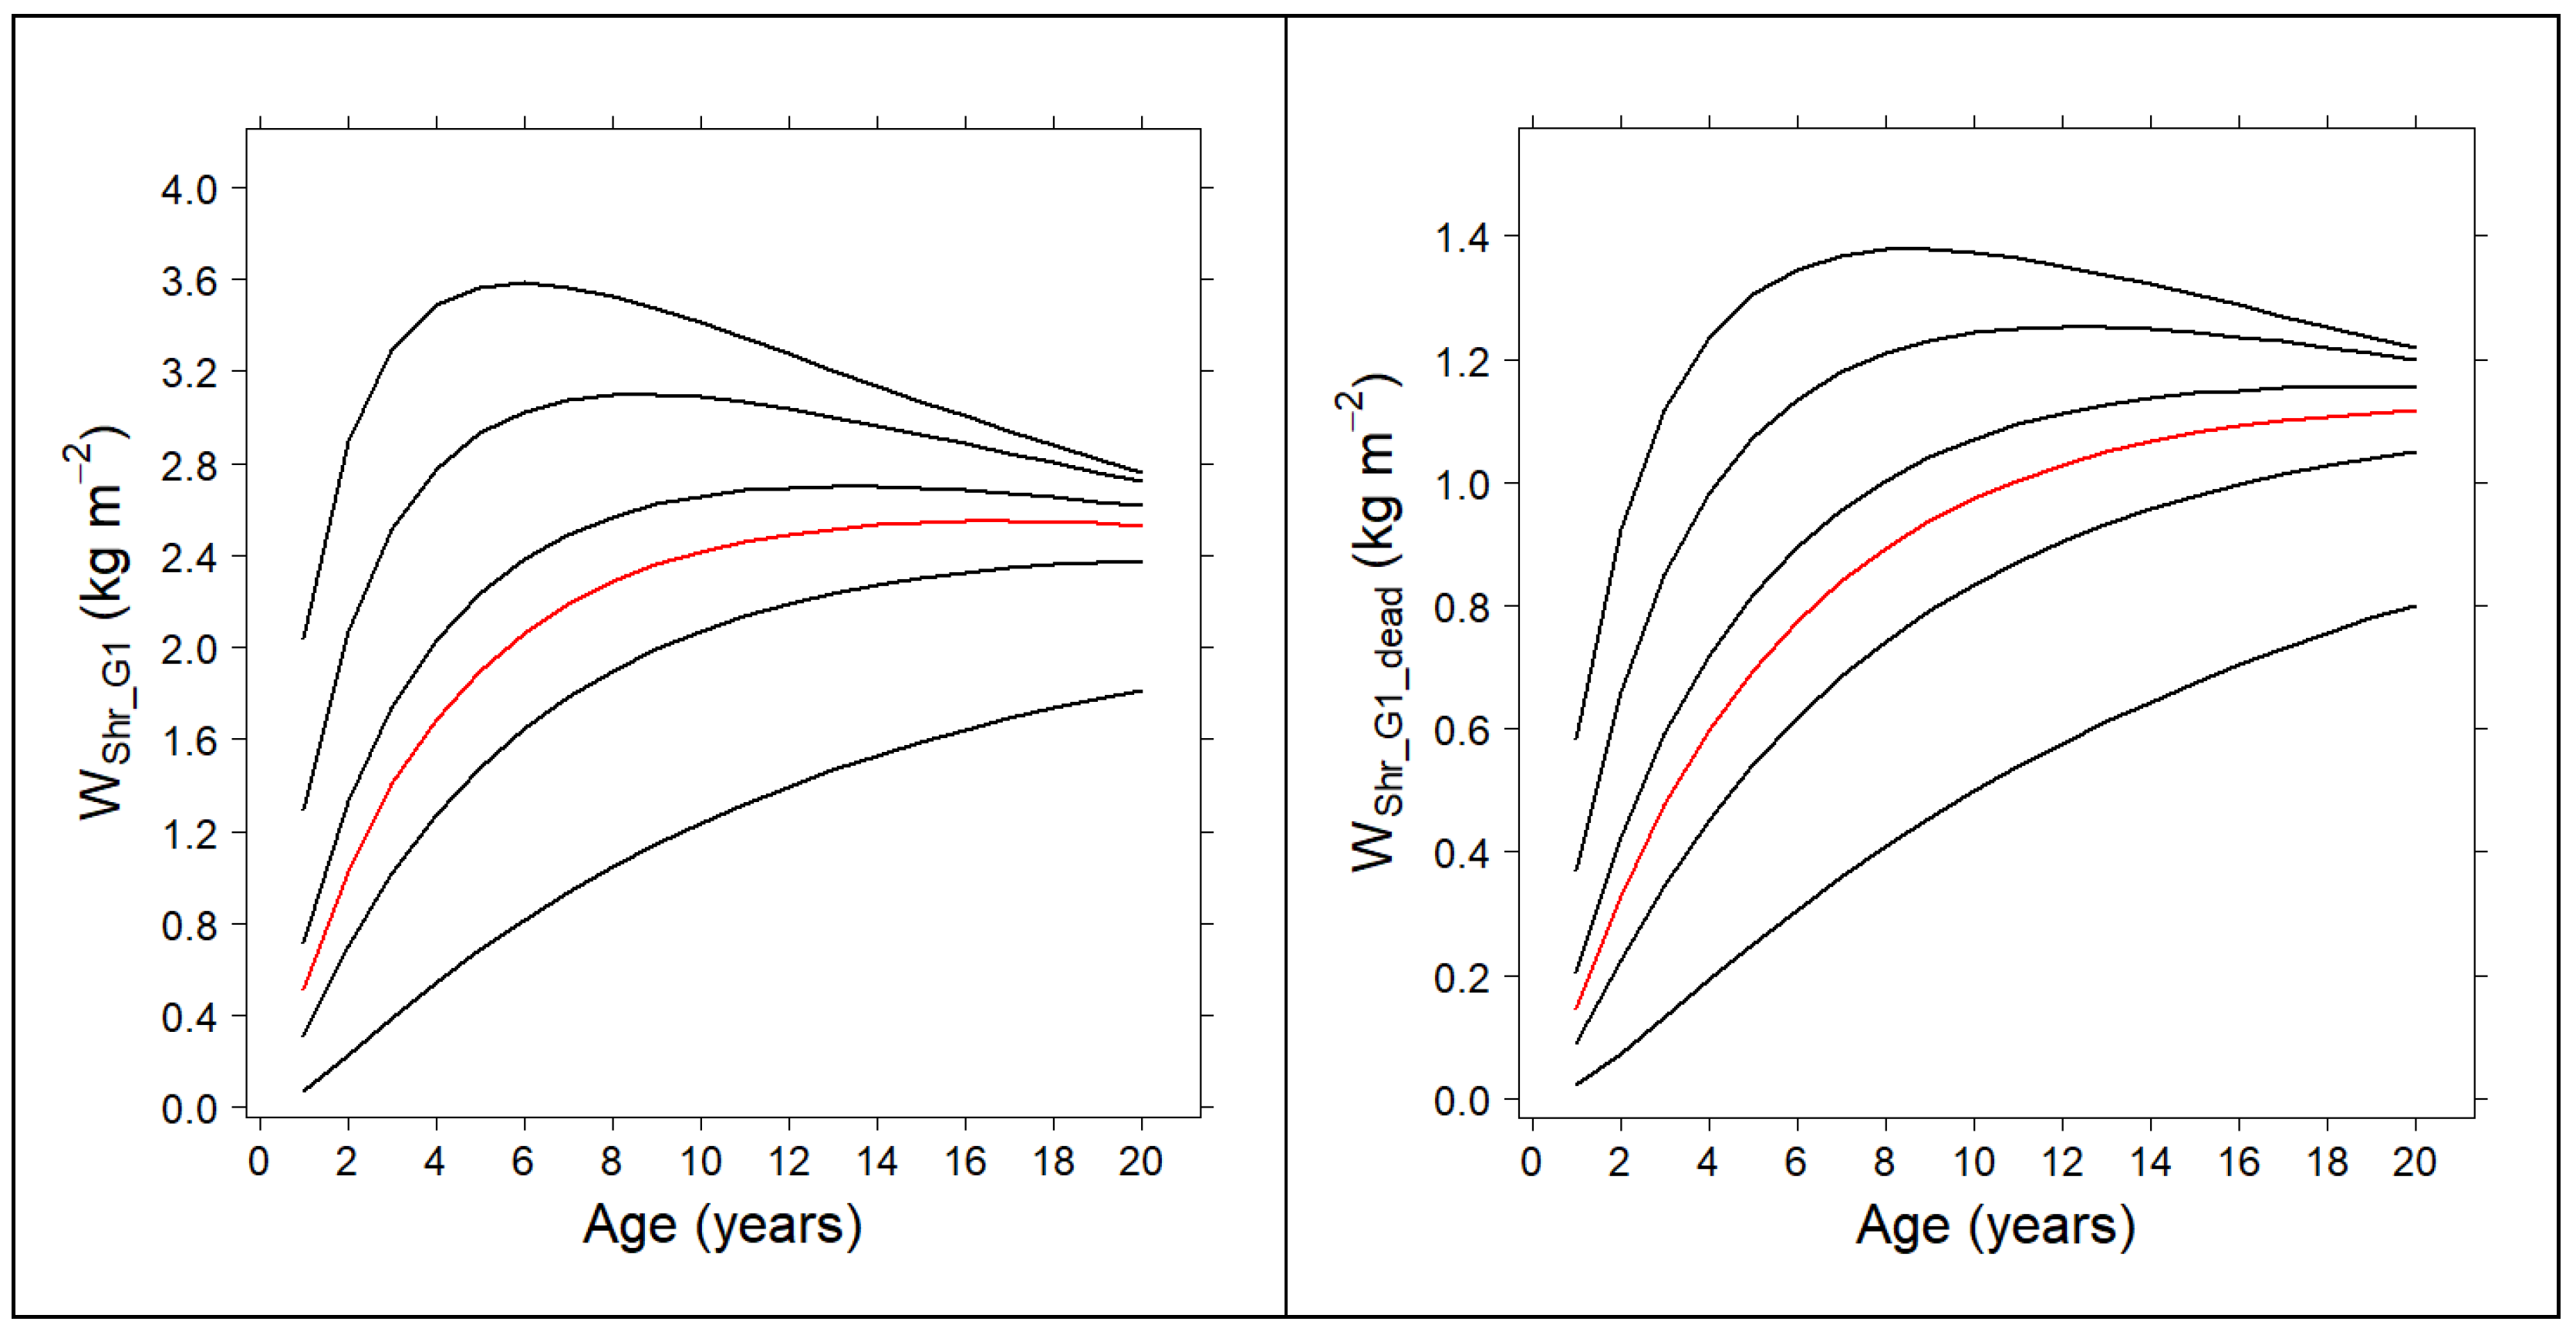
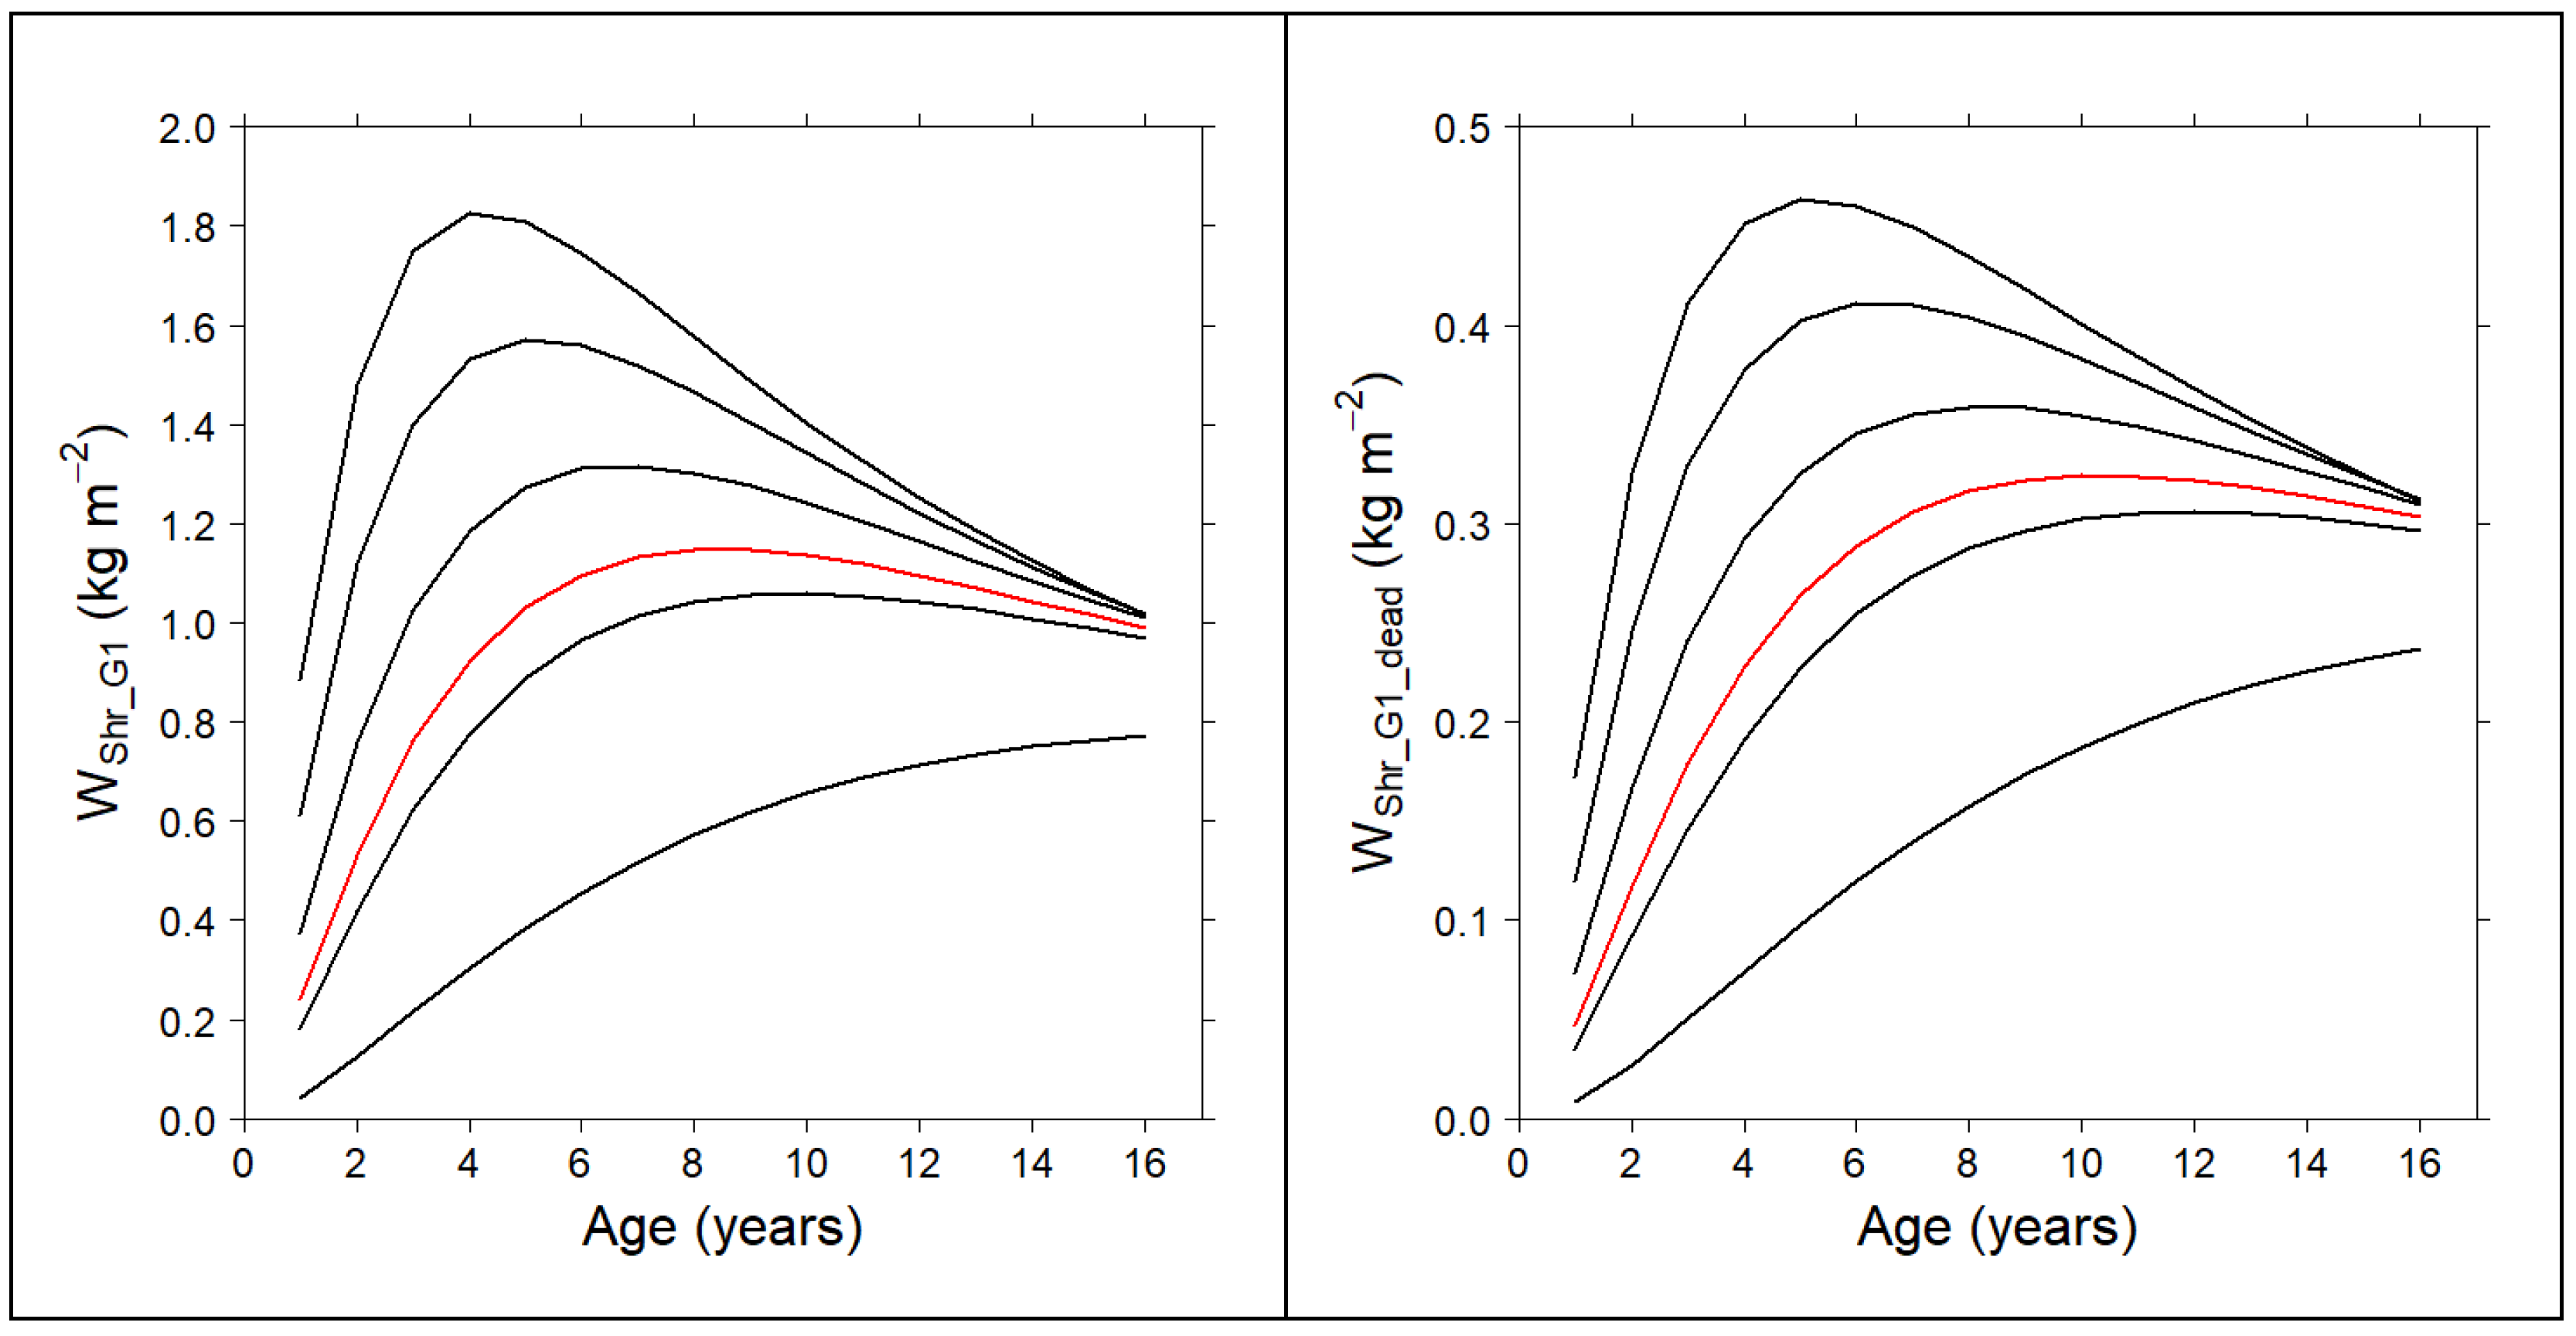
3.3. Compatible System for the Shrub Fuel Complex

Once the SI of each sample plot was estimated using Equation (11), the compatible system of four equations relating age and site index to the biomass of the remaining fractions of the shrub fuel complex (WShr_G1_dead, WShr_G1_live, WShr_G1 and WShr_G23) was fitted for each shrub community. The mathematical expression of the system (Equations (6) to (9)) fitted to gorse-dominated and high heath-dominated shrub communities and the goodness-of-fit statistics are given in Table 4. All parameters were found to be significant at the 5% level.
The results of the White test and the values of the condition number did not indicate any problems of heteroscedasticity or multicollinearity, respectively, for any fuel fraction in either of the shrub communities.
The best results were obtained for the high heath-dominated community, with percentages of observed variability explained varying between 73% for dead fine shrub load (WShr_G1_dead) and 94% for coarse shrub load (WShr_G23); for the gorse-dominated community, the respective percentages varied between 48% of live fine shrub load (WShr_G1_live) and 86% of coarse shrub load (WShr_G23).
Vega et al. [7] also obtained better goodness-of-fit statistics for the high heath-dominated community versus the gorse-dominated community in the same study area by fitting a system of compatible equations to estimate shrub loads by fractions using the mean height of the shrub, shrub cover and the depth of the litter and duff layer as independent variables.
The complete set of fitted equations (Equations (6) to (11)) can also be used to estimate other variables of interest such as the fine ratio (WShr_G1/WShr) and the dead ratio (WShr_G1_dead/WShr_G1) with the age and the site index of the shrub community or the mean and current fuel load annual increment of each of the five fractions (WShr_G1_dead, WShr_G1_live, WShr_G1, WShr_G23 and WShr). The mathematical expression of the fine and dead ratios would be as follows:
F i n e   r a t i o = W S h r _ G 1 W S h r = 1 1 + e x p b 0 + b 1 l o g S I + b 2 l o g t
D e a d   r a t i o = W S h r _ G 1 _ d e a d W S h r _ G 1 = 1 1 + e x p c 0 + c 1 · l o g S I + c 2 · l o g t
As parameters b1 and b2 are both positive for both shrubland communities under study (Table 3), the fine ratio decreases with age and also with increasing site quality (increasing SI). This behavior is biologically expected, as the fine shrub load increases in absolute terms with age and site quality, but does so at a slower rate than the coarse shrub load (shrub fraction with no upper limit of thickness). On the other hand, as c2 is negative and c1 is zero for both shrub communities analyzed (Table 3), the dead ratio varies exclusively with the age of the community, increasing as the latter increases. In our study, the fine ratio varied in gorse-dominated communities between 0.292 and 0.989 (mean value = 0.673), and in high heath-dominated communities, the range was similar (0.266–0.988) with a mean value slightly higher (0.727).
The mean annual increment (MAI, kg m−2 year−1) in the shrub load of any of the fractions analyzed can be obtained by dividing the expression of the corresponding fitted equation by age; likewise, the current annual increment (CAI, kg m−2 year−1) can be obtained by calculating the derivative of the same equation relative to age. For example, the MAI and CAI of the total shrub load (WShr) can be obtained as follows:
M A I ( W S h r ) = e x p a 0 a 0 l o g W S h r t 1 · t 1 t a 2 / t
C A I ( W S h r ) = a 2 · e x p a 0 a 0 l o g W S h r t 1 · t 1 t a 2 · a 0 l o g W S h r t 1 · t 1 a 2 t a 2 + 1
Total fuel loading is an important component in operational fire hazard systems [105,106]; however, fine fuel loading, being the amount of fuel consumed in the flaming phase of combustion, has a primary influence on fireline intensity [23,33,107]. Within this fraction, the load and proportion of fine dead fuel, combined with its low moisture content, favor flammability in heaths [108] and gorse [61], fire initiation [66,109], fire spread and duration [23,109,110]. For these reasons, Figure 3 shows the WShr_G1–age curves and the WShr_G1_dead–age curves for five different site indices for both shrubland communities analyzed (1.5, 3, 4.5, 6 and 7.5 kg m−2 of WShr at a reference age of 10 years for gorse-dominated communities and 1, 2.5, 4, 5.5 and 7 kg m−2 of WShr at a reference age of 10 years for high heath-dominated communities).
The pattern of variation of fine fuel load with age is very similar in both shrubland communities, with a first phase of increase until reaching a maximum and a subsequent decline phase less pronounced. The maximum value of WShr_G1 is reached earlier in the best site qualities for both communities but is more premature in high heath-dominated communities (4 years for a SI of 7 kg m−2) than in gorse-dominated communities (6 years for a SI of 7.5 kg m−2). Thereafter, the decrease is more pronounced in the best site qualities, and the curves are even cut at advanced ages (more than 20 and 16 years for gorse- and high heath-dominated communities, respectively).
Regarding the WShr_G1_dead curves, the pattern is also similar in both shrubland communities, with an initial growth to a higher maximum in the better site qualities and a posterior decrease. The maximum is reached earlier in the best site qualities and, again, is more premature in high heath-dominated communities (5 years for an SI of 7 kg m−2 in these communities vs. 9 years for an SI of 7.5 kg m−2 in gorse-dominated communities). It is important to emphasize that these WShr_G1_dead maxima are delayed with respect to the WShr_G1 maxima, and these delays are longer as site quality becomes worse (from 3 years for an SI of 7.5 kg m−2 to 8 years for an SI of 3 kg m−2 in the gorse-dominated communities and from 1 year for an SI of 7 kg m−2 to 3 years for an SI of 2.5 kg m−2 for the high heath-dominated communities).

4. Discussion

Although remote sensing methods provide invaluable information on biomass accumulation and growth in shrublands, detailed field inventories continue to be critical to obtain information on shrub structural variables at stand level and at a fine scale. Each method provides complementary information, and while field data are necessary to obtain accurate fuel data and test and refine remote sensing models, remote sensing methods represent the only feasible approach for geospatial assessment of these shrub attributes.
To our knowledge, the models developed in this study are the first to enable detailed estimation of the dynamics of total and different fuel load fractions in gorse and high heath communities at stand level. The few scientific examples of dynamic models that disaggregate shrubland fuel loads by fractions refer to the individual plant level [111,112]. However, in multi-stemmed, dense shrub stands in temperate ecosystems, individual-based biomass equations are impractical because measurements of plant density and individual plant attributes are not feasible [7]. Furthermore, our approach, using a site index based on biomass levels at a reference age of 10 years, addresses the issue of the typical wide variability in shrubland biomass, with a reasonably good level of accuracy.

4.1. Effect of Topographic and Climatic Variables on Site Quality

Elevation and climatic data for gorse (Table 2) are consistent with the biogeographic information classifying U. europaeus as a maritime climate-influenced [113,114,115] and meso-temperate species, preferably thriving in the colline and montane elevational levels [116]. Compared to its current global climatic niche [117], the gorse stands included in this study receive abundant annual rainfall, while the annual mean temperature is close to the global mean value. Gorse plants in NW Spain also have an advantageous climatic position for growth, relative to those growing in the Western European habitat [118].
The significant differences between gorse- and high heath-dominated communities in almost all climatic parameters considered (Table 2) are consistent with the distinct habitats. The high heath-dominated communities grow preferentially in the eastern part of the region, further from the oceanic effect, more under the influence of the Mediterranean climate, and at a higher elevation than the gorse-dominated communities. Although the data were partly derived from mixed stands with the presence of other typical species of dry heathlands, they confirm the known biogeographic differences between high heath and gorse [115,119].
The detection of a summer rainfall threshold affecting SI suggests, however, that gorse growth is responsive to an increase in water input in summer, irrespective of the high average annual precipitation rate. This also appears to be consistent with the water shortage for the gorse area in summer in NW Spain (Table 2). Summer rainfall is important for gorse biomass dynamics, as part of the growth occurs in summer [57], coinciding with increased evapotranspiration. Gorse has a tap root that can effectively explore subsurface soil water [113] and can withstand some summer droughts (if not very intense and widespread) [114,117,120]. The resistance, however, will probably lead to a reduction in metabolism, as found in Ulex airensis [121], with growth ultimately affected. Furthermore, gorse mainly grows in mountainous areas in NW Spain, where shallow, coarse-textured soils are most abundant, generally resulting in low water storage and availability in summer [122,123]. On the other hand, the rainfall pattern may be more important in explaining the impact of drought on growth than the amount of rainfall [124], and the mean monthly number of summer rainy days in the study area is comparatively low (4.8). Reduced growth under drought has been reported for U. europaeus [125] and for U. parviflorus [126], and high drought sensitivity of U. europaeus has been noted at the seedling stage [127].
The Tcm threshold seems compatible with the gorse sensitivity to low temperature [113,117,118,128]. Overall, the plasticity of gorse [117,118,129] may also partly explain the modest effect of climatic variables on SI observed in the present study.
The lack of any apparent relationships between SI and climatic variables in heath-dominated communities is not surprising, given the inconsistent information regarding the relationship between water availability and resprouting growth after disturbance in these species [130,131,132,133] as well as in other Mediterranean high heath species such as E. multiflora [134]. The inconsistent response to moderate drought and its well-established strong resilience to various types of disturbance [135,136,137,138,139,140], although sensitive to very frequent clipping [138,141], suggest lower sensitivity to climate than in gorse. The lack of growth response to rainfall and temperature detected in the high heath-dominated communities may also be partly due to the favorable mean annual rainfall–mean annual temperature ratio (150 ± 4.4 mm) for the high heath habitat in NW Spain. Meanwhile, high heath-dominated communities may be sensitive to soil characteristics [142], which also affect resprouting [130], as found for different levels of soil burn severity [143].
Despite the reduced response of biomass growth to climatic variables in gorse- and high heath-dominated communities, the significant increase in mean annual temperature observed in the last few decades in NW Spain and the absence of any changes in precipitation [144] indicate reduced soil water availability. This situation, together with the observed increase in the duff moisture code (strongly and negatively related to the moisture content of the soil organic layer and topsoil) [145], suggests probable adverse changes in plant growth conditions, also leading to increased fire severity in shrubland wildfire.
This study did not address the influence of other factors on the biomass dynamics of gorse and high heath communities. Such factors, along with the study limitations, may also have partly constrained the detection of a stronger influence of climate on growth. One possible limitation of the study is the representativeness of climatic data in relation to the sampled sites and the temporal range of growth considered. Although gorse and high heaths are the dominant species in their respective communities, the spatial composition varied widely and may have affected the biomass growth patterns, increasing the variability. Finally, many other factors, such as topographic characteristics, soil properties, plant competition level and the plant physiological status, can strongly affect temporal patterns of plant growth. The negative consequences of the NW Spain disturbance regime, with an active millennia-long human presence in the region [146,147] and a long history of intensive use of shrub biomass, have probably affected biomass dynamics. Disturbances due to frequent burning, wildfire, grazing and rotational cultivation in prehistoric [148] and historic times [149,150] have probably also influenced the dynamics. Although different types of disturbances, particularly fire, are considered key factors in the perpetuation of heathlands [151,152], some of the disturbances have been recurrent, frequent and severe, dramatically reducing heathland area in the region, and may have had long-lasting effects on plant growth patterns [153]. All of the above may have had an overwhelming influence on both gorse- and high heath-dominated communities, which may have altered the climatic effect on the growth of both shrublands. Further research is required to shed light on this point in order to refine current models.

4.2. Biomass Accumulation and Mean Annual Increment (MAI)

The similarity of the values of biomass mean annual increment (MAI) in gorse-dominated communities in the sample plots of this study with those reported for native Western Europe stands [154] seems consistent with similar climatic conditions and history of land use and disturbance in those habitats [155]. However, data reported by Carswell et al. [49] for this species in treeless stands in New Zealand show high growth maintained even beyond 15 years, which could be related to a niche shift, or simply due to the short time interval explored. Since Oceanic climatic conditions are similar to the native gorse region, the response observed in New Zealand does not seem caused by a climatic niche shift [117] and may have been due to a more complex environmental niche shift. This can entail less competition and fewer natural enemies than in the native niche [129,156], enhancing resource assignation to reproduction and growth (EICA hypothesis: [157,158]). However, the effect of differences in soil properties between gorse from native areas and from sites measured in New Zealand cannot be ruled out in regard to explaining differences in the respective MAIs.
The MAI values of the Mediterranean gorse (Ulex parviflorus)-dominated communities at ages 9 and 17 years [12] were only slightly lower than those from our guide curve for the same age. This was not expected, since the two species have different strategies of regeneration; while Mediterranean gorse is an obligate seeder [12,31,159], U. europaeus is a facultative resprouter [160], which a priori provides an advantage for faster growth. However, at the individual plant level, U. parviflorus biomass between 5 and 26 years showed a pattern of continued growth [161].
The guide curve for the high heath-dominated communities in our study shows a lower MAI at juvenile stage (5 years of age) than that reported by Fernandes et al. [47] and similar to those found by Fernandez-Abascal et al. [162] for the same species and by Montero et al. [51] in E. arborea in sites under Mediterranean climate; although, they surpass the value of these other Mediterranean communities from 10 years of age onwards.
The pattern of biomass accumulation with age in the two shrubland communities considered in this study seems compatible with the traditional summer agricultural burning by a smoldering fire that produces ash, which is used as fertilizer for a subsequent rye crop. The rotation cycles of 27, 36 and 41 years generally applied to this practice, depending on the site quality [163], ensure the accumulation of sufficient fuel to cause severe burns and the recovery of favorable edaphic properties for cultivation.

4.3. Fine Ratio

Information on the dynamics of fine fuel loading in U. europaeus was lacking, until now. Our data suggest that, in addition to age, the structure of oceanic gorse biomass is quite sensitive to local conditions, as reflected in the influence of SI on fine fuel dynamics. Through SI, the findings also demonstrate a weak but appreciable influence of climate on gorse fine fuel ratio, with an increase in Tcm and Ps, both leading to an increase in total standing shrub biomass but a decrease in the fine fuel ratio. The findings also indicate that with a single fuel inventory and determination of stand age, it is possible to substantially improve the accuracy in fine fuel ratio estimation over time. Baeza et al. [12,31] examined the variation in the fine fuel load ratio with age in U. parviflorus in E. Spain, reporting mean values of 0.95, 0.71 and 0.48 for 3-, 9- and 12-year-old plants, respectively. These values are generally higher than those observed for U. europaeus in our study.
The dynamics of the fine fuel ratio in the high heath-dominated community is very similar to that in gorse-dominated communities, with slightly lower values for the same SI and age. For dry low heaths, with Pterospartum tridentatum and E. umbellata as dominant species, Fernandes and Rego [55] reported a fine fuel (<2.5 mm) ratio decreasing from 0.9 at 2 years to 0.70 at 22 years in N. Portugal, the latter value being much higher than that observed for the guide curve in our case at the same age (0.38).

4.4. Dead Ratio

The apparent independence of the dynamic of this parameter from SI in both gorse- and heath-dominated communities was unexpected and may indirectly indicate that this plant trait has an evolutionary character with a genetic basis [164] that increases plant flammability [25,165]. The dead ratio increases rapidly in gorse-dominated stands in the early years of age, with these communities becoming highly flammable [59,60]. This is consistent with the widespread historical use of burning in cycles as short as six years in the region [149,150], given the importance of the amount of fine dead fuel and moisture for fire initiation and spread in gorse [66,109] and also in other shrublands [166].
Overall, the increase in the dead ratio with age was quite low and with a similar age-related variation in gorse- and high heath-dominated communities. In gorse, the mean dead ratio for the guide curve increased from 0.32 to 0.45 at between 2 and 22 years of age, whereas in high heath-dominated communities, it increased from 0.22 to 0.32. The dead ratio varied at a greater rate at the juvenile stage, up to about five years of age, and then scarcely increased up to the mature stage (≈10 years). In contrast, Baeza et al. [12,167] observed greater age-related variation in the dead ratio in Ulex parviflorus, reaching a maximum value (0.56) at 9 years of age, followed by a decrease to 0.40 at 26 years of age, similar to the value obtained for the guide curve at the same age in this study (0.46). However, the dead ratio in the Mediterranean tall heath Erica multiflora increased continuously from 0 to 0.15 [167], in contrast to the present observations for E australis. Fernandes et al. [56] also observed a linear increase in the dead ratio (<2.5 mm thickness material) with age in a dry low heathland of age between 2 and 22 years in Portugal, leading to a significant change in the estimated fire behavior.

4.5. Implications for Fuel Hazard Management

The site-specific equations presented in this study for estimating the future development of different shrubland formations at stand level can be useful in different stages of operational fuel hazard management. Only the value of WShr and the age of a sample in the target community are required to improve substantially the accuracy in the estimation of different parameters related to shrubland fuel load and predict their change with age. Our results also offer guidance for fuel treatment planning, based on the age at which different fuel fractions reach the maximum fuel load. They suggest conducting fuel reduction treatments in relatively young stands and, due to the fast recovery to high fuel loads, repeating the treatments frequently. However, fuel managers should balance information on the rate of fuel accumulation with the local risk of ignitions to optimize the interval between interventions.

5. Conclusions

The models developed in this study provide new information on biomass and fuel load dynamics in the two main shrubland communities in NW Spain, dominated by gorse and high heaths. These communities cover a large area in the region, and they are involved in frequent wildfires and play an important role in terms of biodiversity, C sequestration and potential energetic use, among other functions. Despite the extensive area of gorse at the global level, paradoxically, a review of the relevant literature revealed that knowledge about fuel load dynamics in this species is extremely scarce. Such knowledge is even more limited for E. australis.
Native gorse stands in NW Spain share a range of total fuel load dynamics that are similar to those of stands in geographically very distant areas, in some of which gorse is an introduced species. This study contributes, for the first time, to analyzing the influence of climatic factors on fuel load dynamics in gorse habitats. The results suggest that although gorse-dominated communities receive a fairly high amount of rainfall in the study area, growth showed slight sensitivity to increased summer rainfall, while the preference of gorse for mild temperatures was confirmed. However, the growth of high heath-dominated communities was not sensitive to any of the climate variables explored, in line with previous studies giving rise to inconclusive results regarding the effects of drought on growth. However, in the framework of global change, future studies should further explore the influence of climatic factors on biomass and fuel dynamics in the two communities under consideration.
Our model enables, for the first time, the estimation of biomass dynamics in two different fractions (<6 mm and >6 mm) in gorse and high heath-dominated shrublands and for two vegetative stages (dead and alive), with reasonably good accuracy. Given the generally high variability in fuel loads in these shrub communities, the available models so far provided estimates with a large range of uncertainty. The approach used addresses this by modeling the dynamics of fuel biomass and fractions as a function of site index (SI). In this approach, only the value of shrub fuel load and the age of a sample in the target community are required. Furthermore, the equations developed ensure the fulfillment of the additivity principle, which has not been addressed in other studies of dynamic fuel loading in shrublands.
Although this study focused on fuel load dynamics in the shrub layer, the litter layer can also actively contribute to fire behavior in shrublands. Furthermore, other fuel structural properties, such as fuel height and bulk density of shrub and litter layers, are important for fire behavior, and the dynamics were not addressed here. As in other research on biomass dynamics, our study was limited by the lack of quantification of the disturbance history influence on fuel accumulation, which has probably affected the vegetation development in the study area and may contribute to the high variability in the fuel loads in both gorse- and heath-dominated communities. The influence of soil on growth was also not considered here. The effects of all of these factors remain as challenges for future research.
On the other hand, our findings indicate that the dead fuel ratio in both gorse- and high heath-dominated communities depends on age alone, with no apparent influence of site quality, which facilitates the estimation of this important variable in the two communities examined. We did not find a clear steady state for WShr; therefore, future studies may increase the effort in older stands to better clarify the longer-term fuel load dynamics.
The information obtained in our study may be useful for fire management planning. Thus, fuel hazard assessment and monitoring, updating of fuel maps, fuel reduction treatment planning and implementation as well as fire behavior prediction in wildfire suppression can benefit from our findings. Furthermore, the study findings can improve current knowledge on C cycling and C sequestration dynamics in shrublands, assessment of their bioenergetic potential and the dynamics of competition between species after a disturbance that may favor the expansion of invasive species, among other aspects. Finally, the approach used, which combines intensive destructive field sampling, detailed laboratory work to classify the fuel load into components and the construction of accurate empirical models, can be applied to other dense thickets with high canopies and may be useful in combination with remote sensing approaches.

Author Contributions

Conceptualization, J.A.V., J.G.Á.-G. and A.D.R.-G.; data curation, J.A.V., J.G.Á.-G., S.A.-P., C.F. and A.D.R.-G.; formal analysis, J.A.V., J.G.Á.-G., S.A.-P. and A.D.R.-G.; funding acquisition, J.A.V., C.F. and A.D.R.-G.; investigation, J.A.V., J.G.Á.-G., S.A.-P. and A.D.R.-G.; methodology, J.A.V., J.G.Á.-G. and A.D.R.-G.; project administration, J.A.V., C.F. and A.D.R.-G.; supervision, J.A.V. and A.D.R.-G.; writing—original draft, J.A.V., J.G.Á.-G., S.A.-P., C.F. and A.D.R.-G. All authors have read and agreed to the published version of the manuscript.

Funding

This work was supported by the projects: 1FD97-1122-C06-05; INIA-AGL2001-1242-C04-02; INIA-RTA 2009-00153-C03 (INFOCOPAS); INIA-RTA2014-00011-C06 (GEPRIF); INIA-RTA2017-00042-C05 (VIS4FIRE); PDC2021-120945-C55 (APPVIS4FIRE) and PID2020-116494RR-C42 (ENFIRES); funded by the Spanish National Program of Research, Development and Innovation (Plan Estatal de I+D+i) co-financed by the European Regional Development Fund (ERDF) of the European Union; also by projects: ENV4-CT96-0438 (Fuego Programme); ENV04-CT98-0763 (Fuego2 Programme); EVG1-CT2001-00041 (FIRESTAR); EVR1-CT-2002–4002 (EUFIRELAB) and FP6-018505 (FIRE PARADOX); funded by the Environmental Research Programs of the DGXII of the European Commission (European Union); and finally by SAFTOR project (SOE2/P2/E457) from the SUDOE Interreg IV B Program with ERDF funds. The work of Stéfano Arellano Pérez in this article was supported by grant PTQ2021-012150 awarded by the MCIN/AEI/10.13039/501100011033.

Institutional Review Board Statement

Not applicable.

Informed Consent Statement

Not applicable.

Data Availability Statement

The data presented in this study are available on request from the corresponding author. The data are not publicly available due to privacy.

Conflicts of Interest

Author S.A.-P. was employed by the company Agresta S.C. The remaining authors declare that the research was conducted in the absence of any commercial or financial relationships that could be construed as a potential conflict of interest.

References

  1. Pasalodos-Tato, M.; Ruiz-Peinado, R.; del Río, M.; Montero, G. Shrub biomass accumulation and growth rate models to quantify carbon stocks and fluxes for the Mediterranean region. Eur. J. For. Res. 2015, 134, 537–553. [Google Scholar] [CrossRef]
  2. Lombardo, E.; Bancheva, S.; Domina, G.; Venturella, G. Distribution, ecological role and symbioses of selected shrubby species in the Mediterranean Basin: A review. Plant Biosyst. 2020, 154, 438–454. [Google Scholar] [CrossRef]
  3. Madrigal-González, J.; Fernández-Santos, B.; Silla, F.; García Rodríguez, J.A. Shrub diversity in Mediterranean shrublands: Rescuer or victim of productivity? J. Veg. Sci. 2023, 34, e13169. [Google Scholar] [CrossRef]
  4. Moreira, F.; Viedma, O.; Arianoutsou, M.; Curt, T.; Koutsias, N.; Rigolot, E.; Barbati, A.; Corona, P.; Vaz, P.; Xanthopoulos, G.; et al. Landscape–wildfire interactions in southern Europe: Implications for landscape management. J. Environ. Manag. 2011, 92, 2389–2402. [Google Scholar] [CrossRef] [PubMed]
  5. Fernandes, P.M.; Loureiro, C.; Guiomar, N.; Pezzatti, G.B.; Manso, F.; Lopes, L. The dynamics and drivers of fuel and fire in the Portuguese public forest. J. Environ. Manag. 2014, 146, 373–382. [Google Scholar] [CrossRef] [PubMed]
  6. Archer, S.R.; Andersen, E.M.; Predick, K.I.; Schwinning, S.; Steidl, R.J.; Woods, S.R. Woody Plant Encroachment: Causes and Consequences. In Rangeland Systems; Briske, D.D., Ed.; Springer Series on Environmental Management; Springer: Berlin/Heidelberg, Germany, 2017. [Google Scholar]
  7. Vega, J.A.; Arellano-Pérez, S.; Álvarez-González, J.G.; Fernández, C.; Jiménez, E.; Fernández-Alonso, J.M.; Vega-Nieva, D.; Briones-Herrera, C.; Alonso-Rego, C.; Fontúrbel, T.; et al. Modelling aboveground biomass and fuel load components at stand level in shrub communities in NW Spain. For. Ecol. Manag. 2022, 505, 119926. [Google Scholar] [CrossRef]
  8. Kukavskaya, E.A.; Buryak, L.V.; Shvetsov, E.G.; Conard, S.G.; Kalenskaya, O.P. The impact of increasing fire frequency on forest transformations in southern Siberia. For. Ecol. Manag. 2016, 382, 225–235. [Google Scholar] [CrossRef]
  9. Coop, J.D.; Parks, S.A.; Stevens-Rumann, C.S.; Crausbay, S.D.; Higuera, P.D.; Hurteau, M.D.; Tepley, A.; Whitman, E.; Assal, T.; Collins, B.M.; et al. Wildfire-Driven Forest Conversion in Western North American Landscapes. BioScience 2020, 70, 659–667. [Google Scholar] [CrossRef]
  10. Lloret, F.; Pausas, J.G.; Vila, M. Responses of Mediterranean plant species to different fire frequencies in Garraf Natural Park (Catalonia, Spain): Field observations and modelling predictions. Plant Ecol. 2003, 167, 223–235. [Google Scholar] [CrossRef]
  11. Fernández-García, V.; Marcos, E.; Fulé, P.Z.; Reyes, O.; Santana, V.M.; Calvo, L. Fire regimes shape diversity and traits of vegetation under different climatic conditions. Sci. Total Environ. 2020, 716, 137137. [Google Scholar] [CrossRef]
  12. Baeza, M.J.; Raventós, J.; Escarré, A.; Vallejo, V.R. Fire risk and vegetation structural dynamics in Mediterranean shrubland. Plant Ecol. 2006, 187, 189–201. [Google Scholar] [CrossRef]
  13. Valdecantos, A.; Baeza, M.J.; Vallejo, V.R. Vegetation management for promoting ecosystem resilience in fire-prone Mediterranean shrublands. Restor. Ecol. 2009, 17, 414–421. [Google Scholar] [CrossRef]
  14. Keeley, J.E.; Pausas, J.G.; Rundel, P.W.; Bond, W.J.; Bradstock, R.A. Fire as an evolutionary pressure shaping plant traits. Trends Plant Sci. 2011, 16, 406–411. [Google Scholar] [CrossRef]
  15. Keeley, J.E.; Bond, W.J.; Bradstock, R.A.; Pausas, J.G.; Rundel, P.W. Fire in Mediterranean Ecosystems: Ecology, Evolution and Management; Cambridge University Press: New York, NY, USA, 2012. [Google Scholar]
  16. Pausas, J.G.; Schwilk, D. Fire and plant evolution. New Phytol. 2012, 193, 301–303. [Google Scholar] [CrossRef] [PubMed]
  17. Chandler, C.; Cheney, P.; Thomas, P.; Trabaud, L.; Williams, D. Fire in Forestry. Vol. 1. Forest Fire Behavior and Effects; John Wiley & Sons, Inc.: New York, NY, USA, 1983. [Google Scholar]
  18. Pyne, S.J.; Andrews, P.L.; Laven, R.D. Introduction to Wildland Fire, 2nd ed.; John Wiley and Sons: New York, NY, USA, 1996. [Google Scholar]
  19. Scott, A.C.; Bowman, D.M.J.S.; Bond, W.J.; Pyne, S.J.; Alexander, M.E. Fire on Earth: An Introduction; Wiley-Blackwell: Hoboken, NJ, USA, 2014. [Google Scholar]
  20. Krawchuk, M.; Moritz, M. Constraints on global fire activity vary across a resource gradient. Ecology 2011, 92, 121–132. [Google Scholar] [CrossRef]
  21. Pausas, J.G.; Ribeiro, E. The global fire–productivity relationship. Glob. Ecol. Biogeogr. 2013, 22, 728–736. [Google Scholar] [CrossRef]
  22. Pausas, J.G.; Keeley, J.E. A burning story: The role of fire in the history of life. Bioscience 2009, 59, 593–601. [Google Scholar] [CrossRef]
  23. Fontaine, J.B.; Westcott, V.C.; Enright, N.J.; Lade, J.C.; Miller, B.P. Fire behaviour in south-western Australian shrublands: Evaluating the influence of fuel age and fire weather. Int. J. Wildland Fire 2012, 21, 385–395. [Google Scholar] [CrossRef]
  24. Clarke, P.J.; Knox, K.J.; Wills, K.E.; Campbell, M. Landscape patterns of woody plant response to crown fire: Disturbance and productivity influence sprouting ability. J. Ecol. 2005, 93, 544–555. [Google Scholar] [CrossRef]
  25. Pausas, J.G.; Keeley, J.E.; Schwilk, D.W. Flammability as an ecological and evolutionary driver. J. Ecol. 2017, 105, 289–297. [Google Scholar] [CrossRef]
  26. Tiribelli, F.; Kitzberger, T.; Morales, J.M. Changes in vegetation structure and fuel characteristics along post-fire succession promote alternative stable states and positive fire–vegetation feedbacks. J. Veg. Sci. 2018, 29, 147–156. [Google Scholar] [CrossRef]
  27. Wei, P.; Lamont, B.; He, T.; Xue, W.; Wang, P.C.; Song, W.; Zhang, R.; Keyhani, A.B.; Zhao, S.; Lu, W.; et al. Vegetation-fire feedbacks increase subtropical wildfire risk in scrubland and reduce it in forests. J. Environ. Manag. 2024, 351, 119726. [Google Scholar] [CrossRef] [PubMed]
  28. Duff, T.J.; Keane, R.E.; Penman, T.D.; Tolhurst, K.G. Revisiting wildland fire fuel quantification methods: The challenge of understanding a dynamic, biotic entity. Forests 2017, 8, 351. [Google Scholar] [CrossRef]
  29. Fernandes, P.M.; Botelho, H.S. A review of prescribed burning effectiveness in fire hazard reduction. Int. J. Wildland Fire 2003, 12, 117–128. [Google Scholar] [CrossRef]
  30. Thompson, M.P.; Vaillant, N.M.; Haas, J.R.; Gebert, K.M.; Stockmann, K.D. Quantifying the potential impacts of fuel treatments on wildfire suppression costs. J. For. 2013, 111, 49–58. [Google Scholar] [CrossRef]
  31. Baeza, M.J.; De Luís, M.; Raventós, J.; Escarré, A. Factors influencing fire behaviour in shrublands of different stand ages and the implications for using prescribed burning to reduce wildfire risk. J. Environ. Manag. 2002, 65, 199–208. [Google Scholar] [CrossRef]
  32. De Cáceres, M.; Casals, P.; Gabriel, E.; Castro, X. Scaling-up individual-level allometric equations to predict stand-level fuel loading in Mediterranean shrublands. Ann. For. Sci. 2019, 76, 87. [Google Scholar] [CrossRef]
  33. Rego, F.C.; Morgan, P.; Fernandes, P.; Hoffman, C. Fuel dynamics and management. In 2021 Fire Science: From Chemistry to Landscape Management; Rego, F.C., Morgan, P., Hoffman, C., Eds.; Springer: Berlin/Heidelberg, Germany, 2021; pp. 363–420. [Google Scholar]
  34. Plucinski, M.P.; Gill, A.M.; Bradstock, R.A. Fuel dynamics in shrub dominated landscapes. Proc. R. Soc. Qld. 2009, 115, 145–151. [Google Scholar] [CrossRef]
  35. Dalgleish, S.A.; Van Etten, E.J.; Stock, W.D.; Knuckey, C. Fuel dynamics and vegetation recovery after fire in a semiarid Australian shrubland. Int. J. Wildland Fire 2015, 24, 613–623. [Google Scholar] [CrossRef]
  36. Li, Z.; Shi, H.; Vogelmann, J.E.; Hawbaker, T.J.; Peterson, B. Assessment of fire fuel load dynamics in shrubland ecosystems in the western United States using MODIS products. Remote Sens. 2020, 12, 1911. [Google Scholar] [CrossRef]
  37. Davies, G.M.; Gray, A.; Hamilton, A.; Legg, C.J. The future of fire management in the British uplands. Int. J. Biodiver. Sci. Manag. 2008, 4, 127–147. [Google Scholar] [CrossRef] [PubMed]
  38. Estornell, J.; Ruiz, L.A.; Velázquez-Martí, B.; Fernández-Sarría, A. Estimation of shrub biomass by airborne LiDAR data in small forest stands. For. Ecol. Manag. 2011, 262, 1697–1703. [Google Scholar] [CrossRef]
  39. Botequim, B.; Zubizarreta-Gerendiain, A.; Garcia-Gonzalo, J.; Silva, A.; Marques, S.; Fernandes, P.M.; Pereira, J.M.C.; Tomé, M. A model of shrub biomass accumulation as a tool to support management of portuguese forests. IForest 2014, 8, 114–125. [Google Scholar] [CrossRef]
  40. Alonso-Rego, C.; Arellano-Pérez, S.; Cabo, C.; Ordoñez, C.; Álvarez-González, J.G.; Díaz-Varela, R.A.; Ruiz-González, A.D. Estimating fuel loads and structural characteristics of shrub communities by using terrestrial laser scanning. Remote Sens. 2020, 12, 3704. [Google Scholar] [CrossRef]
  41. Alonso-Rego, C.; Arellano-Pérez, S.; Guerra-Hernández, J.; Molina-Valero, J.A.; Martínez-Calvo, A.; Pérez-Cruzado, C.; Castedo-Dorado, F.; González-Ferreiro, E.; Álvarez-González, J.G.; Ruiz-González, A.D. Estimating stand and fire-related surface and canopy fuel variables in pine stands using low-density airborne and single-scan terrestrial laser scanning data. Remote Sens. 2021, 13, 5170. [Google Scholar] [CrossRef]
  42. Fernández-Alonso, J.M.; Llorens, R.; Sobrino, J.A.; Ruiz-González, A.D.; Alvarez-González, J.G.; Vega, J.A.; Fernández, C. Exploring the Potential of Lidar and Sentinel-2 Data to Model the Post-Fire Structural Characteristics of Gorse Shrublands in NW Spain. Remote Sens. 2022, 14, 6063. [Google Scholar] [CrossRef]
  43. Hartley, R.J.; Davidson, S.J.; Watt, M.S.; Massam, P.D.; Aguilar-Arguello, S.; Melnik, K.O.; Pearce, H.G.; Clifford, V.R. A mixed methods approach for fuel characterisation in gorse (Ulex europaeus L.) scrub from high-density UAV laser scanning point clouds and semantic segmentation of UAV imagery. Remote Sens. 2022, 14, 4775. [Google Scholar] [CrossRef]
  44. Clutter, J.L.; Forston, J.C.; Pienaar, L.V.; Brister, G.H.; Bailey, R.L. Timber Management. A Quantitative Approach; Krieger Publishing Company: New York, NY, USA, 1992. [Google Scholar]
  45. Burkhart, H.E.; Tomé, M. Modeling Forest Trees and Stands; Springer: Dordrecht, The Netherlands, 2012. [Google Scholar]
  46. Vanclay, J.K. Modelling Forest Growth and Yield: Applications to Mixed Tropical Forests; Cab International: Wallingford, UK, 1994. [Google Scholar]
  47. Fernandes, P.; Ruivo, L.; Gonçalves, P.; Rego, F.; Silveira, S. Dinâmica da combustibilidade nas comunidades vegetais da Reserva Natural da Serra da Malcata. In Proceedings of the Actas do Congresso Ibérico de Fogos Florestais, Castelo Branco, Portugal, 17–19 December 2000; Volume 17, p. 19. [Google Scholar]
  48. Pearce, H.G.; Anderson, W.R.; Fogarty, L.G.; Todoroki, C.L.; Anderson, S.A.J. Linear mixed-effects models for estimating biomass and fuel loads in shrublands. Can. J. For. Res. 2010, 40, 2015–2026. [Google Scholar] [CrossRef]
  49. Carswell, F.; Mason, N.; Holdaway, R.; Burrows, L.; Payton, I.; Sutherland, A.; Price, R.; Pearce, G.; Corich-Hermans, O.; Williams, P. Indirect Estimation of Gorse and Broom ‘Non-Forest Land’ to ‘Forest Land’ Transition; Technical Paper 2019/17; Ministry for Primary Industries New Zealand Government: Wellington, New Zealand, 2013. [Google Scholar]
  50. Westcott, V.C.; Enright, N.J.; Miller, B.P.; Fontaine, J.B.; Lade, J.C.; Lamont, B.B. Biomass and litter accumulation patterns in species-rich shrublands for fire hazard assessment. Int. J. Wildland Fire 2014, 23, 860. [Google Scholar] [CrossRef]
  51. Montero, G.; López-Leiva, C.; Ruiz-Peinado, R.; López-Senespleda, E.; Onrubia, R.; Pasalodos, M. Producción de Biomasa y Fijación de Carbono por los Matorrales Españoles y por el Horizonte Orgánico Superficial de los Suelos Forestales; Minsterio de Agruicultura Pesca y Alimentacion: Madrid, Spain, 2021. [Google Scholar]
  52. Marsden-Smedley, J.B.; Catchpole, W.R. Fire behaviour modelling in Tasmanian buttongrass moorlands. I. Fuel characteristics. Int. J. Wildland Fire 1995, 5, 203–214. [Google Scholar] [CrossRef]
  53. Pimont, F.; Dupuy, J.L.; Rigolot, E. A simple model for shrub-strata-fuel dynamics in Quercus coccifera L. communities. Ann. For. Sci. 2018, 75, 44. [Google Scholar] [CrossRef]
  54. Rothermel, R.C.; Philpot, C.W. Predicting changes in chaparral flammability. J. For. 1973, 71, 640–643. [Google Scholar]
  55. Fernandes, P.; Rego, F.C. Changes in fuel structure and fire behaviour with heathland aging in Northern Portugal. In Proceedings of the 13th Fire and Forest Meteorology Conference, Lorne, Australia, 27–31 October 1996; pp. 433–436. [Google Scholar]
  56. Fernandes, P.M.; Ribeiro, L.; Botelho, H.; Rodrigues, A. Short-term recovery of Erica australis shrubland in NE Portugal after prescribed burning. In Proceedings of the III International Conference on Forest Fire Research and 14th Conference on Fire and Forest Meteorology, Luso, Portugal, 16–20 November 1998. [Google Scholar]
  57. Egunjobi, J.K. Ecosystem processes in a stand of Ulex europaeus L. I. Dry matter production, litterfall and efficiency of solar energy utilization. J. Ecol. 1971, 59, 31–38. [Google Scholar] [CrossRef]
  58. Radcliffe, J.E. Gorse-a resource for goats? N. Z. J. Exp. Agric. 1986, 14, 399–410. [Google Scholar] [CrossRef]
  59. Marino, E.; Guijarro, M.; Hernando, C.; Madrigal, J.; Díez, C. Fire hazard after prescribed burning in a gorse shrubland: Implications for fuel management. J. Environ. Manag. 2011, 92, 1003–1011. [Google Scholar] [CrossRef] [PubMed]
  60. Madrigal, J.; Marino, E.; Guijarro, M.; Hernando, C.; Díez, C. Evaluation of the flammability of gorse (Ulex europaeus L.) managed by prescribed burning. Ann. For. Sci. 2012, 69, 387–397. [Google Scholar] [CrossRef]
  61. Dent, J.M.; Buckley, H.L.; Lustig, A.; Curran, T.J. Flame temperatures saturate with increasing dead material in Ulex europaeus, but flame duration, fuel consumption and overall flammability continue to increase. Fire 2019, 2, 6. [Google Scholar] [CrossRef]
  62. Boissard, C.; Cao, X.L.; Juan, C.Y.; Hewitt, C.N.; Gallagher, M. Seasonal variations in VOC emission rates from gorse (Ulex europaeus). Atmos. Environ. 2001, 35, 917–927. [Google Scholar] [CrossRef]
  63. Galappaththi, H.S.D.; de Silva, W.P.P.; Clavijo Mccormick, A. A mini-review on the impact of common gorse in its introduced ranges. Trop. Ecol. 2023, 64, 1–25. [Google Scholar] [CrossRef]
  64. Vega, J.A.; Cuiñas, P.; Fonturbel, T.; Perez-Gorostiaga, P.; Fernandez, C. Predicting fire behaviour in Galician (NW Spain) shrubland fuel complexes. In Proceedings of the 3rd International Conference on Forest Fire Research & 14th Fire and Forest Meteorology, Luso, Portugal, 16–20 November 1998; pp. 713–728. [Google Scholar]
  65. Vega, J.A.; Jiménez, E.; Dupuy, J.L.; Linn, R.R. Effects of flame interaction on the rate of spread of heading and suppression fires in shrubland experimental fires. Int. J. Wildland Fire 2012, 21, 950–960. [Google Scholar] [CrossRef]
  66. Anderson, S.A.; Anderson, W.R. Ignition and fire spread thresholds in gorse (Ulex europaeus). Int. J. Wildland Fire 2010, 19, 589–598. [Google Scholar] [CrossRef]
  67. Elvira, L.M.; Hernando, C. Inflamabilidad y Energía de las Especies de Sotobosque: Estudio Piloto con Aplicación a los Incendios Forestales; Monografia 68; INIA: Madrid, Spain, 1989. [Google Scholar]
  68. Viana, H.; Vega-Nieva, D.J.; Torres, L.O.; Lousada, J.; Aranha, J. Fuel characterization and biomass combustion properties of selected native woody shrub species from central Portugal and NW Spain. Fuel 2012, 102, 737–745. [Google Scholar] [CrossRef]
  69. Arellano-Pérez, S.; Vega, J.A.; Ruiz-González, A.D.; Arellano, A.; Álvarez-González, J.G.; Vega-Nieva, D.; Pérez, E. Foto-Guía de Combustibles Forestales de Galicia y Comportamiento del Fuego Asociado; Andavira: Santiago de Compostela, Spain, 2017; 244p. [Google Scholar]
  70. Fernández-Guisuraga, J.M.; Suárez-Seoane, S.; García-Llamas, P.; Calvo, L. Vegetation structure parameters determine high burn severity likelihood in different ecosystem types: A case study in a burned Mediterranean landscape. J. Environ. Manag. 2021, 288, 112462. [Google Scholar] [CrossRef]
  71. MARM, Ministerio de Medio Ambiente, Medio Rural y Marino. Cuarto Inventario Forestal Nacional; MARM: Madrid, Spain, 2011. [Google Scholar]
  72. Xunta de Galicia. Plan de Prevención e Defensa Contra os Incendios Forestais en Galicia (PLADIGA); Consellería de Medio Rural: Santiago de Compostela, Spain, 2020. [Google Scholar]
  73. Ojeda, F. 4030 Brezales Secos Europeos En: VV. AA.; Bases Ecológicas Preliminares para la Conservación de los Tipos de Hábitat de Interés Comunitario en España; Ministerio de Medio Ambiente y Medio Rural y Marino: Madrid, Spain, 2009. [Google Scholar]
  74. MARM. Mapa Forestal de España. Galicia. Escala 1:25.000; Ministerio de Medio Ambiente y Medio Rural y Marino: Madrid, Spain, 2011. [Google Scholar]
  75. Brown, J.K.; Oberhau, R.D.; Johnston, C.M. Handbook for Inventorying Surface Fuels and Biomass in the Interior West; USDA Forest Service General Technical Reports INT-GTR-129; USDA: Washington, DC, USA, 1982; 48p.
  76. Fosberg, M.A.; Lancaster, J.W.; Schroeder, M.J. Fuel moisture response—Drying relationships under standard and field conditions. For. Sci. 1970, 16, 21–128. [Google Scholar]
  77. Burgan, R.E.; Rothermel, R.C. BEHAVE: Fire Behaviour Prediction and Fuel Modeling System—FUEL Subsystem; USDA Forest Service General Technical Reports INT-167; USDA: Washington, DC, USA, 1984.
  78. Finney, M.A. FARSITE: Fire Area Simulator–Model Development and Evaluation; Research Paper RMRS-RP-4 Revised; USDA Forest Service Rocky Mountain Research Station: Ogden, UT, USA, 1998.
  79. Scott, J.H.; Burgan, R.E. Standard Fire Behavior Fuel Models: A Comprehensive Set for Use with Rothermel’s Surface Fire Spread Model; General Technical Report RMRS-GTR-153; USDA Forest Service Rocky Mountain Research Station: Ogden, UT, USA, 2005.
  80. Vega, J.A.; Álvarez-González, J.G.; Arellano-Pérez, S.; Fernández, C.; Cuiñas, P.; Jiménez, E.; Fernández-Alonso, J.M.; Fontúrbel, T.; Alonso-Rego, C.; Ruiz-González, A.D. Developing customized fuel models for shrub and bracken communities in Galicia (NW Spain). J. Environ. Manag. 2024, 351, 119831. [Google Scholar] [CrossRef]
  81. Bennet, F.A.; McGee, C.E.; Clutter, J.L. Yield of Old-Field Slash Pine Plantations; Paper 107; USDA Forest Service Southeastern Forest Experiment Station: Asheville, NC, USA, 1959.
  82. Newberry, J.D.; Pienaar, L.V. Dominant Height Growth Models and Site Index Curves for Site-Prepared Slash Pine Plantations in the Lower Coastal Plain of Georgia and North Florida; Research Paper 4; Plantation Management Research Cooperation: Athens, GA, USA, 1978. [Google Scholar]
  83. Kiviste, A.; Álvarez-González, J.G.; Rojo, A.; Ruiz, A.D. Funciones de Crecimiento de Aplicación en el Ámbito Forestal, Monografía INIA: Forestal nº 4; Ministerio de Ciencia y Tecnología: Madrid, Spain, 2002. [Google Scholar]
  84. Borders, T.H.; Bailey, R.L.; Ware, K.D. Slash pine site index from a polymorphic model by joining (splining) nonpolynomial segments with an algebraic difference method. For. Sci. 1984, 30, 411–423. [Google Scholar]
  85. Parresol, B.R.; Vissage, J.S. White Pine Site Index for Southern Forest Survey; Research Paper SRS-10; USDA Forest Service Southern Research Station: Asheville, NC, USA, 1998. [Google Scholar]
  86. Álvarez-González, J.G.; Ruiz-González, A.D.; Rodríguez-Soalleiro, R.; Barrio-Anta, M. Ecoregional site index models for Pinus pinaster in Galicia (northwestern Spain). Ann. For. Sci. 2005, 62, 115–127. [Google Scholar] [CrossRef]
  87. Cieszewski, C.J.; Bailey, R.L. Generalized algebraic difference approach: Theory based derivation of dynamic equations with polymorphism and variable asymptotes. For. Sci. 2000, 46, 116–126. [Google Scholar]
  88. Cieszewski, C.J. Comparing fixed-and variable-base-age site equations having single versus multiple asymptotes. For. Sci. 2002, 48, 7–23. [Google Scholar]
  89. Peschel, W. Die Mathematische Methoden zur Herleitung der Wachstumgesetze von Baum und Bestan un die Ergebnisse ihrer Anwendung. Tharandter Forstl. Jahrburch 1938, 89, 169–247. [Google Scholar]
  90. Ludqvist, B. On the height growth in cultivated stands of pine and spruce in Northern Sweden. Medd. Fran Statens Skogforsk. Band 1957, 47, 1–64. [Google Scholar]
  91. Bertalanffy, L. A quantitative theory of organic growth (inquires on growth laws II). Hum. Biol. 1938, 10, 181–213. [Google Scholar]
  92. Richards, F.J. A flexible growth function for empirical use. J. Exp. Bot. 1959, 10, 290–300. [Google Scholar] [CrossRef]
  93. Myers, R.H. Classical and Modern Regression with Applications, 2nd ed.; Duxbury Press: Belmont, CA, USA, 1990. [Google Scholar]
  94. White, H. A heteroskedasticity-consistent covariance matrix estimator and a direct test for heteroskedasticity. Econometrica 1980, 48, 817–838. [Google Scholar] [CrossRef]
  95. Cailliez, F. Estimación del Volumen Forestal y Predicción del Rendimiento; FAO: Rome, Italy, 1980. [Google Scholar]
  96. Harvey, A.C. Estimating regression models with multiplicative heteroscedasticity. Econometrica 1976, 44, 461–465. [Google Scholar] [CrossRef]
  97. SAS Institute Inc. SAS/ETS© 9.1 User’s Guide; SAS Institute Inc.: Cary, NC, USA, 2004. [Google Scholar]
  98. Gonzalo, J. Diagnosis Fitoclimática de la España Peninsular: Actualización y Análisis Geoestadístico Aplicado. Ph.D. Thesis, Universidad Politécnica de Madrid, Madrid, Spain, 2008. [Google Scholar]
  99. González-Rodríguez, M.A.; Diéguez-Aranda, U. Exploring the use of learning techniques for relating the site index of radiata pine stands with climate, soil and physiography. For. Ecol. Manag. 2020, 458, 117803. [Google Scholar] [CrossRef]
  100. Guerra-Hernández, J.; Arellano-Pérez, S.; González-Ferreiro, E.; Pascual, A.; Altelarrea, V.S.; Ruiz-González, A.D.; Álvarez-González, J.G. Developing a site index model for P. pinaster stands in NW Spain by combining bi-temporal ALS data and environmental data. For. Ecol. Manag. 2021, 481, 118690. [Google Scholar] [CrossRef]
  101. Friedman, J.H. Multivariate adaptive regression splines. Ann. Stat. 1991, 19, 1–67. [Google Scholar] [CrossRef]
  102. Milborrow, S.; Hastei, T.; Tibshirani, R.; Miller, A.; Lumley, T.; Earth: Multivariate Adaptive Regression Splines. R Package Version 5.1.1. 2019. Available online: https://CRAN.R-project.org/package=earth (accessed on 14 December 2023).
  103. R Core Team. R: A Language and Environment for Statistical Computing, Version 3.6.1; R Foundation for Statistical Computing: Vienna, Austria, 2023. [Google Scholar]
  104. Weiskittel, A.; Hann, D.W.; Kershaw, J.; Vanclay, J.K. Forest Growth and Yield Modelling; Wiley-Blackwell: Oxford, UK, 2011. [Google Scholar]
  105. Deeming, J.; Burgan, R.; Cohen, J. The National Fire-Danger Rating System-1978; U.S. Department of Agriculture Forest Service, Intermountain Forest and Range Experiment Station: Ogden, UT, USA, 1978.
  106. Van Wagner, C.E. The Development and Structure of the Canadian Forest Fire Weather Index System; Ont. FTR-35; Canadian Forest Service, Petawawa National Forestry Institute: Chalk River, ON, Canada, 1987. [Google Scholar]
  107. Rothermel, R.C. A Mathematical Model for Predicting Fire Spread in Wildland Fuels; General Technical Report INT-GTR-115; USDA Forest Service, Intermountain Forest and Range Experiment Station: Ogden, UT, USA, 1972.
  108. Santana, V.M.; Marrs, R.H. Flammability properties of British heathland and moorland vegetation: Models for predicting fire ignition. J. Environ. Manag. 2014, 139, 88–96. [Google Scholar] [CrossRef]
  109. Plucinski, M.P.; Anderson, W.R.; Bradstock, R.A.; Gill, A.M. The initiation of fire spread in shrubland fuels recreated in the laboratory. Int. J. Wildland Fire 2010, 19, 512–520. [Google Scholar] [CrossRef]
  110. Schwilk, D.W. Flammability is a niche construction trait: Canopy architecture affects fire intensity. Am. Nat. 2003, 162, 725–733. [Google Scholar] [CrossRef]
  111. Xu, H.; Wang, Z.; Li, Y.; He, J.; Wu, X. Dynamic growth models for Caragana korshinskii shrub biomass in China. J. Environ. Manag. 2020, 269, 110675. [Google Scholar] [CrossRef] [PubMed]
  112. Jin, X.; Xu, H.; Wang, B.; Wang, X. Dynamic Model for Caragana korshinskii Shrub Aboveground Biomass Based on Theoretical and Allometric Growth Equations. Forests 2022, 13, 1444. [Google Scholar] [CrossRef]
  113. Richardson, R.G.; Hill, R.L. The biology of Australian weeds. 34. Ulex europaeus L. Plant Prot. Q. 1998, 13, 46–58. [Google Scholar]
  114. Clements, D.R.; Peterson, D.J.; Prasad, R. The biology of Canadian weeds: 112–Ulex europaeus L. Can. J. Plant Sci. 2001, 81, 325–337. [Google Scholar] [CrossRef]
  115. Ruiz de la Torre, J. Flora Mayor. D.G. Biodiversidad; Ministerio de Medio Ambiente: Madrid, Spain, 2006. [Google Scholar]
  116. Rivas-Martinez, S.; Izco, J.; Díaz-González, T.; Penas, A.; Costa, J.C.; Amigo, J.; Herrero, L.; Giménez de Azcarate, J.; Del Rio, S. The Galician-Portuguese biogeographic sector. An initial advance. Int. J. Geobot. Res. 2014, 4, 65–81. [Google Scholar]
  117. Christina, M.; Limbada, F.; Atlan, A. Climatic niche shift of an invasive shrub (Ulex europaeus): A global scale comparison in native and introduced regions. J. Plant Ecol. 2020, 13, 42–50. [Google Scholar] [CrossRef]
  118. Gränzig, T.; Clasen, A.; Fassnacht, F.E.; Cord, A.; Förster, M. Combining remote sensing, habitat suitability models and cellular automata to model the spread of the invasive shrub Ulex europaeus. Biol. Invasions 2023, 25, 3711–3736. [Google Scholar] [CrossRef]
  119. Rivas Martinez, S. Brezales y jarales de Europa occidental (Revision fitosociologica de las clases Calluno-Ulicetea y Cisto-Lavanduletea). Lazaroa 1979, 1, 5–127. [Google Scholar]
  120. Zielke, K.; Boateng, J.; Caldicott, N.; Williams, H. Broom and Gorse: A Forestry Perspective Problem Analysis; British Columbia Ministry of Forests: Queen Charlotte, BC, Canada, 1992. [Google Scholar]
  121. Correia, A.C.; Costa e Silva, F.; Correia, A.V.; Hussain, M.Z.; Rodrigues, A.D.; David, J.S.; Pereira, J.S. Carbon sink strength of a Mediterranean cork oak understorey: How do semi-deciduous and evergreen shrubs face summer drought? J. Veg. Sci. 2014, 25, 411–426. [Google Scholar] [CrossRef]
  122. Martinez-Cortizas, A. Estimación del balance hídrico de los suelos gallegos con escasa reserva. An. Edafol. Agrobiol. 1986, 45, 901–916. [Google Scholar]
  123. Martinez-Cortizas, A.; Castillo-Rodríguez, F.; Pérez-Alberti, A. Factores que influyen en la precipitación y el balance de agua en Galicia. Boletín Asoc. Geógrafos Españoles 1994, 18, 79–96. [Google Scholar]
  124. Maturano-Ruiz, A.; Ruiz-Yanetti, S.; Manrique-Alba, À.; Moutahir, H.; Chirino, E.; Vilagrosa, A.; Bellot, J.F. The main factors that drive plant dieback under extreme drought differ among Mediterranean shrubland plant biotypes. J. Veg. Sci. 2023, 34, e13187. [Google Scholar] [CrossRef]
  125. Rodríguez-Ramírez, N.; Santonja, M.; Baldy, V.; Ballini, C.; Montès, N. Shrub species richness decreases negative impacts of drought in a Mediterranean ecosystem. J. Veg. Sci. 2017, 28, 985–996. [Google Scholar] [CrossRef]
  126. Marteau, A.; Fourmaux, M.; Mevy, J.P. The Role of Gorse (Ulex parviflorus Pourr. Scrubs) in a Mediterranean shrubland undergoing climate change: Approach by hyperspectral measurements. Plants 2023, 12, 879. [Google Scholar] [CrossRef] [PubMed]
  127. Delerue, F.; González, M.; Michalet, R.; Pellerin, S.; Augusto, L. Weak evidence of regeneration habitat but strong evidence of regeneration niche for a leguminous shrub. PLoS ONE 2015, 10, e0130886. [Google Scholar] [CrossRef] [PubMed]
  128. Burroughs, W.J. Frost damage during the winter of 1981/82. Weather 1982, 37, 346–352. [Google Scholar] [CrossRef]
  129. Hernández-Lambraño, R.E.; González-Moreno, P.; Sánchez-Agudo, J.Á. Towards the top: Niche expansion of Taraxacum officinale and Ulex europaeus in mountain regions of South America. Austral Ecol. 2017, 42, 577–589. [Google Scholar] [CrossRef]
  130. Cruz, A.; Pérez, B.; Quintana, J.R.; Moreno, J.M. Resprouting in the Mediterranean-type shrub Erica australis affected by soil resource availability. J. Veg. Sci. 2002, 13, 641–650. [Google Scholar]
  131. Ramírez, D.A.; Parra, A.; Resco de Dios, V.; Moreno, J.M. Differences in morpho physiological leaf traits reflect the response of growth to drought in a seeder but not in a resprouter Mediterranean species. Funct. Plant Biol. 2012, 39, 332–341. [Google Scholar] [CrossRef]
  132. Parra, A.; Moreno, J.M. Post-fire environments are favourable for plant functioning of seeder and resprouter Mediterranean shrubs, even under drought. New Phytol. 2017, 214, 1118–1131. [Google Scholar] [CrossRef] [PubMed]
  133. Parra, A.; Moreno, J.M. Drought differentially affects the post-fire dynamics of seeders and resprouters in a Mediterranean shrubland. Sci. Total Environ. 2018, 626, 1219–1229. [Google Scholar] [CrossRef] [PubMed]
  134. Peñuelas, J.; Prieto, P.; Beier, C.; Cesaraccio, C.; De Angelis, P.; de Dato, G.; Emmett, B.A.; Estiarte, M.; Garadnai, J.; Gorissen, A.; et al. Response of plant species richness and primary productivity in shrublands along a north–south gradient in Europe to seven years of experimental warming and drought: Reductions in primary productivity in the heat and drought year of 2003. Glob. Chang. Biol. 2007, 13, 2563–2581. [Google Scholar] [CrossRef]
  135. Calvo, L.; Tárrega, R.; Luis, E. Secondary succession after perturbations in a shrubland community. Acta Oecologica 2002, 23, 393–404. [Google Scholar] [CrossRef]
  136. Calvo, L.; Tárrega, R.; Luis, E. The dynamics of mediterranean shrub species over 12 years following perturbations. Plant Ecol. 2002, 160, 25–42. [Google Scholar] [CrossRef]
  137. Calvo, L.; Tárrega, R.; Luis, E.D.; Valbuena, L.; Marcos, E. Recovery after experimental cutting and burning in three shrub communities with different dominant species. Plant Ecol. 2005, 180, 175–185. [Google Scholar] [CrossRef]
  138. Paula, S.; Ojeda, F. Resistance of three co-occurring resprouter Erica species to highly frequent disturbance. Plant Ecol. 2006, 183, 329–336. [Google Scholar] [CrossRef]
  139. Fernández, C.; Vega, J.A.; Fontúrbel, T. Shrub resprouting response after fuel reduction treatments: Comparison of prescribed burning, clearing and mastication. J. Environ. Manag. 2013, 117, 235–241. [Google Scholar] [CrossRef] [PubMed]
  140. Fernández, C.; Vega, J.A.; Fontúrbel, T. Does shrub recovery differ after prescribed burning, clearing and mastication in a Spanish heathland? Plant Ecol. 2015, 216, 429–437. [Google Scholar] [CrossRef]
  141. Paula, S.; Ojeda, F. Belowground starch consumption after recurrent severe disturbance in three resprouter species of the genus Erica. Botany 2009, 87, 253–259. [Google Scholar] [CrossRef]
  142. Ojeda, F.; Arroyo, J.; Marañón, T. Ecological distribution of four co-occurring Mediterranean heath species. Ecography 2000, 23, 148–159. [Google Scholar] [CrossRef]
  143. Fernandez, C.; Vega, J.A.; Fontúrbel, T. Does fire severity influence shrub resprouting after spring prescribed burning? Acta Oecologica 2013, 48, 30–36. [Google Scholar] [CrossRef]
  144. Cruz, R.; Lago, A.; Lage, A.; Rial, M.E.; Díaz-Fierros, F.; Salsón, S. Evolución reciente del clima de Galicia. tendencias observadas en variables meteorológicas. In Análisis de Evidencias e Impactos del Cambio Climático en Galicia; Pérez Muñuzuri, V., Fernández Cañamero, M., Gómez Gesteira, J.M., Eds.; Xunta de Galicia: Santiago, Spain, 2009; pp. 19–58. [Google Scholar]
  145. Vega, J.A.; Fernández, C.; Jiménez, E.; Ruiz, A.D. Evidencias de cambio climático en Galicia a través de la tendencia de los índices de peligro de incendios forestales. In Análisis de Evidencias e Impactos del Cambio Climático en Galicia; Pérez Muñuzuri, V., Fernández Cañamero, M., Gómez Gesteira, J.M., Eds.; Xunta de Galicia: Santiago, Spain, 2009; pp. 173–194. [Google Scholar]
  146. Kaal, J.; Costa-Casais, M.; Ferro-Vázquez, C.; Pontevedra-Pombal, X.; Martínez-Cortizas, A. Soil formation of “Atlantic rankers” from NW Spain—A high resolution aluminium and iron fractionation study. Pedosphere 2008, 18, 441–453. [Google Scholar] [CrossRef]
  147. Kaal, J.; Criado-Boado, F.; Costa-Casais, M.; López-Sáez, J.A.; López-Merino, L.; Mighall, T.; Carrión, Y.; Silva Sánchez, N.; Martínez Cortizas, A. Prehistoric land use at an archaeological hot-spot (the rock art park of Campo Lameiro, NW Spain) inferred from charcoal, synanthropic pollen and non-pollen palynomorph proxies. J. Archaeol. Sci. 2013, 40, 1518–1527. [Google Scholar] [CrossRef]
  148. Fábregas, R.; Fernández, C.; Ramil, P. La adopción de la economía productora en el noroeste ibérico. In O Neolítico Atlántico e as Orixes do Megalistismo Universidade de Santiago; Rodríguez Casal, A., Ed.; Consello da Cultura Galega: Santiago, Spain, 1997. [Google Scholar]
  149. Guitián Rivera, L. Los incendios forestales a través de la historia: Pervivencias y cambios en el uso del fuego en el noroeste peninsular. In Incendios Históricos; Araque Jiménez, E., Ed.; Una Aproximación Multidisciplinar; Universidad Internacional de Andalucía: Seville, Spain, 1999; pp. 149–162. [Google Scholar]
  150. Balboa López, X. El fuego en la historia de los montes gallegos: De las rozas al incendio forestal. In Incendios Históricos; Araque, E., Ed.; Una Aproximación Multidisciplinar; Universidad Internacional de Andalucía: Seville, Spain, 1999; pp. 255–277. [Google Scholar]
  151. Davies, G.M.; Hamilton, A.; Smith, A.; Legg, C.J. Using visual obstruction to estimate heathland fuel load and structure. Int. J. Wildland Fire 2008, 17, 380–389. [Google Scholar] [CrossRef]
  152. Harris, M.P.K.; Allen, K.A.; McAllister, H.A.; Eyre, G.; Le Duc, M.G.; Marrs, R.H. Factors affecting moorland plant communities and component species in relation to prescribed burning. J. Appl. Ecol. 2011, 48, 1411–1421. [Google Scholar] [CrossRef]
  153. Ramil Rego, P.; Rodríguez Guitián, M.A.; López Castro, H.; Ferreiro da Costa, J.; Muñoz Sobrino, C. Loss of European dry heaths in NW Spain: A case study. Diversity 2013, 5, 557–580. [Google Scholar] [CrossRef]
  154. Forgeard, F. Étude expérimentale du rôle de la structure et de la biomasse végétale sur le comportement du feu dans les landes de Bretagne. Acta Oecologica 1989, 10, 273–294. [Google Scholar]
  155. Atlan, A.; Udo, N.; Hornoy, B.; Darrot, C. Evolution of the uses of gorse in native and invaded regions: What are the impacts on its dynamics and management? La Terre Et La Vie-Rev. D’écologie 2015, 70, 191–206. [Google Scholar] [CrossRef]
  156. Hornoy, B.; Tarayre, M.; Herve, M.; Gigord, L.; Atlan, A. Invasive plants and enemy release: Evolution of trait means and trait correlations in Ulex europaeus. PLoS ONE 2011, 6, e26275. [Google Scholar] [CrossRef]
  157. Blossey, B.; Notzold, R. Evolution of increased competitive ability in invasive nonindigenous plants: A hypothesis. J. Ecol. 1995, 83, 887–889. [Google Scholar] [CrossRef]
  158. Joshi, J.; Vrieling, K. The enemy release and EICA hypothesis revisited: Incorporating the fundamental difference between specialist and generalist herbivores. Ecol. Lett. 2005, 8, 704–714. [Google Scholar] [CrossRef]
  159. De Luis, M.; Raventós, J.; González-Hidalgo, J.C. Post-fire vegetation succession in Mediterranean gorse shrublands. Acta Oecologica 2006, 30, 54–61. [Google Scholar] [CrossRef]
  160. Reyes, O.; Casal, M.; Rego, F.C. Resprouting ability of six Atlantic shrub species. Folia Geobot. 2009, 44, 19–29. [Google Scholar] [CrossRef]
  161. Baeza, M.J.; Santana, V.M. Biological significance of dead biomass retention trait in Mediterranean Basin species: An analysis between different successional niches and regeneration strategies as functional groups. Plant Biol. 2015, 17, 1196–1202. [Google Scholar] [CrossRef] [PubMed]
  162. Fernández-Abascal, I.; Luis, E.; Tárrega, R.; Marcos, E. Trends in post-fire biomass recovery in an Erica australis heathland. In Fire and Biological Processes; Trabaud, L., Prodon, P., Eds.; Bachuys Publishers: Leiden, The Netherlands, 2002; pp. 33–42. [Google Scholar]
  163. Rey Castelao, O. Montes y Política Forestal en la Galicia del Antiguo Régimen; Monografías de la Universidad de Santiago de Compostela: Santiago de Compostela, Spain, 1995. [Google Scholar]
  164. Moreira, B.; Castellanos, M.C.; Pausas, J.G. Genetic component of flammability variation in a Mediterranean shrub. Mol. Ecol. 2014, 23, 1213–1223. [Google Scholar] [CrossRef] [PubMed]
  165. Pausas, J.G.; Alessio, G.A.; Moreira, B.; Corcobado, G. Fires enhance flammability in Ulex parviflorus. New Phytol. 2012, 193, 18–23. [Google Scholar] [CrossRef]
  166. Anderson, W.R.; Cruz, M.G.; Fernandes, P.M.; McCaw, L.; Vega, J.A.; Bradstock, R.A.; Fogarty, L.; Gould, J.; McCarthy, G.; Marsden-Smedley, J.B.; et al. A generic, empirical-based model for predicting rate of fire spread in shrublands. Int. J. Wildland Fire 2015, 24, 443–460. [Google Scholar] [CrossRef]
  167. Baeza, M.J.; Santana, V.M.; Pausas, J.G.; Vallejo, V.R. Successional trends in standing dead biomass in Mediterranean basin species. J. Veg. Sci. 2011, 22, 467–474. [Google Scholar] [CrossRef]
Figure 1. Geographical location of the 316 inventory plots in Galicia encompassing two shrub communities (left). Layout of inventory plot showing transects and location of four destructive sampling subplots (quadrats in green) in each inventory plot (right).
Fire 07 00126 g001
Figure 2. Three different families of WShr-t curves generated from the guide curve (red line) of the base model proposed by Korf (cited in Ludqvist [90]) for five different site indexes (1.5, 3, 4.5, 6 and 7.5 kg m−2 at a reference age of 10 years for gorse-dominated communities and 1, 2.5, 4, 5.5 and 7 kg m−2 at a reference age of 10 years for high heath-dominated communities).
Fire 07 00126 g002
Figure 3. WShr_G1–age curves (left column) and WShr_G1_dead–age curves (right column) for the SI corresponding to the guide curve (red) and five different site indexes: 1.5, 3, 4.5, 6 and 7.5 kg m−2 of WShr at a reference age of 10 years for gorse-dominated communities (upper row) and 1, 2.5, 4, 5.5 and 7 kg m−2 of WShr at a reference age of 10 years for high heath-dominated communities (lower row).
Fire 07 00126 g003aFire 07 00126 g003b
Table 1. Mean values of the standing shrub fuel strata characteristics. Std. dev. = standard deviation, n = number of plots, h S h r ¯ = shrub height, CovShr = shrub cover, WShr = total shrub fuel loadWShr_G23 = coarse shrub fuel load, WShr_G1 = fine shrub fuel load, WShr_G1_dead = dead fine shrub fuel load, WShr_G1_live = live fine shrub fuel load. See definitions in the text. Ea = high heath-dominated communities and Ue = gorse-dominated communities.
VariableStatisticUeEa
n165102
h S h r ¯ Mean123.56107.28
(cm)Std. dev.67.4369.72
CovShrMean858989.75
(%)Std. dev.22.5317.49
tMean9.368.00
(years)Std. dev.4.695.98
WShrMean3.492.40
(kg m−2)Std. dev.1.461.68
WShr_G23Mean1.330.91
(kg m−2)Std. dev.1.061.11
WShr_G1Mean2.161.49
(kg m−2)Std. dev.0.710.74
WShr_G1_deadMean0.850.41
(kg m−2)Std. dev.0.360.27
WShr_G1_liveMean1.311.08
(kg m−2)Std. dev.0.470.52
Table 2. Summary statistics of the physiographical and climate variables extracted from the raster datasets corresponding to the 267 sample plot locations. Standard deviations are shown in parentheses. Different letters indicate significant differences between mean values (α = 5%).
Species ElevationSlopePPsTTwmTcmP/T P s ¯ / T w m RdRds
U. europaeus572a11a1560a137a11.8a18.3a6.5a132.5a2.5a10.7a4.8a
n = 156(242)(7)(239)(19)(1.2)(1.0)(1.5)(20.0)(0.4)(2.2)(1.7)
range30–11130–351036–197592–1868.6–14.615.5–20.73–9.589.3–181.71.6–3.89.6–11.93.9–5.9
E. australis1005b18b1449b144b10.0b17.9b3.5b150.0b2.7b9.8b4.8a
n = 102(281)(9)(277)(28)(1.3)(1.3)(1.4)(43.9)(0.7)(2.1)(1.7)
range 497–17102–43873–200491–2116.1–12.314.4–20.8−0.6–6.271.0–272.51.5–4.18.6–10.73.9–5.9
Table 3. Parameter estimates and goodness-of-fit statistics for the three base models fitted to WShr-t data from gorse- and high heath-dominated communities.
Gorse-Dominated Communities
Modela0a1a2MERMSE
(kg m−2)
Hossfeld1.36340.3704---0.47921.0624
Korf3.0581−3.66460.32910.50831.0323
Bertalanffy–Richards8.14100.05220.85040.50731.0333
High Heath-Dominated Communities
Modela0a1a2MERMSE
(kg m−2)
Hossfeld2.82150.2965---0.73210.8801
Korf5.1644−6.54250.20700.75380.8436
Bertalanffy–Richards9.65990.04981.27650.75290.8453
Table 4. Mathematical expressions and goodness-of-fit statistics of the system of four equations fitted to estimate the biomass of the shrub fuel complex in gorse- and high heath-dominated communities using site index and age as independent variables.
Gorse-Dominated Communities
ModelMERMSE
(kg m−2)
W S h r _ G 1 = W S h r 1 + e x p 4.2327 + 1.0749 · l o g S I + 0.9766 · l o g t 0.69340.3949
W S h r _ G 23 = W S h r · e x p 4.2327 + 1.0749 · l o g S I + 0.9766 · l o g t 1 + e x p 4.2327 + 1.0749 · l o g S I + 0.9766 · l o g t 0.86300.3949
W S h r _ G 1 _ d e a d = W S h r _ G 1 1 + e x p 0.9153 0.2263 · l o g t 0.56990.2382
W S h r _ G 1 _ l i v e = W S h r _ G 1 · e x p 0.9153 0.2263 · l o g t 1 + e x p 0.9153 0.2263 · l o g t 0.48030.3426
High Heath-Dominated Communities
ModelMERMSE
(kg m−2)
W S h r _ G 1 = W S h r 1 + e x p 5.4793 + 1.0431 · l o g S I + 1.5572 · l o g t 0.85900.2792
W S h r _ G 23 = W S h r · e x p 5.4793 + 1.0431 · l o g S I + 1.5572 · l o g t 1 + e x p 5.4793 + 1.0431 · l o g S I + 1.5572 · l o g t 0.93770.2792
W S h r _ G 1 _ d e a d = W S h r _ G 1 1 + e x p 1.41553 0.2163 · l o g t 0.72910.1436
W S h r _ G 1 _ l i v e = W S h r _ G 1 · e x p 1.4155 0.2163 · l o g t 1 + e x p 1.4155 0.2163 · l o g t 0.77150.2505
Disclaimer/Publisher’s Note: The statements, opinions and data contained in all publications are solely those of the individual author(s) and contributor(s) and not of MDPI and/or the editor(s). MDPI and/or the editor(s) disclaim responsibility for any injury to people or property resulting from any ideas, methods, instructions or products referred to in the content.

