
Severe and Short Interval Fires Rearrange Dry Forest Fuel Arrays in South-Eastern Australia


 , , , , , , and
Abstract
1. Introduction
- Ground litter (surface fuels), tree canopy (canopy fuels) and tree bark (bark fuels) fuel load, cover and hazard will be highest after fires of low severities and long intervals due to lower rates of consumption during those fires;
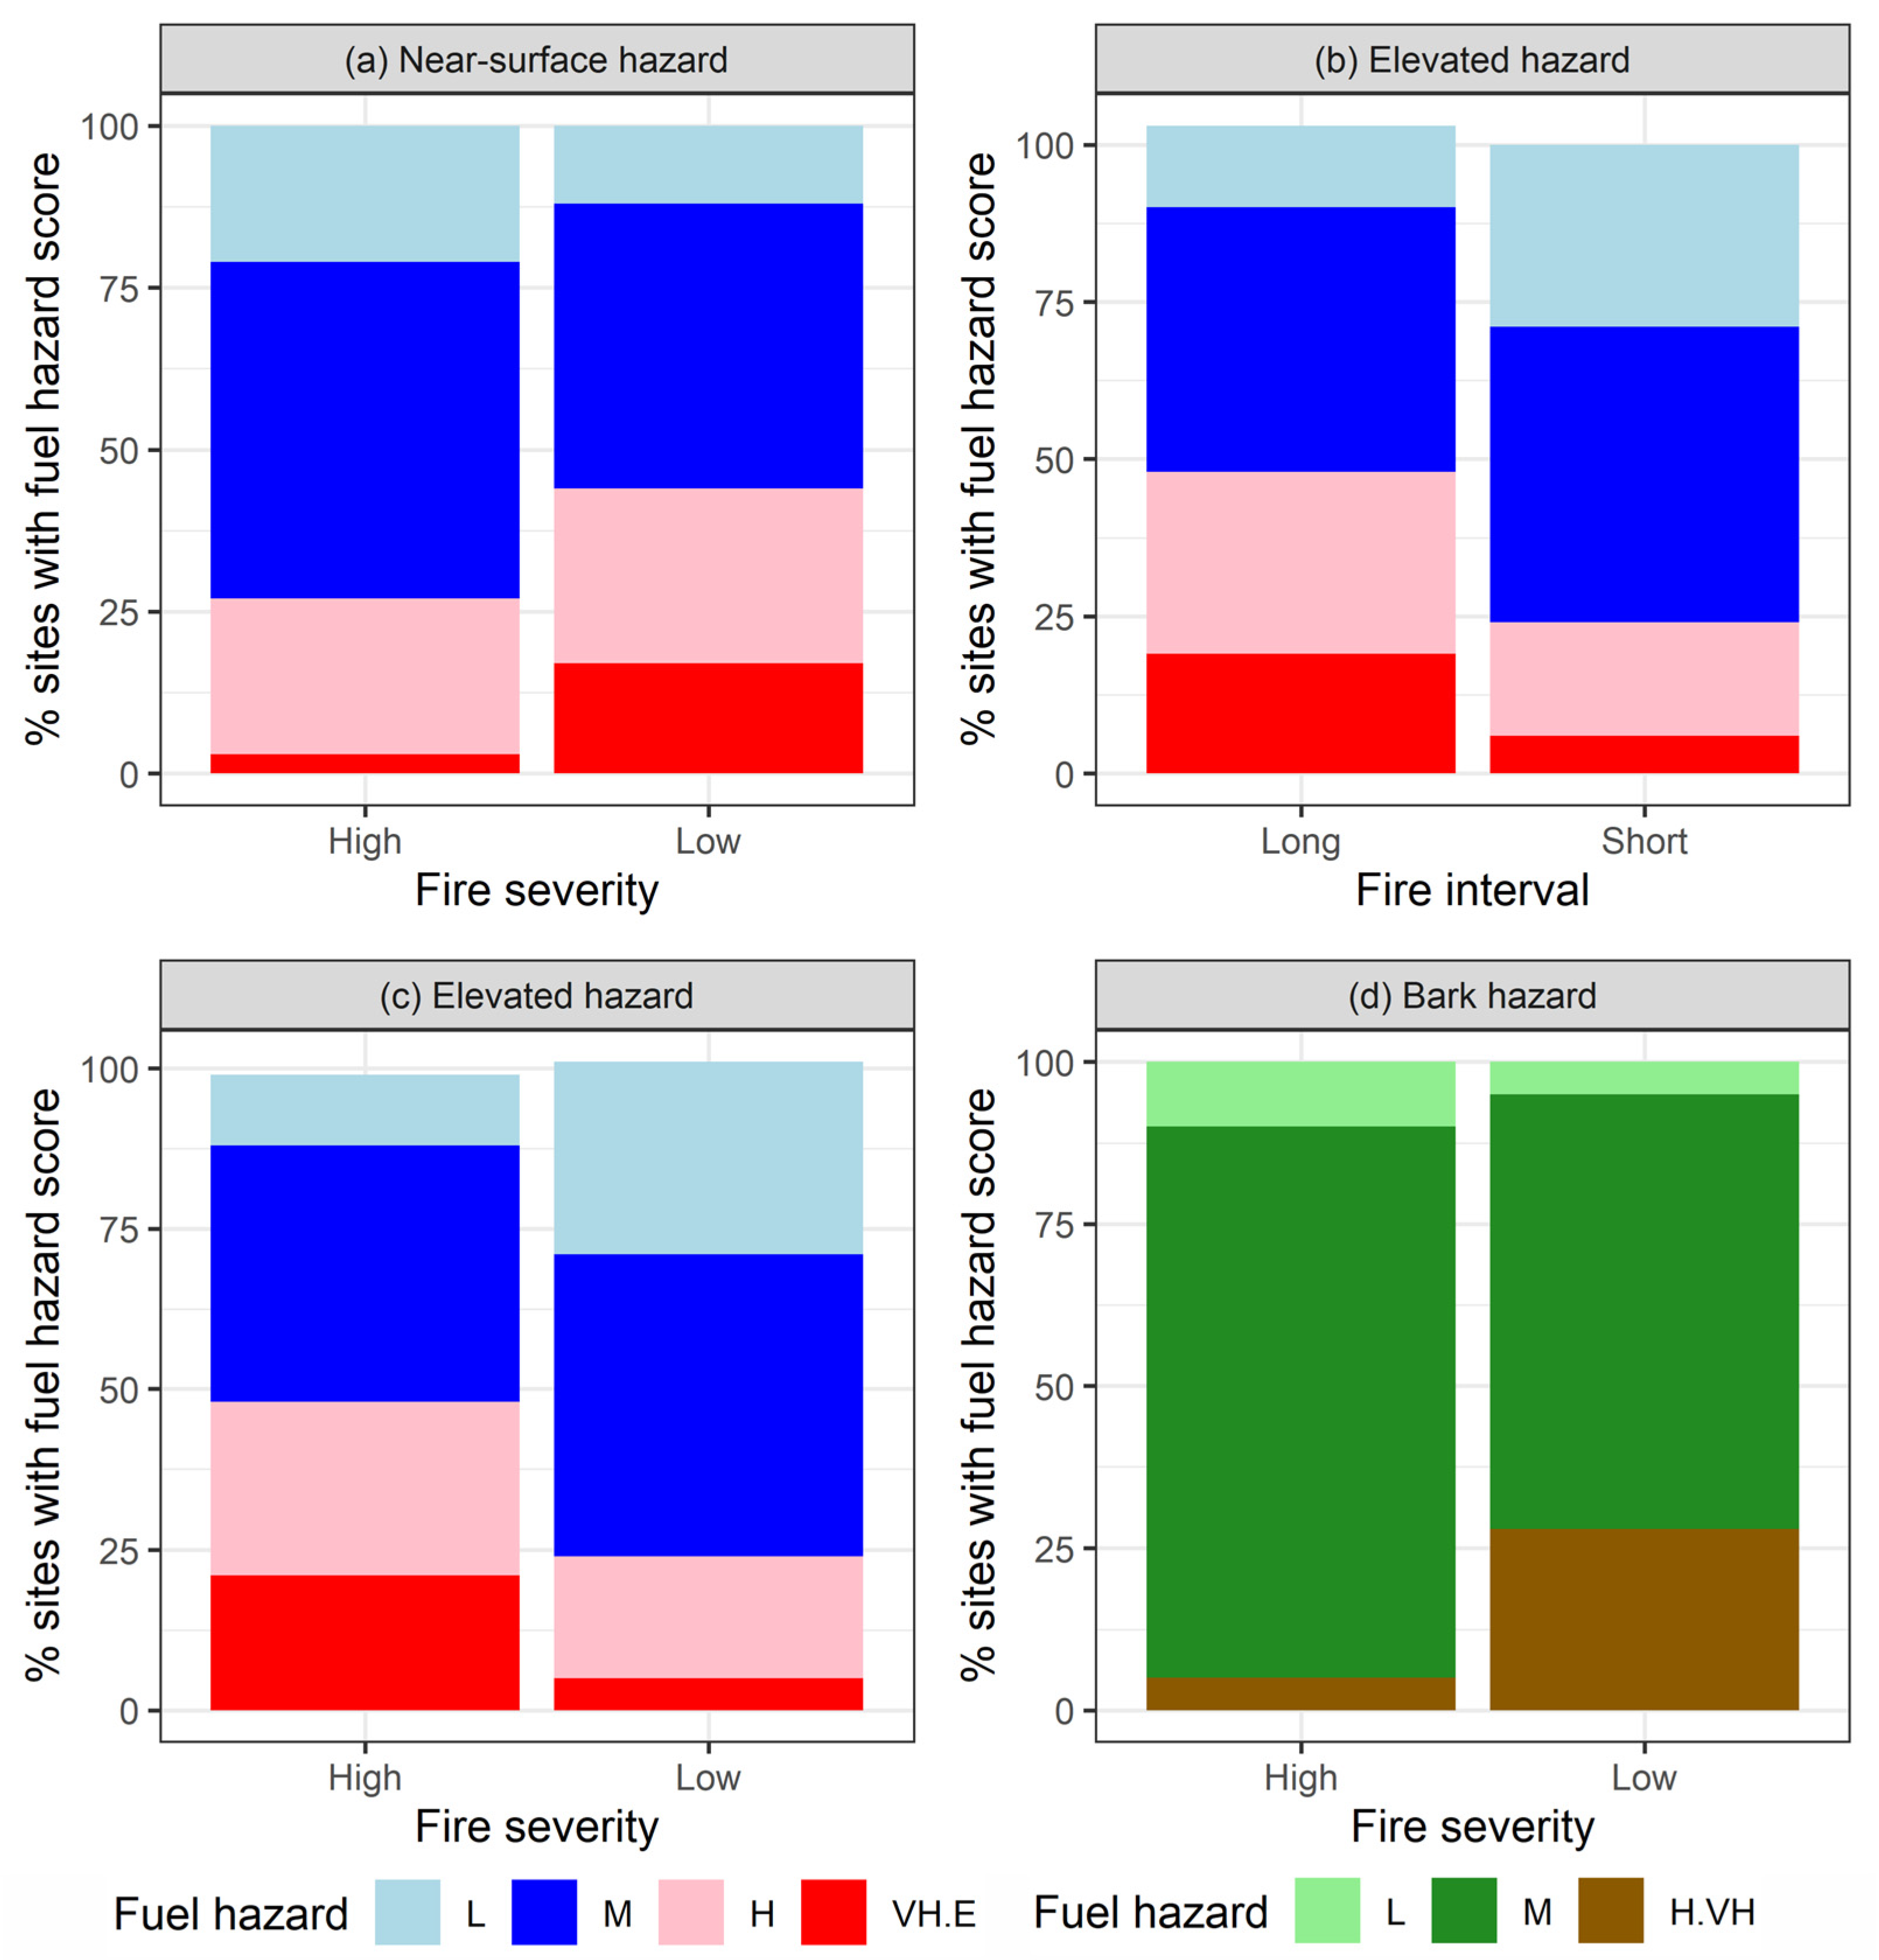
- Herbaceous (near-surface fuels) fuel cover and hazard will be highest after fires of high-severities and short-intervals due to selection for fast regenerating species;
- Midstorey (elevated fuels) fuel cover and hazard will be highest after fires of high fire severities due to fire-stimulated germination of shrubs, and lowest at short inter-fire intervals due to exhaustion of shrub seed and bud banks.
2. Materials and Methods
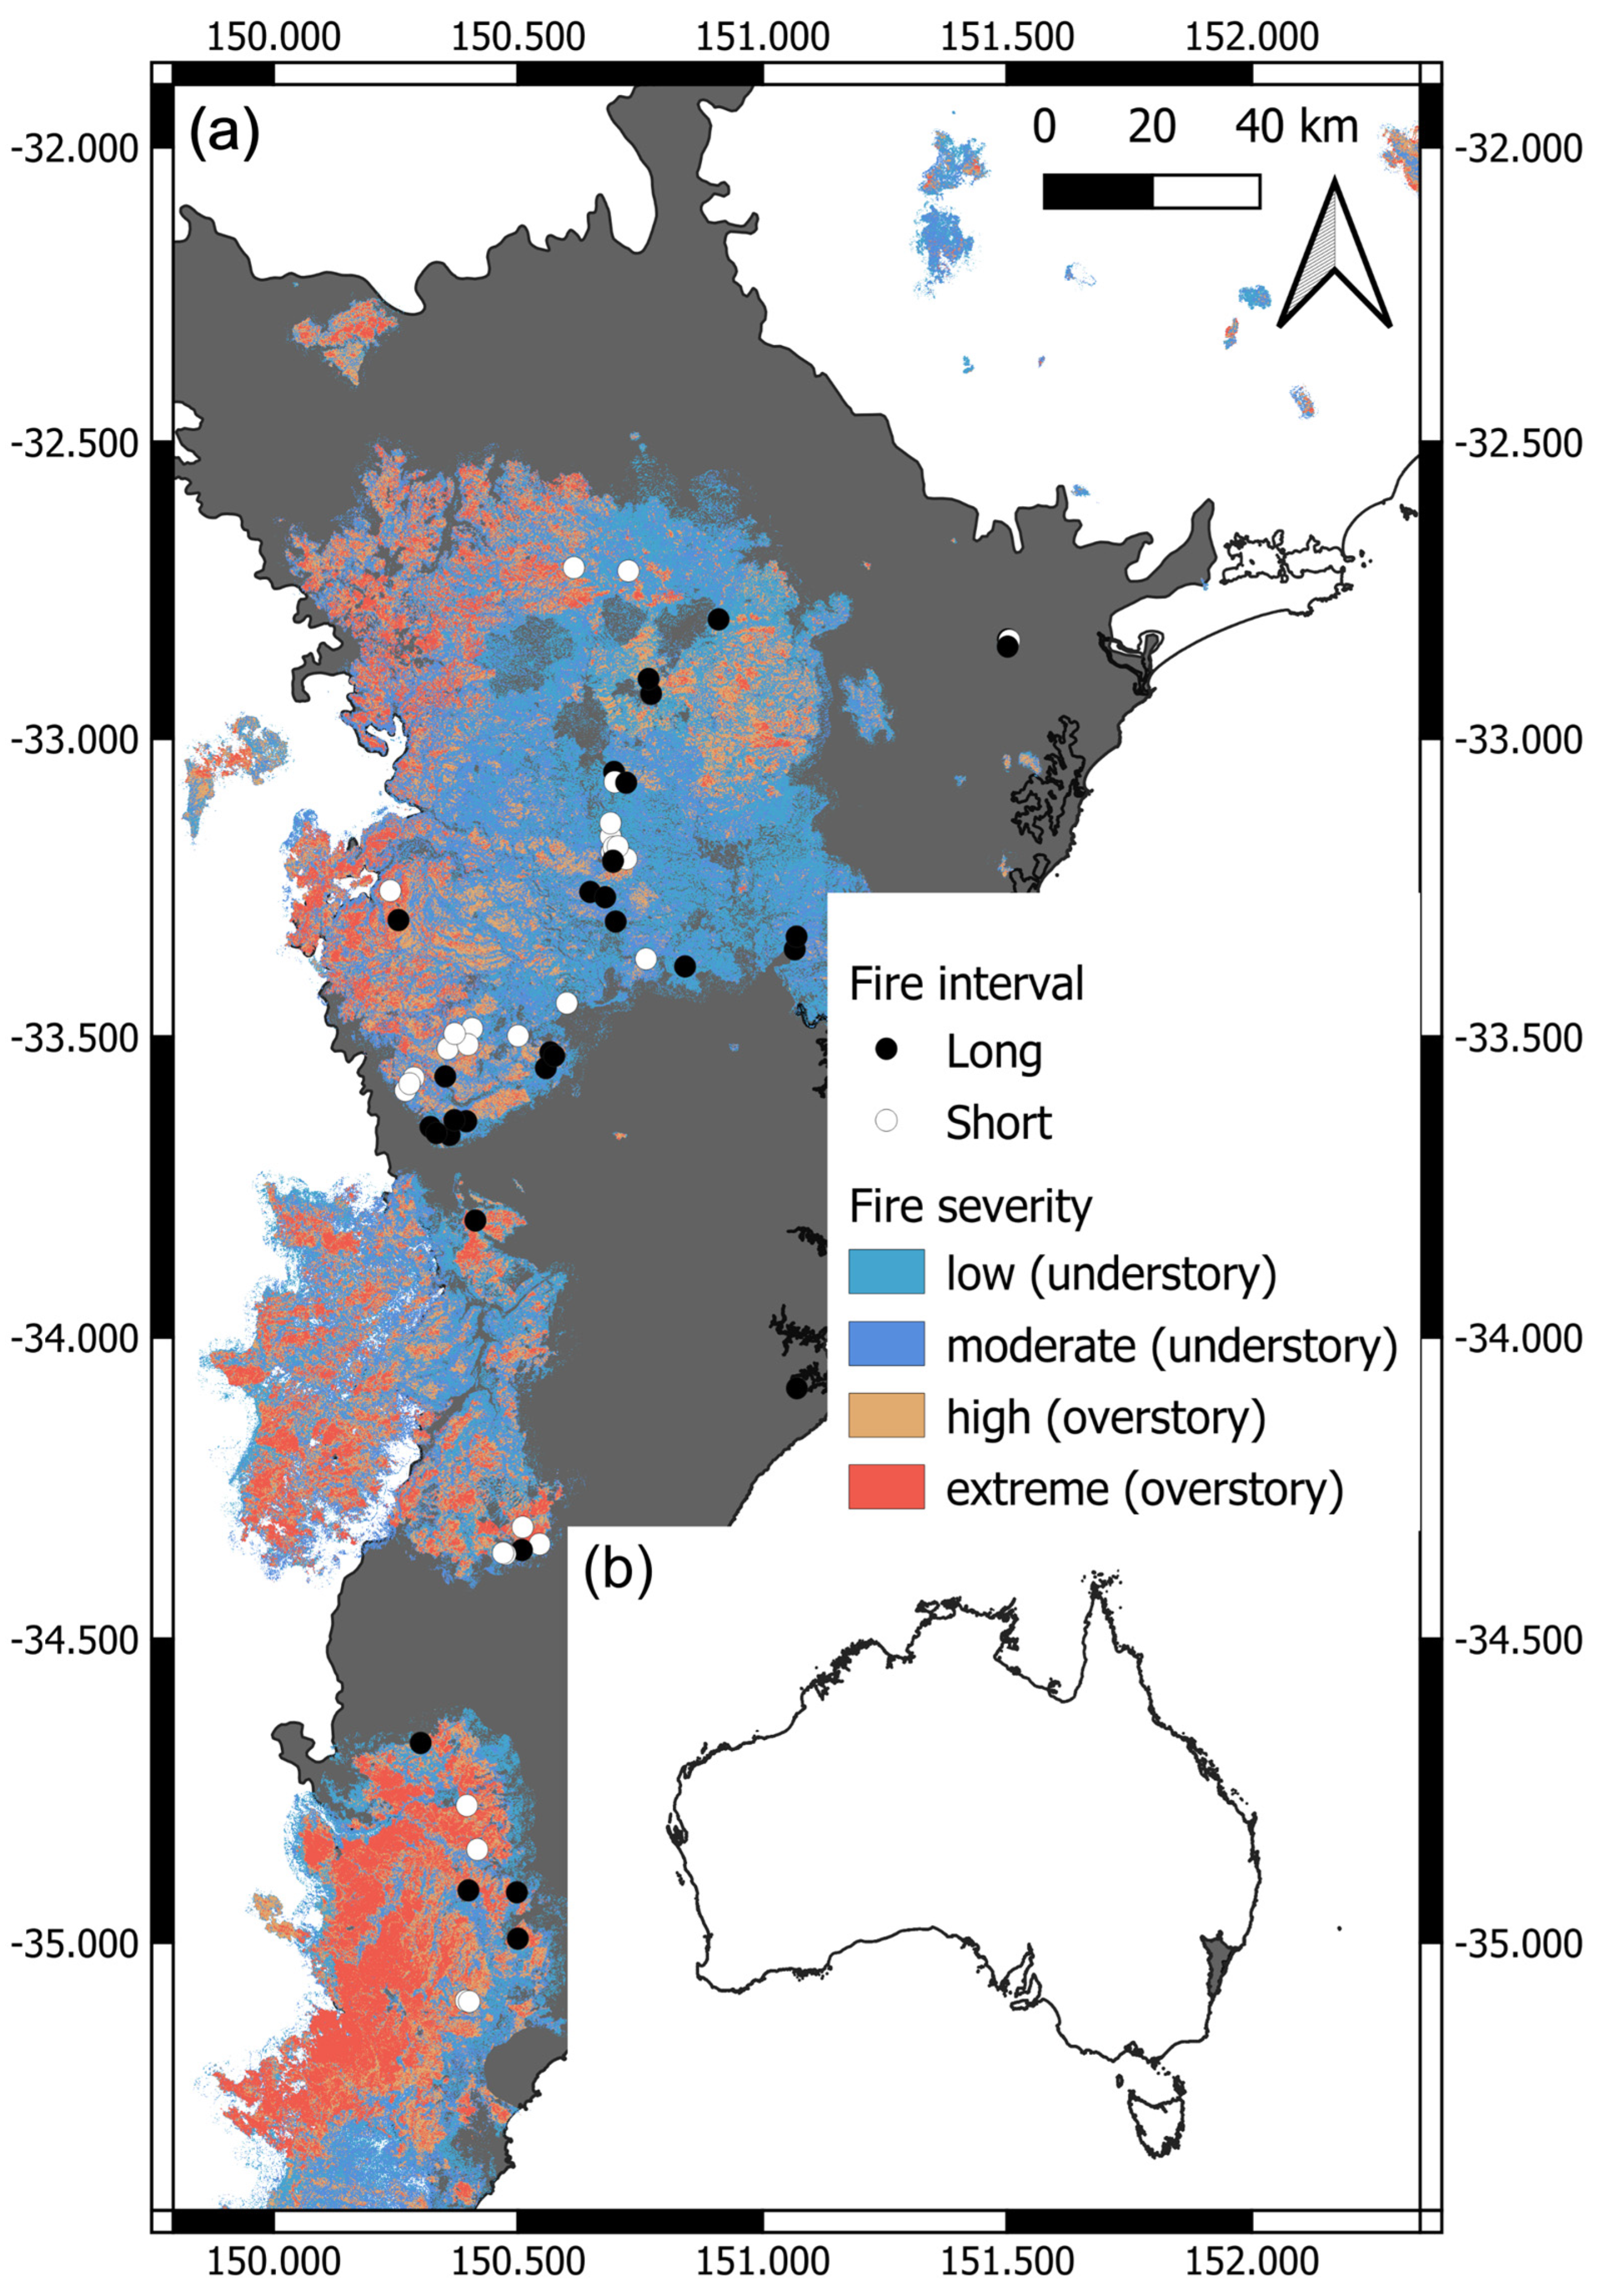
2.1. Study Area and Design
2.2. Surface Fuel Load
2.3. Fuel Cover, Connectivity and Height
2.4. Tree Basal Area
2.5. Fuel Hazard
2.6. Data Analyses
3. Results
4. Discussion
4.1. Fuel Recovery and Fire Hazard
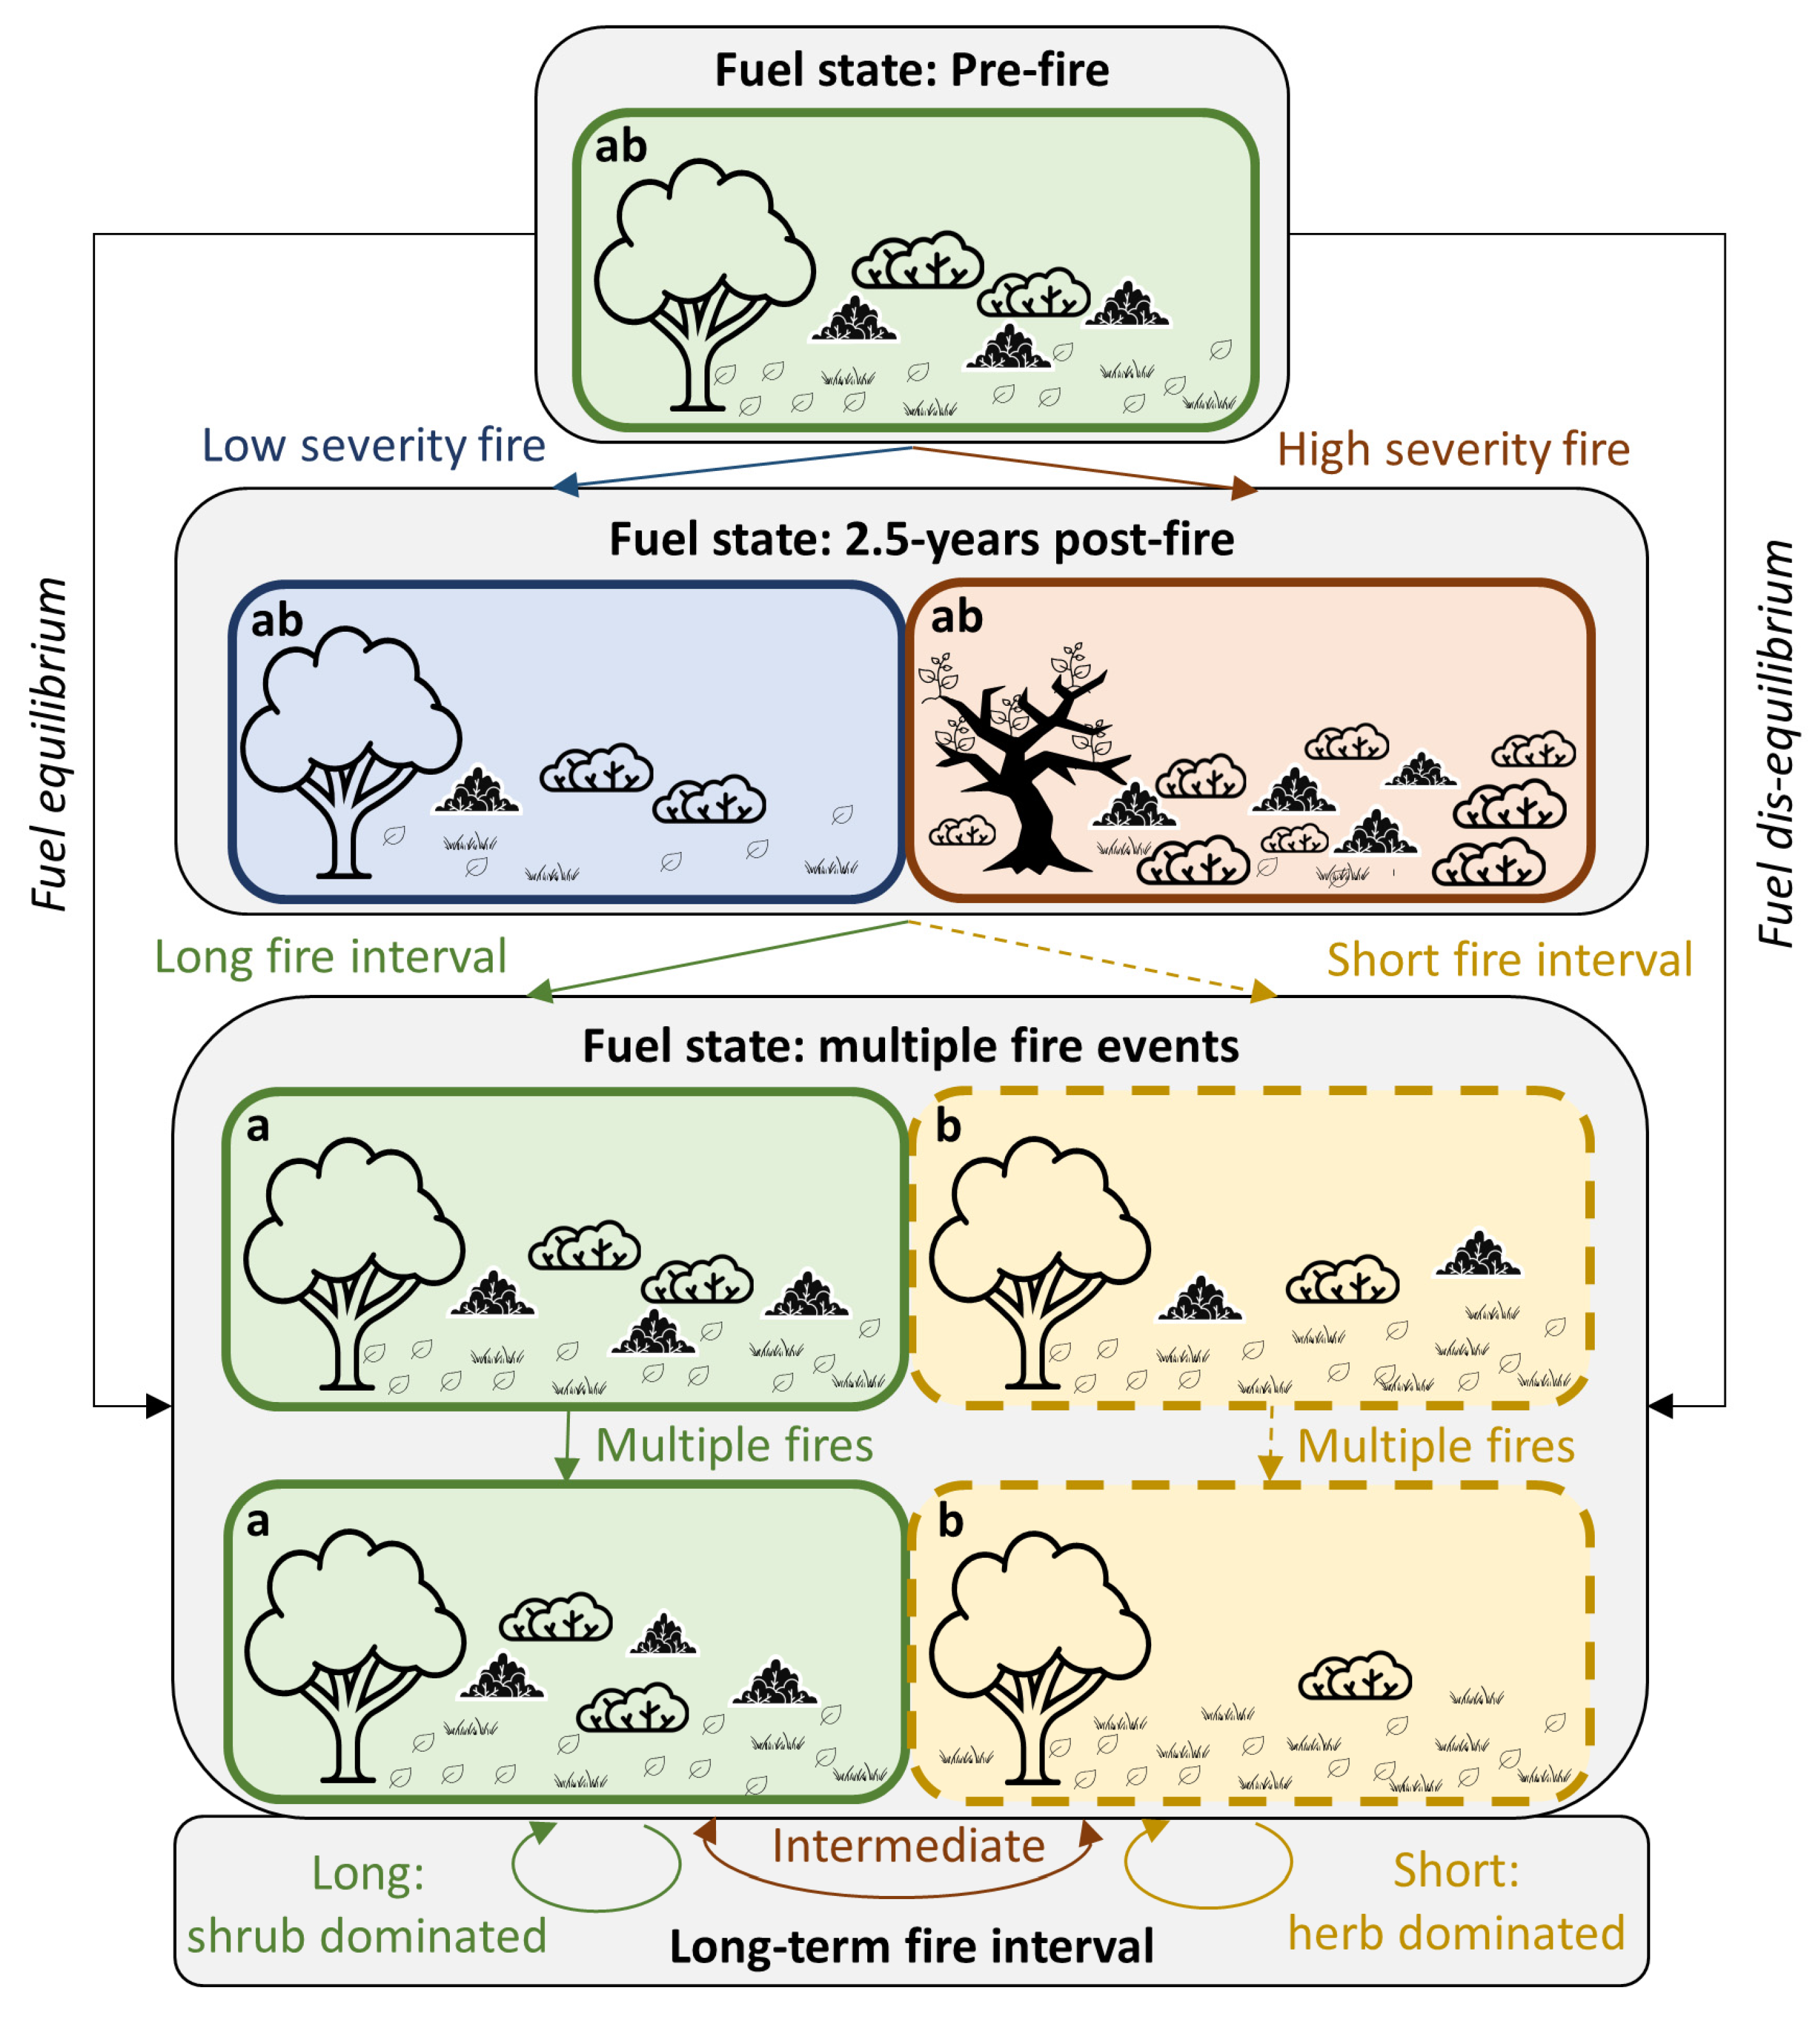
4.2. Future Fire Regimes and Fuel States
5. Conclusions
Author Contributions
Funding
Institutional Review Board Statement
Informed Consent Statement
Data Availability Statement
Acknowledgments
Conflicts of Interest
Appendix A

References
- Whitlock, C.; Higuera, P.E.; McWethy, D.B.; Briles, C.E. Paleoecological perspectives on fire ecology: Revisiting the fire-regime concept. Open Ecol. J. 2010, 16, 3. [Google Scholar]
- Keeley, J.E.; Pausas, J.G.; Rundel, P.W.; Bond, W.J.; Bradstock, R.A. Fire as an evolutionary pressure shaping plant traits. Trends Plant Sci. 2011, 16, 406–411. [Google Scholar] [CrossRef]
- Clarke, P.J.; Lawes, M.; Midgley, J.J.; Lamont, B.; Ojeda, F.; Burrows, G.; Enright, N.; Knox, K. Resprouting as a key functional trait: How buds, protection and resources drive persistence after fire. New Phytol. 2013, 197, 19–35. [Google Scholar] [CrossRef] [PubMed]
- Pausas, J.G. Generalized fire response strategies in plants and animals. Oikos 2019, 128, 147–153. [Google Scholar] [CrossRef]
- Pausas, J.G.; Keeley, J.E. Evolutionary ecology of resprouting and seeding in fire-prone ecosystems. New Phytol. 2014, 204, 55–65. [Google Scholar] [CrossRef]
- Ooi, M.K.; Denham, A.J.; Santana, V.M.; Auld, T.D. Temperature thresholds of physically dormant seeds and plant functional response to fire: Variation among species and relative impact of climate change. Ecol. Evol. 2014, 4, 656–671. [Google Scholar] [CrossRef]
- Abram, N.J.; Henley, B.J.; Sen Gupta, A.; Lippmann, T.J.; Clarke, H.; Dowdy, A.J.; Sharples, J.J.; Nolan, R.H.; Zhang, T.; Wooster, M.J. Connections of climate change and variability to large and extreme forest fires in southeast Australia. Commun. Earth Environ. 2021, 2, 8. [Google Scholar] [CrossRef]
- Jones, M.W.; Abatzoglou, J.T.; Veraverbeke, S.; Andela, N.; Lasslop, G.; Forkel, M.; Smith, A.J.; Burton, C.; Betts, R.A.; van der Werf, G.R. Global and regional trends and drivers of fire under climate change. Rev. Geophys. 2022, 60, e2020RG000726. [Google Scholar] [CrossRef]
- Xu, X.; Jia, G.; Zhang, X.; Riley, W.J.; Xue, Y. Climate regime shift and forest loss amplify fire in Amazonian forests. Glob. Change Biol. 2020, 26, 5874–5885. [Google Scholar] [CrossRef]
- Miller, G.; Friedel, M.; Adam, P.; Chewings, V. Ecological impacts of buffel grass (Cenchrus ciliaris L.) invasion in central Australia–does field evidence support a fire-invasion feedback? Rangel. J. 2010, 32, 353–365. [Google Scholar] [CrossRef]
- Wright, B.R.; Latz, P.K.; Albrecht, D.E.; Fensham, R.J. Buffel grass (Cenchrus ciliaris) eradication in arid central Australia enhances native plant diversity and increases seed resources for granivores. Appl. Veg. Sci. 2021, 24, e12533. [Google Scholar] [CrossRef]
- Tedim, F.; Leone, V.; Amraoui, M.; Bouillon, C.; Coughlan, M.R.; Delogu, G.M.; Fernandes, P.M.; Ferreira, C.; McCaffrey, S.; McGee, T.K. Defining extreme wildfire events: Difficulties, challenges, and impacts. Fire 2018, 1, 9. [Google Scholar] [CrossRef]
- Collins, L.; Bradstock, R.A.; Clarke, H.; Clarke, M.F.; Nolan, R.H.; Penman, T.D. The 2019/2020 mega-fires exposed Australian ecosystems to an unprecedented extent of high-severity fire. Environ. Res. Lett. 2021, 16, 044029. [Google Scholar] [CrossRef]
- Stephens, S.L.; Burrows, N.; Buyantuyev, A.; Gray, R.W.; Keane, R.E.; Kubian, R.; Liu, S.; Seijo, F.; Shu, L.; Tolhurst, K.G. Temperate and boreal forest mega-fires: Characteristics and challenges. Front. Ecol. Environ. 2014, 12, 115–122. [Google Scholar] [CrossRef]
- Abatzoglou, J.T.; Williams, A.P. Impact of anthropogenic climate change on wildfire across western US forests. Proc. Natl. Acad. Sci. USA 2016, 113, 11770–11775. [Google Scholar] [CrossRef] [PubMed]
- Grünig, M.; Seidl, R.; Senf, C. Increasing aridity causes larger and more severe forest fires across Europe. Glob. Change Biol. 2023, 29, 1648–1659. [Google Scholar] [CrossRef] [PubMed]
- Cunningham, C.X.; Williamson, G.J.; Nolan, R.H.; Teckentrup, L.; Boer, M.M.; Bowman, D.M. Pyrogeography in flux: Reorganization of Australian fire regimes in a hotter world. Glob. Change Biol. 2024, 30, e17130. [Google Scholar] [CrossRef]
- Sullivan, A.L.; McCaw, W.L.; Cruz, M.G.; Matthews, S.; Ellis, P.F. Fuel, fire weather and fire behaviour in Australian ecosystems. Flammable Aust. Fire Regimes Biodivers. Ecosyst. A Chang. World 2012, 51–77. [Google Scholar]
- Hines, F.; Hines, F.; Tolhurst, K.G.; Wilson, A.A.; McCarthy, G.J. Overall Fuel Hazard Assessment Guide; Victorian Government, Department of Sustainability and Environment Melbourne: Melbourne, Australia, 2010. [Google Scholar]
- Raison, R.; Woods, P.; Khanna, P. Dynamics of fine fuels in recurrently burnt eucalypt forests. Aust. For. 1983, 46, 294–302. [Google Scholar] [CrossRef]
- Walker, J. Fuel dynamics in Australian vegetation. In Fire and the Australian; Biota, A.M., Gill, R.H.G., Noble, I.R., Eds.; Australian Academy of Science: Canberra, Australia, 1981; p. 101. [Google Scholar]
- Cheney, N.P.; Gould, J.S.; McCaw, W.L.; Anderson, W.R. Predicting fire behaviour in dry eucalypt forest in southern Australia. For. Ecol. Manag. 2012, 280, 120–131. [Google Scholar] [CrossRef]
- Gill, A.; Christian, K.; Moore, P.; Forrester, R. Bushfire incidence, fire hazard and fuel reduction burning. Aust. J. Ecol. 1987, 12, 299–306. [Google Scholar] [CrossRef]
- Zylstra, P.; Bradstock, R.A.; Bedward, M.; Penman, T.D.; Doherty, M.D.; Weber, R.O.; Gill, A.M.; Cary, G.J. Biophysical mechanistic modelling quantifies the effects of plant traits on fire severity: Species, not surface fuel loads, determine flame dimensions in eucalypt forests. PLoS ONE 2016, 11, e0160715. [Google Scholar] [CrossRef] [PubMed]
- Fernandes, P.M. Empirical support for the use of prescribed burning as a fuel treatment. Curr. For. Rep. 2015, 1, 118–127. [Google Scholar] [CrossRef]
- Boer, M.M. Anatomy of a perfect storm—Australia’s ‘Black Summer’ forest fires. In Proceedings of the 1st International Electronic Conference on Forests—Forests for a Better Future: Sustainability, Innovation, Interdisciplinarity session Fire Risks and Other Natural Hazards, Basel, Switzerland, 15–30 November 2020. [Google Scholar] [CrossRef]
- Gallagher, R.V.; Allen, S.; Mackenzie, B.D.; Yates, C.J.; Gosper, C.R.; Keith, D.A.; Merow, C.; White, M.D.; Wenk, E.; Maitner, B.S. High fire frequency and the impact of the 2019–2020 megafires on Australian plant diversity. Divers. Distrib. 2021, 27, 1166–1179. [Google Scholar] [CrossRef]
- Graham, A.M.; Pringle, K.J.; Pope, R.J.; Arnold, S.R.; Conibear, L.A.; Burns, H.; Rigby, R.; Borchers-Arriagada, N.; Butt, E.W.; Kiely, L. Impact of the 2019/2020 Australian megafires on air quality and health. GeoHealth 2021, 5, e2021GH000454. [Google Scholar] [CrossRef] [PubMed]
- Ward, M.; Tulloch, A.I.; Radford, J.Q.; Williams, B.A.; Reside, A.E.; Macdonald, S.L.; Mayfield, H.J.; Maron, M.; Possingham, H.P.; Vine, S.J. Impact of 2019–2020 mega-fires on Australian fauna habitat. Nat. Ecol. Evol. 2020, 4, 1321–1326. [Google Scholar] [CrossRef] [PubMed]
- Australian Bureau of Meteorology. Climate Data Online. Available online: http://www.bom.gov.au/climate/data/ (accessed on 1 March 2023).
- Collins, L.; Clarke, H.; Clarke, M.F.; McColl Gausden, S.C.; Nolan, R.H.; Penman, T.; Bradstock, R. Warmer and drier conditions have increased the potential for large and severe fire seasons across south-eastern Australia. Glob. Ecol. Biogeogr. 2022, 31, 1933–1948. [Google Scholar] [CrossRef]
- Gordon, C.E.; Price, O.F.; Tasker, E.M. Mapping and exploring variation in post-fire vegetation recovery following mixed severity wildfire using airborne Li DAR. Ecol. Appl. 2017, 27, 1618–1632. [Google Scholar] [CrossRef] [PubMed]
- Hammill, K.; Penman, T.; Bradstock, R. Responses of resilience traits to gradients of temperature, rainfall and fire frequency in fire-prone, Australian forests: Potential consequences of climate change. Plant Ecol. 2016, 217, 725–741. [Google Scholar] [CrossRef]
- Price, O.H.; Nolan, R.H.; Samson, S.A. Fuel consumption rates in resprouting eucalypt forest during hazard reduction burns, cultural burns and wildfires. For. Ecol. Manag. 2022, 505, 119894. [Google Scholar] [CrossRef]
- Volkova, L.; Aparicio, A.G.W.; Weston, C.J. Fire intensity effects on post-fire fuel recovery in Eucalyptus open forests of south-eastern Australia. Sci. Total Environ. 2019, 670, 328–336. [Google Scholar] [CrossRef] [PubMed]
- Olson, J.S. Energy storage and the balance of producers and decomposers in ecological systems. Ecology 1963, 44, 322–331. [Google Scholar] [CrossRef]
- Pausas, J.G.; Keeley, J.E. Epicormic resprouting in fire-prone ecosystems. Trends Plant Sci. 2017, 22, 1008–1015. [Google Scholar] [CrossRef] [PubMed]
- Karna, Y.K.; Penman, T.D.; Aponte, C.; Hinko-Najera, N.; Bennett, L.T. Persistent changes in the horizontal and vertical canopy structure of fire-tolerant forests after severe fire as quantified using multi-temporal airborne lidar data. For. Ecol. Manag. 2020, 472, 118255. [Google Scholar] [CrossRef]
- NSW National Parks and Wildlife Service. The Sydney Basion Bioregion. In The Bioregions of New South Wales—Their Biodiversity, Conservation and History; NSW National Parks and Wildlife Service: Parramatta, Australia. Available online: https://www.environment.nsw.gov.au/-/media/OEH/Corporate-Site/Documents/Animals-and-plants/Bioregions/bioregions-sydney-basin.pdf (accessed on 1 March 2023).
- Keith, D.A. Ocean Shores to Desert Dunes: The Native Vegetation of New South Wales and the ACT; Department of Environment and Conservation (NSW): Sydney, Australia, 2004. [Google Scholar]
- NSW Department of Planning and Environment. Fire Extent and Severity Mapping (FESM). Available online: https://datasets.seed.nsw.gov.au/dataset/fire-extent-and-severity-mapping-fesm (accessed on 1 September 2023).
- Gibson, R.; Danaher, T.; Hehir, W.; Collins, L. A remote sensing approach to mapping fire severity in south-eastern Australia using sentinel 2 and random forest. Remote Sens. Environ. 2020, 240, 111702. [Google Scholar] [CrossRef]
- Kenny, B.; Sutherland, E.; Tasker, E.; Bradstock, R. Guidelines for Ecologically Sustainable Fire Management; NSW National Parks and Wildlife Service: Hurstville, Australia, 2004. [Google Scholar]
- NSW Department of Planning and Environment. Fire History Database of NSW. Available online: https://datasets.seed.nsw.gov.au/dataset/fire-history-wildfires-and-prescribed-burns-1e8b6 (accessed on 1 March 2023).
- Fox, J.; Weisberg, S.; Adler, D.; Bates, D.; Baud-Bovy, G.; Ellison, S.; Firth, D.; Friendly, M.; Gorjanc, G.; Graves, S. Package ‘Car’ Version 3.1–2; R Foundation for Statistical Computing: Vienna, Austria, 2012. [Google Scholar]
- Bates, D.; Maechler, M.; Bolker, B.; Walker, S.; Christensen, R.H.B.; Singmann, H.; Dai, B.; Scheipl, F.; Grothendieck, G. Package ‘lme4′ Version 1.1–7; R Foundation for Statistical Computing: Vienna, Austria, 2015. [Google Scholar]
- Barton, K.; Barton, M.K. Package ‘MuMIn’, Version 1.47.5; R Foundation for Statistical Computing: Vienna, Austria, 2015; Volume 1, p. 439. [Google Scholar]
- Christensen, R.H.B. Cumulative link models for ordinal regression with the R package ordinal. Submitt. J. Stat. Softw. 2018, 35, 1–46. [Google Scholar]
- Hammill, K.A.; Bradstock, R.A. Remote sensing of fire severity in the Blue Mountains: Influence of vegetation type and inferring fire intensity. Int. J. Wildland Fire 2006, 15, 213–226. [Google Scholar] [CrossRef]
- Enright, N.J.; Fontaine, J.B.; Bowman, D.M.; Bradstock, R.A.; Williams, R.J. Interval squeeze: Altered fire regimes and demographic responses interact to threaten woody species persistence as climate changes. Front. Ecol. Environ. 2015, 13, 265–272. [Google Scholar] [CrossRef]
- Nolan, R.H.; Collins, L.; Gibson, R.K.; Samson, S.A.; Rolls, K.T.; Milner, K.; Medlyn, B.E.; Price, O.F.; Griebel, A.; Choat, B. The carbon cost of the 2019–2020 Australian fires varies with fire severity and forest type. Glob. Ecol. Biogeogr. 2022, 31, 2131–2146. [Google Scholar] [CrossRef]
- Watson, P. Fuel Load Dynamics in NSW Vegetation–Part 1: Forests and Grassy Woodlands; Centre for Environmental Risk Management of Bushfires, University of Wollongong: Wollongong, Australia, 2012. [Google Scholar]
- Burrows, N.; McCaw, L. Prescribed burning in southwestern Australian forests. Front. Ecol. Environ. 2013, 11, e25–e34. [Google Scholar] [CrossRef]
- Price, O.F.; Penman, T.D.; Bradstock, R.A.; Boer, M.M.; Clarke, H. Biogeographical variation in the potential effectiveness of prescribed fire in south-eastern Australia. J. Biogeogr. 2015, 42, 2234–2245. [Google Scholar] [CrossRef]
- Collins, L.; Bennett, A.F.; Leonard, S.W.; Penman, T.D. Wildfire refugia in forests: Severe fire weather and drought mute the influence of topography and fuel age. Glob. Change Biol. 2019, 25, 3829–3843. [Google Scholar] [CrossRef] [PubMed]
- Gould, J.S.; McCaw, W.; Cheney, N.; Ellis, P.F.; Knight, I.; Sullivan, A.L. Project Vesta: Fire in Dry Eucalypt Forest: Fuel Structure, Fuel Dynamics and Fire Behaviour; Csiro Publishing: Clayton, Australia, 2008. [Google Scholar]
- Cruz, M.G.; Cheney, N.P.; Gould, J.S.; McCaw, W.L.; Kilinc, M.; Sullivan, A.L. An empirical-based model for predicting the forward spread rate of wildfires in eucalypt forests. Int. J. Wildland Fire 2021, 31, 81–95. [Google Scholar] [CrossRef]
- Storey, M.A.; Bedward, M.; Price, O.F.; Bradstock, R.A.; Sharples, J.J. Derivation of a Bayesian fire spread model using large-scale wildfire observations. Environ. Model. Softw. 2021, 144, 105127. [Google Scholar] [CrossRef]
- Zylstra, P.; Wardell-Johnson, G.; Falster, D.; Howe, M.; McQuoid, N.; Neville, S. Mechanisms by which growth and succession limit the impact of fire in a south-western Australian forested ecosystem. Funct. Ecol. 2023, 37, 1350–1365. [Google Scholar] [CrossRef]
- McColl-Gausden, S.C.; Bennett, L.T.; Clarke, H.G.; Ababei, D.A.; Penman, T.D. The fuel-climate-fire conundrum: How will fire regimes change in temperate eucalypt forests under climate change? Glob. Change Biol. 2022, 28, 5211–5226. [Google Scholar] [CrossRef] [PubMed]
- Cruz, M.G.; Alexander, M.E.; Fernandes, P.M. Evidence for lack of a fuel effect on forest and shrubland fire rates of spread under elevated fire danger conditions: Implications for modelling and management. Int. J. Wildland Fire 2022, 31, 471–479. [Google Scholar] [CrossRef]
- Kirono, D.G.; Round, V.; Heady, C.; Chiew, F.H.; Osbrough, S. Drought projections for Australia: Updated results and analysis of model simulations. Weather. Clim. Extrem. 2020, 30, 100280. [Google Scholar] [CrossRef]
- Freeman, D.; Williamson, B.; Weir, J. Cultural burning and public sector practice in the Australian Capital Territory. Aust. Geogr. 2021, 52, 111–129. [Google Scholar] [CrossRef]


| Fuel Strata | Response Variable | Predictor Variables | Fit | |||
|---|---|---|---|---|---|---|
| Severity | Interval | Vegetation | TBA | |||
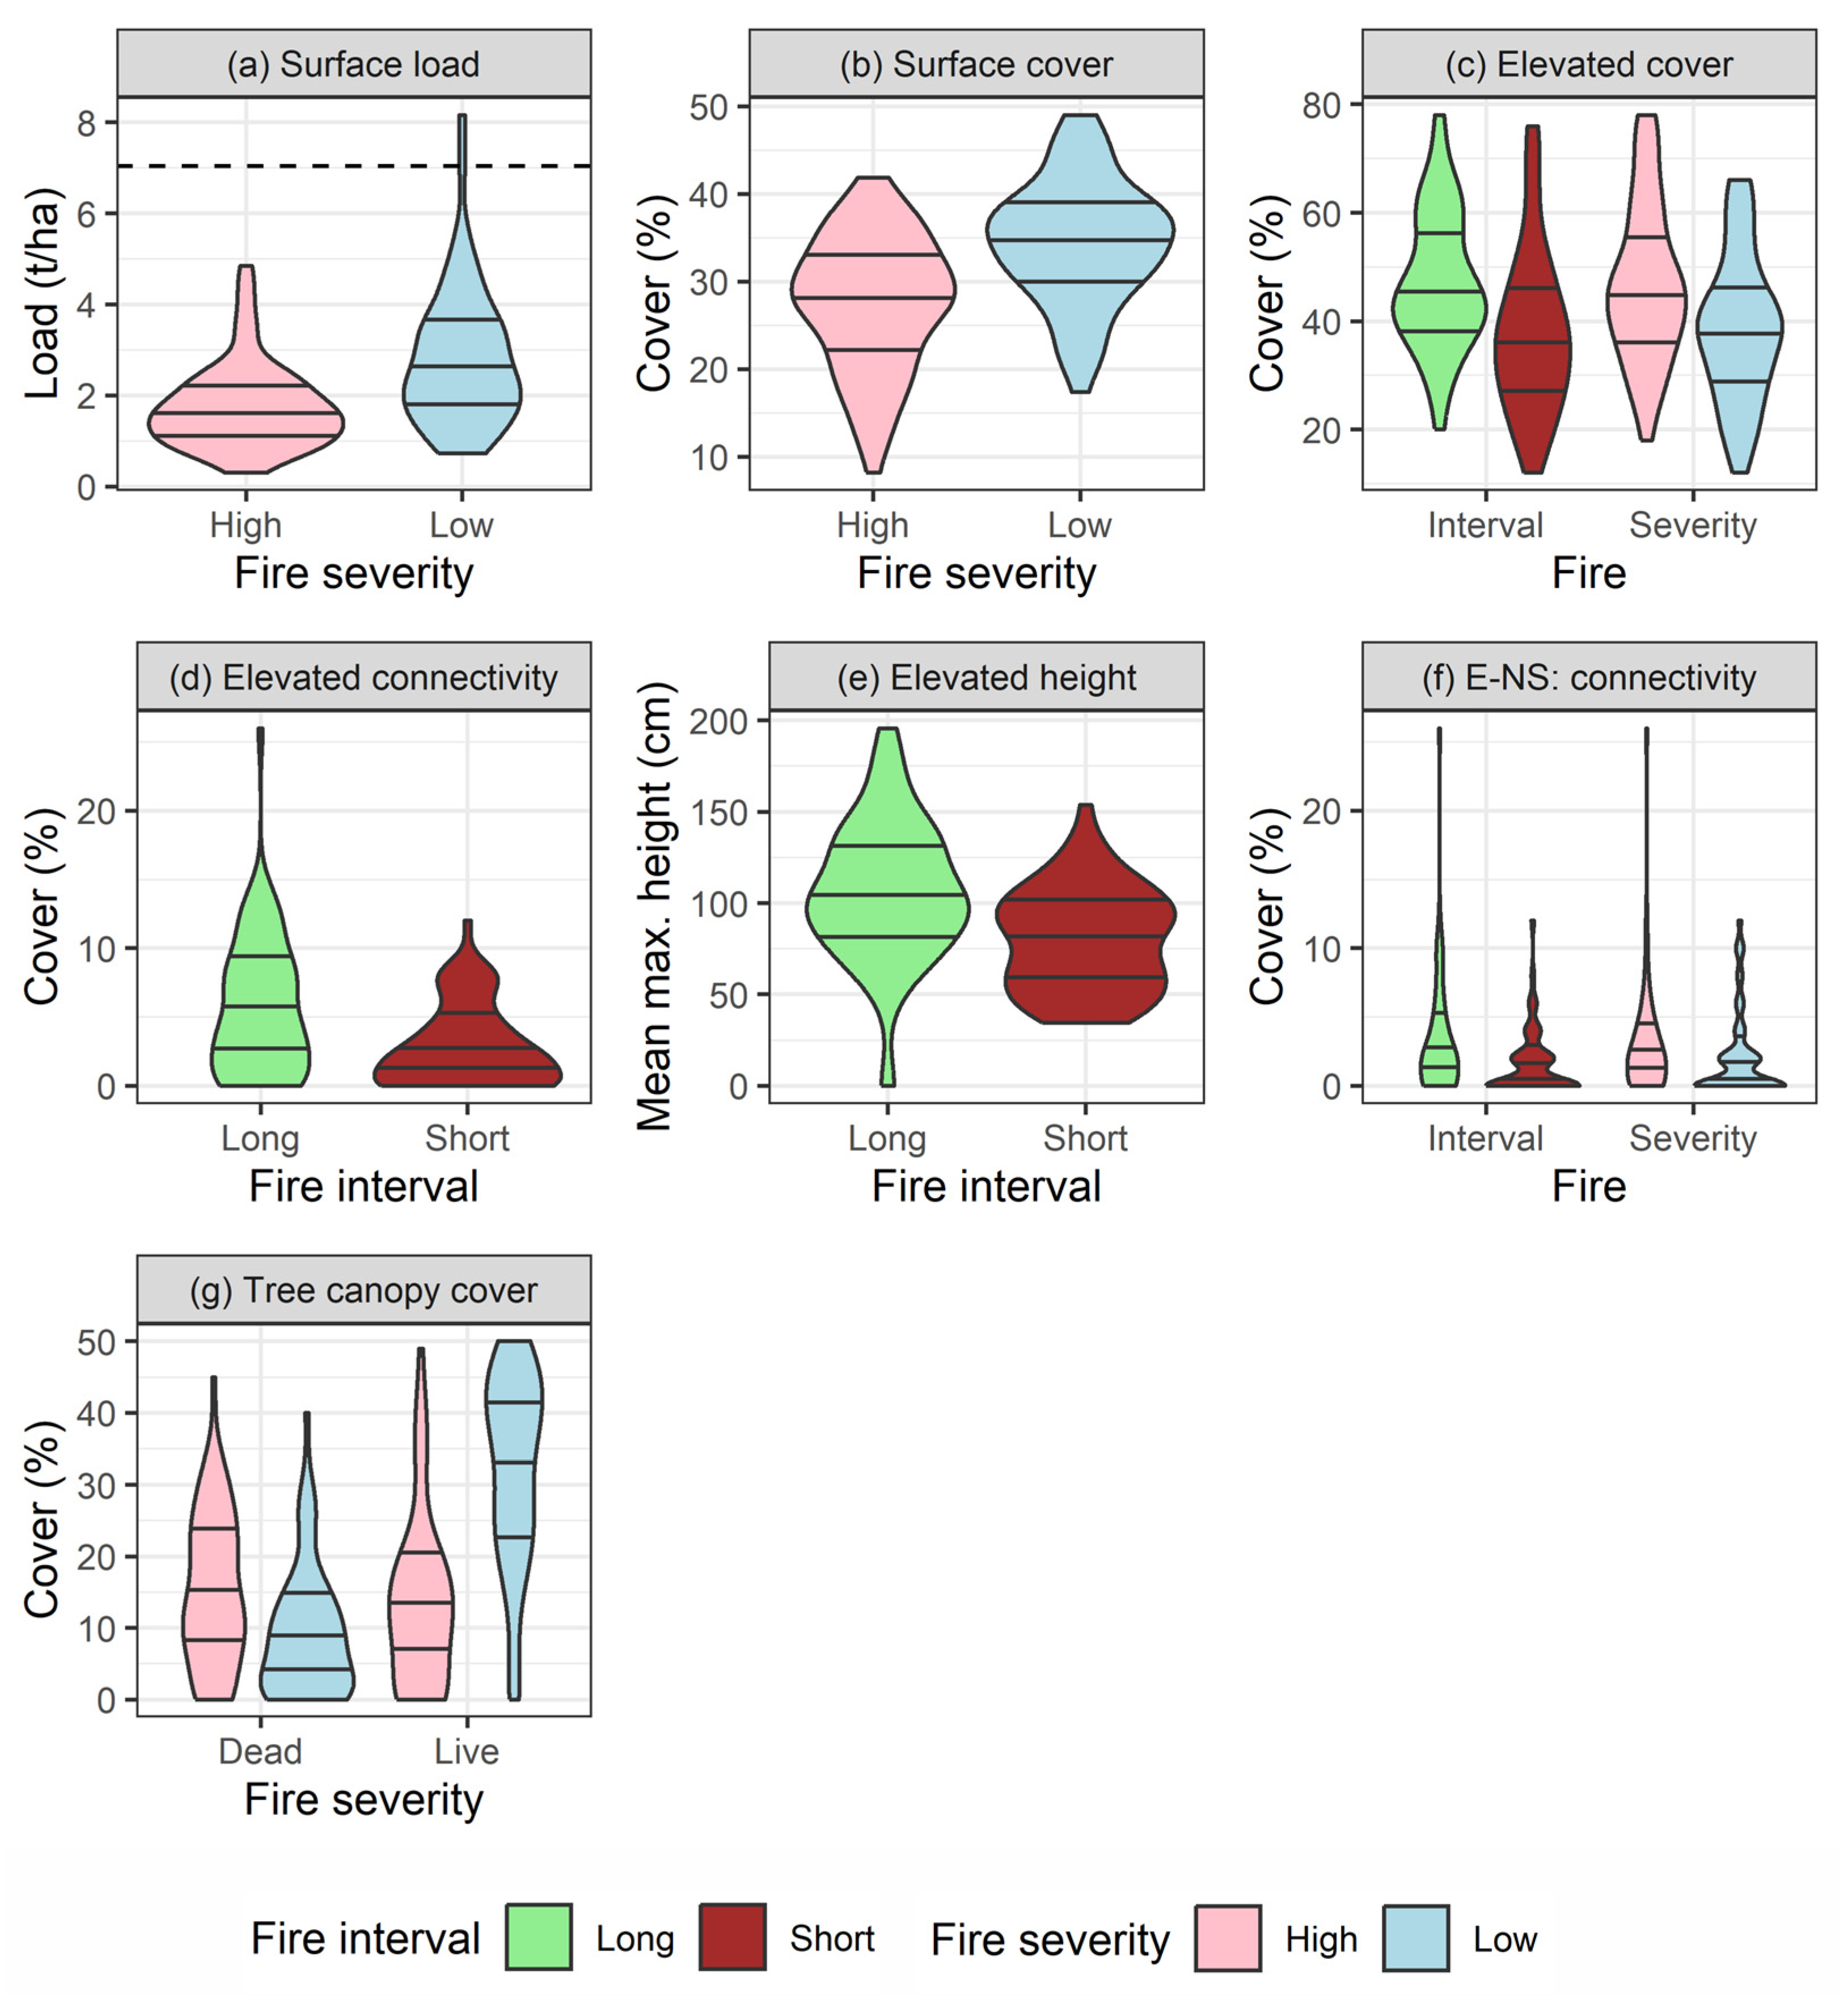
| Surface | Fuel load (tha−1) | 9.99 ** | <0.01 | 6.05 | 6.33 * | 0.26 |
| Surface | Fuel cover (%) | 18.08 *** | 0.01 | 9.41 * | 0.13 | 0.27 |
| Surface | Mean litter depth (mm) | 0.42 | 1.02 | 2.65 | <0.01 | 0.05 |
| Surface | Fuel hazard (l, m, h, vh/e) | 2.07 | 0.11 | 3.04 | 1.06 | - |
| Near-surface | Fuel cover (%) | 0.05 | 2.31 | 3.31 | 0.17 | 0.08 |
| Near-surface | Fuel vertical connectivity (%) | 0.45 | 2.19 | 8.00 * | 0.56 | 0.14 |
| Near-surface | Fuel hazard (l, m, h, vh/e) | 4.27 * | 0.52 | 9.99 * | 0.41 | - |
| Elevated | Fuel cover (%) | 9.96 ** | 11.47 *** | 13.24 ** | 0.53 | 0.28 |
| Elevated | Fuel vertical connectivity (%) | 1.92 | 15.75 *** | 18.09 *** | 0.94 | 0.35 |
| Elevated | Mean maximum fuel height (cm) | 1.14 | 12.26 *** | 4.38 | 0.12 | 0.19 |
| Elevated | Fuel hazard (l, m, h, vh/e) | 9.22 ** | 6.58 * | 3.68 | 0.152 | - |
| Near surface–Elevated | Fuel vertical connectivity (%) | 3.94 * | 7.22 ** | 12.73 ** | 0.34 | 0.34 |
| Canopy | Live fuel cover (%) | 38.93 *** | 0.86 | 7.26 | 0.04 | 0.42 |
| Canopy | Dead fuel cover (%) | 5.78 * | 0.61 | 4.84 | 1.44 | 0.14 |
| Bark | Fuel hazard (l, m, h/vh) | 6.94 ** | 3.66 | 7.29 | 1.20 | - |
Disclaimer/Publisher’s Note: The statements, opinions and data contained in all publications are solely those of the individual author(s) and contributor(s) and not of MDPI and/or the editor(s). MDPI and/or the editor(s) disclaim responsibility for any injury to people or property resulting from any ideas, methods, instructions or products referred to in the content. |
© 2024 by the authors. Licensee MDPI, Basel, Switzerland. This article is an open access article distributed under the terms and conditions of the Creative Commons Attribution (CC BY) license (https://creativecommons.org/licenses/by/4.0/).
Share and Cite
Gordon, C.E.; Nolan, R.H.; Boer, M.M.; Bendall, E.R.; Williamson, J.S.; Price, O.F.; Kenny, B.J.; Taylor, J.E.; Denham, A.J.; Bradstock, R.A. Severe and Short Interval Fires Rearrange Dry Forest Fuel Arrays in South-Eastern Australia. Fire 2024, 7, 130. https://doi.org/10.3390/fire7040130
Gordon CE, Nolan RH, Boer MM, Bendall ER, Williamson JS, Price OF, Kenny BJ, Taylor JE, Denham AJ, Bradstock RA. Severe and Short Interval Fires Rearrange Dry Forest Fuel Arrays in South-Eastern Australia. Fire. 2024; 7(4):130. https://doi.org/10.3390/fire7040130
Chicago/Turabian StyleGordon, Christopher E., Rachael H. Nolan, Matthias M. Boer, Eli R. Bendall, Jane S. Williamson, Owen F. Price, Belinda J. Kenny, Jennifer E. Taylor, Andrew J. Denham, and Ross A. Bradstock. 2024. "Severe and Short Interval Fires Rearrange Dry Forest Fuel Arrays in South-Eastern Australia" Fire 7, no. 4: 130. https://doi.org/10.3390/fire7040130
APA StyleGordon, C. E., Nolan, R. H., Boer, M. M., Bendall, E. R., Williamson, J. S., Price, O. F., Kenny, B. J., Taylor, J. E., Denham, A. J., & Bradstock, R. A. (2024). Severe and Short Interval Fires Rearrange Dry Forest Fuel Arrays in South-Eastern Australia. Fire, 7(4), 130. https://doi.org/10.3390/fire7040130