

Research on the Exposure Risk Analysis of Wildfires with a Spatiotemporal Knowledge Graph
by
 , , , , ,
Xingtong Ge
1,2,
Ling Peng
1,2,*,
Yi Yang
3,
Yinda Wang
1,4,
Deyue Chen
1,2 ,
,
Lina Yang
1,2,
Weichao Li
1 and
Jiahui Chen
1,2 1
Aerospace Information Research Institute, Chinese Academy of Sciences, Beijing 100049, China
2
College of Resources and Environment (CRE), University of Chinese Academy of Sciences, Beijing 100049, China
3
Institute of Automation, Chinese Academy of Sciences, Beijing 100049, China
4
School of Electronic, Electrical and Communication Engineering (EECE), University of Chinese Academy of Sciences, Beijing 100049, China
*
Author to whom correspondence should be addressed.
Fire 2024, 7(4), 131; https://doi.org/10.3390/fire7040131
Submission received: 21 October 2023
/
Revised: 1 April 2024
/
Accepted: 4 April 2024
/
Published: 11 April 2024
(This article belongs to the Special Issue The Use of Remote Sensing Technology for Forest Fire)
Abstract
:This study focuses on constructions that are vulnerable to fire hazards during wildfire events, and these constructions are known as ‘exposures’, which are an increasingly significant area of disaster research. A key challenge lies in estimating dynamically and comprehensively the risk that individuals are exposed to during wildfire spread. Here, ‘exposure risk’ denotes the potential threat to exposed constructions from fires within a future timeframe. This paper introduces a novel method that integrates a spatiotemporal knowledge graph with wildfire spread data and an exposure risk analysis model to address this issue. This approach enables the semantic integration of varied and heterogeneous spatiotemporal data, capturing the dynamic nature of wildfire propagation for precise risk analysis. Empirical tests are employed for the study area of Xichang, Sichuan Province, using real-world data to validate the method’s efficacy in merging multiple data sources and enhancing the accuracy of exposure risk analysis. Notably, this approach also reduces the time complexity from to .
1. Introduction
Wildfires are a significant threat among natural disasters and have been increasingly affecting our society and environment. In the European Union, more than USD 60.5 billion in damages has been incurred in communities over the past two decades, resulting in more than 600 casualties, including firefighters and civilians [1]. In 2020, the United States experienced wildfires that caused damages totaling USD 16.5 billion, with California alone experiencing damage or destruction to more than 10,000 structures [2]. Moreover, Liangshan Prefecture in China’s Sichuan Province experienced successive wildfires in 2019 and 2020, leading to injuries and the loss of numerous rescue personnel [3,4].
The United Nations Office for Disaster Risk Reduction (UNDRR) characterizes ‘exposure’ as the presence of people, infrastructure, housing, production capacities, and other tangible human assets in hazard-prone areas [5]. According to the definition of ‘exposure’ by The United Nations Office for Disaster Risk Reduction, we have chosen specific elements for in-depth study in this research. Therefore, in our study, ‘exposure’ primarily refers to constructions that may be damaged in wildfire-affected environments. These constructions include buildings (as part of the tangible human assets mentioned by UNDRR) and roads (as part of the infrastructure mentioned by UNDRR). This research aims to analyze the spatiotemporal risks to buildings and roads near wildfires and make wildfire spread predictions. Such analysis could significantly refine the strategies for emergency response and evacuation during wildfire emergencies, thereby helping stakeholders in risk mitigation endeavors.
Understanding spatiotemporal risk analysis for exposures necessitates acquiring detailed spatial distribution information on these exposures. Extensive research has focused on the spatial distribution of these substances. Traditional methods, such as on-site surveys conducted by local authorities followed by the generation of comprehensive reports, have been important for documenting this information [6,7,8]. However, this approach is both expensive and time-consuming. Advancements in aerospace and sensor technologies have significantly improved the quality of ground imagery, enabling the capture of all-weather, omnidirectional, and real-time data [9]. Consequently, remote sensing techniques have become increasingly popular for quickly gathering spatial distribution data on exposures. For example, Torres et al. [10] combined LiDAR data with aerial images from the Spanish National Plan of Aerial Orthophotography to extract building coverage and characteristics, applying machine learning to assess seismic vulnerability. Gonzalez et al. [11] successfully used convolutional neural networks (CNNs) to automatically detect building materials and types of lateral load-resisting systems, achieving high accuracy and recall rates. Additionally, many studies have concentrated on extracting post-disaster information about damaged buildings. Qing et al. [12] developed a CNN-based hierarchical building damage assessment process, while Ismail and Awad [13] introduced a graph-based building damage detection method that leverages knowledge of adjacent structures. Notably, some related research, such as that by Beverly et al. [14], closely associates fire exposure with fuel, devising a metric for fire exposure risk based on the proximity of grid cells to combustible materials.
The subjects of this study were buildings and roads, two critical exposure types in wildfires. In scenarios where wildfires are actively spreading, the risk of buildings catching fire is closely associated with personal safety, while the risk of roads catching fire is vital for formulating rescue and evacuation strategies [15,16]. Therefore, our research aims to predict which buildings and roads are at risk of ignition in wildfire scenarios.
Remote sensing technology, as previously discussed, plays a pivotal role in facilitating the extraction of spatial distribution data of exposures on a large scale and with rapid efficiency. Considerable research has leveraged remote sensing techniques to obtain detailed distribution data for buildings and roads. Our team has made contributions in this area by developing a robust methodology for the extraction of building and road data using advanced remote sensing technology [17,18,19,20,21].
Considering the dynamic nature of wildfires both temporally and spatially, acquiring information on the spatial distribution of fire scene exposures is only an initial step. Early detection of fires is crucial [22,23]; however, to enable accurate assessment of the associated spatiotemporal risks, it is imperative to conduct in-depth research into the spread patterns of wildfires.
Recent research has increasingly concentrated on analyzing wildfire spread trends. Li et al. [24] introduced a method to simulate wildfire spread using a long short-term memory (LSTM) cellular automaton model, integrating S-LSTM to account for the temporal dynamics of fire behavior and its interaction with wind. Wu et al. [25] developed a neural network-based fire propagation model that incorporates a range of physical and environmental factors and is suitable for predicting fire spread in medium- to large-scale forest areas. Furthermore, Khakzad [26] explored wildfire spread risk assessment at the wildland–industrial interface using dynamic Bayesian networks combined with models predicting wildfire behavior. These studies provide a robust technical basis for the precise prediction of wildfire spread.
A major challenge in wildfire management is the accurate prediction of the areas (exposures) that will be impacted and the timing of these impacts. These exposures directly concern human life and the safety of property. While foundational research exists in risk prediction and exposure analysis, a lack of information remains: (1) Most current research treats exposure as a one-dimensional factor in disaster hazard [27,28] and vulnerability assessments [29,30,31], typically in non-disaster contexts. This approach does not address the risk analysis of exposures during the active spread of a wildfire. Identifying the future spatial locations of at-risk exposures is crucial for effective risk analysis, aiding in the development of emergency rescue and evacuation plans. (2) Traditional geographic information system (GIS) techniques for spatial analysis, such as overlay and buffer analyses of exposures near wildfires, rely on data organized per layer. This method necessitates traversing within each layer, increasing the time complexity and complicating the organization and indexing of spatiotemporal exposure data.
To effectively assess the spatiotemporal risks associated with fire scene exposures, diverse data sources, including building, road, vegetation, terrain, fire incident, and weather condition data, must be integrated. The Disaster Prediction Spatiotemporal Knowledge Graph (DPKG) [3] serves as an advanced tool for managing and amalgamating these varied spatiotemporal data sources, facilitating their fusion for comprehensive analysis. Leveraging the DPKG, we introduce a methodology termed the Knowledge Graph for Wildfire Exposure Risk Analysis (KGERA), which is specifically designed to evaluate the spatiotemporal risks related to exposures during the progression of wildfires. Our research primarily focused on identifying exposures at risk under specific spatiotemporal conditions rather than assessing the magnitude or level of risk. Our goal is to predict exposures that may be at risk within specific spatiotemporal ranges, such as buildings and roads threatened by wildfires, using spatiotemporal data and the KGERA framework. Our method helps predict and identify which exposures may be at risk at a future point in time; however, we did not investigate specific risk magnitudes or levels, as this is not the focus of this study.
In conclusion, this study offers contributions in several areas: (1) The development of the KGERA for the semantic modeling of data related to wildfire exposures in a spatiotemporal context. (2) The transformation of remote sensing data into structured knowledge within the knowledge graph provides a semantic-driven inference and analysis of exposure risk. (3) A practical case study demonstrates the effectiveness of this methodology in modeling spatiotemporal exposure information and conducting semantically oriented risk analysis.
2. Methods
While the DPKG primarily concentrates on disaster prediction, it lacks semantic modeling of exposure data. To address this shortcoming, we developed the KGERA, which extends the capabilities of the DPKG in integrating diverse spatiotemporal data. The KGERA effectively extracts and structures exposure data from remote sensing imagery, encompassing a range of heterogeneous sources, such as buildings, roads, vegetation, terrain, fire incidents, and weather conditions. This framework indexes spatiotemporal data semantically, enabling direct access to specific data within the desired range without the need for layer traversal, thus reducing the complexity inherent in traditional database methods. Additionally, the KGERA introduces a novel spatiotemporal reasoning mechanism to analyze wildfire spread trends from established fire points. This approach enables detailed risk analysis at the individual element level, utilizing semantic relationships with particular buildings or roads to decrease the temporal complexity.
The method we propose for spatiotemporal risk analysis in the context of exposure integrates two key elements: the KGERA framework and a controller that oversees rule-based inference and program flow management. Section 2.1 and Section 2.2 of this study investigate the detailed exposition of the KGERA’s application in exposure analysis. The controller plays a vital role in executing rule-based inferences, utilizing the structural capabilities of the KGERA system.
2.1. Method Architecture
2.1.1. Conceptual Data Model for Wildfire Exposure Risk Analysis
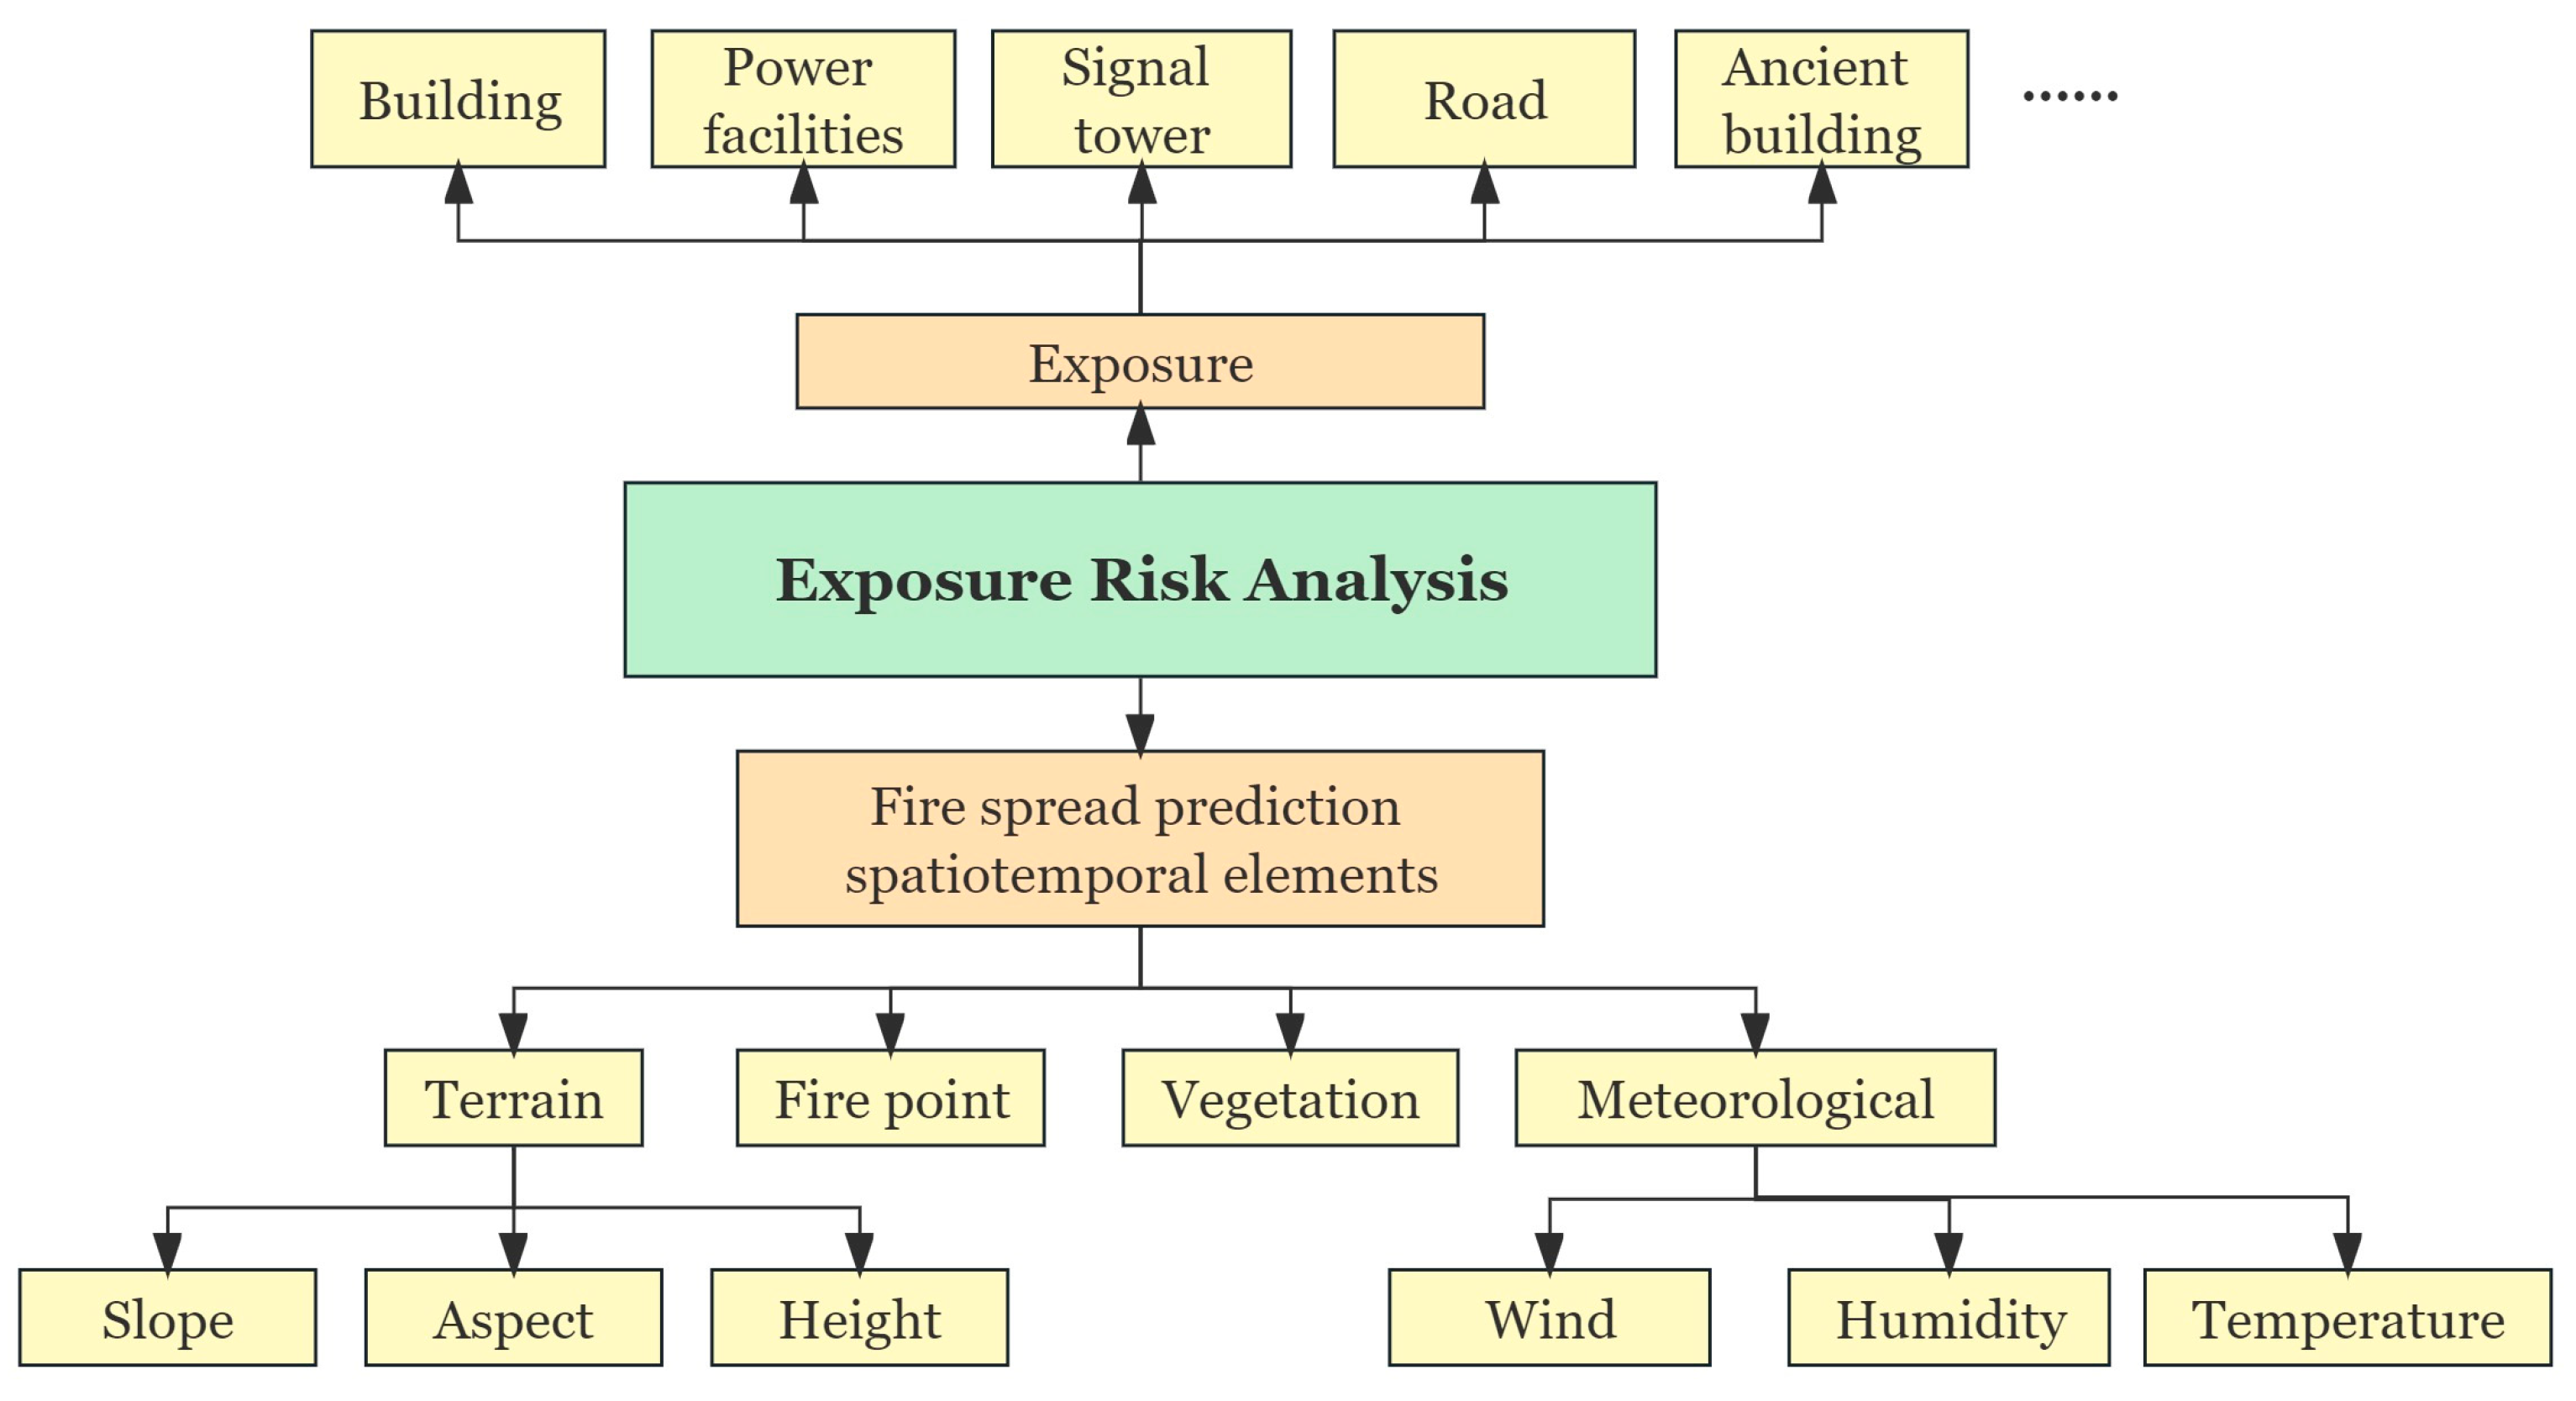
In our approach to analyzing wildfire spread and exposure risk, we categorize the data into two distinct groups: hazard factors and exposure entities. A conceptual data model essential for understanding the spatiotemporal risk associated with wildfire exposures was developed and illustrated in Figure 1. This model forms the foundational basis for the KGERA architecture, structuring and guiding our analysis.
2.1.2. KGERA Architecture
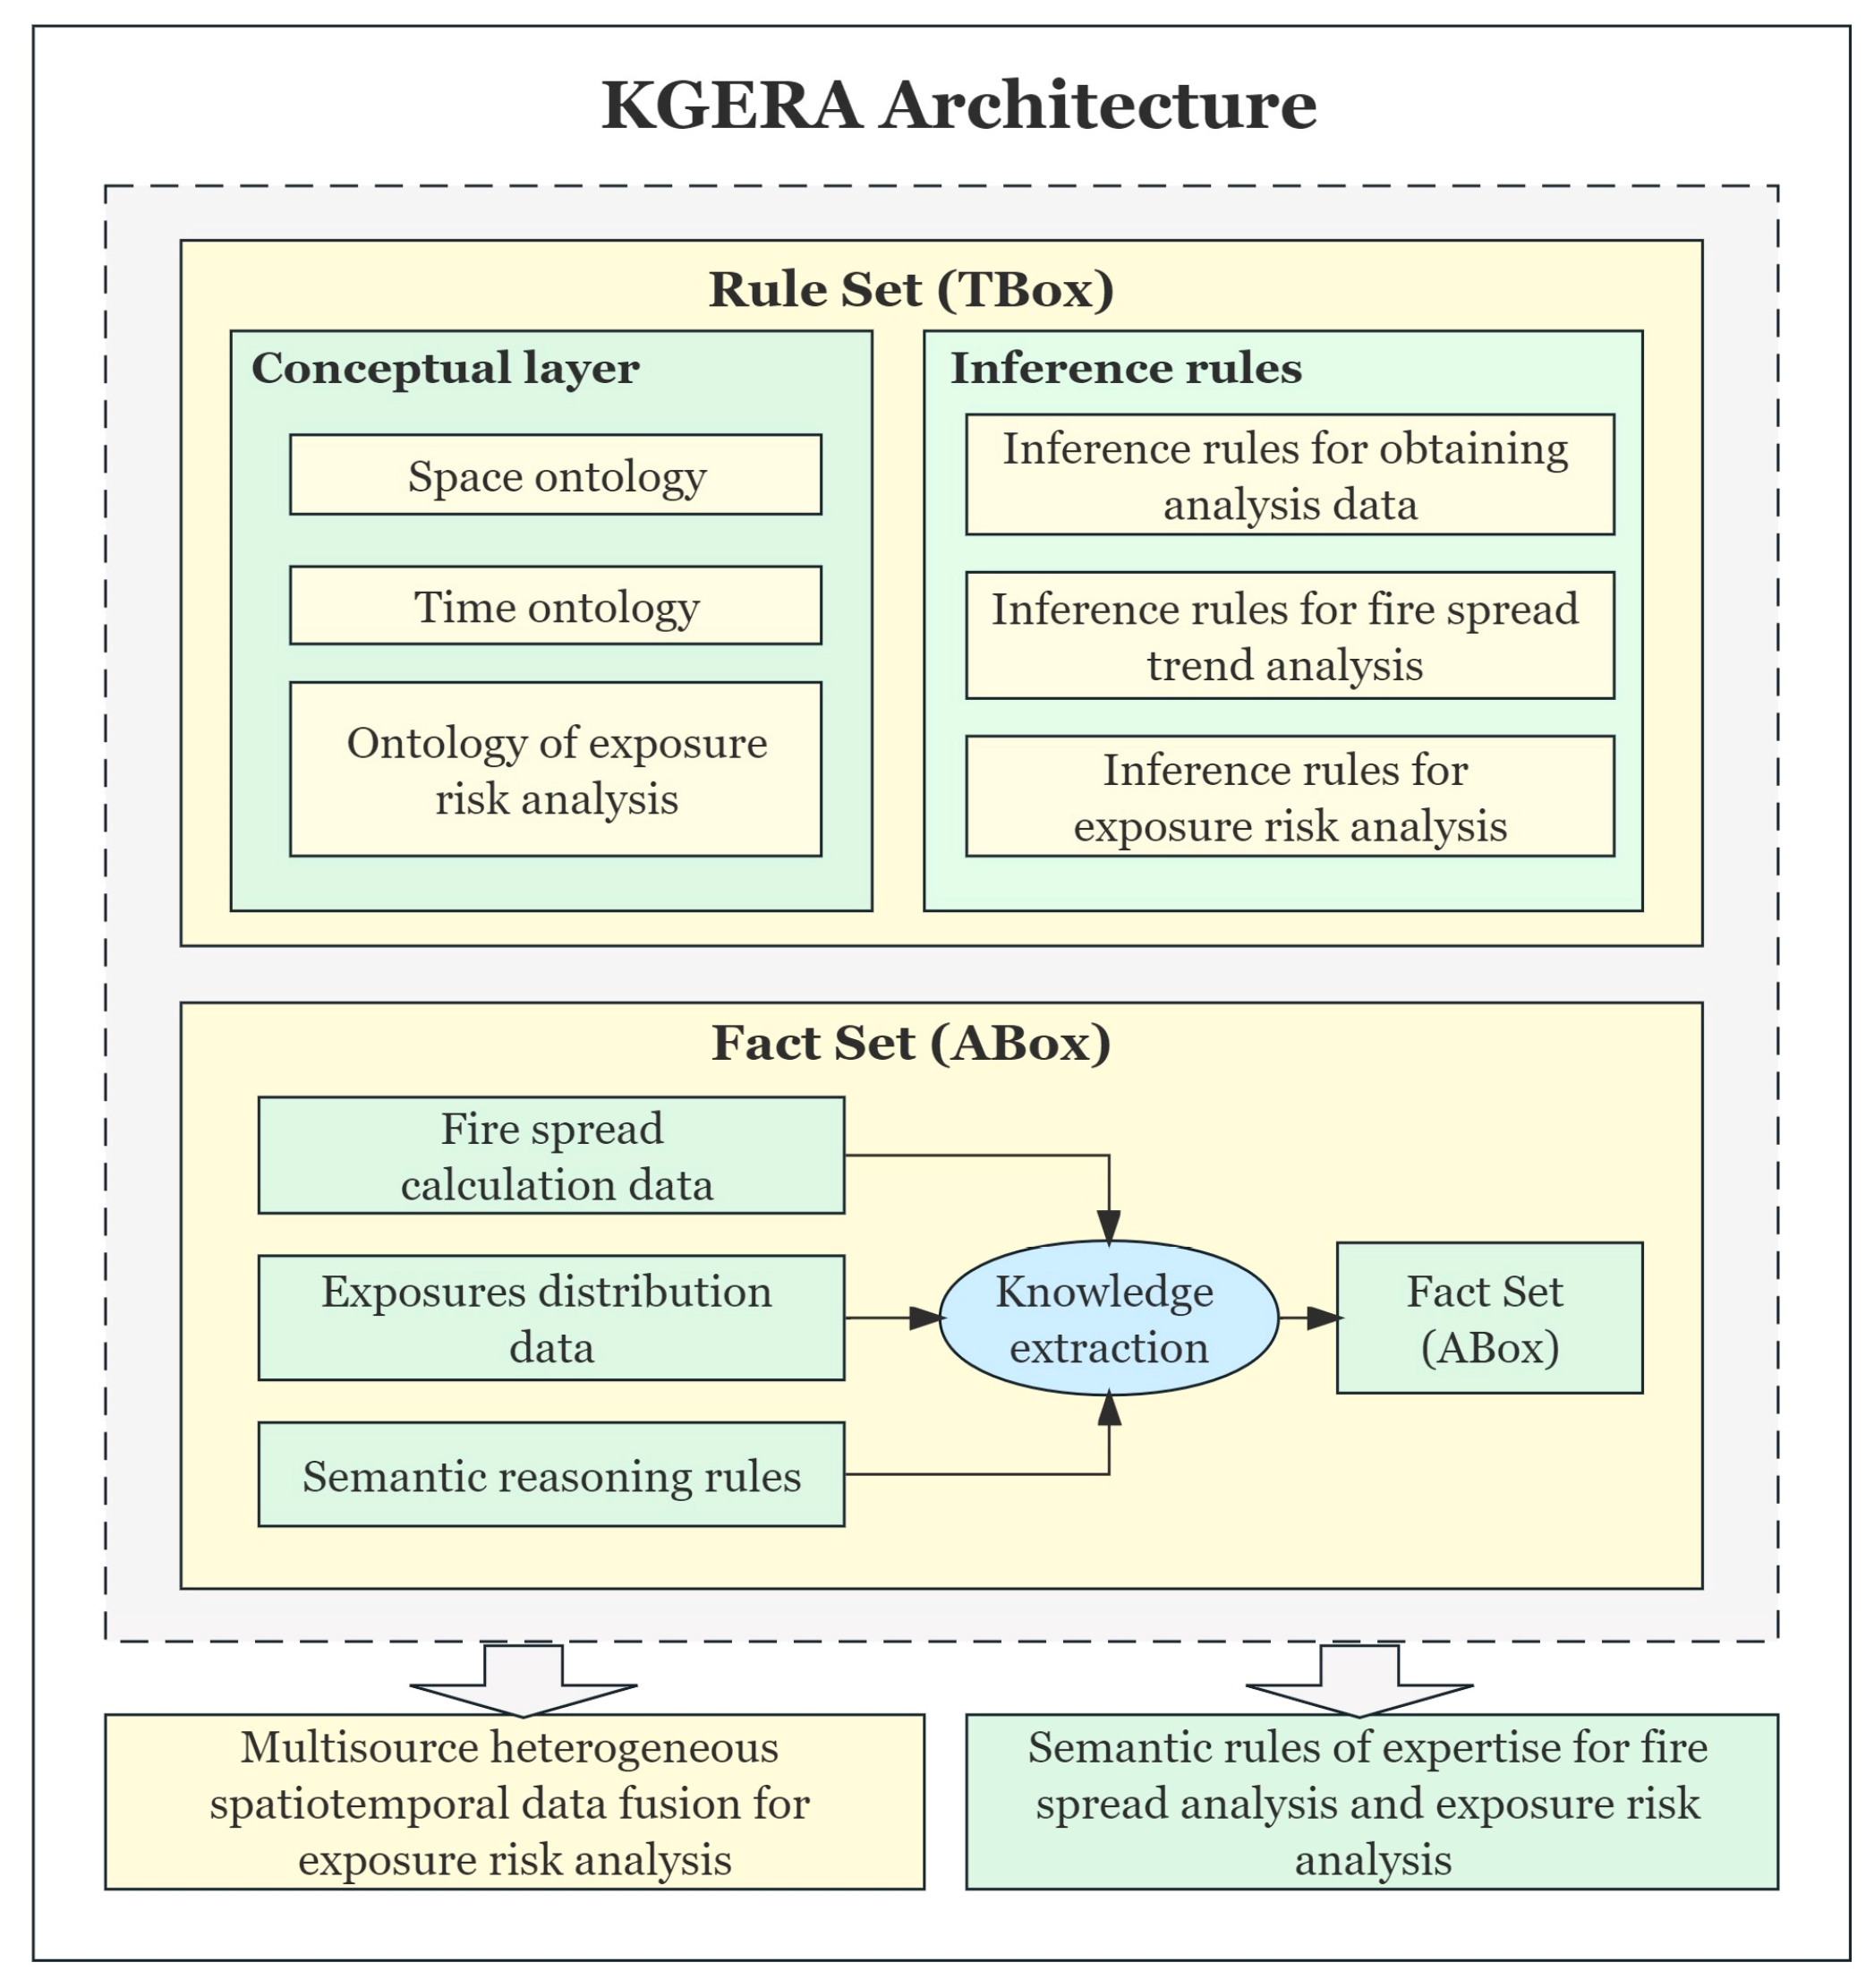
Figure 2 illustrates the architecture of the proposed KGERA.
The KGERA’s architecture is structured around two principal components: the rule set, known as the TBox, and the fact set termed the ABox. The TBox consists of concept layers and a set of inference rules. These concept layers consolidate spatiotemporal data, which are essential for wildfire spread analysis and exposure risk assessment, by incorporating various temporal, spatial, and attribute features. The development of this conceptual framework within the knowledge graph necessitates the creation of both temporal and spatial ontologies. This layer encapsulates the ontologies for wildfire spread and exposure risk analysis, organizing their hierarchical relationships according to the attributes of the spatiotemporal data. These attributes are intimately linked to the type of data being analyzed, for instance, terrain data, which are characterized by specific attributes, such as aspect [4].
Inference rules form the logical bedrock of semantic reasoning, underpinning the integration and reasoning of multi-source spatiotemporal data. These rules encapsulate domain-specific expertise in wildfire spread and exposure risk analysis within the knowledge graph, translating this expertise into formal semantic reasoning rules.
In the KGERA framework, the instance layer of the knowledge graph, referred to as the ABox, integrates various forms of spatiotemporal data—unstructured, structured, and semistructured—essential for conducting wildfire spread analysis and evaluating spatiotemporal exposure risks. This layer is adept at modeling these diverse data types within the knowledge graph’s ABox, facilitating comprehensive analysis and interpretation.
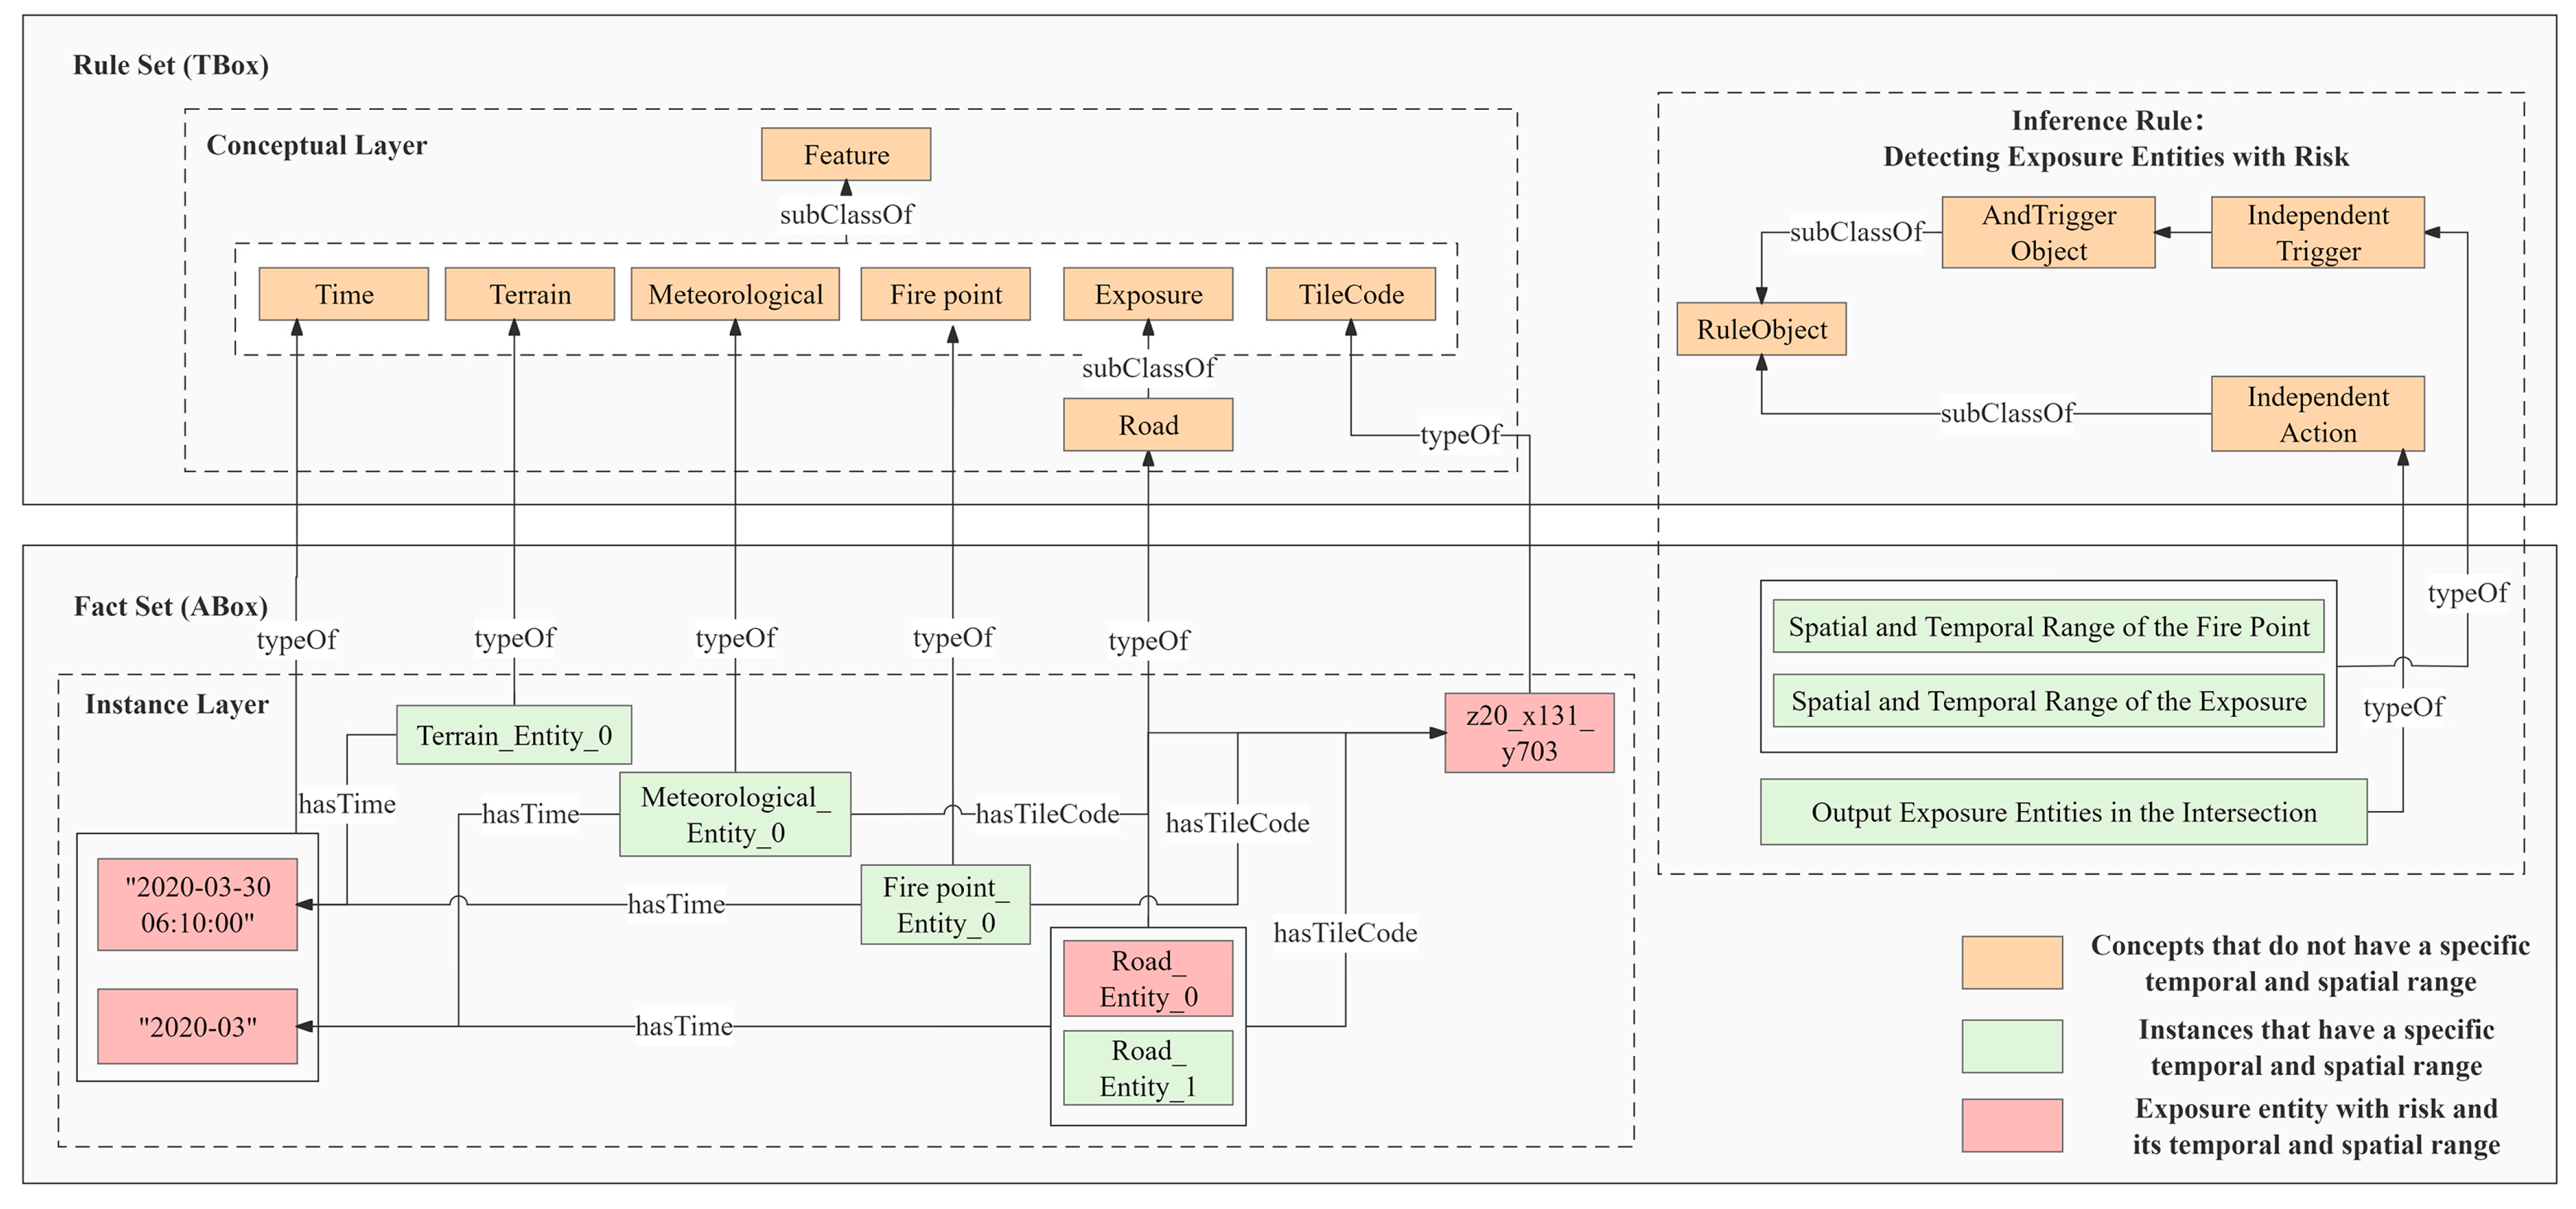
In Figure 3, we illustrate the components and relationships of the KGERA model. The model defines a set of rules (TBox) to represent abstract conceptual structures and their relationships. In this structure, ‘Feature’ exists as a superclass, under which subclasses include ‘Terrain’, ‘Meteorological’, ‘Fire Point’, and ‘Exposure’, and each category possesses temporal and spatial attributes, which are reflected through their associations with the concepts of ‘Time’ and ‘TileCode’.
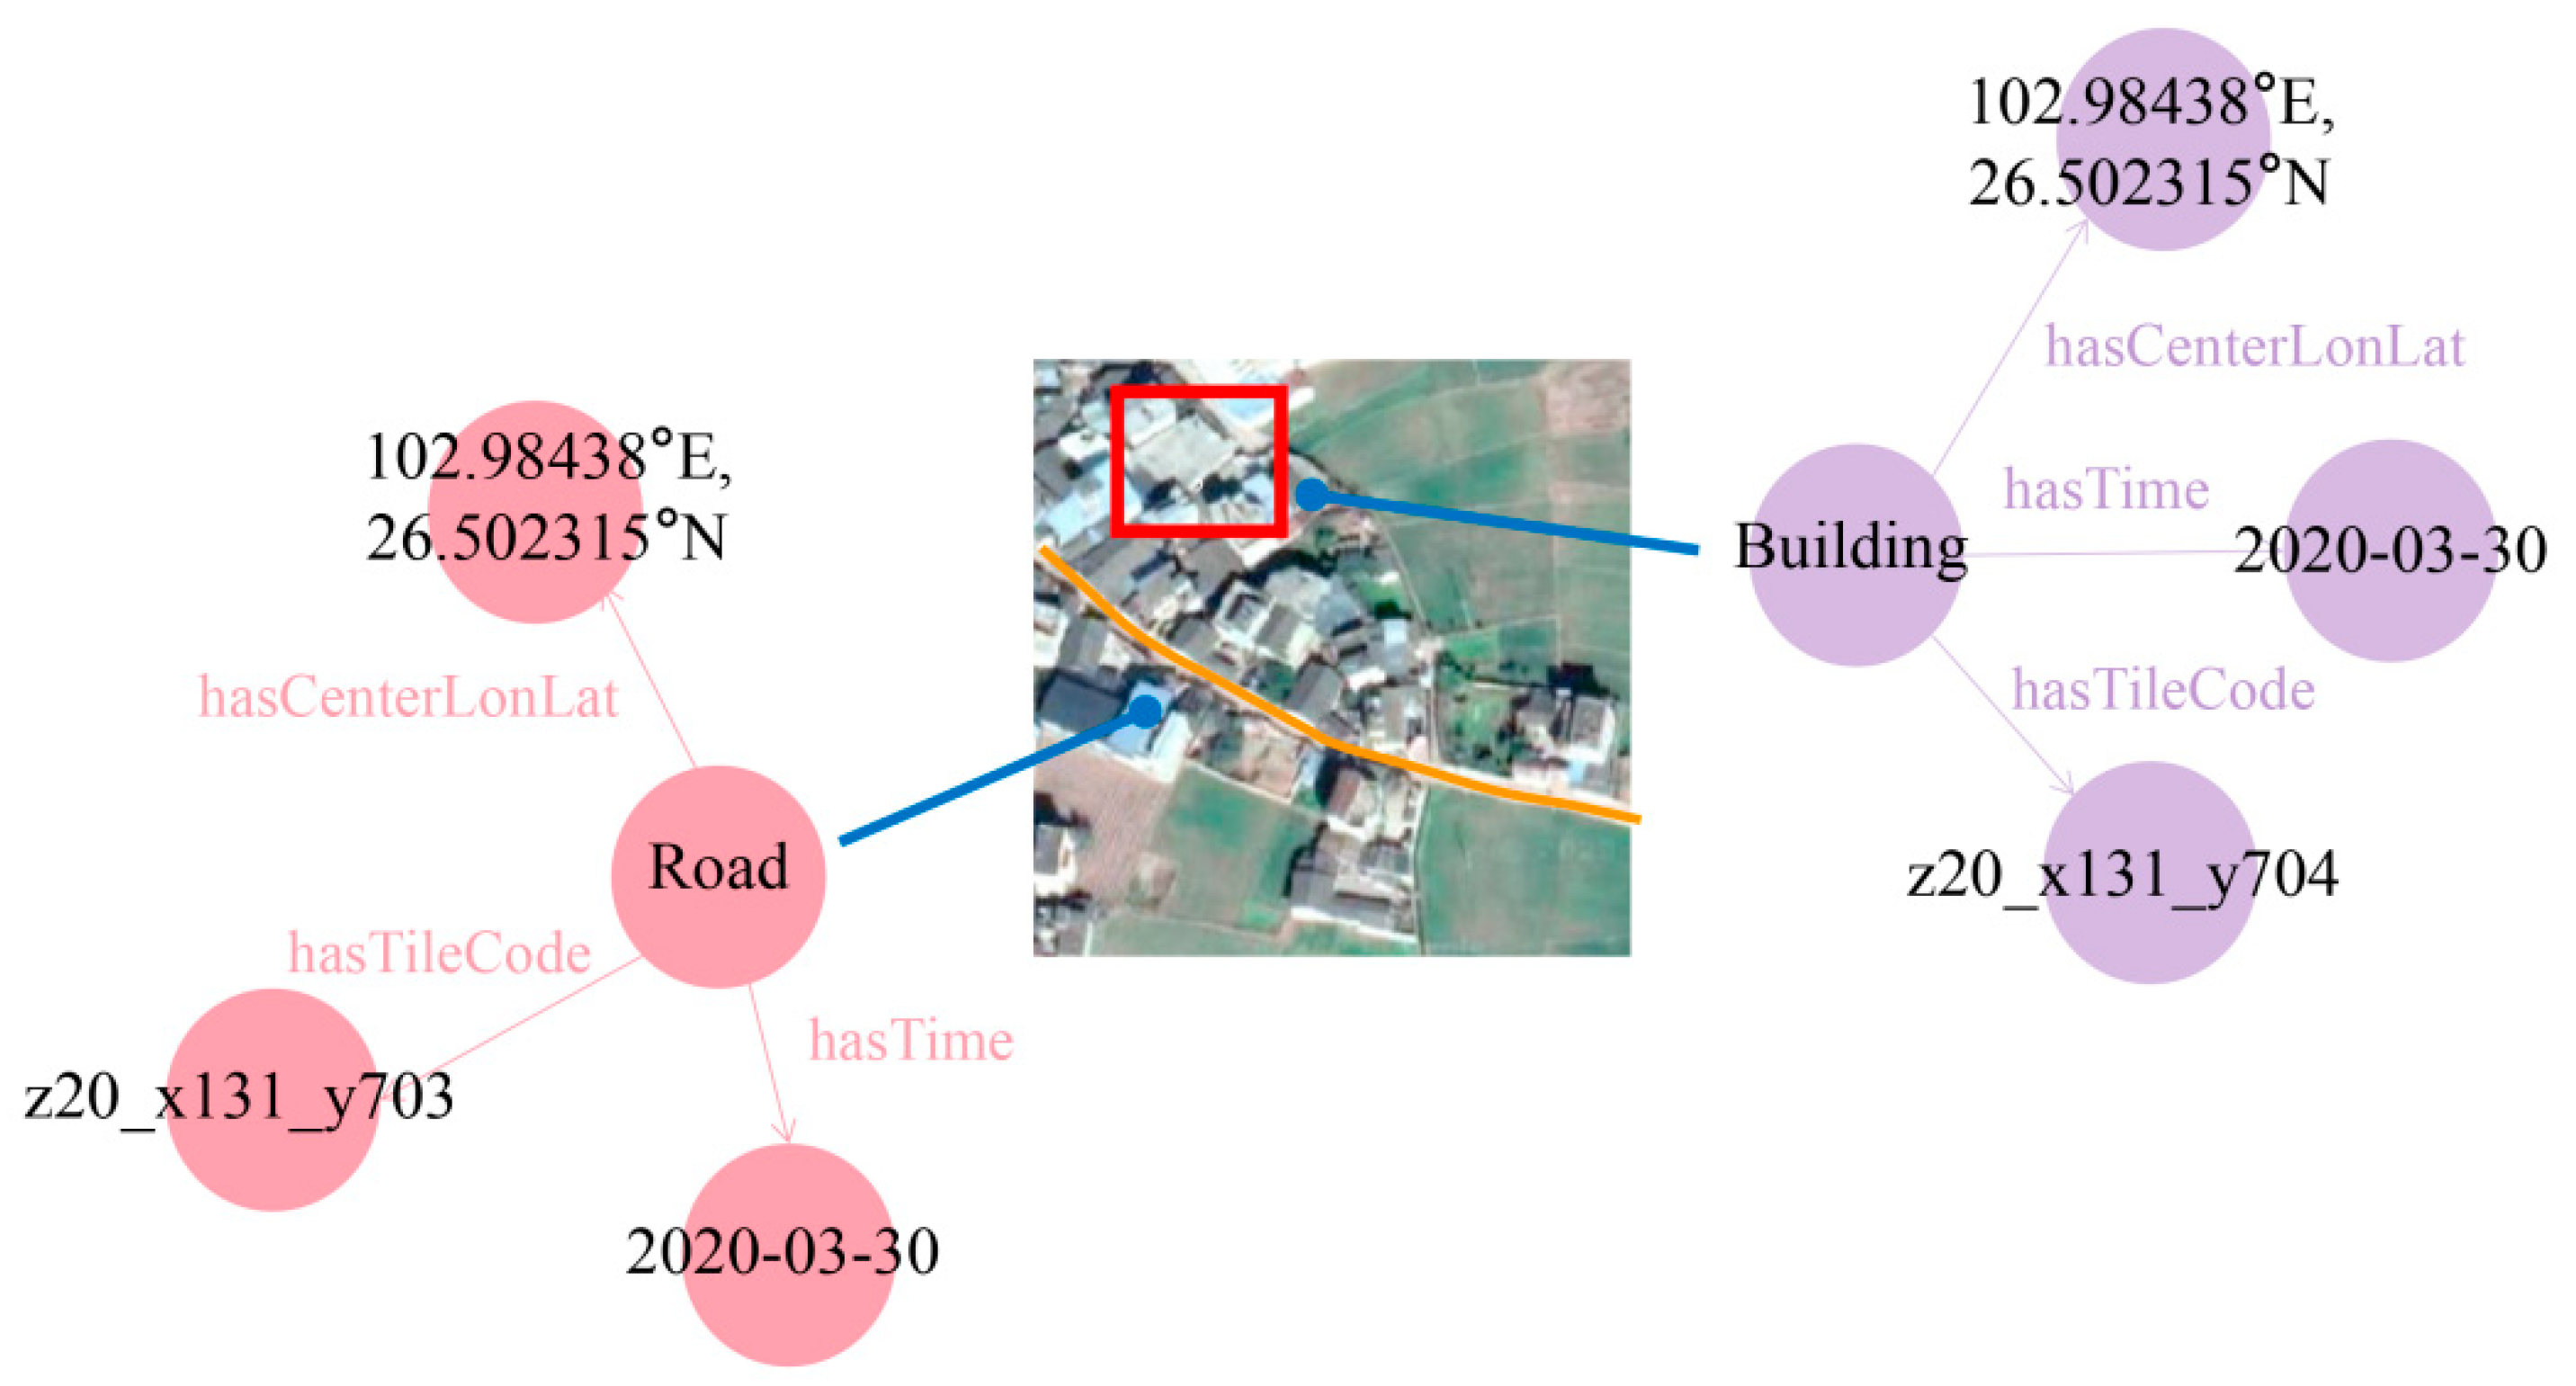
The instance layer (Instance Layer) is a significant component of the fact set (ABox), demonstrating how abstract concepts are connected to specific data instances. For instance, the instance ‘Road_Entity_0’ is connected to instances of ‘z20_x131_y703’ for TileCode and ‘30 March 2020 06:10:00′ for Time through ‘hasTime’ and ‘hasTileCode’, representing the specific spatiotemporal characteristics of the instance.
Furthermore, the model describes inference rules, such as ‘Detecting Exposure Entities with Risk’, which are used to detect exposure instances with risk. Through RuleObject, IndependentAction, AndTriggerObject, and their corresponding instances, we can infer exposure instances with risk and their spatiotemporal ranges using semantic associations indexed in the TBox and ABox.
2.2. Construction of the Wildfire Exposure Risk Analysis Knowledge Graph
This section outlines the structural design of the KGERA, focusing on the detailed construction of the concept layer, instance layer, and set of inference rules integral to the framework.
2.2.1. Design of the Conceptual Layer
In the KGERA framework, the conceptual layer plays a crucial role in forming logical and semantic interconnections among the diverse spatiotemporal data sources utilized for analyzing wildfire spread and exposure risks. This layer integrates semantic concepts, ensuring their interconnected coherence, which is essential for the multifaceted analysis of wildfire spread and associated exposure risks. The conceptual layer incorporates temporal and spatial ontologies, which are specifically tailored for the study of wildfire spread dynamics and exposure risk assessment. These ontologies, which are based on established research [4,32,33], are central to the framework and facilitate a comprehensive and integrated understanding of the various factors influencing wildfire behavior and vulnerability to exposure.
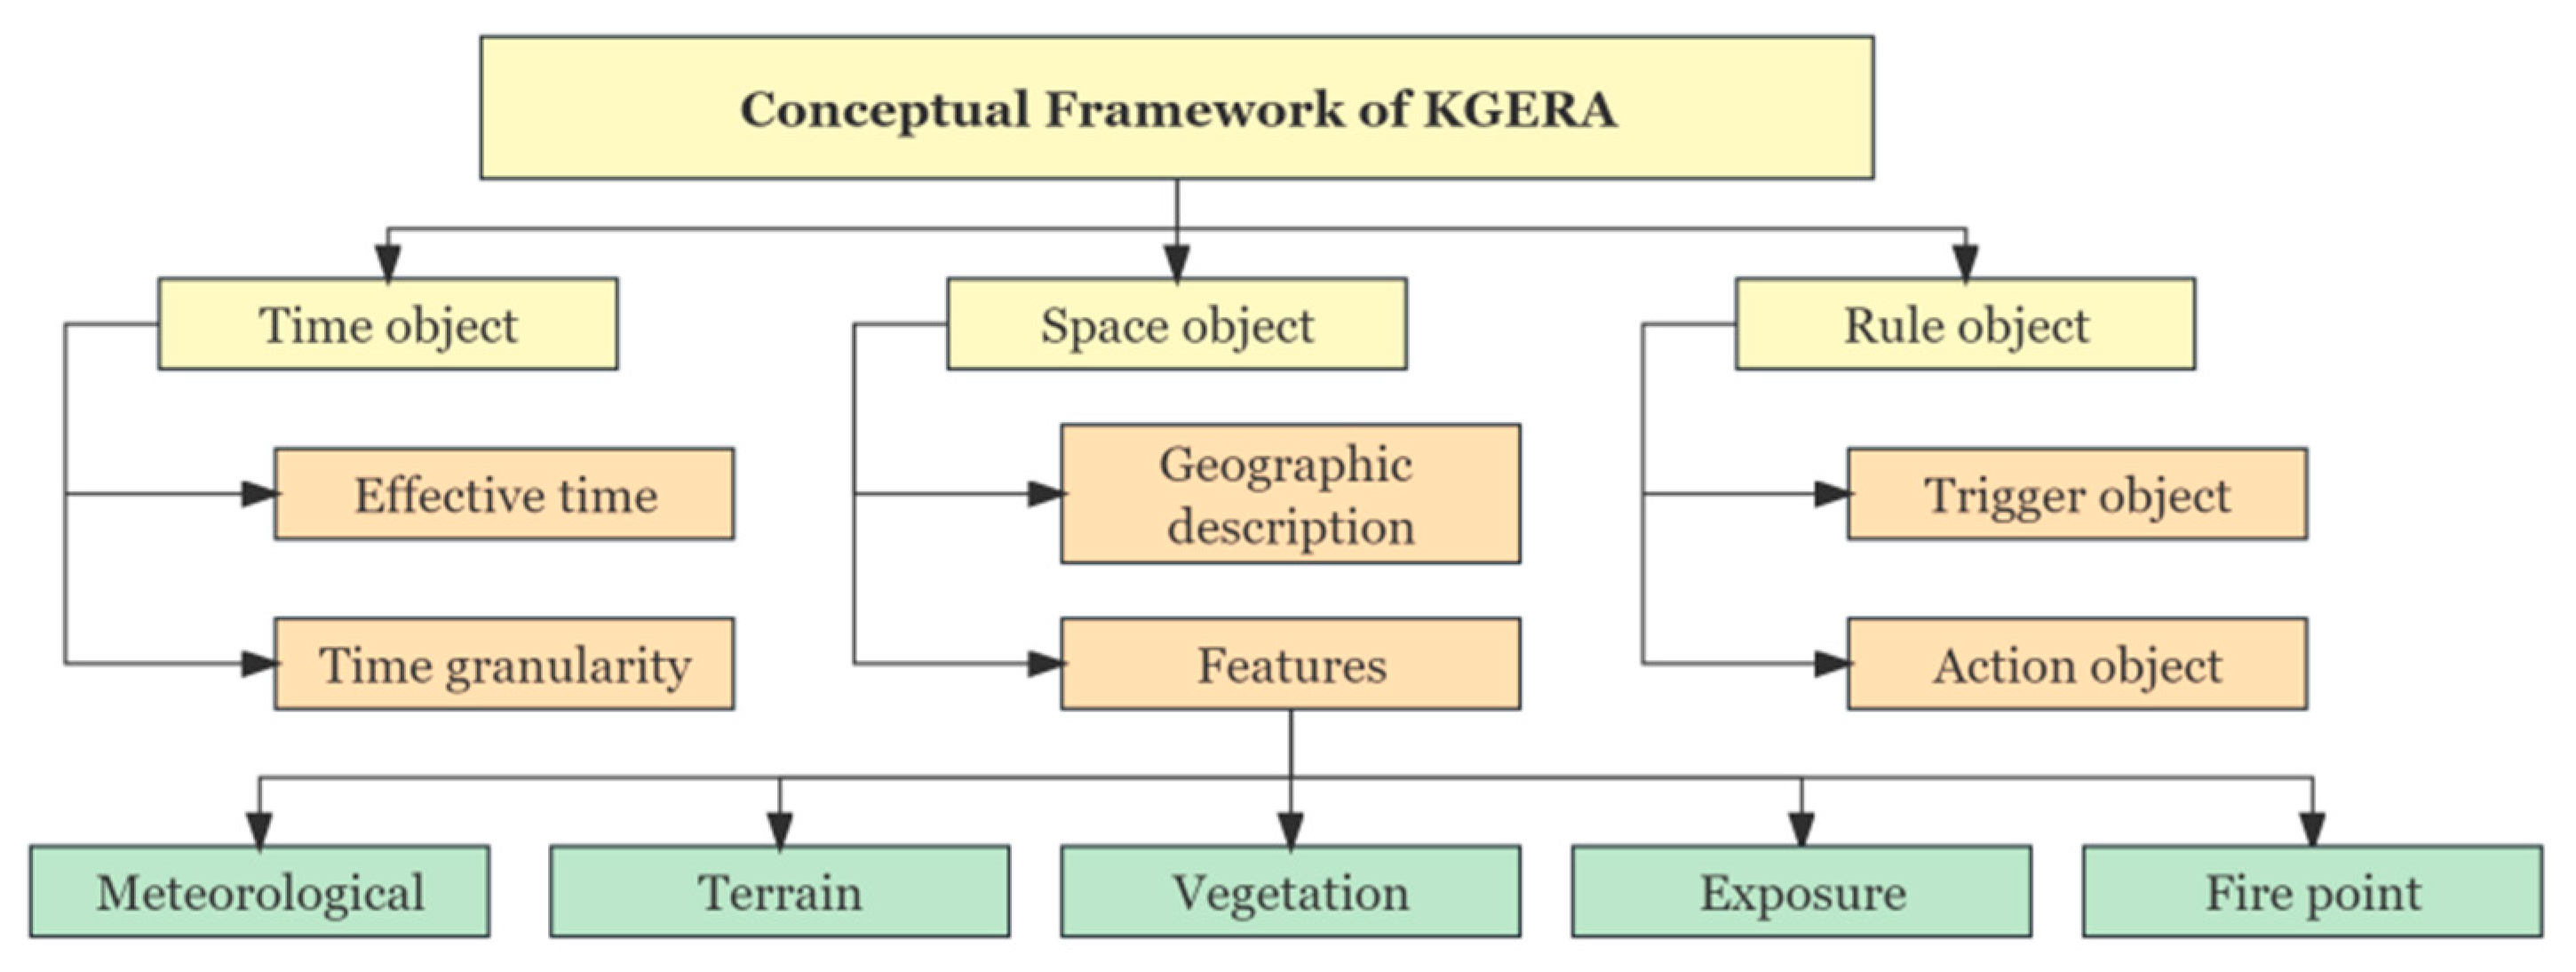
To formulate the ontology required for analyzing the spread of wildfires and assessing the associated spatiotemporal risks, we adopted a tree classification method. This method segments the various concepts present within multi-source spatiotemporal data [3]. Building on the foundation of the KGERA’s architecture, we then created a comprehensive ontology for both wildfire spread analysis and exposure risk assessment. The detailed structure of this ontology is illustrated in Figure 4.
2.2.2. Design of the Instance Layer
- 1.
- Instantiation methods for accessing information extracted from remote sensing
Recent advancements in deep learning-based remote sensing technology have significantly enhanced the efficiency of extracting terrestrial information from remote sensing imagery. This technology has become widely adopted across various sectors. High-resolution remote sensing images enable rapid and macroscopic acquisition of ground information, which is particularly vital in hazard risk assessment involving the identification of buildings. However, disaster-prone areas often feature complex terrains and dense vegetation, presenting challenges in data extraction. To identify the distribution and quantity of buildings, we initially employ the basic U-Net model for extraction, followed by ensemble learning techniques to refine the semantic segmentation results. Subsequently, neural network reconstruction is applied to these results to effectively distinguish individual buildings by differentiating the segmented images.
- 2.
- Instantiation methods for other geographic information
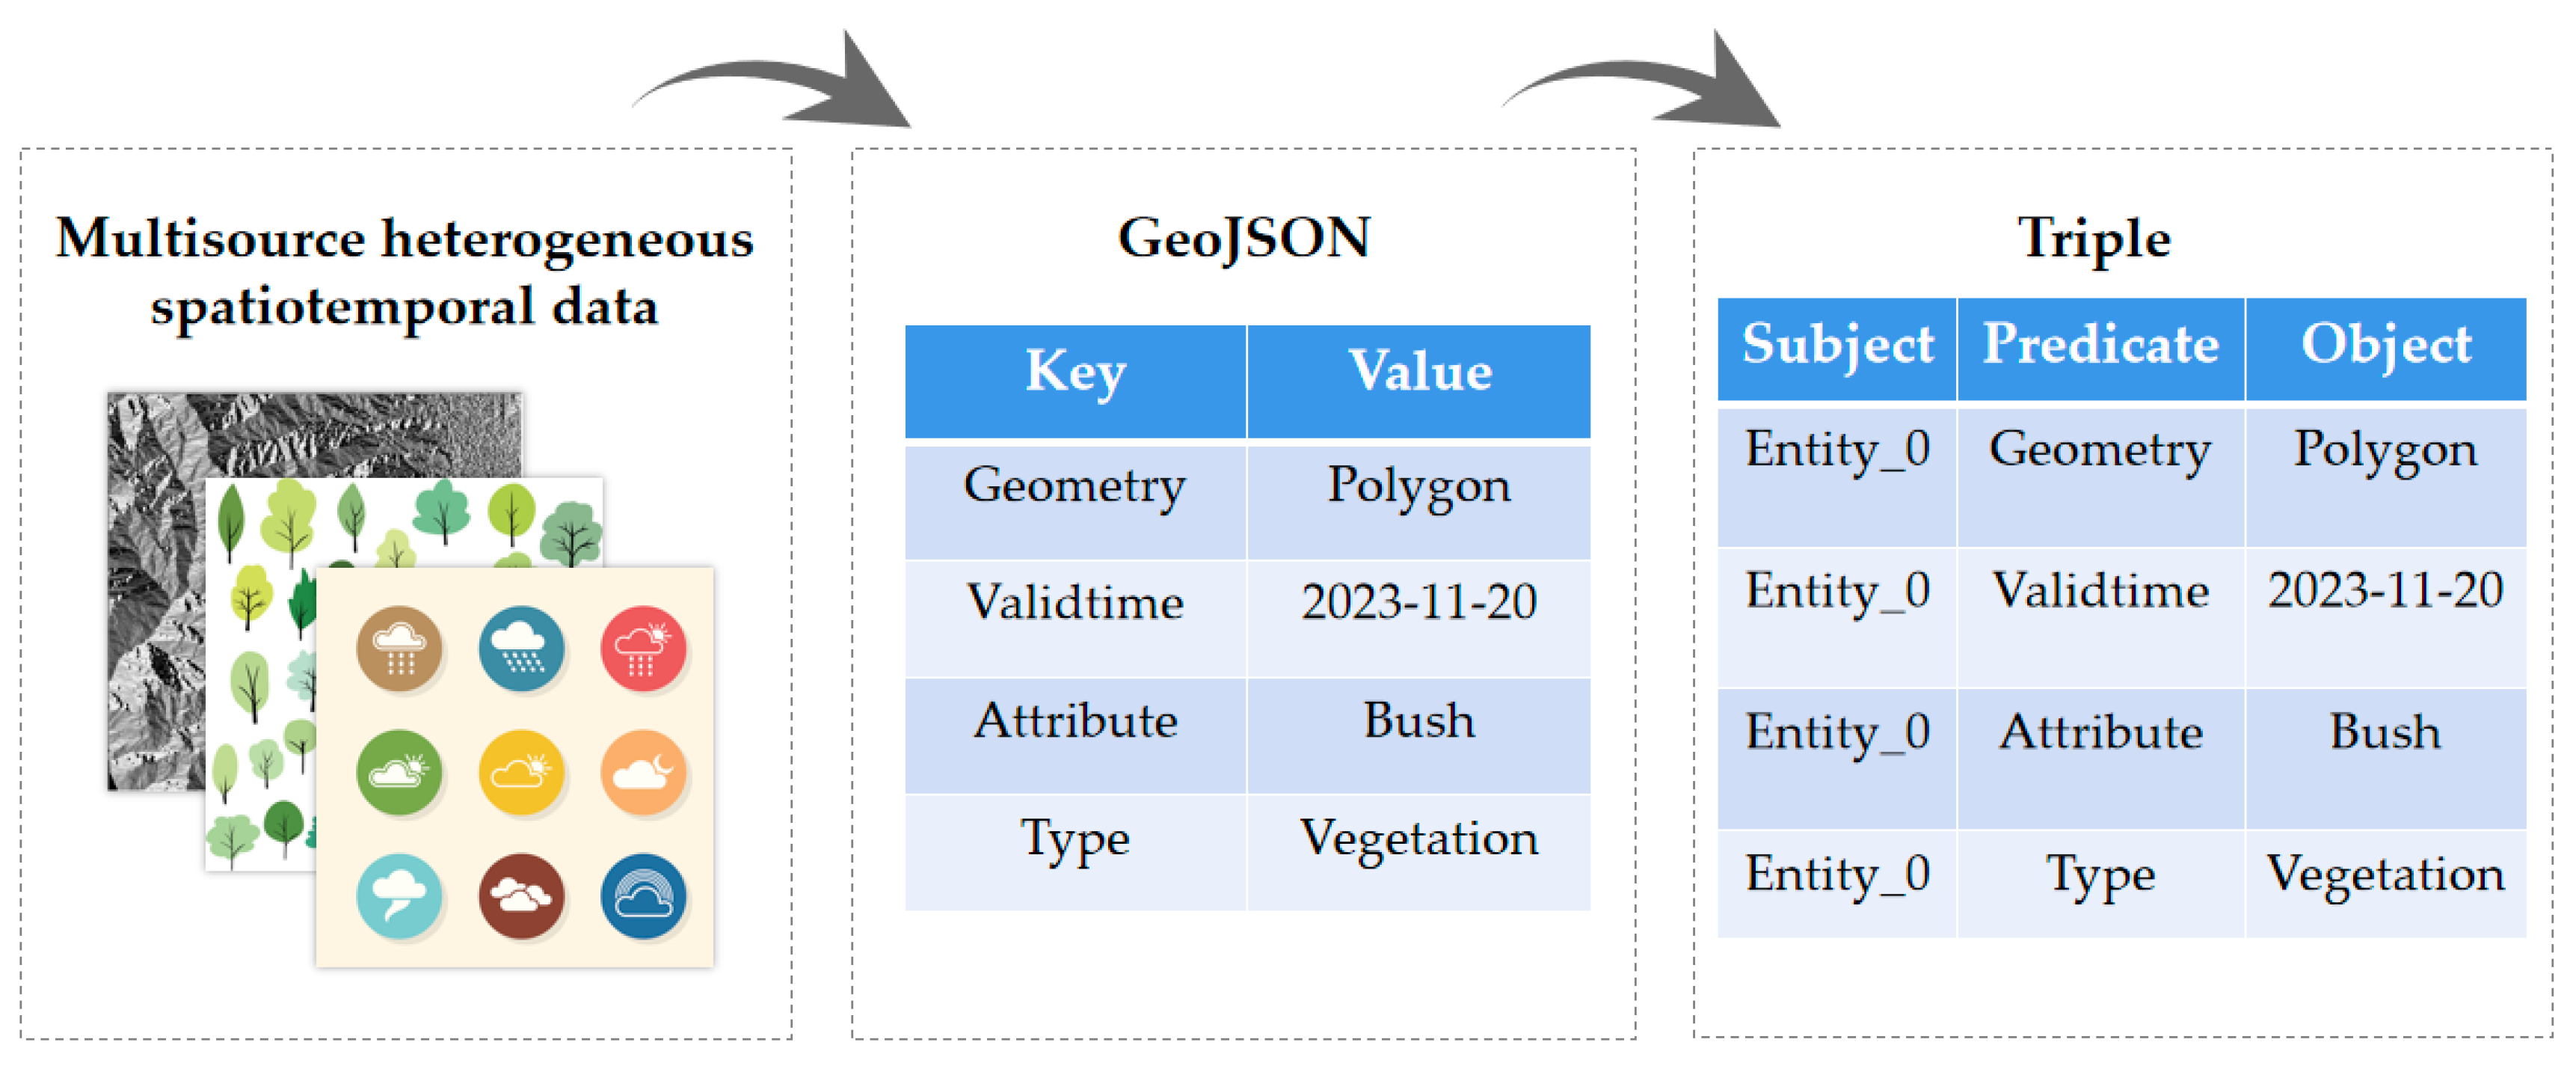
For effective collaborative analysis of multi-source heterogeneous spatiotemporal data, it is crucial to establish a standardized instantiation method that is applicable to various data types. Thus, we developed a unique instantiation methodology tailored for integrating multi-source heterogeneous spatiotemporal data, as illustrated in Figure 5.
We transform multi-source heterogeneous spatiotemporal data into the GeoJSON format, as endorsed by the OGC International Spatial Information Standardization Organization. The GeoJSON structure comprises numerous key-value pairs adhering to specific rules: the key names align with the attribute names designated in the conceptual layer, and the values’ data types conform to those permitted for the respective attributes in the conceptual layer.
Utilizing the ontologies related to time, space, and wildfire spread analysis, along with the spatiotemporal risk analysis of exposure as defined by the conceptual layer, we comprehensively map GeoJSON in the instance layer. In this process, the geometric component of GeoJSON is aligned with the predicate of spatial information triples, and its geometric values are correspondingly mapped with the objects of these triples, adhering to the GeoSPARQL format specifications. Similarly, the ‘ValidTime’ attribute in GeoJSON is associated with the predicate of temporal information triples, with its values being mapped with the respective triple objects. Furthermore, each key within GeoJSON’s attribute collection is linked to the predicate of the relevant geographic entity attribute triple, ensuring that the attribute values are automatically associated with the corresponding predicates in these triples.
The instance layer will continue to be updated as the temporal and spatial scope requirements evolve. For instance, frequently updated meteorological data and wildfire propagation predictions are input into the instance layer in triple form, with new triples being added to record the information.
2.2.3. Design of the Inference Rules of Wildfire Exposure Risk Analysis
In this section, we present a methodology for representing expertise in the analysis of wildfire spread and spatiotemporal risk analysis of exposure as semantic reasoning rules within the knowledge graph.
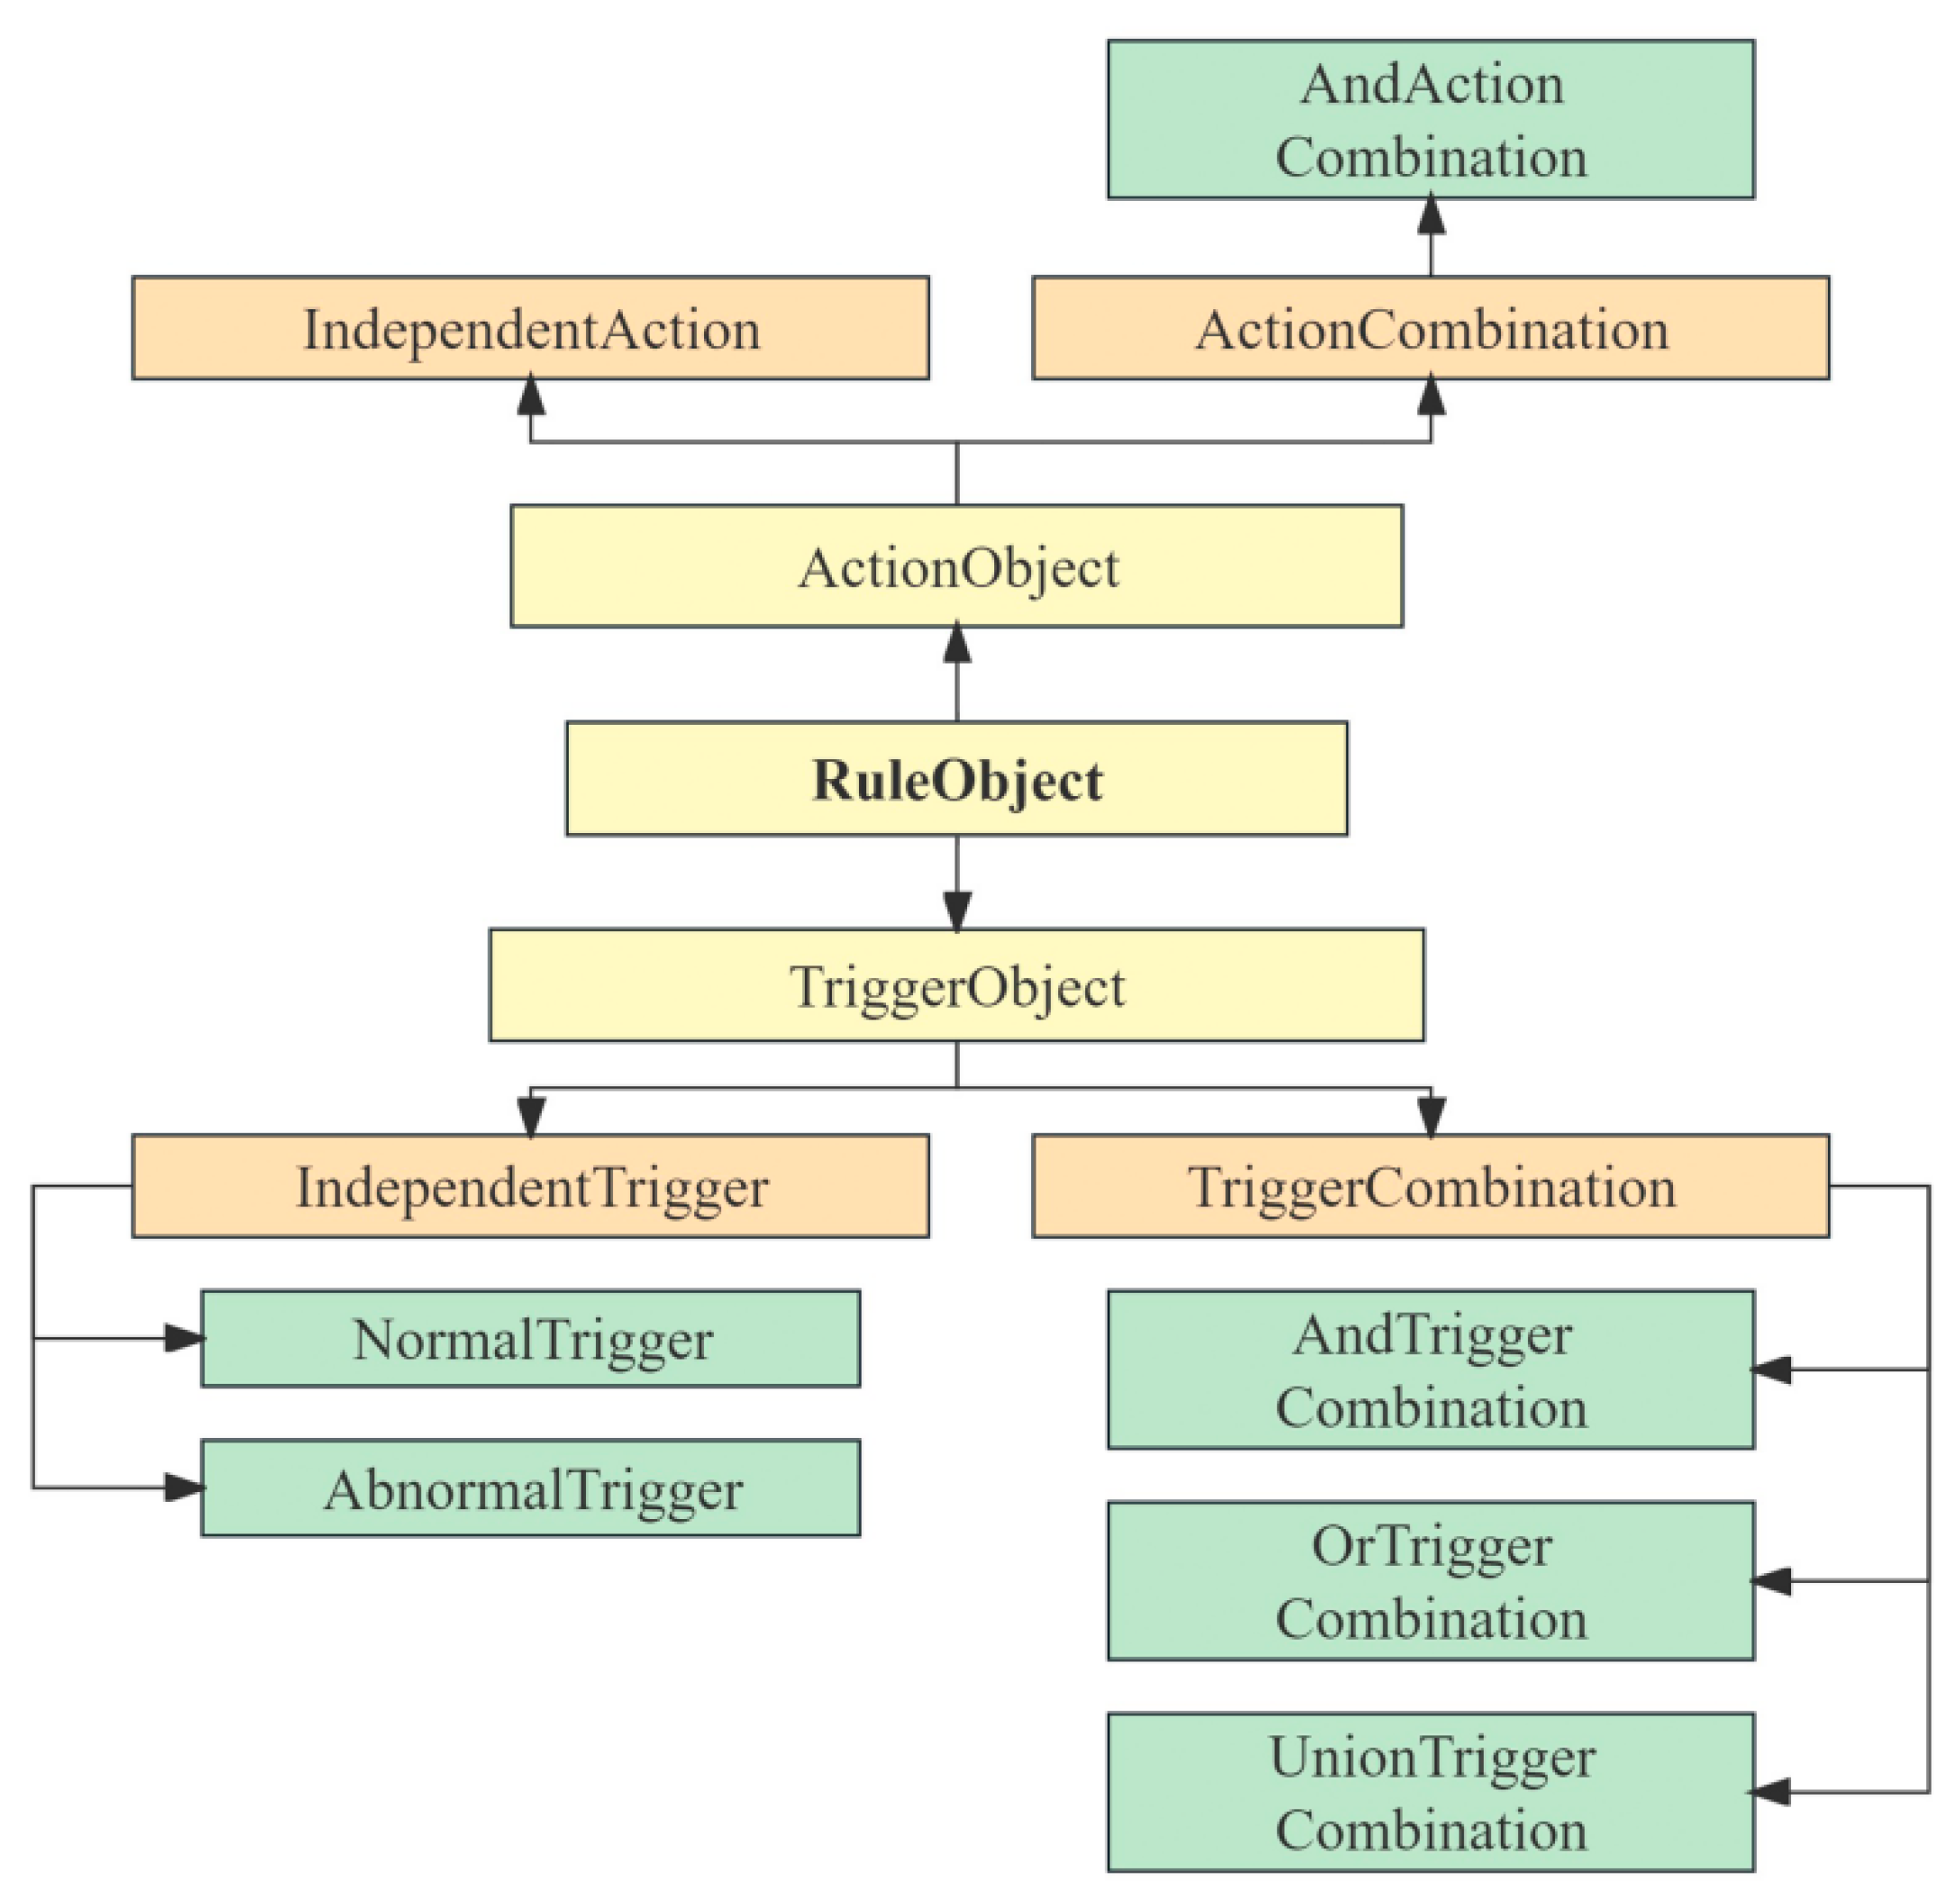
Expertise in the analysis of wildfire spread and the spatiotemporal risk analysis of exposure is represented within the knowledge graph as semantic reasoning rules. We improve upon the results of existing research [3] and define the semantic inference rules as . Tr represents TriggerObject, which represents the triggering event of the rule. Ac denotes ActionObject, which means the response action of the rule. The relationships among RuleObject, TriggerObject, and ActionObject are shown in Figure 6.
In particular, when TriggerObject belongs to AndTriggerCombination, the inference rule is triggered if and only if the intersection of the spatiotemporal ranges of all events in the triggering event set is not empty.
When TriggerObject belongs to OrTriggerCombination, the inference rule is triggered if and only if the spatiotemporal scope of any event in the trigger event set is not empty. When any event in OrTriggerCombination occurs, whether other events in the event collection also occur within the same temporal and spatial range will not be determined. Subsequent reasoning can only use entities corresponding to individual events of the input.
When TriggerObject belongs to UnionTriggerCombination, the inference rule is triggered if and only if the spatiotemporal range of any event in the trigger event set is not empty. When any event in UnionTriggerCombination occurs, it searches for whether other events in the event set also occur within the same space–time. Subsequent reasoning for using data includes the entities corresponding to the independent event input at the beginning and entities within the same spatiotemporal range corresponding to other events in the triggered event combination.
When ActionObject belongs to AndActionCombination, after the inference rule is triggered, each independent action function contained in AndActionCombination needs to be executed sequentially.
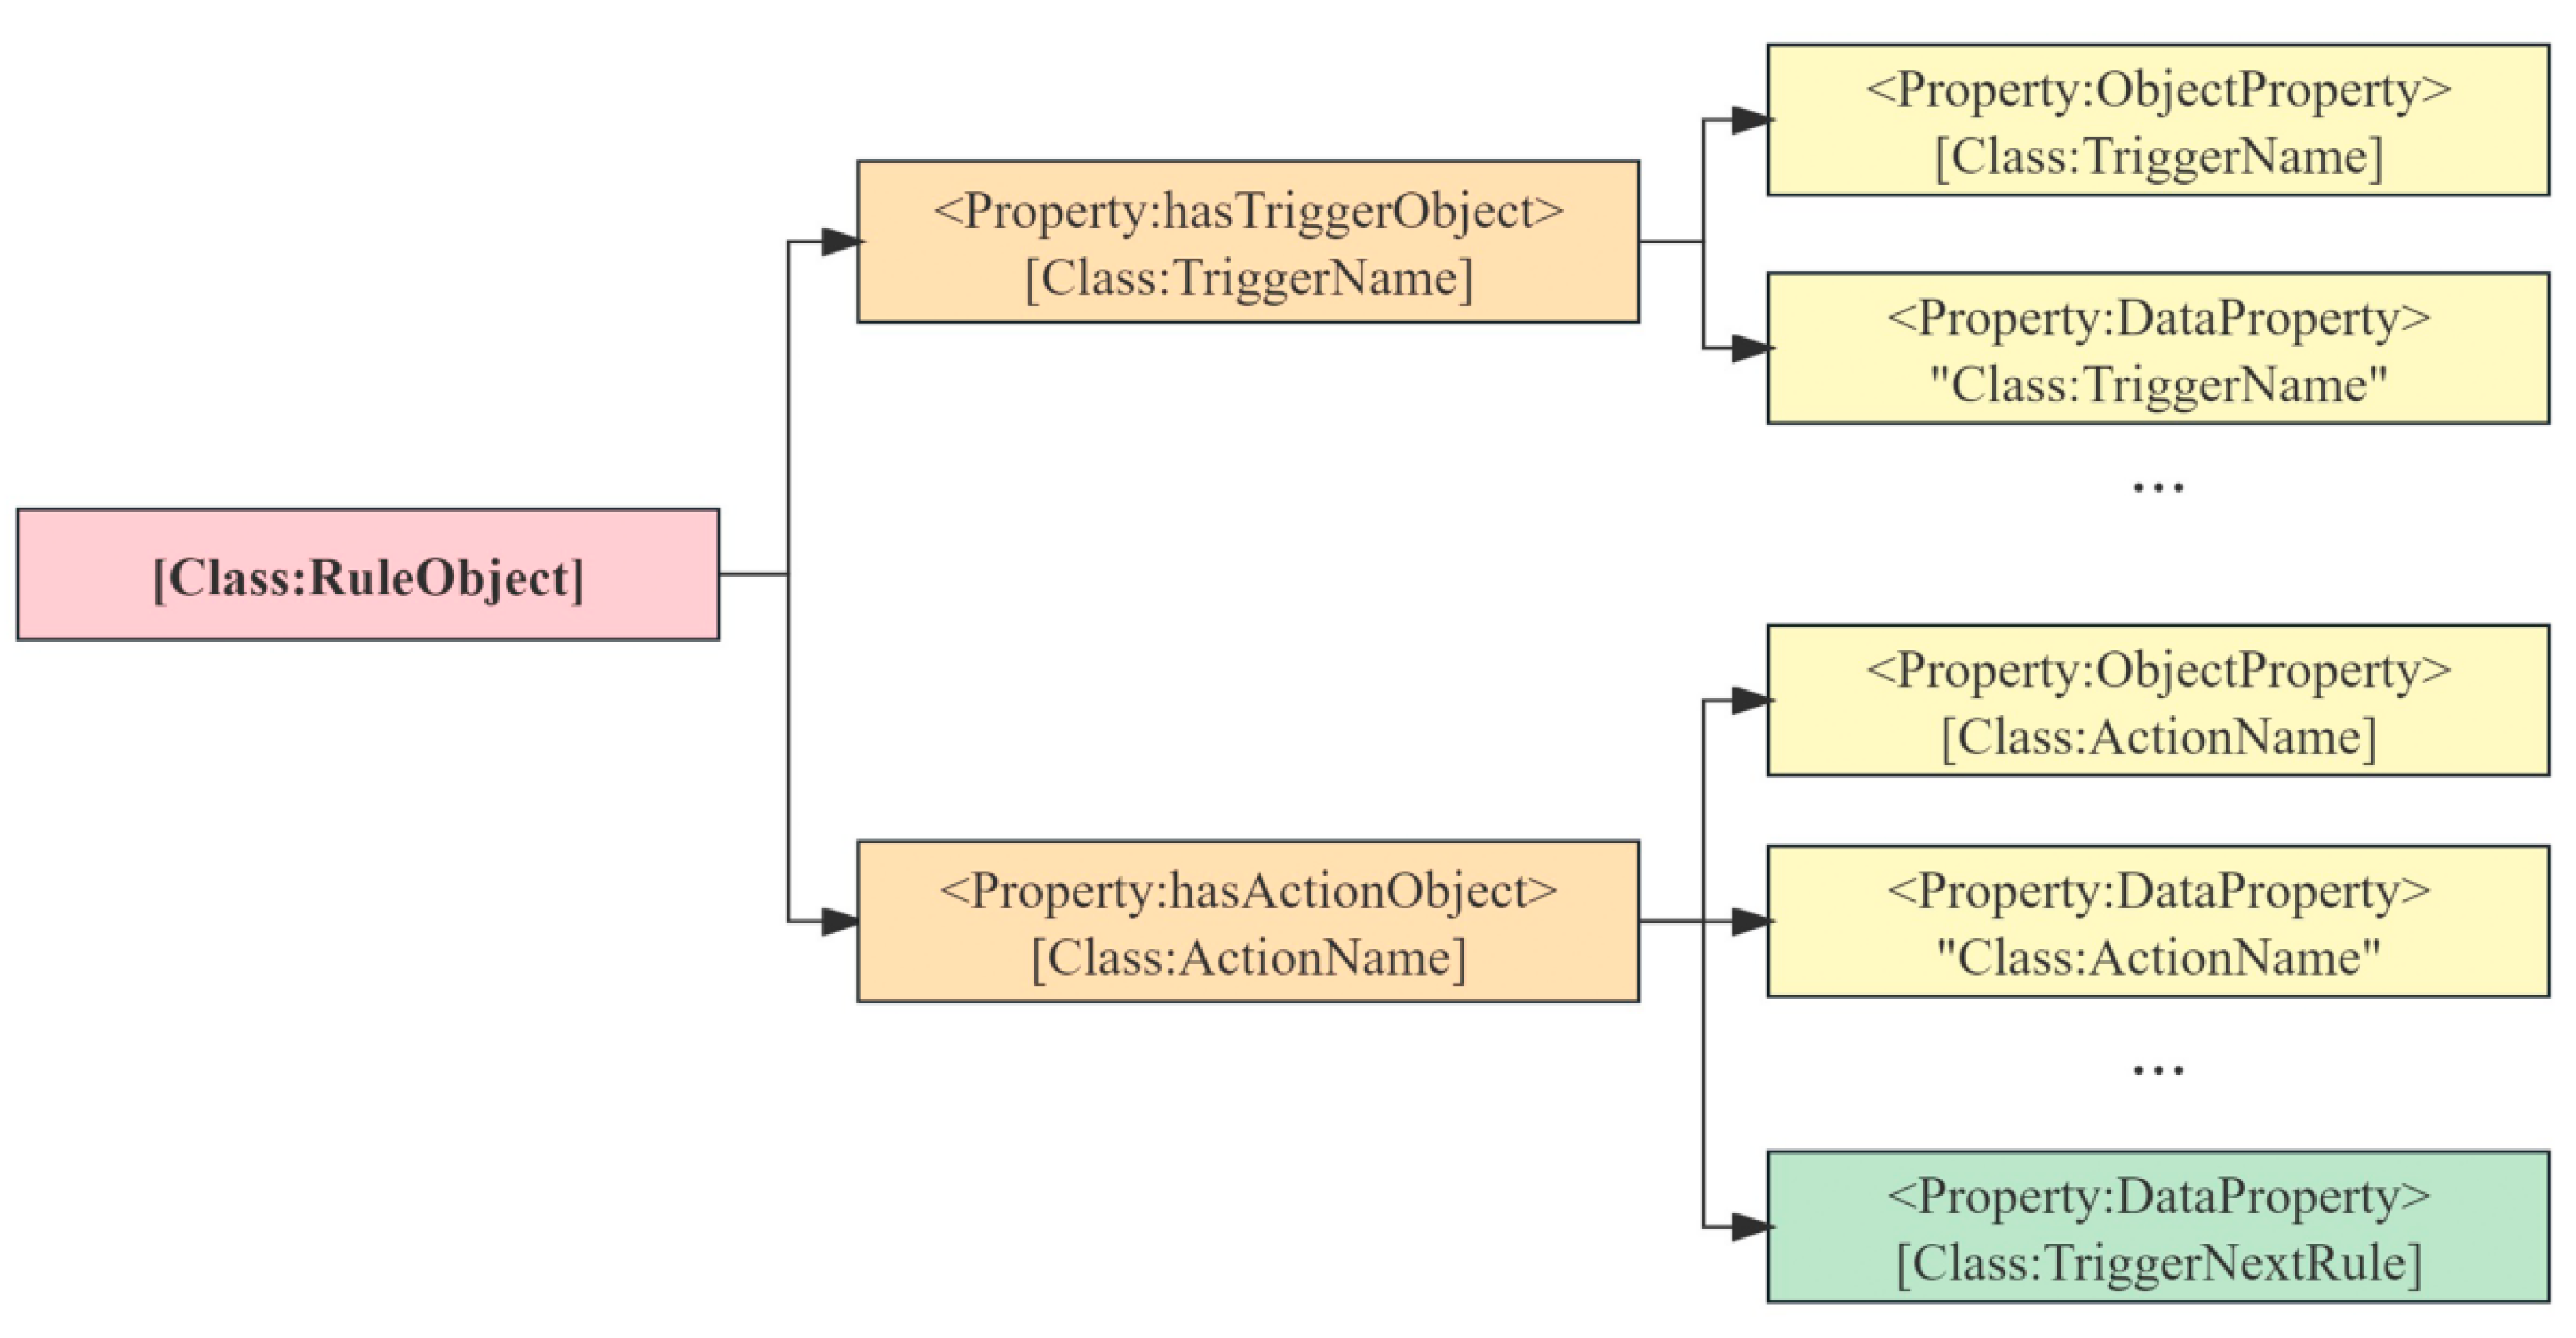
The structure of RuleObject is illustrated in Figure 7.
The components of the inference rules are derived from specialized knowledge of wildfire spread and exposure risk analysis. These components include entities, actions, action sequences, and trigger relationships preceding the actions. These features are methodically structured into inference rules, which can activate one another, creating a logical chain of reasoning applicable to both wildfire spread analysis and spatiotemporal risk assessment of exposure.
For example, we defined an inference rule: ‘Detecting Exposure Entities with Risk’, as shown in Figure 3. Its TriggerObject is AndTriggerObject contains two independent events: ‘Spatial and Temporal Range of the Fire Point’ and ‘Spatial and Temporal Range of the Exposure’. Its ActionObject is ‘Output Exposure Entities in the Intersection’, executed using a C# controller responsible for rule inference and program flow control.
The specific process of spatiotemporal reasoning is described as follows: (1) The controller retrieves fire point entities and their spatiotemporal ranges from the KGERA (based on triple connection relationships in the conceptual and instance layers). (2) The controller retrieves exposure entities and their spatiotemporal ranges from the KGERA (also based on triple connection relationships). (3) The controller determines whether there is a spatiotemporal intersection between the fire point entities and the exposure entities. (4) If an intersection exists, the controller executes the ActionObject to output the Exposure entities in the intersection.
3. Experiment and Results
This section introduces a case study that applies the KGERA method to the analysis of wildfire spread and spatiotemporal exposure risk. The findings of this study underline the effectiveness of the method in integrating diverse spatiotemporal data sources, encapsulating expert knowledge, discerning patterns in wildfire spread, and executing thorough spatiotemporal risk analyses of exposure.
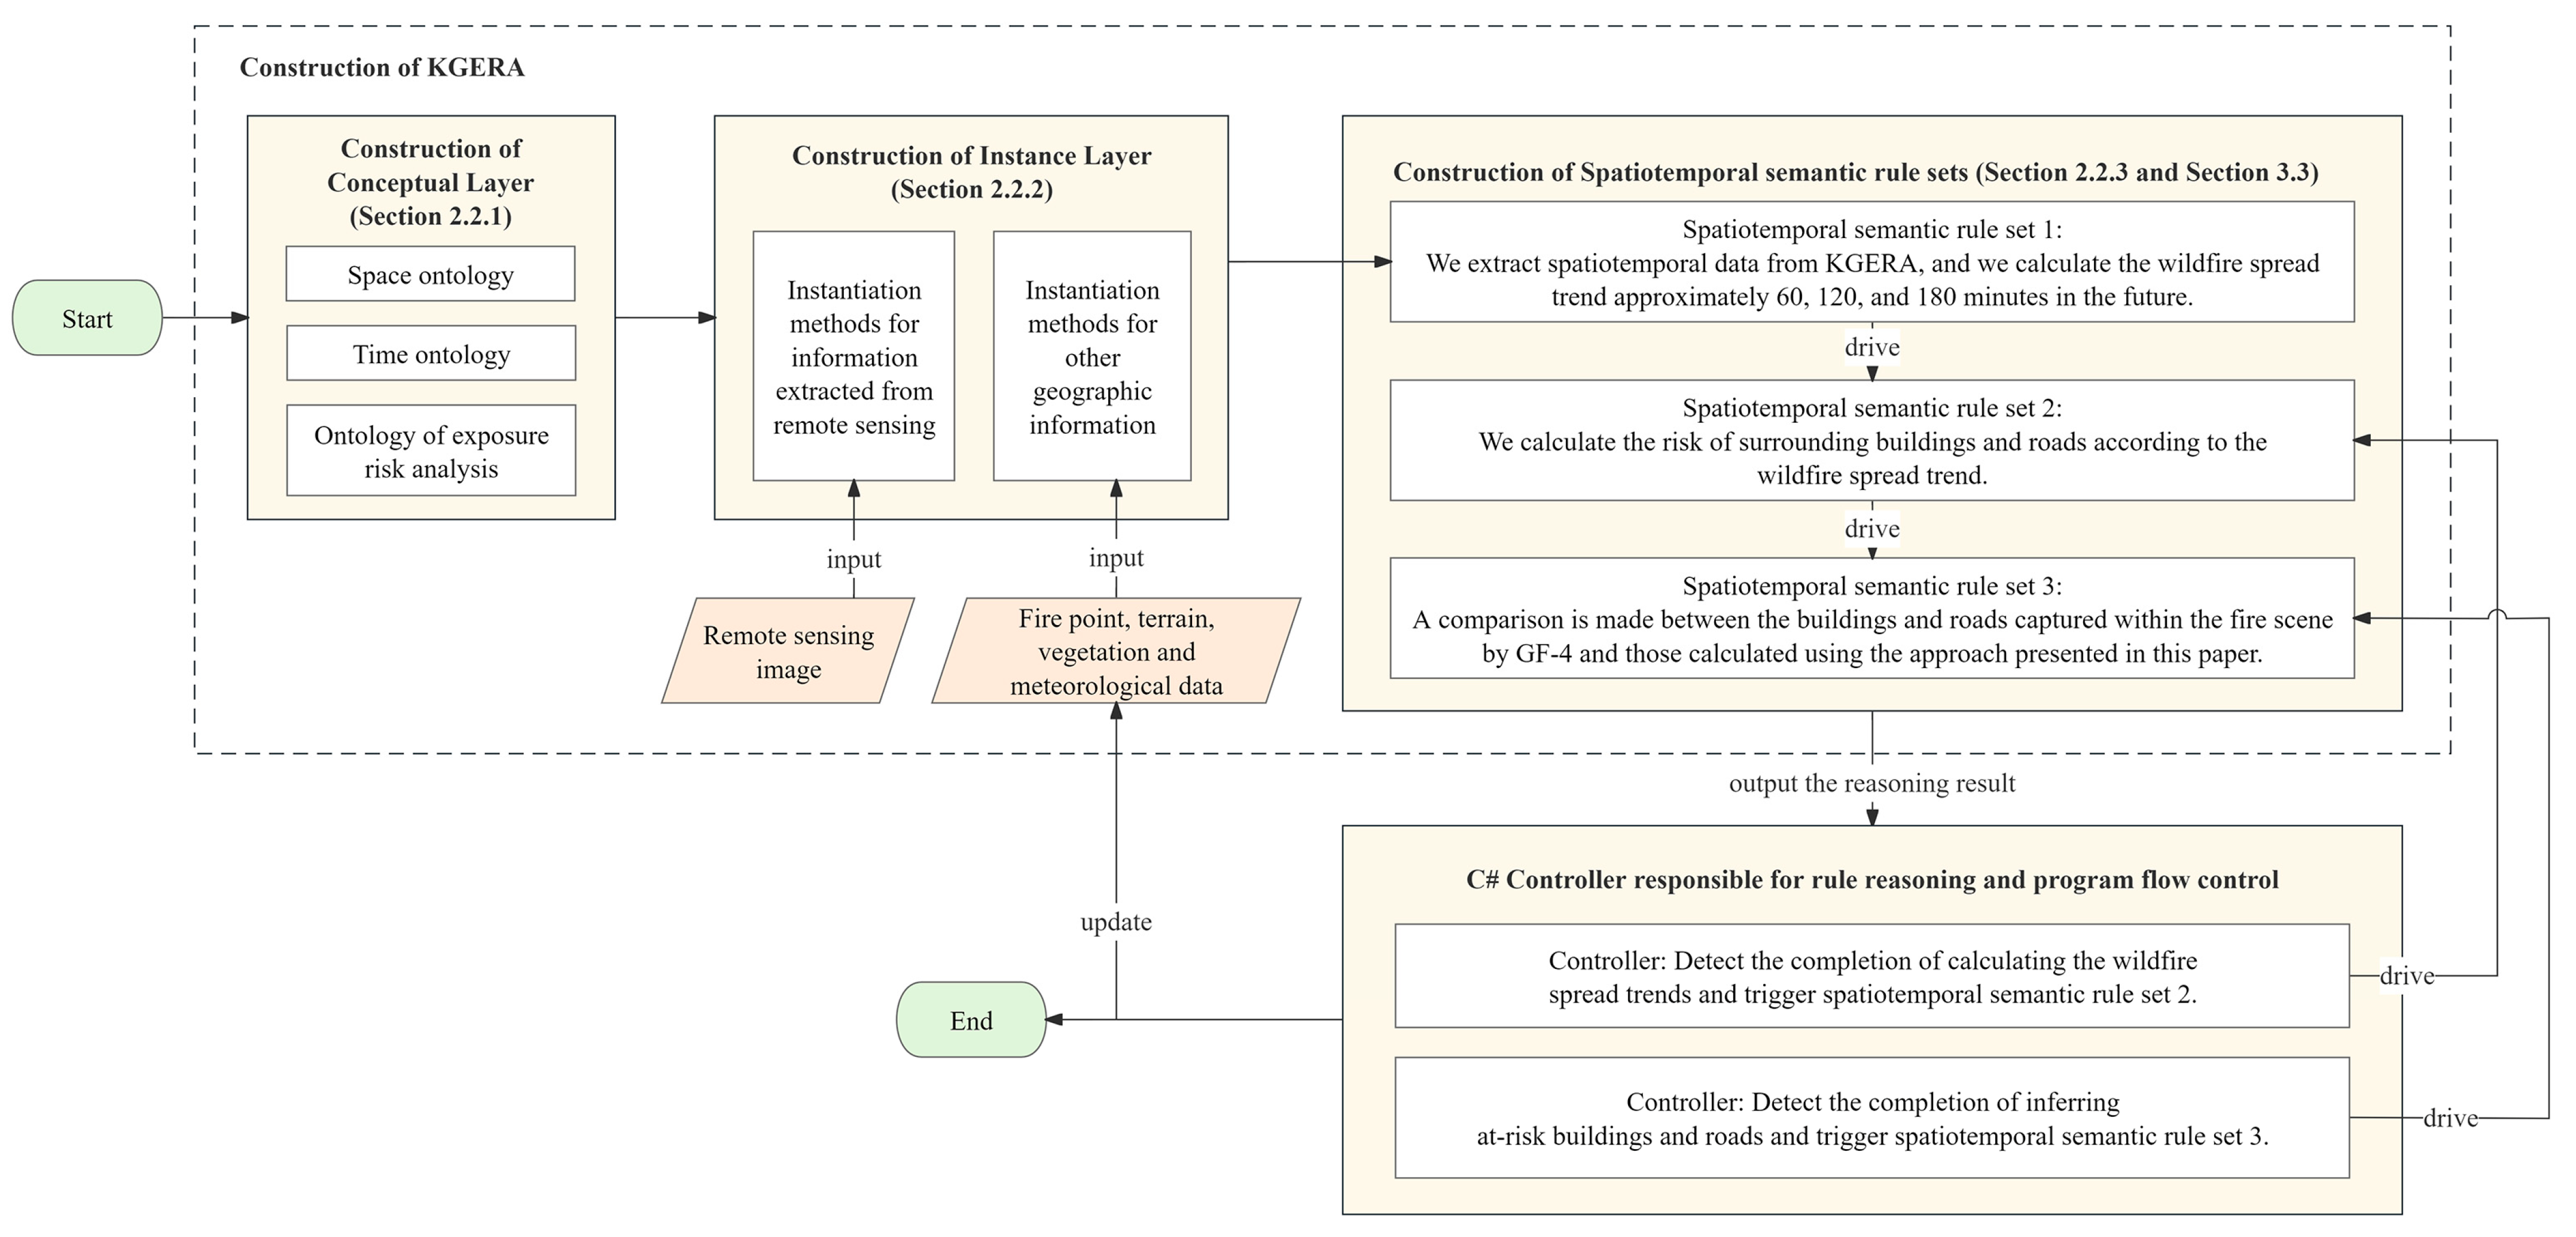
Figure 8 illustrates the various components of the KGERA in the experiment, including the establishment of the conceptual layer, the extraction of multi-source data information, and how this information is integrated into the KGERA. In the conceptual layer, the space ontology and time ontology specify semantic representations of the spatial and temporal dimensions, while the ontologies of exposure risk analysis define abstract concepts and their semantic relationships in exposure risk analysis for multi-source heterogeneous data.
In addition, the interaction between spatiotemporal semantic rule sets and the controller in Section 3.3 is also depicted in the figure. This process implements the use of rule inference to predict the future spread trend of wildfires and accurately retrieve buildings and roads at risk due to wildfires. Both of these analysis processes involve a significant amount of retrieval actions for specific spatiotemporal range data, especially the intermediate process of calculating wildfire spread speed based on TileCode units (as shown in Figure 14).
The KGERA can efficiently retrieve data based on the indexing structure in the temporal and spatial dimensions (as shown in Figure 19), providing critical technological support for faster identification and positioning of buildings and roads potentially threatened by wildfires.
3.1. Experimental Area
For our study, which focused on analyzing wildfire spread trends and executing spatiotemporal risk assessments of exposure, Xichang City in the Liangshan Yi Autonomous Prefecture, Sichuan Province, China, was selected as the experimental location.
Geographically, Xichang City spans longitudes from 101°46′ to 102°25′ east and latitudes from 27°32′ to 28°10′ north, encompassing an area of approximately 2882.9 square kilometers. Characterized by dense vegetation and a dry climate, the region is prone to wildfires. Historically, Xichang has experienced several significant wildfire events, some of which have led to casualties among responders. These aspects make Xichang an ideal location for this research. For a comprehensive understanding of the experimental data, Table 1 provides detailed information, including the data sources and specific aspects of the data.
3.2. Remote Sensing Information Extraction Model for Buildings
Building extraction in our study was carried out using ensemble learning, a method that combines multiple models to achieve more accurate learning outcomes. This approach involves creating a set of ‘individual learners’ and strategically amalgamating them. Model selection in ensemble learning follows the ‘good but different’ principle [20], suggesting that combined predictions benefit from integrating models with high individual accuracy and distinct characteristics. The application of ensemble learning aims to enhance both the precision and robustness of the building extraction process.
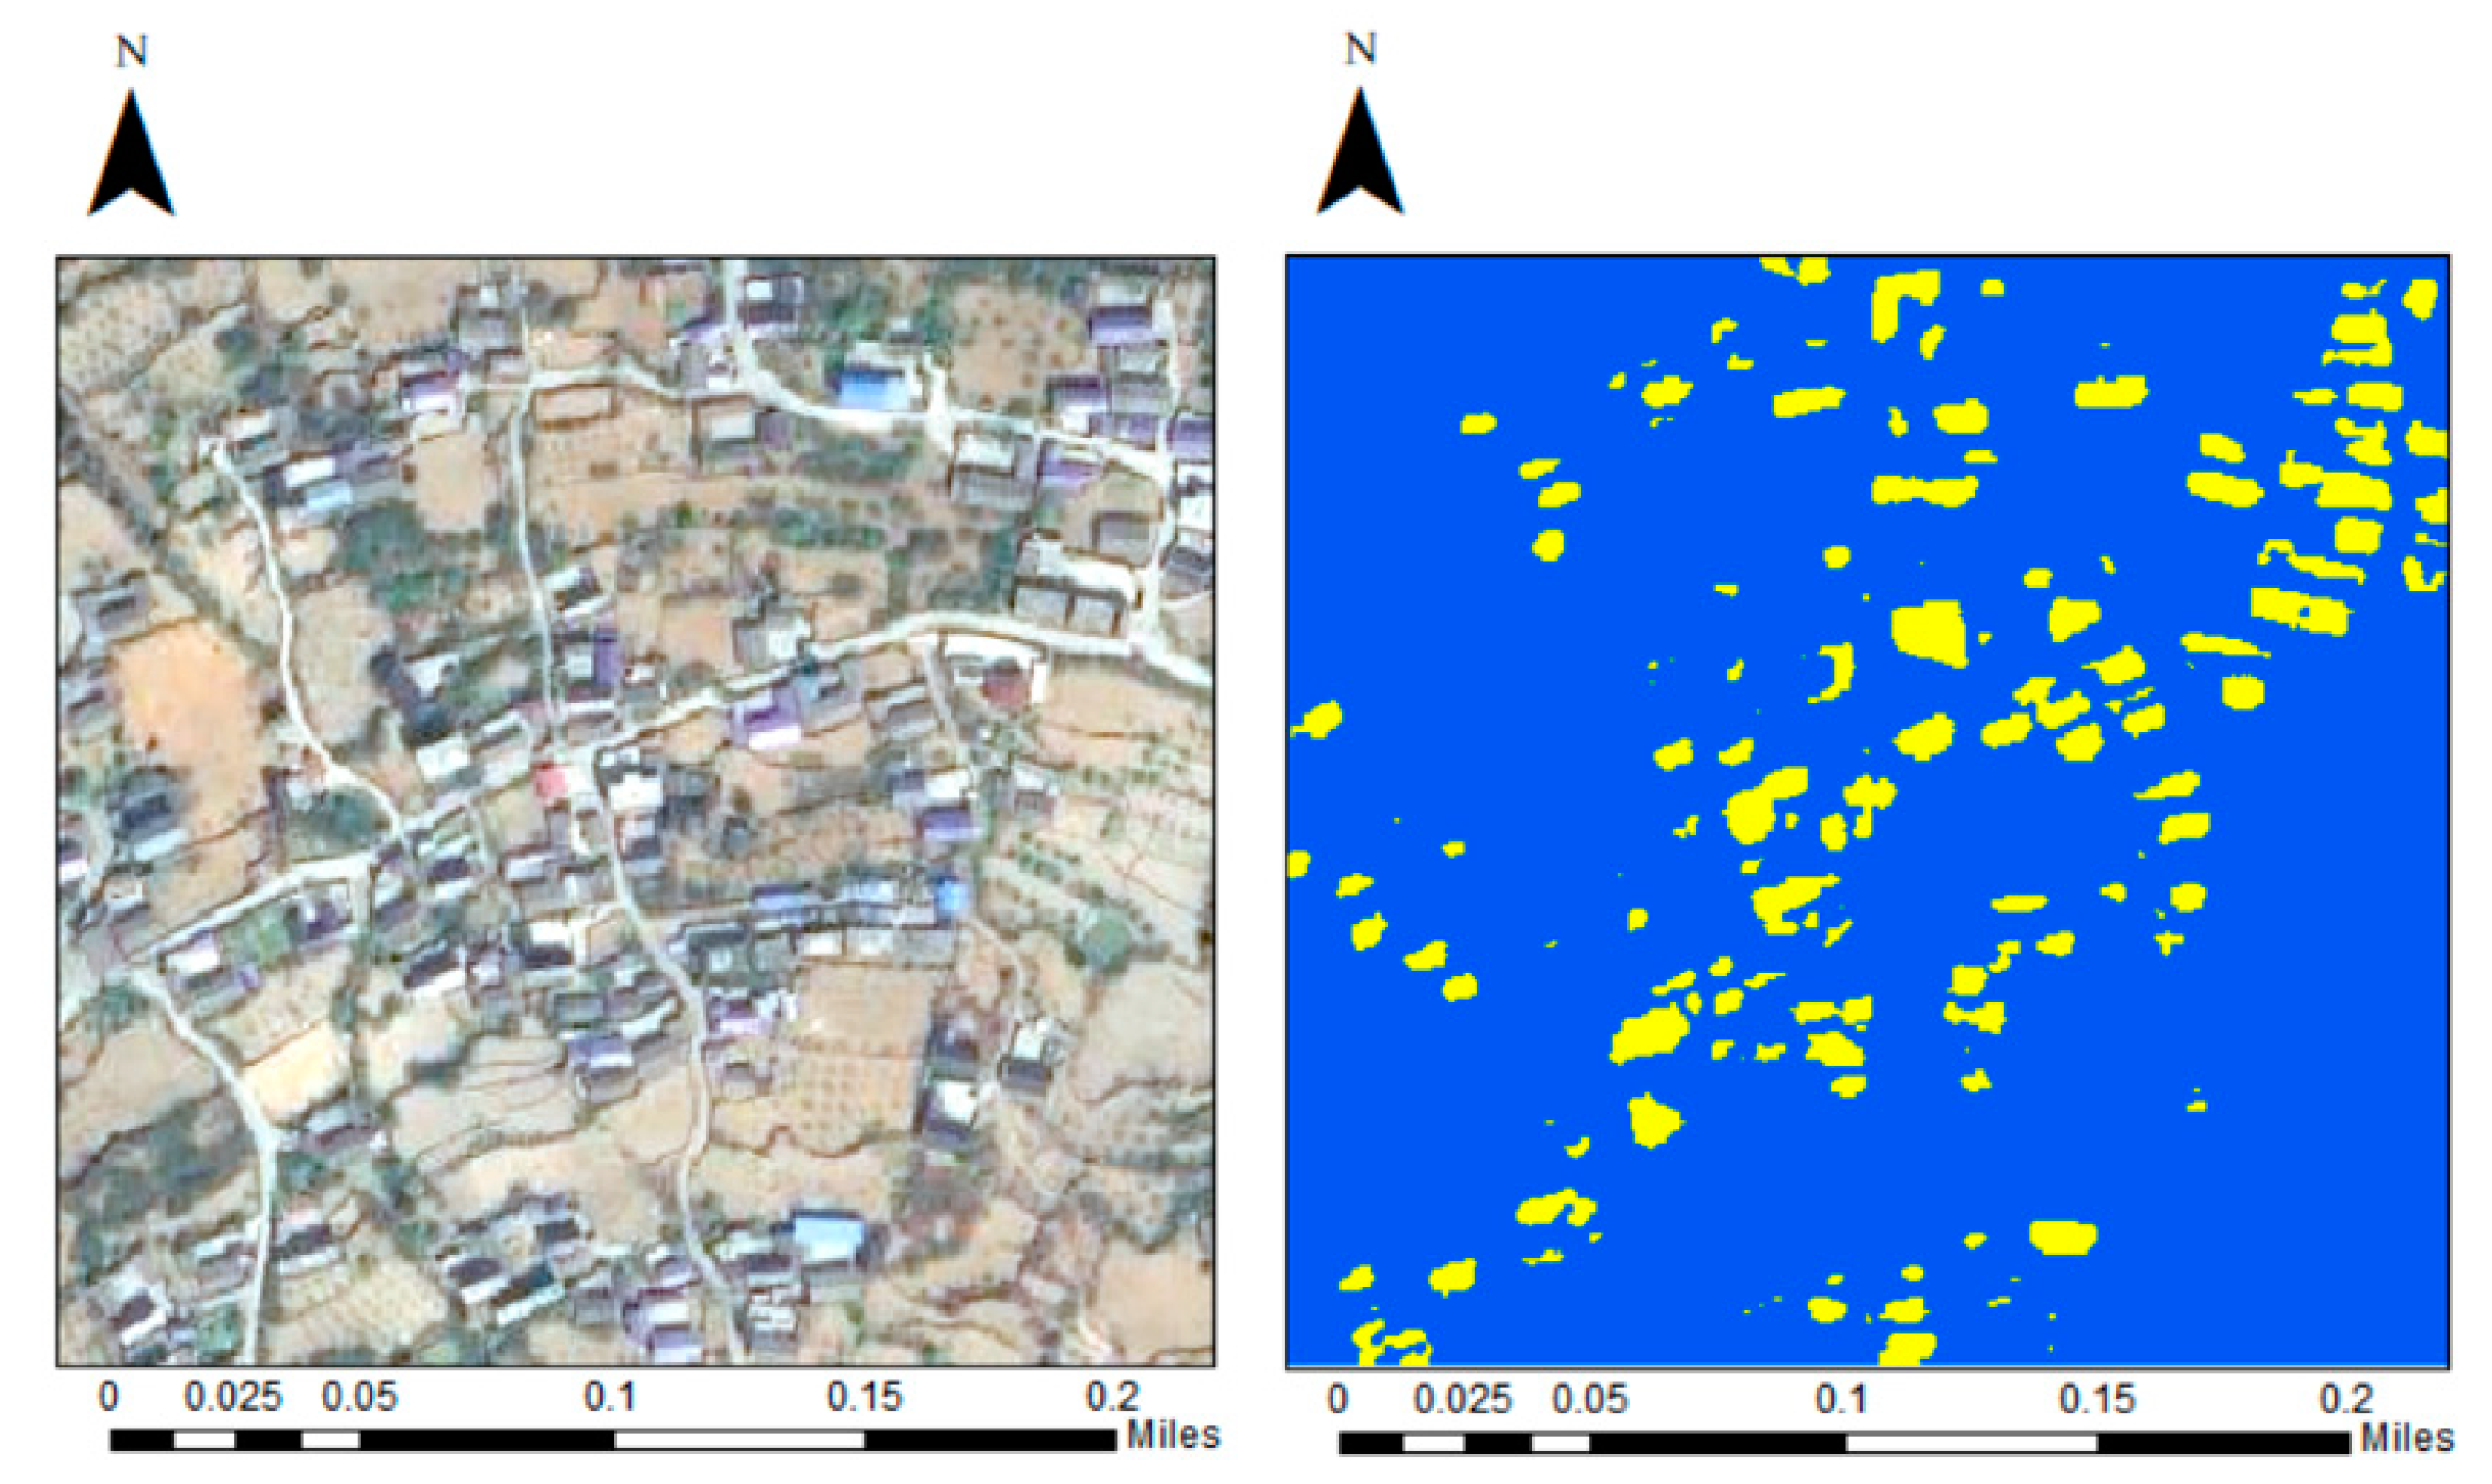
Different CNN models can be constructed through hyperparameter adjustments or alternative network architectures. When enhancing the accuracy of a single CNN model proves difficult, the integration of multiple, varied CNN models can capitalize on their unique strengths and differences, thereby achieving higher accuracy. We implemented the building extraction model developed by Chen et al. [20], which underwent validation testing. These tests showed that the F1-value for single-building extraction achieved an advanced level of 0.908. Moreover, the extracted building data were cross-verified with electronic maps, yielding satisfactory accuracy. The building extraction results for Xichang City are illustrated in Figure 9.
3.3. Construction of KGERA
In our case study, we employed Protégé [41] to develop the conceptual layer of the KGERA, which entailed formulating ontologies for time, space, wildfire spread analysis, and spatiotemporal risk assessment of exposure. These crafted ontologies provide a structured framework that adequately models the temporal, spatial, and attribute aspects of the data.
We also developed the instance layer of the spatiotemporal knowledge graph, focusing on March 2019 to March 2020, a time during which Xichang City experienced significant wildfire events over two consecutive years. The date 31 March 2020 was chosen as the target date for our analysis. On this date, we compiled a variety of data types, including meteorological, terrain, vegetation, and exposure data, relevant to both wildfire spread and exposure risk analyses. These data were subsequently transformed into the instance layer of the knowledge graph for integrated analysis, as described in Section 2.2.2. Figure 10 displays the instances of buildings and roads within this layer.
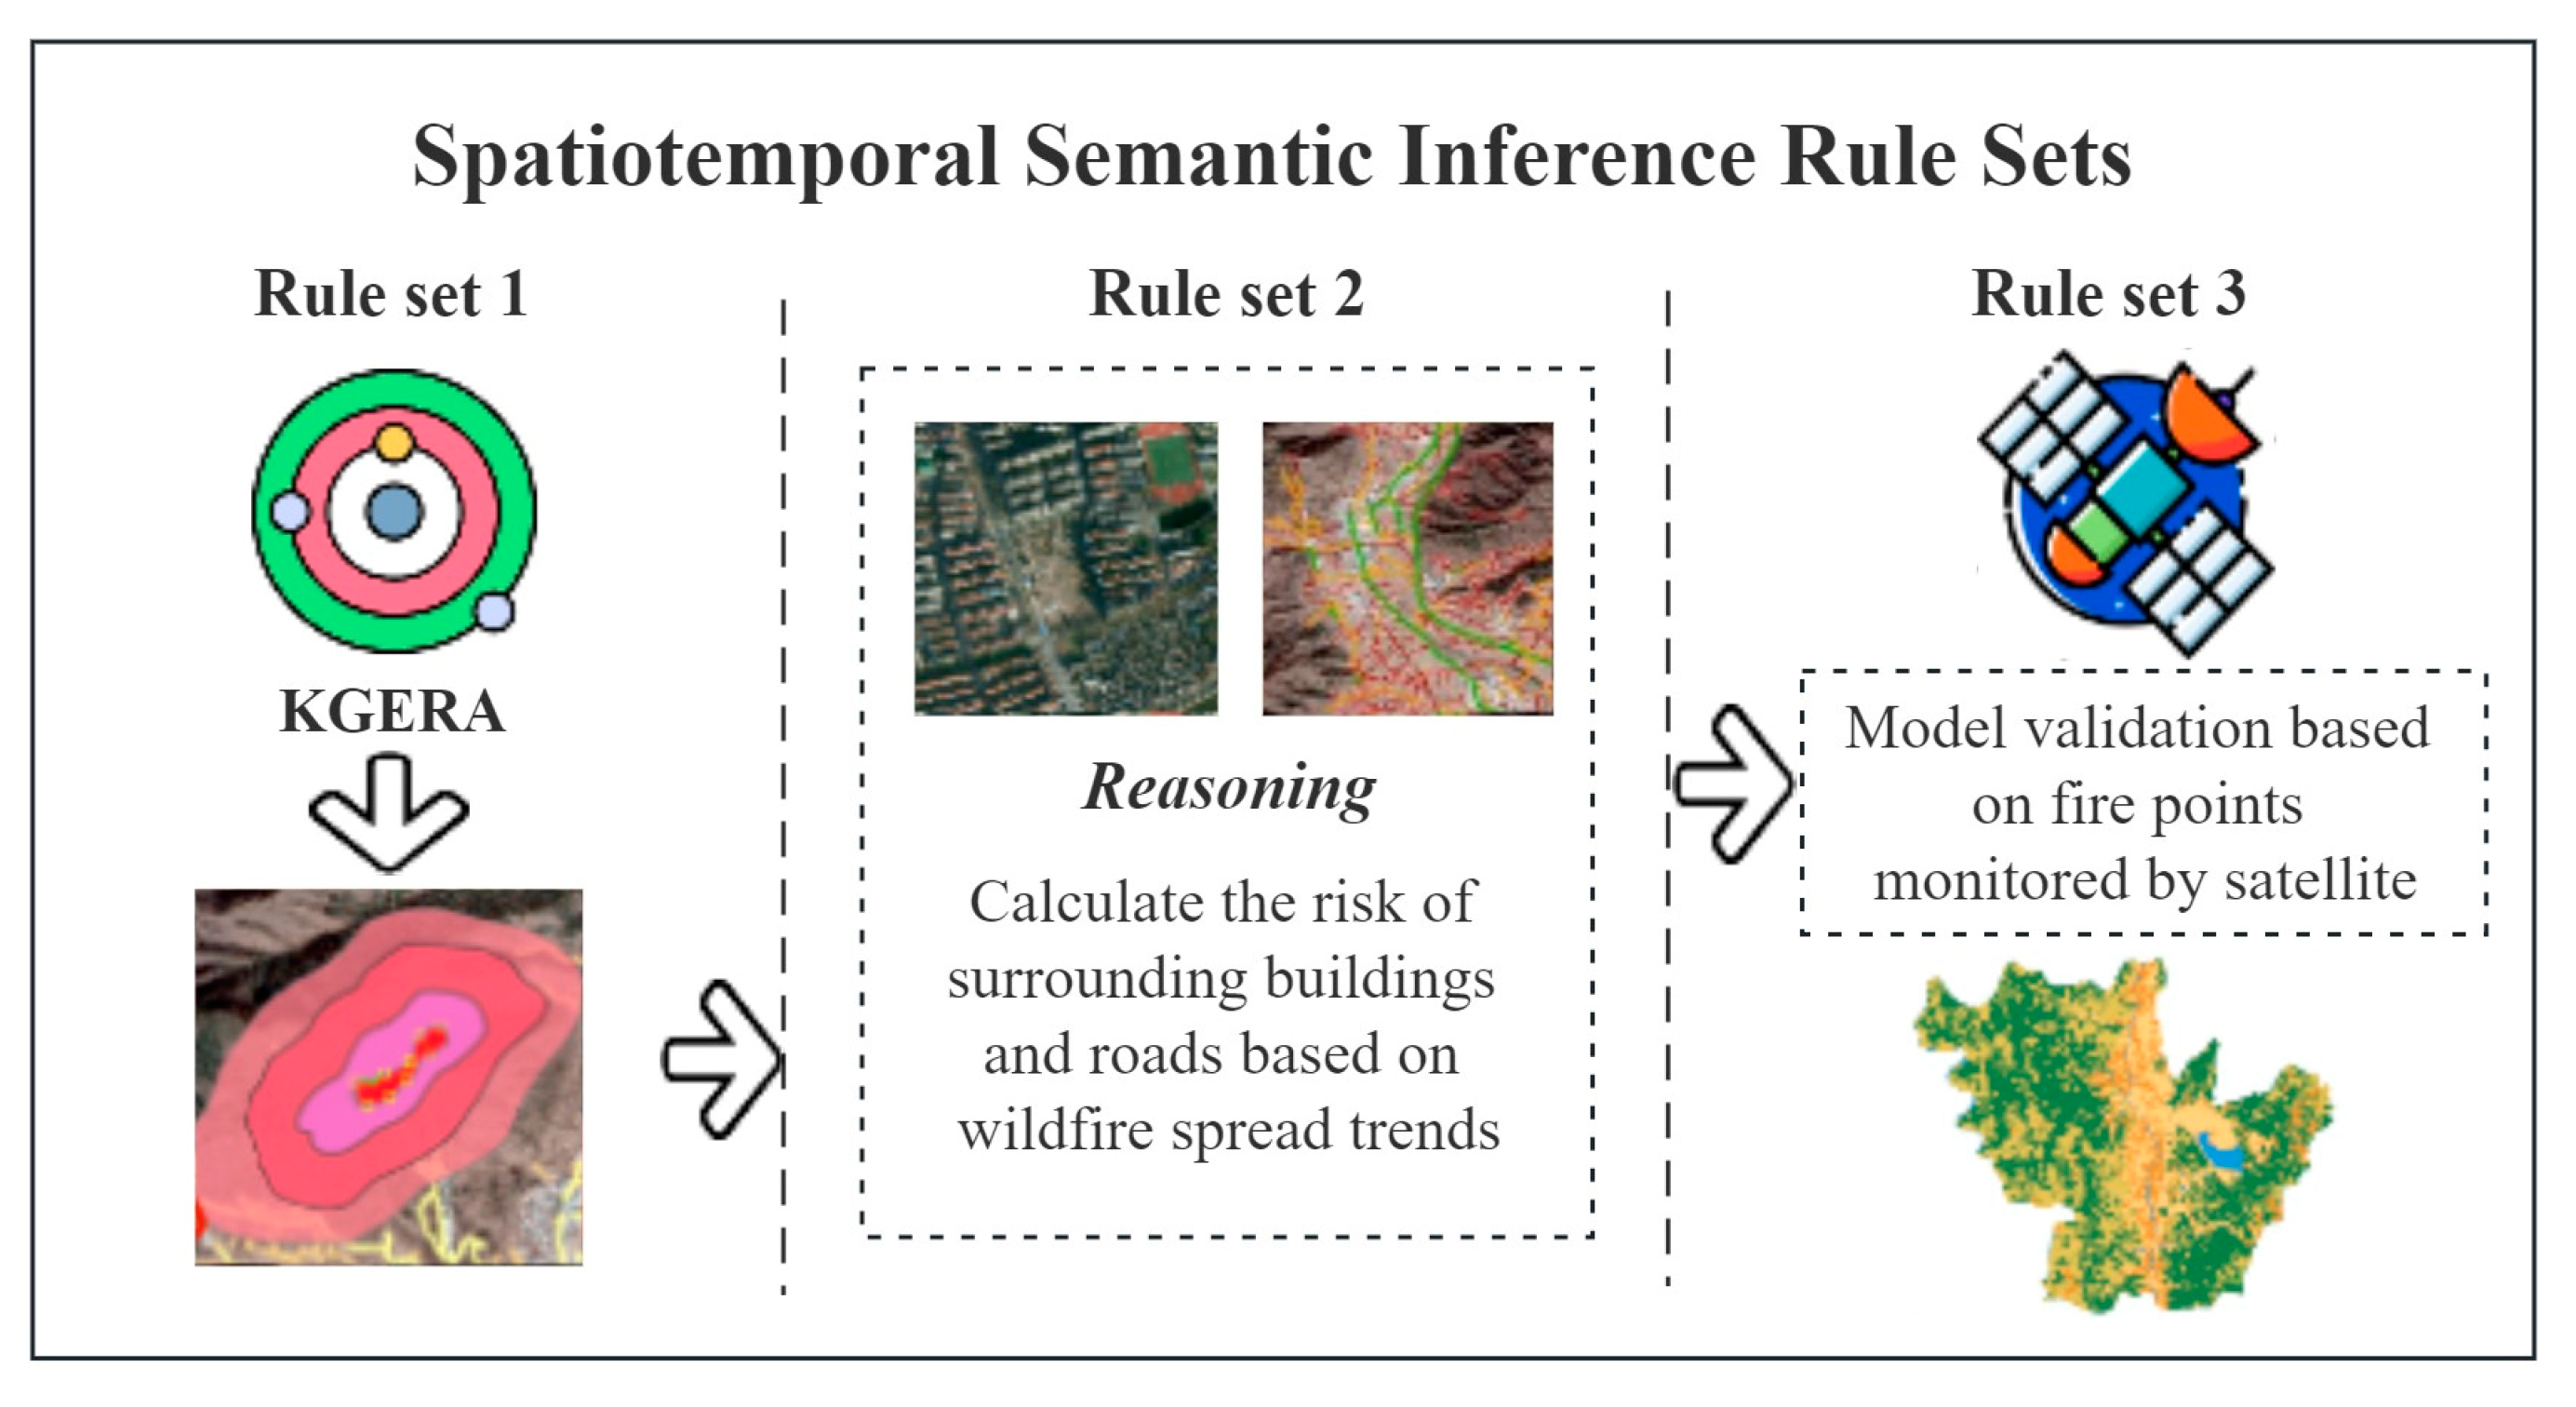
In our case study, we converted the specialized knowledge required for analyzing wildfire spread trends and performing spatiotemporal exposure risk assessments into a set of spatiotemporal semantic reasoning rules. These rules, as depicted in Figure 11, comprehensively represent the essential knowledge and logical connections pertinent to these analytical tasks.
- Spatiotemporal Semantic Rule Set 1: Utilizing historical fire data from Xichang City on 31 March 2020, we gathered spatiotemporal information via the KGERA and estimated the trends in wildfire spread over future intervals of 60, 120, and 180 min;
- Controller Function: The controller calculates the complete wildfire spread trend and subsequently activates Spatiotemporal Semantic Rule Set 2;
- Spatiotemporal Semantic Rule Set 2: Leveraging inference rules, we assess the risk to nearby buildings and roads based on the predicted wildfire spread trajectory;
- Controller Function: Upon determining the completion of risk assessment for buildings and roads, the controller initiates Spatiotemporal Semantic Rule Set 3;
- Spatiotemporal Semantic Rule Set 3: To validate the accuracy of our methodology, we compare the buildings and roads within the wildfire scene as captured using GF-4 satellite imagery against those identified through our proposed analytical approach.
At present, in China, the Zhengfei Wang model [42] and the Rothermel model [43] are the most widely used wildfire simulation models. For our Rule Set 1, the Zhengfei Wang model was selected as the foundational framework for predicting wildfire spread. However, the applicability of Zhengfei Wang’s model is limited to terrains with slopes of less than 60°. For steeper slopes exceeding 60°, the model’s quantitative outputs significantly deviate from the expected values. Consequently, Xianmin Mao revised the model to enhance its accuracy for steeper terrains. Xianmin Mao’s [44] basic formulations for wildfire spread speed are presented in Formulas (1) and (2):
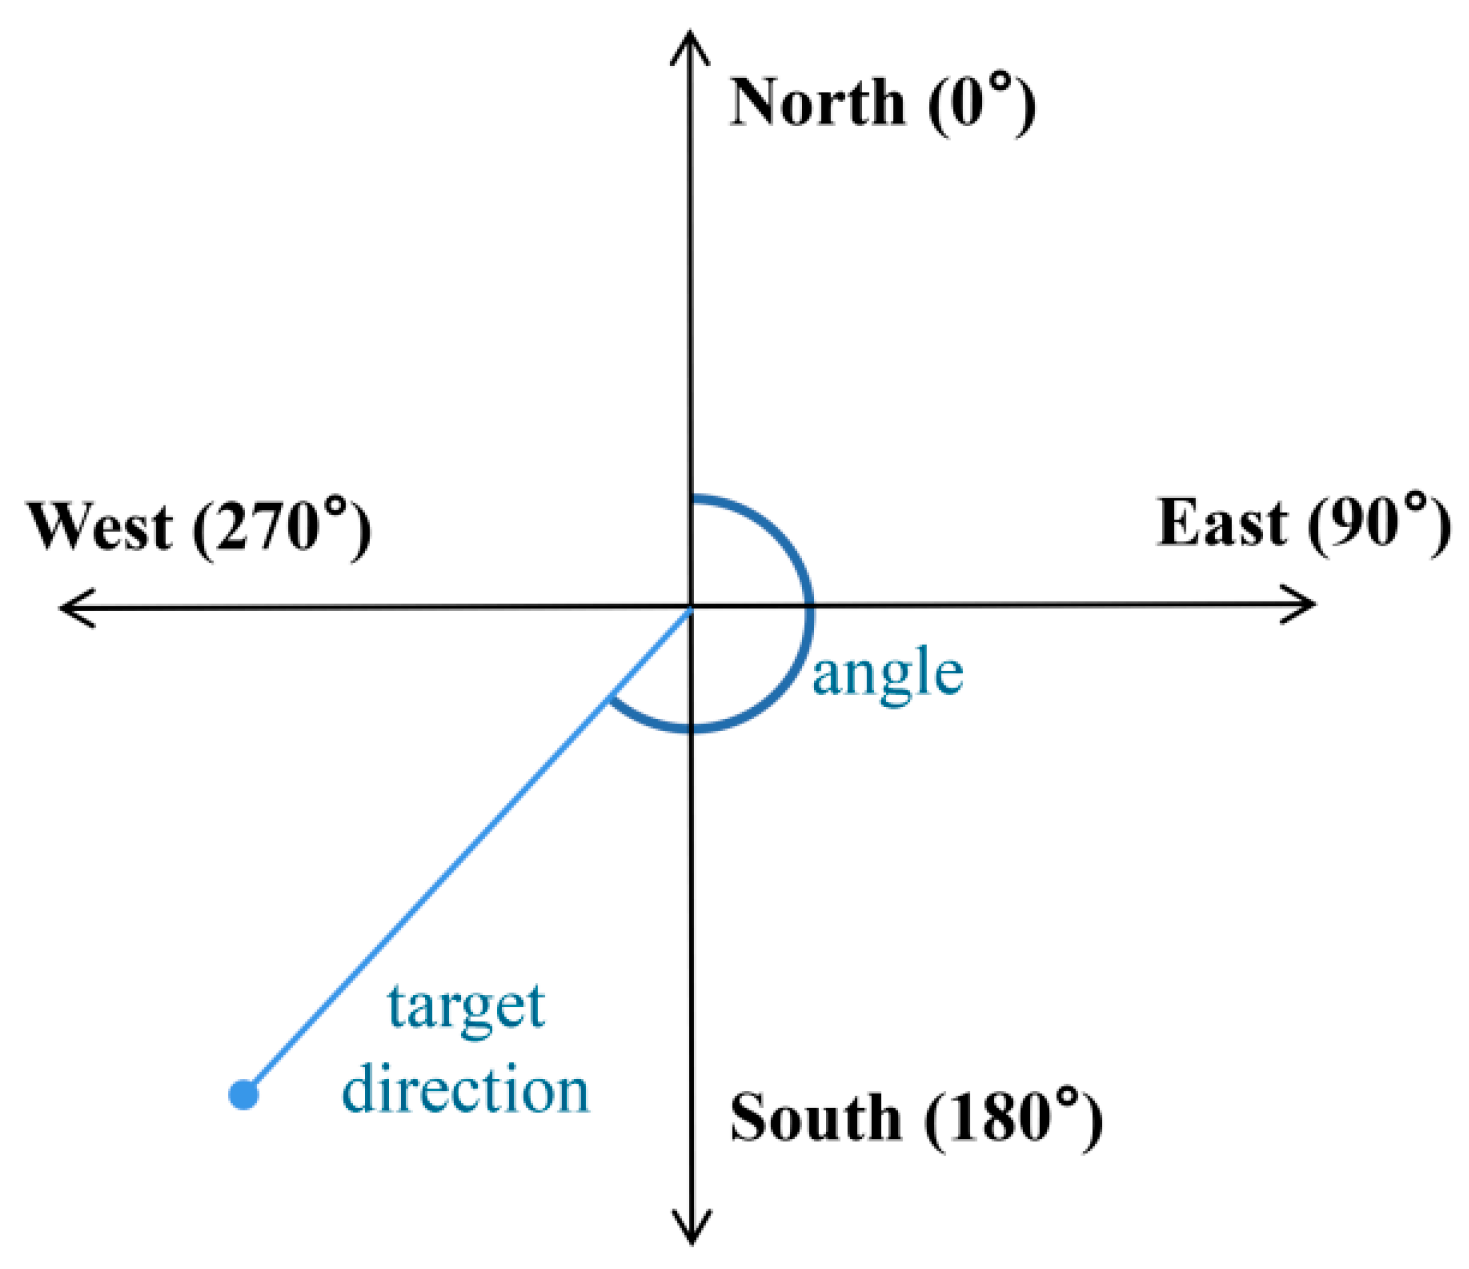
where is the wildfire spread speed (m/s), is the slope (°), is the wind speed (m/s), is the daily maximum temperature (°C), is the noon average wind level (level), and is the daily minimum humidity (%). , , , and are constants, where = 0.03, = 0.05, = 0.01, and = 0.3. Table 2 shows the values of , and the definitions of each variable angle and coordinate axis are shown in Figure 12. In Formulas (1) and (2), the wind direction, aspect, and fire spread direction are defined, with 0 degrees representing the north direction and the angles increasing in a clockwise direction.
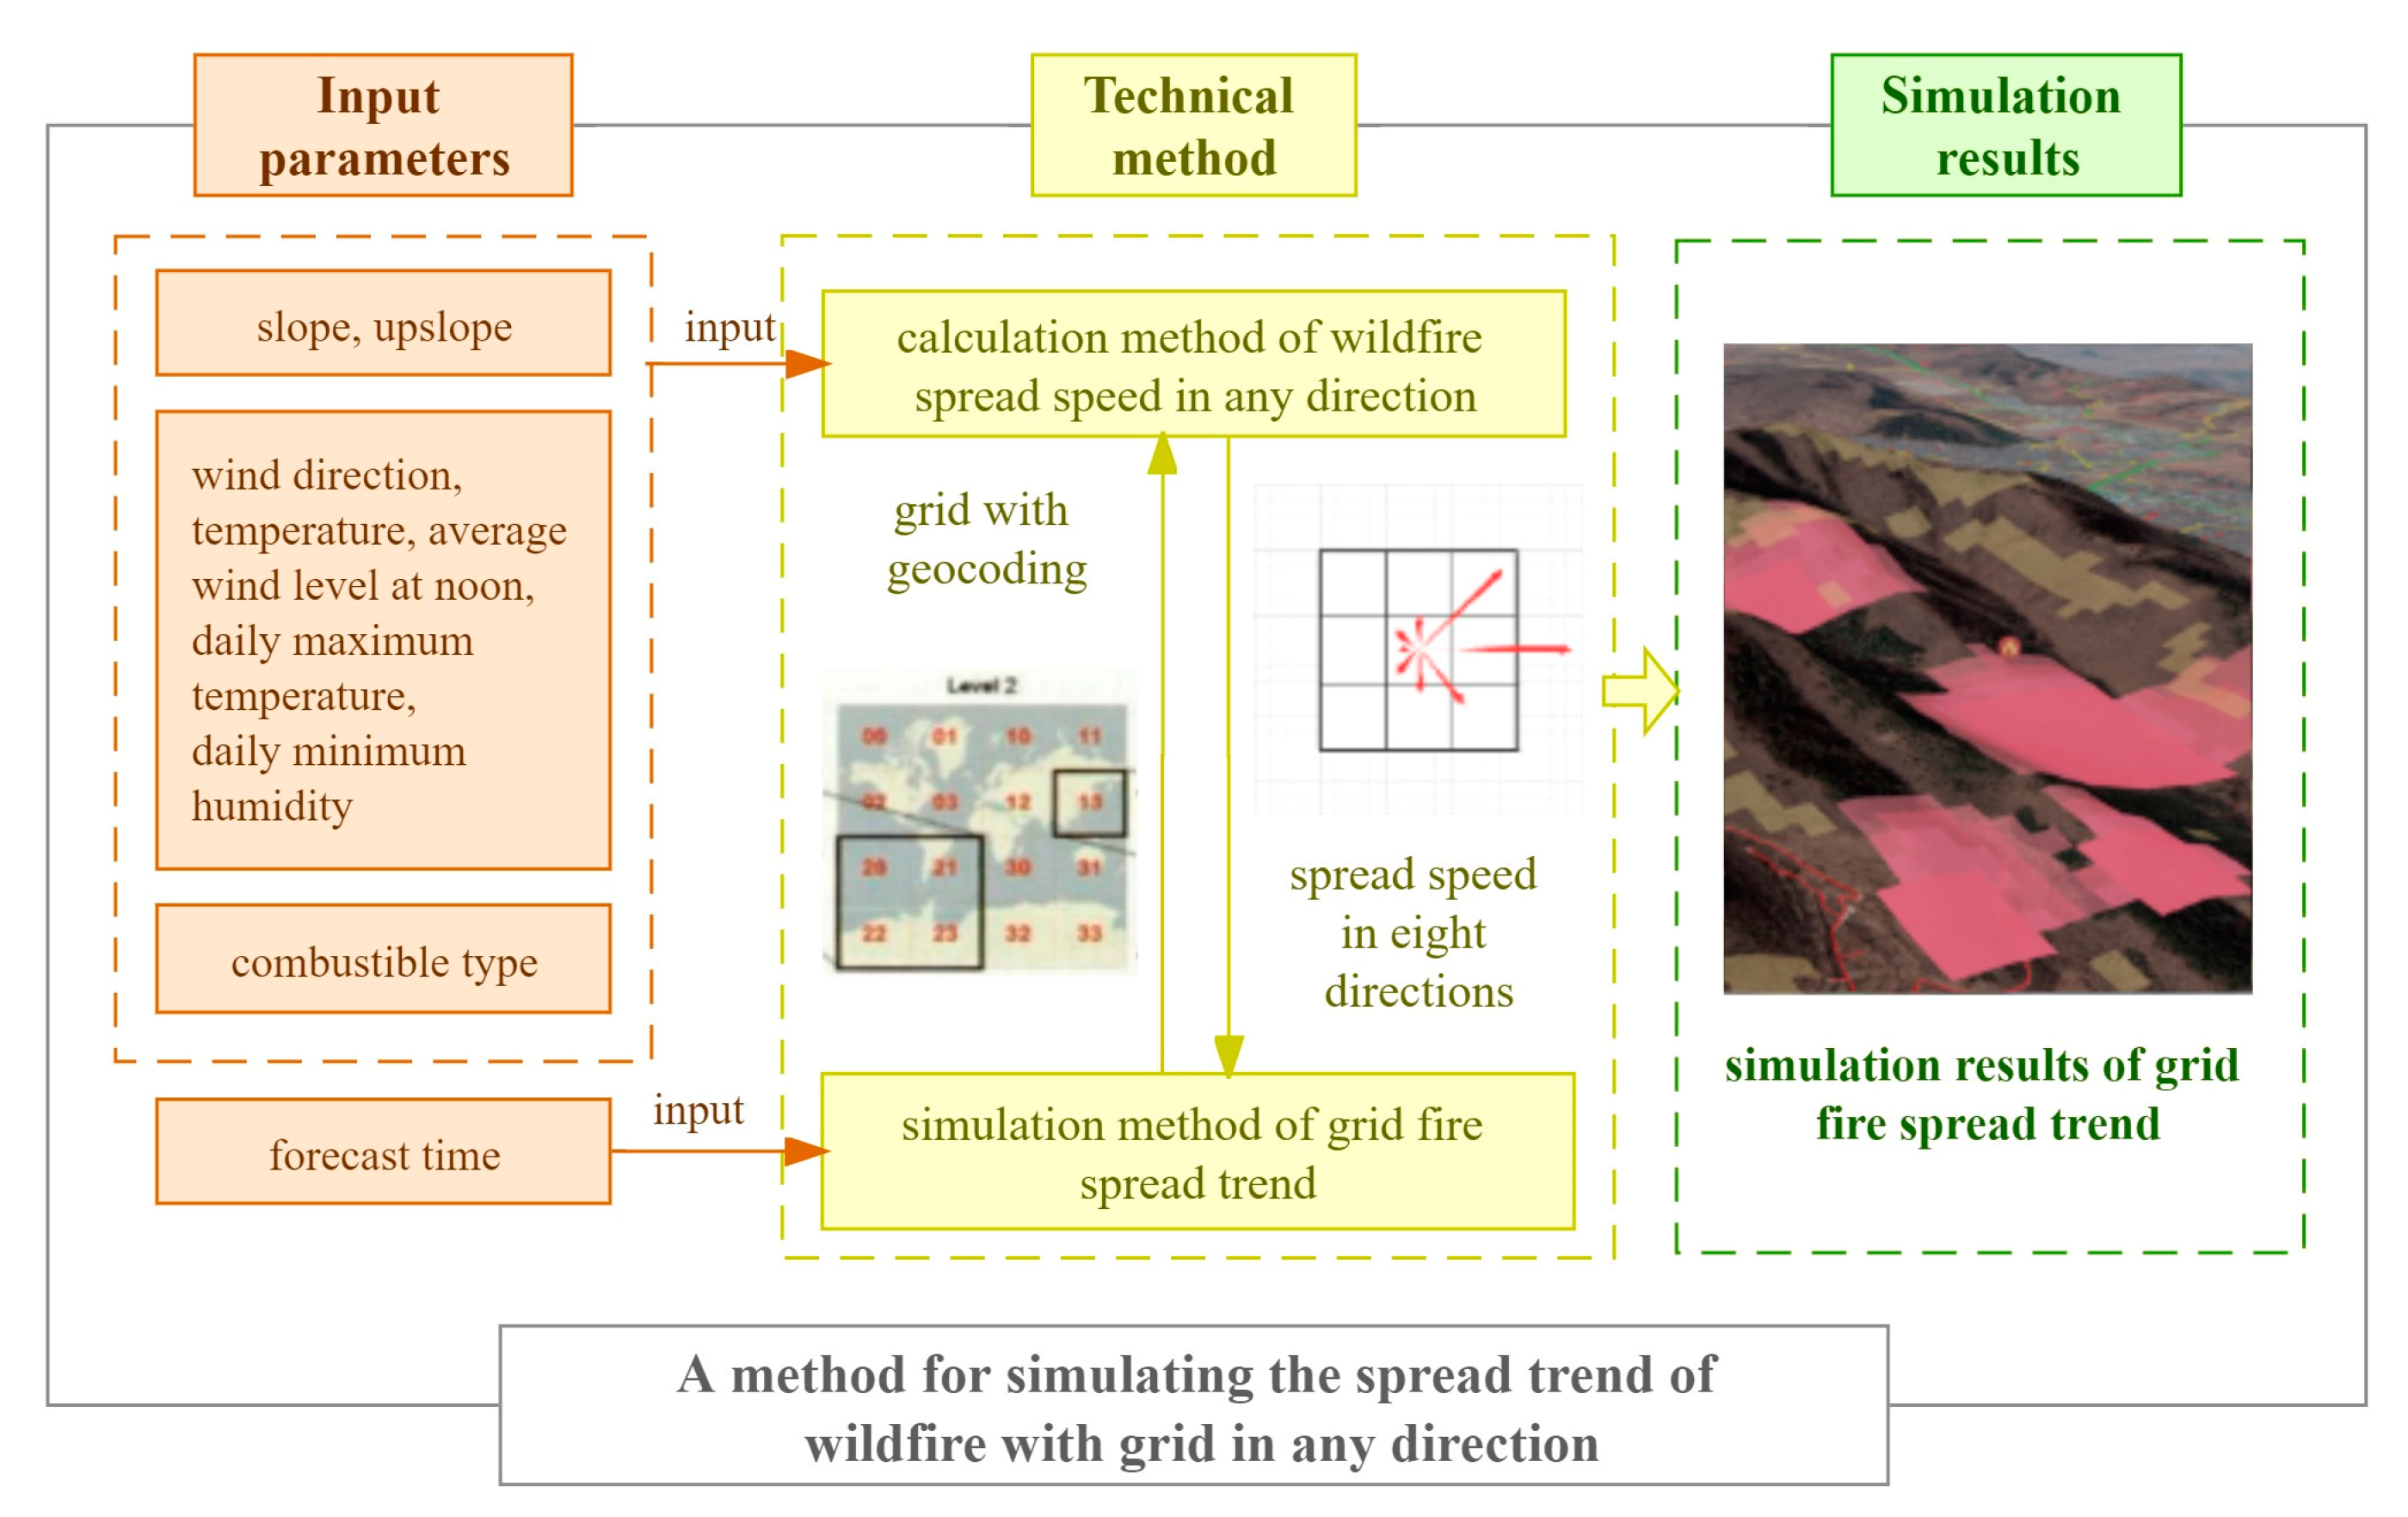
Considering the impacts of wind and terrain, Mao modified the model to categorize the spread speed into various directional components: uphill, downhill, left flat slope, right flat slope, and windward. This approach yielded a maximum of five directional spread velocities. However, these five directional speeds do not directly reveal the overall future spread range. Consequently, a method capable of calculating wildfire spread speeds in any direction and projecting future spread ranges is needed.
In our study, we introduce a grid-based method to simulate wildfire spread trends in any direction. The structure of this method is shown in Figure 13.
In our technical approach, we incorporate the influence of both wind and terrain factors over the spread of wildfires. To account for the effect of wind, we introduce a correction term that considers the angle between the fire spread speed and the upslope direction. This correction helps adjust the wind action term accordingly. Similarly, we also consider the impact of terrain through a correction term , which accounts for the angle between the fire spread speed and the azimuth of the wind direction. By incorporating these corrections, we can more accurately assess the combined effect of wind and terrain on the spread of wildfires. Finally, we obtain the wildfire spreading speed in any direction, as shown in Formulas (3) and (4):
where is the angle at which the fire spread speed is calculated, is the upslope direction, is the wind direction, is the wildfire spread speed (m/s), is the slope (°), and is the wind speed (m/s). Table 2 shows the values of , and the definitions of each variable angle and coordinate axis are shown in Figure 12.
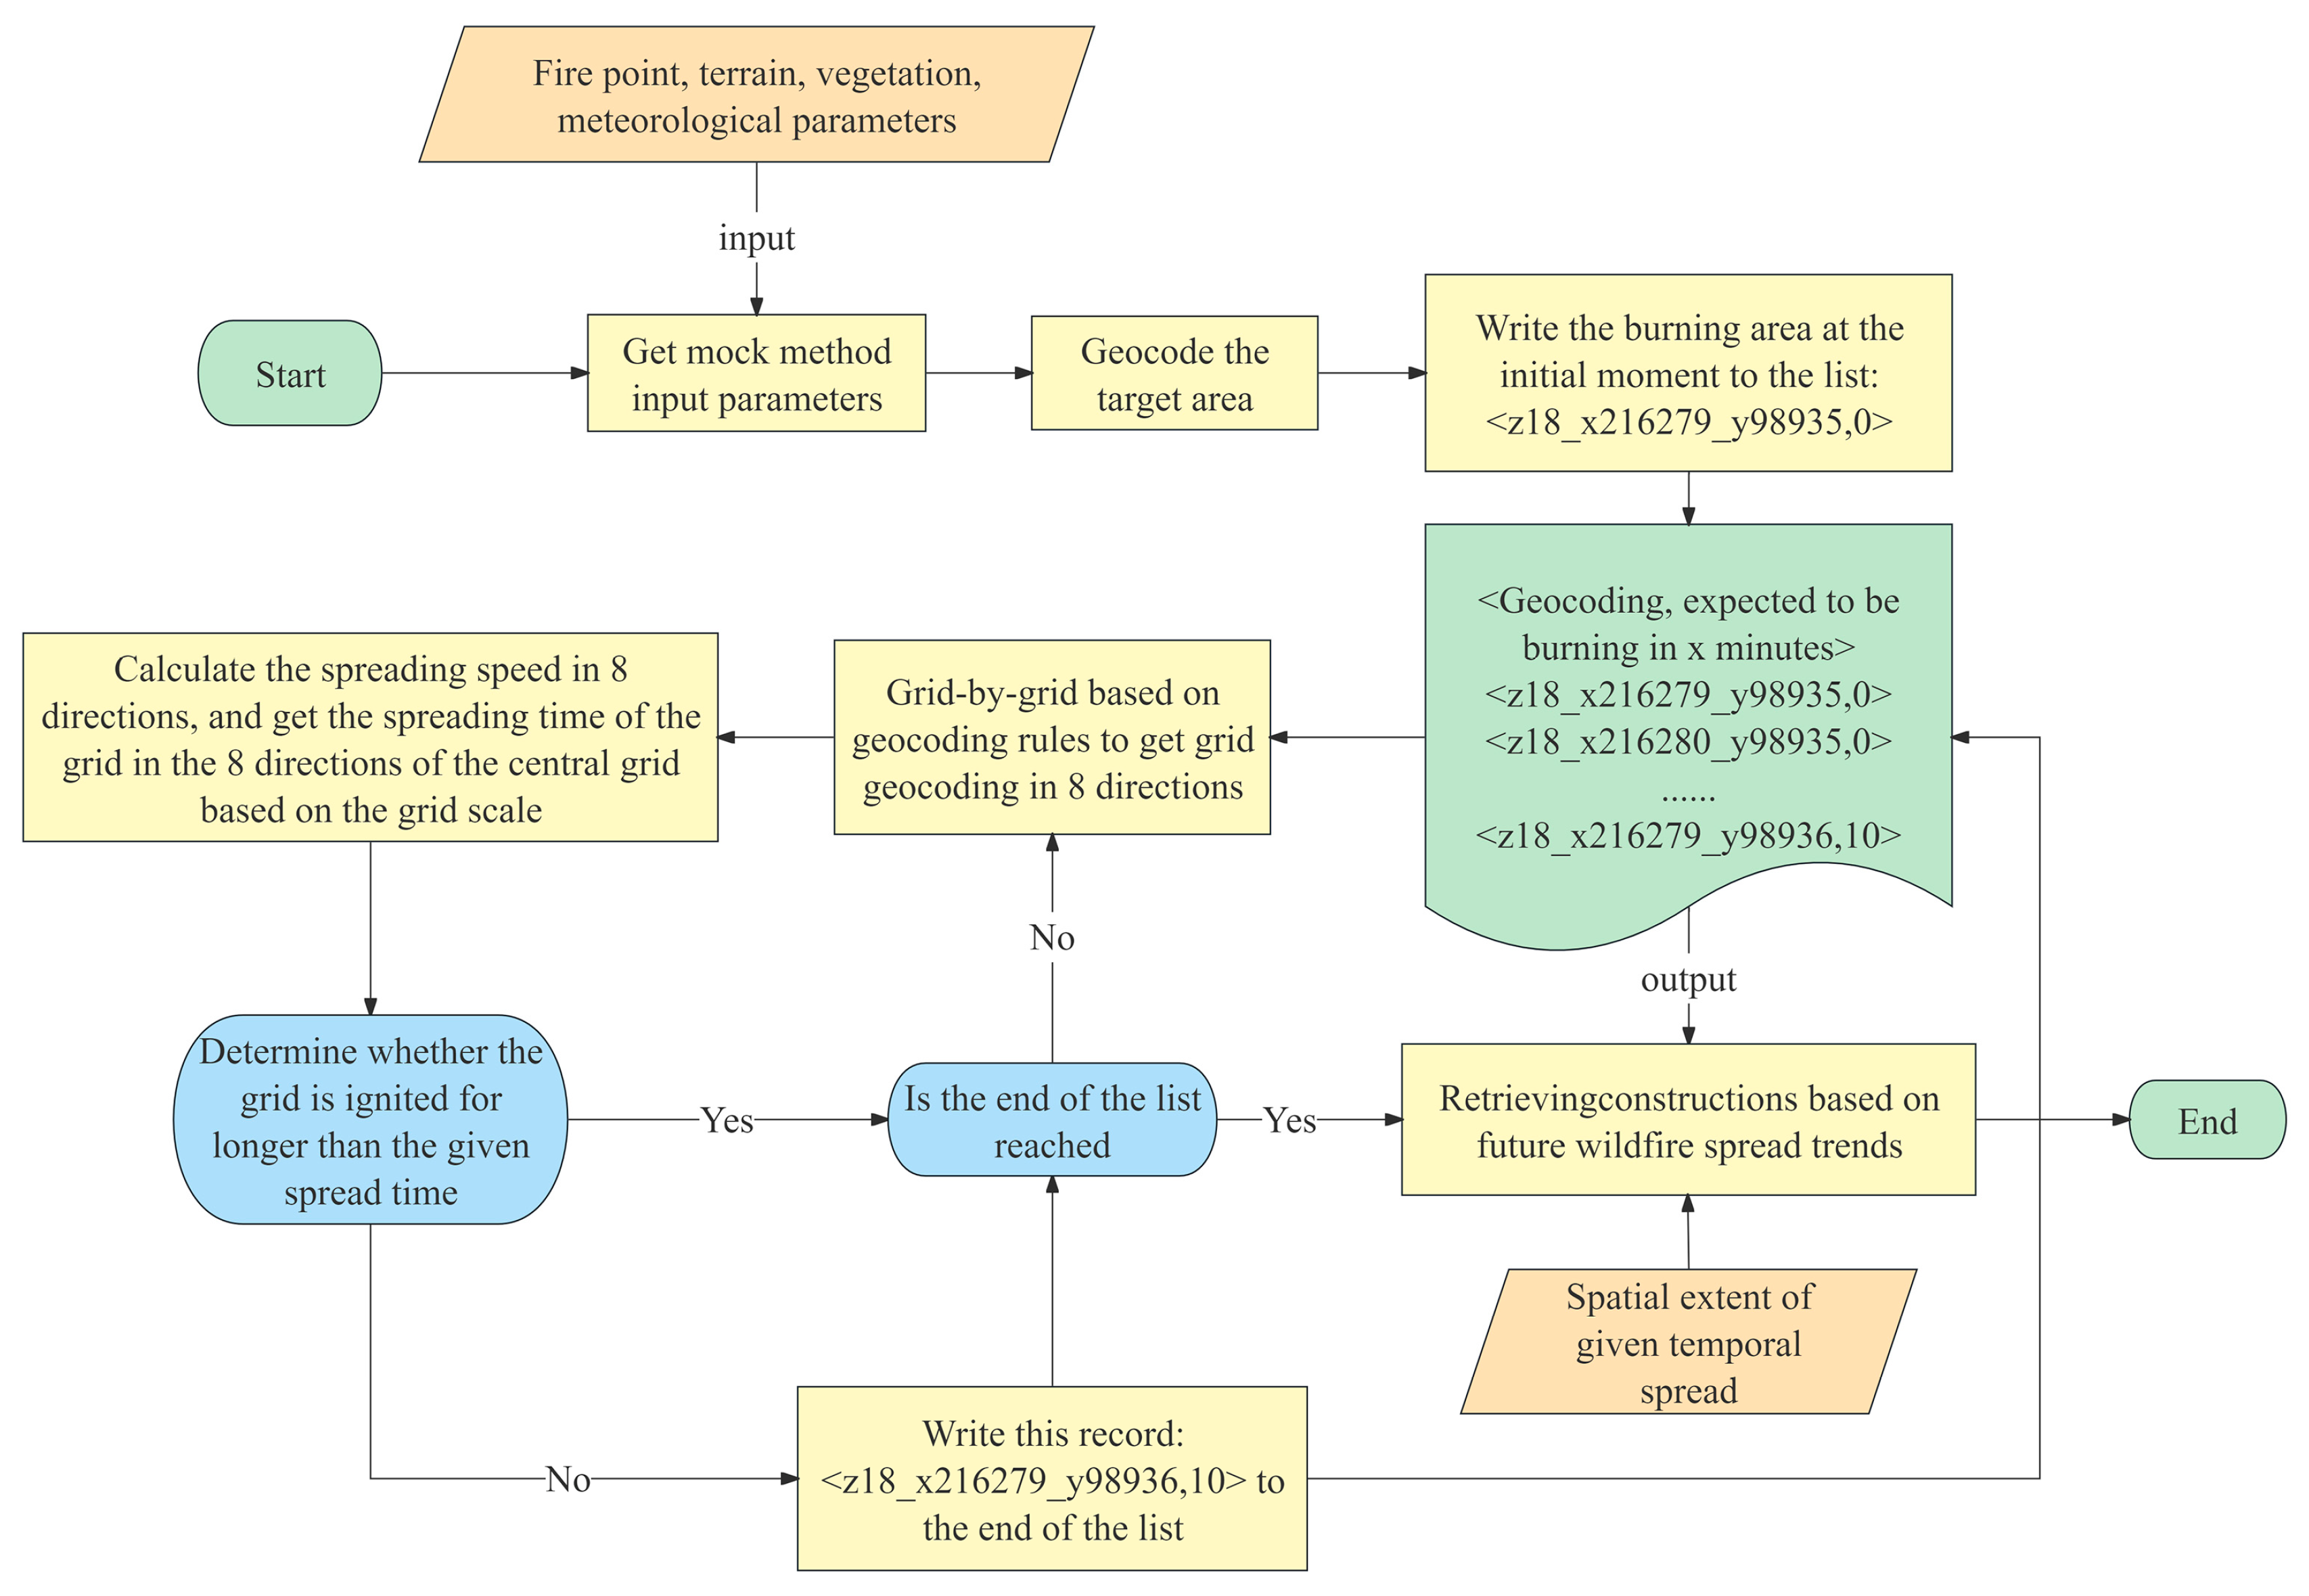
Based on Formulas (3) and (4), the spreading velocity in any direction of the plane can be calculated. We further propose a gridded wildfire spread trend simulation method, as shown in Figure 14. This method can calculate the spread plane based on the velocity vector, which is beneficial for predicting the spatiotemporal range of wildfire spread and spatiotemporal risk analysis of exposures.
First, we obtain the input parameters of the simulation method, including the geocoding level, specified spread time, ignition point-slope, upslope direction, wind direction, daily maximum temperature, daily minimum humidity, and average wind level at noon. Next, we geocode the target area at a specified scale and write the geocoding and spread time of the burning area at the initial moment on the list. Then, we used the grids as the center grids one by one and obtained a total of eight directions (north, northeast, east, southeast, south, southwest, west, and northwest) based on the geocoding rules in four directions. Subsequently, based on multi-source data and Formulas (3) and (4), we calculate the spreading speed in eight directions and obtain the north and northeast directions of the center grid based on the grid scale and grid side length as well as the east, southeast, south, southwest, west, and northwest grid spreading times in eight directions. Subsequently, we add the spreading time in eight directions from the center grid to the spreading time from the center grid, and we determine whether the time exceeds the given time. If the spread time is not exceeded and the center grid is not the last element in the list, we continue to execute the algorithm. Finally, all the grids in the list are calculated; we output the union of the spatial ranges corresponding to the grids in the list, that is, the spatial range expected to spread within a given time, and we retrieve the exposures at risk.
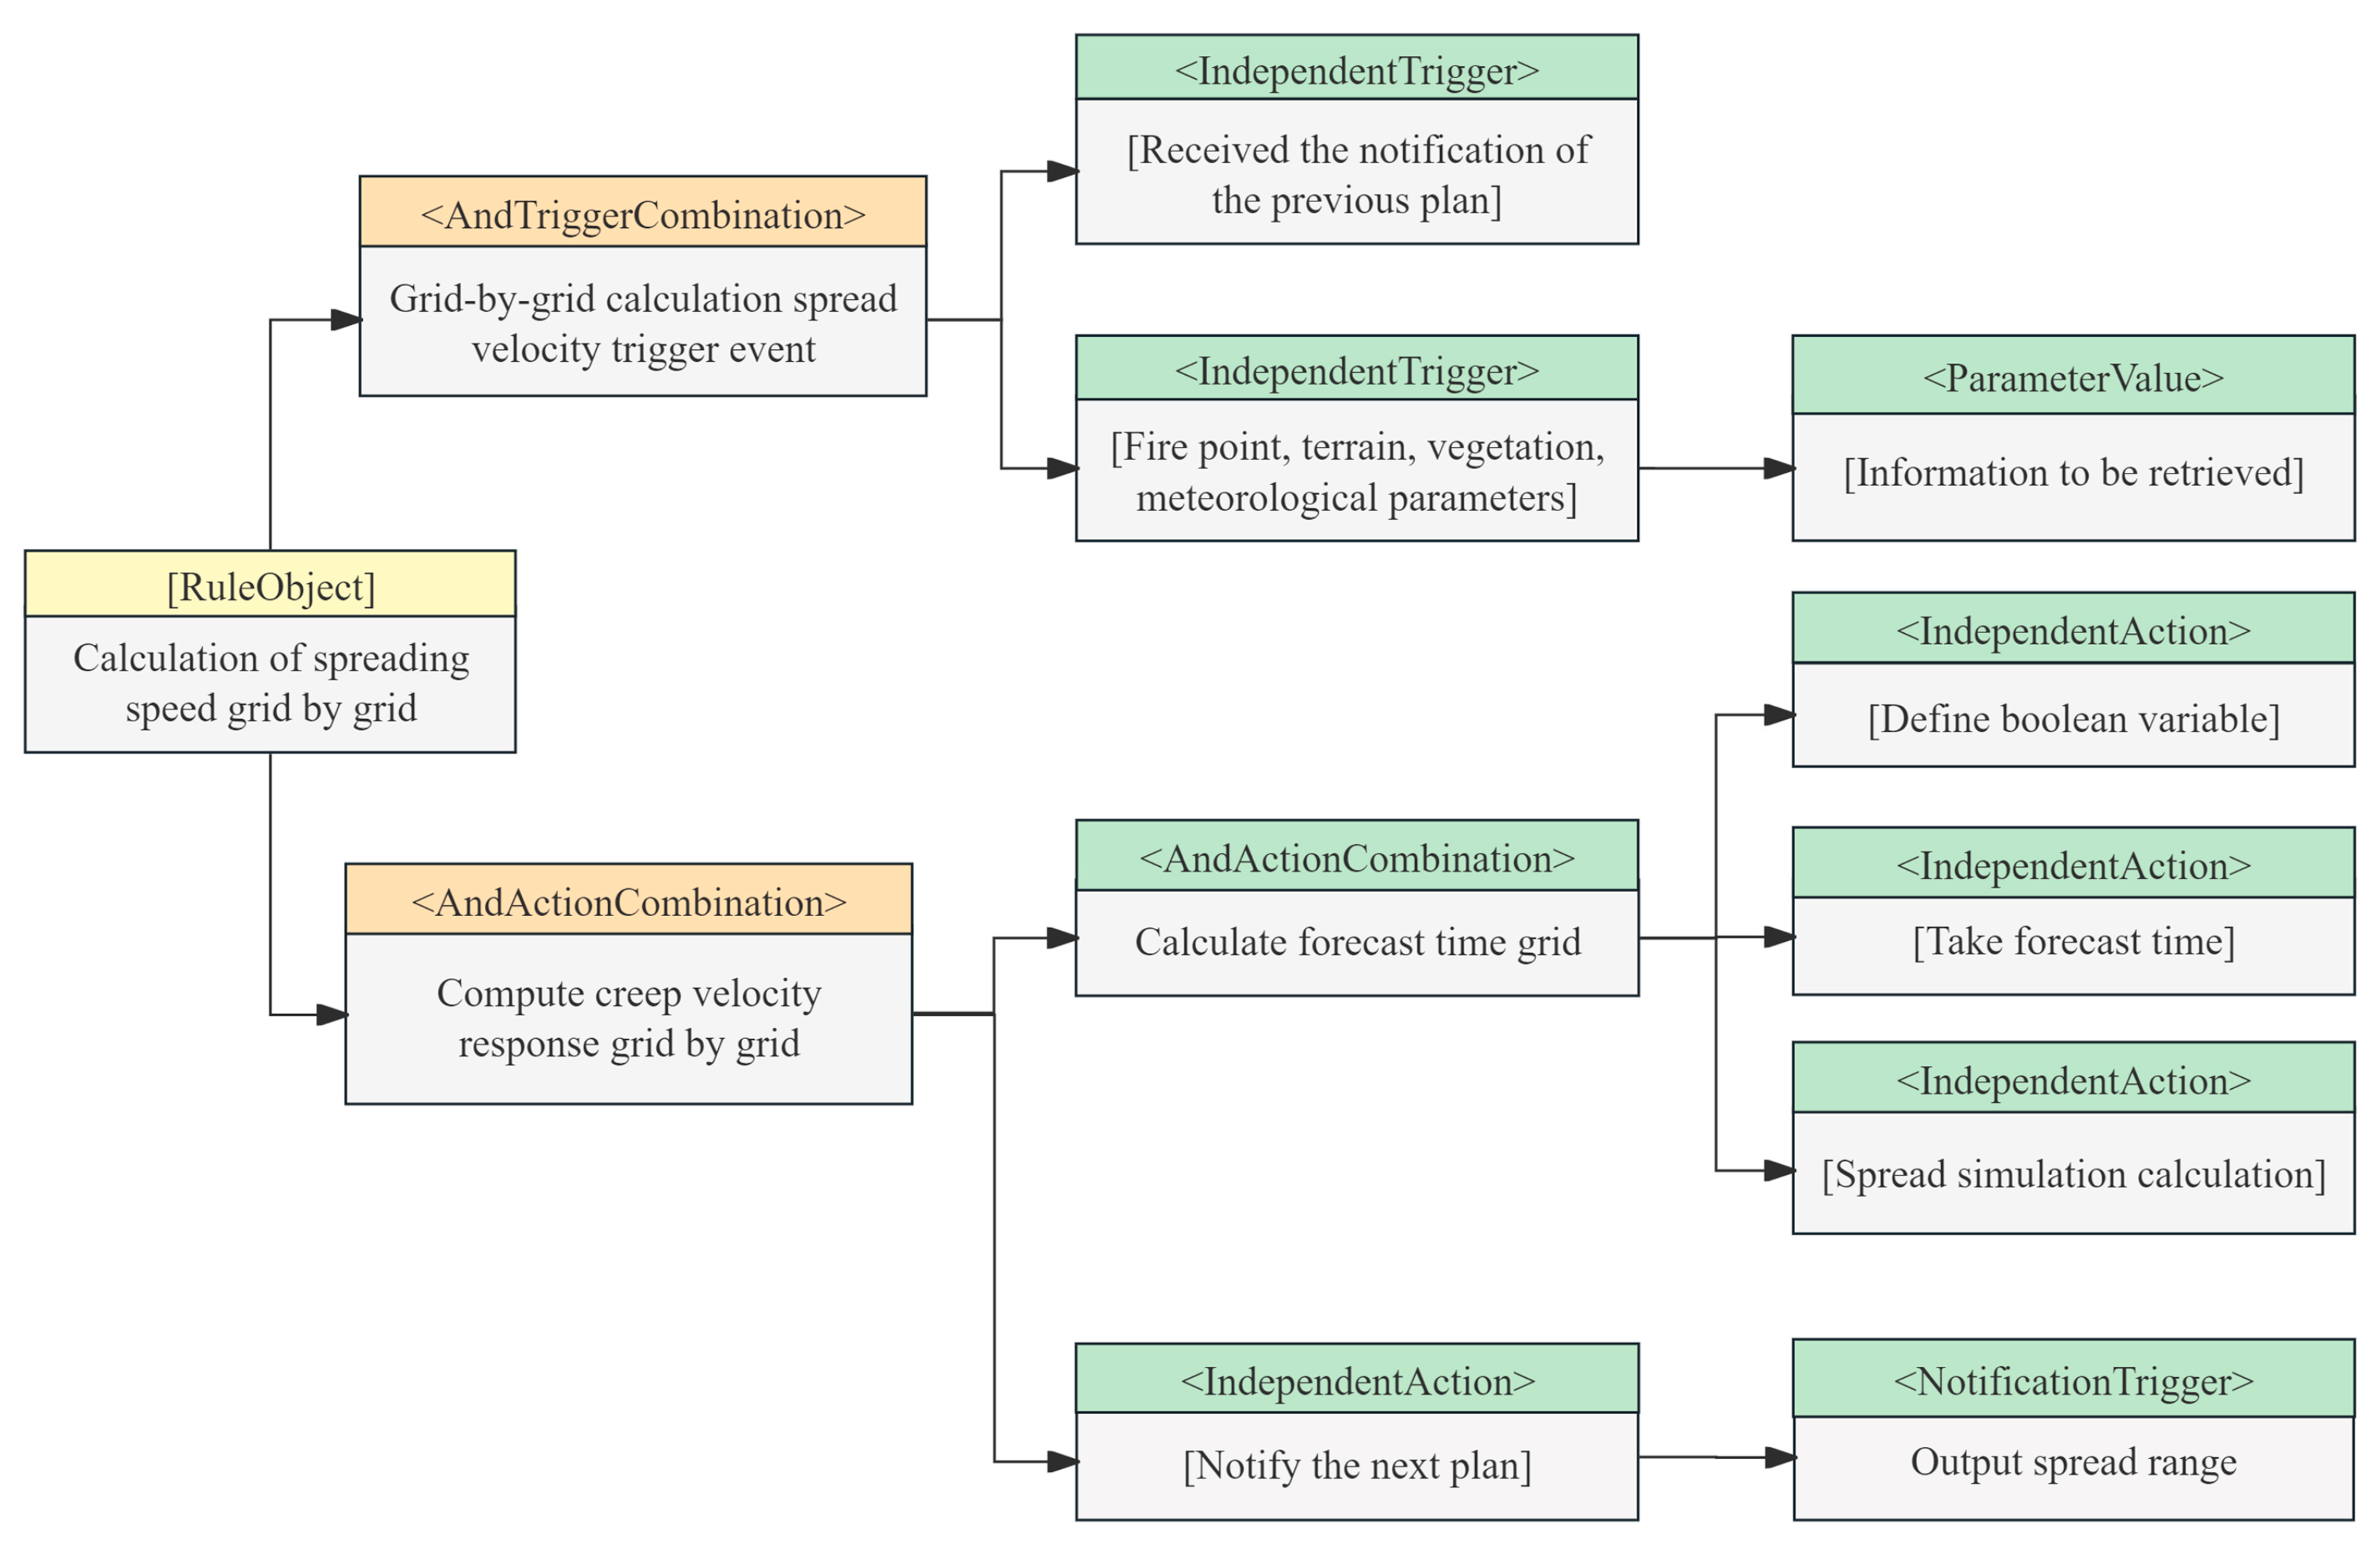
The gridded method for simulating wildfire spread trends, outlined in Section 2.2.3, was transformed into a set of spatiotemporal semantic inference rules, as illustrated in Figure 15. Figure 15 illustrates a RuleObject named ‘Calculation of spreading speed grid by grid’. When this RuleObject receives notifications from preceding RuleObjects and is able to retrieve the parameters required for its calculations, it is triggered. Its primary action involves calculating the wildfire spread speed on each grid and determining whether adjacent grids will ignite. Once calculations and assessments are completed for each grid, this RuleObject generates trigger conditions for the subsequent RuleObject named ‘Output spread range’. These rules facilitate the efficient and precise analysis and prediction of wildfire spread patterns across various grid cells.
3.4. Wildfire Exposure Risk Analysis
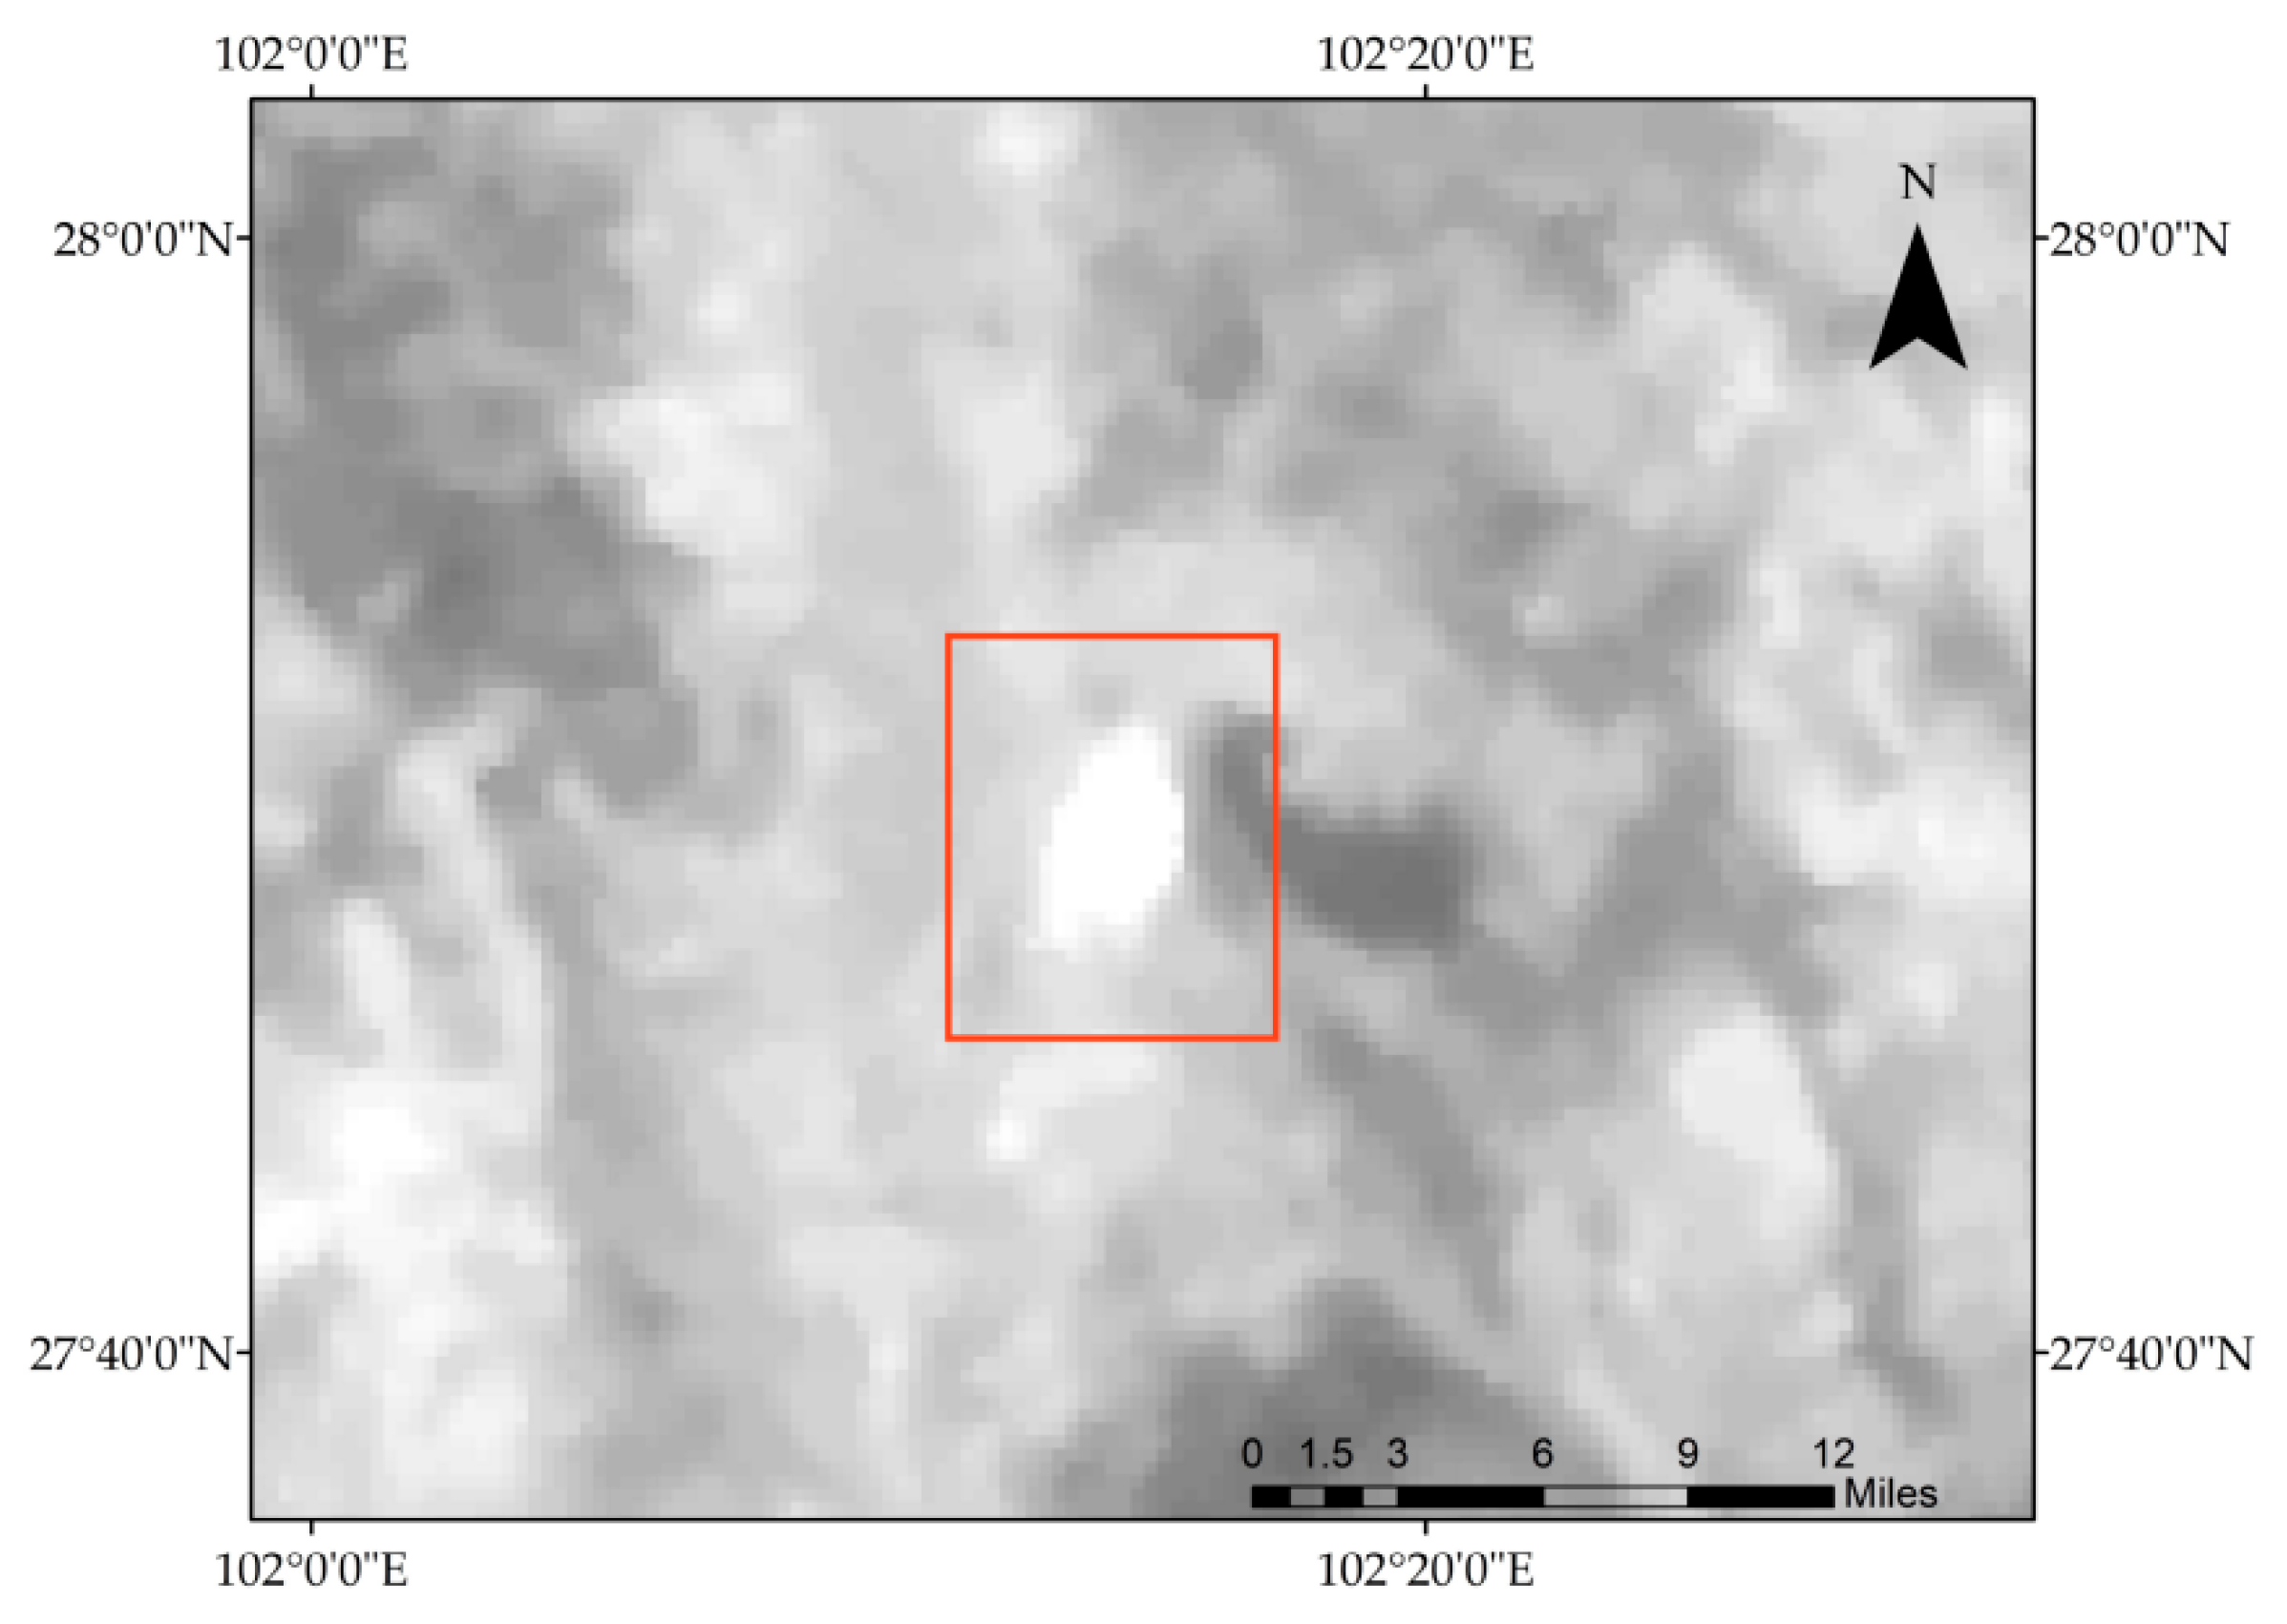
At approximately 7:00 a.m. on 30 March 2020, a wildfire broke out in Xichang City within the Liangshan Yi Autonomous Prefecture, Sichuan Province, China. The blaze swiftly moved toward the Lushan Scenic Area, exhibiting rapid expansion. By 8:00 a.m. on March 31, it had engulfed more than 1000 hectares, with more than 80 hectares becoming severely damaged. The GF-4 satellite imagery captured this scene in Xichang at 5:39 a.m. on March 31, as shown in Figure 16. The highly bright area within the red frame in the figure indicates an abnormal heat source from the wildfire.
The wildfire’s escalation was exacerbated by a sudden shift and intensification of wind at the site, coupled with airborne embers obstructing escape routes. Tragically, this resulted in 19 fatalities among the firefighting personnel and 3 injuries. The fires consumed a vast expanse of 3047.7805 hectares, affecting a variety of land types. The impacted forested area totaled 791.6 hectares, leading to direct economic losses of 97.3112 million yuan. Revisiting the situation at 5:39 a.m. on March 31 and utilizing the fire range data from GF-4, we applied our method to predict further wildfire spread and evaluate the risk to nearby structures and roads. This approach aids in strategizing safe rescue operations and evacuation planning.
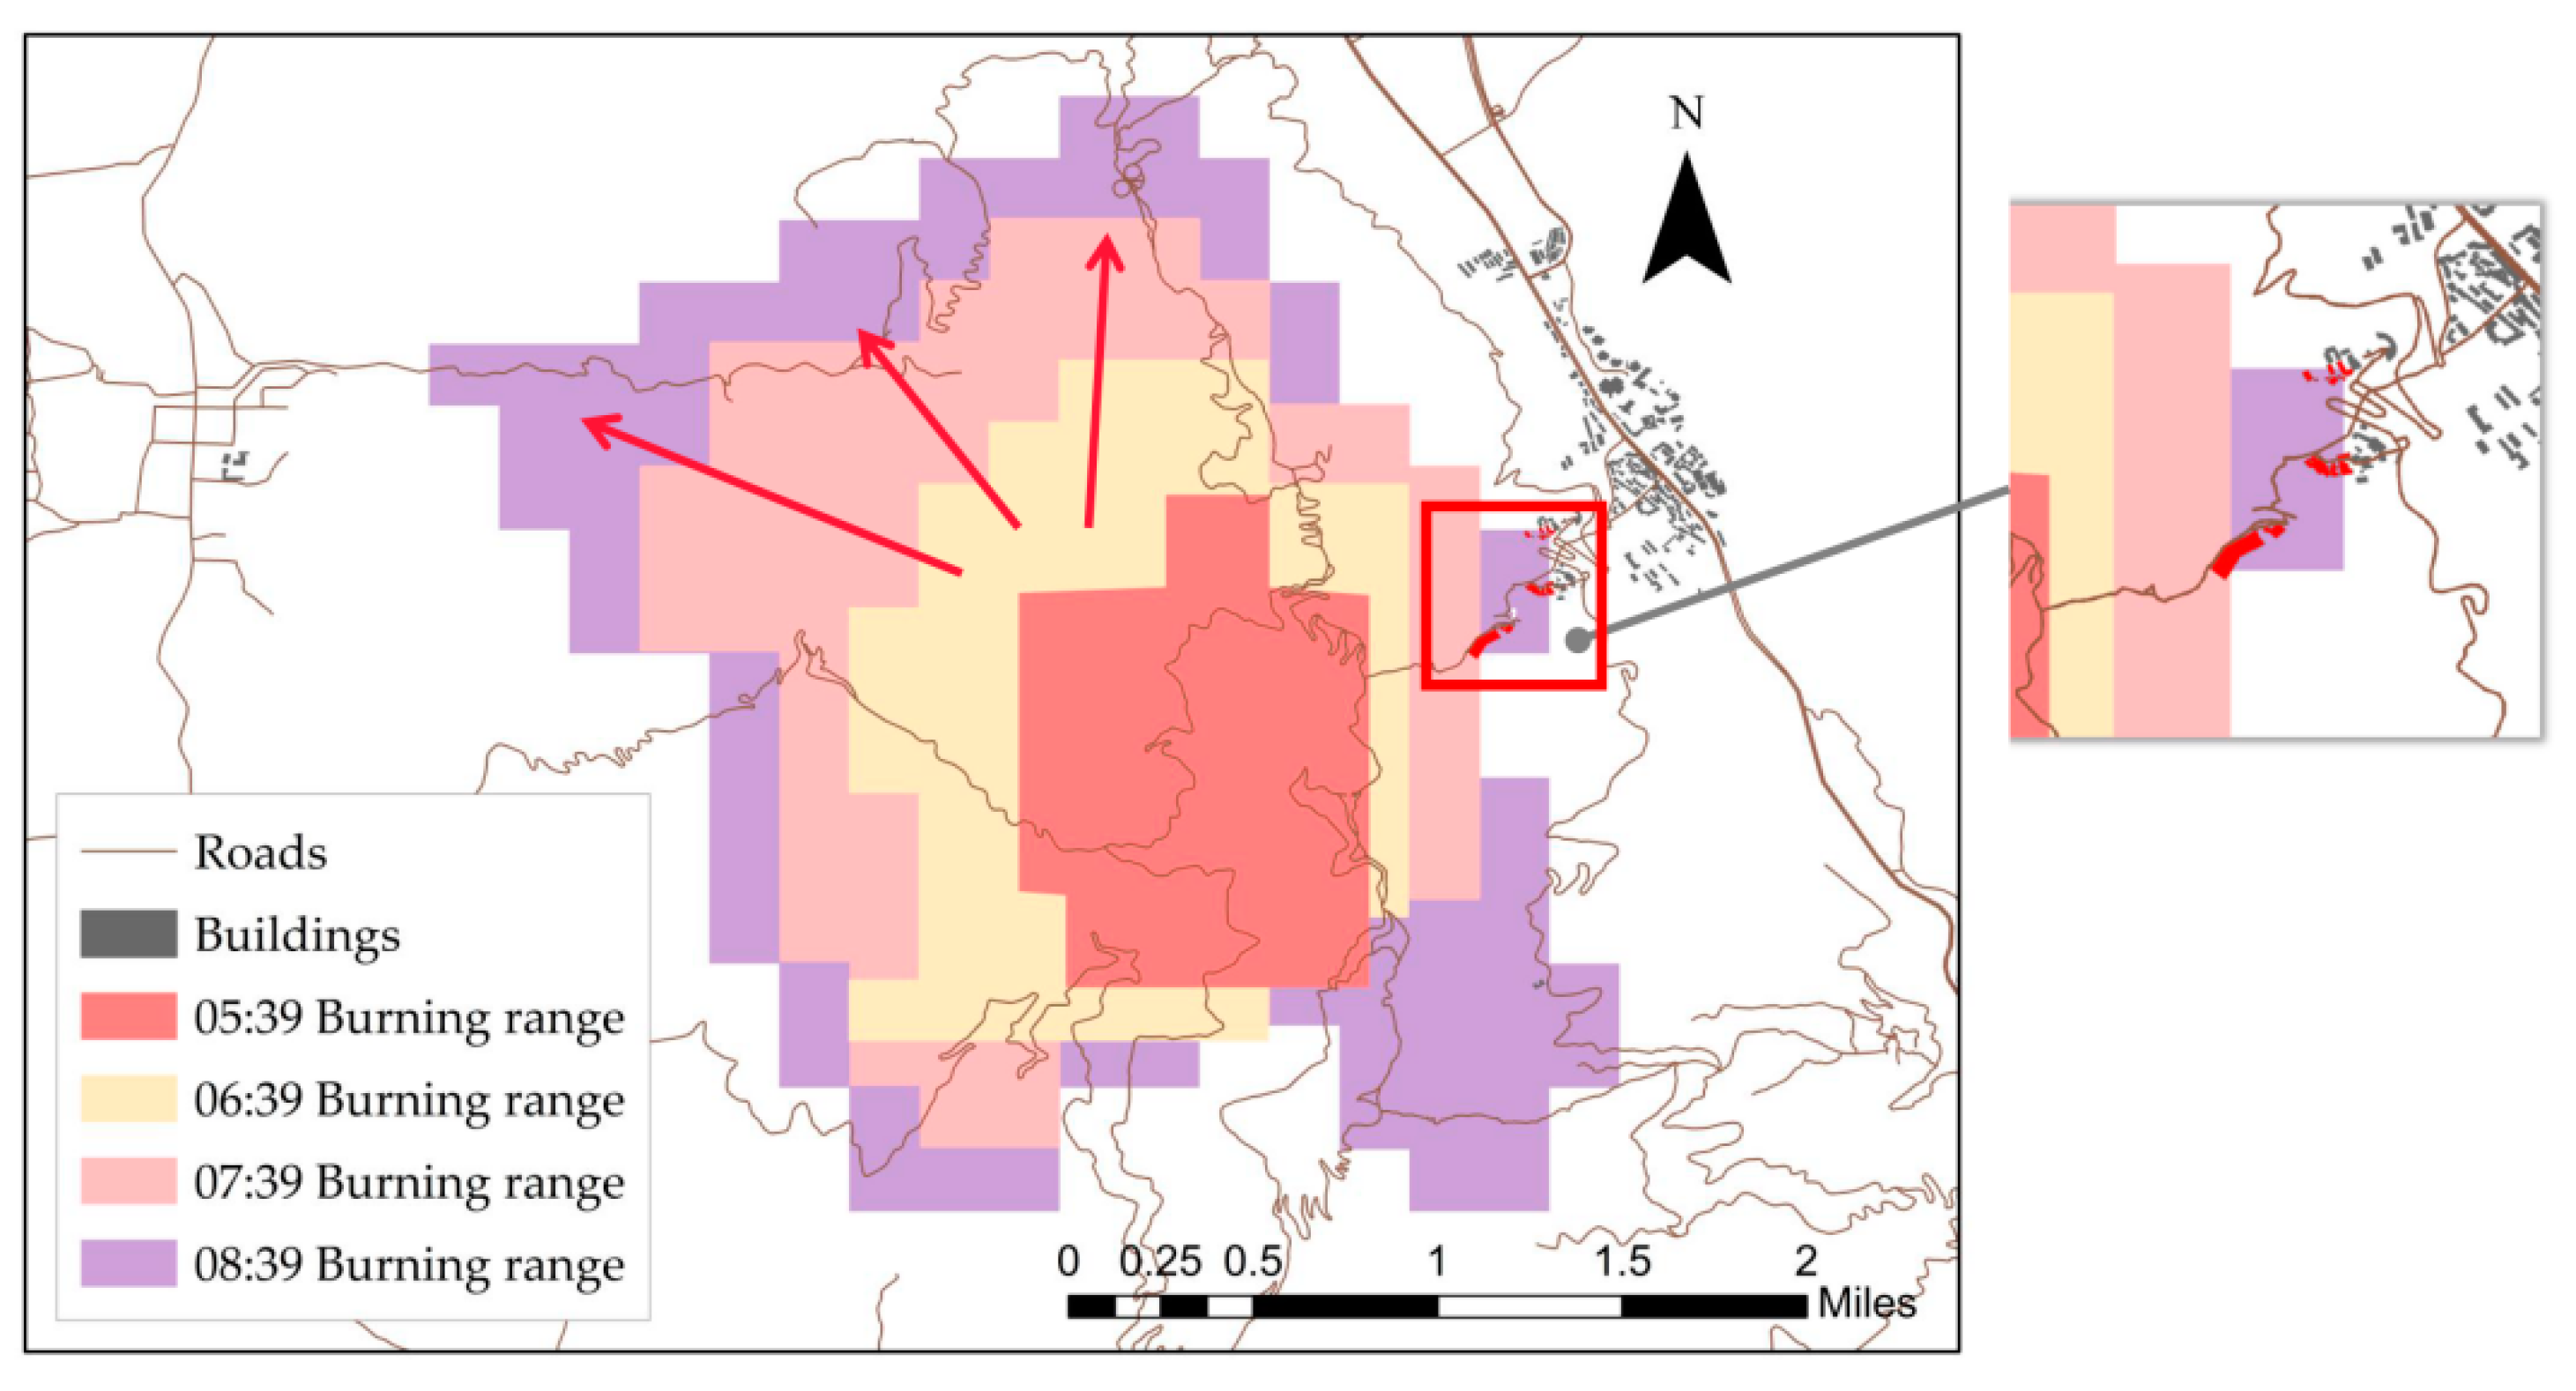
Utilizing a combination of multi-source data from the wildfire scene and the established spatiotemporal semantic reasoning rules, we forecasted the wildfire progression at 6:39, 7:39, and 8:39 a.m. on March 31, beginning with the situation at 5:39 a.m. We also retrieved nearby buildings and roads that were at risk using these inference rules, as shown in Figure 17.
Figure 17 illustrates the roads and buildings at imminent risk of wildfire within the subsequent three hours. Fire command and rescue teams should closely monitor these areas for the following reasons: (1) The roads highlighted in Figure 17 are susceptible to significant smoke and fire impacts. Blocking these roads can prevent individuals from becoming trapped in hazardous fire-spreading zones while simultaneously creating clear evacuation pathways for the safe exit of local residents and tourists. (2) The figure also suggests the possibility of the fire reaching nearby buildings. Therefore, it is crucial for rescue teams to prioritize these structures and expedite the evacuation of occupants. (3) Additionally, Figure 17 reveals areas where the fire burn radius could become enlarged. Firefighters should be wary of the indicated direction of rapid spread, adjusting their tactics accordingly to safeguard the lives of rescue personnel.
4. Discussion
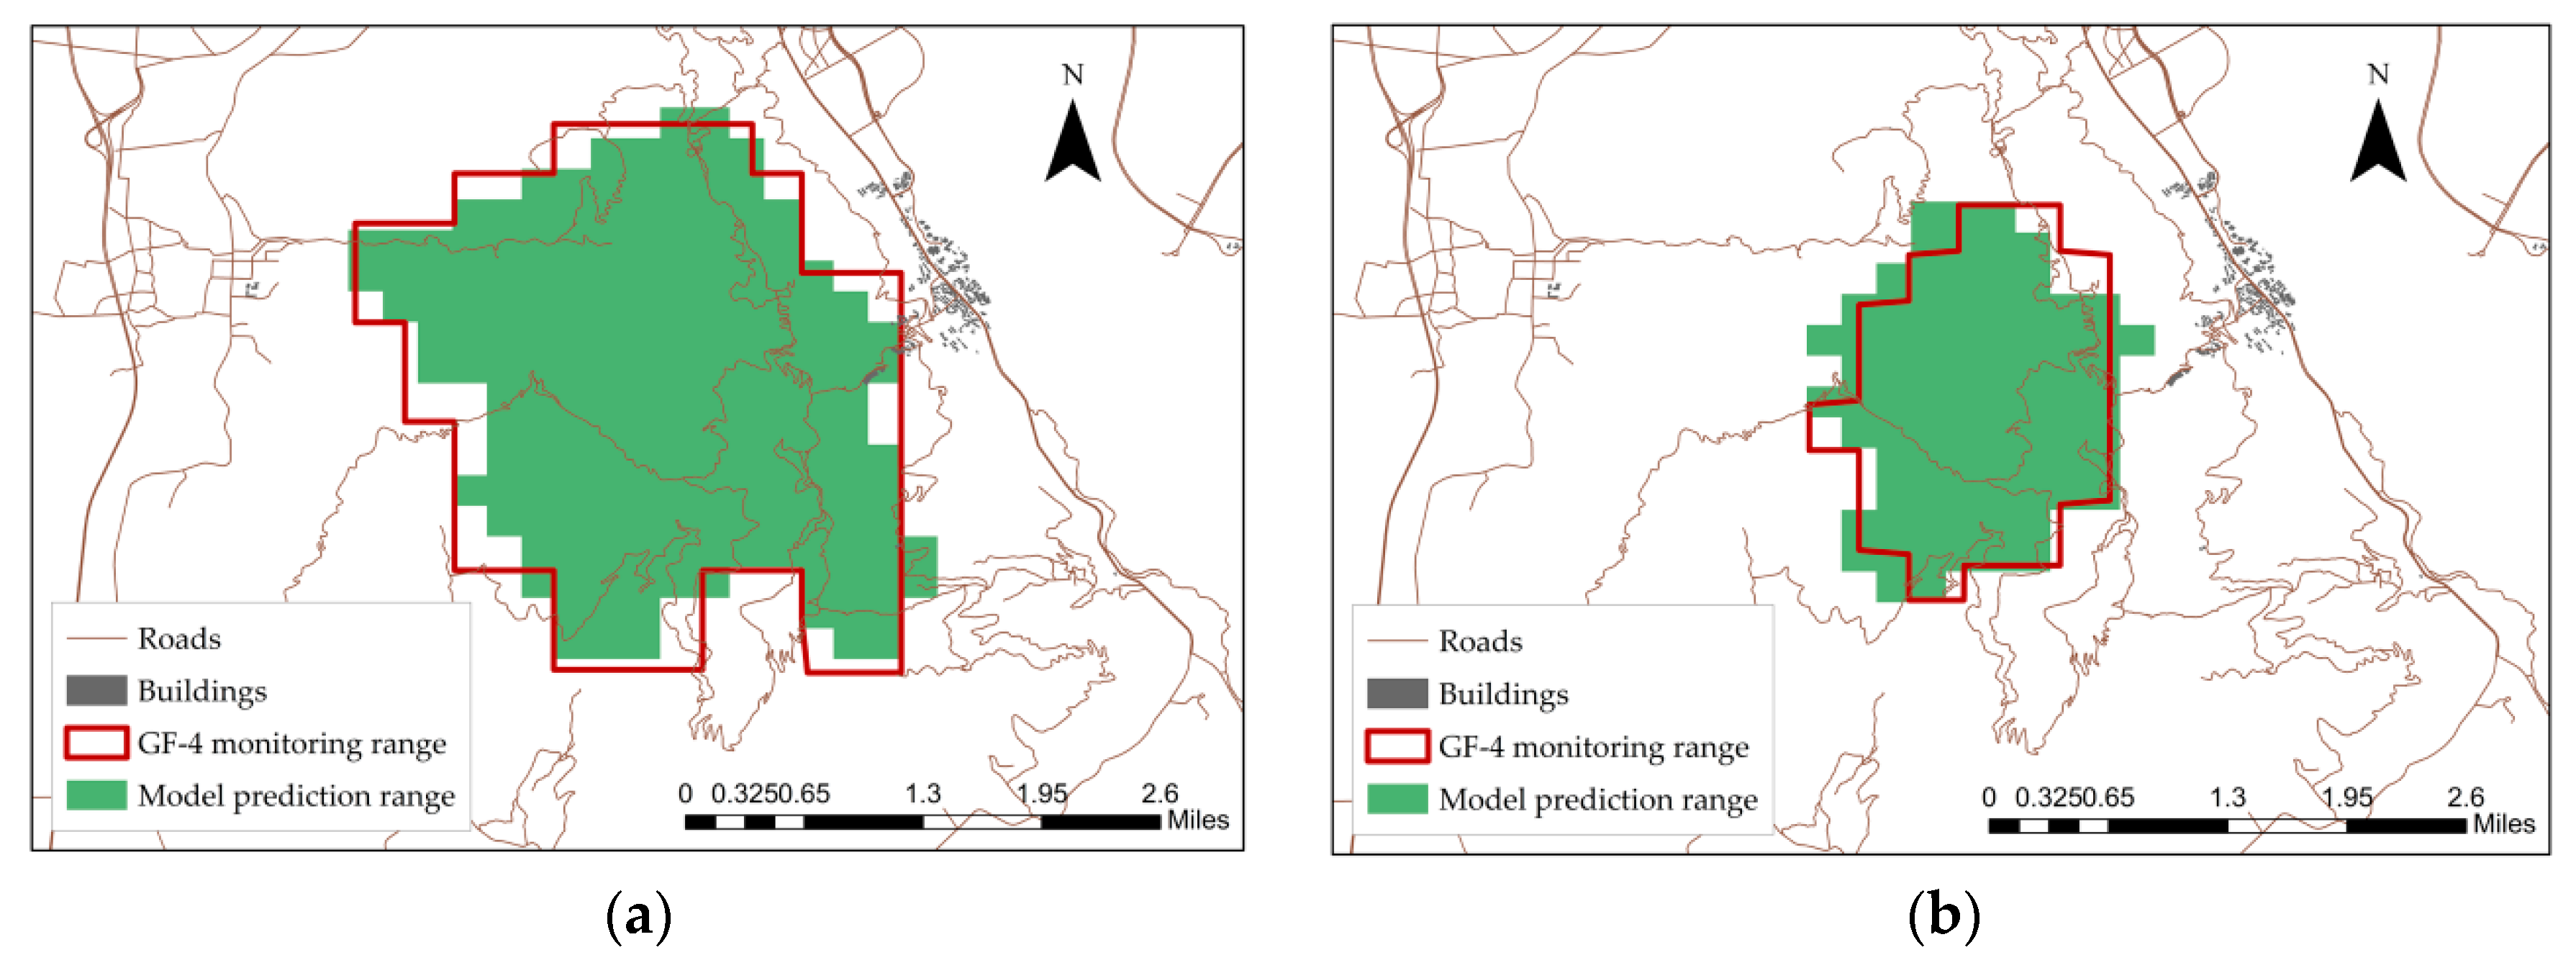
The extent of the wildfires at 7:02 a.m. and 8:41 a.m. was recorded on March 31. Utilizing the methodology outlined in this study, we forecasted the wildfire reach at these same timestamps. Our predictions were then juxtaposed with the GF-4 observations, as shown in Figure 18.
A comparison with the GF-4 monitoring data reveals that our method can be used to effectively analyze the spatial positions of buildings and roads vulnerable to future wildfire damage. This juxtaposition underscores our approach’s ability to assess spatiotemporal exposure risks.
In contrast to conventional methods that rely on relational data tables, our proposed approach yields marked advantages in terms of efficiency, especially in emergency rescue situations. Here, we present the evidence supporting this efficiency benefit.
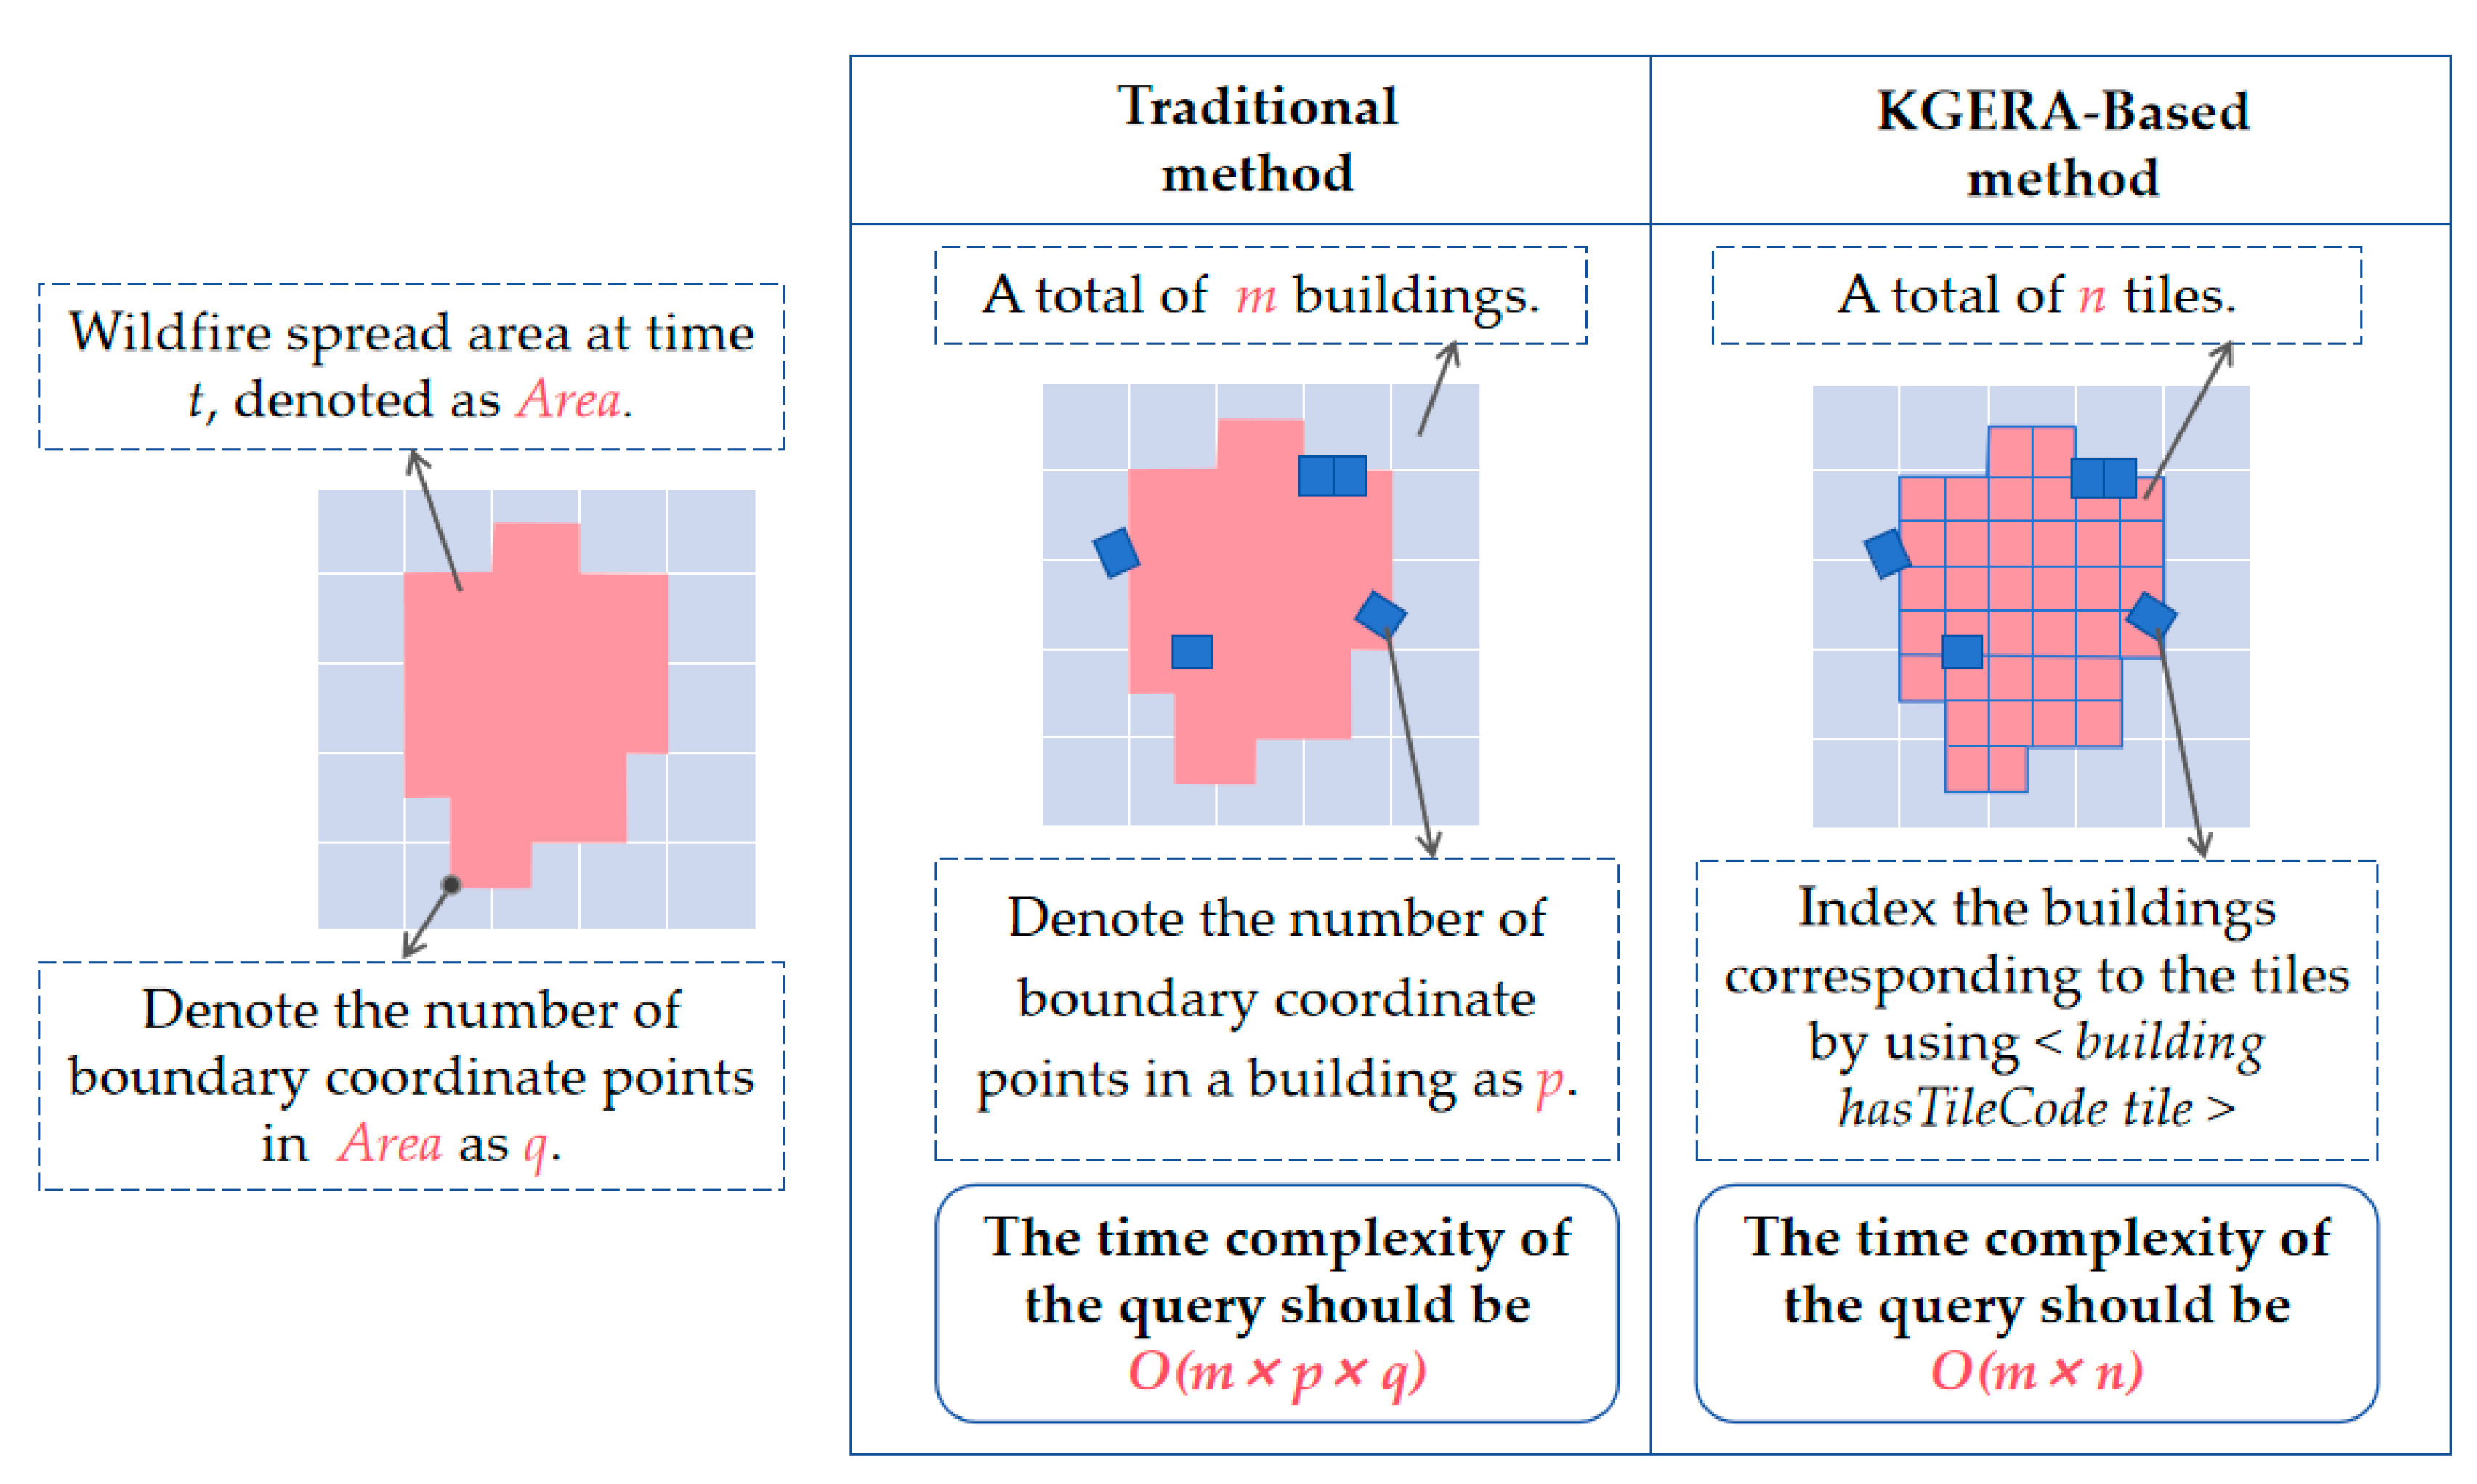
We calculate the area of wildfire spread at time , referred to as , depicted as a spatial vector polygon. To identify buildings at risk of ignition at time , we conduct a spatial intersection analysis between and all the buildings in the experimental zone (for a total of buildings), as illustrated in Figure 19. (1) In traditional relational data table methods, each of the buildings must be individually evaluated for intersection with . The algorithm’s time complexity for polygon intersections depends on the number of boundary coordinates of the features, labeled for buildings and for . Thus, the query’s time complexity is . (2) With the KGERA method, comprises a sequence of tiles totaling tiles. Using the instance layer’s building storage format shown in Figure 10, we can directly index buildings corresponding to these tiles via , eliminating the need for polygon intersection checks. Consequently, the query’s time complexity in this case is .
The methodology introduced in this study demonstrates a notably reduced time complexity compared to conventional query methods that rely on relational data tables.
Our approach effectively harnesses multi-source data from wildfire scenes, employing spatiotemporal semantic rules to model potential future fire spread patterns. Furthermore, it can identify buildings and roads within risk zones precisely. By integrating spatiotemporal relationships, semantic information, and fire propagation models, our method can pinpoint buildings and roads at potential risk of fire, thereby offering more precise data for rescue planning.
Research [1] advocates decoupling the static and dynamic fire environmental variables in landscape fire risk assessments to assess wildfire vulnerability instead of complex computational simulation models. This research focused on assessing the likelihood of fire spreading to a particular location based solely on fuel type before the fire occurs. The discussion in the article [1] mentions a challenge that integrates dynamic meteorological conditions into the analysis to provide hazard signals during wildfire spread. Our research provides hazard signals during the dynamic spread of wildfires and offers risk analysis for surrounding construction. Meteorological conditions, topography, and fuel type are crucial factors influencing the spread of wildfires. The Rothermel model, widely used in wildfire spread prediction [2], integrates fuel type, topography, and meteorological factors. Multiple studies [3,4,5,6] confirm that it is crucial to consider factors such as meteorological conditions and topography rather than focusing solely on fuel type when predicting wildfire spread.
While our method offers advantages in forecasting disaster spread and aiding rescue efforts, it is important to acknowledge its limitations. (1) Data Reliability: The method’s accuracy relies heavily on the quality of the input data. Any discrepancies, omissions, or inaccuracies in field or remote sensing data can significantly impact prediction outcomes. Given the resolution limits of available data, our approach may not be entirely suitable for local fire scenarios in smaller communities. (2) Model Complexity: The extensive use of multi-source data and spatiotemporal semantic rules results in a complex computational process, which demands significant computational power and resources. Enhancing the practicality of the method requires algorithm optimization to lower the computational complexity and boost the operational efficiency. (3) Dynamic Changes: Wildfire spread is influenced by numerous dynamic factors, such as wind, terrain, and vegetation. However, our method cannot promptly incorporate real-time changes in these variables, making accurate, immediate fire predictions challenging. Consequently, fire commanders and rescue teams should continue to rely on situational awareness and live observational data for decision making.
5. Conclusions
This study focuses on elucidating a method for analyzing spatiotemporal exposure risks in wildfire scenarios. The proposed approach entails encoding domain-specific expertise into semantic rules within a knowledge graph. Utilizing rule-based inference, this method effectively extracts spatiotemporal data through the KGERA, facilitating exposure risk analysis during wildfire progression. While it can predict and identify potential exposure risks at future time points, the method does not quantify the magnitude of these risks. The proposed method integrates a variety of mechanisms, models, processes, and functionalities that collectively augment the effectiveness of exposure risk analysis. The key contributions of this study are given as follows:
- (1)
- In response to the challenge of high temporal complexity in spatial risk analysis, the KGERA offers spatiotemporal semantic modeling. This modeling facilitates the integration of data related to wildfire exposure within the broader framework of spatiotemporal wildfire risk analysis;
- (2)
- By addressing the issue of insufficient analysis of exposure risk during the active spread of wildfires in existing research, the proposed method offers a knowledge modeling approach by formalizing remote sensing-extracted information into factual knowledge within the knowledge graph, facilitating the modeling and application of domain-specific expertise;
- (3)
- The approach outlined in this study leverages spatiotemporal data and the KGERA framework to identify exposures that are potentially at risk in certain spatiotemporal zones, including buildings and roads threatened by wildfires, with satisfactory accuracy.
The KGERA framework introduced in this study enables the semantic integration of diverse data sources in wildfire management, providing a knowledge graph-driven method for spatiotemporal exposure risk analysis. Future studies could incorporate real-time data with wildfire emergency protocols to derive more accurate and timely rescue strategies during evolving fire conditions. Moreover, the KGERA framework lays the groundwork for further exploration in exposure risk analysis across various disaster contexts, such as extreme weather events or floods. Future research will aim to broaden the scope of exposure studies and enhance the frequency of analyzing spatiotemporal dynamics between disasters and exposures. Specifically, in fire exposure research, our focus on assessing risks based on fuel type will increase. We plan to integrate prefire vulnerability assessments based on fuel types with exposure risk evaluations considering multiple influencing factors.
Author Contributions
Conceptualization, X.G., L.P. and Y.Y.; methodology, X.G., L.P. and W.L.; validation, X.G., W.L. and Y.W.; resources, L.P.; data curation, X.G., Y.W., D.C. and L.Y.; writing—original draft preparation, X.G.; writing—review and editing, X.G., Y.Y. and J.C.; funding acquisition, L.P. All authors have read and agreed to the published version of the manuscript.
Funding
This work was supported by the National Key Research and Development Program of China (2021YFC1523503) and the Beijing Municipal Science and Technology Project (Z191100001419002).
Institutional Review Board Statement
Not applicable.
Informed Consent Statement
Not applicable.
Data Availability Statement
Data are contained within the article.
Conflicts of Interest
The authors declare that they have no conflicts of interest.
References
- Sixth-Generation Fires: Public-Policy Change toward Prevention Required to Address Large-Scale Events. Available online: https://www.iawfonline.org/article/sixth-generation-fires-public/ (accessed on 19 October 2023).
- NOAA: Billion-Dollar Weather and Climate Disasters 2021; National Centers for Environmental Information, National Oceanic and Atmospheric Administration: Washington, DC, USA, 2021. Available online: https://www.ncdc.noaa.gov/billions/ (accessed on 20 November 2023).
- Ge, X.; Yang, Y.; Chen, J.; Li, W.; Huang, Z.; Zhang, W.; Peng, L. Disaster Prediction Knowledge Graph Based on Multi-Source Spatio-temporal Information. Remote Sens. 2022, 14, 1214. [Google Scholar] [CrossRef]
- Ge, X.; Yang, Y.; Peng, L.; Chen, L.; Li, W.; Zhang, W.; Chen, J. Spatio-temporal Knowledge Graph Based Forest Fire Prediction with Multi Source Heterogeneous Data. Remote Sens. 2022, 14, 3496. [Google Scholar] [CrossRef]
- UNDRR—Homepage|UNDRR. Available online: https://www.undrr.org/ (accessed on 20 November 2023).
- Liu, P.X.; Zhang, J. Precise guidance for disaster prevention and mitigation based on analysis of highway vulnerability survey data. Eng. Constr. Des. 2022, 23, 100–103. [Google Scholar]
- Bu, H. Clearing the fundamentals, being well-prepared: Inner Mongolia Highway Bureau’s efficient implementation of comprehensive risk assessment for road vulnerability to natural disasters. China Highw. 2022, 8, 42–45. [Google Scholar]
- Capes, R.; Teeuw, R. On safe ground? Analysis of European urban geohazards using satellite radar interferometry. Int. J. Appl. Earth Obs. Geoinf. 2017, 58, 74–85. [Google Scholar] [CrossRef]
- Gao, L.; Zhang, L.M.; Chen, H.X.; Shen, P. Simulating debris flow mobility in urban settings. Eng. Geol. 2016, 214, 67–78. [Google Scholar] [CrossRef]
- Torres, Y.; Arranz, J.J.; Gaspar-Escribano, J.M.; Haghi, A.; Martínez-Cuevas, S.; Benito, B.; Ojeda, J.C. Integration of LIDAR and multispectral images for rapid exposure and earthquake vulnerability estimation. Application in Lorca, Spain. Int. J. Appl. Earth Obs. Geoinf. 2019, 81, 161–175. [Google Scholar] [CrossRef]
- Gonzalez, D.; Rueda-Plata, D.; Acevedo, A.B.; Duque, J.C.; Ramos-Pollán, R.; Betancourt, A.; García, S. Automatic detection of building typology using deep learning methods on street level images. Build. Environ. 2020, 177, 106805. [Google Scholar] [CrossRef]
- Qing, Y.; Ming, D.; Wen, Q.; Weng, Q.; Xu, L.; Chen, Y.; Zhang, Y.; Zeng, B. Operational earthquake-induced building damage assessment using CNN-based direct remote sensing change detection on superpixel level. Int. J. Appl. Earth Obs. Geoinf. 2022, 112, 102899. [Google Scholar] [CrossRef]
- Ismail, A.; Awad, M. Towards Cross-Disaster Building Damage Assessment with Graph Convolutional Networks. arXiv 2022, arXiv:2201.10395. [Google Scholar]
- Beverly, J.; McLoughlin, N.; Chapman, E. A simple metric of landscape fire exposure. Landsc. Ecol. 2021, 36, 785–801. [Google Scholar] [CrossRef]
- Tanachawengsakul, T.; Mishima, N.; Fuchikami, T. A Simulation Study on Fire Evacuation Routes in Primary Stage for a Historic Canal Residential Area. Procedia—Soc. Behav. Sci. 2016, 216, 492–502. [Google Scholar] [CrossRef]
- Kuligowski, E. Evacuation decision-making and behavior in wildfires: Past research, current challenges and a future research agenda. Fire Saf. J. 2021, 120, 103129. [Google Scholar] [CrossRef]
- Chen, X.; Sun, Q.; Guo, W.; Qiu, C.; Yu, A. GA-Net: A geometry prior assisted neural network for road extraction. Int. J. Appl. Earth Obs. Geoinf. 2022, 114, 103004. [Google Scholar] [CrossRef]
- Chen, R.; Li, X.; Hu, Y. Road Extraction from Remote Sensing Images in Wildland-Urban Interface Areas. Geosci. Remote Sens. Lett. 2020, 19, 3000705. [Google Scholar] [CrossRef]
- Liu, X.; Chen, Y.; Wang, C.; Tan, K.; Li, J. A lightweight building instance extraction method based on adaptive optimization of mask contour. Int. J. Appl. Earth Obs. Geoinf. 2023, 122, 103420. [Google Scholar] [CrossRef]
- Chen, D.-Y.; Peng, L.; Li, W.-C.; Wang, Y.-D. Building Extraction and Number Statistics in WUI Areas Based on UNet Structure and Ensemble Learning. Remote Sens. 2021, 13, 1172. [Google Scholar] [CrossRef]
- Lv, B.; Peng, L.; Wu, T.; Chen, R. Research on Urban Building Extraction Method Based on Deep Learning Convolutional Neural Network. IOP Conf. Ser. Earth Environ. Sci. 2020, 502, 012022. [Google Scholar] [CrossRef]
- Sun, Y.; Jiang, L.; Pan, J.; Sheng, S.; Hao, L. A satellite imagery smoke detection framework based on the mahalanobis distance for early fire identification and positioning. Int. J. Appl. Earth Obs. Geoinf. 2023, 118, 103257. [Google Scholar] [CrossRef]
- Park, M.; Tran, D.Q.; Bak, J.; Park, S. Advanced wildfire detection using generative adversarial network-based augmented datasets and weakly supervised object localization. Int. J. Appl. Earth Obs. Geoinf. 2022, 114, 103052. [Google Scholar] [CrossRef]
- Li, X.; Zhang, M.; Zhang, S.; Liu, J.; Sun, S.; Hu, T.; Sun, L. Simulating Forest Fire Spread with Cellular Automation Driven by a LSTM Based Speed Model. Fire 2022, 5, 13. [Google Scholar] [CrossRef]
- Wu, Z.; Wang, B.; Li, M.; Tian, Y.; Quan, Y.; Liu, J. Simulation of forest fire spread based on artificial intelligence. Ecol. Indic. 2022, 136, 108653. [Google Scholar] [CrossRef]
- Khakzad, N. Modeling wildfire spread in wildland-industrial interfaces using dynamic Bayesian network. Reliab. Eng. Syst. Saf. 2019, 189, 165–176. [Google Scholar] [CrossRef]
- Bisson, M.; Favalli, M.; Fornaciai, A.; Mazzarini, F.; Isola, I.; Zanchetta, G.; Pareschi, M.T. A rapid method to assess fire-related debris flow hazard in the Mediterranean region: An example from Sicily (southern Italy). Int. J. Appl. Earth Obs. Geoinf. 2005, 7, 217–231. [Google Scholar] [CrossRef]
- Nunes, A.N.; Figueiredo, A.; Pinto, C.; Lourenço, L. Assessing wildfire hazard in the Wildland–Urban Interfaces (WUIs) of central Portugal. Forests 2023, 14, 1106. [Google Scholar] [CrossRef]
- Liu, Q.; Ruan, C.; Zhong, S.; Li, J.; Yin, Z.; Lian, X. Risk assessment of storm surge disaster based on numerical models and remote sensing. Int. J. Appl. Earth Obs. Geoinf. 2018, 68, 20–30. [Google Scholar] [CrossRef]
- Naderpour, M.; Rizeei, H.M.; Khakzad, N.; Pradhan, B. Forest fire induced Natech risk assessment: A survey of geospatial technologies. Reliab. Eng. Syst. Saf. 2019, 191, 106558. [Google Scholar] [CrossRef]
- Chuvieco, E.; Yebra, M.; Martino, S.; Thonicke, K.; Gómez-Giménez, M.; San-Miguel, J.; Oom, D.; Velea, R.; Mouillot, F.; Molina, J.R.; et al. Towards an integrated approach to wildfire risk assessment: When, where, what and how may the landscapes burn. Fire 2023, 6, 215. [Google Scholar] [CrossRef]
- O’Connor, M.J.; Das, A.K. A method for representing and querying temporal information in owl. In Proceedings of the International Joint Conference on Biomedical Engineering Systems and Technologies, Valencia, Spain, 20–23 January 2010; pp. 97–110. [Google Scholar]
- Chen, J.; Zhong, S.; Ge, X.; Li, W.; Zhu, H.; Peng, L. Spatio-temporal Knowledge Graph for Meteorological Risk Analysis. In Proceedings of the 2021 IEEE 21st International Conference on Software Quality, Reliability and Security Companion (QRS-C), Hainan Island, China, 6–10 December 2021; pp. 440–447. [Google Scholar]
- Fire Map—NASA. Available online: https://firms2.modaps.eosdis.nasa.gov/map/ (accessed on 19 October 2023).
- JAXA Himawari Monitor. Available online: https://www.eorc.jaxa.jp/ptree/userguide.html (accessed on 19 October 2023).
- ERA5-Land Hourly Data from 1950 to Present. Available online: https://cds.climate.copernicus.eu/ (accessed on 19 October 2023).
- LP DAAC—Homepage. Available online: https://lpdaac.usgs.gov/ (accessed on 19 October 2023).
- Esri_2020_Land_Cover_V2 ImageServer. Available online: https://tiledimageservices.arcgis.com/P3ePLMYs2RVChkJx/arcgis/rest/services/Esri_2020_Land_Cover_V2/ImageServer (accessed on 19 October 2023).
- National Forest Resources Intelligent Management Platform. Available online: http://www.stgz.org.cn/ (accessed on 19 October 2023).
- Haklay, M.; Weber, P. Openstreetmap: User-generated street maps. IEEE Pervasive Comput. 2008, 7, 12–18. [Google Scholar] [CrossRef]
- Musen, M.A. Encyclopedia of Systems Biology; Dubitzky, W., Wolkenhauer, O., Cho, K.-H., Yokota, H., The Protégé Team Protégé Ontology Editor, Eds.; Springer: New York, NY, USA, 2013; pp. 1763–1765. Available online: https://link.springer.com/referenceworkentry/10.1007%2F978-1-4419-9863-7_1104 (accessed on 19 October 2023).
- Wang, Z. Algorithm for measuring the initial spreading speed of mountain fires. Mt. Res. 1983, 2, 42–51. [Google Scholar]
- Geng, D.; Ning, J.; Li, Z.; Yu, H.; Di, X.; Yang, G. Spread rate and parameter correction of surface combustibles in Korean pine plantations based on Rothermel model. J. Beijing For. Univ. 2021, 43, 79–88. [Google Scholar]
- Mao, X. Effects of wind and topography on forest fire spreading speed. J. Appl. Meteorol. 1993, 1, 100–104. [Google Scholar]
Figure 1.
A conceptual model for exposure risk analysis.

Figure 2.
KGERA architecture.

Figure 3.
Components and relationships of the KGERA model.

Figure 4.
Conceptual framework of KGERA.

Figure 5.
Instantiation of multi-source heterogeneous spatiotemporal data.

Figure 6.
Relationships among RuleObject, TriggerObject, and ActionObject.

Figure 7.
Template for RuleObject definition.

Figure 8.
Construction of KGERA in the experiment.

Figure 9.
Extraction results for buildings in Xichang City (partial).

Figure 10.
Instances of buildings and roads in the instance layer.

Figure 11.
Spatiotemporal semantic inference rule sets.

Figure 12.
Definitions of variable angles and coordinate axes in Formulas (1) and (2).

Figure 13.
A framework for simulating the wildfire spread trend with grids in any direction.

Figure 14.
Method of simulating the gridded wildfire spread trend.

Figure 15.
Spatiotemporal semantic reasoning rules for gridded wildfire spread trend simulation.

Figure 16.
The fire scene in Xichang City was captured using GF-4 at 5:39 on March 31.

Figure 17.
The spreading trend of wildfires and the risk of exposure from 5:39 to 8:39 on 31 March 2020.
Figure 17.
The spreading trend of wildfires and the risk of exposure from 5:39 to 8:39 on 31 March 2020.

Figure 18.
The range of wildfires monitored via GF-4 was compared with the range predicted using the method proposed in this study. (a) Comparison between the GF-4 monitoring range and the model prediction range at 5:39. (b) Comparison between the GF-4 monitoring range and the model prediction range at 8:41.

Figure 19.
Comparison of efficiency between the KGERA-based method and the traditional method based on relational data tables.
Figure 19.
Comparison of efficiency between the KGERA-based method and the traditional method based on relational data tables.


Table 1.
Sources and details of the experimental data.
| Data | Source | Spatial Resolution | Temporal Resolution | Satellite Sensor |
|---|---|---|---|---|
| Fire | NASA-FIRMS [34] | Approximately 0.375 km × 0.375 km; approximately 1 km × 1 km | Mid-latitudes experience 3–4 looks a day | VIIRS S-NPP; VIIRS NOAA-20; MODIS/Aqua; MODIS/Terra |
| JAXA Himawari Monitor|User’s Guide [35] | 0.02 × 0.02 degrees for latitude and longitude (2 km × 2 km at nadir) | 10 min | Himawari-8 sensor | |
| High score four satellite (GF-4) | VIR 50 mMIR 400 m | Minute-level or second-level observations of specific regions | High score four sensor | |
| Meteorological | Copernicus Climate Data Store [36] | 0.1° × 0.1°; Native resolution is 9 km | Updated hourly | None |
| Terrain | Land Processes Distributed Active Archive Center [37] | 30 m × 30 m | Acquired 11–22 February 2000 | STS Endeavour OV-105 |
| Land cover | Esri_2020_Land_Cover_V2 ImageServer [38] | 10 m × 10 m | Released in 2020 | Sentinel-2L2A/B |
| Vegetation | “One Map” of Forest Inspection and Forest Resource Management in 2020 [39] | 2 km × 2 km | Released in 2020 | None |
| Road | OpenStreetMap [40] | Nationwide vector data | Updated daily | Crowdsourcing |
Table 2.
The type of surface combustible corresponds to the value of .
| Type of Surface Combustibles | |
|---|---|
| Tiled pine leaves | 0.8 |
| Thatch weed | 1.2 |
| Litter | 1.6 |
| Sedge dwarf birch | 1.8 |
| Pasture grassland | 2.0 |
| Red pine, Huashan pine, Yunnan pine, and other woodlands | 1.0 |
Disclaimer/Publisher’s Note: The statements, opinions and data contained in all publications are solely those of the individual author(s) and contributor(s) and not of MDPI and/or the editor(s). MDPI and/or the editor(s) disclaim responsibility for any injury to people or property resulting from any ideas, methods, instructions or products referred to in the content. |
© 2024 by the authors. Licensee MDPI, Basel, Switzerland. This article is an open access article distributed under the terms and conditions of the Creative Commons Attribution (CC BY) license (https://creativecommons.org/licenses/by/4.0/).
Share and Cite
MDPI and ACS Style
Ge, X.; Peng, L.; Yang, Y.; Wang, Y.; Chen, D.; Yang, L.; Li, W.; Chen, J. Research on the Exposure Risk Analysis of Wildfires with a Spatiotemporal Knowledge Graph. Fire 2024, 7, 131. https://doi.org/10.3390/fire7040131
AMA Style
Ge X, Peng L, Yang Y, Wang Y, Chen D, Yang L, Li W, Chen J. Research on the Exposure Risk Analysis of Wildfires with a Spatiotemporal Knowledge Graph. Fire. 2024; 7(4):131. https://doi.org/10.3390/fire7040131
Chicago/Turabian StyleGe, Xingtong, Ling Peng, Yi Yang, Yinda Wang, Deyue Chen, Lina Yang, Weichao Li, and Jiahui Chen. 2024. "Research on the Exposure Risk Analysis of Wildfires with a Spatiotemporal Knowledge Graph" Fire 7, no. 4: 131. https://doi.org/10.3390/fire7040131