Article

Prediction of DC Breakdown Voltage of Rod–Plate Gaps under Full-Flame Bridging Conditions

1
College of Electrical Engineering & New Energy, China Three Gorges University, Yichang 443002, China
2
Hubei Provincial Engineering Technology Research Center for Power Transmission Line, Yichang 443002, China
3
Beijing Electric Power Research Institute, State Grid, Beijing 100075, China
*
Author to whom correspondence should be addressed.
Fire 2024, 7(4), 143; https://doi.org/10.3390/fire7040143
Submission received: 6 March 2024 / Revised: 9 April 2024 / Accepted: 10 April 2024 / Published: 16 April 2024

Abstract

:
In order to evaluate the risk of transmission line tripping due to wildfires, it is necessary to predict the breakdown voltage of the insulation gap under the flame. Firstly, this paper studies the breakdown prediction of rod–plane gaps under the full-flame bridging of wooden cribs; it then obtains the breakdown voltage and the leakage current values of full-flame bridging considering different sizes of wooden cribs and different gap distances. Then, a multi-physical field simulation is carried out to obtain the flame gap characteristic parameters, such as spatial temperature. The feature quantity is normalized and reduced in dimension, and a prediction model for gap breakdown voltage under flame conditions based on a support vector machine (SVM) is established. Finally, the DC withstand voltage values and corresponding characteristic quantities under different flame gap conditions are used as sample sets to test the prediction model. The results show that the prediction error for small gap breakdown voltage is less than 2.6%. The samples were tested under different flame intensities for training and prediction, and the error was less than 3.3%. The small gap data for 30~60 cm is used to predict the breakdown voltage of the long gap for 100~140 cm, and the error is less than 3.2%. Compared with the fitting correction formula method proposed in existing research, the error is reduced by 11.5% and 4.4%, respectively, which verifies the effectiveness of the SVM prediction model.

1. Introduction

With the rapid development and construction of power transmission networks, transmission corridors often need to traverse regions with dense vegetation that are prone to high fire risks. Consequently, trip accidents in transmission lines due to forest fires occur frequently [1]. Predicting the discharge voltage across flame gaps plays a crucial role in the external insulation protection of transmission lines. However, the existing methods for predicting the discharge voltage across gaps under flame primarily rely on fitting correction formulas derived from extensive discharge test data, limiting their applicability. Therefore, it is essential to investigate the discharge mechanism within the insulating gaps under flame conditions, considering factors such as temperature and charged particle concentration [2,3,4,5,6]. Establishing a new breakdown voltage prediction model is crucial for guiding the operation and maintenance scheduling of transmission line corridors during wildfires.
Researchers have predicted the gap breakdown voltage under flame conditions through empirical and semi-empirical formulas. The air density model [3] was used to analyze the effect of temperature on gap insulation strength, resulting in obtaining the average breakdown voltage gradient model under a flame gap. This model only considers the flame temperature’s influence on the gap, neglecting flame conductivity and space-charged particles. A study was conducted to investigate the temperature, height, ash content, and calorific values of flames from various types of vegetation [4]. Through these tests, a multiple linear regression formula was derived for the breakdown voltage. Huang [5] took the smoke zone, discontinuous zone, and continuous zone of the Chinese fir fire flame as independent variables and obtained the fitting expression of the gap breakdown voltage when the flame was not fully bridged through regression analysis. Li [6] studied the power frequency breakdown characteristics of wire plates under typical vegetation flame through experiments. Considering factors such as flame temperature, conductivity, and charged particles, a gap discharge model under the flame was established. Compared with the air gap, the flame gap condition is more complicated. The influencing factors of the breakdown voltage are not independent of each other. The breakdown voltage prediction model above mainly aims to predict the breakdown voltage under corresponding test conditions, and the scope of application is limited. Therefore, this paper considers the combination of a simulation model and an intelligent algorithm to carry out breakdown voltage prediction.
It has long been a sought-after goal for researchers and engineers to obtain the breakdown voltages of air gaps through mathematical calculations instead of experiments, which can effectively reduce the number of tests and costs required for external insulation design. The BP neural network is used to predict the gap discharge voltage under icing and rain conditions, with various atmospheric parameters being input as feature quantities [7,8]. The results demonstrate that the BP neural network model effectively predicts the gap discharge voltage under complex conditions. However, it has high training sample requirements, and its ability to predict data outside the training samples is poor, making it unsuitable for small sample sizes. The breakdown voltage of different air gaps is predicted using the SVM prediction model, with various electric field distributions being used as characteristic quantities [9]. The results indicate that the intelligent algorithm model performs well in predicting the gap discharge voltage for small samples. This demonstrates that the SVM effectively handles multi-dimensional factors influencing the gap discharge voltage in complex environments. In this paper, a variety of factors affecting the breakdown voltage under flame conditions are considered. The SVM model is used to link the multi-dimensional factors with the breakdown voltage to establish a discharge prediction model for flame gaps.
When a fire breaks out in a lush vegetation area, the flames can potentially bridge the lowest point of a transmission line during extreme conditions, causing the insulation gap to experience its lowest breakdown voltage [10]. Given this worst-case scenario, we conducted rod–plate gap breakdown tests under conditions where various sizes of wooden crib flames fully bridged the gaps. Through the tests, the breakdown voltage and leakage current values at different clearance distances could be obtained. We established a simulation to acquire characteristic parameters such as space temperature. Using a support vector machine (SVM), we established a breakdown voltage prediction model. In this study, we predict and analyze the breakdown voltage under different operating conditions. Initially, we predict the breakdown voltage of small gaps under flame conditions. We employ various prediction methods to estimate the breakdown voltage of longer gaps, using data from smaller gaps as a training set. This process verifies the model’s suitability for longer gaps.

2. Rod–Plate Gap Breakdown Test under Flame

2.1. Testing Apparatus

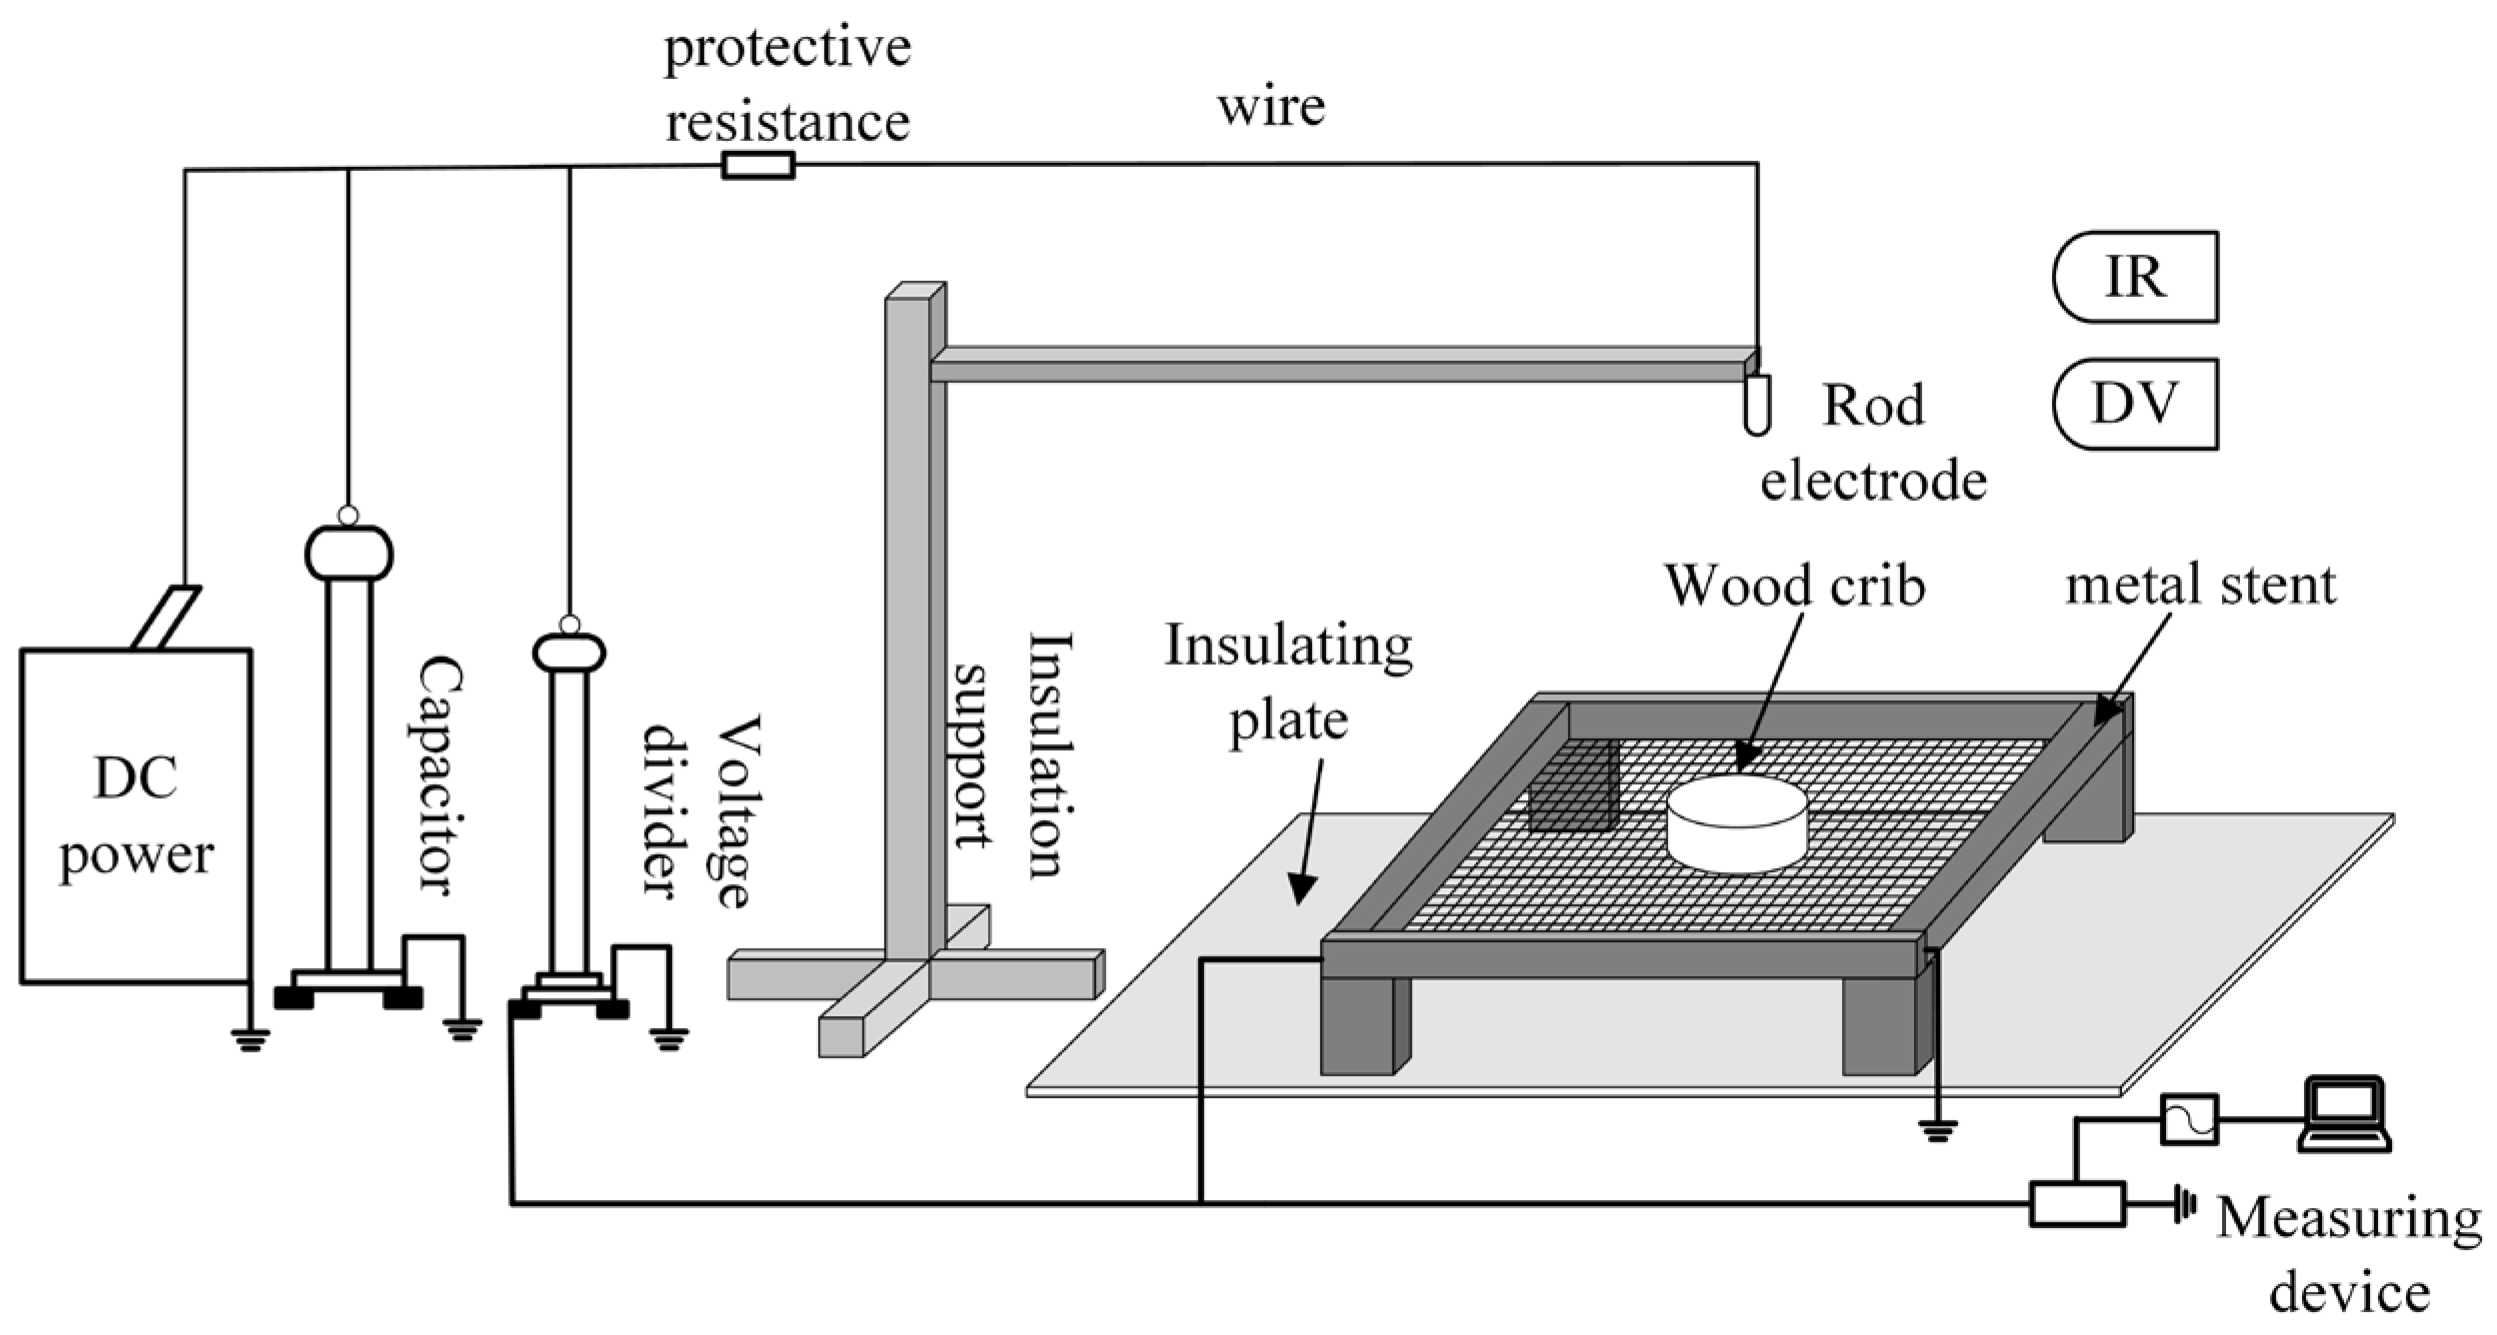
The rod–plate gap breakdown test device under vegetation combustion is shown in Figure 1. The test device is composed of a DC power supply, capacitor, voltage divider, protection resistance, rod electrode, vegetation stack, metal plate, and breakdown voltage acquisition device. In the experiment, wooden crib fire was used as the fire source, and the influence of vegetation flame intensity on the gap breakdown voltage was compared and studied. The test wooden crib is approximately circular and placed in a regular pine bar of 2 × 2 × 7 cm.

2.2. Testing Steps

In the experiment, pine strips were arranged into circular wooden stacks with diameters of approximately 20 cm, 26 cm, 32 cm, and 62 cm, and a height of 6 cm. Breakdown tests were then conducted at varying gap distances. During the pressurization process, the applied voltage and waveform were recorded synchronously, and each test was recorded using a camera. The specific test steps are as follows:
(1) The test platform was built, as shown in Figure 1. The wooden stack was placed between the net electrode and the upper rod electrode, with the signal acquisition system being connected to the circuit.
(2) The wooden crib was evenly sprayed with alcohol using a spray pot. Upon ignition of the vegetation, the signal acquisition system was activated, and the camera was turned on to capture the entire test process. Following steady burning of the vegetation, the direct lift method (2~3 kV/s) was employed to apply pressure to the gap until breakdown occurred.
(3) The voltage polarity was reversed, the gap distance was adjusted, and the wooden stack was rearranged; then, a retest was conducted to determine the breakdown voltage under full-flame conditions.
During the test, each voltage polarity and gap distance were tested 6 times. All tests were carried out in a semi-closed space to reduce the influence of external space wind on the flame.

2.3. Experimental Results and Analysis

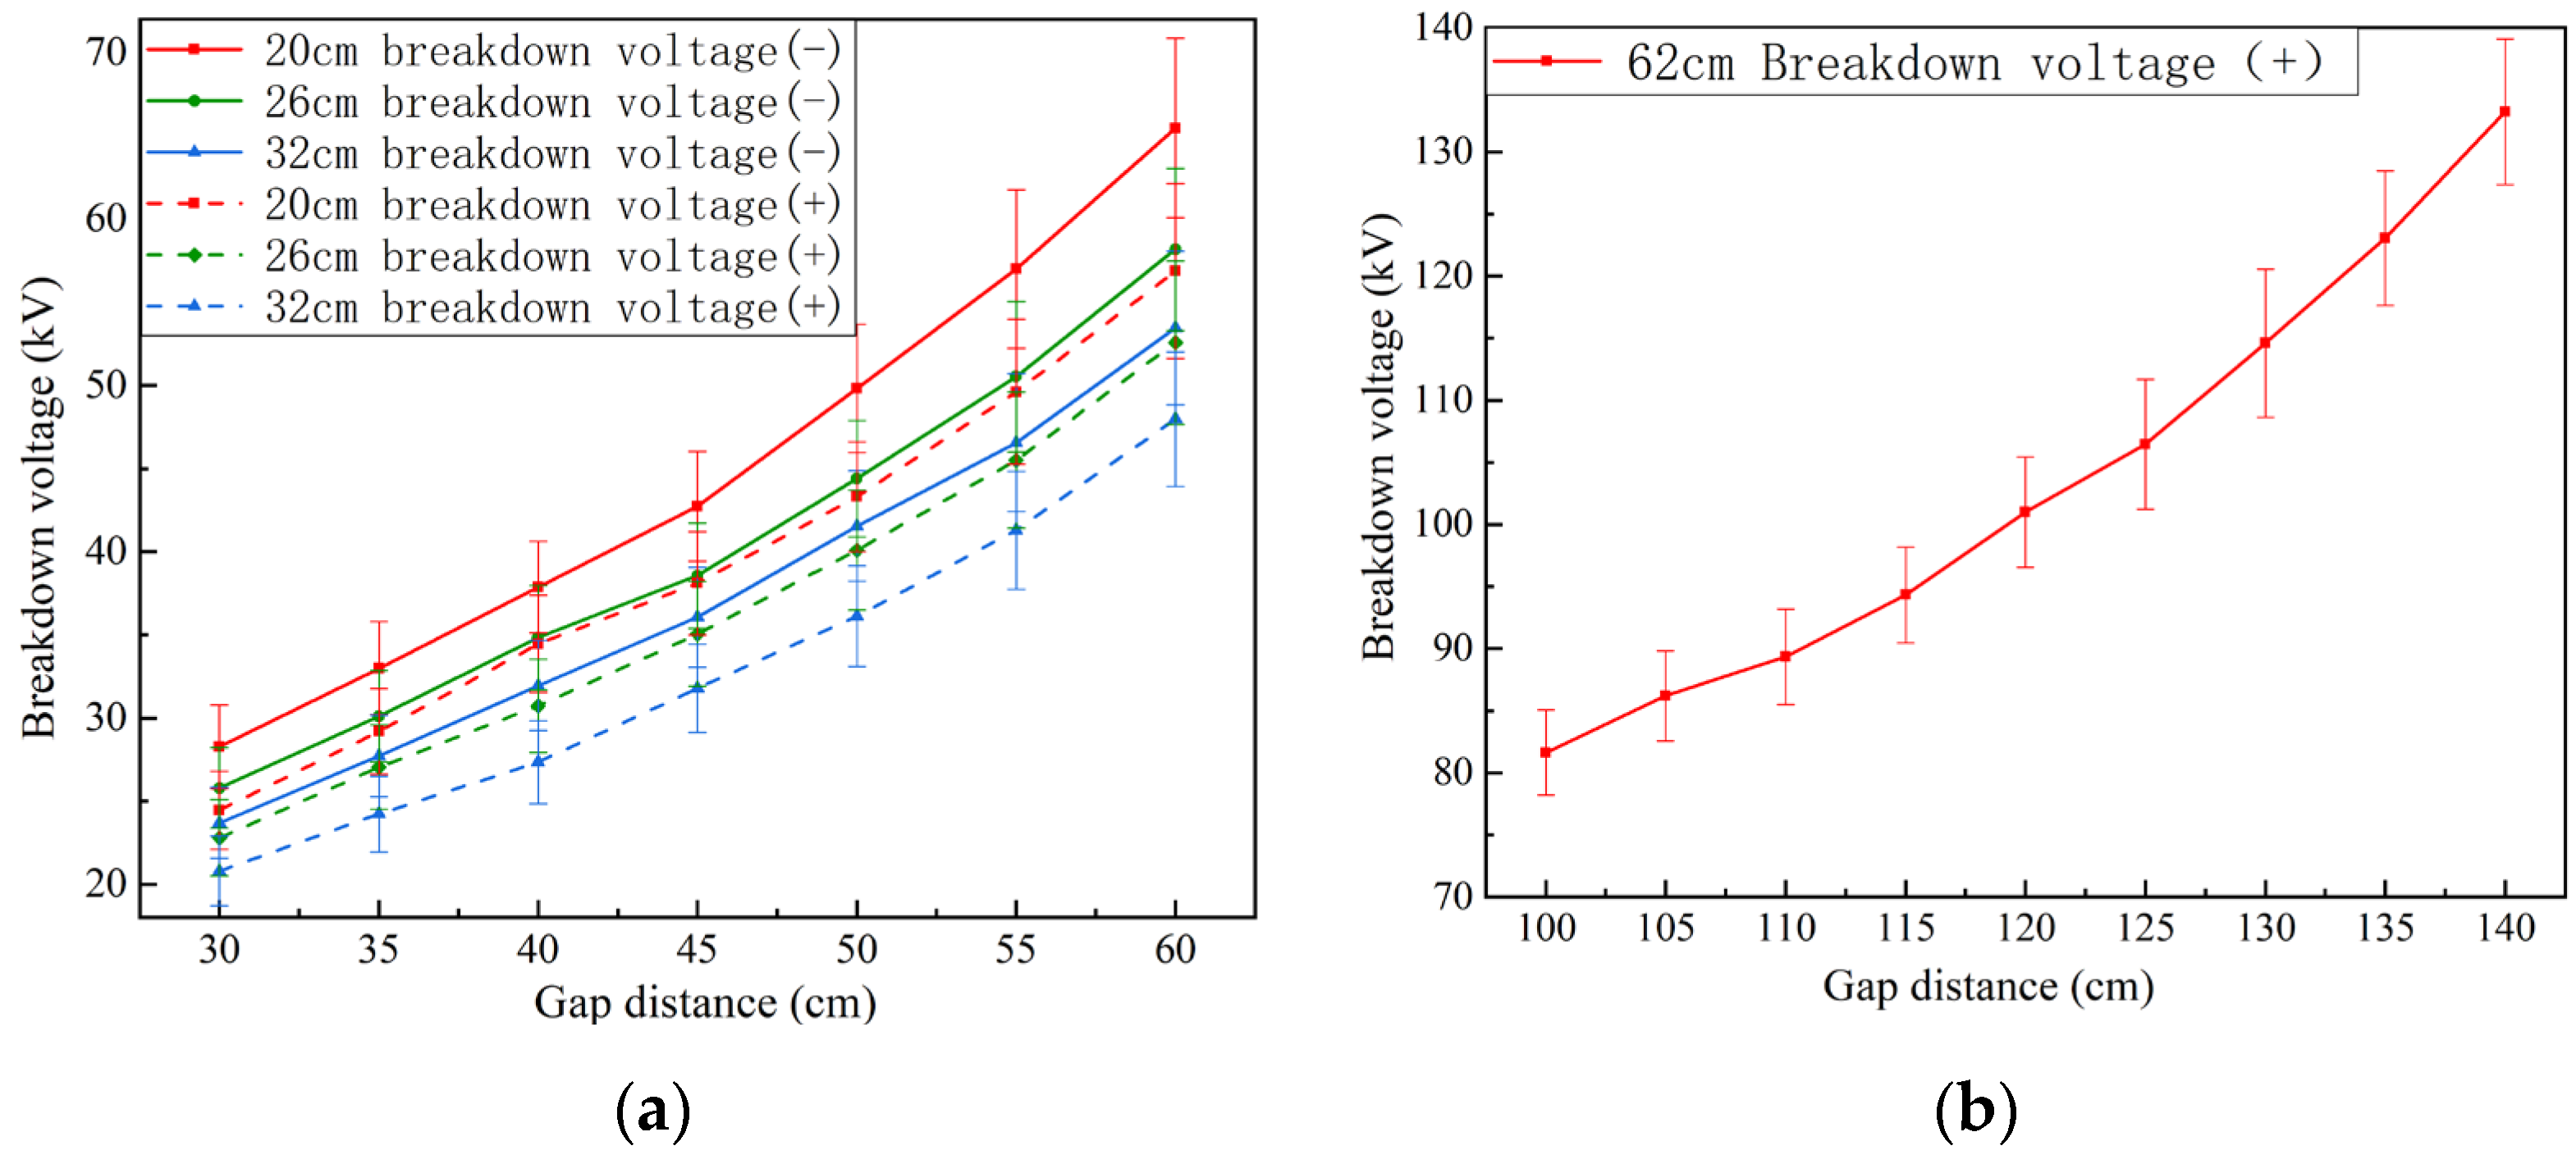
To explore the breakdown voltage under different polarities and rod–plate gaps, the size of the test wooden crib used was 20 cm, 26 cm, and 32 cm, respectively. Under wooden crib fire conditions, the flame gap distance was 30 cm to 60 cm. In subsequent studies, prediction of breakdown voltage under longer gaps was required, along with conducting breakdown voltage tests for flame gaps ranging from 100 cm to 140 cm for a 62 cm wooden crib.
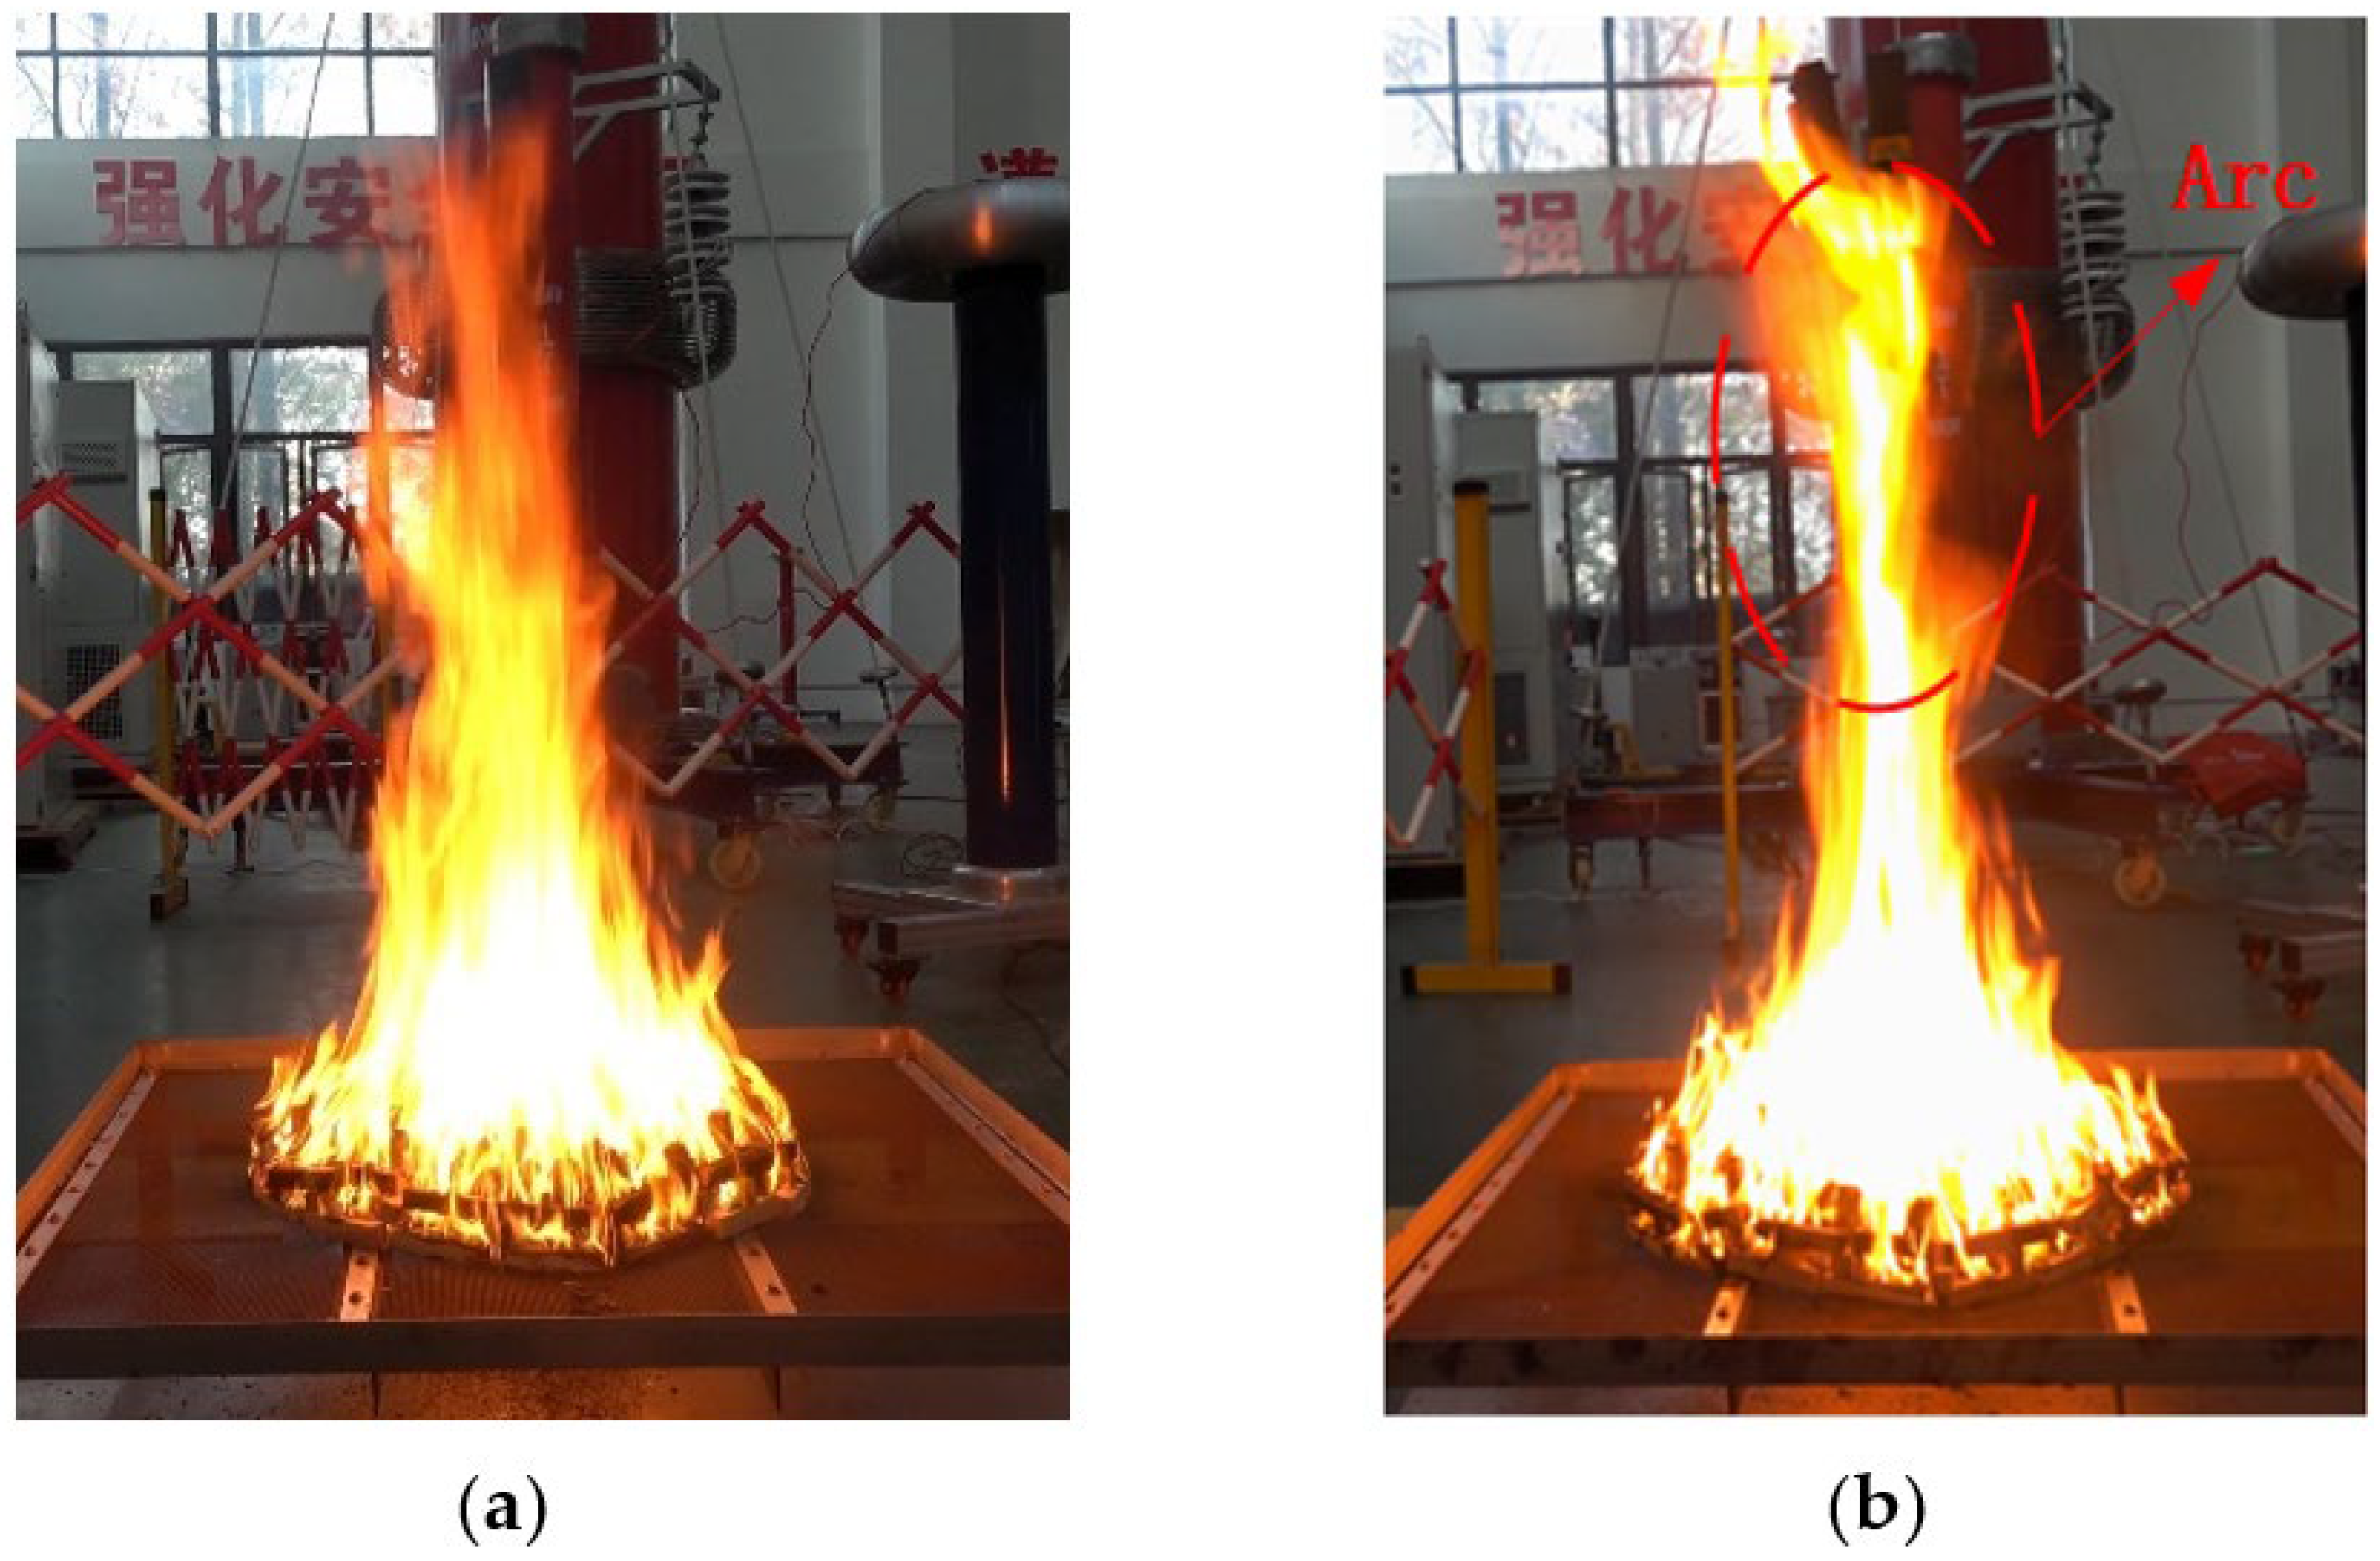
Figure 2a displays the form of the flame body when the gap is entirely bridged. On the other hand, Figure 2b illustrates that when the flame gap collapses, a luminous arc emerges, stretching across the entire gap, which is positioned in the center of the flame body. In Figure 3, the breakdown voltage values for different flame gaps in various sizes of wooden cribs are presented. As the rod–plate gap distance increases, the tail slightly tilts upwards. It was found that under different combustion conditions of wooden cribs, the breakdown voltage of the rod–plate gap is significantly lower than that of the air gap. As the gap distance increases, the breakdown voltage gradually increases. At the same gap distance, as the size of the wooden crib increases, the gap breakdown voltage decreases. The flame gap is more likely to breakdown under positive voltage.

3. Simulation Analysis of the Influencing Factors of the Flame Gap Breakdown Voltage

The combustion of wooden cribs generates high temperatures and a significant number of charged particles. These particles distort the spatial electric field, making the insulation gap more prone to breakdown. However, directly measuring temperature distribution and charged particle concentration through experiments is difficult. Therefore, the leakage current is used to characterize the change in the concentration of charged particles in space. Multi-physical field simulation is chosen to calculate and analyze the temperature distribution in space.

3.1. Simulation Model

3.1.1. Non-Isothermal Flow Model

The flame combustion airflow is turbulent flow. In this paper, the RNG k-ε turbulence model, considering the influence of vortex, is used to simulate the fluid field. The RNG k-ε model is a turbulence calculation model obtained by integrating the standard k-ε model and the renormalization group model. Compared with the standard k-ε turbulence model, it has higher calculation accuracy and can accurately describe the high-speed flow state of vortices such as flame. The governing equation is as follows:
ρ k t + ρ k u i x i = x j α k μ e f f k x j + G k + ρ ε
ρ k t + ρ ε u i x i = x j α ε μ e f f ε x j + C 1 ε k G k C 2 ε ρ ε 2 k
ρ C p T t + ρ C p u · T + · q = Q
In the formula, k is the turbulent kinetic energy, ε is the turbulent dissipation rate, ρ is the density, ui is the instantaneous velocity in the i direction, Gk is the generation term of the turbulent kinetic energy k, αk is the Prandtl number of the turbulent kinetic energy k, αε is the Prandtl number of the turbulent dissipation rate ε, μeff is the equivalent viscosity coefficient, and C1ε and C2ε are the calculation constants. The value of C1ε is 1.42, and the value of C2ε is 1.68. q is the heat transfer rate, Cp is the specific heat capacity, u is the specific thermodynamic energy, and Q is heat.

3.1.2. Space Charge Density Coupling Model

The electric field changes the movement of charged particles, which in turn affects the chemical reaction between particles. The component Fi of the electric field force is composed of the electric field intensity component Ei, and the concentration of the charged material n+, n, is as follows:
F i = e E i n + n
E i = V x i
2 V = e n + n ε 0
In the formula, + and − represent the properties of positive and negative carriers, e represents the electron charge, V is the potential, and ε0 is the vacuum dielectric constant.

3.1.3. Chemical Reaction Model

The main combustible component in the process of vegetation combustion is cellulose, and the simplified chemical molecular formula is CxHyOz. According to the literature [11,12], the combustion reaction formula of pine crib during pyrolysis is as follows:
C 14 H 10 O 6 4 C + 3 CO + CO 2 + 2 CH 4 + 2 H 2 + 2 H 2 O
After the combustion of vegetation, a large number of hydrocarbons is generated, and a large amount of heat is generated during the pyrolysis chemical reaction process. Under the action of high heat, hydrocarbons react with other substances in the air to generate a large number of electrons and positively charged particles. The main ion reactions are as follows:
CH + O HCO + + e
HCO + + H 2 O CO + H 3 O +
The distance, h, between the rod electrode and the wooden crib is set according to different electrode heights under specific test conditions. The radius of the rod electrode is 1.5 cm and the length is 9.5 cm. An airbag with a radius of 500 cm and a height of 2500 cm is set as the outer boundary. The geometric structure of the simulation model is shown in Figure 4. In this paper, the initial electric field generated by the rod electrode is a constant electric field, the air boundary area is zero charge, and the ground potential is zero. The side boundary and upper boundary of the model are set as open boundary, and the lower boundary of the model is adiabatic.

3.2. The Effect of the Electrode-Applied Voltage on Flame Temperature

Under the influence of polar voltage, the flame exhibits periodic oscillation characteristics. Throughout stable combustion periods, the oscillation frequency of the flame remains consistent. Therefore, the average spatial temperature of a flame oscillation cycle is analyzed. As depicted in Figure 5, the temperature near the electrode rises under the voltage’s influence, increasing by 22 °C to 113 °C, as compared to the temperature without voltage. Notably, positive and negative voltages have distinct impacts on the temperature near the electrode. With the increase in voltage, the temperature near the electrode gradually rises, revealing a pronounced polarity effect. Across various voltage amplitudes, the temperature near the positive voltage electrode surpasses that under the negative voltage by 12 °C to 61 °C. Analysis indicates that the electric field force intensifies in proximity to the electrode under the influence of voltage. Within this region, charged particles experience both fluid drag force and electric field force, increasing the likelihood of particle ionization and collision ionization. Consequently, chemical reaction processes accelerate in this region, leading to elevated temperatures near the electrode. Subsequently, when assessing spatial temperature characteristic parameters, particular attention is given to the flame body area near the electrode and the discharge channel.

4. Prediction Method for the Breakdown Voltage of Rod–Plane Gaps under Flame Conditions

4.1. Input Characteristic Parameters

It is considered that the discharge channel area has a strong correlation with the development of gap discharge [
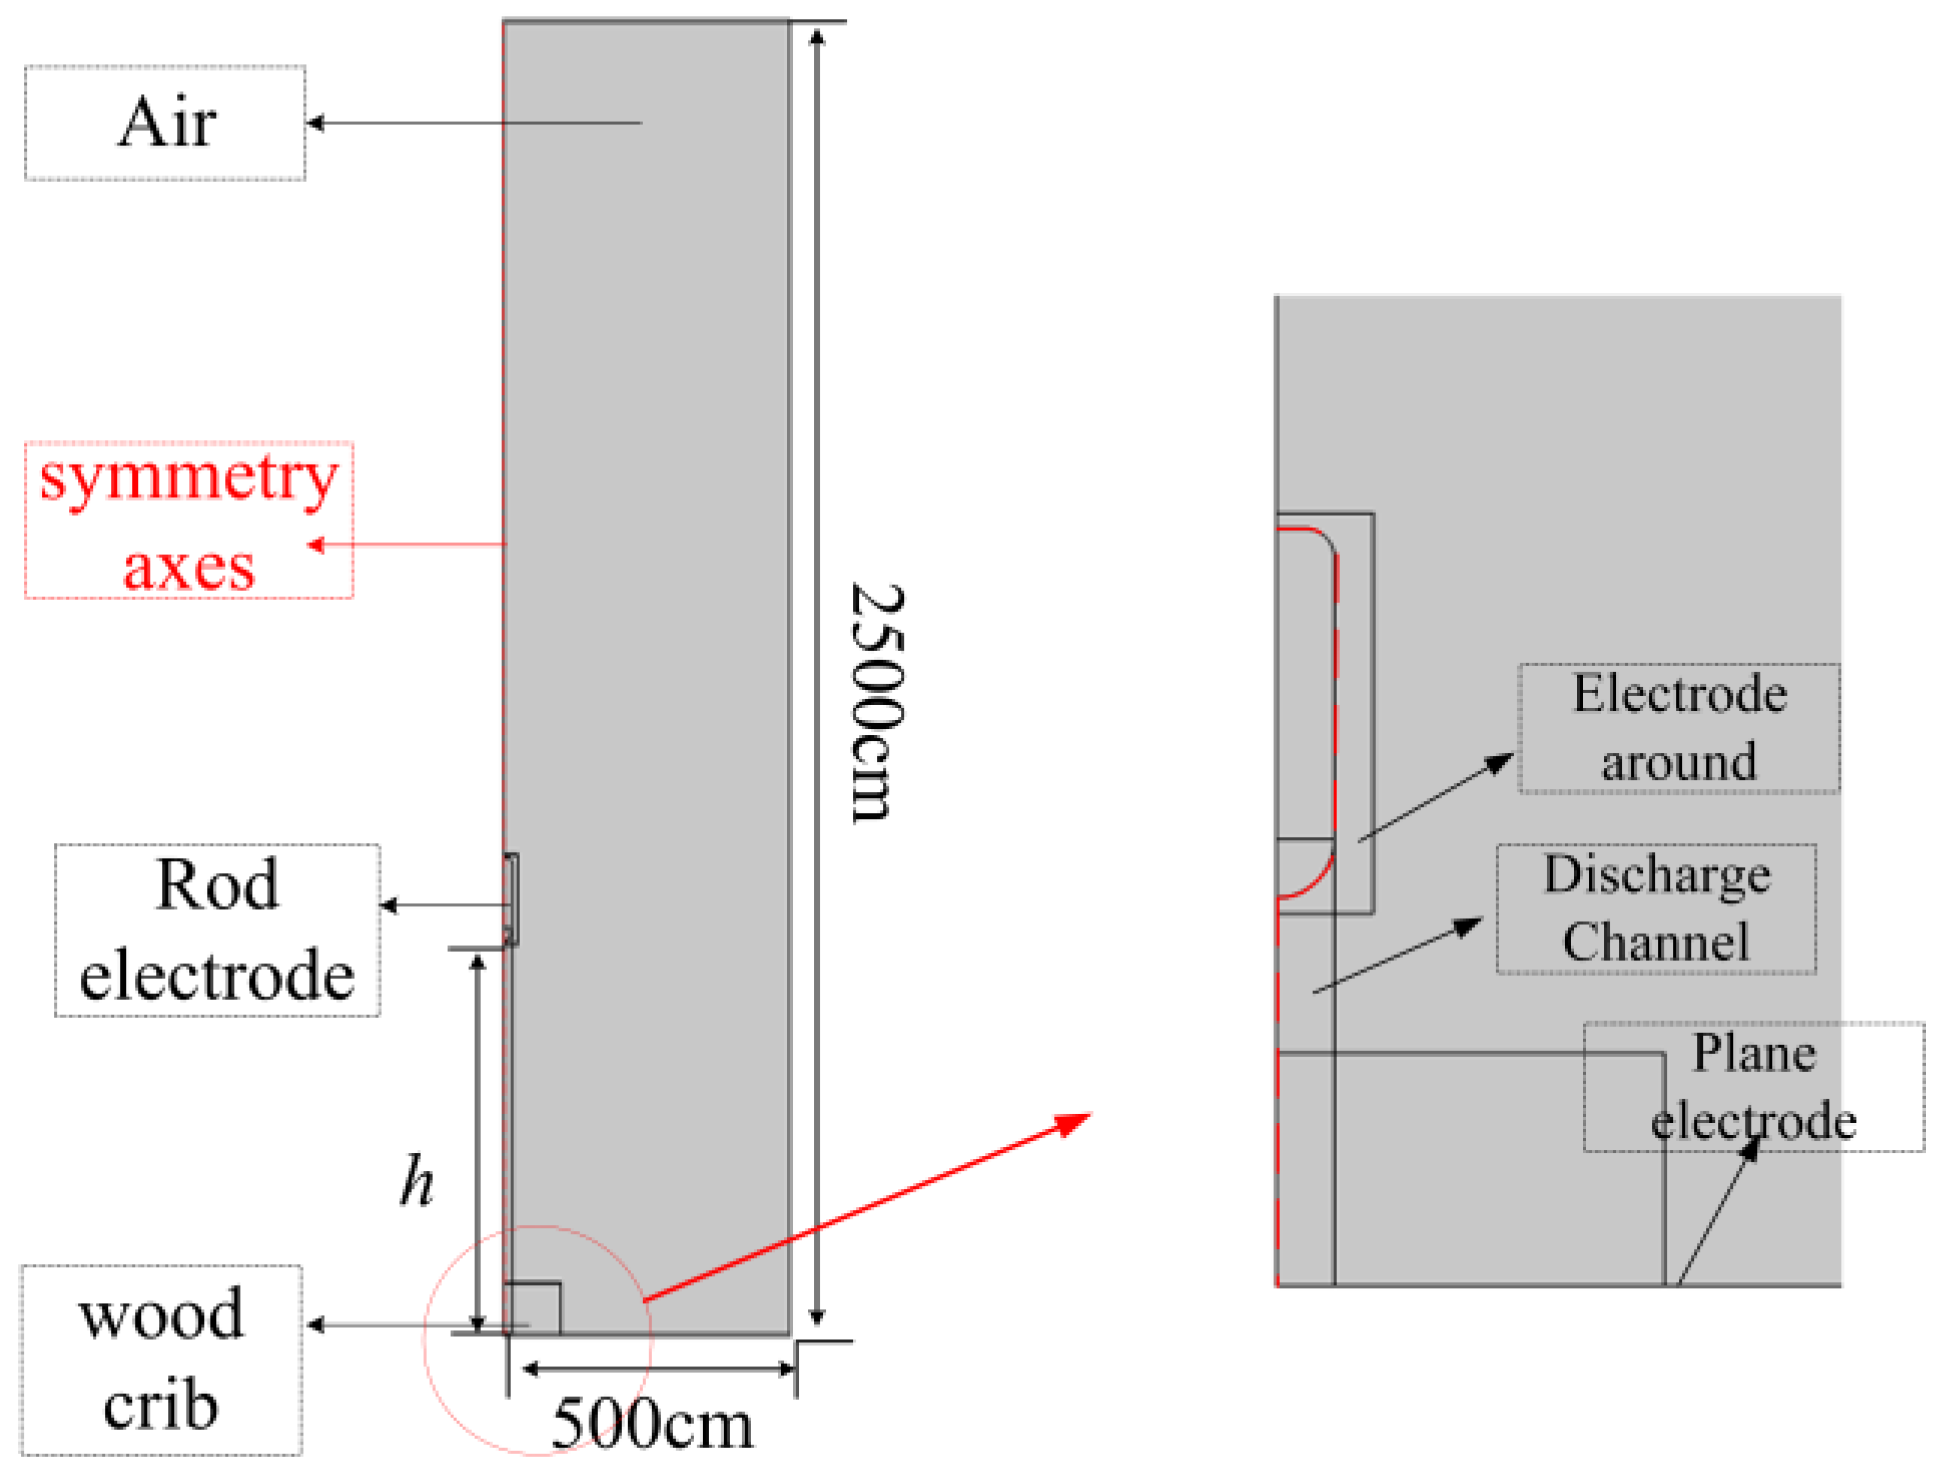
9]. The simulation analysis above shows that the breakdown voltage under flame conditions has a significant correlation with the space temperature, and the space temperature in different regions shows a polarity effect distribution under the applied voltage of the electrode. The concentration of charged particles in the flame space has a strong correlation with the leakage current, so the characteristic quantities of leakage current are selected to characterize the charged particle characteristic quantities of the flame gap. The characteristic quantities of the flame environment characterize the important influencing factors of the breakdown voltage under flame conditions, and the two are used as the input parameters for the SVM model. In the discharge channel area, the flame combustion plume is conically distributed upward, and the temperature effect in this area is evident. According to reference [4], this area is divided into continuous flame area and intermittent area. The input characteristic quantities are studied from one flame oscillation period. The specific feature selection is shown in Table 1, and the value area is shown in Figure 6.
The specific definitions of different eigenvalues are as follows:
(1) The maximum temperature Tg-max and average temperature Tg-avg of the flame root:
T g - m a x = max T i
T g - a v e = i = 1 n T i n
In the formula, Ti is the temperature of the ith unit, and n is the volume of the ith individual unit.
(2) The maximum value Tf-max and the average value Tf-ave of the temperature around the electrode:
T f - m a x = i = 1 n T i n
T f - a v e = i = 1 n T i n
(3) The average temperature of the flame body region Tave:
T L - a v e = 0 x T i ( t ) d t x
T J - a v e = x d T i ( t ) d t d x
T a v e = i = 1 n T a v e i n
In the formula, Ti(t) is the temperature value of the region, TL-ave is the average temperature of the continuous flame zone, TJ-ave is the average temperature of the intermittent flame zone, x is the height of the continuous flame zone, d is the electrode height of the plume region, T a v e i is the average temperature of the ith region, and n is the number of regions.

4.2. SVM Model Prediction Method and Parameter Selection

The prediction process is shown in Figure 7. The SVM model is trained by using the multi-physical field coupling model established above. Taking the gap length L0 as an example, the breakdown voltage of the gap is U0. The breakdown voltage under the gap is divided into breakdown interval [U0, (100% + σ%)U0] and tolerance interval [(100% − σ%)U0,U0]; σ is the difference between the maximum and minimum values of the test data and the average values mentioned above. The voltage values of the tolerance interval and the breakdown interval are loaded on each air gap in the sample set, and the simulation calculation is carried out. The input characteristic quantities, such as space temperature, leakage current, and wooden crib combustion characteristics, are extracted and normalized to eliminate the influence of dimension. The calculation formula is as follows:
x i = x i x min x max x min
where xi is an input parameter, xmin and xmax are the maximum and minimum values of the parameter, respectively, and xi′ is the normalized value.
For the test sample, taking the gap length Lp and the breakdown voltage U = Up as an example, the input feature set is extracted using the same method as used for the training set, and it is input into the SVM model for prediction. Under the initial voltage value U = Up, the model output is −1, and the loading voltage is increased to U = Up + dU until the output is 1. Under the initial voltage U = Up, the model output is 1, and the loading voltage is reduced to U = Up − dU until the output is −1. Among them, the d value is set according to the experiment and accuracy requirements. When the output of SVM increases from −1 to 1, the output voltage of 1 is the predicted value of the breakdown voltage.
The sample set above is input into the SVM model; the sample output of the breakdown interval is 1, and the sample output of the tolerance interval is −1. The K-CV (K-fold cross-validation) method is used for cross-training, and the improved GS (grid search) algorithm is used to optimize the parameters of the support vector machine model.

5. Prediction Results and Analysis

5.1. Analysis of the Influence of Feature Vector Dimension Reduction on Prediction Results

Taking the data in Table 2 as the training sample, and the data in Table 3 as the Test sample. The feature vector obtained using the above test and finite element calculation is used as the input for the model. The average absolute percentage error eMAPE is used to evaluate the prediction results. For 5-CV, the improved GS algorithm is used to optimize the parameters of the SVM model.
The optimal parameters and error indicators of the SVM model are shown in Table 4. The average errors of the breakdown voltage prediction results for the three different sizes of wooden crib flame gaps are 2.5%, 2.3%, and 2.6%, respectively. The predicted breakdown voltage of the test sample has a trend that is consistent with the experimental value. The results show that the SVM model proposed in this paper has good accuracy in the hybrid prediction of the small gap breakdown voltage under flame conditions.

5.2. Prediction and Analysis of the Breakdown Voltage of Large-Size Wooden Cribs

Under the same gaps, the flame intensity of different sizes of wooden cribs is different, and the influence on space temperature and leakage current is different. To explore the effective characterization of the SVM input feature quantity proposed in this paper, the prediction of breakdown voltage for different sizes of wooden cribs is realized. The breakdown voltage of the 32 cm wooden crib gap was predicted by using 20 cm and 26 cm wooden crib test data as training samples.
The prediction results are shown in Figure 8. The average error of the positive breakdown voltage is 2.9%, and the average error of the negative breakdown voltage is 3.3%. The predicted breakdown voltage of the rod–plate gap of the 32 cm wooden crib under flame conditions is in good agreement with the experimental results, and the changing trend is the same. It shows that the input characteristic quantities, such as space temperature, leakage current, and wooden crib combustion properties, proposed in this paper can effectively characterize the influencing factors of the breakdown voltage of gaps under different flame intensities. It shows that the SVM prediction model proposed in this paper also has a good prediction effect for the breakdown voltage of rod–plate gaps under different sizes of wooden cribs under flame conditions.

5.3. Prediction Analysis of the Long Gap Breakdown Voltage

In order to explore the prediction effect of different methods on the breakdown voltage of long gaps under different flame conditions in this paper, the air density fitting formula [3] and regression analysis method [6] are used. These two methods are compared with the SVM model proposed in this paper for predicting the breakdown voltage under different flame conditions. All methods use the small gap breakdown voltage test data for 30~60 cm as training samples and the 100 cm~140 cm breakdown voltage data as test samples.
The comparison results are shown in Figure 9. The average error of the breakdown voltage prediction using the temperature–air density fitting formula method is 14.7%, and the average error of the breakdown voltage prediction result using the regression analysis method is 7.6%; thus, the SVM prediction model is effective. The average error of the breakdown voltage prediction result is 3.2%. The breakdown voltage of the long gap under flame conditions is not directly linear with the breakdown voltage of the small gap. It is difficult to achieve a good prediction effect by using the small gap data directly to predict the breakdown voltage of the long gap. Compared with these two methods, the prediction error of the SVM model is relatively low, thereby indicating the good prediction effect of the model proposed in this paper for long gap distances.

6. Conclusions

In this paper, a voltage prediction model for rod–plate gaps under full-flame bridging conditions is established by using an SVM. The characteristic parameters are obtained through breakdown tests and multi-physics simulations under flame conditions. The breakdown voltage of the flame gaps under different working conditions is predicted. The main conclusions are as follows:
(1) The small gap breakdown voltage is predicted using the small gap training samples, and the prediction error is not more than 2.6%. The breakdown voltages of different sizes of wooden cribs are used for training and prediction, and the average error is not more than 3.3%. It shows that the prediction method and prediction model proposed in this paper have good prediction effects for small gaps.
(2) The small gap breakdown voltage data are used to predict the breakdown voltage of the long gap under the wooden crib flame conditions. Compared with the fitting method proposed in existing research, the average error of the SVM model is smaller, which is 3.2%. The prediction results verify that this model can predict the breakdown voltage of longer gaps.

Author Contributions

Writing—review & editing, Z.P.; Writing—original draft, Y.L.; Data curation, P.L., K.Y., K.Z. and R.Z. All authors have read and agreed to the published version of the manuscript.

Funding

This research received no external funding.

Institutional Review Board Statement

Not applicable.

Informed Consent Statement

Not applicable.

Data Availability Statement

The original contributions presented in the study are included in the article, further inquiries can be directed to the corresponding author.

Conflicts of Interest

Authors Kuan Ye, Kai Zhou and Ruizhe Zhang are employed by State Grid. The remaining authors declare that the research was conducted in the absence of any commercial or financial relationships that could be construed as a potential conflict of interest.

Abbreviations

BP neural networkBack propagation neural network
SVMSupport Vector Machine

References

  1. Lu, J.; Zhou, T.; Wu, C.; Ou, Y. Dropping fire retardants by helicopter and its application to wildfire prevention near electrical transmission lines. Fire 2023, 6, 176. [Google Scholar] [CrossRef]
  2. Sadurski, K.J.; Reynders, J.P. High voltage AC breakdown in presence of fires. In Proceedings of the 6th International Symposium on High Voltage Engineering, New Orleans, LA, USA, 28 August–1 September 1989. [Google Scholar]
  3. You, F.; Chen, H.; Zhang, L.; Zhou, J.; Zhu, J. Experimental study on flashover of high-voltage transmission lines induced by wood crib fire. CSEE J. Power Energy Syst. 2011, 31, 192–197. [Google Scholar] [CrossRef]
  4. Zhou, E.; Fan, L.; Huang, Y.; Zhou, Y.; Zhou, W.; Chen, W. Risk distribution assessment of wildfire-induced trips in transmission line based on flame combustion model. Power Syst. Technol. 2022, 46, 2778–2785. [Google Scholar] [CrossRef]
  5. Huang, D.; Chen, X.; Zhou, E.; Lu, W.; Li, H.; Shuang, M. Study on the Breakdown Voltage of Conductor-plane Gap under Vegetation Fire Condition Considering the Division of Flame Gap. Power Syst. Technol. 2023, 47, 3467–3474. [Google Scholar] [CrossRef]
  6. Li, P.; Ruan, J.; Huang, D.; Long, M.; Wu, T.; Pu, Z. Study on Breakdown Characteristic and Discharge Model of Conductor-plane Gap Under Typical Vegetation Flame. CSEE J. Power Energy Syst. 2016, 36, 4001–4011. [Google Scholar] [CrossRef]
  7. Yuan, Y.; Jiang, X.; Du, Y.; Ma, J.; Sun, C. Predictions of the AC Discharge Voltage of Short Rod-plane Air Gap Under Rain Conditions with the Application of ANN. High Volt. 2012, 38, 102–108. [Google Scholar]
  8. Yang, Q.; Sima, W.; Jiang, X.; Bai, K.; Mei, B. The Building And Application Of A Neural Network Model For Forecasting The Flashover Voltage Of The Insulator In Complex Ambient Conditions. CSEE J. Power Energy Syst. 2005, 155–159. [Google Scholar]
  9. Qiu, Z.; Ruan, J.; Huang, D.; Pu, Z.; Shu, S. A prediction method for breakdown voltage of typical air gaps based on electric field features and support vector machine. IEEE Trans. Dielectr. Electr. Insul. 2015, 22, 2125–2135. [Google Scholar] [CrossRef]
  10. Zhou, E.; Fan, L.; Huang, D.; Chen, X.; Wang, Y.; Huang, L. Breakdown Characteristics of Conductor-plane Gap under Vegetation Fire at the Altitudes of 2013 m. High Volt. 2022, 48, 4316–4322. [Google Scholar] [CrossRef]
  11. Dai, X.; Gamba, A.; Liu, C.; Anderson, J.; Charlier, M.; Rush, D.; Welch, S. An engineering CFD model for fire spread on wood cribs for travelling fires. Adv. Eng. Softw. 2022, 173, 103213. [Google Scholar] [CrossRef]
  12. Mell, W.; Maranghides, A.; McDermott, R.; Manzello, S.L. Numerical simulation and experiments of burning douglas fir trees. Combust. Flame 2009, 156, 2023–2041. [Google Scholar] [CrossRef]
Figure 1. Layout of the experimental equipment.
Fire 07 00143 g001
Figure 2. The breakdown process of full-flame bridging. (a) The flame completely bridging the gap; (b) the flame gap breakdown process producing an arc.
Fire 07 00143 g002
Figure 3. The breakdown voltage test values for different sizes of wooden cribs. (a) The breakdown voltage test values of the small gap; (b) the breakdown voltage test values of the long gap.
Fire 07 00143 g003
Figure 4. Geometry of the simulation model.
Fire 07 00143 g004
Figure 5. Temperature near the electrode under different voltages.
Fire 07 00143 g005
Figure 6. Characteristic value area diagram.
Fire 07 00143 g006
Figure 7. Prediction flow chart.
Fire 07 00143 g007
Figure 8. Breakdown voltage prediction results for the 32 cm wooden crib.
Fire 07 00143 g008
Figure 9. Breakdown voltage prediction results of long gap distances.
Fire 07 00143 g009
Table 1. Input parameters for the SVM model.
TypeFeatureSymbol
Space
Temperature
Maximum temperature of the flame rootTg-max
Average temperature of the flame rootTg-avg
Maximum temperature around the electrodeTf-max
Average temperature around the electrodeTf-avg
Average temperature of the discharge channelTavg
Leakage
Current
Average leakage currentIavg
Maximum leakage currentImax
Burning
Characteristics
Maximum electric field intensityD
Average electric field intensityH
Table 2. Training samples.
D/cmd/cm
203035404550
263035404550
323035404550
Table 3. Test samples.
D/cmd/cm
205560
265560
325560
Table 4. Optimal parameters and error indexes of the model under different characteristic dimensions.
9 Features
D20 cm26 cm32 cm
C274.37119.4278.793
γ0.00680.00830.0126
eMAPE2.5%2.3%2.6%
Disclaimer/Publisher’s Note: The statements, opinions and data contained in all publications are solely those of the individual author(s) and contributor(s) and not of MDPI and/or the editor(s). MDPI and/or the editor(s) disclaim responsibility for any injury to people or property resulting from any ideas, methods, instructions or products referred to in the content.

