
Hydrogen in the Natural Gas Network—Relevance for Existing Fire Precautions

Abstract
:1. Introduction
2. Literature Review on Hydrogen-Natural Gas Mixtures (Summary)
3. Experimental Method
3.1. Scenario
3.2. Experimental Setup
3.3. Experimental Procedure
3.4. Imaging Methods
4. Results and Discussion
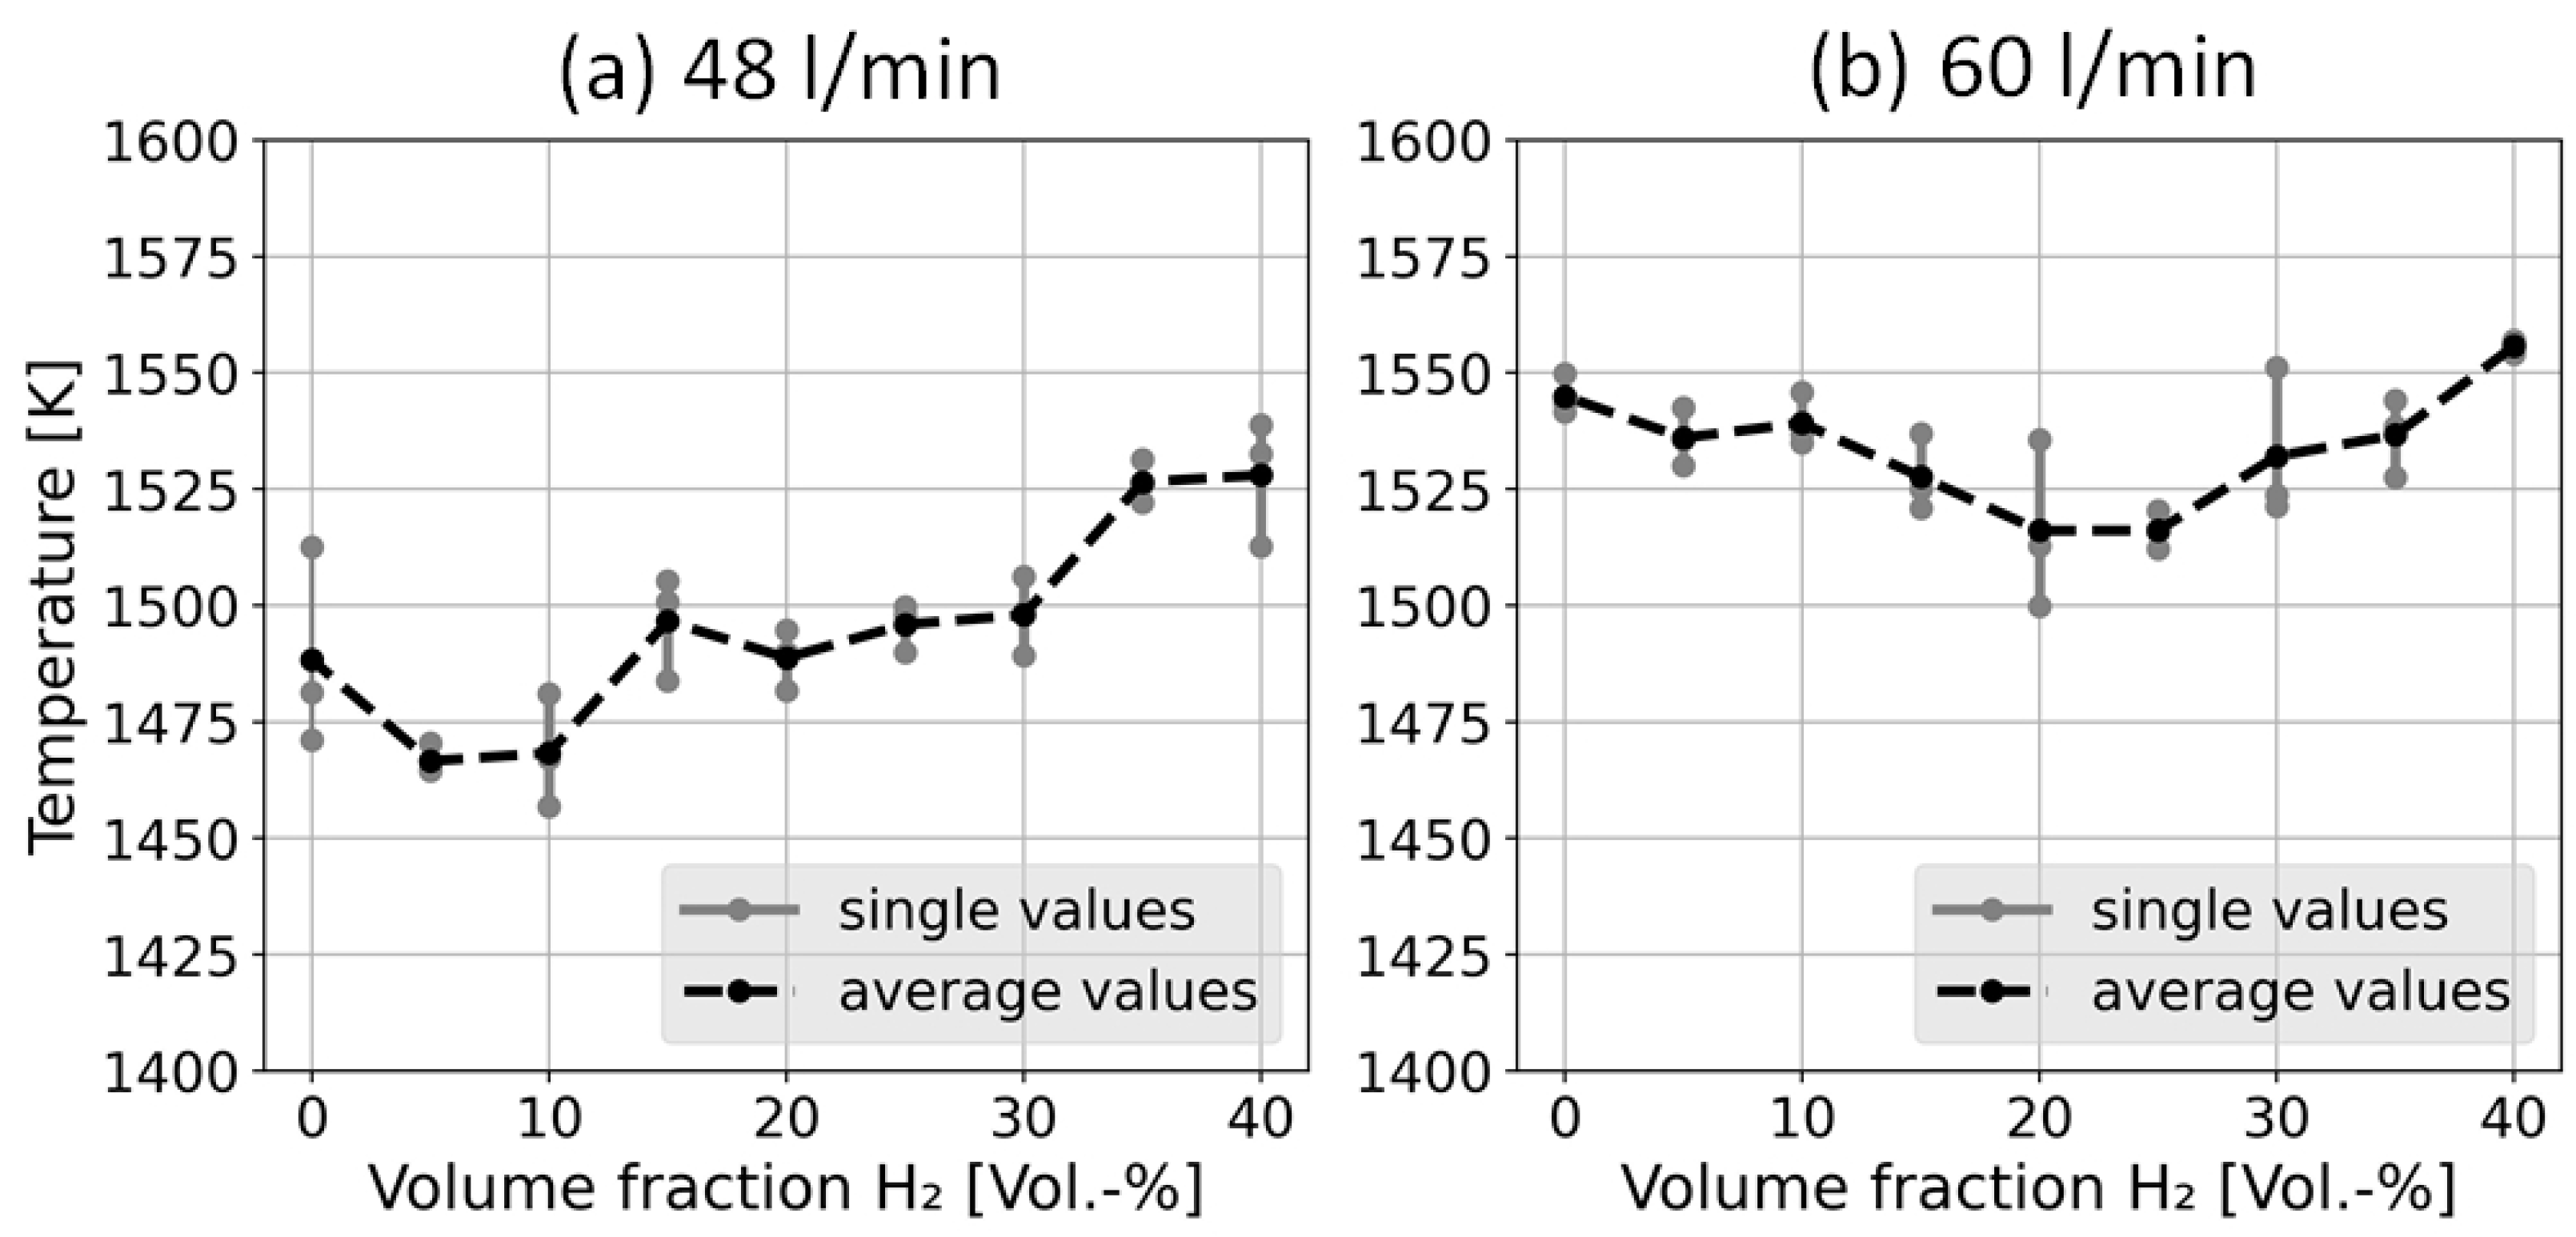
4.1. Temperature
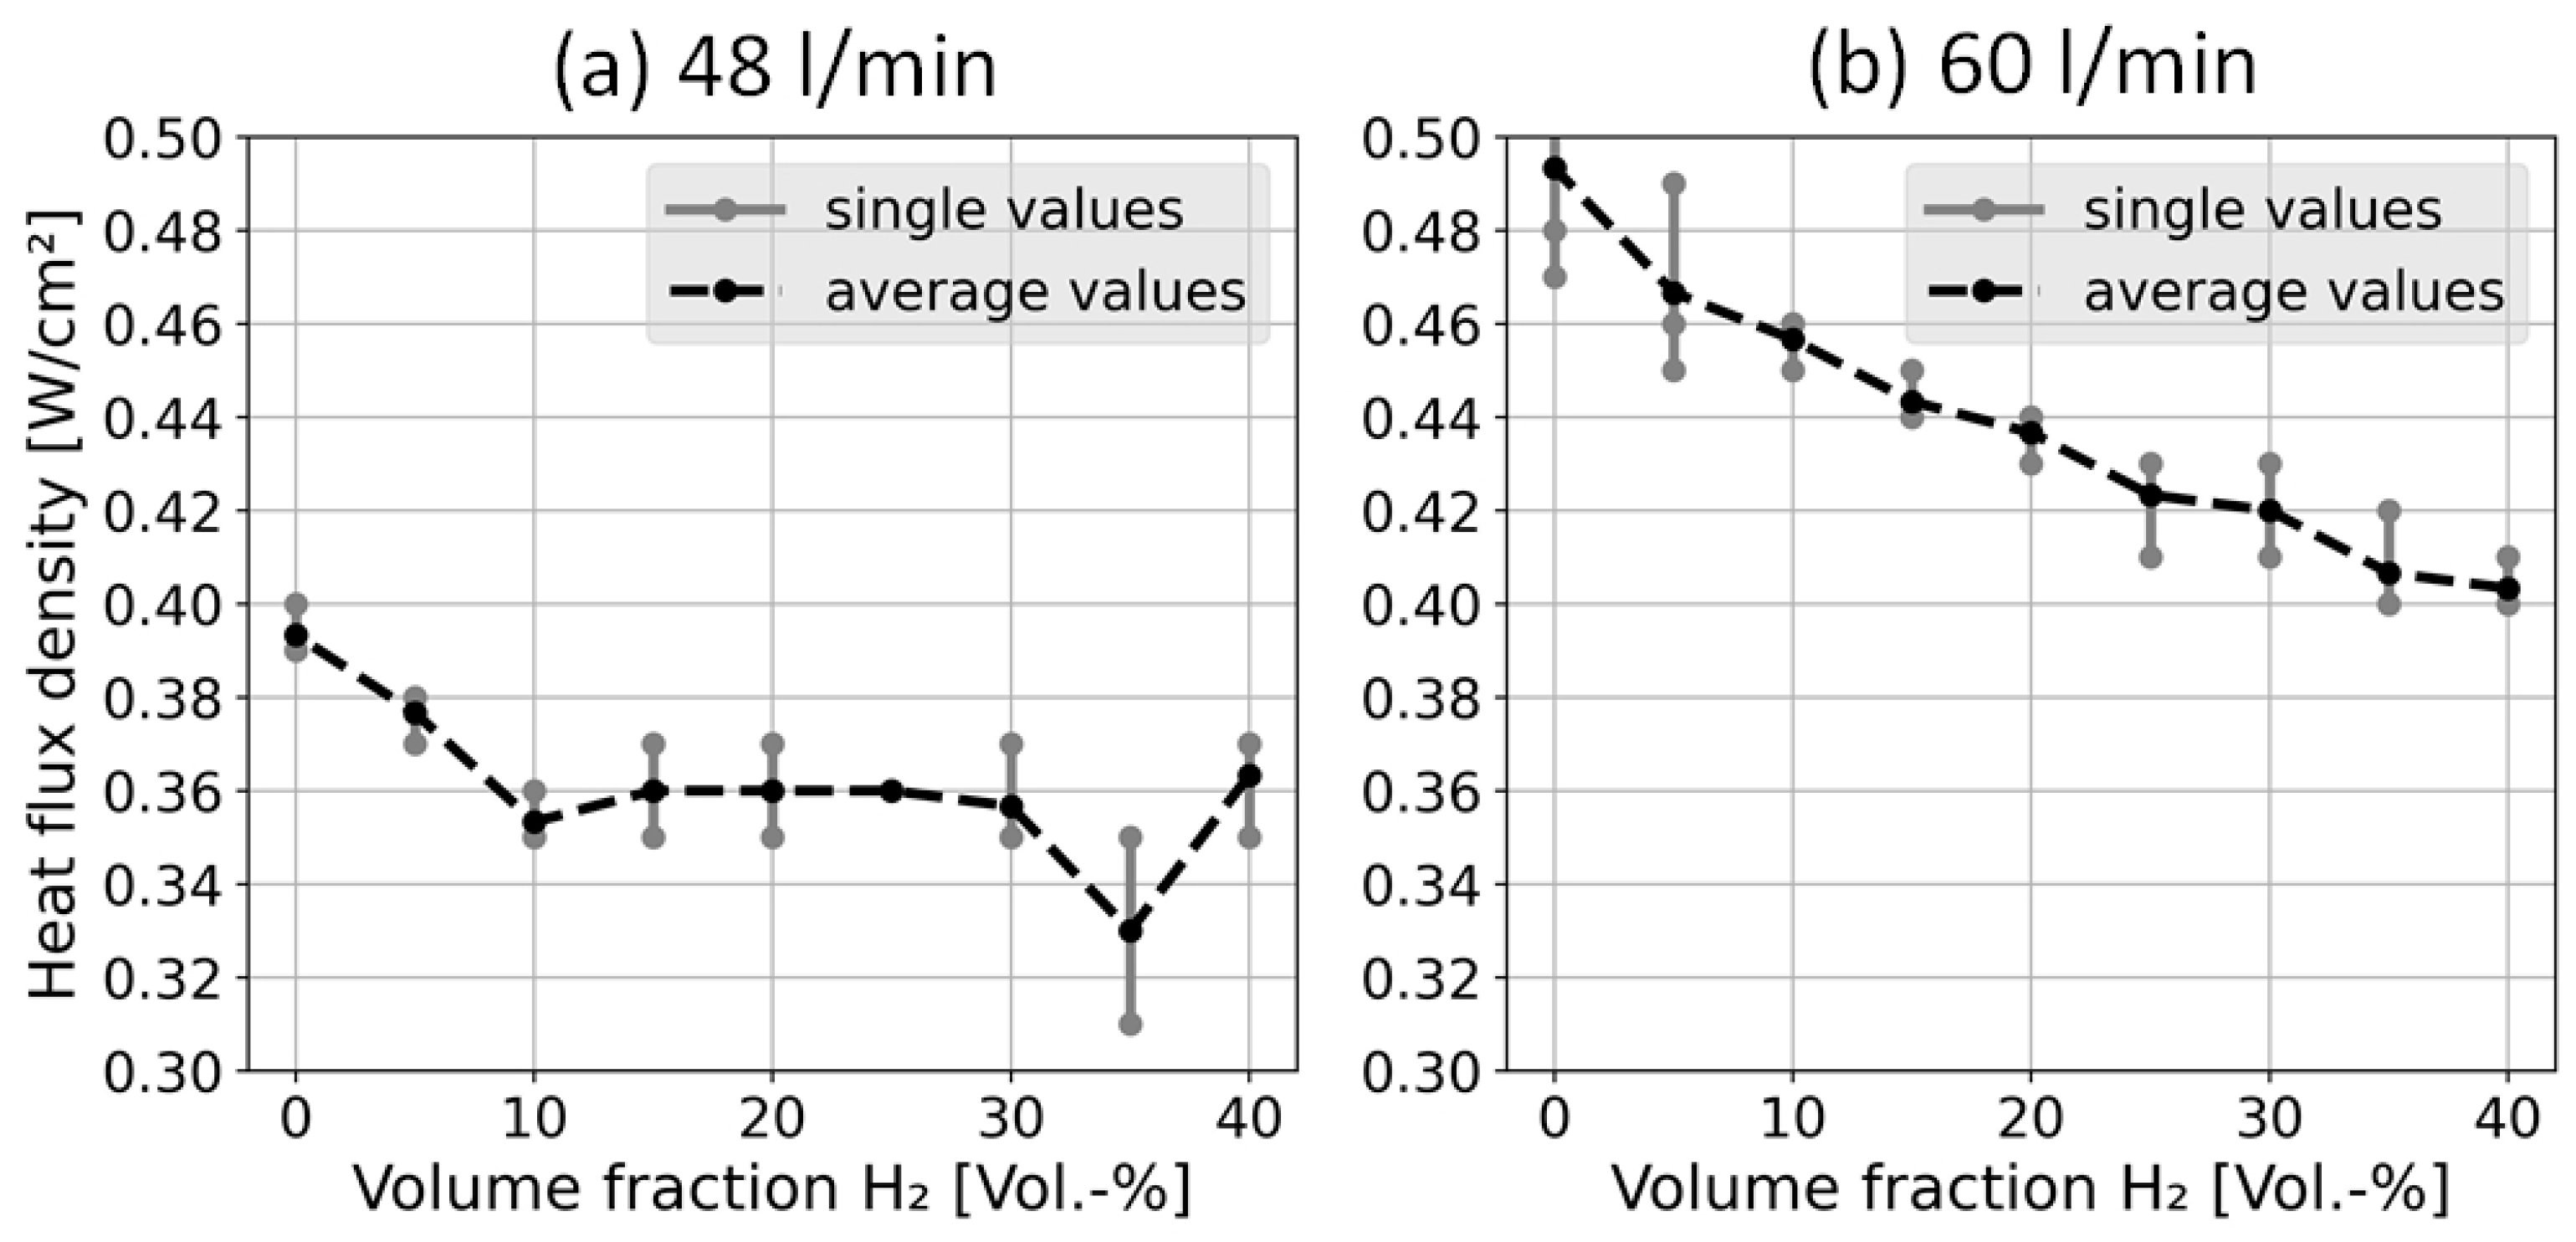
4.2. Heat Flux
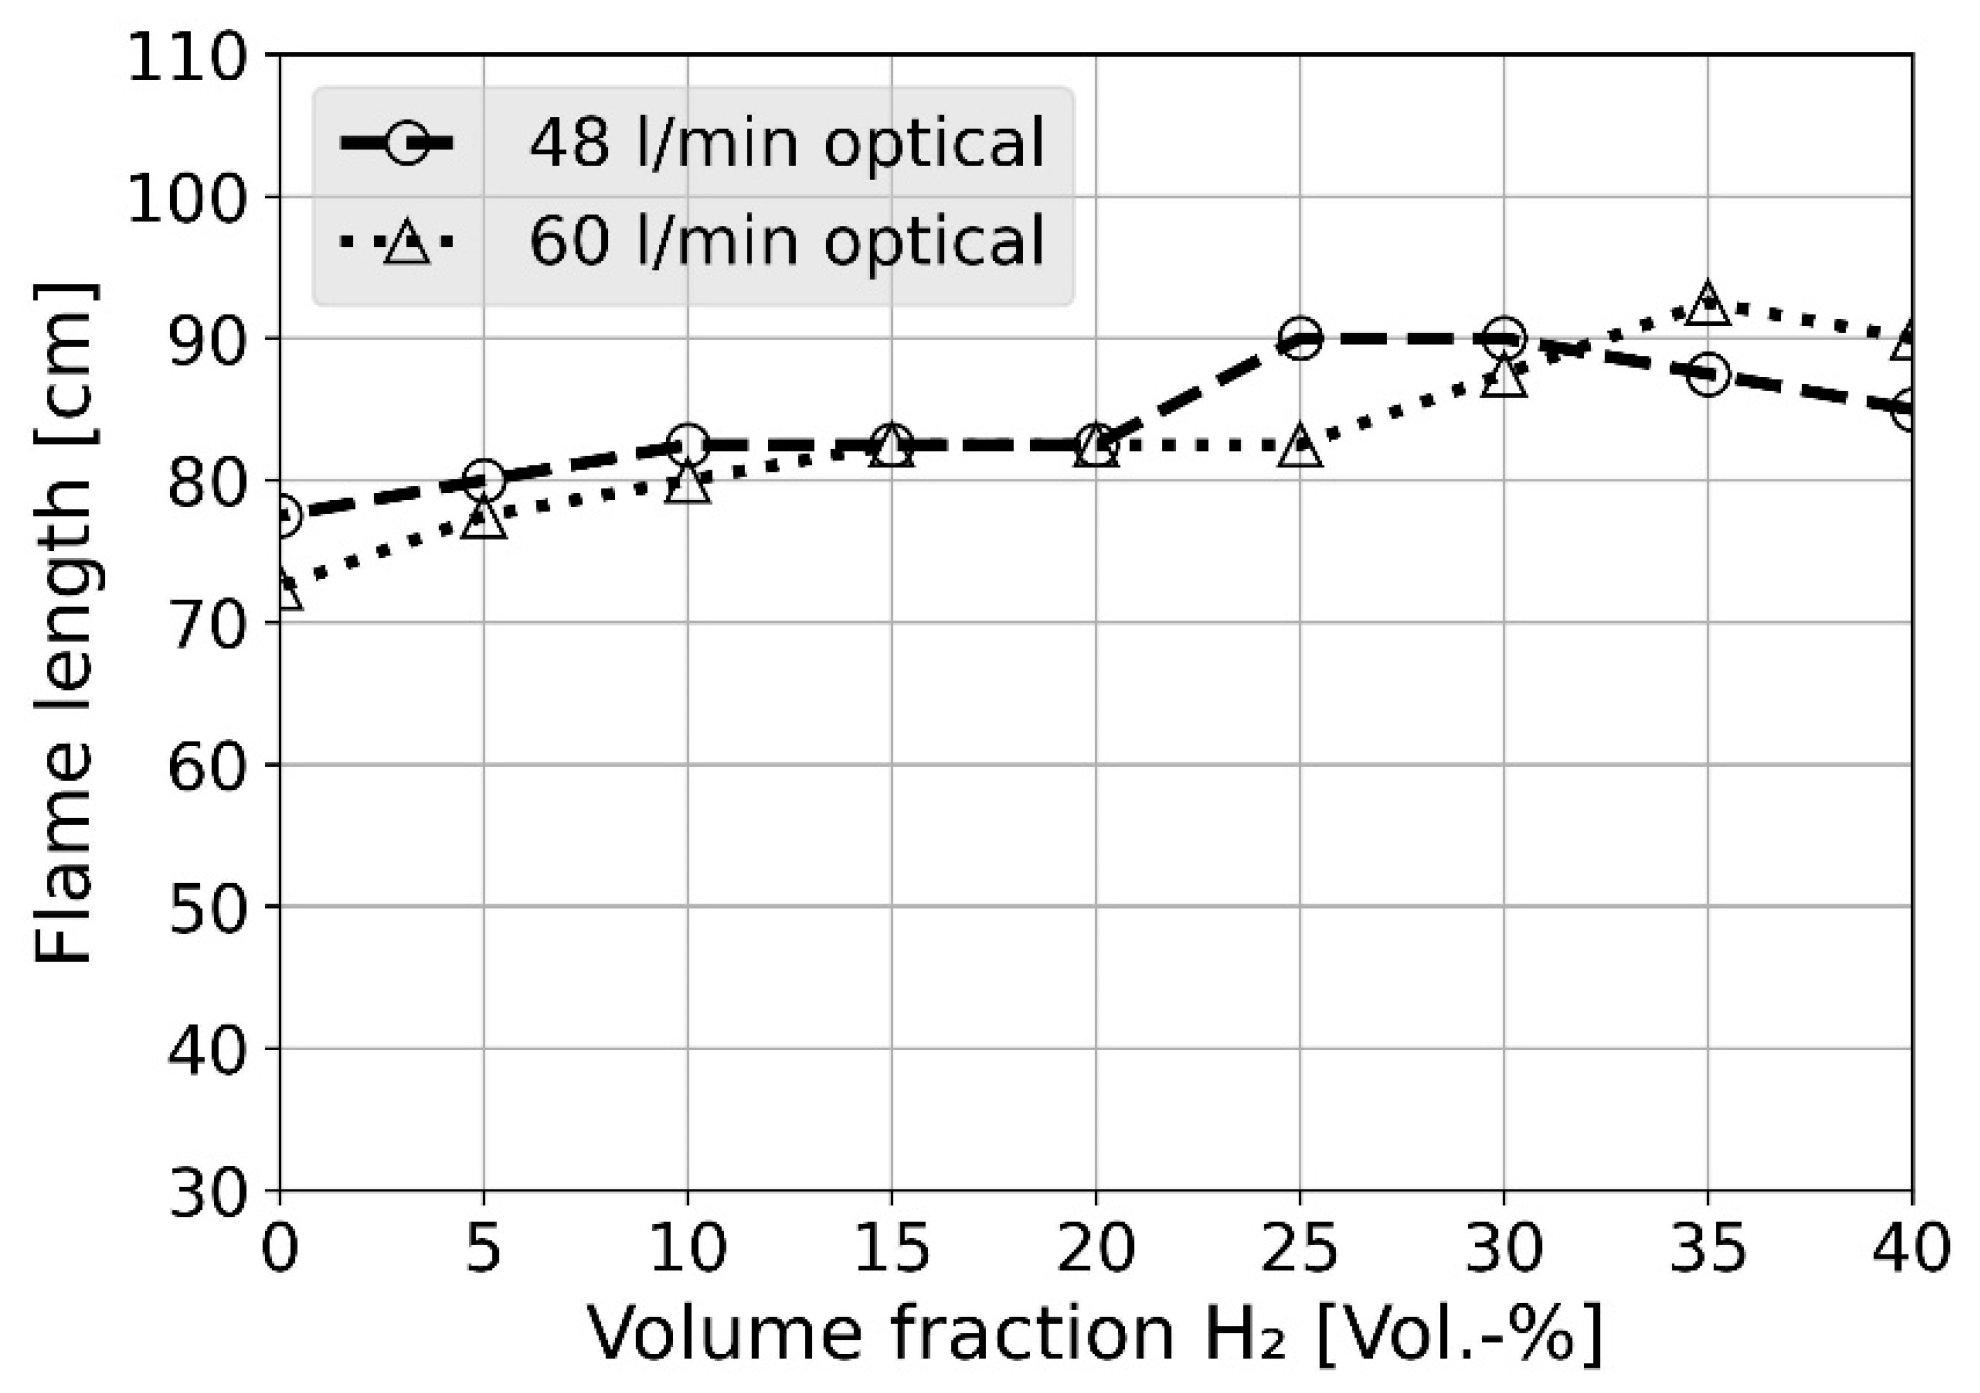
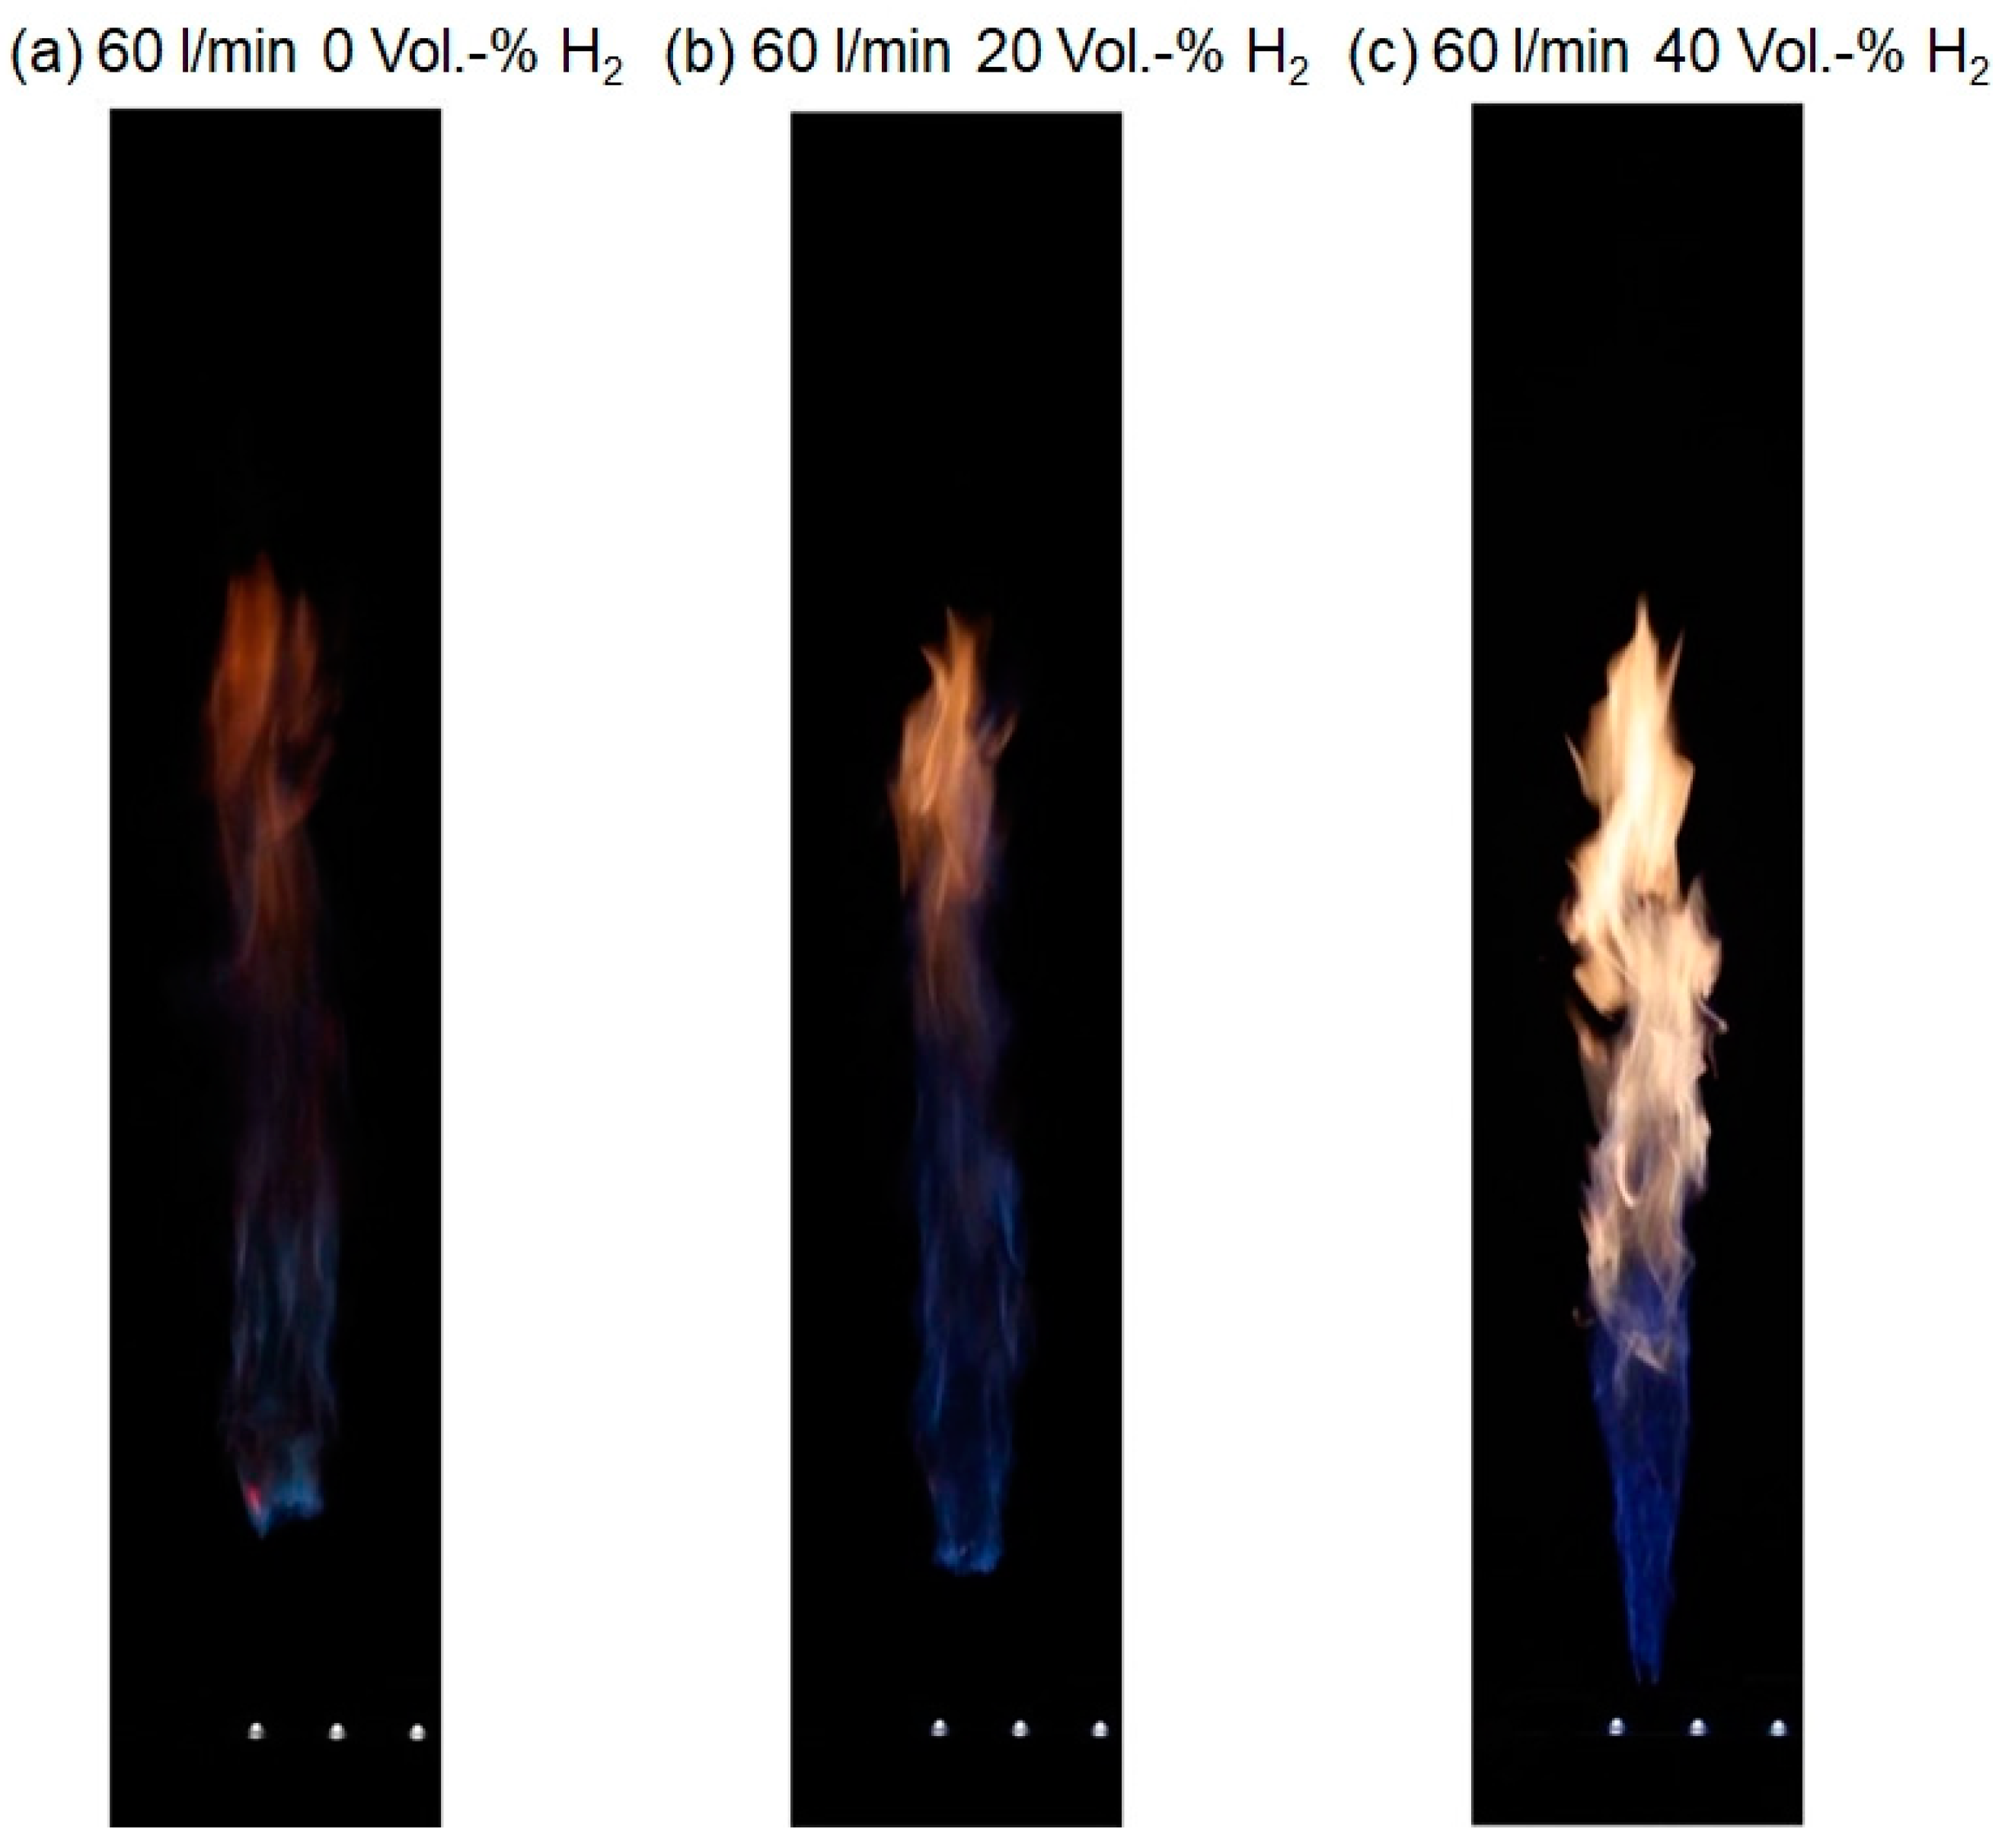
4.3. Flame Length
4.4. Lift-Off Height
5. Visibility/Color
6. Conclusions
- Flame temperature
- Steel plate temperature and heat flux densities at the nozzle axis
- Lifting height and flame length
- Emissivity
Author Contributions
Funding
Data Availability Statement
Conflicts of Interest
References
- Presse-und Informationsamt der Bundesregierung. Klimaschutzgesetz: Klimaneutralität bis 2045. Bundesregierung. Available online: https://www.bundesregierung.de/breg-de/themen/klimaschutz/klimaschutzgesetz-2021-1913672 (accessed on 22 June 2022).
- Wächter, S. Mehr Wasserstoff Technisch Sicher Verankern: DVGW-Regeln für Klimafreundliche Energieinfrastruktur; Deutsches Verbände Forum: Bonn, Germany, 2019. [Google Scholar]
- BDEW. Was Ist Klimaneutrales Gas? Bio-Erdgas, Synthetisches Gas, Wasserstoff: Heute Klimaschonend, Morgen Klimaneutral; BDEW: Berlin, Germany, 2020. [Google Scholar]
- Tenge, S.; Brandes, A. Erstmals 20 Prozent Wasserstoff im deutschen Gasnetz: Pilotprojekt nimmt Arbeit auf. DVGW Energ. Wasser-Prax. 2019, 12, 70–71. [Google Scholar]
- Schröder, V.; Askar, E.; Tashqin, T.; Habib, A.K. Sicherheitstechnische Eigenschaften von Erdgas-Wasserstoff-Gemischen. 2016. Available online: https://www.bgetem.de/redaktion/arbeitssicherheit-gesundheitsschutz/dokumente-und-dateien/brancheninformationen/energie-und-wasserwirtschaft/gasversorgung/abschlussbericht-zum-forschungsvorhaben-2539-sicherheitstechnische-eigenschaften-von-erdgas-wasserstoff-gemischen (accessed on 15 May 2022).
- Regulierung von Wasserstoffnetzen Ergebnisse der Marktkonsultation: Zusammenfassung der Stellungnahmen. 2020. Available online: https://www.bundesnetzagentur.de/SharedDocs/Downloads/DE/Sachgebiete/Energie/Unternehmen_Institutionen/NetzentwicklungUndSmartGrid/Wasserstoff/Konsultationsbericht.pdf?__blob=publicationFile&v=1 (accessed on 31 May 2022).
- Wasserstoff-Beimischung: Sicherheit in Ihrem Zuhause. 2021. Available online: https://www.dvgw.de/medien/dvgw/leistungen/publikationen/sicherheit-h2-beimischung-dvgw.pdf (accessed on 31 May 2022).
- Erstmals 20 Prozent Wasserstoff im Deutschen Gasnetz: Innovationsprojekt von E.ON, Avacon und DVGW Startet Mit Wasserstoffbeimischung. 2021. Available online: https://www.dvgw.de/medien/dvgw/verein/presse/gempi-dvgw-avacon-eon-beimischung-h2.pdf (accessed on 31 May 2022).
- Schellhorn, M. Neue Heizgeräte Versprechen Durchbruch Beim Wasserstoff. 2022. Available online: https://www.bundesbaublatt.de/artikel/bbb_Neue_Heizgeraete_versprechen_Durchbruch_beim_Wasserstoff_3735489.html (accessed on 25 July 2022).
- Dörr, H. Wasserstoff in der Gasinfrastruktur: DVGW/Avacon-Pilotvorhaben mit bis zu 20 Vol.-% Wasserstoff im Erdgas H2-20—Erhebung der Gasinstallationen nach TRGI. 2022. Available online: https://www.dvgw.de/medien/dvgw/meindvgw/fachinfos/forschung/g201902-h2-20-abschlussbericht.pdf (accessed on 31 May 2022).
- Gaßner, K.M.; Pointner, N. Tote nach Explosion in Stuttgarter Wohnhaus Geborgen. Available online: https://de.nachrichten.yahoo.com/wohnhaus-stuttgart-explosion-teils-eingest%C3%BCrzt-072917986.html?guccounter=1&guce_referrer=aHR0cHM6Ly93d3cuZ29vZ2xlLmNvbS8&guce_referrer_sig=AQAAAIhDgguaC0dNq9rvZ0rJTWrwqwg6lRt8Bn9RBPL13pBGqbq_VBxOAyuBfEVPAzfHIXrn6gvw_Kvq_fBTQfMGigDpJCT8doJkKBevNvpoZT1OJxB9v7dC4coVlzbzYADS_Vr504X8TC62-ArrqL15EKSUGWGqYGBLumakb0Nh2pKu (accessed on 20 May 2024).
- Lewis, B.; von Elbe, G. Combustion, Flames and Explosions of Gases, 3rd ed.; Elsevier: Amsterdam, The Netherlands, 1987. [Google Scholar]
- Zhan, X.; Chen, Z.; Qin, C. Effect of hydrogen-blended natural gas on combustion stability and emission of water heater burner. Case Stud. Therm. Eng. 2022, 37, 102246. [Google Scholar] [CrossRef]
- Afgan, N.H. (Ed.) Heat Transfer in Flames: Selected Chapters from the 1973 Seminar of the International Centre for Heat and Mass Transfer; Scripta Book Co. u. a: Washington, DC, USA, 1974. [Google Scholar]
- Groth, K.M.; Hecht, E.S. HyRAM: A methodology and toolkit for Quantitative Risk Assessment of hydrogen systems. Int. J. Hydrogen Energy 2017, 7485–7493. [Google Scholar] [CrossRef]
- Petersen, E.L.; Hall, J.M.; Smith, S.D.; Vries, J.d.; Amadio, A.R.; Crofton, M.W. Ignition of Lean Methane-Based Fuel Blends at Gas Turbine Pressures. J. Eng. Gas Turbines Power 2007, 129, 937–944. [Google Scholar] [CrossRef]
- El-Ghafour, S.; El-dein, A.; Aref, A. Combustion characteristics of natural gas–hydrogen hybrid fuel turbulent diffusion flame. Int. J. Hydrogen Energy 2010, 35, 2556–2565. [Google Scholar] [CrossRef]
- Pignatelli, F.; Kim, H.; Subash, A.A.; Liu, X.; Szasz, R.Z.; Bai, X.S.; Brackmann, C.; Aldén, M.; Lörstad, D. Pilot impact on turbulent premixed methane/air and hydrogen-enriched methane/air flames in a laboratory-scale gas turbine model combustor. Int. J. Hydrogen Energy 2022, 47, 25404–25417. [Google Scholar] [CrossRef]
- Dreyer, L. Wasserstoff im Erdgasnetz Relevanz Für Bestehende Brandschutzmaßnahmen. Master’s Thesis, Karlsruhe Institute of Technology Karlsruhe, Germany, 2022. [Google Scholar]
- WIKA Alexander Wiegand SE & Co. KG. Einsatz von Thermoelementen, WIKA Datenblatt IN 00.23. 2016. Available online: https://www.wika.com/media/Technical-information/German/ds_in0023_de_de.pdf (accessed on 2 November 2022).
- Baehr, H.D.; Stephan, K. Wärme-und Stoffübertragung; Springer: Berlin/Heidelberg, Germany, 2016. [Google Scholar]
- The MathWorks, Inc. 2021. Available online: https://de.mathworks.com/help/matlab/ref/rgb2gray.html (accessed on 20 August 2020).
- The MathWorks, Inc. 2021. Available online: https://de.mathworks.com/help/images/ref/edge.html (accessed on 15 September 2020).
- Wu, L.; Kobayashi, N.; Li, Z.; Huang, H. Experimental study on the effects of hydrogen addition on the emission and heat transfer characteristics of laminar methane diffusion flames with oxygen-enriched air. Int. J. Hydrogen Energy 2016, 41, 2023–2036. [Google Scholar] [CrossRef]
- Max, D. Untersuchungen freier Diffusionsflammen mit Propan-Butan Gemisch: VBT-Seminar. Unpublished work. 2022. [Google Scholar]
- Kasabov, P. Experimentelle Untersuchungen an Abgehobenen Flammen unter Druck. Ph.D. Thesis, Karlsruhe Institute of Technology, Karlsruhe, Germany, 2014. [Google Scholar]
- Schumacher, A.; Waldmann, H. Wärme-und Strömungstechnik im Dampferzeugerbau: Grundlagen u. Berechnungsverfahren; Vulkan-Verlag Classen: Essen, Germany, 1972. [Google Scholar]
- Sedlmaier, J. Numerische und experimentelle Untersuchung an einer abgehobenen Flamme unter Druck. Ph.D. Thesis, Karlsruhe Institute of Technology, Karlsruhe, Germany, 2019. [Google Scholar]
- Fairweather, M.; Ormsby, M.P.; Sheppard, C.; Woolley, R. Turbulent burning rates of methane and methane–hydrogen mixtures. Combust. Flame 2009, 156, 780–790. [Google Scholar] [CrossRef]
- Droste, B.; Eder, A.; Karl, W.; Kesten, M.; Musiol, F.; Rohde, J.; Sauer, G.; Szamer, R.; Ziegler, H.-P. Anwendung der Wasserstoff-Technologie—Eine Bestandsaufnahme: Des Arbeitskreises Wasserstofftechnologie der SFK. 2002. Available online: https://www.kas-bmu.de/sfk-berichte.html?file=files/publikationen/SFK-Publikationen/Berichte/sfk_gs_37.pdf&cid=1664 (accessed on 15 September 2023).
- Gauglitz, G.; Löbert, H. Einführung in die Spektroskopie, Das elektromagnetische Spektrum und dessen Spektralbereiche. Available online: http://www.chemgapedia.de/vsengine/vlu/vsc/de/ch/13/vlu/spektroskopie/grundlagen/einfuehrung.vlu/Page/vsc/de/ch/13/pc/spektroskopie/grundlagen/spektralbereiche.vscml.html (accessed on 14 November 2022).
- Lux, J.; Haidn, O. Flame Stabilization in High-Pressure Liquid Oxygen/Methane Rocket Engine Combustion. J. Propuls. Power 2009, 25, 15–23. [Google Scholar] [CrossRef]


| Parameter | Measuring and Control Devices | Calibration Range | Position/Exp. Procedure |
|---|---|---|---|
| Pressure | PrimAtü 10 | 0–120 mbar | S. Figure 1—PI-1/pressure monitoring |
| Temperature | Thermocouple Type K (NiCr-Ni) | −40–+1200 °C [20] | steel plate, S. Figure 2/temperature distribution along the plate |
| Temperature | Thermocouple Type S (Pt10%Rh-Pt) | 0–+1600 °C [20] | in the flame, S. Figure 2/flame temperatures over the length of the flame, flame length and lift-off height |
| Heat flux density | Medtherm Corporation Gardon Gage Sensor | 0–5 W∙cm−2 | steel plate, S. Figure 2 (WF1)/heat flux near the leakage |
| Heat flux density | Medtherm Corporation Gardon Gage Sensor | 0–10 W∙cm−2 | near the flame, S. Figure 2 (WF2)/heat flux density over the length of the flame |
| Volume flow rate | Bronkhorst F-201AV-50K-RGD-33-V | 0–60 L∙min−1 H2 | S. Figure 1/volume flow control and monitoring |
| Volume flow rate | Bronkhorst F-112AC-M20-RGD-33-V | 0–100 L∙min−1 CH4 | S. Figure 1/volume flow control and monitoring |
| Lift-Off Heights at 48 L∙min−1 in cm | Lift-Off Heights at 60 L∙min−1 in cm | |
|---|---|---|
| 0.00 | 11.1 | 15.7 |
| 0.10 | 9.9 | 12.0 |
| 0.20 | 6.2 | 8.9 |
| 0.30 | 1.0 | 4.7 |
| 0.40 | 0.3 | 0.5 |
Disclaimer/Publisher’s Note: The statements, opinions and data contained in all publications are solely those of the individual author(s) and contributor(s) and not of MDPI and/or the editor(s). MDPI and/or the editor(s) disclaim responsibility for any injury to people or property resulting from any ideas, methods, instructions or products referred to in the content. |
© 2024 by the authors. Licensee MDPI, Basel, Switzerland. This article is an open access article distributed under the terms and conditions of the Creative Commons Attribution (CC BY) license (https://creativecommons.org/licenses/by/4.0/).
Share and Cite
Dinkov, I.; Braun, J.H.; Schelb, D. Hydrogen in the Natural Gas Network—Relevance for Existing Fire Precautions. Fire 2024, 7, 189. https://doi.org/10.3390/fire7060189
Dinkov I, Braun JH, Schelb D. Hydrogen in the Natural Gas Network—Relevance for Existing Fire Precautions. Fire. 2024; 7(6):189. https://doi.org/10.3390/fire7060189
Chicago/Turabian StyleDinkov, Ilian, Jan H. Braun, and Dietmar Schelb. 2024. "Hydrogen in the Natural Gas Network—Relevance for Existing Fire Precautions" Fire 7, no. 6: 189. https://doi.org/10.3390/fire7060189