Abstract
The urban utility tunnel is an indispensable part of modern engineering construction. However, the fire risk cannot be ignored due to the narrow space and limited ventilation of the utility tunnel. A study of smoke filling is performed in a 1/8-scaled utility tunnel (25 m × 0.5 m × 0.45 m). Five heat release rates (5, 10, 15, 20 and 25 kW) and four positions of fire sources are used for tests. The initial position of the one-dimensional smoke movement of strong plume is determined. Based on the traditional model, the longitudinal temperature attenuation model of tunnel smoke is established with consideration of radiation and convection heat losses. The theoretical value of the longitudinal temperature rise of smoke is in good agreement with the experimental value. A one-dimensional spreading velocity model is established that coincides well with the experimental value, and the relative error is less than 20%. The spreading velocity of smoke is increased by the heat release rate. The velocity of the smoke spreading at the near end is smaller than that at the center, due to the long spreading route. The current conclusions disclosed in this study provide important guidance for the ventilation design of utility tunnels for fire smoke scenarios.
1. Introduction
As a civil infrastructure of underground space, the urban utility tunnel is an indispensable part of modern engineering construction. The utility tunnel has the functions of beautifying the urban environment and protecting underground pipelines [1]. Since the internal space of urban utility tunnels is narrow and the ventilation is limited, hot smoke is easily accumulated in the event of a fire. The rapid spread of high-temperature smoke may cause damage to the structure and internal materials of the utility tunnel [2]. High-temperature and corrosive fire smoke can easily damage the internal facilities of a utility tunnel, thus affecting the stability and service life of the utility tunnel [3]. It is imperative to study the temperature profile and smoke movement of utility tunnel fires.
According to the relative flame height and ceiling height of a utility tunnel, fire can be divided into strong plume and weak plume [4]. When the flame height is more than one-third of the ceiling height, it is considered strong fire plume [5,6]. Otherwise, it is weak fire plume. For weak plume, the flow field of fire smoke is divided into the radial plume zone, one-dimensional jet zone and stagnant zone [7]. For strong plumes, the flow field can be simply grouped into the impingement zone and attenuation zone [8]. The internal space of an urban utility tunnel is narrow and long, so the fire smoke movement has a long spreading path. As the warmed smoke spreads in the utility tunnel, the temperature gradually decays due to the continuous heat exchange with the surrounding air and sidewalls of the tunnel. The temperature attenuation of smoke in the longitudinal direction under the ceiling roof has been widely investigated by previous researchers. Kunsch [9] established a shallow-layer equation to describe longitudinal temperature decay, in which the air entrainment, the friction with the ceiling and the heat loss to the ceiling were taken into account. Later, on the basis of Kunsch’s theory [9], Hu et al. [10] omitted the air entrainment term in the continuity equation and momentum equation, and proposed an exponential function to describe the longitudinal temperature attenuation in full-scale highway tunnels. Ye et al. [11] used an oil pool fire to simulate the smoke movement in a scaled utility tunnel, and proposed a theoretical model for the longitudinal maximum temperature decay of strong plume using the approximate thermal boundary layer theory. Ingason and Li [12] proposed the theoretical expression of the attenuation of the longitudinal maximum temperature rise.
Models of smoke spreading velocity were established based on highway tunnel fire [13]. Hinkley [14] proposed a classical model of the spreading velocity of smoke from a ceiling jet, finding that the spreading velocity was attenuated exponentially with temperature. However, the heat loss during the propagation of smoke flow was neglected, so the predicted results strongly over-estimated the spreading velocity of smoke to some place far away the fire source. In order to overcome this deficiency, Yang et al. [15] conducted scaled experimental runs to examine the velocity of instantaneous smoke movement. In accordance with Hinkley’s model [14], the authors proposed a prediction model of the smoke front’s spreading velocity by considering the heat loss during smoke propagation. Later, Hu et al. [10] established two index models of smoke spreading velocity based on the buoyancy-dominated smoke movement and the viscosity-dominated smoke movement.
In summary, models of longitudinal temperature attenuation and smoke spreading speed were established on the basis of the ceiling jet flow of building or highway tunnel fire [16,17]. In accordance with the technical code for urban utility tunnels, the fire prevention area is closed once combustibles catch fire. The smoke is discharged after it is extinguished, so the actual fire of the utility tunnel is different from a highway tunnel fire or ceiling fire inside a compartment. The longitudinal temperature attenuation of ceiling smoke mainly depends on the radiation heat loss of the smoke and the convective heat exchange between the ceiling and the smoke. The radiation heat loss of smoke is generally ignored in the previous model because it is smaller than the convection heat loss. However, this assumption causes a large error for the initial value of the longitudinal temperature attenuation of an urban utility tunnel. Therefore, this study aims to propose an optimized model of longitudinal temperature decay in which radiant heat loss is not neglected.
2. Theoretical Analysis
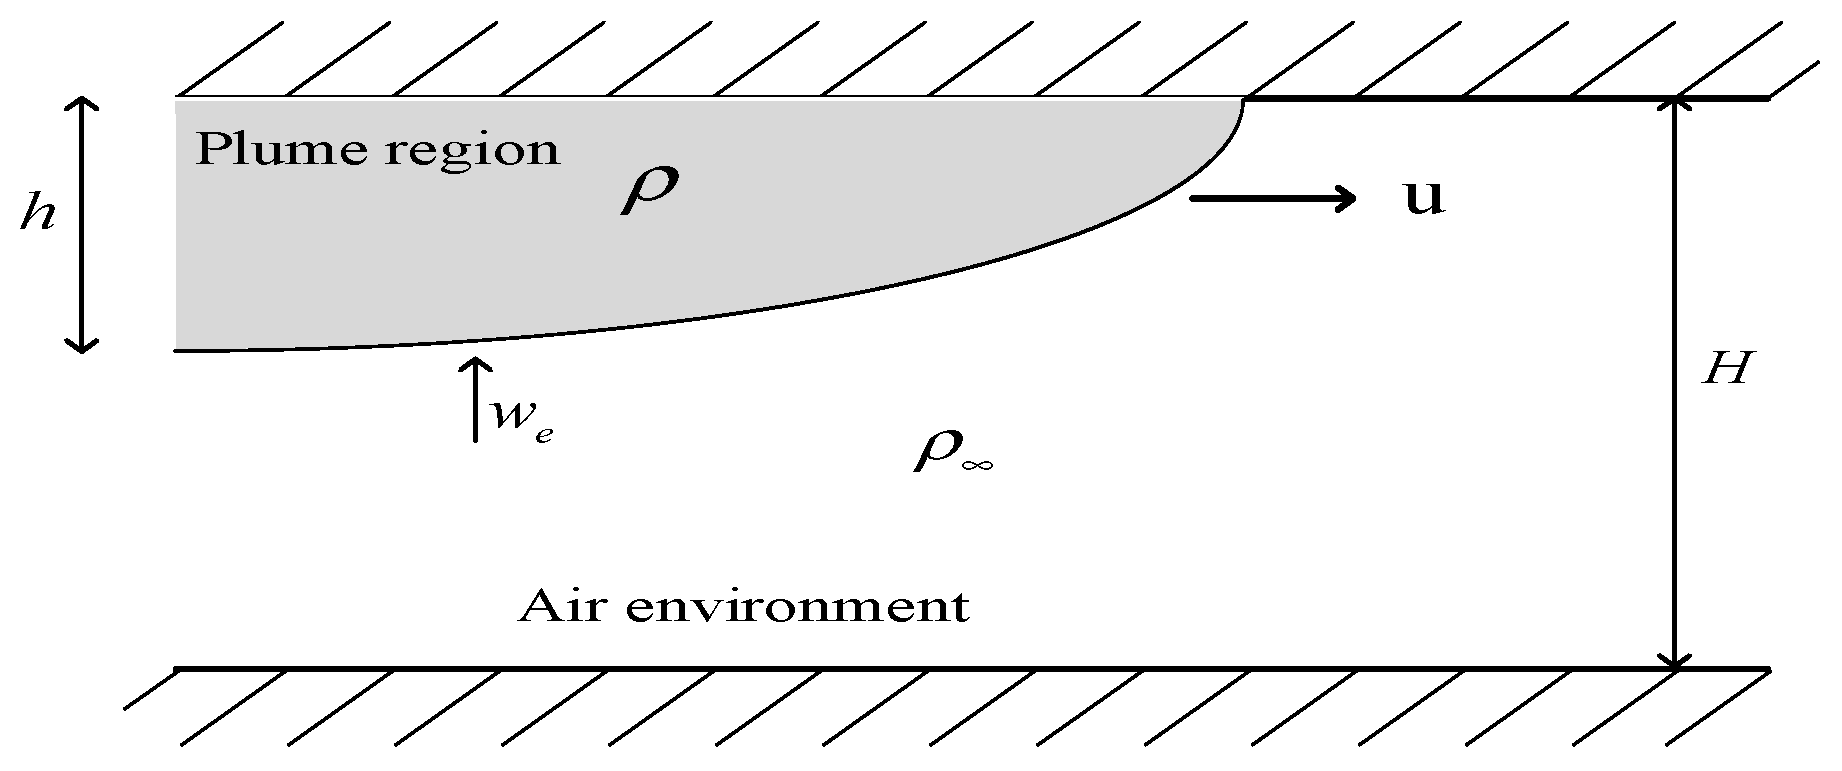
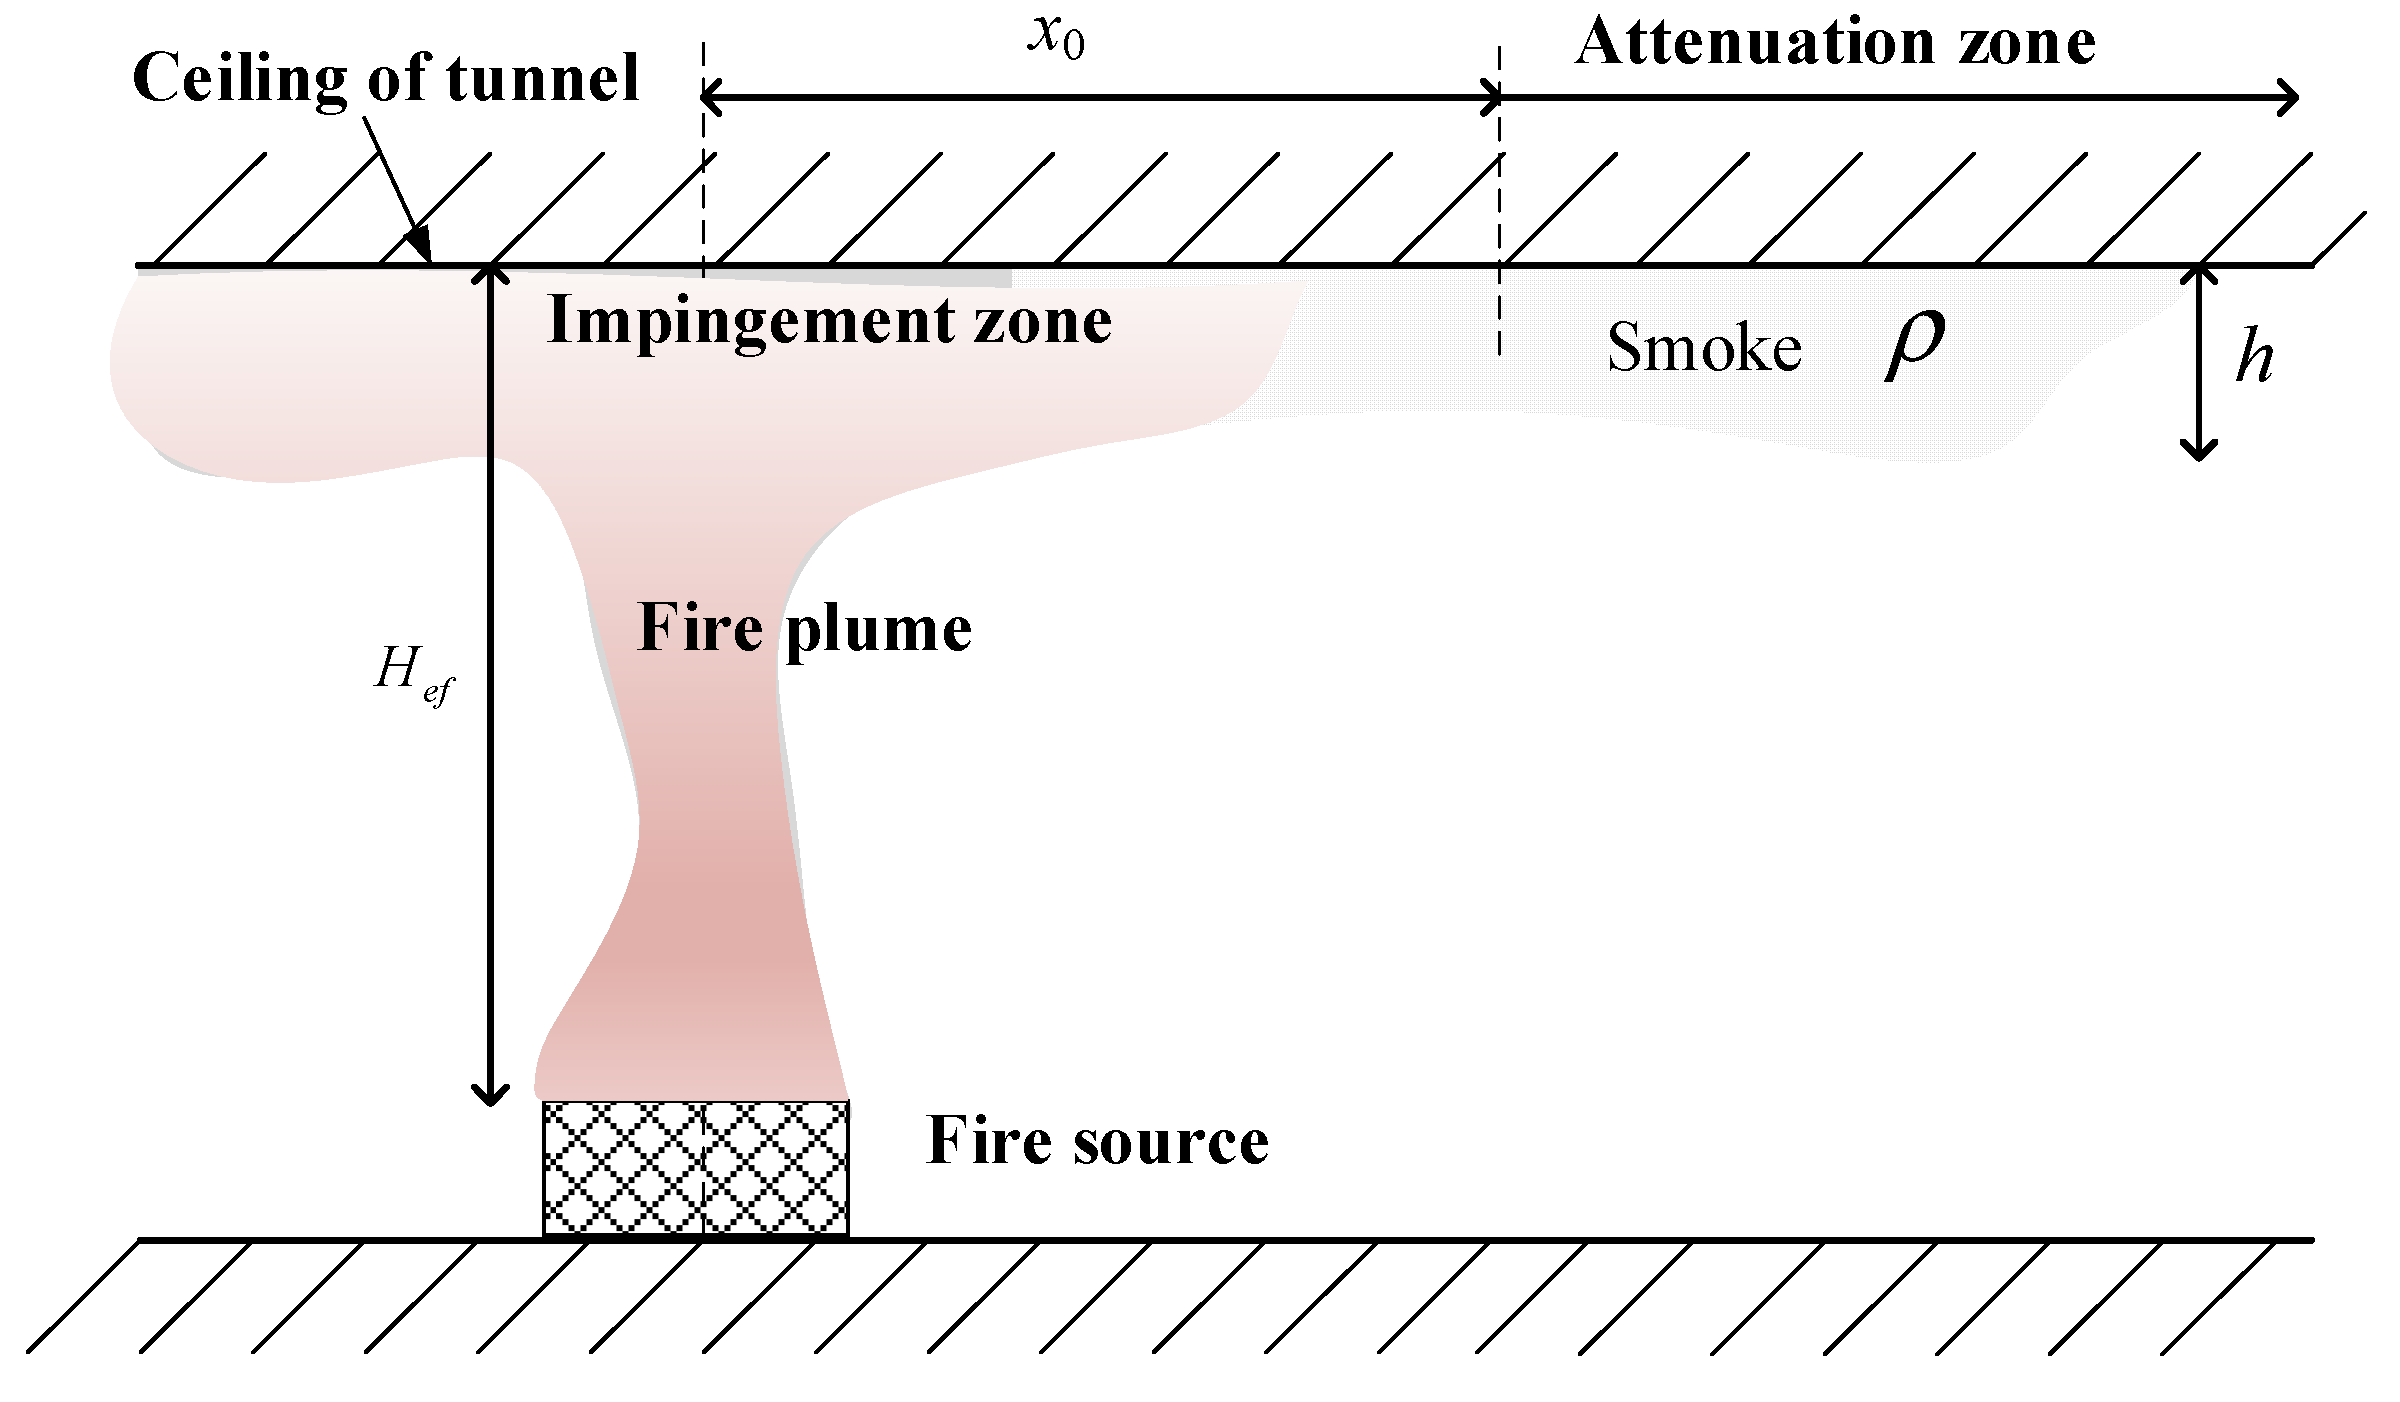
Figure 1 shows a schematic view of the longitudinal temperature attenuation of one-dimensional smoke motion in a utility tunnel. The spreading front of the smoke is selected as the control volume.

Figure 1.
Schematic view of longitudinal temperature attenuation of one-dimensional smoke flow in a utility tunnel.
The basic controlling equations of mass and energy conservation for the smoke movement are established, in which the terms of smoke entrainment and radiation heat loss are considered. The longitudinal temperature decay of smoke follows the exponential correlation function [10,18]:
where the coefficient is , α is the coefficient of thermal transfer, incorporating the convection and radiation heat transmission coefficient, D is the sectional perimeter of smoke flow that is in contact with the tunnel wall, D = B + 2h, B is the width of the tunnel, B = 50 cm, h is the thickness of the smoke layer, is the specific heat capacity and is the mass flow rate of smoke discharge, .
This leads to the following:
where u is the spreading velocity of smoke, is the convection heat transfer coefficient and is the radiation heat transfer coefficient.
The relationship of and is as follows [19]:
where is the emissivity, generally taken as 0.7 [20].
The non-dimensional heat-transfer coefficient, the Stanton number, is defined as follows [21]:
Therefore, the one-dimensional longitudinal temperature decay formula of smoke is obtained:
where is the temperature rising vertically above the fire source, and is the actual longitudinal temperature of smoke away the impingement point. The ambient temperature was determined as T0 = 16 °C.
The diffusion of smoke along the ceiling of the tunnel is described by the shallow-layer equation [9], in which the air entrainment, friction with the ceiling and heat dissipation to the ceiling are considered. Then, the continuity equation and momentum equation are established.
The continuity equation is as follows:
The momentum equation is as follows:
where is the air entrainment rate, . In general, the coefficient is = 0.00015 [9]. On the right side of Equation (7), the first term, , is the radial pressure gradient caused by the change in the gravitational potential energy of the hot smoke; the second term, , is the resistance exerted by the tunnel wall, = 0.0065 [9].
The left side of Equation (7) leads to . The term is replaced by the continuous equation, and the differential term is expanded to . Then, it yields the following:
In accordance with the ideal gas state equation [22], and , Equation (8) is written as follows:
Equation (9) is the differential equation of the spreading velocity of the smoke front. u, with respect to the spreading distance, x. Apparently, the spreading velocity of smoke is closely related to the attenuation rate of longitudinal temperature, , which is in accordance with He’s theory [13]. Therefore, after introducing the longitudinal temperature attenuation formula of Equation (5) into Equation (9), the velocity of smoke movement is obtained using the finite difference method.
3. Experimental Setup
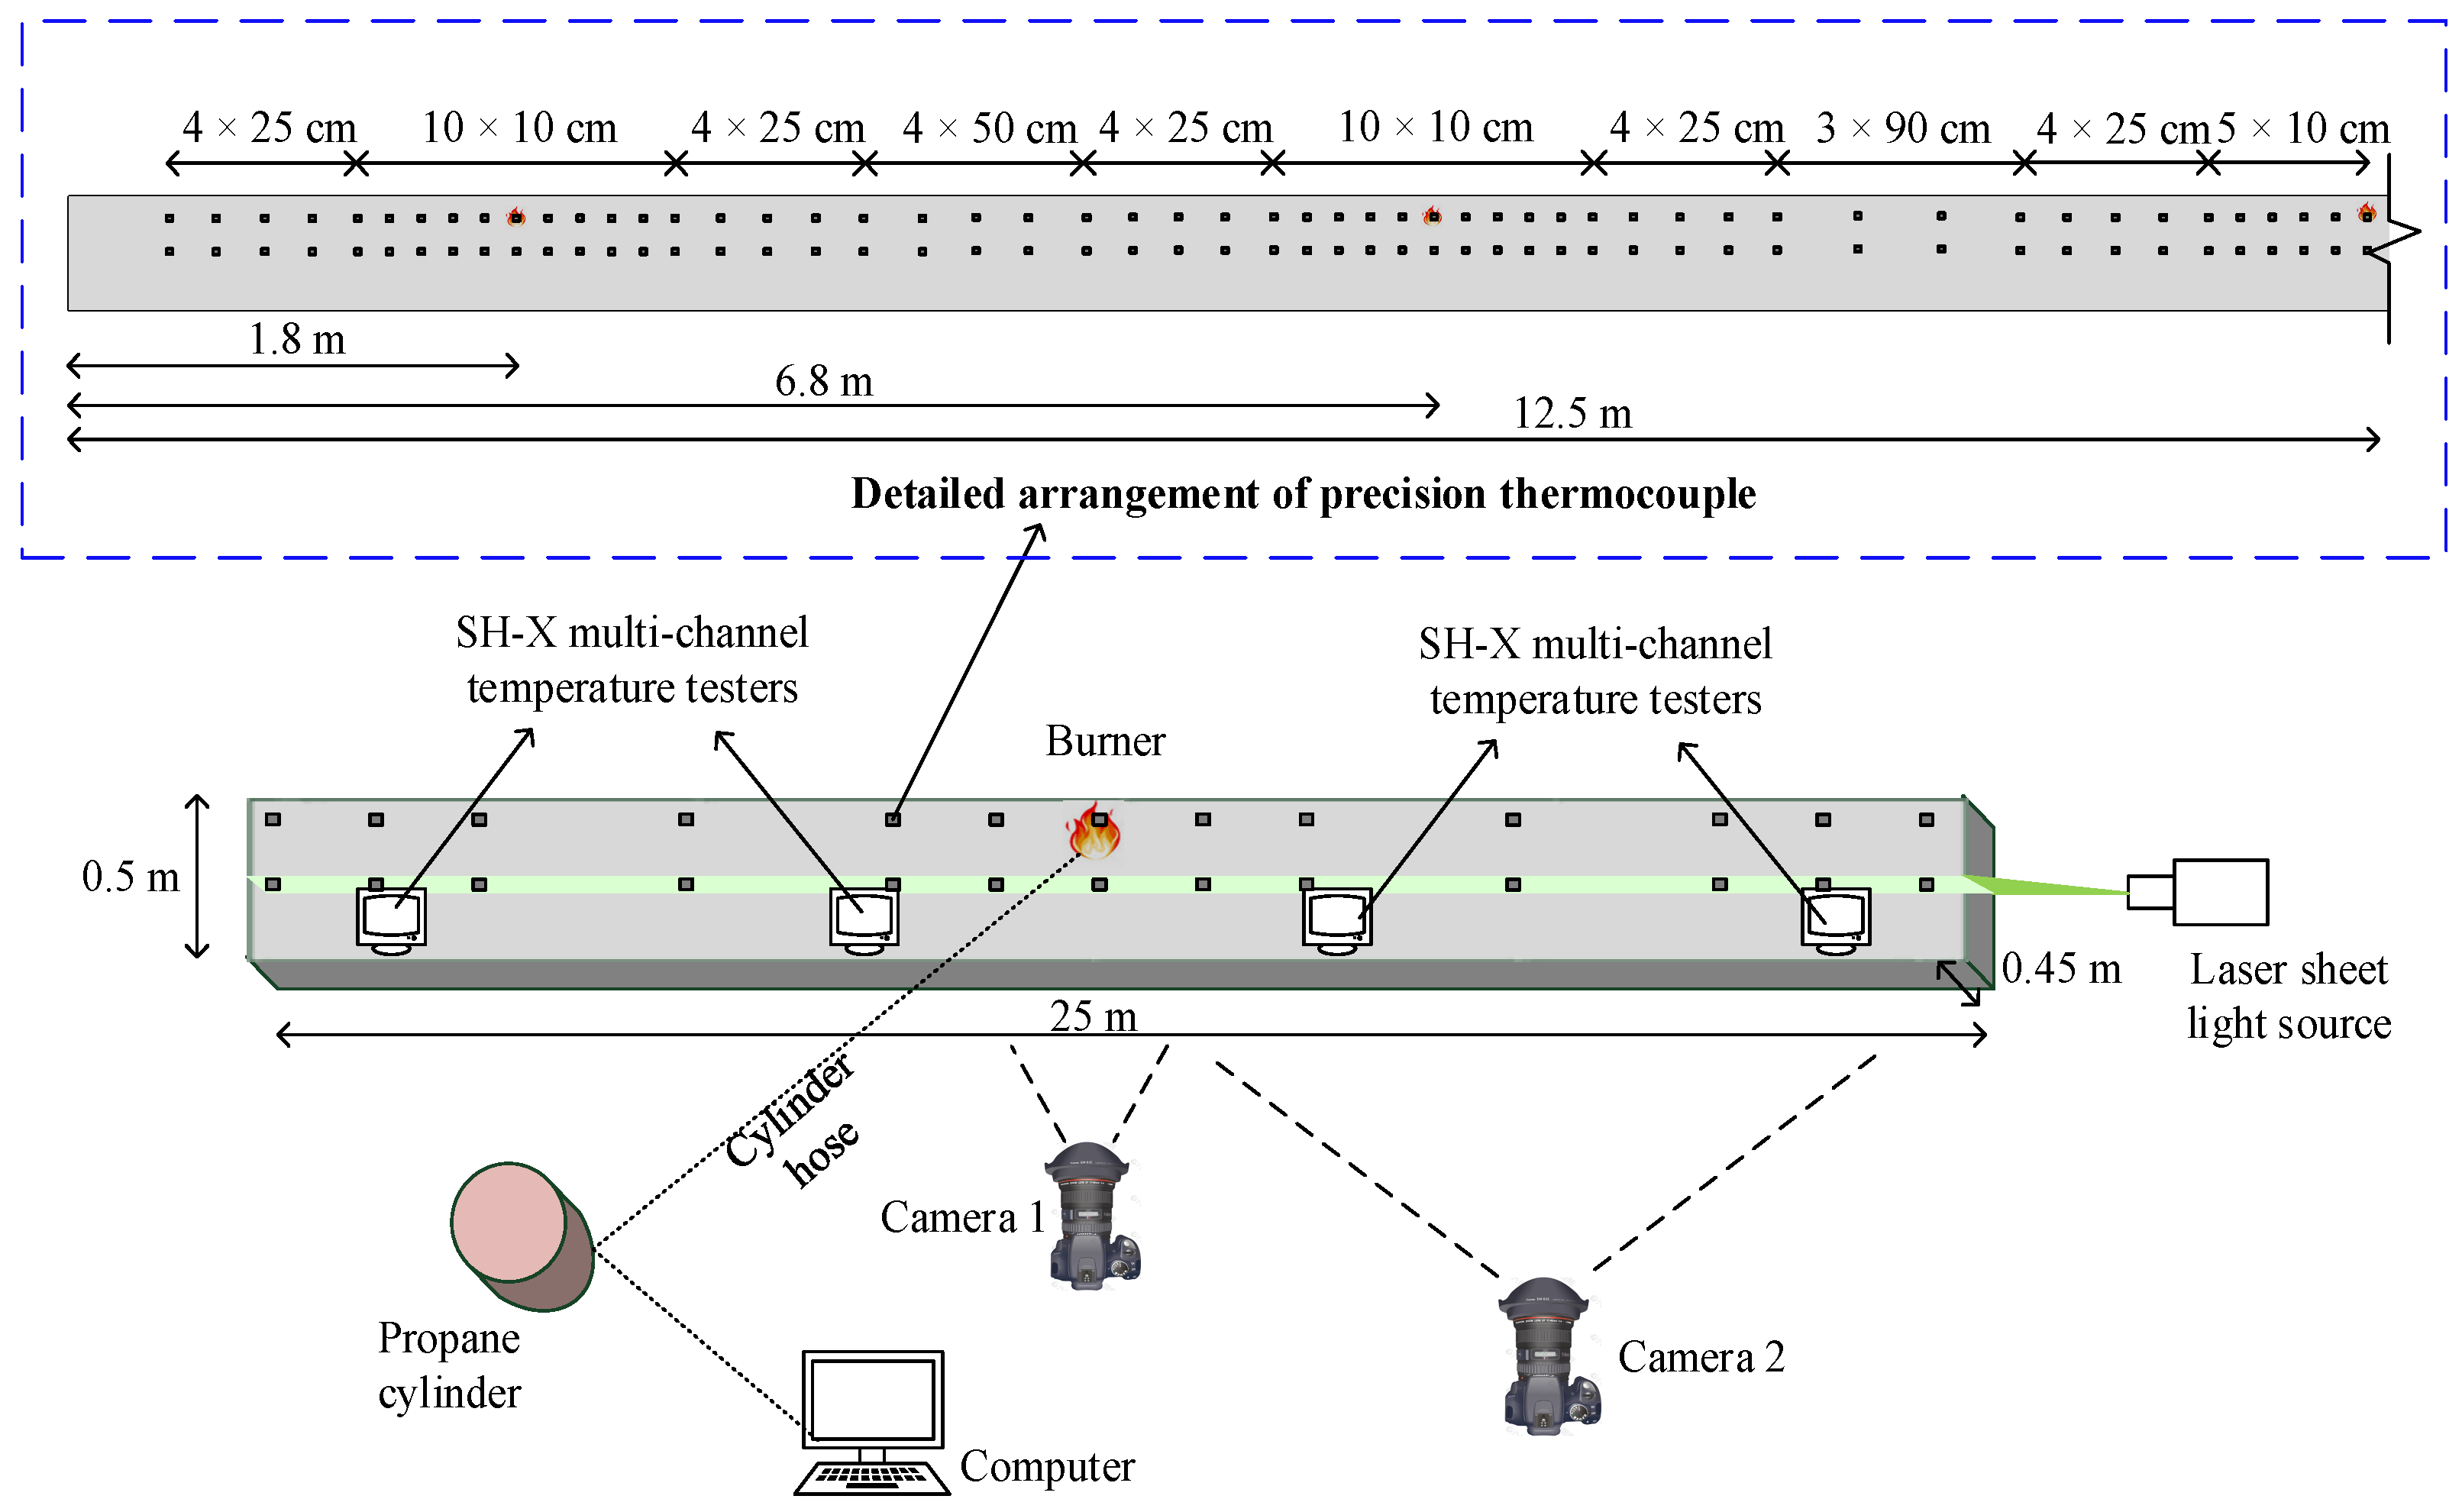
As shown in Figure 2, a 1/8-scaled urban utility tunnel was used for tests. The length of one individual fire prevention zone was L = 200 m, so the length of the scaled urban utility tunnel was 25 m. The box culvert structure was used to build the scaled urban utility tunnel. Each length of the individual segment was 2.5 m, and 10 segments were used. The cross-section size of the scaled urban utility tunnel was width × height = 0.5 m × 0.45 m. The top, bottom, back and both ends of the tunnel were made of fireproof board, and the fireproof-glass watching window was installed at the front of the tunnel. A fan was installed at each extreme end of the tunnel to facilitate the rapid delivery of fire smoke. The fireproof glass of each section of the box culvert structure was equipped with an available switchgear, which was convenient for the installation of the measuring instrument and for cleaning the internal wall of the tunnel. The heat release rate (HRR) of the fire source was precisely controlled using a propane burner measuring a size of 0.1 m × 0.1 m × 0.1 m. The HRR of the fire source was controlled using a gas turbine flow meter. A similar method of simulating a fire source was employed by previous researchers [23,24,25]. Propane gas fuel was ignited with an electric spark igniter, and then, the front window was closed immediately after ignition.

Figure 2.
Experimental setup.
The temperature of smoke gas was measured using the K-type thermocouple. The thermocouple wire diameter was 1 mm, and the temperature measurement range was 0–800 °C. The temperature data were collected using the SH-X multi-channel data logger. A data logger had 8 groups of channels, and 1 channel could connect 8 thermocouples; thus, in total, 4 data loggers were used. Figure 2 shows the arrangement of the thermocouple in the 12.5 m long half of the utility tunnel; the other half mirrored it. The thermocouple was arranged orderly along the longitudinal and lateral direction of the utility tunnel. Ten thermocouples were arranged near the fire source with an interval distance of 10 cm. In the remaining space away from the fire source, dozens of thermocouples were arranged with an interval distances of 25, 50 and 90 cm. A close-range camera was arranged near the fire source to capture the flame behavior, and another long-range camera was arranged on the side of the fireproof glass observation area to record the fire smoke movement. The smoke layer was irradiated using a laser sheet light source (power 200 mW), so the flow configuration and stratification of smoke were observed. The type of the laser sheet light source was MGL-F-532-2W with a working wavelength of 532 nm (green light). It adopted the DPSS technology and had the TEM00 mode laser. Its output range was 1500–2500 mW, and the one used in this experiment could reach 2000 mW.
Since the cables in the utility tunnel were protected by the fireproof layer, flame spreading across the cable was difficult to maintain. Meanwhile, the burning of the cable was not easy to sustain due to the melting and dripping of thermoplastic materials, so it was assumed that the longest length of the burning cable was 5 m in a full-size utility tunnel. The diameter of the 110 kV cable was 8 cm, and the burning area of an individual 5 m long cable was 1.256 m2. In general, the combustion heat of the cable was 265 kW/m2. Considering that 12 cables were arranged on the covered bridge, the HRR of a full-size cable fire was 3.9 MW. The relationship of the heat release rate of the fire source and the scaled tunnel model followed the Froude model [12,26]. The similarity of scaled fire and full-scale fire was , TM = TF, where the subscripts ‘M’ and ‘F’ were labeled as the parameters of the scaled model and the full scale, respectively. The temperature evolution and movement of fire smoke were related to the HRR of the fire source. Thus, five HRRs, = 5, 10, 15, 20, and 25 kW, were designed for five sources. The HRR was controlled using the turbine flowmeter. The relationship of the HRR (kW) to the flow rate of propane Q (L/min) was , where is the combustion heat of propane (kJ/kg), is the density and is the combustion efficiency. When the ventilation was sufficient, the liquid fire had the same combustion efficiency in the confined tunnel and in the open space [27,28]. This work focused on the one-dimensional spread process of smoke, in which there was no difference in the combustion efficiency of propane between the urban utility tunnel fire and the open-space fire. Consequently, the HRR of the fire source was easily controlled. The combustible cables in the power cable cabin of the urban utility tunnel were distributed near the sidewall of the utility tunnel, so the gas burner was set close to the sidewall of the utility tunnel. Meanwhile, the fire source was set at different longitudinal (x = 1.8, 6.8 and 12.5 m) and vertical positions (z = 0.1 and 0.2 m) inside the utility tunnel. In the real utility tunnel, several layers of cables were placed on the bracket. The cable was not located on the ground, but at a certain height from the ground. The cables were uniformly distributed along the vertical direction of the tunnel. The scale ratio of the utility tunnel was 1:8, and the maximal height was 0.45 m. Thus, two kinds of vertical heights of 0.1 and 0.2 m were designed for experiments. The specific experimental runs are shown in Table 1. All cases were repeated to attain a reliable result. According to the rule of error propagation [29], the error could be expressed as follows: , where is a function of x. Similarly, it attained . Therefore, the error of the theoretical model, , was calculated as follows: .

Table 1.
Experimental conditions.
4. Results and Discussion
4.1. Smoke Movement Configuration
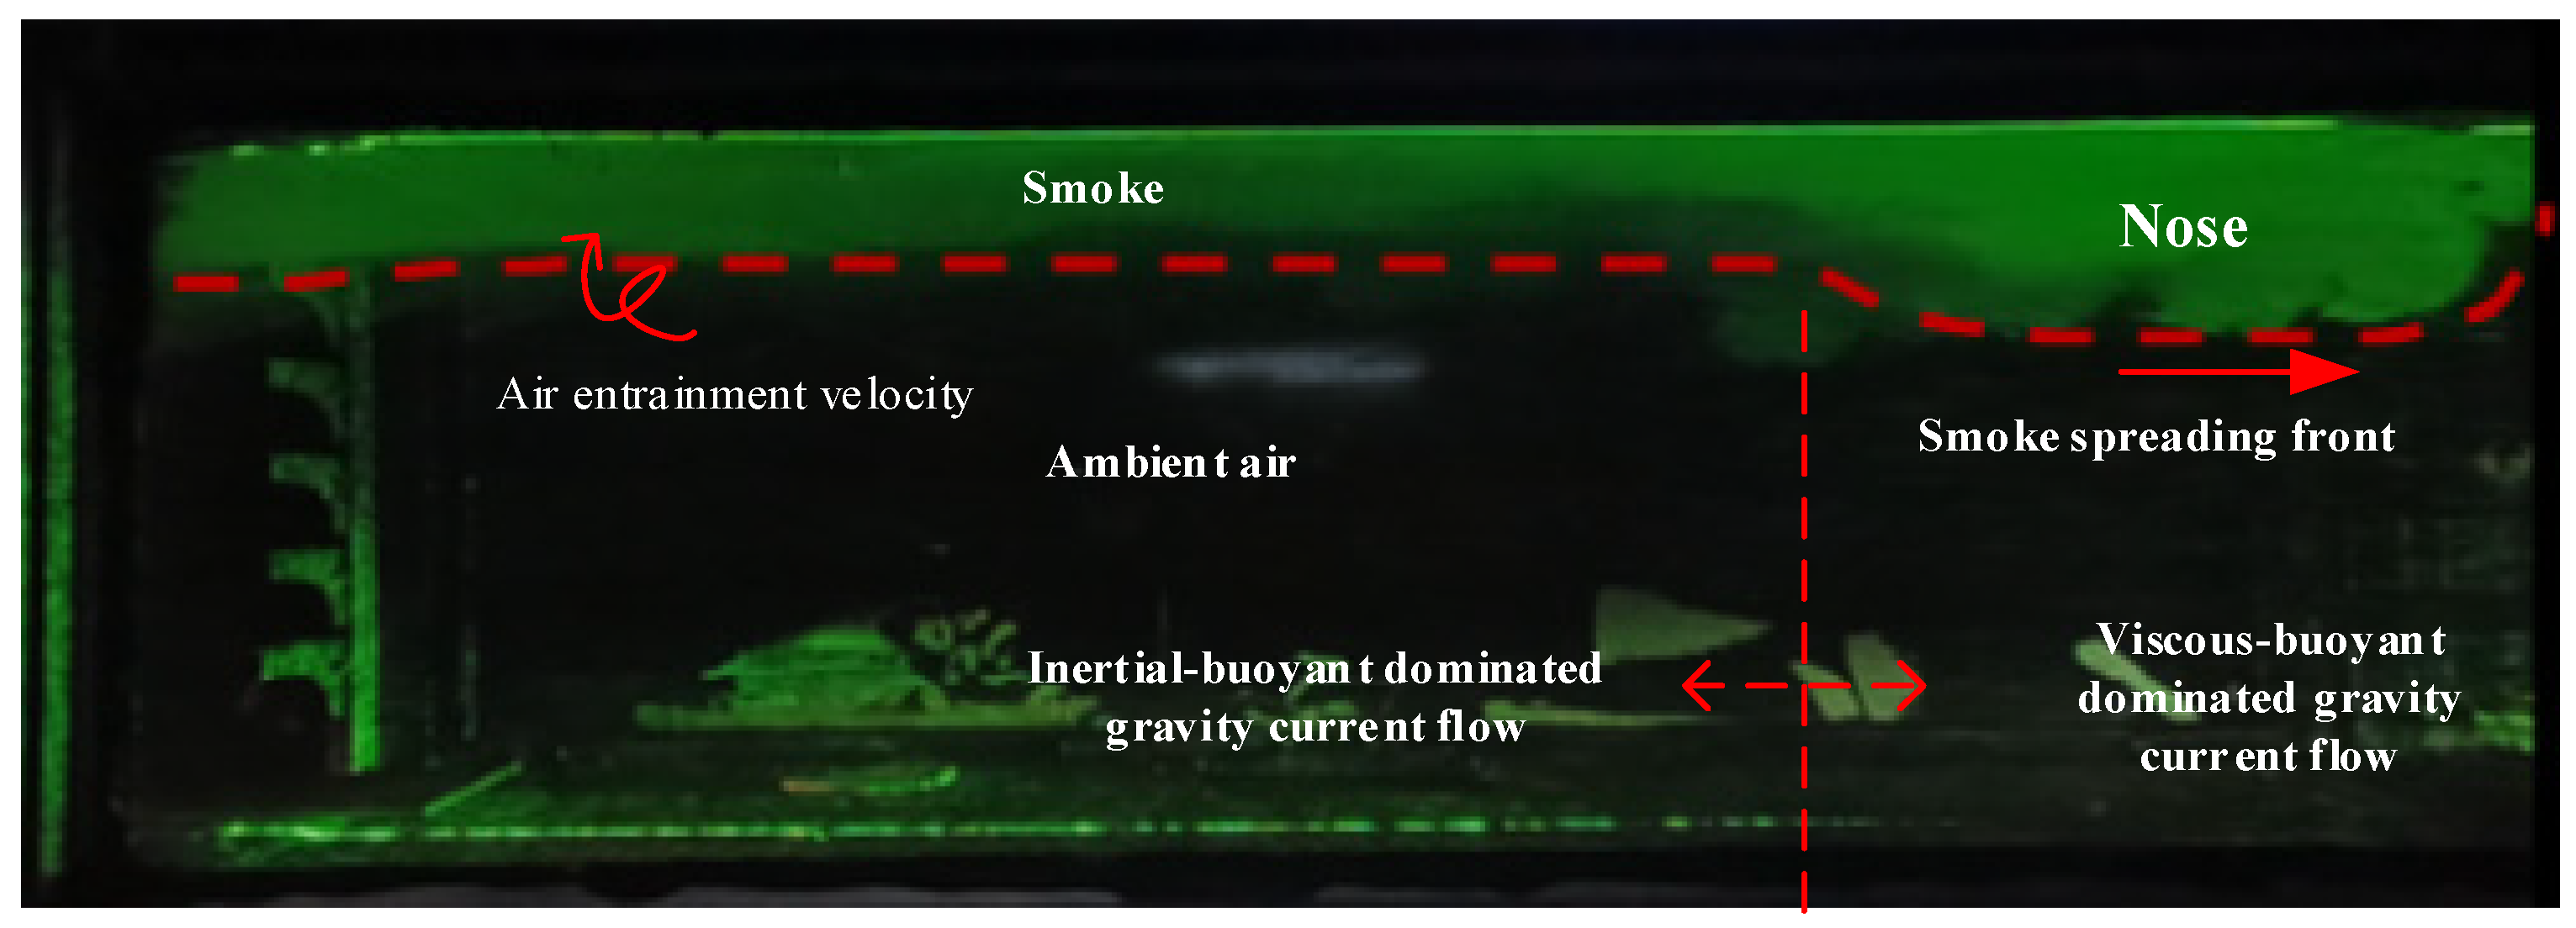
As shown in Figure 3, a nose-shaped smoke front was formed. This is because the smoke movement of tunnel fire belongs to the natural flow driven by thermal buoyancy, that is, the gravity current [30]. As the hot smoke gas spreads forward, the buoyancy becomes weak due to the heat loss in the front of the hot smoke. Thus, the effect of the viscous force increases. As time elapses, the spreading velocity of the smoke flow front is less than that of the main part of the gravity flow. The previous study proved that the velocity of the main part of the gravity flow is 1.3 times of that of the smoke flow front [30]. This indicates that the spread of hot smoke undergoes the inertia–buoyancy stage and the viscosity–buoyancy stage, accompanied by a change in smoke layer thickness [31]. In the viscosity–buoyancy stage, the smoke layer thickness is increased by the gravity flow, and an increasing pressure head is formed to overcome ceiling wall resistance.
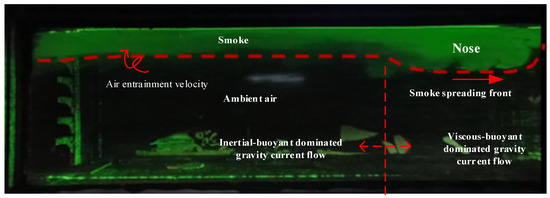
Figure 3.
Nose-shaped smoke front.
4.2. Initial Position of One-Dimensional Horizontal Spreading of Smoke
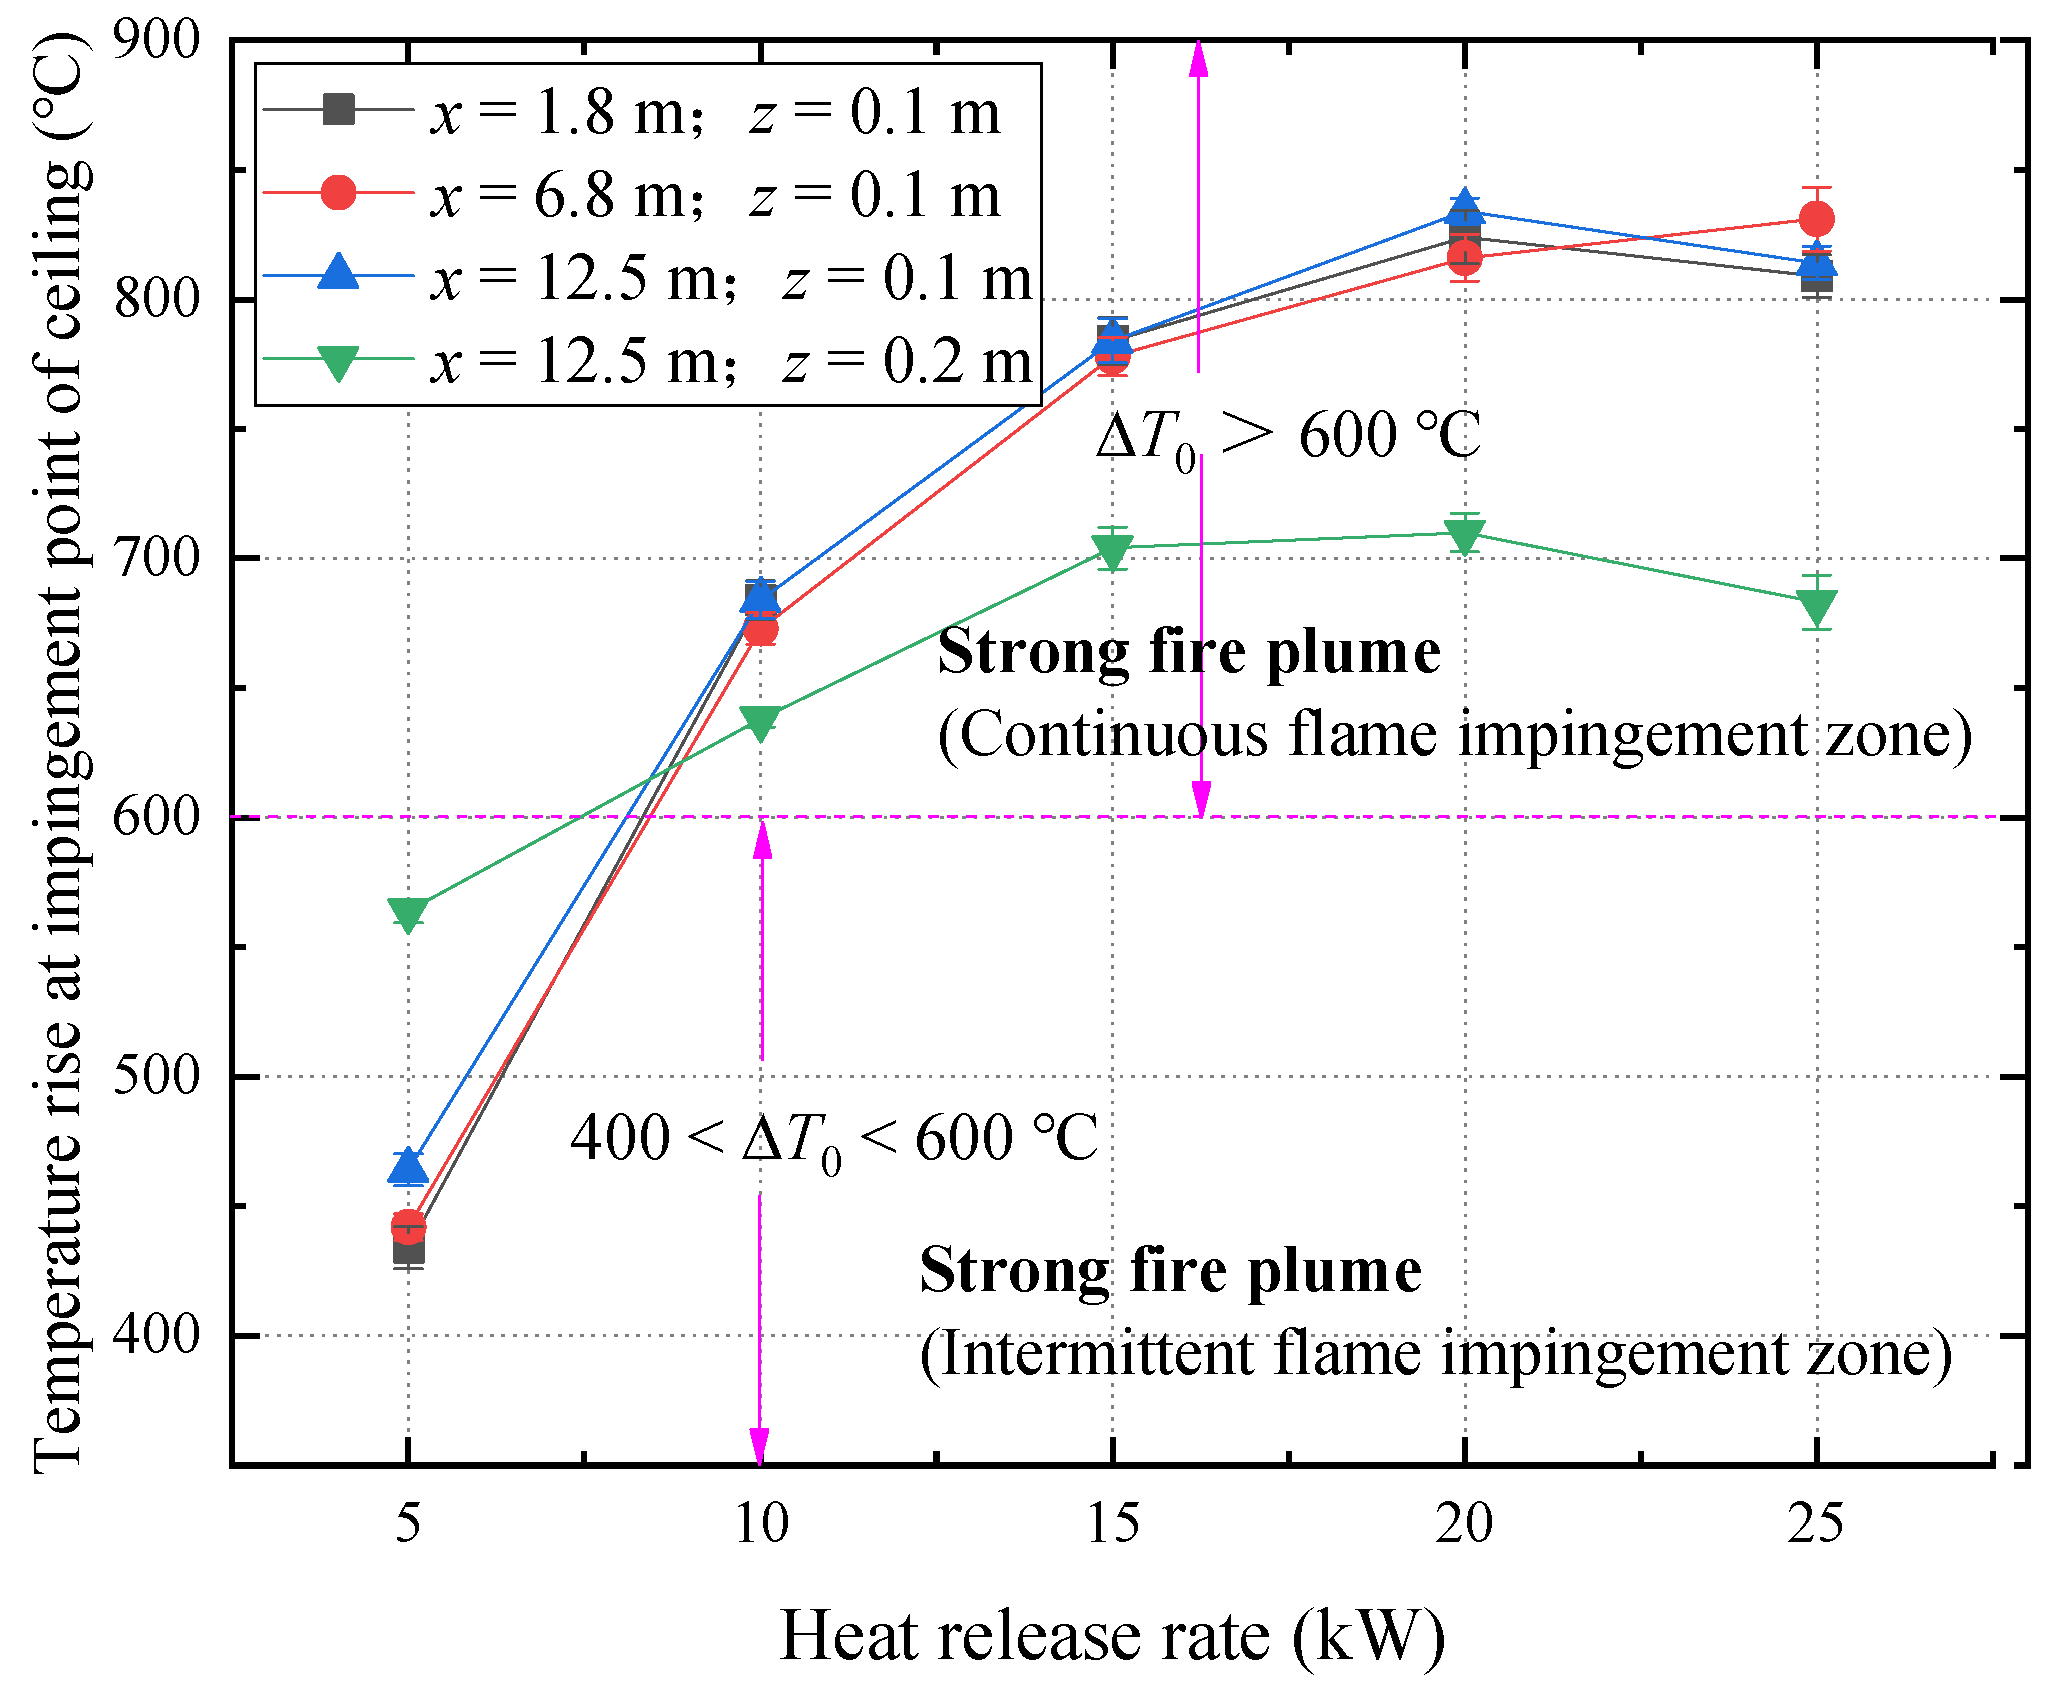
For the vertical plume in a tunnel, there are two critical temperature rises in analyzing the fire plume impingement behavior: ΔT0 = 400 K and ΔT0 = 600 K. For the temperature rise in the plume at the impingement point, namely ΔT0 < 400 K, 400 K < ΔT0 < 600 K and ΔT0 > 600 K, the corresponding fire plume is the buoyant plume zone, the intermittent flame zone and the continuous flame zone, respectively [8]. The buoyant plume belongs to the weak plume, while the intermittent and continuous plume belong to the strong plume [32].
Figure 4 shows the temperature rise at the position where the flame collides with the ceiling of the utility tunnel. Note that all temperature rises are larger than 400 K, so the fire plume belongs to the strong plume. The longitudinal smoke spreading along the ceiling of the utility tunnel is regarded as a one-dimensional flow state [11]. The smoke flow field is grouped into an impingement zone and attenuation zone [8], as shown in Figure 5. The intersection point of the two zones is the initial position of the one-dimensional smoke spreading.
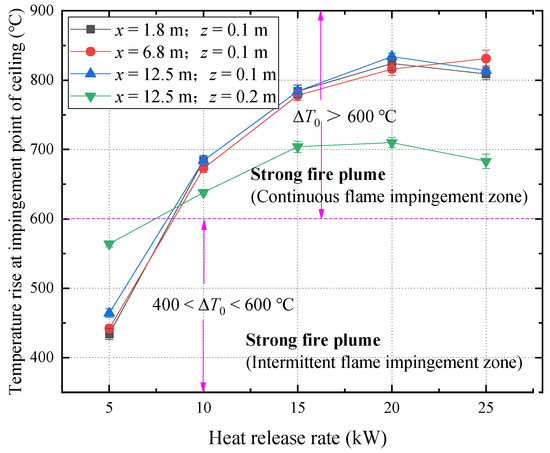
Figure 4.
Temperature rise at the fire plume impingement position of the ceiling.
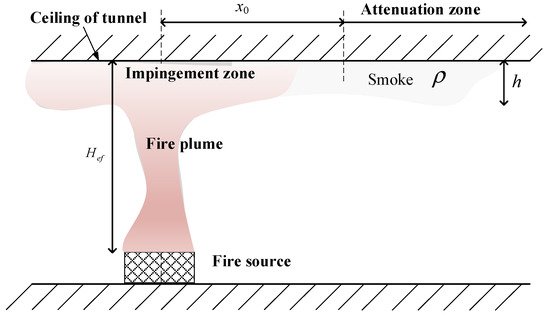
Figure 5.
Impingement zone and attenuation zone of strong plume ceiling jet.
At the initial position of the one-dimensional spreading of smoke, the temperature and spreading speed at the center line is very close to those near the sidewall of the tunnel [8,33,34]. Specifically, when the temperature difference at the center line and the sidewall of the tunnel is less than 5 °C, the two temperature distribution curves almost overlap [35]. Therefore, the temperature difference of 5 °C is chosen as the critical criterion of the initial position of the one-dimensional horizontal smoke spreading.
The distance from the center of fire source to initial position of one-dimensional horizontal smoke spreading is labeled as x0. Heskestad [6] used the radius of fire plume b at the height of the ceiling to characterize the strong plume phenomenon on the unrestricted ceiling. Gao et al. [8] verified that the initial position of the one-dimensional spreading of smoke was 1.7 times radius b at the height of the ceiling, x0 = 1.7b. Therefore, it is considered that the initial position of the one-dimensional smoke spreading, x0, is expressed by plume radius b [6]:
where is the plume temperature at the hitting point of the ceiling, is the difference between the temperature of the plume impingement point and the air temperature, and is the HRR, which is about 0.7–0.8 times that of the fire source, .
As predicted by Equation (10), the initial position of the one-dimensional spread of smoke is related to the specific heat capacity, , the ambient air density, , the ambient temperature, , the gravity acceleration, g, the HRR, , and the effective height when the flame hits the top . It yields the following:
The dimensional analysis method [15] is used to characterize the initial position of the one-dimensional spread of smoke, and , , g and h are chosen as the basic dimensions, so Equation (11) becomes the following:
The integration of the two dimensionless quantities on the right side of Equation (12) produces the following:
The dimensionless initial position of one-dimensional smoke spreading is defined as , and the modified dimensionless HRR is defined as . Figure 6 shows the correlation of the dimensionless initial position of one-dimensional smoke spread, , and the modified dimensionless HRR, . It is seen that there is a nearly linear relationship of with the modified dimensionless HRR, , in the double logarithmic coordinates. The fitting equation is as follows:
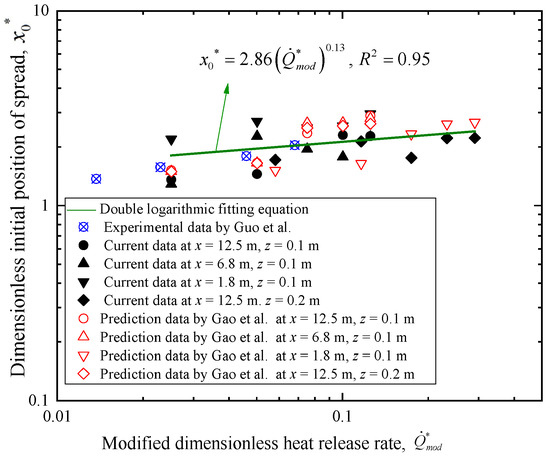
Figure 6.
Dimensionless fitting between the initial position of smoke spread and modified dimensionless HRR [8,34].
The initial position of one-dimensional smoke spreading in a full-size tunnel fire was investigated by Guo et al. [34] using Fire Dynamics Simulator (FDS) under different atmospheric pressures and fire source powers of 3, 5, 10 and 15 MW. Also, Gao et al. [8] proposed that the initial position of the one-dimensional horizontal smoke spread of the strong plume was 1.7 times the radius of the plume at the ceiling height. As shown in Figure 6, the proposed non-dimensional parameters collapse and correlate well with the numerical and experimental results of previous work.
4.3. New Proposed Formula of Longitudinal Temperature Rise of Smoke
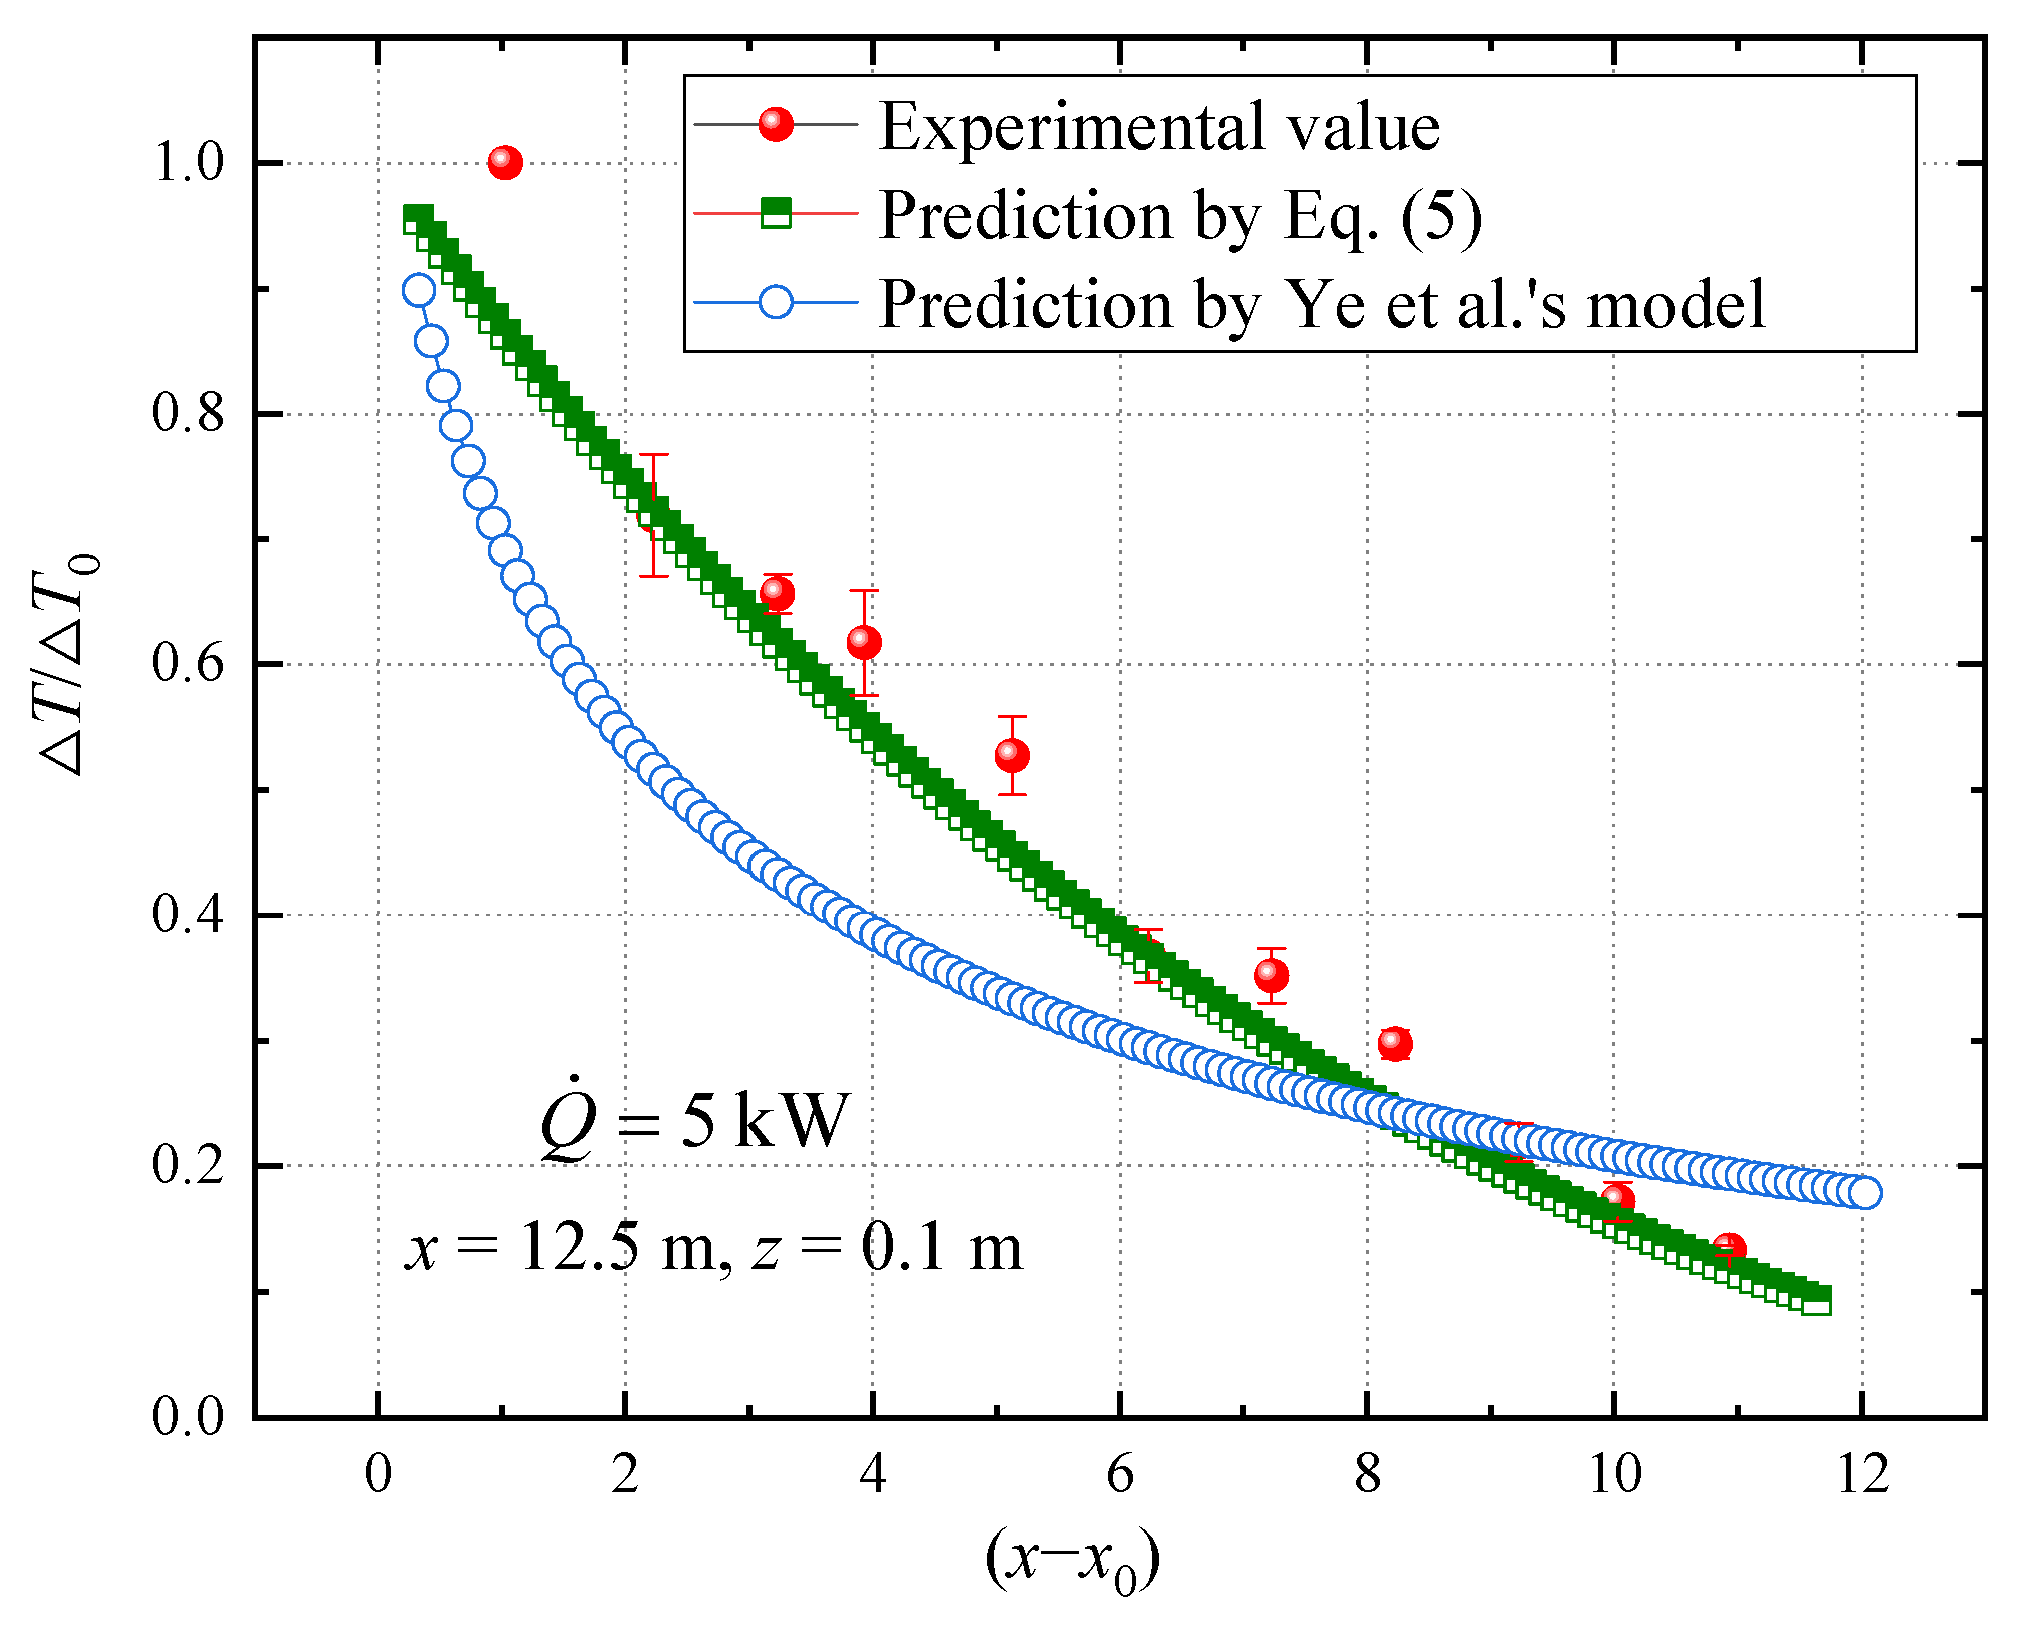
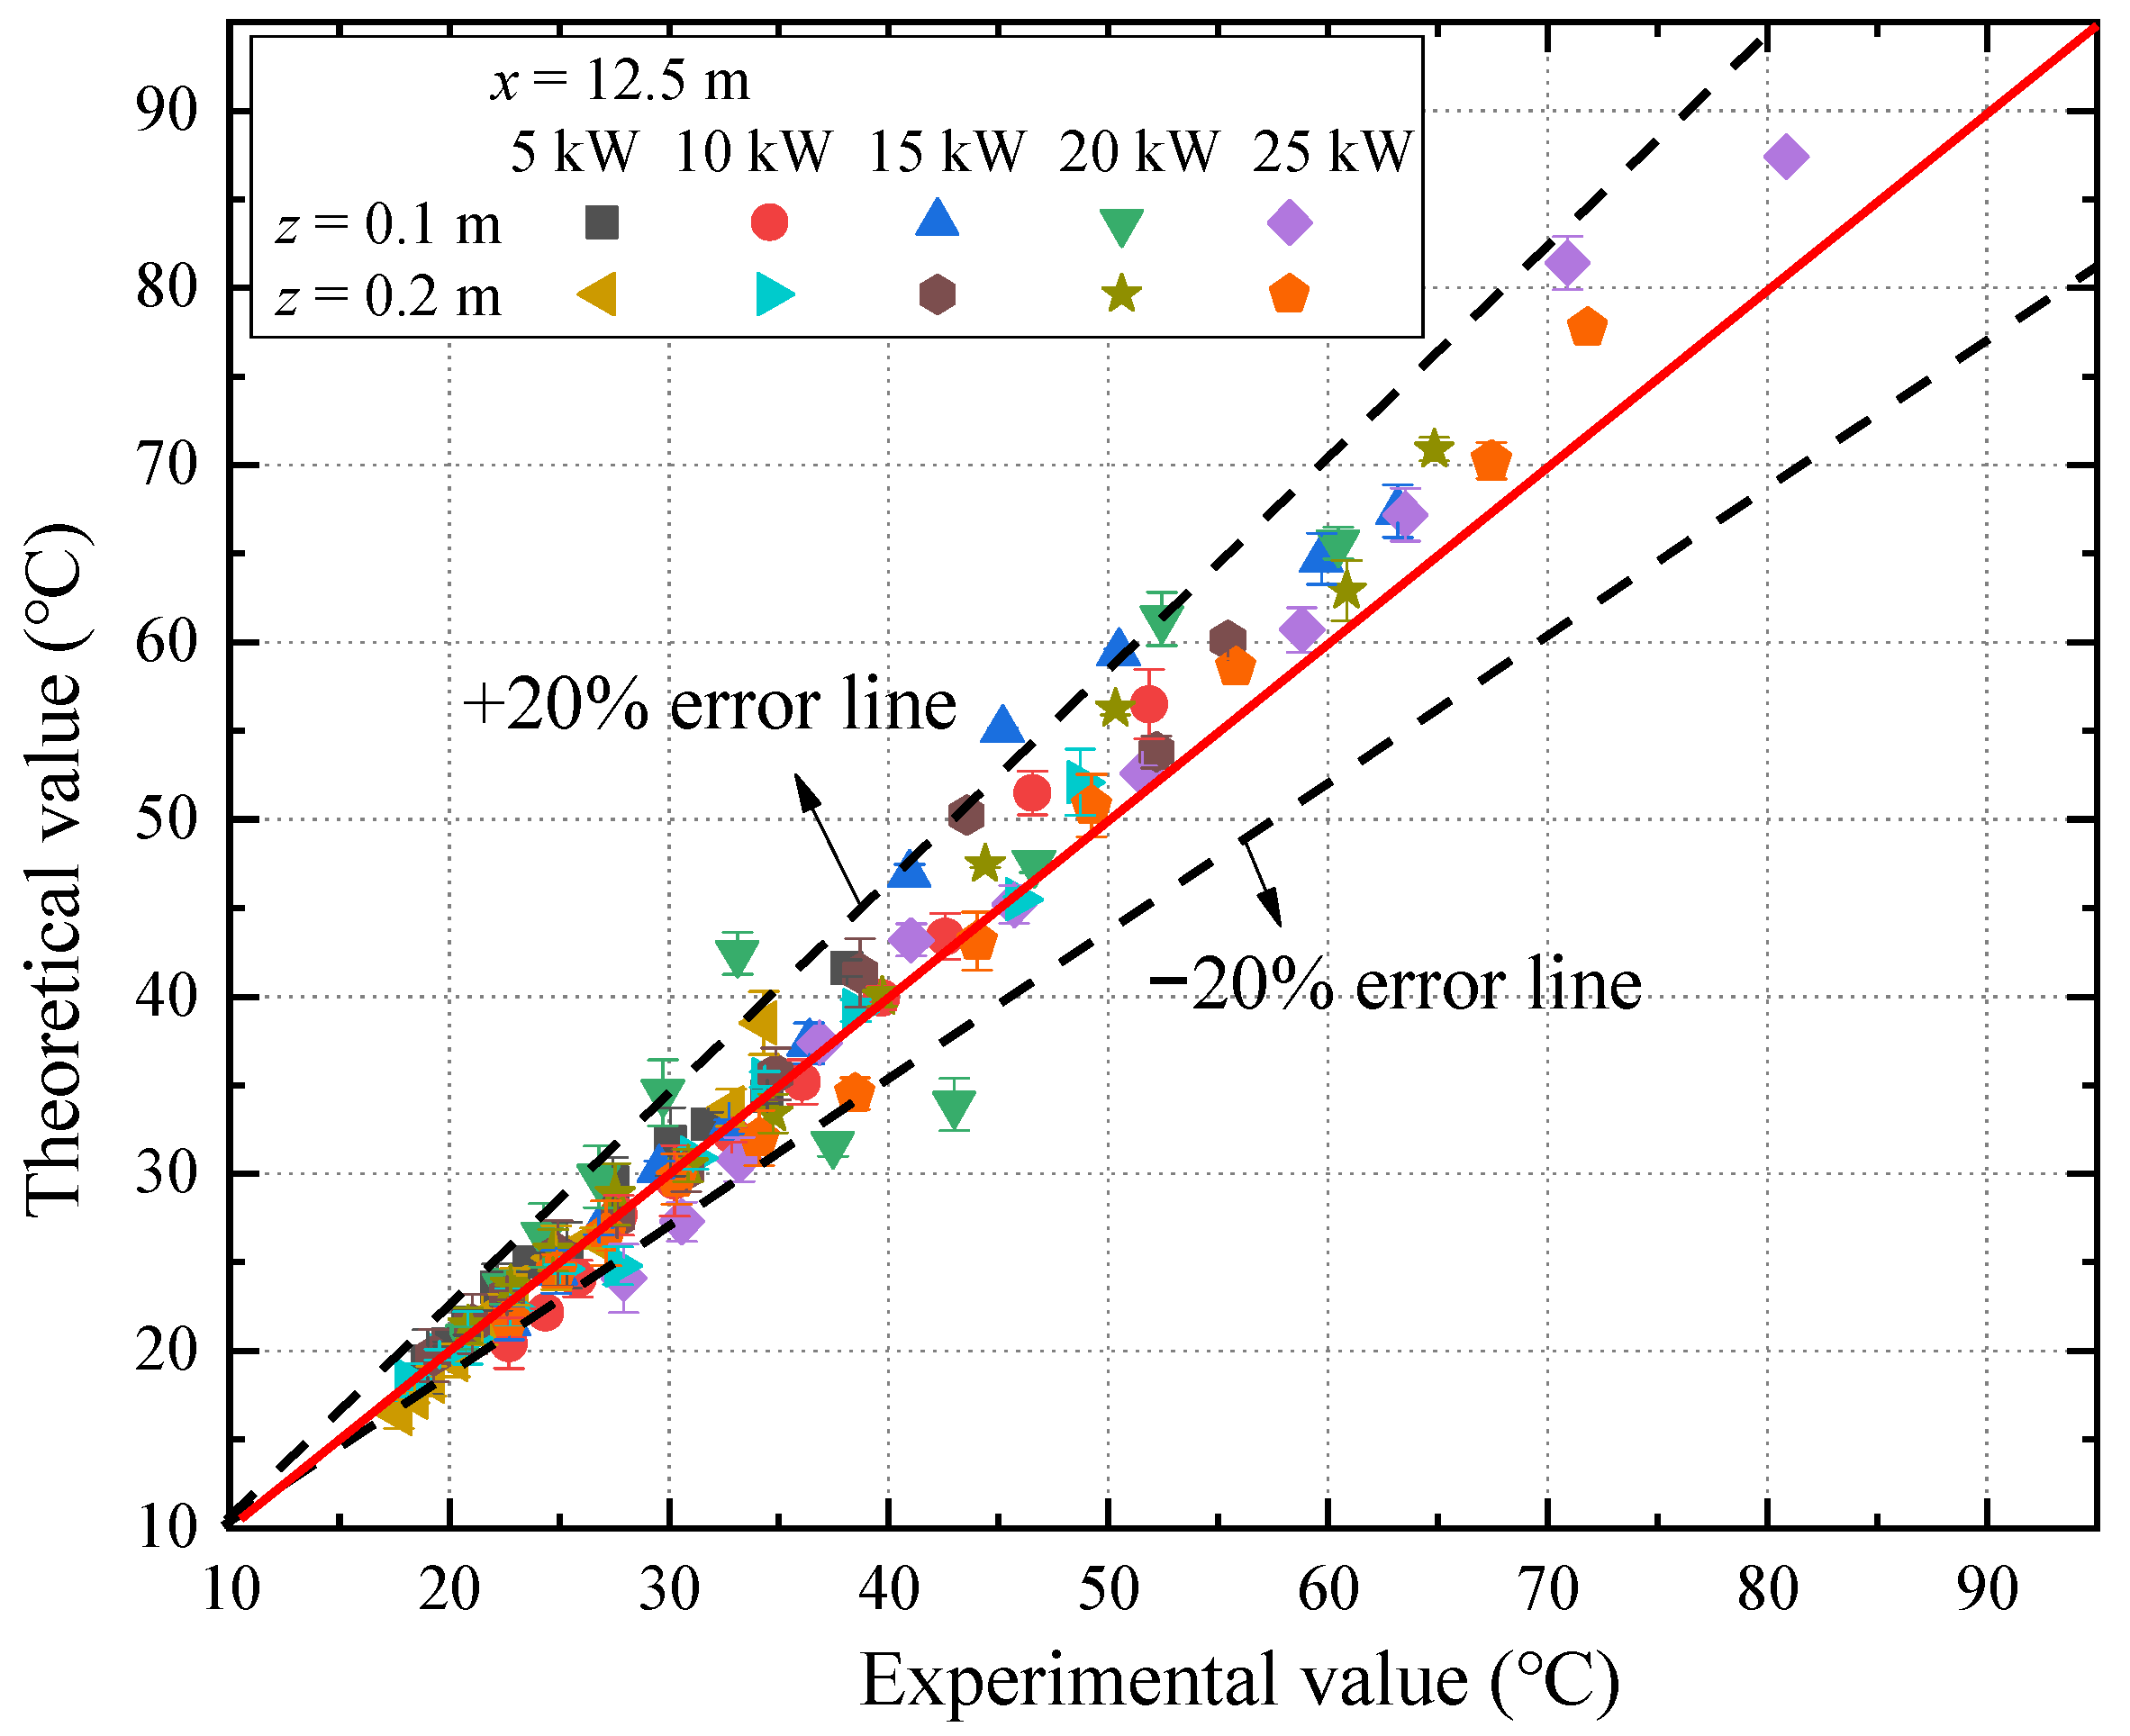
The longitudinal temperature rise of smoke, ΔT0, is attained by solving the transcendental equation, Equation (5), in accordance with the zero function [36]. At x = 12.5 m, z = 0.1 m and = 5 kW, Figure 7 shows the comparison of the measured data with the theoretical results of Equation (5) and Ye et al.’s model [11]. It was found that the currently proposed theoretical model formulated in Equation (5) is in better agreement with the experimental data. There are three possible reasons: first, the radiant heat loss is ignored in Ye et al.’s model [11], which leads to a large attenuation value of the temperature rise; second, the average thickness of the smoke layer is used to replace the thermal boundary thickness for calculation, so the systematic deviation caused by the fluctuation of the smoke layer’s thickness is avoided; third, the prediction of the longitudinal temperature rise of smoke depends on some characteristic parameters, and is determined based on the experimental condition. There are some deviations in these parameters between the current experiments and Ye et al.’s experiments [11]. Figure 8 shows the comparison of theoretical and experimental data on longitudinal temperature rise with two different positions (z = 0.1 and 0.2 m) and five different HRRs ( = 5, 10, 15, 20 and 25 kW) of the fire source. It was found that the theoretical values obtained via Equation (5) are in accordance with the experimental data.

Figure 7.
Dimensionless longitudinal temperature rise (ΔT/ΔT0) based on different models [11].
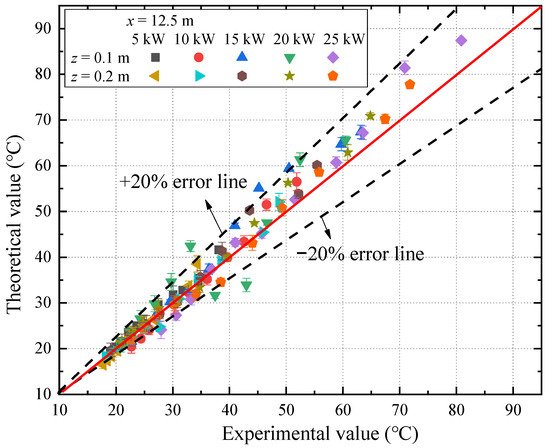
Figure 8.
Comparison of theoretical and experimental data of longitudinal temperature rise.
4.4. Spreading Velocity of Smoke
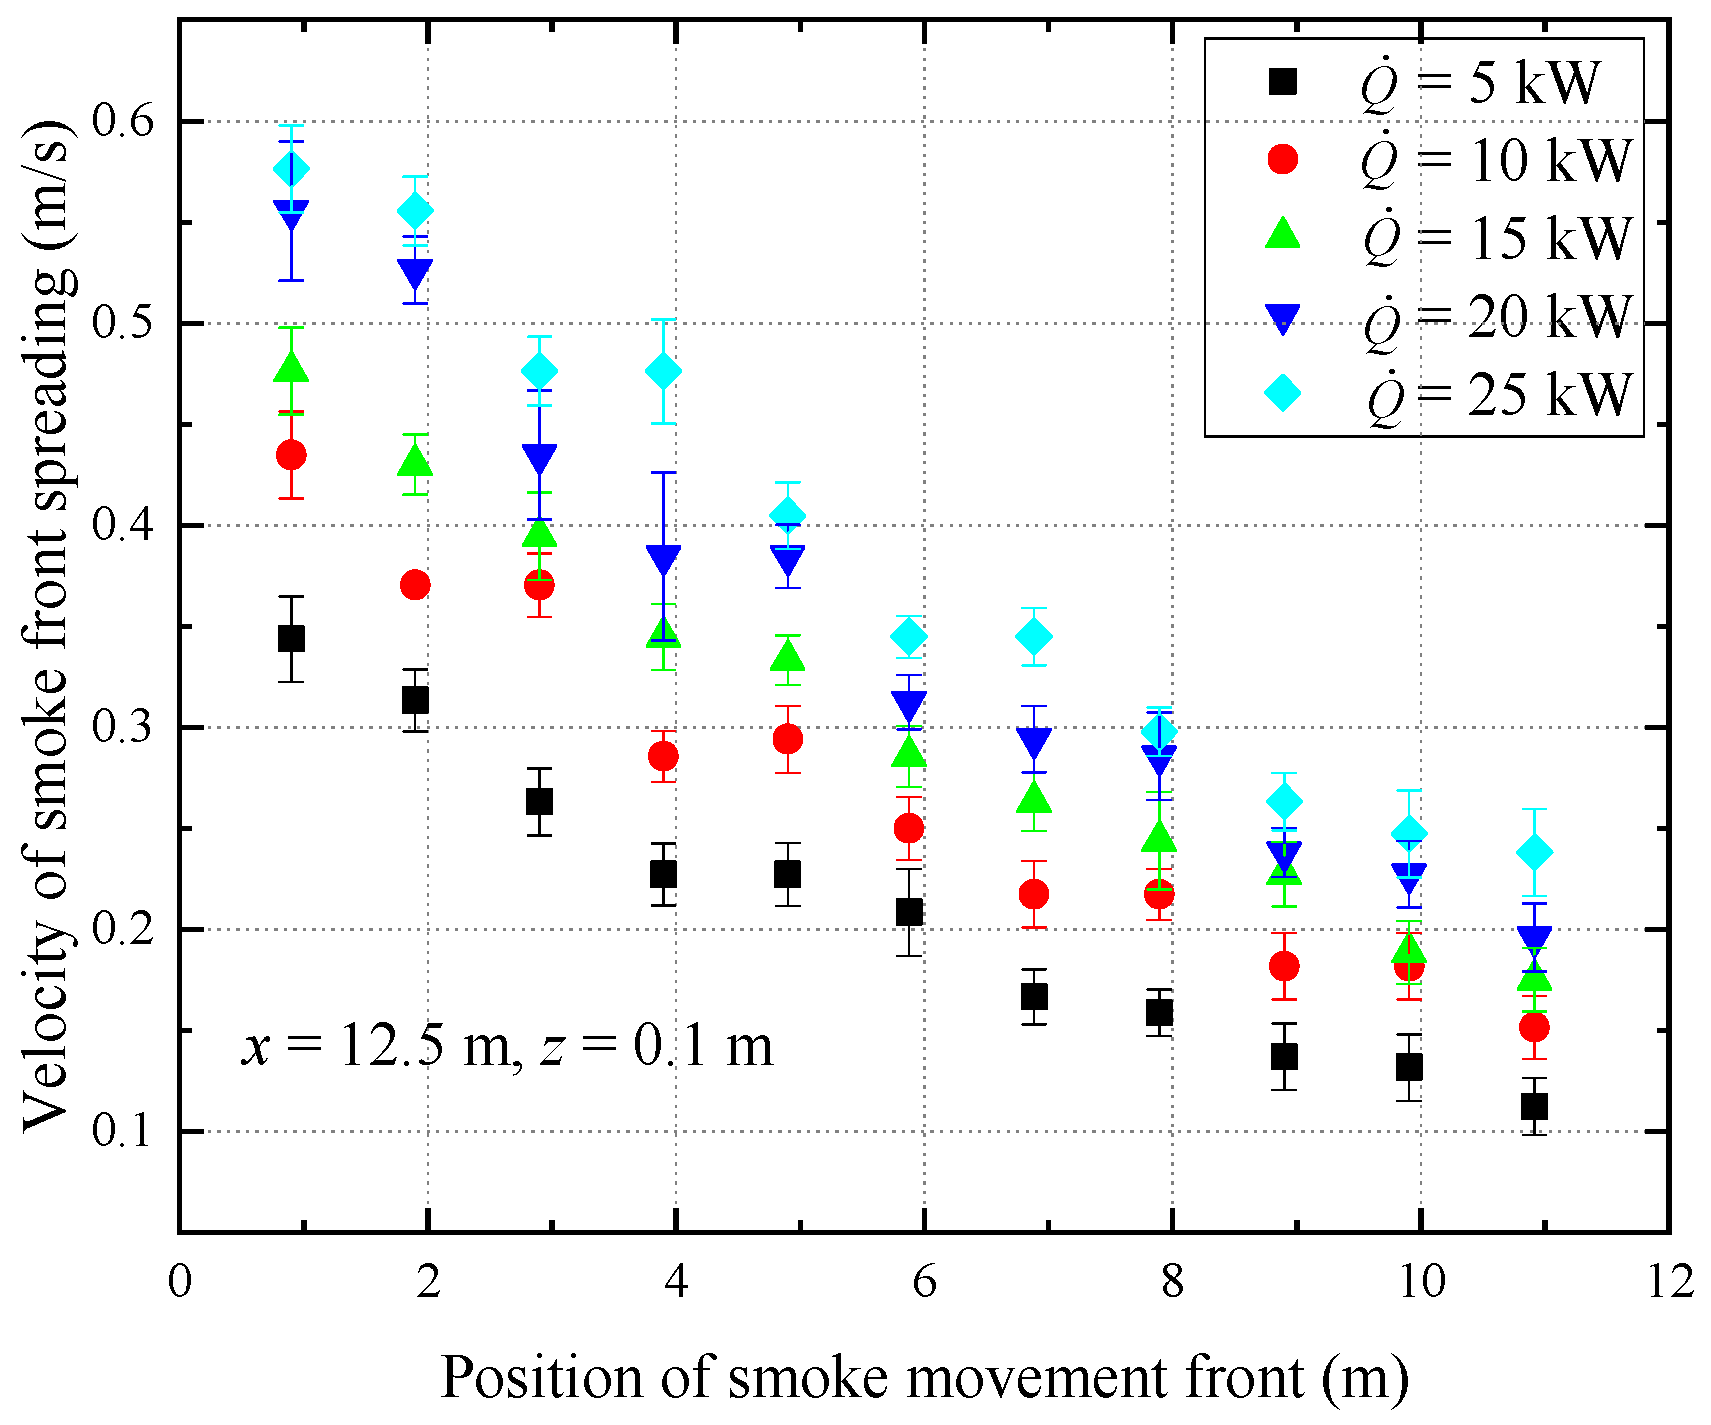
In the event of a utility tunnel fire, fireproof doors at both extremes are closed. The spreading velocity of smoke has a significant impact on evaluating the diffusion of toxic smoke, temperature distribution and personnel evacuation in the tunnel. At x = 12.5 m, z = 0.1 m, Figure 9 shows the instantaneously spreading velocity of smoke as a function of the HRR of fire source. It is found that the instantaneously spreading velocity decreases along the longitudinal direction. In general, at the half length of the tunnel, the spreading velocity is decreased by 50–60%. The temperature and spreading speed of smoke depend on air entrainment and heat dissipation. The air entrainment rate is much lower than the spreading velocity of smoke. With the spread of the smoke along the top ceiling of the tunnel, the accumulated heat loss increases, which leads to a decrease in the smoke temperature and spreading velocity.
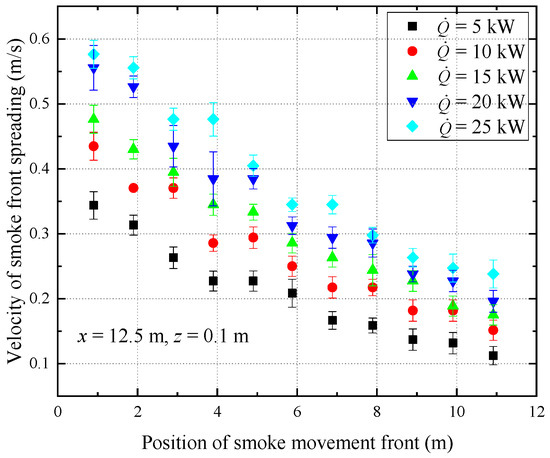
Figure 9.
Instantaneously spreading speed of smoke along the ceiling of the utility tunnel.
Figure 10 shows the average spreading velocity of smoke from the fire source to the other end of the tunnel with different heat release rates and fire source positions. At a certain fire point location, the average spreading velocity of smoke is increased by the HRR. When the gas burner is placed in the middle (x = 12.5 m), the smoke spreads symmetrically to both ends of the tunnel. When the gas burner is installed near one end of the tunnel, the minimal velocity of smoke movement is attained, because the smoke is cooled down during the long spreading route. For instance, at = 5 kW, the average spreading velocity of smoke is 0.06 m/s at x = 1.8 m; in contrast, it is 0.195 m/s at x = 12.5 m, with a 2.3-fold increase. At = 25 kW, the average spreading velocity of smoke is 0.16 m/s at x = 1.8 m; in contrast, it is 0.35 m/s at x = 12.5 m, with a 1.2-fold increase. Moreover, when the position of the fire source is elevated, the smoke moving velocity decreases. When the height of fire source is raised, the temperature rise at the impingement point on the ceiling is low (as shown in Figure 4), so the initial energy of the one-dimensional movement of the smoke is weakened. The longitudinal position of the fire source has a great influence on the average velocity of smoke movement, while the vertical position has little influence. Specifically, the average speed increases as the fire source got closer to middle of utility tunnel. Therefore, it is suggested that the corresponding smoke exhaust speed can be determined according to the longitudinal position of the fire source. The smoke exhaust should be designed based on the larger velocity of the spreading smoke.
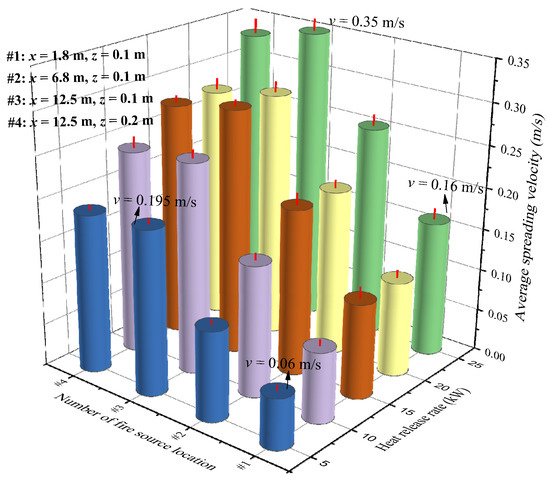
Figure 10.
Average spreading velocity of smoke versus HRR and fire source position.
Substituting the theoretical value of the longitudinal temperature rise predicted by Equation (5) into the differential equation, Equation (9), the spreading velocity of smoke is obtained. As plotted in Figure 11, the theoretical value of the spreading velocity of smoke coincides well with the experimental value, and the relative error is less than 20%.
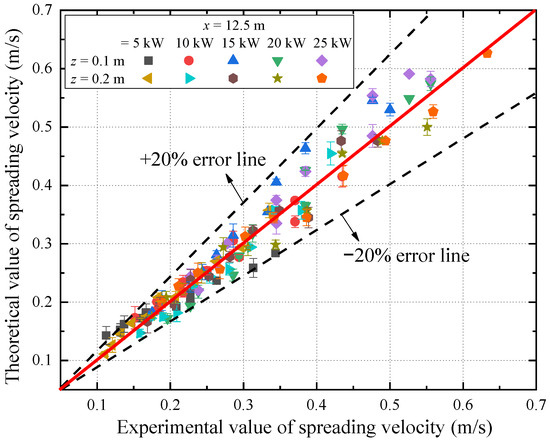
Figure 11.
Comparison of theoretical and experimental value of spreading velocity of smoke.
5. Conclusions
The movement configuration, initial position of one-dimensional horizontal spreading, longitudinal temperature decay formula and spreading velocity of smoke are investigated using a 1/8-scaled urban utility tunnel. The major findings are summarized as follows:
- (1)
- A nose-shaped smoke front is formed because the smoke movement of the tunnel fire belongs to the natural convection driven by thermal buoyancy, that is, the gravity current.
- (2)
- Based on non-dimensional analysis, it is found that the dimensionless initial position of one-dimensional smoke spreading increases exponentially with the dimensionless heat release rate in the correlation of . The proposed dimensionless model collapses and correlates well with the numerical results from previous studies.
- (3)
- The longitudinal temperature attenuation formula of smoke is established with a consideration of radiation heat loss. Different from the classical logarithmic equation, the transcendental equation is solved by the fzero function. It is found that the theoretical value of the longitudinal temperature rise of smoke, ΔT0, is in good agreement with the measurement.
- (4)
- The average spreading velocity of smoke increases with an increase in the heat release rate. When the fire source is located near one end of the tunnel, the velocity of smoke spreading is smaller than that of the fire source at the center, due to the long spreading route. It is suggested that the corresponding smoke exhaust speed can be determined according to the longitudinal position of the fire source. The smoke exhaust should be designed based on the larger velocity of smoke spreading. The theoretical value of the spreading velocity of smoke coincides well with the experimental value, and the relative error is less than 20%.
Author Contributions
Methodology, B.C.; investigation, H.L.; software, R.F.; writing—review and editing, X.J.; funding acquisition, L.Y. All authors have read and agreed to the published version of the manuscript.
Funding
This research was funded by the Anhui Provincial Key R&D Program under grant number 2022m07020013 and Anhui Provincial Natural Science Foundation under grant number 2208085UD13.
Institutional Review Board Statement
Not applicable.
Informed Consent Statement
Not applicable.
Data Availability Statement
The data presented in this study are available on request from the corresponding author.
Acknowledgments
The authors would like to thank the Anhui Provincial Key R&D Program (No. 2022m07020013) and Anhui Provincial Natural Science Foundation (No. 2208085UD13) for their supports.
Conflicts of Interest
The authors declare no conflict of interest.
References
- Pan, R.; Zhu, G.; Liang, Z.; Zhang, G.; Liu, H.; Zhou, X. Experimental study on the fire shape and maximum temperature beneath ceiling centerline in utility tunnel under the effect of curved sidewall. Tunn. Undergr. Space Technol. 2020, 99, 103304. [Google Scholar] [CrossRef]
- Du, F.; Zhang, Q.; Wang, K.; Cui, W.; Guo, Y.; Deng, Y. Study on crowd evacuation in subway transfer station fires based on numerical simulation. Emerg. Manag. Sci. Technol. 2022, 2, 16. [Google Scholar] [CrossRef]
- Hua, N.; Tessari, A.; Elhami Khorasani, N. The effect of geologic conditions on the fire behavior of tunnels considering soil-structure interaction. Tunn. Undergr. Space Technol. 2022, 122, 104380. [Google Scholar] [CrossRef]
- Zhao, P.; Yuan, Z.; Liang, C.; Yuan, Y.; Xie, Y.; Yu, N. Experimental investigation on ceiling temperature characteristics induced by weak and strong fire plumes in tunnel fires equipped with two-point extraction ventilation using smoke extraction channel. Tunn. Undergr. Space Technol. 2022, 124, 104487. [Google Scholar] [CrossRef]
- Atkinson, G.T.; Drysdale, D.D. Convective heat transfer from fire gases. Fire Saf. J. 1992, 19, 217–245. [Google Scholar] [CrossRef]
- Heskestad, G.; Hamada, T. Ceiling jets of strong fire plumes. Fire Saf. J. 1993, 21, 69–82. [Google Scholar] [CrossRef]
- Chow, W.K.; Gao, Y.; Zhao, J.H.; Dang, J.F.; Chow, C.L.; Miao, L. Smoke movement in tilted tunnel fires with longitudinal ventilation. Fire Saf. J. 2015, 75, 14–22. [Google Scholar] [CrossRef]
- Gao, Z.H.; Liu, Z.X.; Wan, H.X.; Zhu, J.P. Experimental study on longitudinal and transverse temperature distribution of sidewall confined ceiling jet plume. Appl. Therm. Eng. 2016, 107, 583–590. [Google Scholar] [CrossRef]
- Kunsch, J.P. Critical velocity and range of a fire-gas plume in a ventilated tunnel. Atmos. Environ. 1999, 33, 13–24. [Google Scholar] [CrossRef]
- Hu, L.H.; Huo, R.; Li, Y.Z.; Wang, H.B.; Chow, W.K. Full-scale burning tests on studying smoke temperature and velocity along a corridor. Tunn. Undergr. Space Technol. 2005, 20, 223–229. [Google Scholar] [CrossRef]
- Ye, K.; Zhou, X.; Zheng, Y.; Liu, H.; Tang, X.; Cao, B.; Huang, Y.; Chen, Y.; Yang, L. Estimating the longitudinal maximum gas temperature attenuation of ceiling jet flows generated by strong fire plumes in an urban utility tunnel. Int. J. Therm. Sci. 2019, 142, 434–448. [Google Scholar] [CrossRef]
- Ingason, H.; Li, Y.Z. Model scale tunnel fire tests with longitudinal ventilation. Fire Saf. J. 2010, 45, 371–384. [Google Scholar] [CrossRef]
- He, Y. Smoke temperature and velocity decays along corridors. Fire Saf. J. 1999, 33, 71–74. [Google Scholar] [CrossRef]
- Hinkley, P.L. The Flow of Hot Gass along an Enclosed Shopping Mall a Tentative Theroy; No. 807; Fire Research Note; UK Fire Research Station (FRS): Borehamwood, UK, 1970. [Google Scholar]
- Yang, D.; Huo, R.; Zhang, X.L.; Zhao, X.Y. On the front velocity of buoyancy-driven transient ceiling jet in a horizontal corridor: Comparison of correlations with measurements. Appl. Therm. Eng. 2011, 31, 2992–2999. [Google Scholar] [CrossRef]
- Xu, G.; Zhu, G.; Pan, R.; Liu, X. Investigation on temperature distribution under the coupling action of transverse position and fire sealing of linear fire in tunnel. Case Stud. Therm. Eng. 2021, 26, 101032. [Google Scholar] [CrossRef]
- Luo, M.; Zeng, Y.; Su, L.-C.; Huang, X. Review and application of engineering design models for building fire smoke movement and control. Emerg. Manag. Sci. Technol. 2024, 4, e001. [Google Scholar] [CrossRef]
- Hu, L. Study on Thermal Physics of Fire Induced Smoke Movement in Tunnels. Ph.D. Thesis, University of Science and Technology of China, Hefei, China, 2006. [Google Scholar]
- Karadağ, R. The investigation of relation between radiative and convective heat transfer coefficients at the ceiling in a cooled ceiling room. Energ. Convers. Manag. 2009, 50, 1–5. [Google Scholar] [CrossRef]
- Karlsson, B.; Quintiere, J. Enclosure Fire Dynamics; Taylor & Francis: Boca Raton, FL, USA, 2000. [Google Scholar]
- Li, L.; Cheng, X.; Cui, Y.; Dong, W.; Mei, Z. Estimation of smoke arrival time in tunnel fires. Tunn. Undergr. Space Technol. 2013, 38, 431–434. [Google Scholar] [CrossRef]
- Bird, J.O. Ideal gas laws. In Newnes Engineering Science Pocket Book; Butterworth-Heinemann: Oxford, UK, 1987; pp. 317–321. [Google Scholar]
- Wei, S.; Wan, H.; Zhou, X.; Zhang, Y. Experimental study on flame tilt angles of two unequal fires in a longitudinal ventilated tunnel. Tunn. Undergr. Space Technol. 2023, 137, 105125. [Google Scholar] [CrossRef]
- Guo, F.; Ding, L.; Gao, Z.; Yu, L.; Ji, J. Effects of wind flow and sidewall restriction on the geometric characteristics of propane diffusion flames in tunnels. Energy 2020, 198, 117332. [Google Scholar] [CrossRef]
- Tang, F.; Cao, Z.; Palacios, A.; Wang, Q. A study on the maximum temperature of ceiling jet induced by rectangular-source fires in a tunnel using ceiling smoke extraction. Int. J. Therm. Sci. 2018, 127, 329–334. [Google Scholar] [CrossRef]
- Ingason, H.; Li, Y.; Lönnermark, A. Tunnel Fire Dynamics; Springer: New York, NY, USA, 2015. [Google Scholar]
- Hinkley, P.L.; Wraight, H.G.H.; Theobald, C.R. The contribution of flames under ceilings to fire spread in compartments. Fire Saf. J. 1984, 7, 227–242. [Google Scholar] [CrossRef]
- Lattimer, B.Y.; Mealy, C.; Beitel, J. Heat Fluxes and Flame Lengths from Fires under Ceilings. Fire Technol. 2013, 49, 269–291. [Google Scholar] [CrossRef]
- Sipkens, T.A.; Corbin, J.C.; Grauer, S.J.; Smallwood, G.J. Tutorial: Guide to error propagation for particle counting measurements. J. Aerosol Sci. 2023, 167, 106091. [Google Scholar] [CrossRef]
- Chan, W.R. Experimental and Numerical Studies on Two-Dimensional Gravity Currents in a Horizontal Channel; California Institute of Technology: Pasadena, CA, USA, 1993. [Google Scholar]
- Chobotov, M.V. Gravity Currents with Heat Transfer Effects; California Institute of Technology: Pasadena, CA, USA, 1987. [Google Scholar]
- Zhou, T.; Zhou, Y.; Fan, C.; Wang, J. Experimental study on temperature distribution beneath an arced tunnel ceiling with various fire locations. Tunn. Undergr. Space Technol. 2020, 98, 103344. [Google Scholar] [CrossRef]
- Jiang, X.; Liu, M.; Wang, J.; Li, K. Study on air entrainment coefficient of one-dimensional horizontal movement stage of tunnel fire smoke in top central exhaust. Tunn. Undergr. Space Technol. 2016, 60, 1–9. [Google Scholar] [CrossRef]
- Guo, F.; Gao, Z.; Wan, H.; Ji, J.; Yu, L.; Ding, L. Influence of ambient pressure on critical ventilation velocity and backlayering distance of thermal driven smoke in tunnels with longitudinal ventilation. Int. J. Therm. Sci. 2019, 145, 105989. [Google Scholar] [CrossRef]
- Ji, J.; Guo, F.; Gao, Z.; Zhu, J.; Sun, J. Numerical investigation on the effect of ambient pressure on smoke movement and temperature distribution in tunnel fires. Appl. Therm. Eng. 2017, 118, 663–669. [Google Scholar] [CrossRef]
- Mazza, D.; Canuto, E. Chapter 7-Exploring with Matlab acid–base equilibria in water. In Fundamental Chemistry with Matlab; Mazza, D., Canuto, E., Eds.; Elsevier: Amsterdam, The Netherlands, 2022; pp. 155–172. [Google Scholar]


Disclaimer/Publisher’s Note: The statements, opinions and data contained in all publications are solely those of the individual author(s) and contributor(s) and not of MDPI and/or the editor(s). MDPI and/or the editor(s) disclaim responsibility for any injury to people or property resulting from any ideas, methods, instructions or products referred to in the content. |
© 2024 by the authors. Licensee MDPI, Basel, Switzerland. This article is an open access article distributed under the terms and conditions of the Creative Commons Attribution (CC BY) license (https://creativecommons.org/licenses/by/4.0/).