
Flash Point Improvement of Mineral Oil Utilizing Nanoparticles to Reduce Fire Risk in Power Transformers: A Review

 , ,
, , 

Abstract
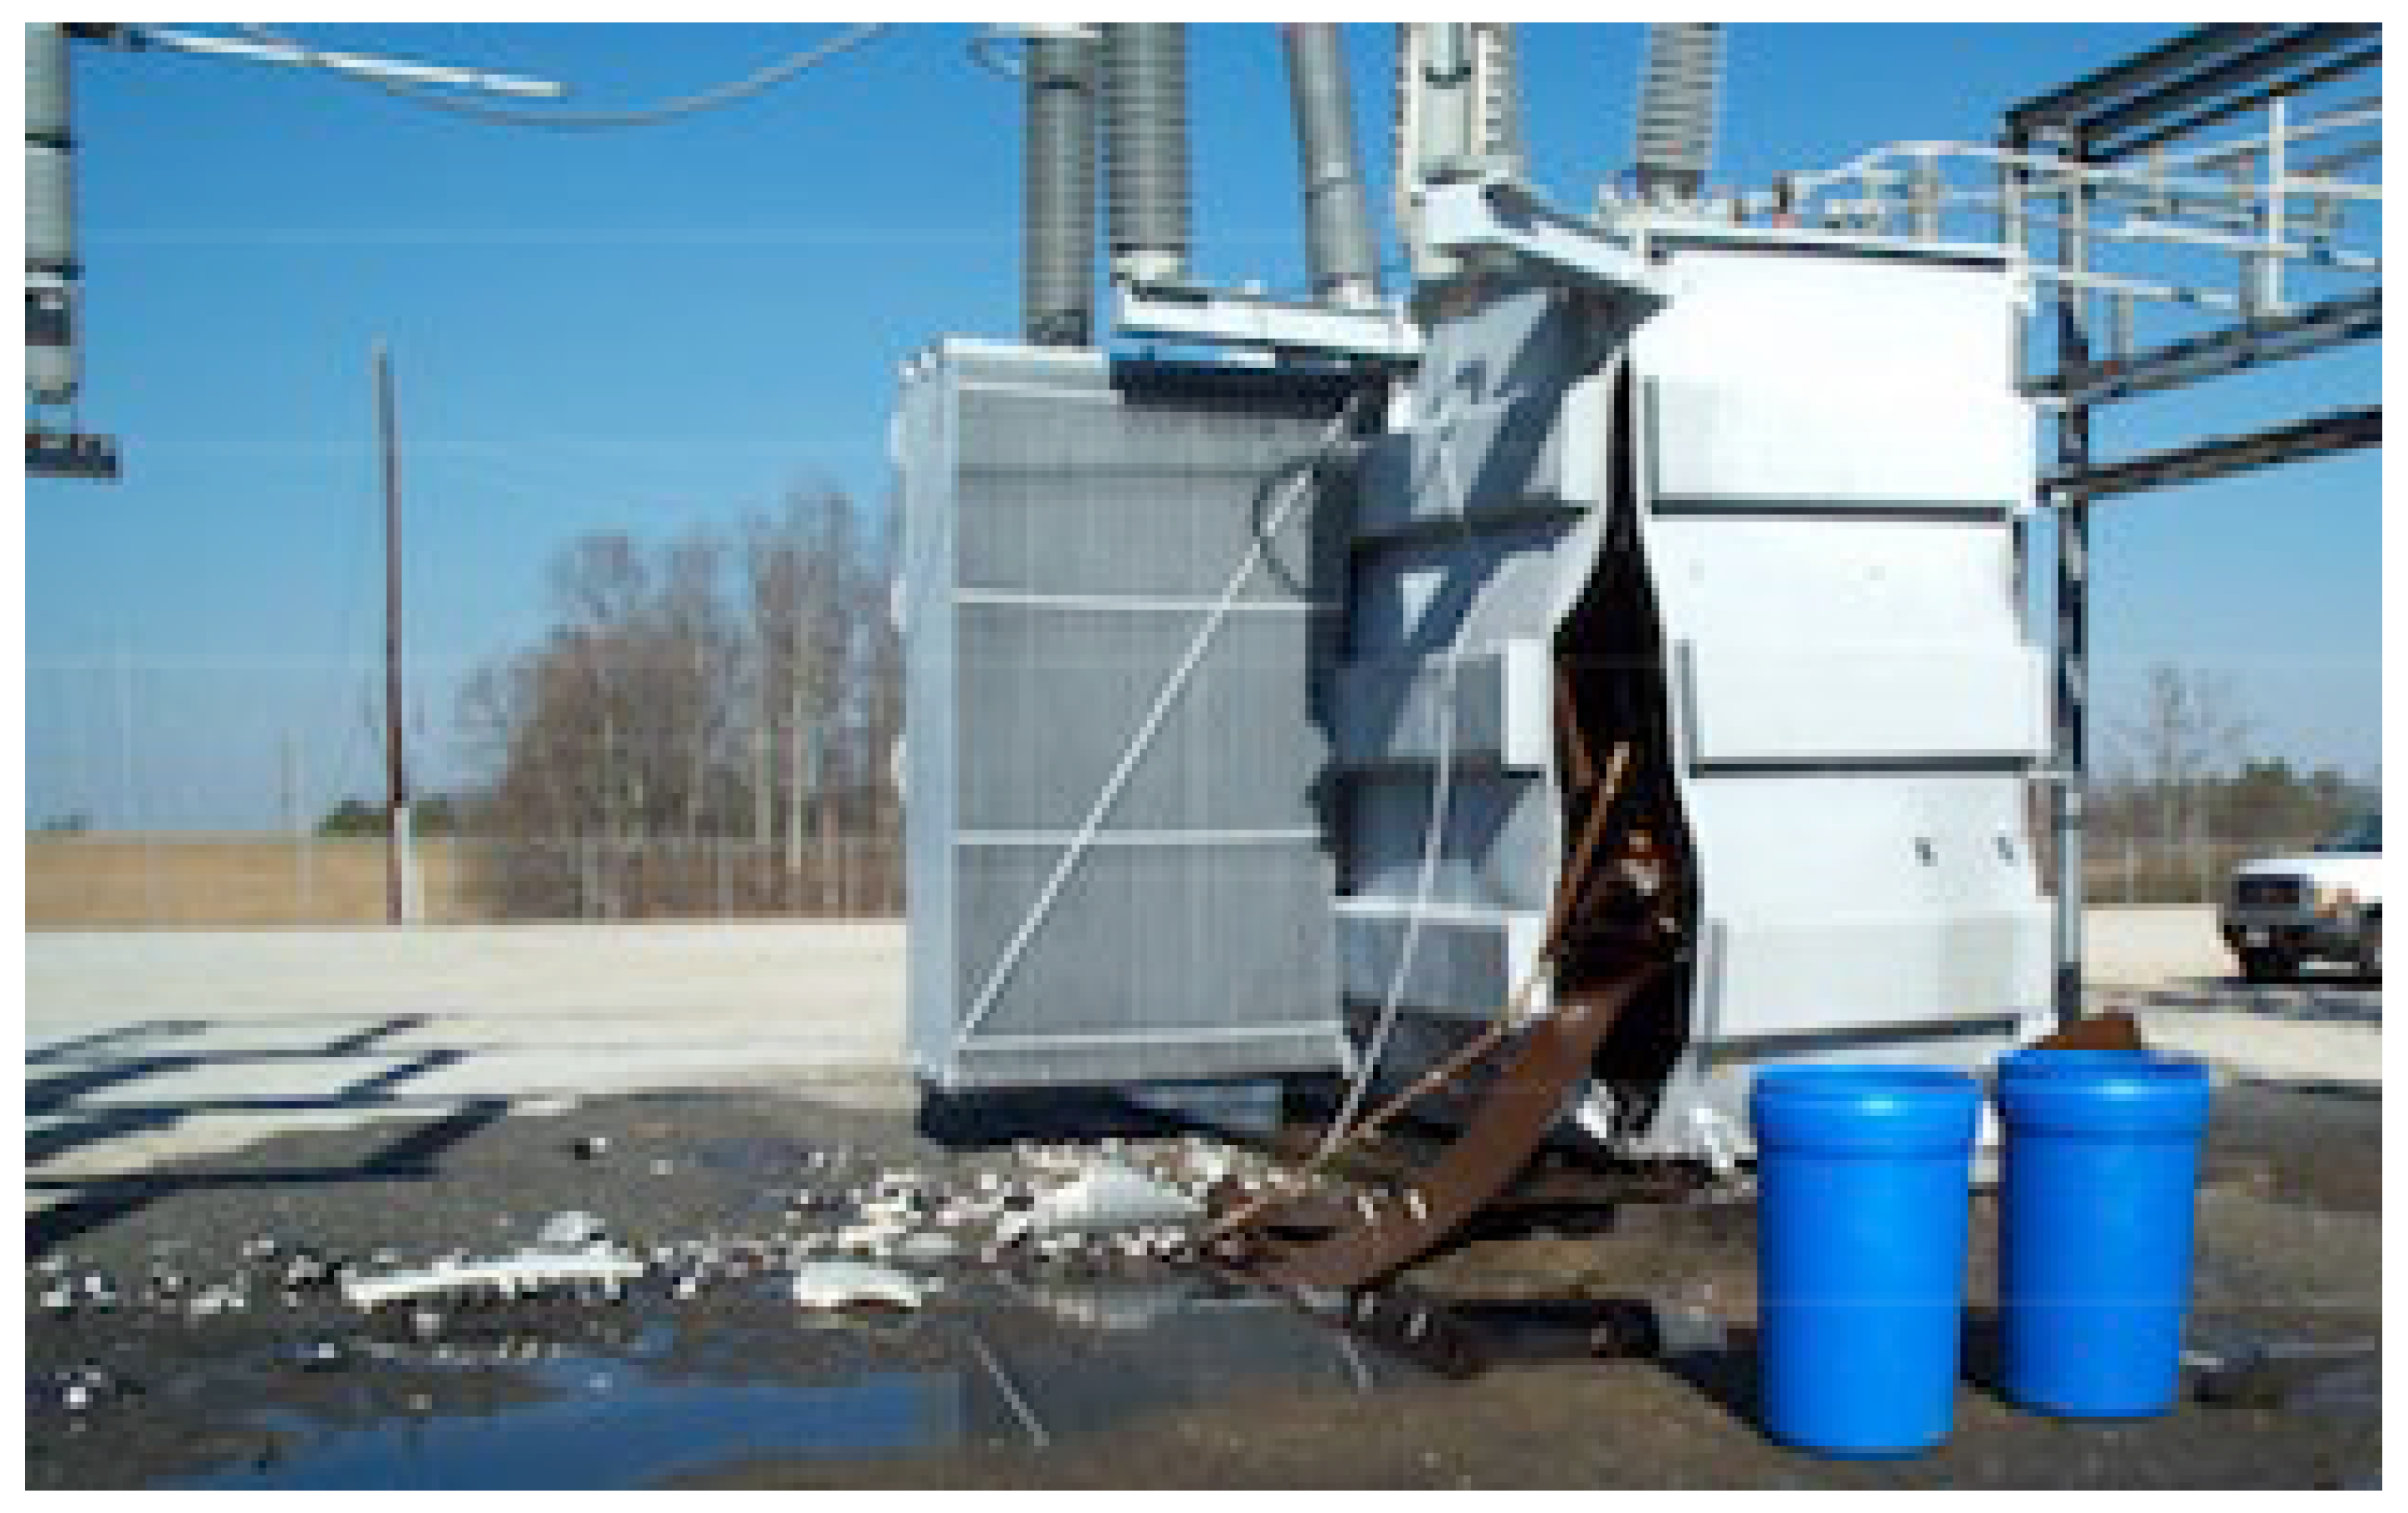
:1. Introduction
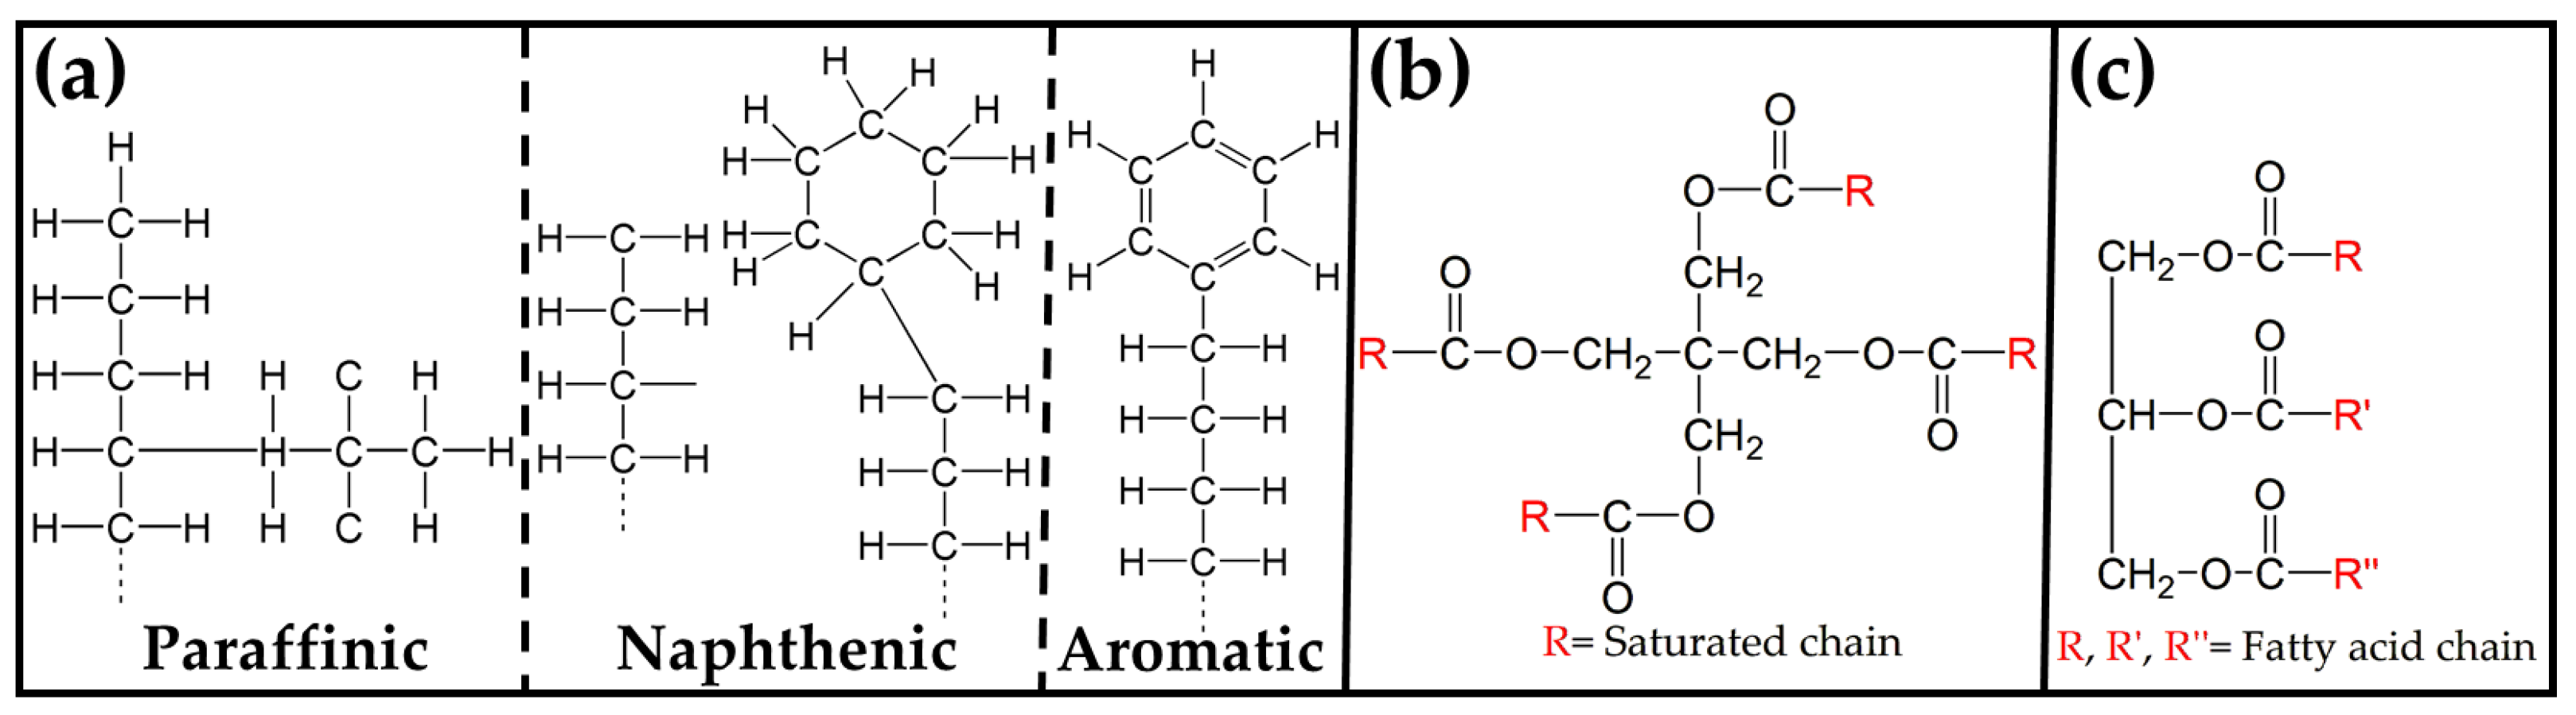
2. Transformer Oil (TO)
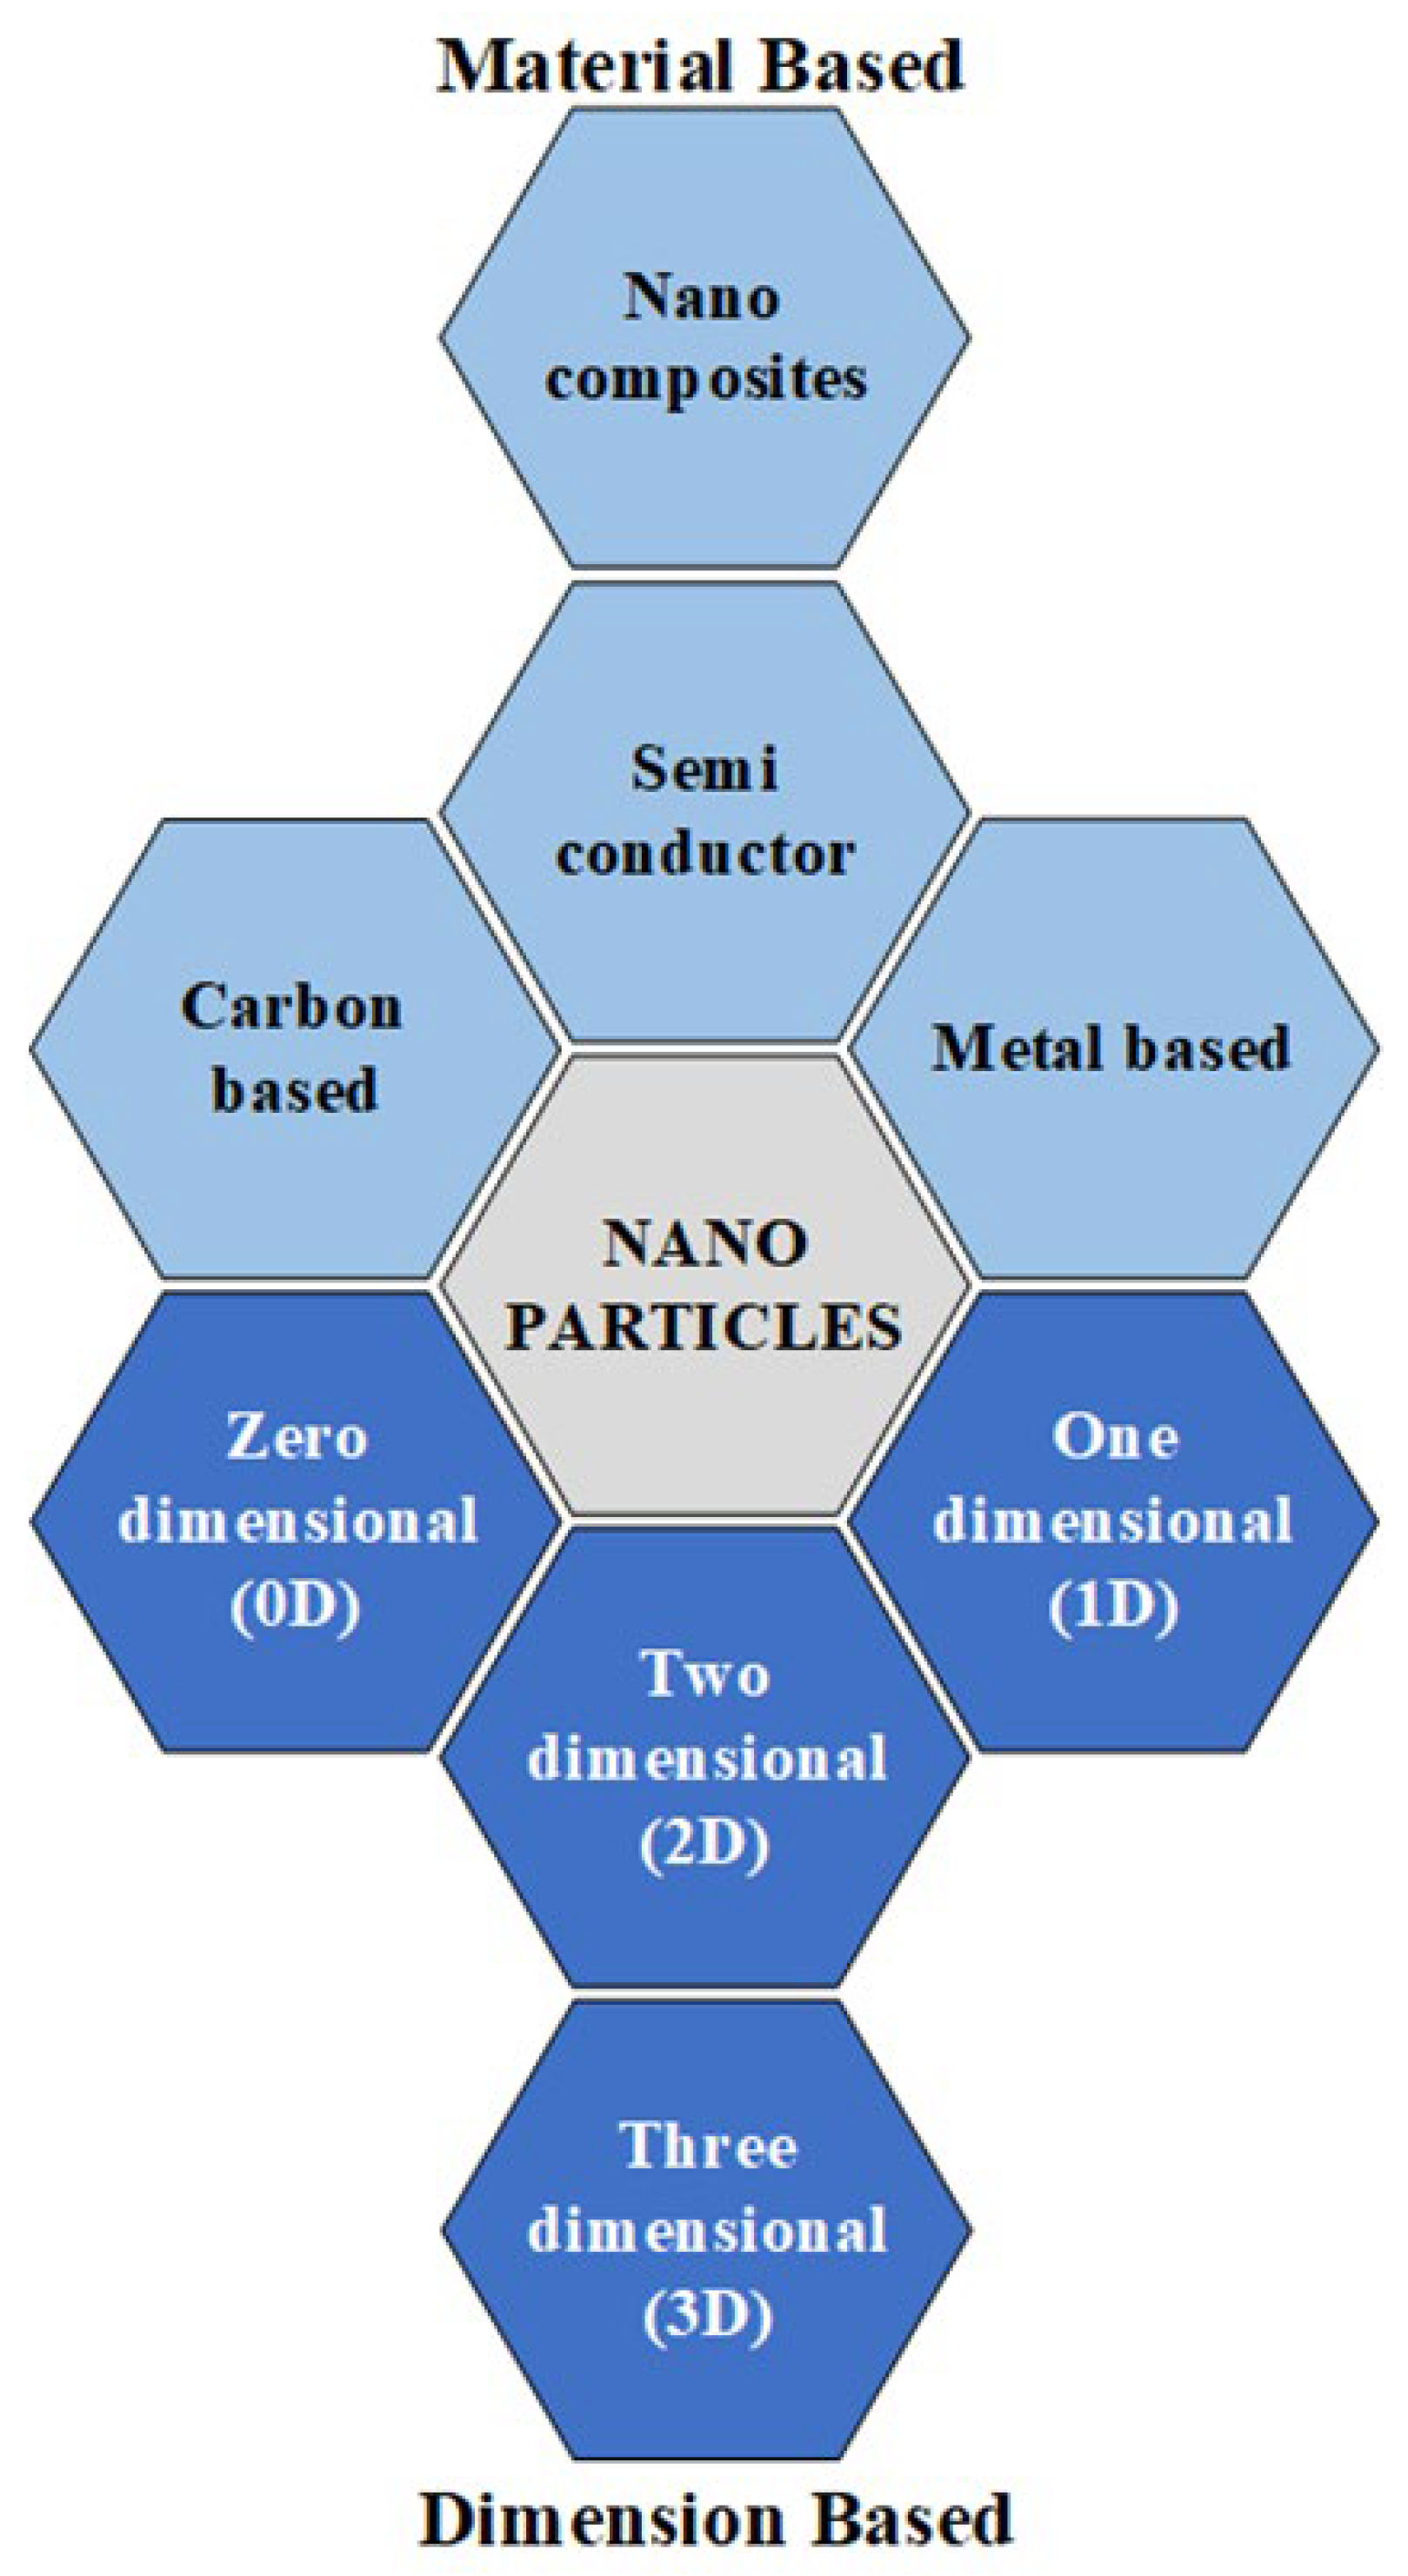
3. Nanoparticles (NPs)
3.1. Material-Based NPs
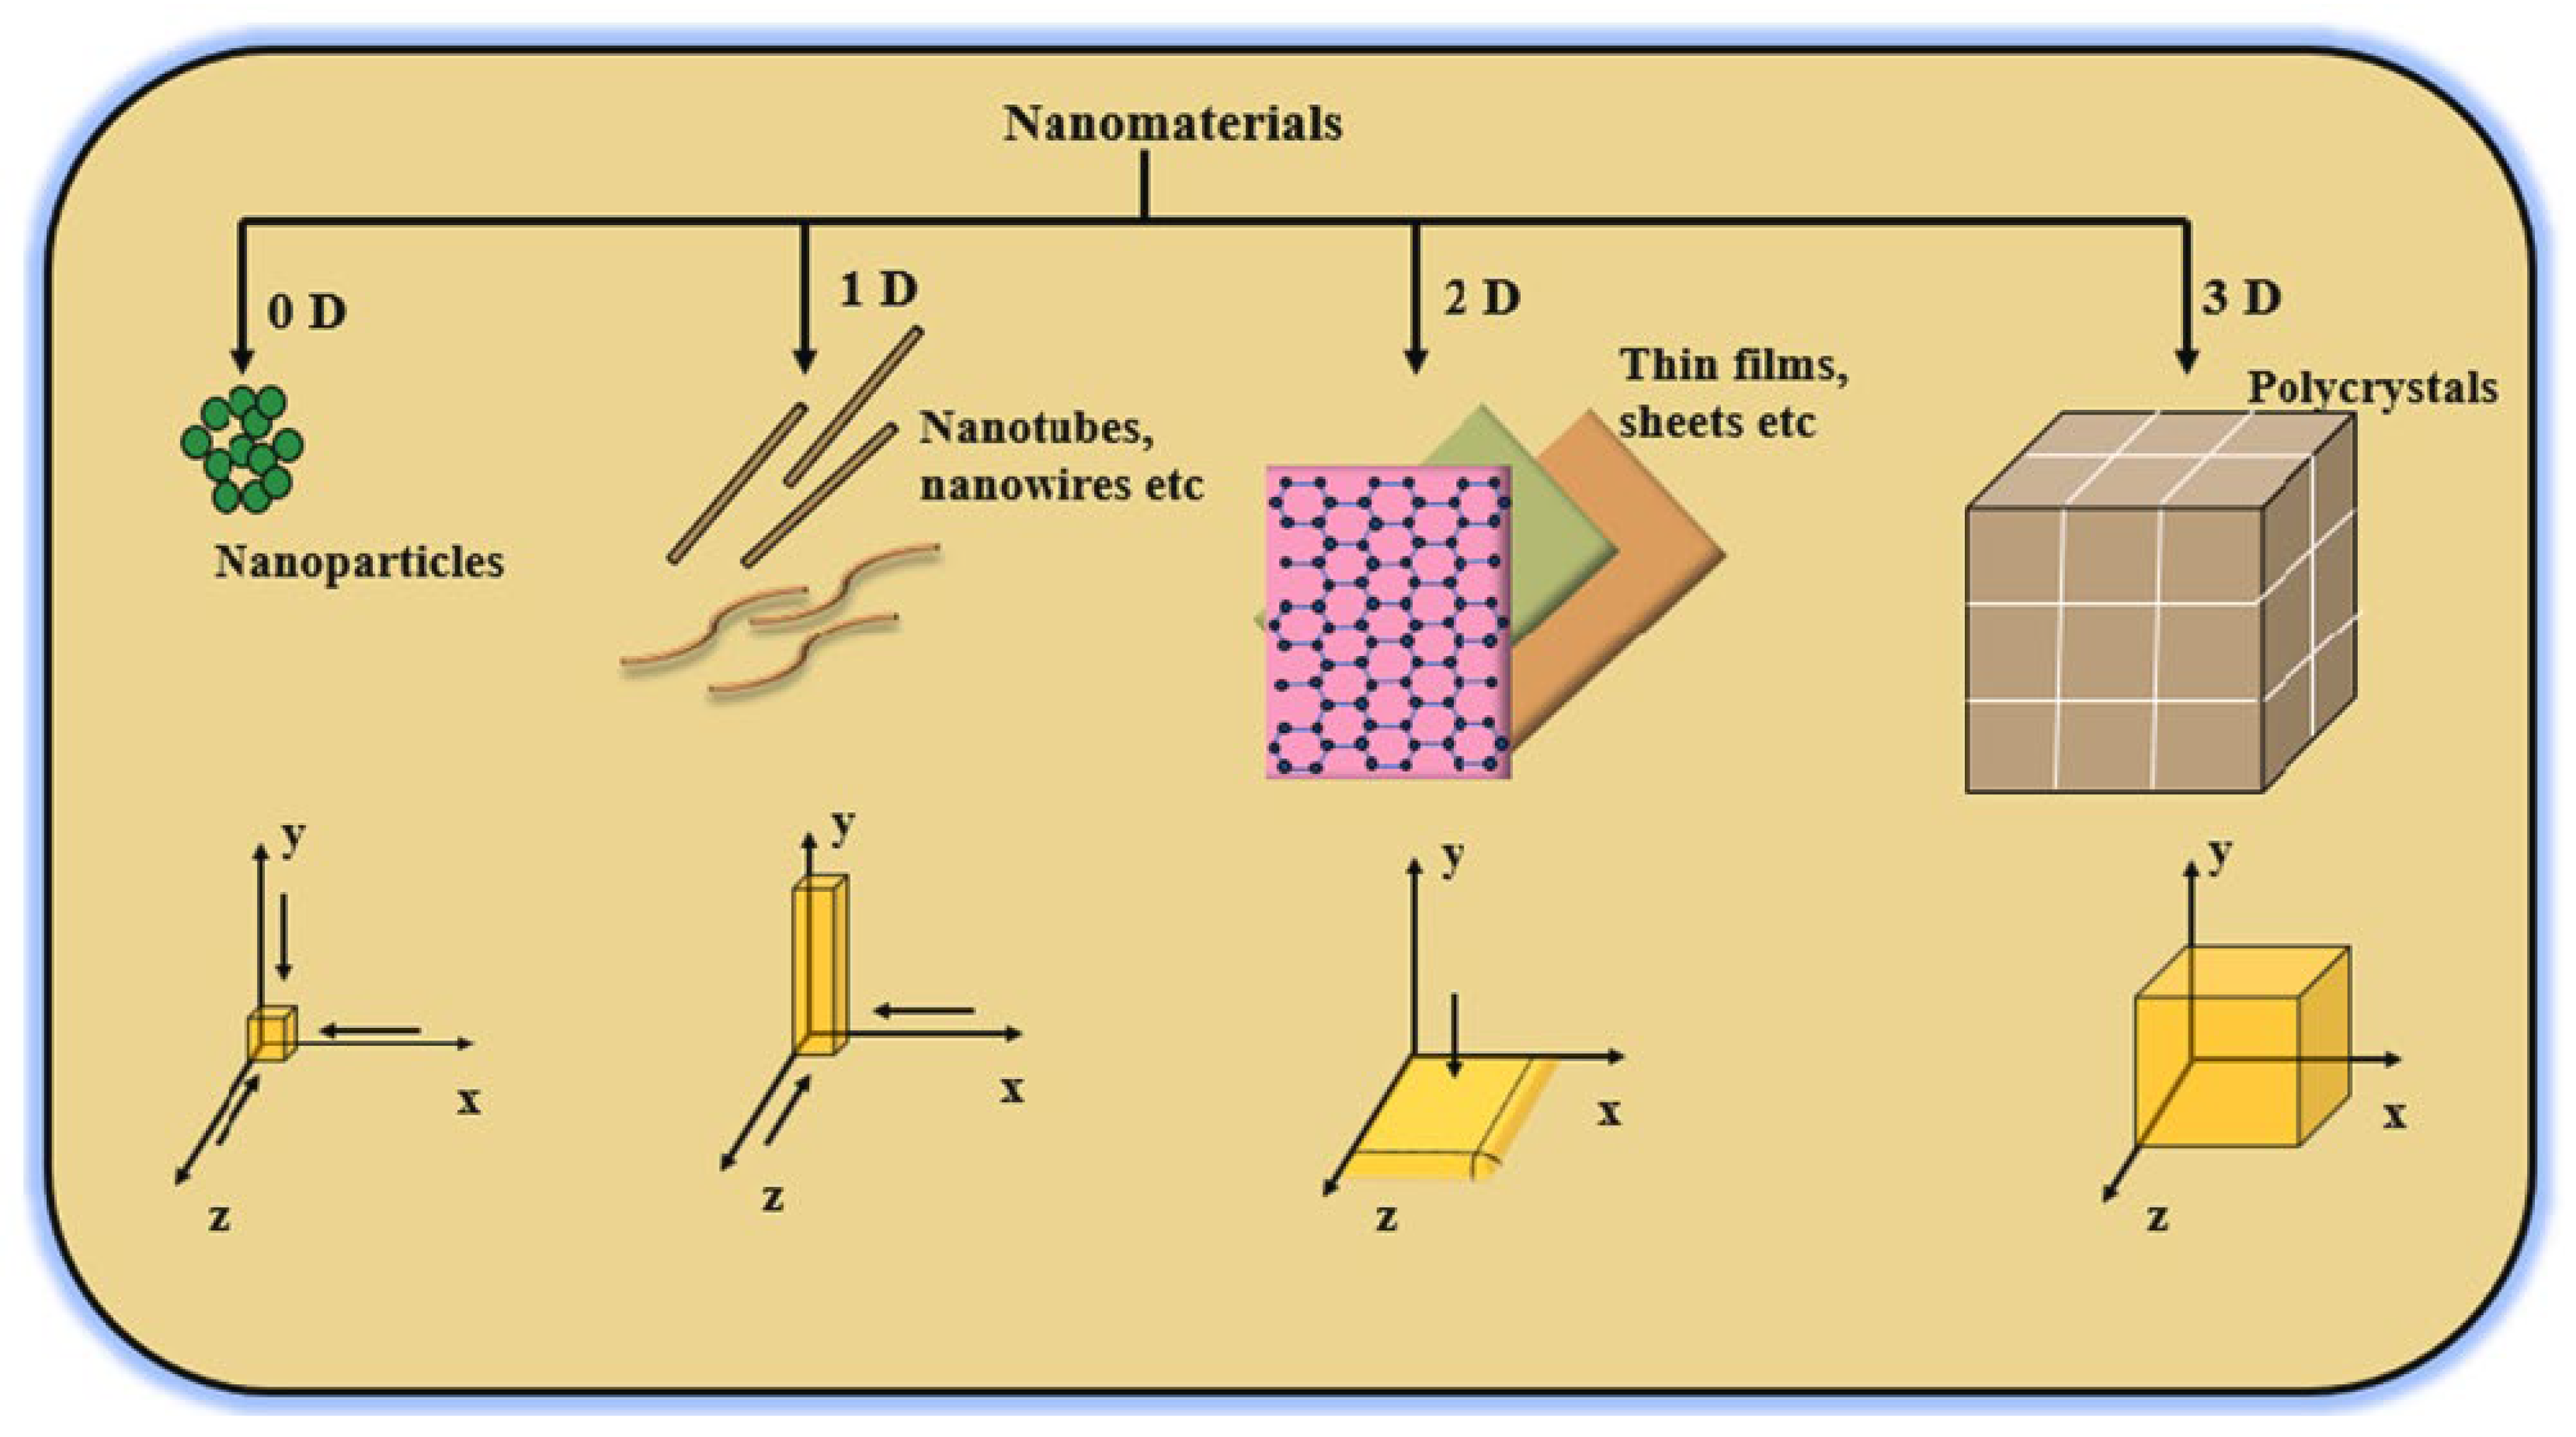
3.2. Dimension-Based NPs
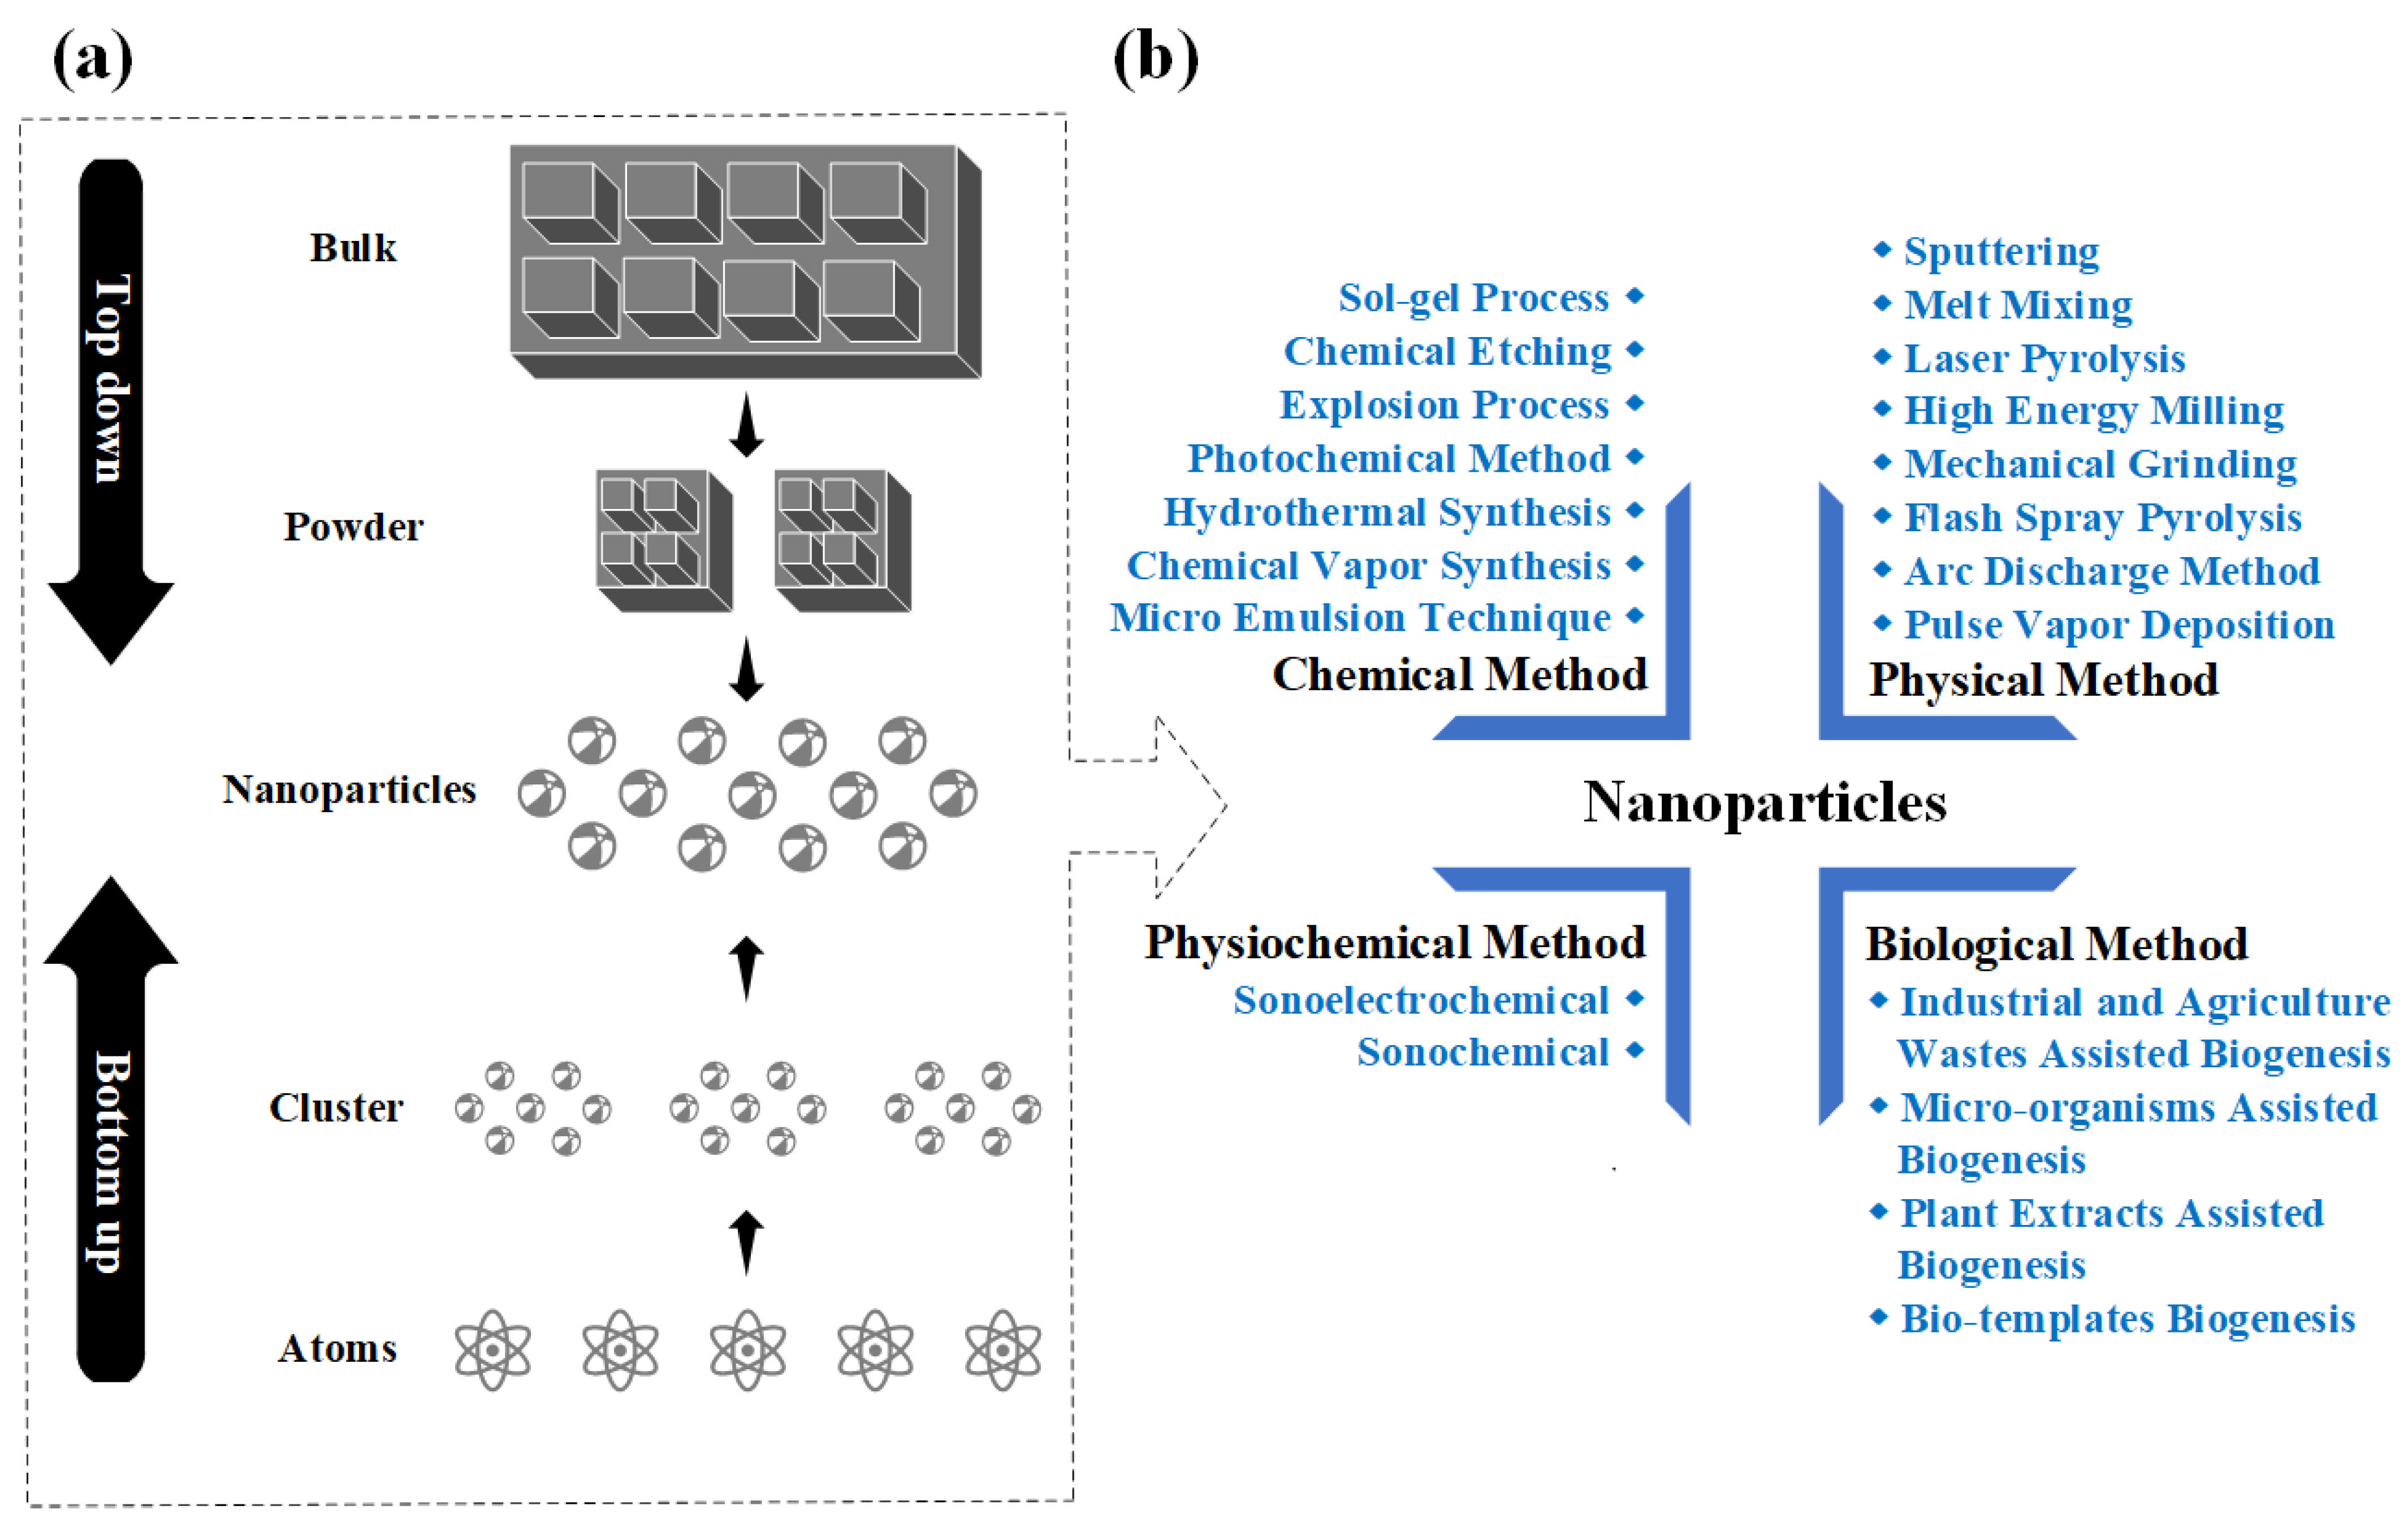
3.3. Synthesis of NPs
4. Preparation of Nano Insulating Liquid (NIL)
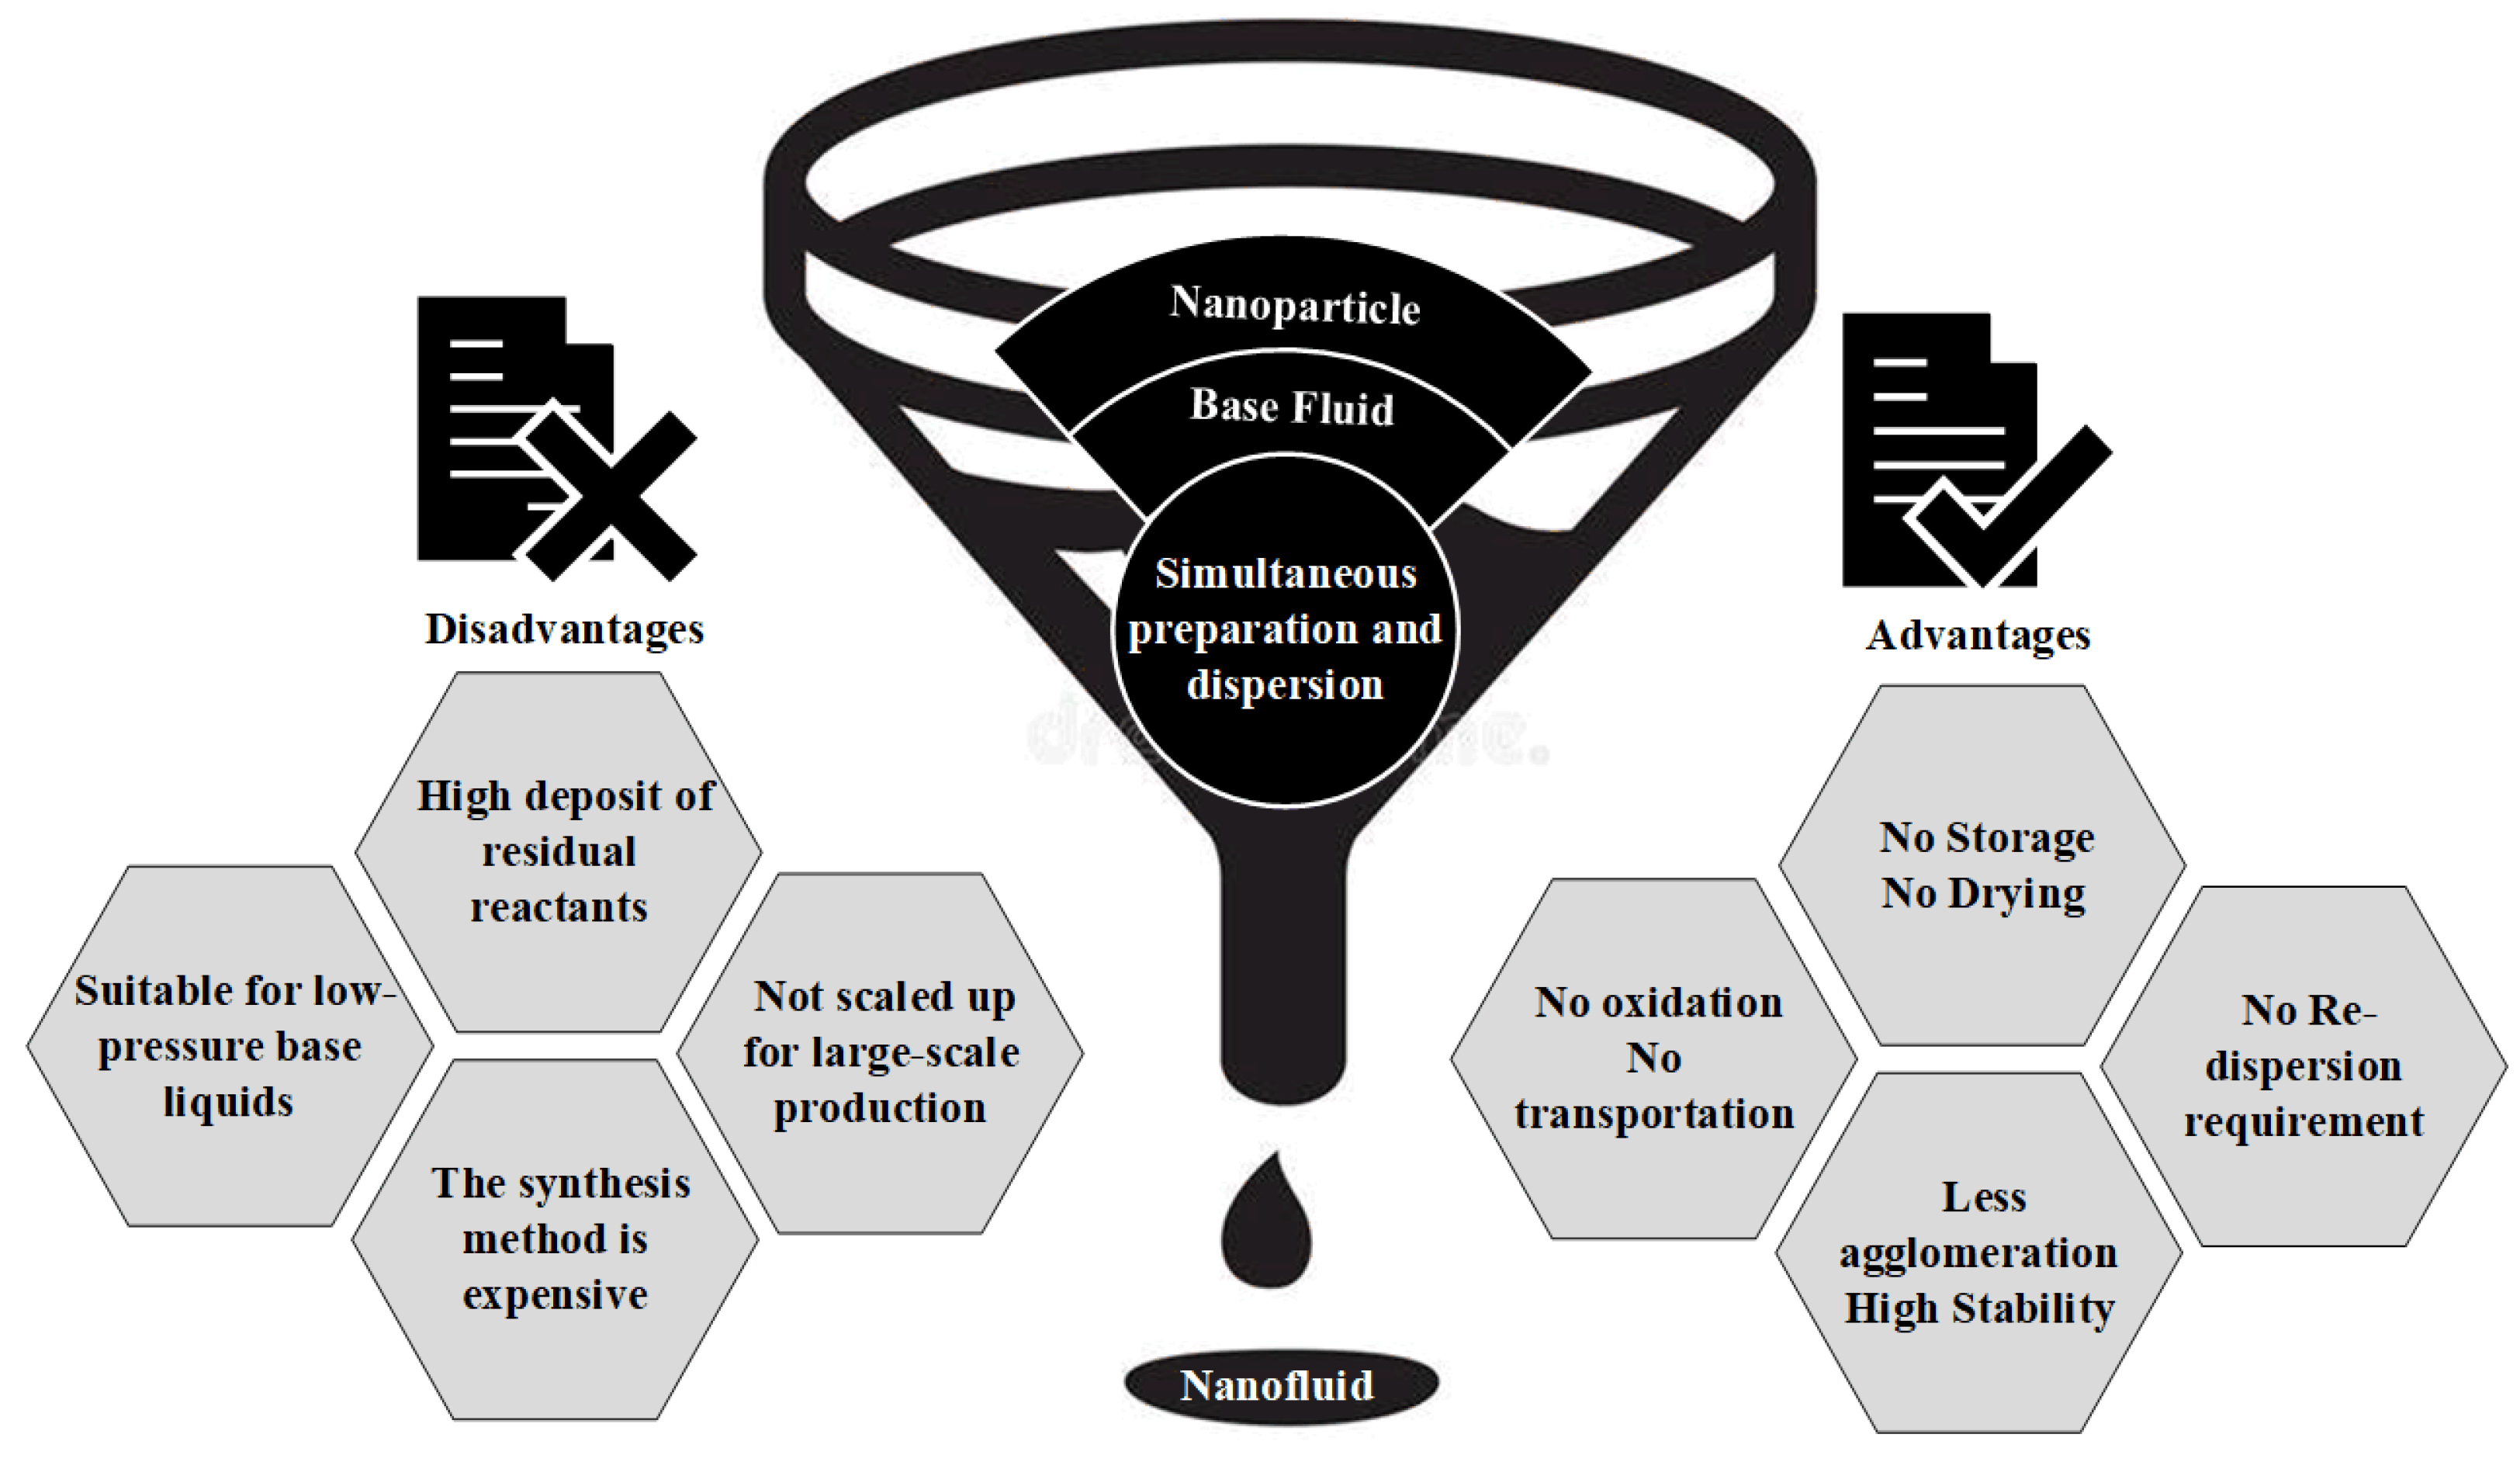
4.1. One-Step Method
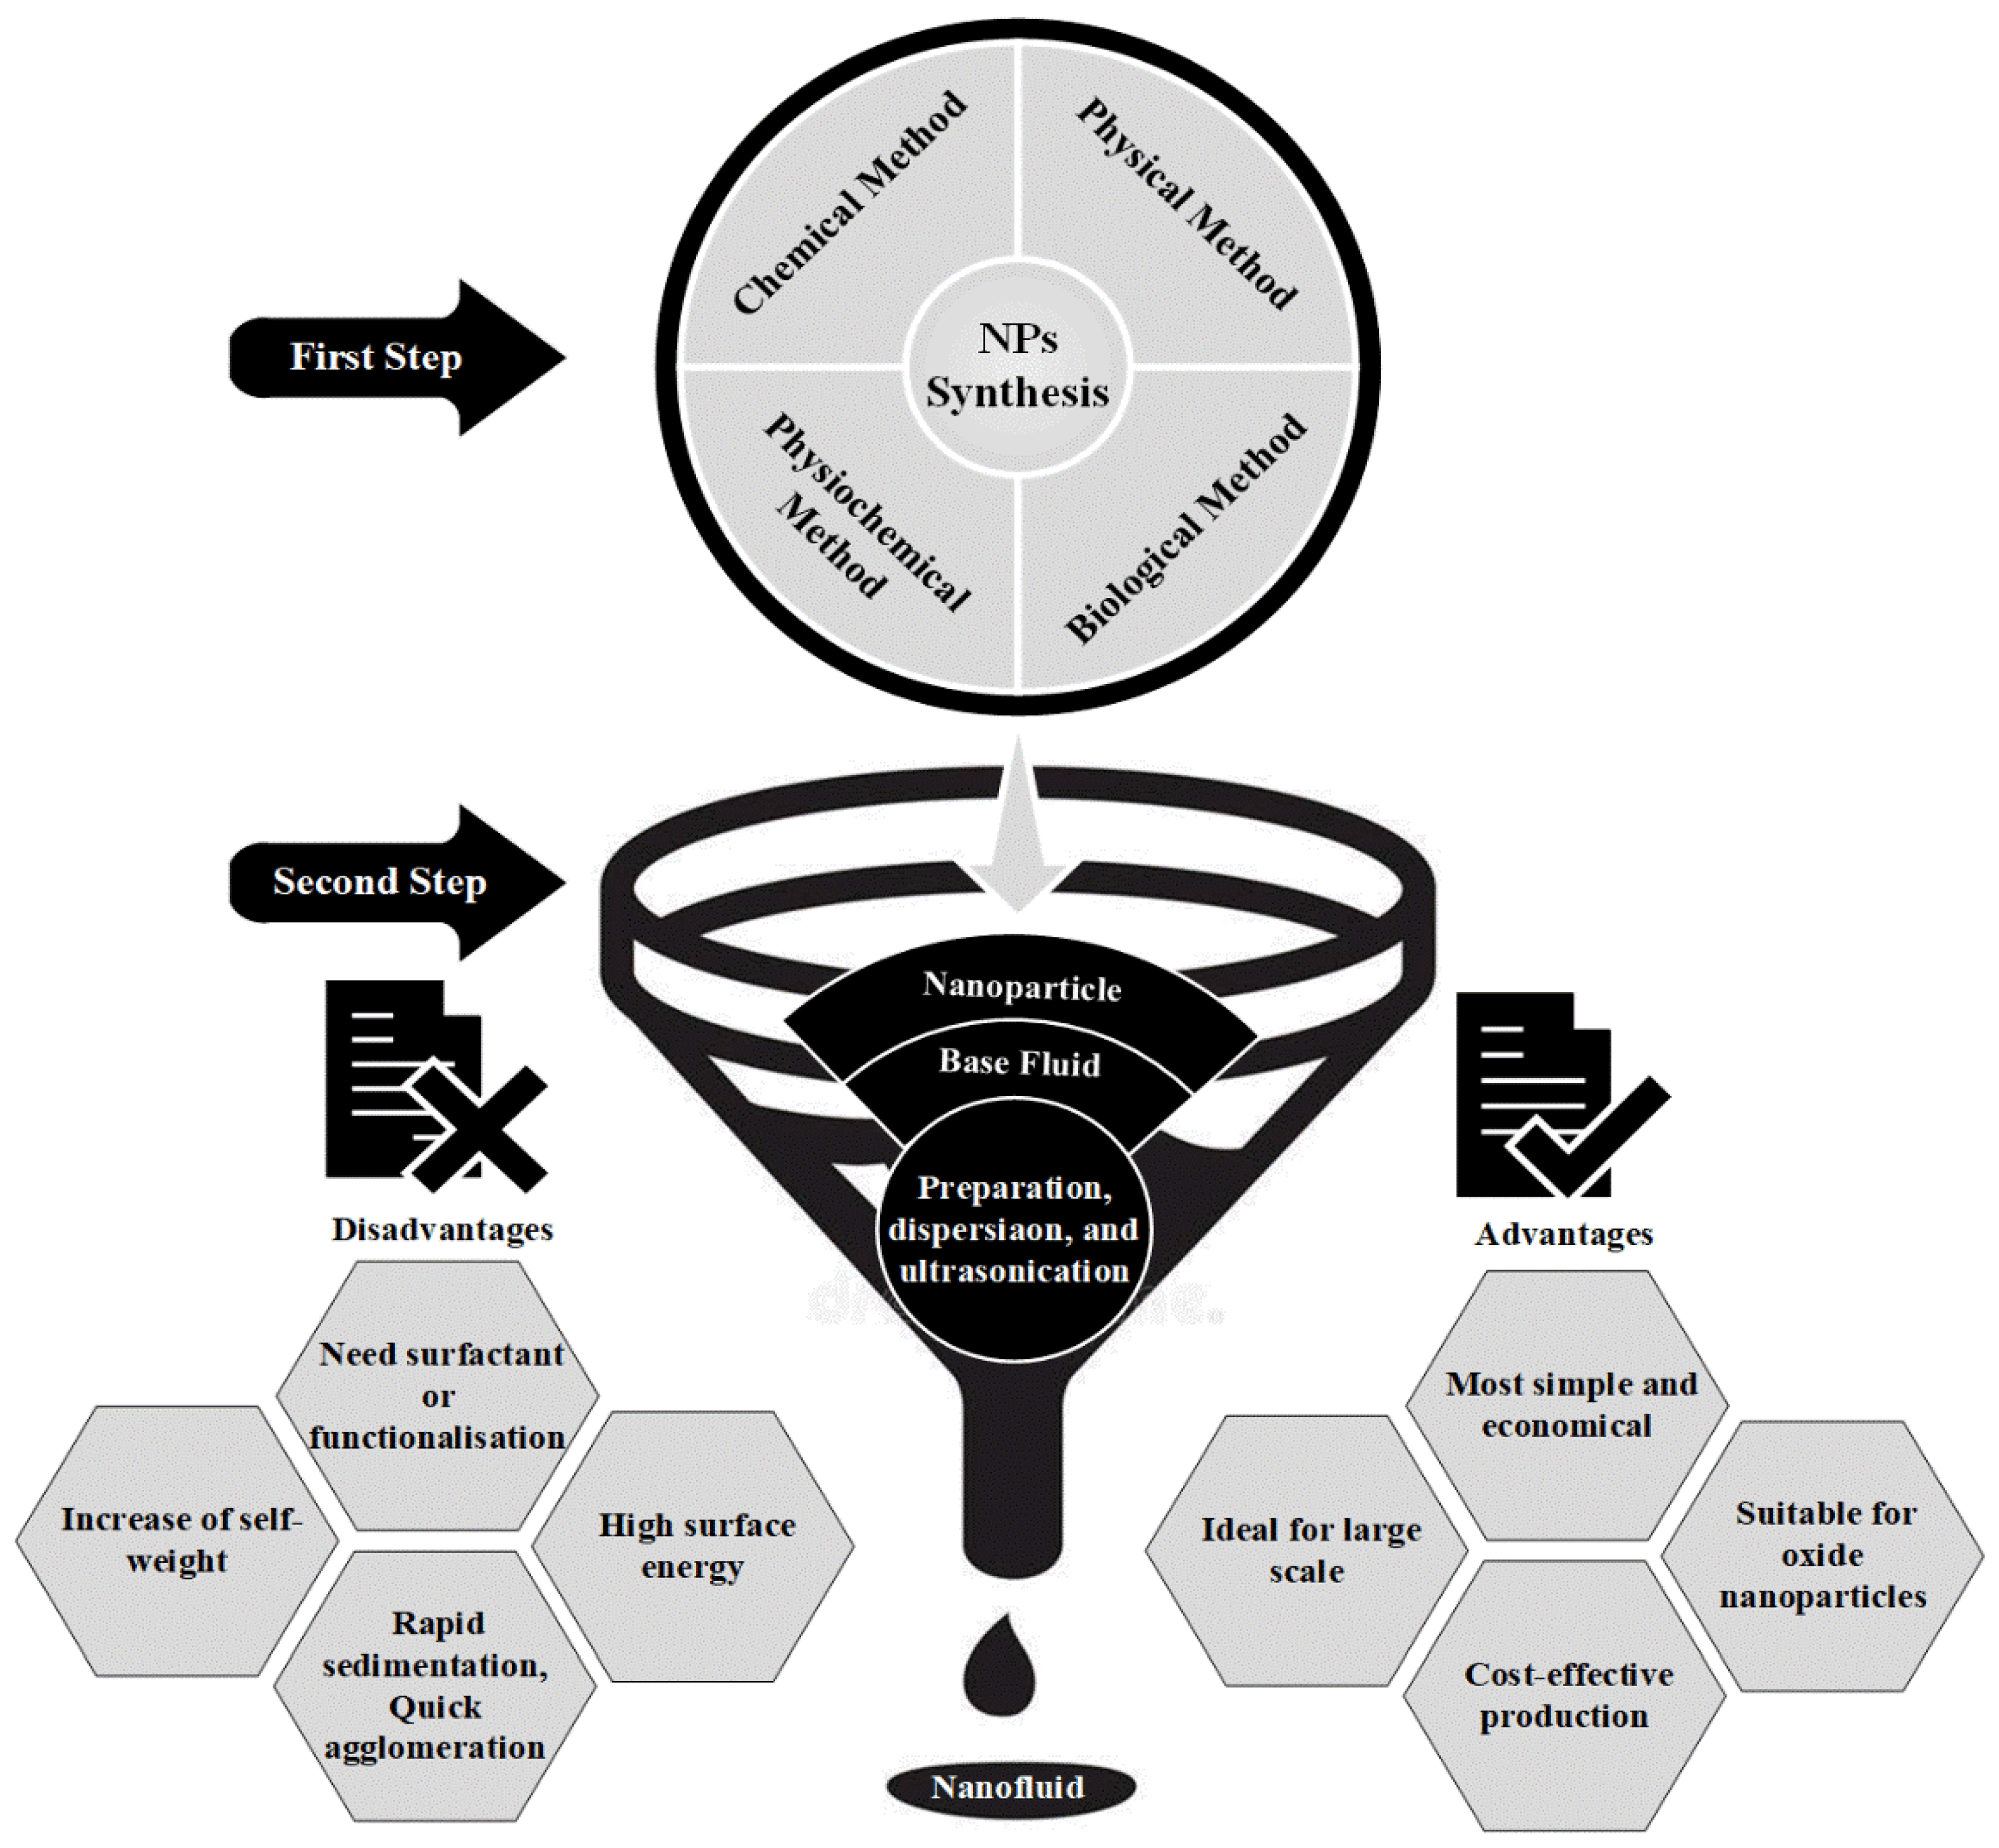
4.2. Two-Step Method
4.3. Concentration
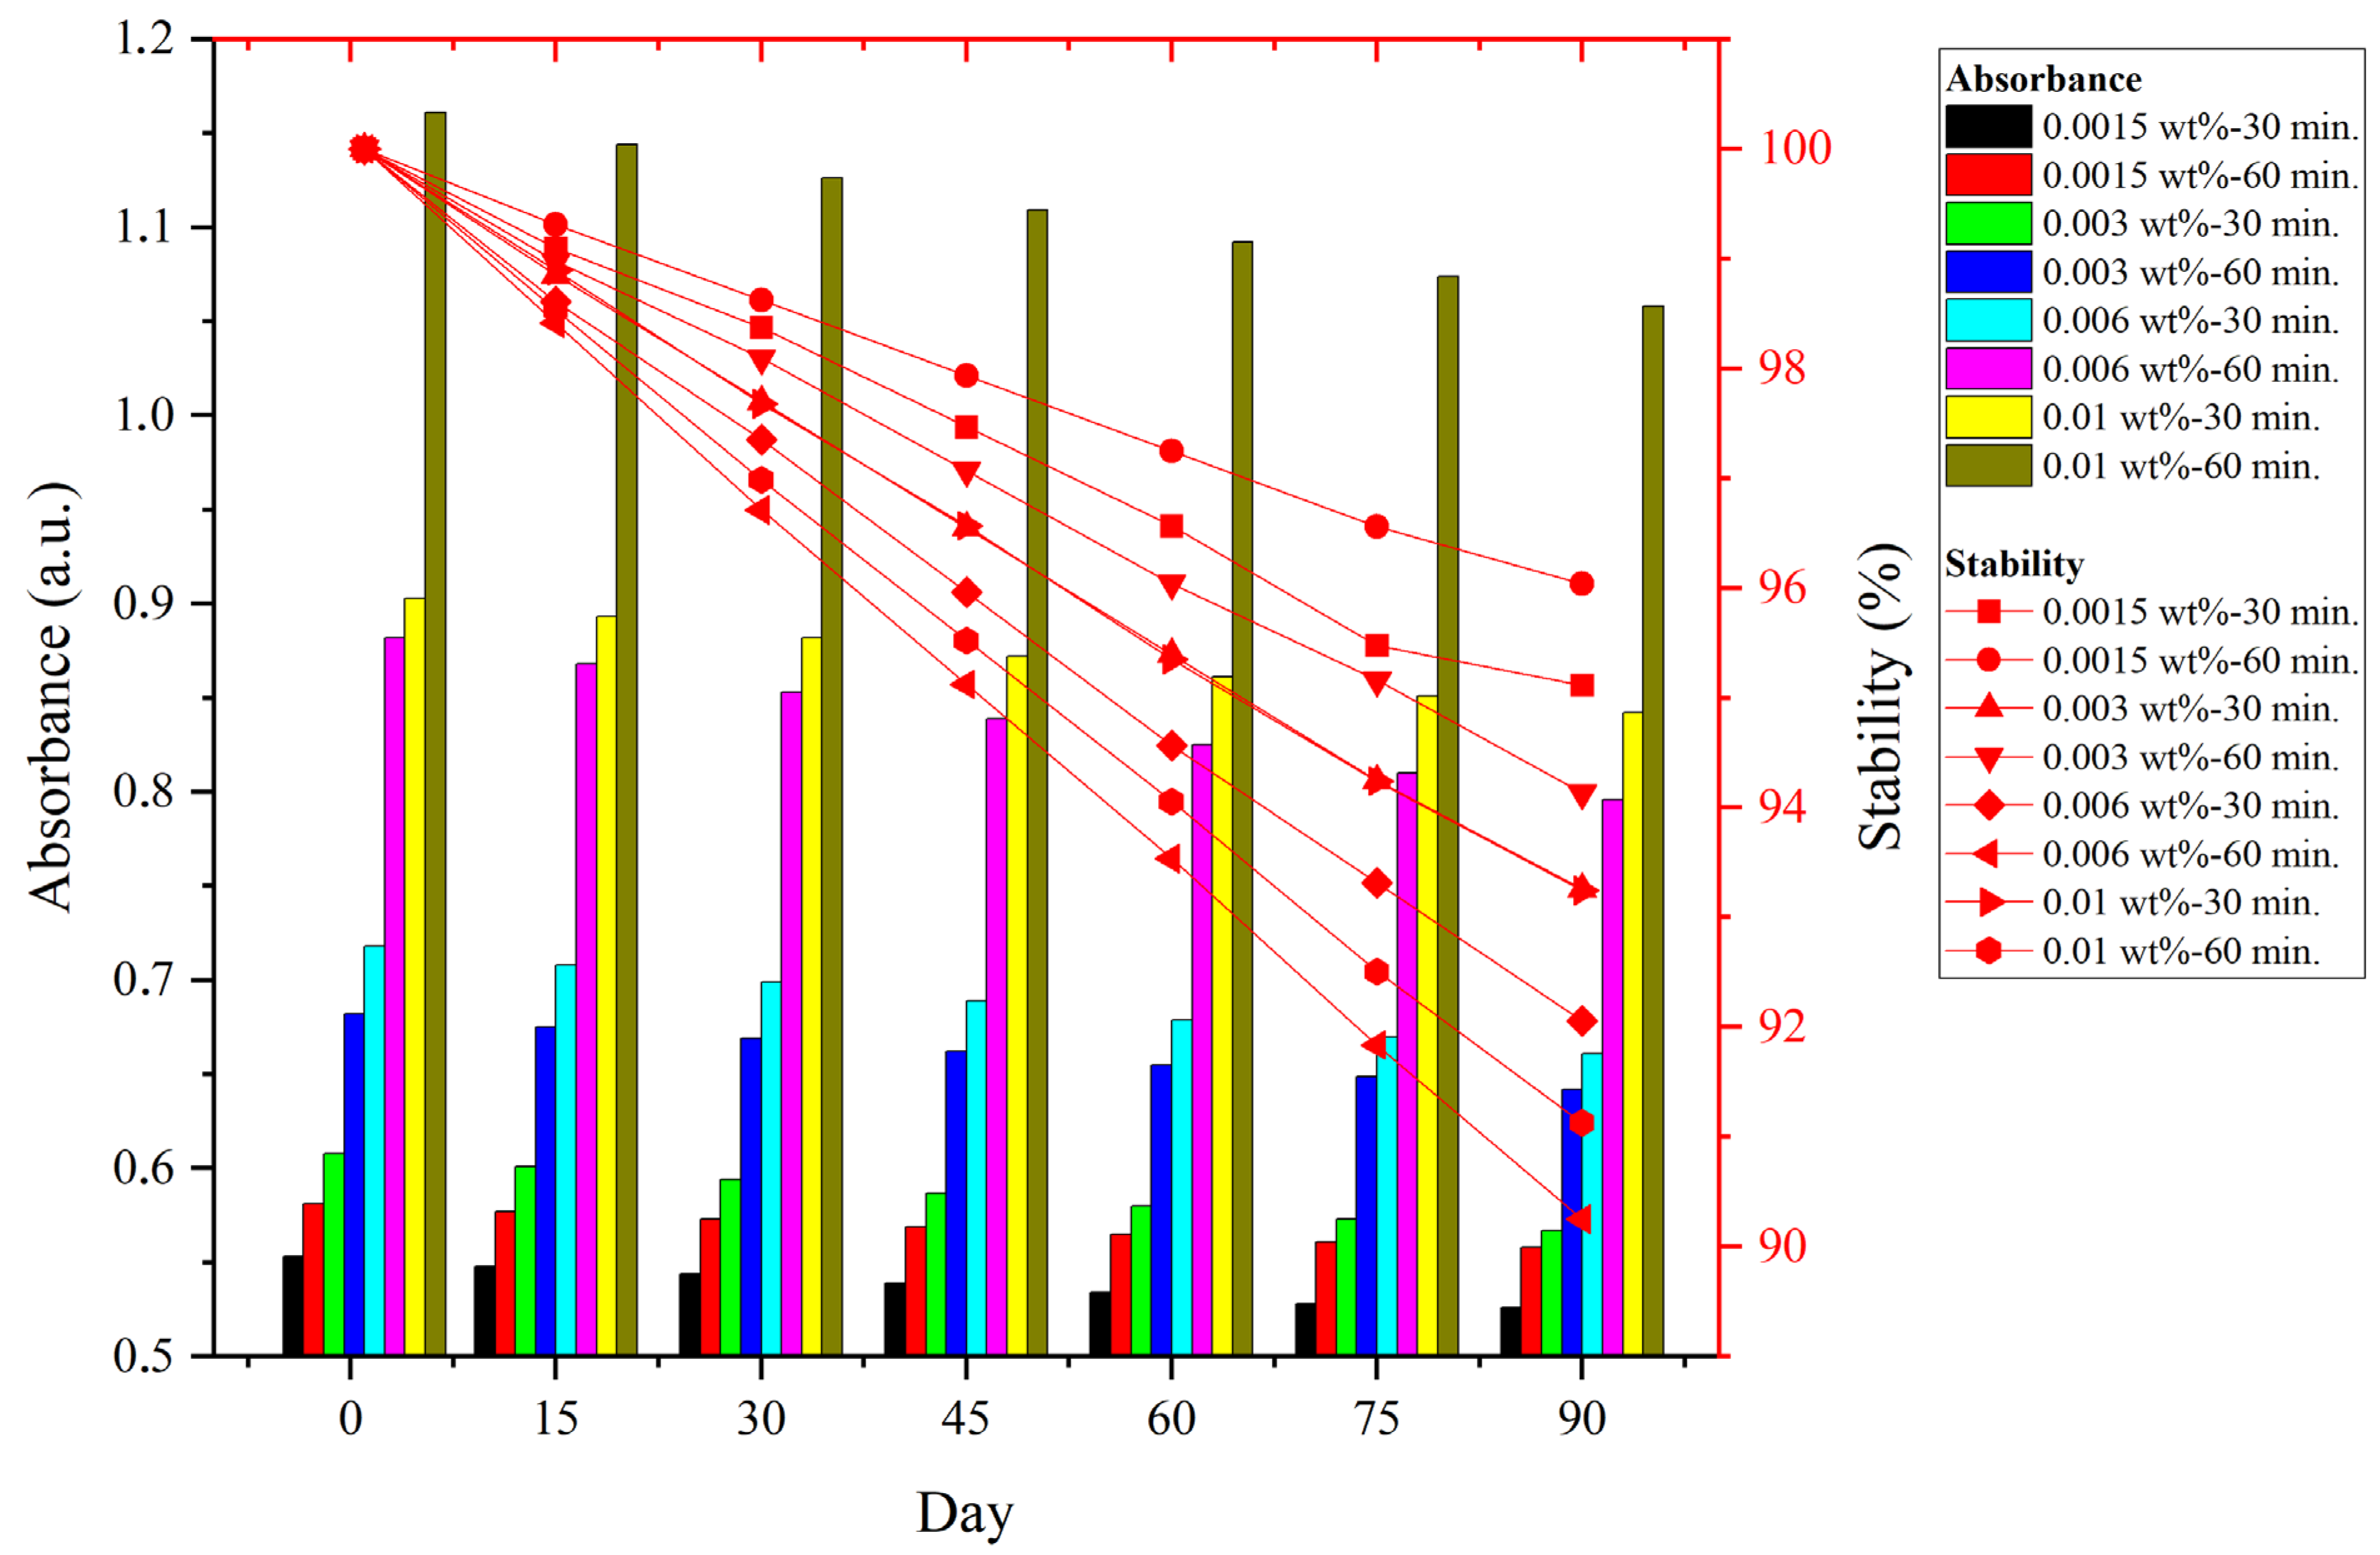
4.4. Stability of NIL
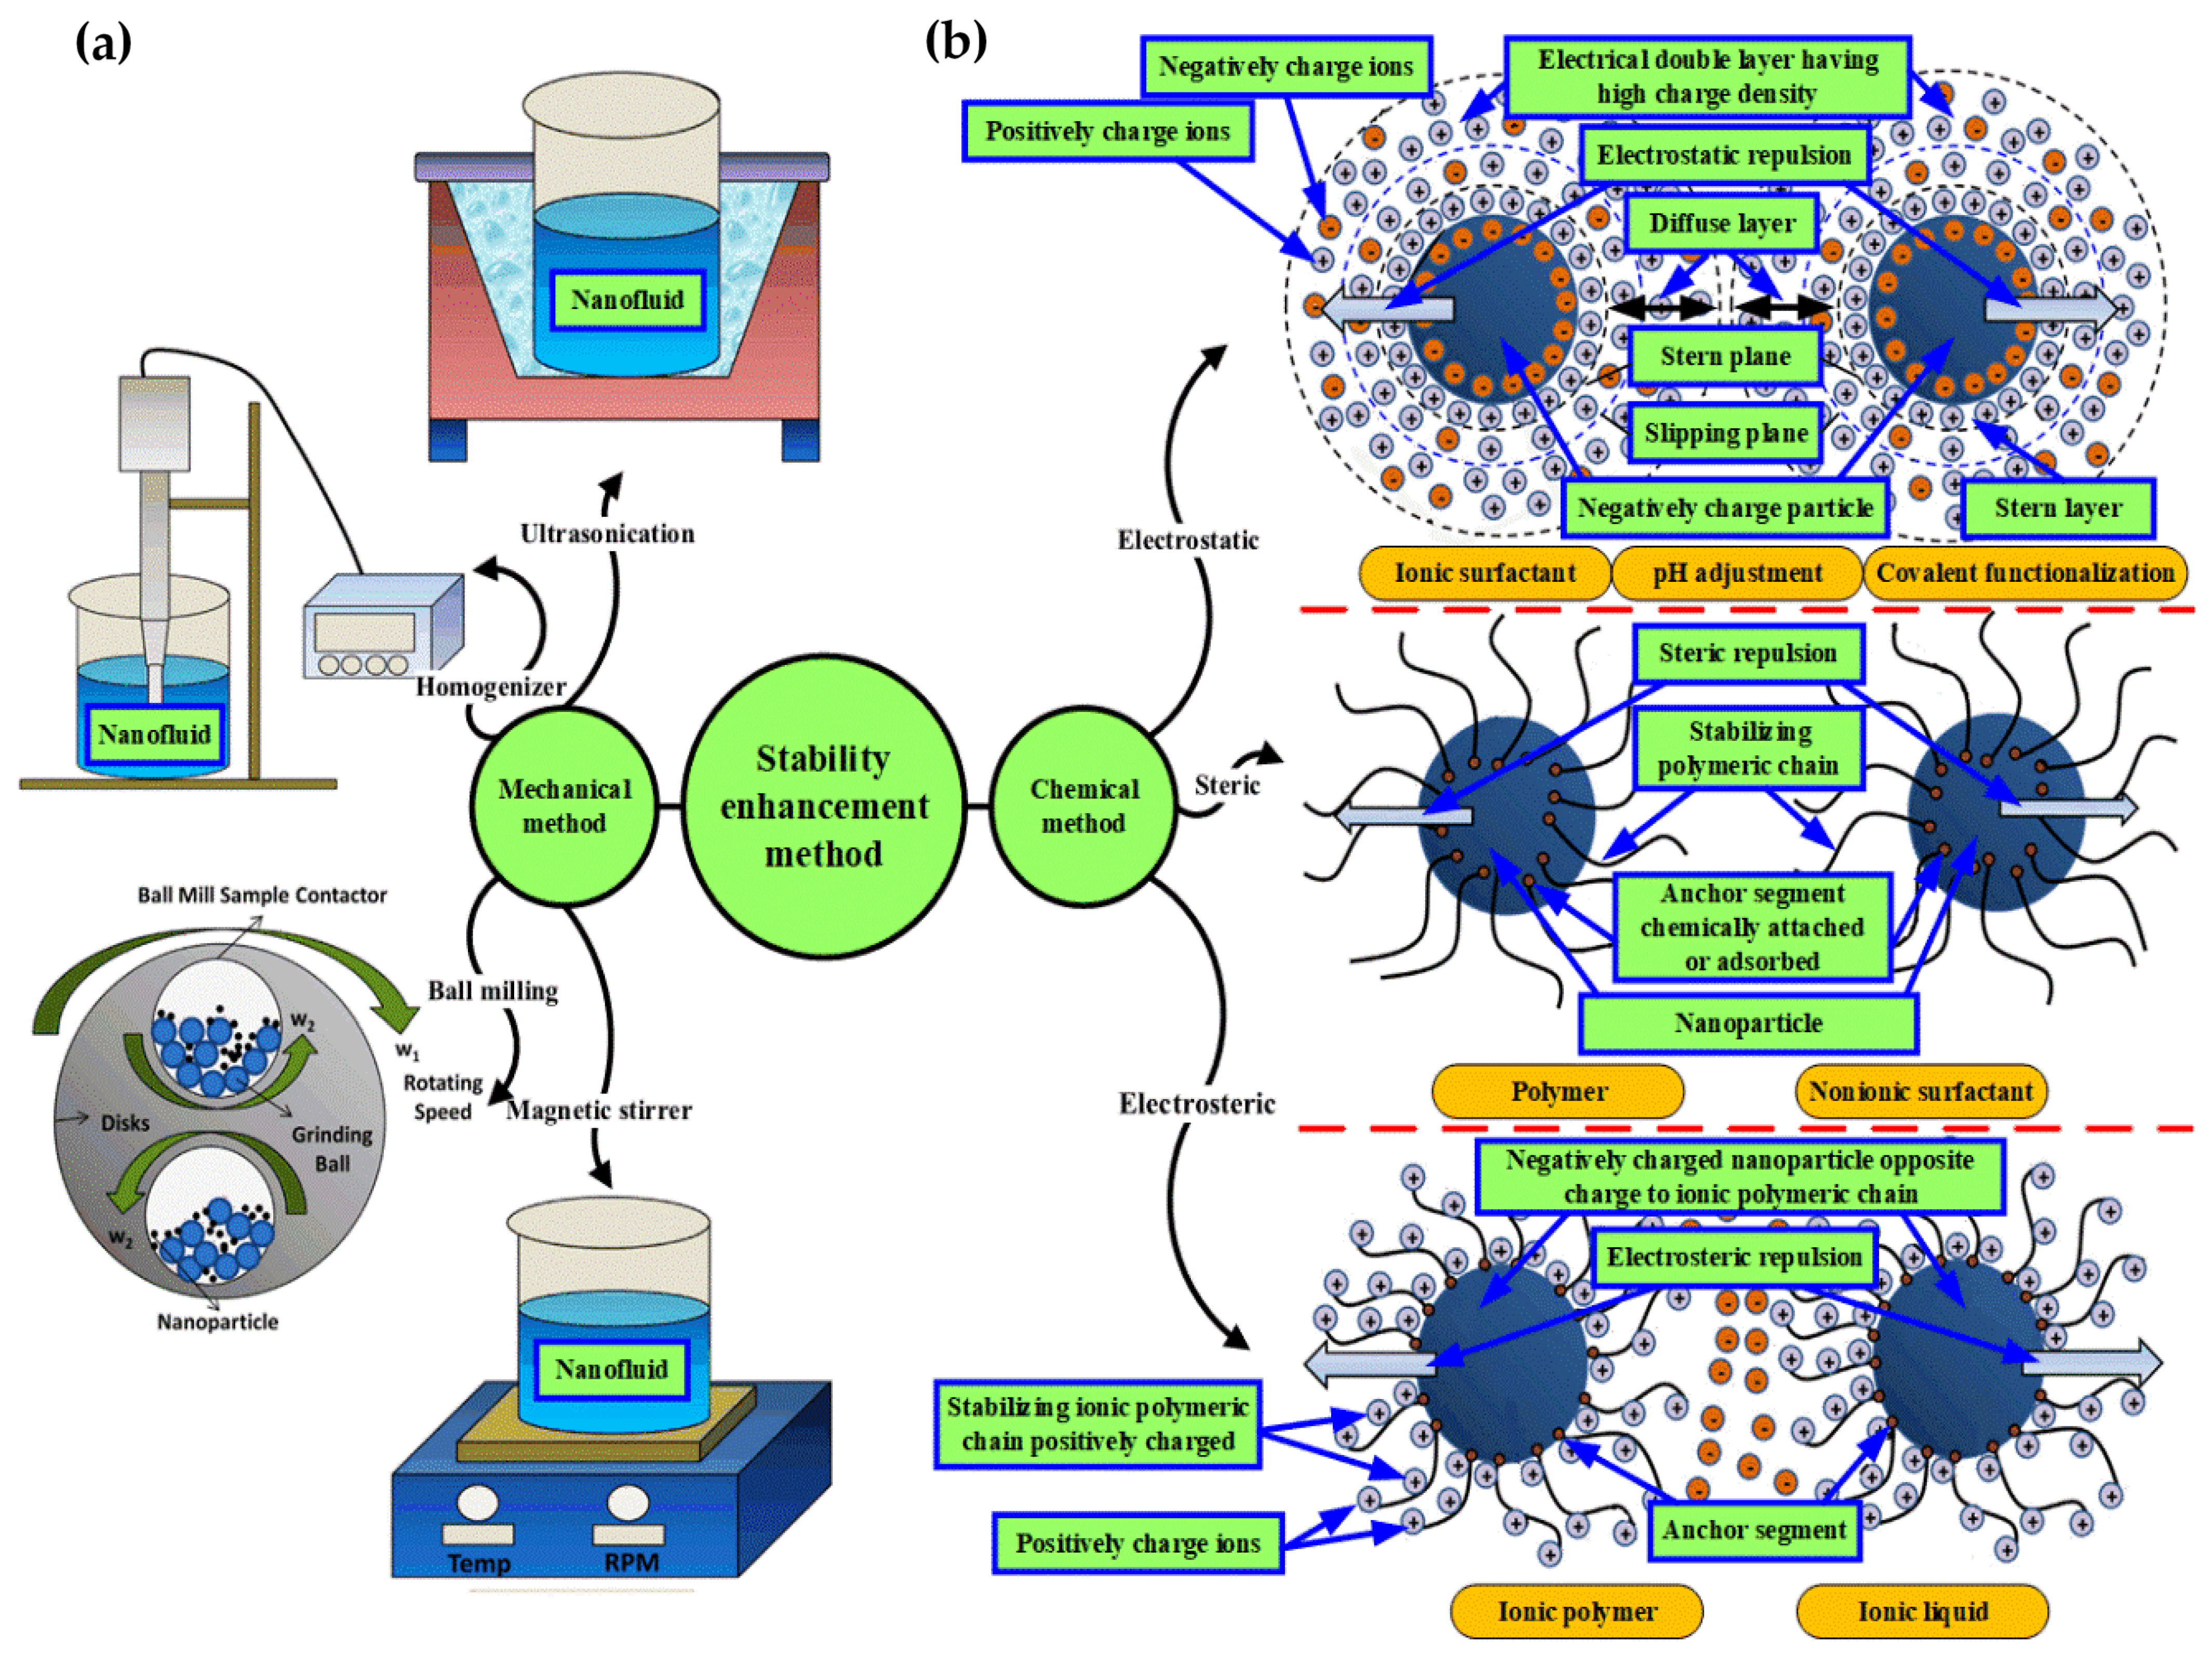
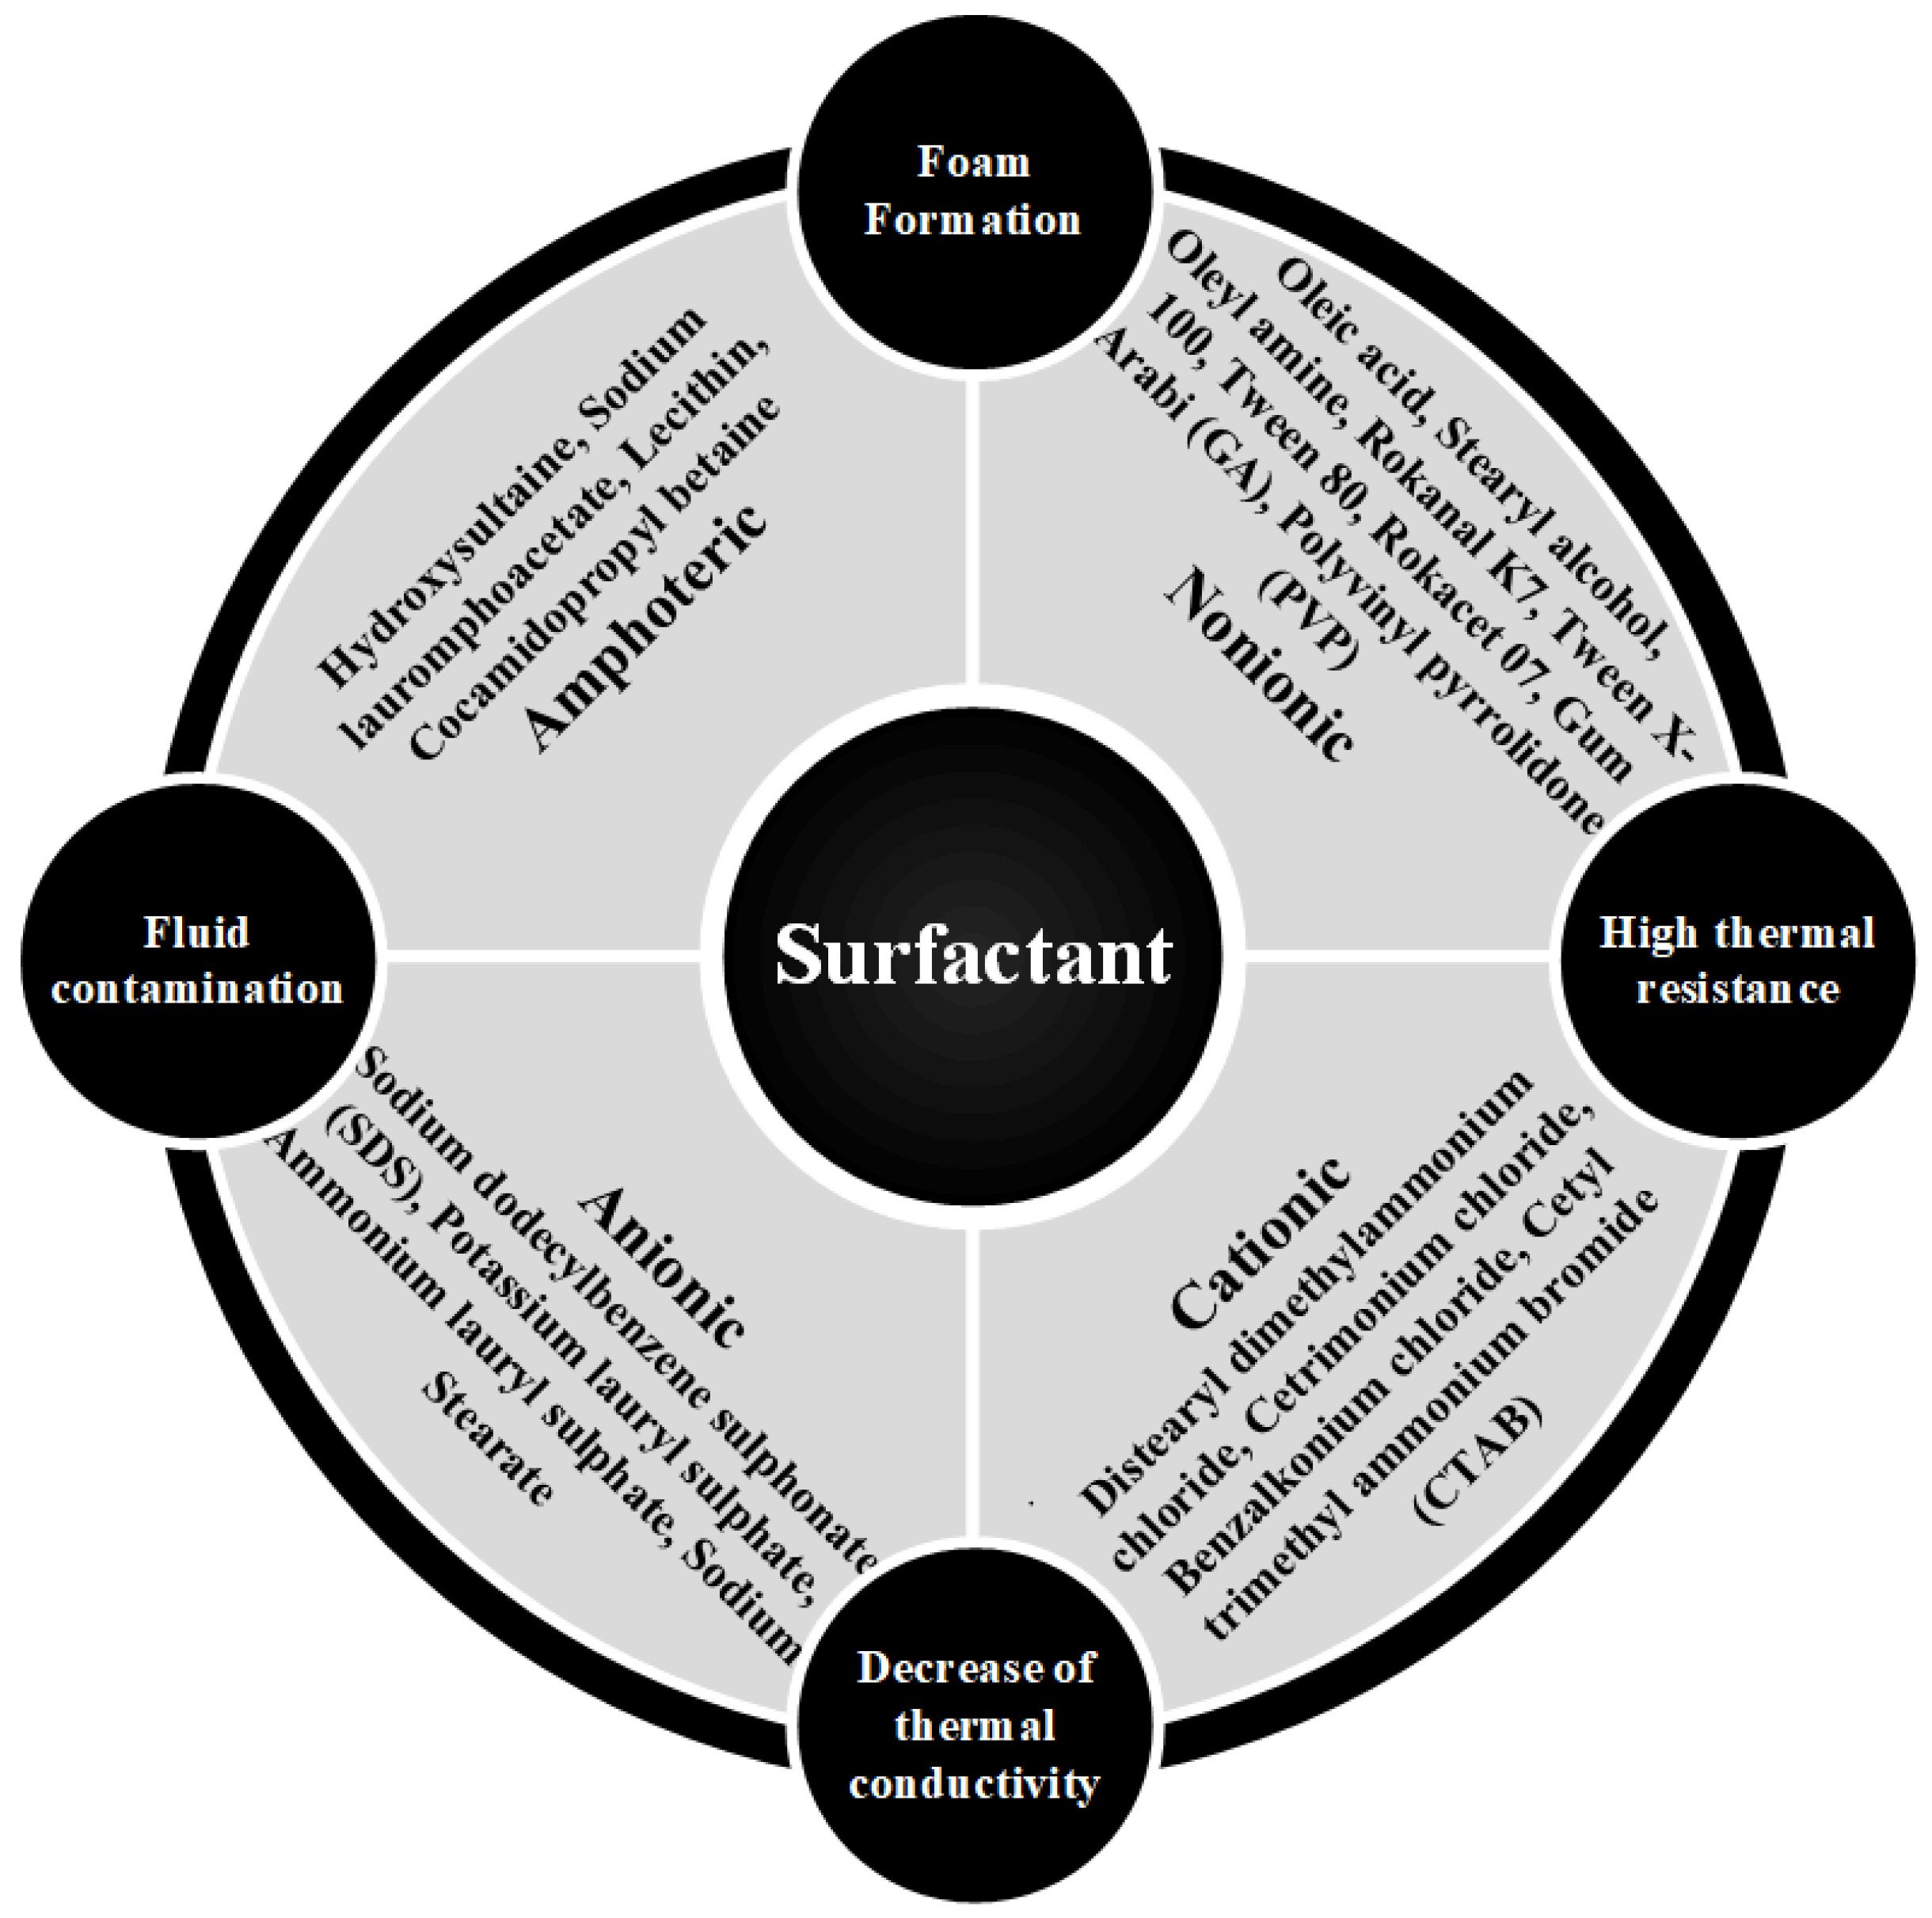
4.5. Stability Enhancement Methods
Mechanical Method
4.6. Stability Enhancement Mechanism
4.7. Stability Evaluation Method
5. Encouraging Significant Discovery
5.1. Flash Point Prediction Method
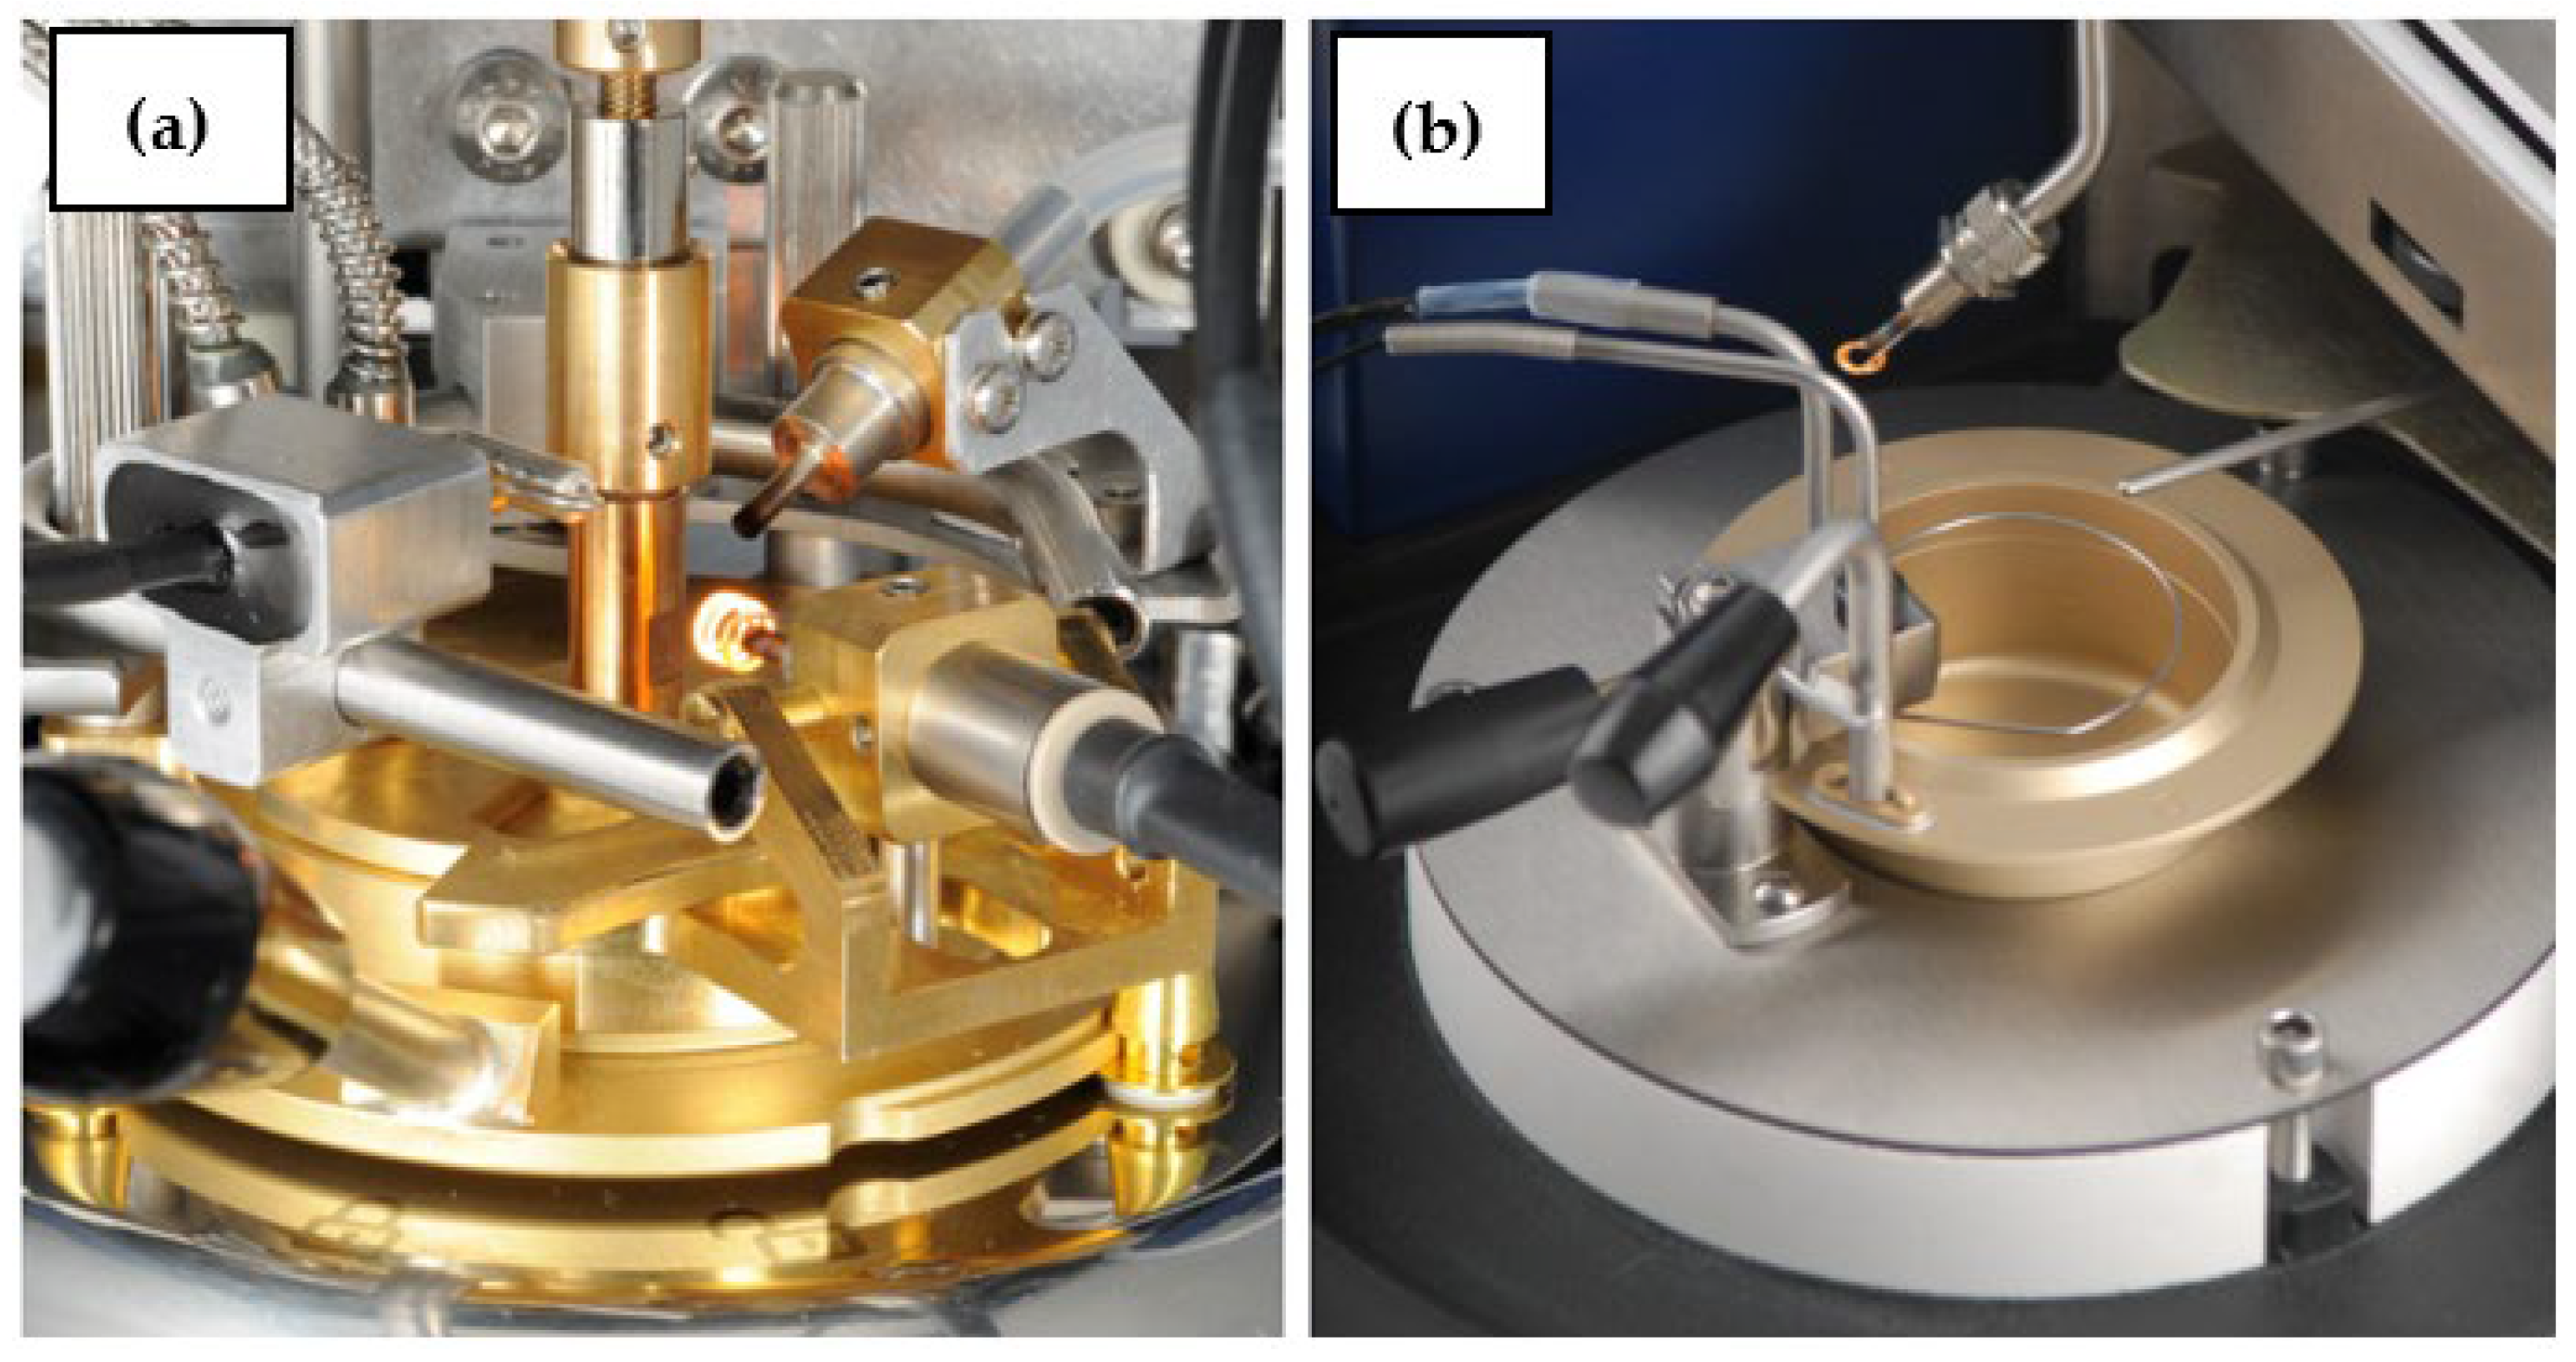
5.2. Flash Point Testing Method

| Ref. | Formula | Aplicability | Variable | Eq. No. |
|---|---|---|---|---|
| [95] | Compounds (FP: 124–204 °C) |
| (15) | |
| [96] | Hydrocarbons (BP: 20–340 °C) |
| (16) | |
| [97] | Hydrocarbon and petroleum fraction (BP greater than 500 °F) |
| (17) | |
| [97] | Hydrocarbon and petroleum fraction (BP greater than 500 °F) |
| (18) | |
| [98] | Organic compounds |
| (19) | |
| [99] | Organic compounds (Tb range: −13.7–365 °C and FP: −69–193 °C) |
| (20) | |
| [100] | Hydrocarbons |
| (21) | |
| [101] | Organic liquid |
| (22) | |
| [102] | Hydrocarbons (BP: 20–340 °C) |
| (23) | |
| [103] | Hydrocarbons |
| (24) | |
| [104] | Compounds |
| (25) | |
| [105] | Hydrocarbons (BP: 200–700 °F) |
| (26) | |
| [106] | Hydrocarbons |
| (27) |
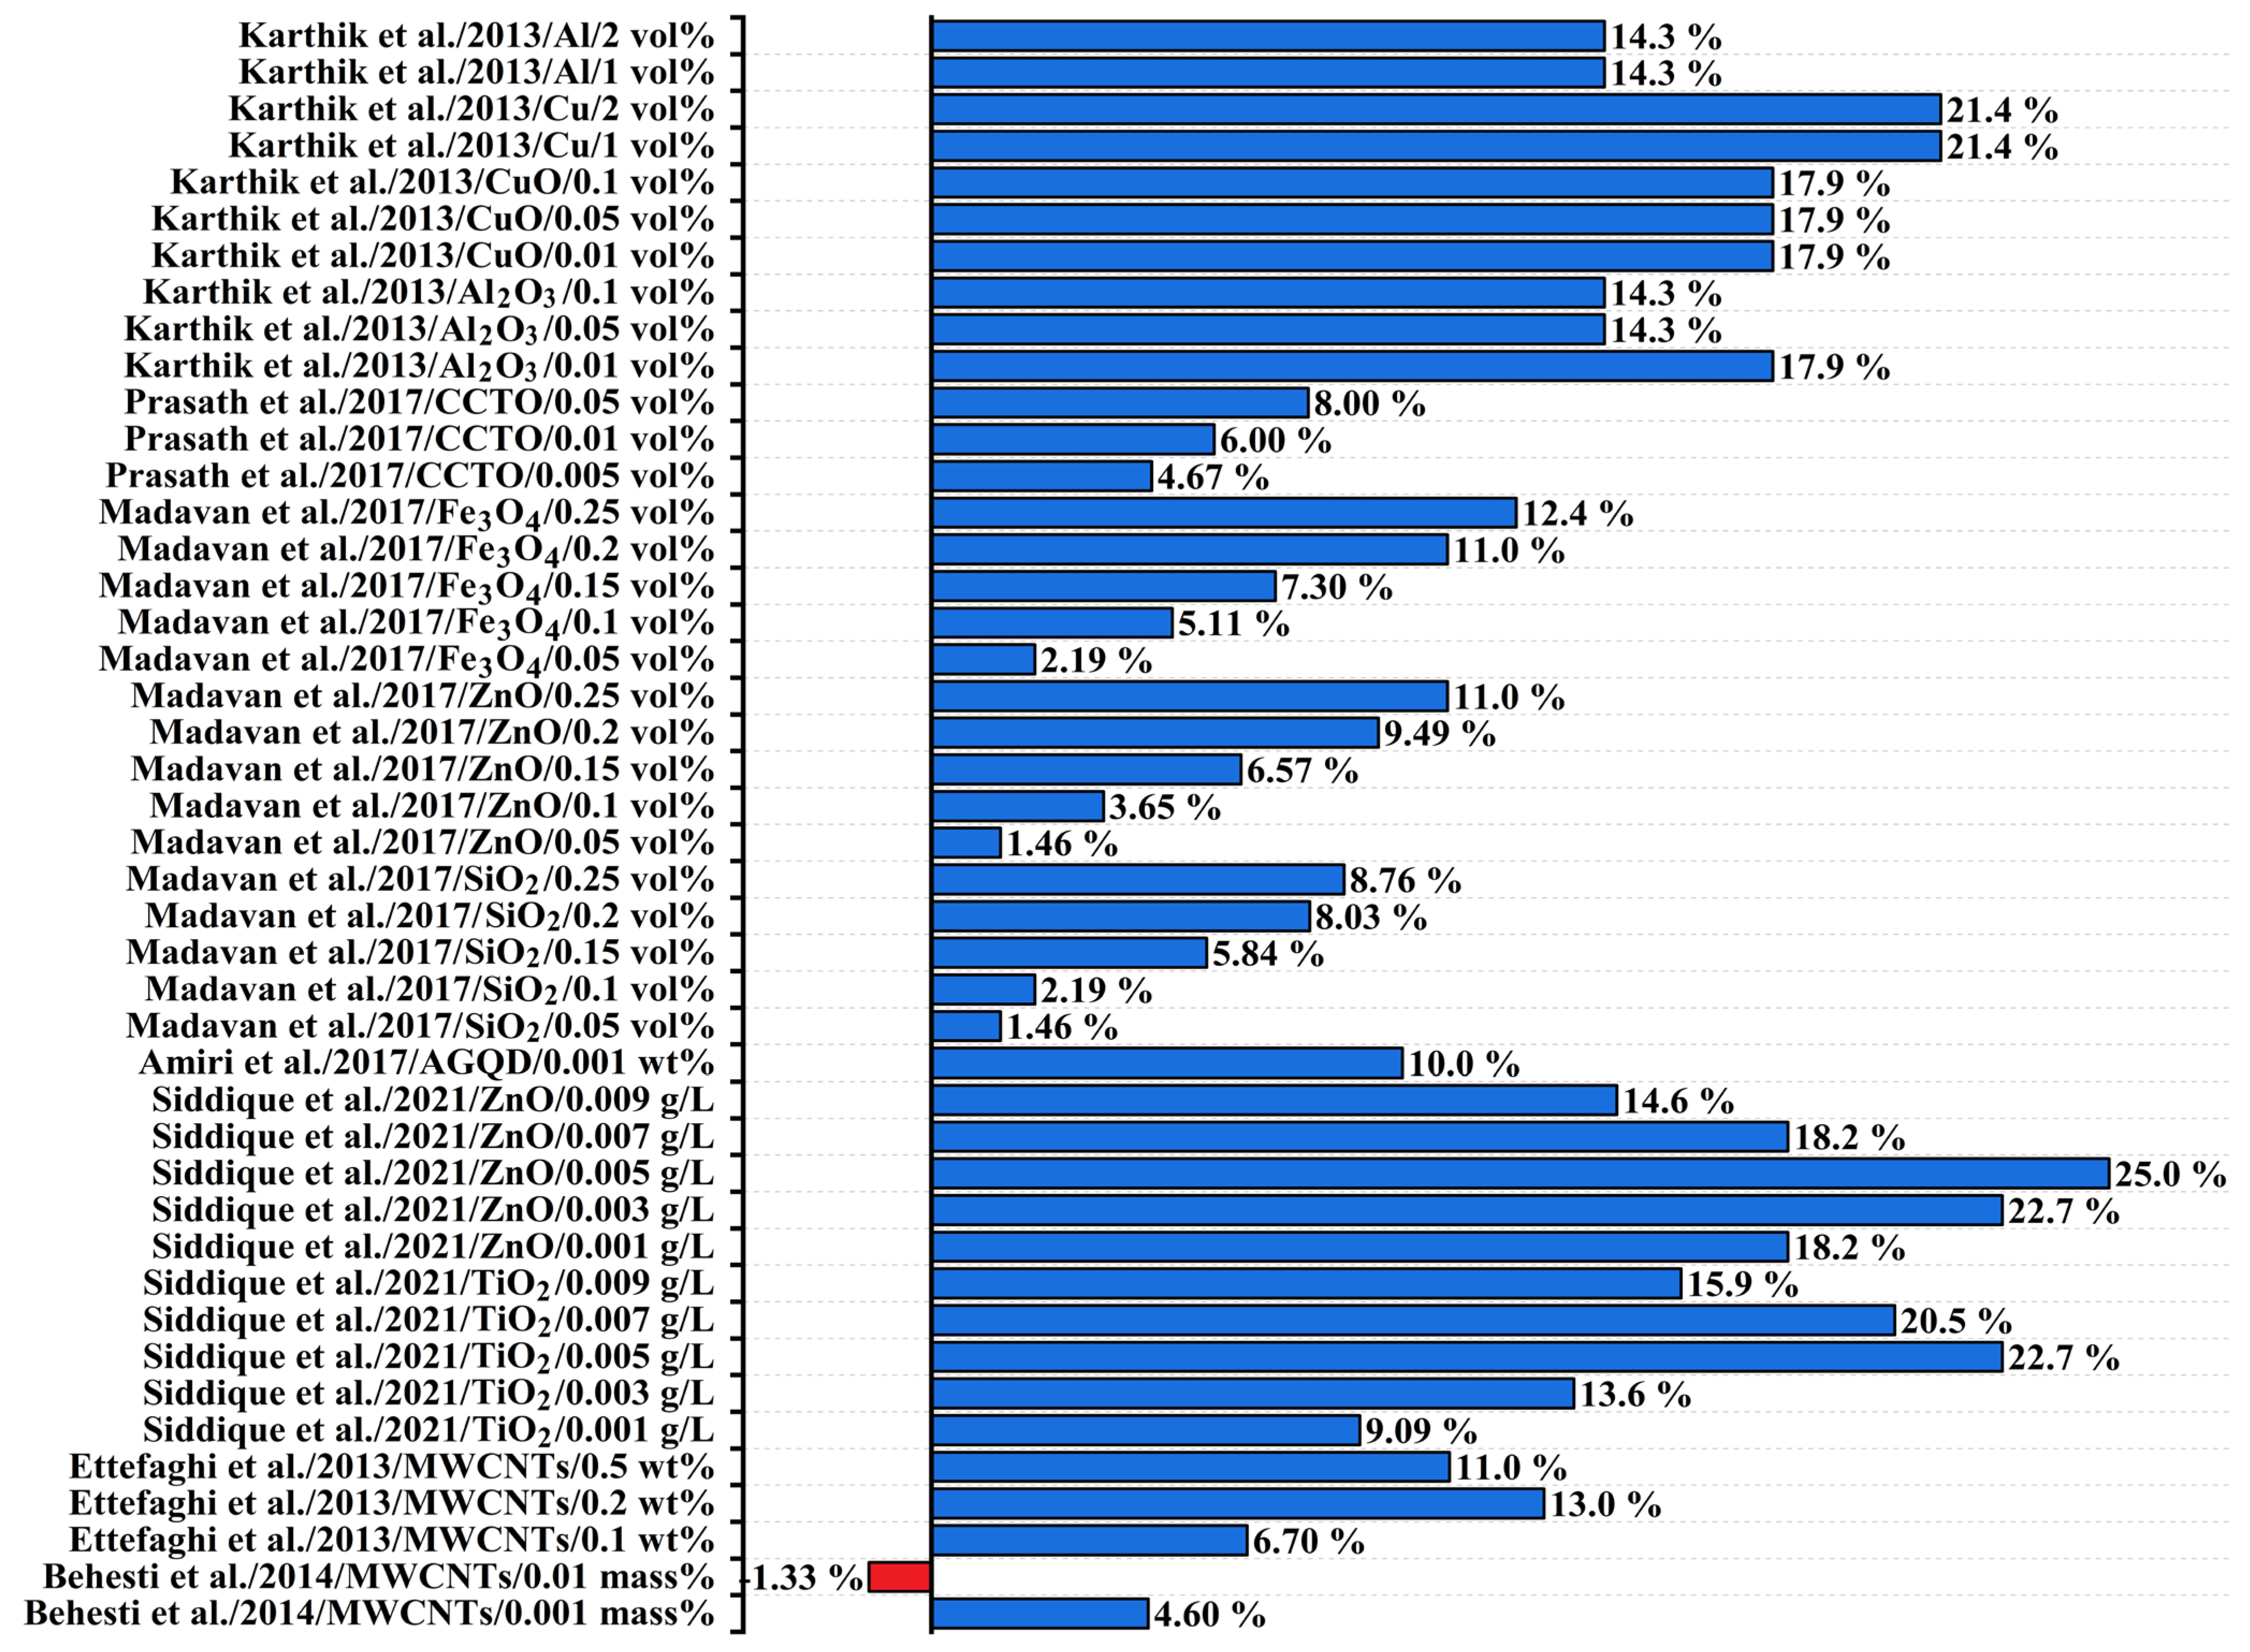
5.3. The Influence of NPs on Flash Point
5.4. Minimizing Fire Risk in Transformers
5.4.1. Detection of Gas Accumulation in Oil
5.4.2. Monitoring Dangerous Gases
5.4.3. Pressure Protection
5.4.4. Fire Prevention
5.5. Research Potential and Future Challenges
6. Conclusions
Author Contributions
Funding
Data Availability Statement
Acknowledgments
Conflicts of Interest
Nomenclature
| MO | Mineral oil |
| TO | Transformer oil |
| NF | Nanofluid |
| NP | Nanoparticle |
| IEC | International Electrotechnical Commission |
| ISO | International Organization for Standardization |
| ASTM | American Society for Testing and Materials |
| C60 | Fullerene |
| GO | Graphene oxide |
| CNTs | Carbon nanotubes |
| Fe3O4 | Iron(II,III) oxide |
| AuNPs | Gold nanoparticles |
| AgNPs | Silver nanoparticles |
| ZnO | Zinc oxide |
| TiO2 | Titanium oxide |
| CdSe | Cadmium selenide |
| Al2O3 | Aluminum oxide |
| CuO | Copper oxide |
| NaOH | Sodium hydroxide |
| NH4OH | Ammonium hydroxide |
| SiO2 | Silicon dioxide |
| AGQD | Amine-treated graphene quantum dots |
| CCTO | Calcium copper titanate |
| TEM | Transmission electron microscopy |
| NIL | Nanoinsulating liquid |
| g/L | Mass-to-volume ratio |
| wt% | Weight percent |
| vol% | Volume percent |
| w | Weight |
| m | Mass |
| bf | Base fluid |
| ρ | Density (kg/m3) |
| ∅ | Concentration symbol for volume fraction |
| BM | Brownian motion |
| Aλ | Absorbance |
| I | Intensity of the laser light beam after passing through the colloidal suspension |
| Io | Intensity of the incident laser light |
| α | Absorptivity |
| c | Concentration of particles |
| DLS | Dynamic light scattering |
| FP | Flash point |
| CST | Stoichiometric concentration |
| C | Carbon |
| S | Sulfur |
| O | Oxygen |
| H | Hydrogen |
| X | Halogen |
| BP | Boiling point |
| Tb | Normal boiling point |
| sg | Specific gravity (m/s2) |
References
- Benamor, A.; Nasser, M.; Al-Marri, M.J. Gas Processing Technology-Treatment and Utilization. In Encyclopedia of Sustainable Technologies; Elsevier: Amsterdam, The Netherlands, 2017; pp. 359–387. [Google Scholar] [CrossRef]
- Raj, R.A.; Samikannu, R.; Yahya, A.; Mosalaosi, M. Enhancement of dielectric properties of Baobab Oil and Mongongo Oil using cost-effective additive for power transformer insulating fluids. Environ. Technol. Innov. 2020, 20, 101150. [Google Scholar] [CrossRef]
- N’cho, J.; Fofana, I.; Hadjadj, Y.; Beroual, A. Review of Physicochemical-Based Diagnostic Techniques for Assessing Insulation Condition in Aged Transformers. Energies 2016, 9, 367. [Google Scholar] [CrossRef]
- Adekunle, A.A.; Oparanti, S.O. A Review on Physicochemical and Electrical Performance of Vegetable Oil-Based Nanofluids for High Voltage Equipment. Electr. Power Syst. Res. 2023, 214, 108873. [Google Scholar] [CrossRef]
- Hoole, P.R.P.; Rufus, S.A.; Hashim, N.I.B.; Saadd, M.H.I.B.; Abdullah, A.S.b.; Othman, A.-K.H.; Piralaharan, K.; Vaithilingam, C.A.; Hoole, S.R.H. Power Transformer Fire and Explosion: Causes and Control. Int. J. Control Theory Appl. 2017, 10, 211–220. [Google Scholar]
- Tenbohlen, S.; Hanif, Z.; Martin, D. Analysis of Major Failures of Power Transformers. In Proceedings of the Cigre SC A2 & 6th International Colloquium Transformer Research and Asset Management (ICTRAM), Split, Croatia, 29 November–2 December 2023. [Google Scholar]
- Zile, M. Analysis of the Failures in Power Transformers. Aksaray Univ. J. Sci. Eng. 2020, 4, 19–29. [Google Scholar] [CrossRef]
- Muller, S.; Boiarciuc, M.P.; Perigaud, G. Protection of oil-filled Transformer against Explosion: Numerical Simulations on a 200 MVA Transformer. In Proceedings of the 2009 IEEE Bucharest Power Tech Conference, Bucharest, Romania, 28 June–2 July 2009. [Google Scholar]
- Mahanta, D.K.; Laskar, S. Electrical insulating liquid: A review. J. Adv. Dielectr. 2017, 7, 1730001. [Google Scholar] [CrossRef]
- Khan, I.; Saeed, K.; Khan, I. Nanoparticles: Properties, applications and toxicities. Arab. J. Chem. 2019, 12, 908–931. [Google Scholar] [CrossRef]
- Abid, N.; Khan, A.M.; Shujait, S.; Chaudhary, K.; Ikram, M.; Imran, M.; Haider, J.; Khan, M.; Khan, Q.; Maqbool, M. Synthesis of nanomaterials using various top-down and bottom-up approaches, influencing factors, advantages, and disadvantages: A review. Adv. Colloid Interface Sci. 2022, 300, 102597. [Google Scholar] [CrossRef]
- IEC 60156:2018; Insulating Liquids—Determination of the Breakdown Voltage at Power Frequency—Test Method. International Electrotechnical Commission (IEC): London, UK, 2018.
- IEC 60247:2004; Insulating Liquids—Measurement of Relative Permittivity, Dielectric Dissipation Factor (tan δ) and D.C. Resistivity. International Electrotechnical Commission (IEC): London, UK, 2004.
- ISO 3104:2020; Petroleum Products—Transparent and Opaque Liquids—Determination of Kinematic Viscosity and Calculation of Dynamic Viscosity. International Organization for Standardization (ISO): Geneva, Switzerland, 2020.
- ISO 3106:2019; Petroleum Products—Determination of Pour Point. International Organization for Standardization (ISO): Geneva, Switzerland, 2019.
- ISO 2592:2017; Petroleum and Related Products—Determination of Flash and Fire Points—Cleveland Open Cup Method. International Organization for Standardization (ISO): Geneva, Switzerland, 2017.
- ISO 3675:1998; Crude Petroleum and Liquid Petroleum Products—Laboratory Determination of Density—Hydrometer Method. International Organization for Standardization (ISO): Geneva, Switzerland, 1998.
- ASTM E1269-11; Standard Test Method for Determining Specific Heat Capacity by Differential Scanning Calorimetry. American Standard Testing and Material (ASTM): West Conshohocken, PA, USA, 2011.
- ASTM D7896-19; Standard Test Method for Thermal Conductivity, Thermal Diffusivity, and Volumetric Heat Capacity of Engine Coolants and Related Fluids by Transient Hot Wire Liquid Thermal Conductivity Method. American Standard Testing and Material (ASTM): West Conshohocken, PA, USA, 2019.
- Rao, N.; Singh, R.; Bashambu, L. Carbon-based nanomaterials: Synthesis and prospective applications. Mater. Today Proc. 2021, 44, 608–614. [Google Scholar] [CrossRef]
- Younis, N.K.; Ghoubaira, J.A.; Bassil, E.P.; Tantawi, H.N.; Eid, A.H. Metal-based nanoparticles: Promising tools for the management of cardiovascular diseases. Nanomed. Nanotechnol. Biol. Med. 2021, 36, 102433. [Google Scholar] [CrossRef]
- Terna, A.D.; Elemike, E.E.; Mbonu, J.I.; Osafile, O.E.; Ezeani, R.O. The future of semiconductors nanoparticles: Synthesis, properties and applications. Mater. Sci. Eng. B 2021, 272, 115363. [Google Scholar] [CrossRef]
- Omanović-Mikličanin, E.; Badnjević, A.; Kazlagić, A.; Hajlovac, M. Nanocomposites: A brief review. Health Technol. 2019, 10, 51–59. [Google Scholar] [CrossRef]
- Joudeh, N.; Linke, D. Nanoparticle classification, physicochemical properties, characterization, and applications: A comprehensive review for biologists. J. Nanobiotechnol. 2022, 20, 262. [Google Scholar] [CrossRef]
- Baig, N.; Kammakakam, I.; Falath, W. Nanomaterials: A review of synthesis methods, properties, recent progress, and challenges. Mater. Adv. 2021, 2, 1821–1871. [Google Scholar] [CrossRef]
- Asadi, A.; Aberoumand, S.; Moradikazerouni, A.; Pourfattah, F.; Żyła, G.; Estellé, P.; Mahian, O.; Wongwises, S.; Nguyen, H.M.; Arabkoohsar, A. Recent advances in preparation methods and thermophysical properties of oil-based nanofluids: A state-of-the-art review. Powder Technol. 2019, 352, 209–226. [Google Scholar] [CrossRef]
- Kalsi, S.; Kumar, S.; Kumar, A.; Alam, T.; Dobrotă, D. Thermophysical properties of nanofluids and their potential applications in heat transfer enhancement: A review. Arab. J. Chem. 2023, 16, 105272. [Google Scholar] [CrossRef]
- Bakthavatchalam, B.; Habib, K.; Saidur, R.; Saha, B.B.; Irshad, K. Comprehensive study on nanofluid and ionanofluid for heat transfer enhancement: A review on current and future perspective. J. Mol. Liq. 2020, 305, 112787. [Google Scholar] [CrossRef]
- Rafiq, M.; Lv, Y.; Li, C. A Review on Properties, Opportunities, and Challenges of Transformer Oil-Based Nanofluids. J. Nanomater. 2016, 2016, 8371560. [Google Scholar] [CrossRef]
- Wilk, J.; Smusz, R.; Grosicki, S. Thermophysical properties of water-based Cu nanofluid used in special type of coil heat exchanger. Appl. Therm. Eng. 2017, 127, 933–943. [Google Scholar] [CrossRef]
- Li, F.; Li, L.; Zhong, G.; Zhai, Y.; Li, Z. Effects of ultrasonic time, size of aggregates and temperature on the stability and viscosity of Cu-ethylene glycol (EG) nanofluids. Int. J. Heat Mass Transf. 2019, 129, 278–286. [Google Scholar] [CrossRef]
- Li, Y.; Chen, X.; Wu, Y.; Lu, Y.; Zhi, R.; Wang, X.; Ma, C. Experimental study on the effect of SiO2 nanoparticle dispersion on the thermophysical properties of binary nitrate molten salt. Sol. Energy 2019, 183, 776–781. [Google Scholar] [CrossRef]
- Kannaiyan, S.; Boobalan, C.; Umasankaran, A.; Ravirajan, A.; Sathyan, S.; Thomas, T. Comparison of experimental and calculated thermophysical properties of alumina/cupric oxide hybrid nanofluids. J. Mol. Liq. 2017, 244, 469–477. [Google Scholar] [CrossRef]
- Moldoveanu, G.M.; Huminic, G.; Minea, A.A.; Huminic, A. Experimental study on thermal conductivity of stabilized Al2O3 and SiO2 nanofluids and their hybrid. Int. J. Heat Mass Transf. 2018, 127, 450–457. [Google Scholar] [CrossRef]
- Sai Bhargava Reddy, M.; Jayarambabu, N.; Kiran Kumar Reddy, R.; Kailasa, S.; Venkateswara Rao, K. Study of acoustic and thermodynamic factors of synthesized ZnO-water nanofluid by ultrasonic technique. Mater. Today Proc. 2020, 26, 25–30. [Google Scholar] [CrossRef]
- Radkar, R.N.; Bhanvase, B.A.; Barai, D.P.; Sonawane, S.H. Intensified convective heat transfer using ZnO nanofluids in heat exchanger with helical coiled geometry at constant wall temperature. Mater. Sci. Energy Technol. 2019, 2, 161–170. [Google Scholar] [CrossRef]
- Dalkılıç, A.S.; Yalçın, G.; Küçükyıldırım, B.O.; Öztuna, S.; Akdoğan Eker, A.; Jumpholkul, C.; Nakkaew, S.; Wongwises, S. Experimental study on the thermal conductivity of water-based CNT-SiO2 hybrid nanofluids. Int. Commun. Heat Mass Transf. 2018, 99, 18–25. [Google Scholar] [CrossRef]
- Kakavandi, A.; Akbari, M. Experimental investigation of thermal conductivity of nanofluids containing of hybrid nanoparticles suspended in binary base fluids and propose a new correlation. Int. J. Heat Mass Transf. 2018, 124, 742–751. [Google Scholar] [CrossRef]
- Lanjwani, H.B.; Kamboh, S.A.; Anwar, M.I.; Alahmadi, H.; Ambreen, T.; Shehzad, S.A. Stability analysis of stratified radiative non-Newtonian Casson nanofluid flow past on stretching/shrinking sheet using two-phase model. Chin. J. Phys. 2023, 85, 752–775. [Google Scholar] [CrossRef]
- Tawade, J.V.; Guled, C.N.; Noeiaghdam, S.; Fernandez-Gamiz, U.; Govindan, V.; Balamuralitharan, S. Effects of thermophoresis and Brownian motion for thermal and chemically reacting Casson nanofluid flow over a linearly stretching sheet. Results Eng. 2022, 15, 100448. [Google Scholar] [CrossRef]
- Farade, R.A.; Wahab, N.I.A.; Mansour, D.-E.A.; Azis, N.B.; Jasni, J.B.; Veerasamy, V.; Thirumeni, M.; Irudayaraj, A.X.R.; Murthy, A.S. Investigation of the Effect of Sonication Time on Dispersion Stability, Dielectric Properties, and Heat Transfer of Graphene Based Green Nanofluids. IEEE Access 2021, 9, 50607–50623. [Google Scholar] [CrossRef]
- Hwang, Y.; Lee, J.K.; Lee, C.H.; Jung, Y.M.; Cheong, S.I.; Lee, C.G.; Ku, B.C.; Jang, S.P. Stability and thermal conductivity characteristics of nanofluids. Thermochim. Acta 2007, 455, 70–74. [Google Scholar] [CrossRef]
- Mukherjee, S. Preparation and Stability of Nanofluids-A Review. IOSR J. Mech. Civ. Eng. 2013, 9, 63–69. [Google Scholar] [CrossRef]
- Chakraborty, S.; Panigrahi, P.K. Stability of nanofluid: A review. Appl. Therm. Eng. 2020, 174. [Google Scholar] [CrossRef]
- Xu, J.; Xu, C.; Niu, L.; Kang, C. Surface modification of Sb2O3 nanoparticles with dioctylphthalate. Appl. Surf. Sci. 2019, 485, 35–40. [Google Scholar] [CrossRef]
- Umar, S.; Sulaiman, F.; Abdullah, N.; Mohamad, S.N. Investigation of the effect of pH adjustment on the stability of nanofluid. AIP Conf. Proc. 2018, 2031, 020031. [Google Scholar]
- Ghadimi, A.; Saidur, R.; Metselaar, H.S.C. A review of nanofluid stability properties and characterization in stationary conditions. Int. J. Heat Mass Transf. 2011, 54, 4051–4068. [Google Scholar] [CrossRef]
- Swinehart, D.F. The Beer-Lambert law. J. Chem. Educ. 1962, 39, 333–335. [Google Scholar] [CrossRef]
- Bhattacharjee, S. DLS and zeta potential - What they are and what they are not? J. Control. Release 2016, 235, 337–351. [Google Scholar] [CrossRef]
- Segal, V.; Hjortsberg, A.; Rabinovich, A.; Nattrass, D.; Raj, K. AC (60 hz) and Impulse Breakdown Strength of A Colloidal Fluid Based on Transformer Oil and Magnetite nanoparticles. In Proceedings of the Conference Record of the 1998 IEEE International Symposium on Electrical Insulation (Cat. No.98CH36239), Arlington, VA, USA, 7–10 June 1998. [Google Scholar]
- Luo, Q.; Wang, C.; Wen, H.; Liu, L. Research and optimization of thermophysical properties of sic oil-based nanofluids for data center immersion cooling. Int. Commun. Heat Mass Transf. 2022, 131, 105863. [Google Scholar] [CrossRef]
- Koutras, K.N.; Tegopoulos, S.N.; Charalampakos, V.P.; Kyritsis, A.; Gonos, I.F.; Pyrgioti, E.C. Breakdown Performance and Partial Discharge Development in Transformer Oil-Based Metal Carbide Nanofluids. Nanomaterials 2022, 12, 269. [Google Scholar] [CrossRef]
- Kurimský, J.; Rajňák, M.; Šárpataky, M.; Čonka, Z.; Paulovičová, K. Electrical and acoustic investigation of partial discharges in two types of nanofluids. J. Mol. Liq. 2021, 341, 117444. [Google Scholar] [CrossRef]
- Beroual, A.; Khaled, U. Effect of Nanoparticles’ Mixtures on AC Breakdown Voltage of Mineral Oil. IEEE Trans. Dielectr. Electr. Insul. 2021, 28, 1216–1222. [Google Scholar] [CrossRef]
- Kurimsky, J.; Rajnak, M.; Cimbala, R.; Paulovicova, K.; Rozynek, Z.; Kopcansky, P.; Timko, M. Electrical discharges in ferrofluids based on mineral oil and novel gas-to-liquid oil. J. Mol. Liq. 2021, 325, 115244. [Google Scholar] [CrossRef]
- Khan, S.A.; Tariq, M.; Khan, A.A.; Alamri, B. Effect of Iron/Titania-Based Nanomaterials on the Dielectric Properties of Mineral Oil, Natural and Synthetic Esters as Transformers Insulating Fluid. IEEE Access 2021, 9, 168971–168980. [Google Scholar] [CrossRef]
- Rajňák, M.; Kurimský, J.; Cimbala, R.; Čonka, Z.; Bartko, P.; Šuga, M.; Paulovičová, K.; Tóthová, J.; Karpets, M.; Kopčanský, P.; et al. Statistical analysis of AC dielectric breakdown in transformer oil-based magnetic nanofluids. J. Mol. Liq. 2020, 309, 113243. [Google Scholar] [CrossRef]
- Primo, V.A.; Garcia, B.; Burgos, J.C.; Perez, D. AC breakdown voltage of Fe3O4 based nanodielectric fluids. Part 1: Analysis of dry fluids. IEEE Trans. Dielectr. Electr. Insul. 2020, 27, 352–359. [Google Scholar] [CrossRef]
- Ilyas, S.U.; Narahari, M.; Theng, J.T.Y.; Pendyala, R. Experimental evaluation of dispersion behavior, rheology and thermal analysis of functionalized zinc oxide-paraffin oil nanofluids. J. Mol. Liq. 2019, 294, 111613. [Google Scholar] [CrossRef]
- Rajnak, M.; Wu, Z.; Dolnik, B.; Paulovicova, K.; Tothova, J.; Cimbala, R.; Kurimský, J.; Kopcansky, P.; Sunden, B.; Wadsö, L.; et al. Magnetic Field Effect on Thermal, Dielectric, and Viscous Properties of a Transformer Oil-Based Magnetic Nanofluid. Energies 2019, 12, 4532. [Google Scholar] [CrossRef]
- Khaled, U.; Beroual, A. AC Dielectric Strength of Mineral Oil-Based Fe3O4 and Al2O3 Nanofluids. Energies 2018, 11, 3505. [Google Scholar] [CrossRef]
- Li, Y.; Dong, M.; Zhang, C.; Xie, J.; Ren, M.; Zhou, J.; Dai, J. Investigation on charge-carrier transport characteristics of transformer oil-based nanofluids. IEEE Trans. Dielectr. Electr. Insul. 2018, 25, 2443–2451. [Google Scholar] [CrossRef]
- Aljure, M.; Becerra, M.; Karlsson, M. Streamer Inception from Ultra-Sharp Needles in Mineral Oil Based Nanofluids. Energies 2018, 11, 2064. [Google Scholar] [CrossRef]
- Zhou, Y.; Sui, S.; Li, J.; Ouyang, Z.; Lv, Y.; Li, C.; Lu, W. The effects of shallow traps on the positive streamer electrodynamics in transformer oil based nanofluids. J. Phys. D Appl. Phys. 2018, 51, 105304. [Google Scholar] [CrossRef]
- Lv, Y.; Rafiq, M.; Li, C.; Shan, B. Study of Dielectric Breakdown Performance of Transformer Oil Based Magnetic Nanofluids. Energies 2017, 10, 1025. [Google Scholar] [CrossRef]
- Madavan, R.; Balaraman, S. Investigation on effects of different types of nanoparticles on critical parameters of nano-liquid insulation systems. J. Mol. Liq. 2017, 230, 437–444. [Google Scholar] [CrossRef]
- Sima, W.; Shi, J.; Yang, Q.; Huang, S.; Cao, X. Effects of conductivity and permittivity of nanoparticle on transformer oil insulation performance: Experiment and theory. IEEE Trans. Dielectr. Electr. Insul. 2015, 22, 380–390. [Google Scholar] [CrossRef]
- Susan-Resiga, D.; Socoliuc, V.; Boros, T.; Borbath, T.; Marinica, O.; Han, A.; Vekas, L. The influence of particle clustering on the rheological properties of highly concentrated magnetic nanofluids. J Colloid Interface Sci 2012, 373, 110–115. [Google Scholar] [CrossRef] [PubMed]
- Chakraborty, B.; Maur, S.; Kumar Pradhan, A.; Chatterjee, B.; Dalai, S. Investigations on dielectric characteristics of hybrid nanofluids through time and frequency domain spectroscopic measurement. J. Mol. Liq. 2022, 366, 120347. [Google Scholar] [CrossRef]
- Ibrahim, M.E.; Tag Eldin, E.; Elzoghby, S.F.; Izzularab, M.A.; Abd-Elhady, A.M. The Role of the Accumulated Surface Charge on Nanoparticles in Improving the Breakdown Strength of Liquid and Solid Insulation. Energies 2022, 15, 4860. [Google Scholar] [CrossRef]
- Khan, S.A.; Tariq, M.; Khan, A.A.; Alamri, B.; Mihet-Popa, L. Influence of Area and Volume Effect on Dielectric Behaviour of the Mineral Oil-Based Nanofluids. Energies 2022, 15, 3354. [Google Scholar] [CrossRef]
- Verma, H.C.; Baral, A. Dielectric frequency response at different voltage levels of mineral oil-based silica nanofluids. Ain Shams Eng. J. 2023, 14, 101994. [Google Scholar] [CrossRef]
- Atiya, E.G.; Mansour, D.-E.A.; Izzularab, M.A. Partial Discharge Development in Oil-Based Nanofluids: Inception, Propagation and Time Transition. IEEE Access 2020, 8, 181028–181035. [Google Scholar] [CrossRef]
- Bao, Y.-Y.; Huang, J.-H.; Chen, Y.-J.; Liu, Z.-H. Natural convection heat transfer of nanofluid in a cavity under an inhomogeneous electric field. Int. J. Heat Mass Transf. 2019, 131, 341–345. [Google Scholar] [CrossRef]
- Zhang, C.; Wang, Y.; Yan, Z.; He, Z. Effect of the Coexistence of Al2O3 Nanoparticles and Water on Transformer Oil Electrical Performance. IEEE Access 2019, 7, 10189–10195. [Google Scholar] [CrossRef]
- Jin, H.; Morshuis, P.; Mor, A.R.; Smit, J.J.; Andritsch, T. Partial discharge behavior of mineral oil based nanofluids. IEEE Trans. Dielectr. Electr. Insul. 2015, 22, 2747–2753. [Google Scholar] [CrossRef]
- Jin, H.; Andritsch, T.; Tsekmes, I.A.; Kochetov, R.; Morshuis, P.H.F.; Smit, J.J. Properties of mineral oil-based silica nanofluids. IEEE Trans. Dielectr. Electr. Insul. 2014, 21, 1100–1108. [Google Scholar] [CrossRef]
- Siddique, Z.B.; Basu, S.; Basak, P. Dielectric behavior of natural ester based mineral oil blend dispersed with TiO2 and ZnO nanoparticles as insulating fluid for transformers. J. Mol. Liq. 2021, 339, 116825. [Google Scholar] [CrossRef]
- Chakraborty, B.; Raj, K.Y.; Pradhan, A.K.; Chatterjee, B.; Chakravorti, S.; Dalai, S. Investigation of Dielectric Properties of TiO2 and Al2O3 nanofluids by Frequency Domain Spectroscopy at Different Temperatures. J. Mol. Liq. 2021, 330, 115642. [Google Scholar] [CrossRef]
- Raja, S.; Koperundevi, G. Titania-based transformer nanofluid: A study on the synthesis for enhanced breakdown strength and its humidity ageing. IET Nanodielectrics 2020, 3, 138–146. [Google Scholar] [CrossRef]
- Wang, Z.; Zhou, Y.; Lu, W.; Peng, N.; Chen, W. The Impact of TiO2 Nanoparticle Concentration Levels on Impulse Breakdown Performance of Mineral Oil-Based Nanofluids. Nanomaterials 2019, 9, 627. [Google Scholar] [CrossRef]
- Lv, Y.; Ge, Y.; Sun, Z.; Sun, Q.; Huang, M.; Li, C.; Qi, B.; Yuan, J.; Xing, Z. Effect of Nanoparticle Morphology on Pre-Breakdown and Breakdown Properties of Insulating Oil-Based Nanofluids. Nanomaterials 2018, 8, 476. [Google Scholar] [CrossRef]
- Thabet, A.; Allam, M.; Shaaban, S.A. Investigation on enhancing breakdown voltages of transformer oil nanofluids using multi-nanoparticles technique. IET Gener. Transm. Distrib. 2018, 12, 1171–1176. [Google Scholar] [CrossRef]
- Zhou, Y.; Sui, S.Y.; Li, J.; Wang, Z.Y.; Cui, W.; Lv, Y.Z.; Li, C.R. Statistical analysis of moisture’s effect on AC breakdown strength of TiO2 nanofluids. J. Mol. Liq. 2018, 249, 420–428. [Google Scholar] [CrossRef]
- Emara, M.M.; Mansour, D.-E.A.; Azmy, A.M. Mitigating the impact of aging byproducts in transformer oil using TiO2 nanofillers. IEEE Trans. Dielectr. Electr. Insul. 2017, 24, 3471–3480. [Google Scholar] [CrossRef]
- Lv, Y.; Li, C.; Sun, Q.; Huang, M.; Li, C.R.; Qi, B. Effect of Dispersion Method on Stability and Dielectric Strength of Transformer Oil-Based TiO2 Nanofluids. Nanoscale Res Lett 2016, 11, 515. [Google Scholar] [CrossRef]
- Lv, Y.; Ge, Y.; Li, C.; Wang, Q.; Zhou, Y.; Qi, B.; Yi, K.; Chen, X.; Yuan, J. Effect of TiO2 nanoparticles on streamer propagation in transformer oil under lightning impulse voltage. IEEE Trans. Dielectr. Electr. Insul. 2016, 23, 2110–2115. [Google Scholar] [CrossRef]
- Atiya, E.G.; Mansour, D.-E.A.; Khattab, R.M.; Azmy, A.M. Dispersion behavior and breakdown strength of transformer oil filled with TiO2 nanoparticles. IEEE Trans. Dielectr. Electr. Insul. 2015, 22, 2463–2472. [Google Scholar] [CrossRef]
- Du, Y.; Lv, Y.; Li, C.; Chen, M.; Zhong, Y.; Zhou, J.; Li, X.; Zhou, Y. Effect of Semiconductive Nanoparticles on Insulating Performances of Transformer Oil. IEEE Trans. Dielectr. Electr. Insul. 2012, 19, 7. [Google Scholar]
- Khoirudin; Sukarman, S.; Mulyadi, D.; Fazrin, N.; Miftahudin, M.; Suhara, A.; Lailisya Putri, P. Analysis of Transformer Oil Post-Flashover: DGA Testing and Diagnostic Approached. J. Tek. Mesin Mech. Xplore 2024, 4, 74–85. [Google Scholar] [CrossRef]
- Santos, S.M.; Nascimento, D.C.; Costa, M.C.; Neto, A.M.B.; Fregolente, L.V. Flash point prediction: Reviewing empirical models for hydrocarbons, petroleum fraction, biodiesel, and blends. Fuel 2020, 263, 116375. [Google Scholar] [CrossRef]
- Lance, R.C.; Barnard, A.J., Jr.; Hooyman, J.E. Measurement of flash points: Apparatus, methodology, applications. J. Hazard. Mater. 1979, 3, 107–119. [Google Scholar] [CrossRef]
- Stanhope-Seta. Flash Point Testing; Stanhope-Seta: Surrey, UK, 2019. [Google Scholar]
- Rowley, J.R.; Freeman, D.K.; Rowley, R.L.; Oscarson, J.L.; Giles, N.F.; Wilding, W.V. Flash Point: Evaluation, Experimentation and Estimation. Int. J. Thermophys. 2010, 31, 875–887. [Google Scholar] [CrossRef]
- Prugh, R.W. Estimation of Flash Point Temperature. J. Chem. Educ. 1973, 50, A85. [Google Scholar] [CrossRef]
- Satyanarayana, K.; Kakati, M.C. Correlation of Flash Points. Fire Mater. 1991, 15, 97–100. [Google Scholar] [CrossRef]
- Albahri, T.A. Flammability characteristics of pure hydrocarbons. Chem. Eng. Sci. 2003, 58, 3629–3641. [Google Scholar] [CrossRef]
- Patil, G.S. Estimation of Flash Point. Fire Mater. 1988, 12, 127–131. [Google Scholar] [CrossRef]
- Hshieh, F.-Y. Correlation of closed-cup flash points with normal boiling points for silicone and general organic compounds. Fire Mater. 1997, 21, 277–282. [Google Scholar] [CrossRef]
- Satyanarayana, K.; Rao, P.G. Improved equation to estimate flash points of organic compounds. J. Hazard. Mater. 1992, 32, 81–85. [Google Scholar] [CrossRef]
- Catoire, L.; Naudet, V. A Unique Equation to Estimate Flash Points of Selected Pure Liquids Application to the Correction of Probably Erroneous Flash Point Values. J. Phys. Chem. Ref. Data 2004, 33, 1083–1111. [Google Scholar] [CrossRef]
- Metcalfe, E.; Metcalfe, A.E.M. Communication: On the Correlation of Flash Points. Fire Mater. 1992, 16, 153–154. [Google Scholar] [CrossRef]
- Liu, X.; Liu, Z. Research Progress on Flash Point Prediction. J. Chem. Eng 2010, 55, 2943–2950. [Google Scholar] [CrossRef]
- Gharagheizi, F.; Eslamimanesh, A.; Mohammadi, A.H.; Richon, D. Empirical Method for Representing the Flash-Point Temperature of Pure Compounds. Ind. Eng. Chem. Res. 2011, 50, 5877–5880. [Google Scholar] [CrossRef]
- Butler, R.M.; Cooke, G.M.; Lukk, G.G.; Jameson, B.G. Prediction of Flash Points of Middle Distillates. Ind. Eng. Chem. 1956, 48, 808–812. [Google Scholar] [CrossRef]
- Alqaheem, S.S.; Riazi, M.R. Flash Points of Hydrocarbons and Petroleum Products: Prediction and Evaluation of Methods. Energy Fuels 2017, 31, 3578–3584. [Google Scholar] [CrossRef]
- Karthik, R.; Raja, T.S.R.; Madavan, R. Enhancement of Critical Characteristics of Transformer Oil Using Nanomaterials. Arab. J. Sci. Eng. 2012, 38, 2725–2733. [Google Scholar] [CrossRef]
- Beheshti, A.; Shanbedi, M.; Heris, S.Z. Heat transfer and rheological properties of transformer oil-oxidized MWCNT nanofluid. J. Therm. Anal. Calorim. 2014, 118, 1451–1460. [Google Scholar] [CrossRef]
- Ettefaghi, E.-o.-l.; Ahmadi, H.; Rashidi, A.; Nouralishahi, A.; Mohtasebi, S.S. Preparation and thermal properties of oil-based nanofluid from multi-walled carbon nanotubes and engine oil as nano-lubricant. Int. Commun. Heat Mass Transf. 2013, 46, 142–147. [Google Scholar] [CrossRef]
- Prasath, R.T.A.R.; Roy, N.K.; Mahato, S.N.; Thomas, P. Mineral oil based high permittivity CaCu3Ti4O12 (CCTO) nanofluids for power transformer application. IEEE Trans. Dielectr. Electr. Insul. 2017, 24, 2344–2353. [Google Scholar] [CrossRef]
- Amiri, A.; Shanbedi, M.; Ahmadi, G.; Rozali, S. Transformer oils-based graphene quantum dots nanofluid as a new generation of highly conductive and stable coolant. Int. Commun. Heat Mass Transf. 2017, 83, 40–47. [Google Scholar] [CrossRef]
- Blanc, R.; Carrander, K.; Duarte, D.; Ebisawa, Y.; Figueroa, E.J.; Foata, M.; Kadowaki, M.; Kobayashi, T.; LEE, T.; Martin, R.; et al. Guide for Transformer Fire Safety Practices; Cigre: Paris, France, 2013. [Google Scholar]
- Chakraborty, M.; Baruah, N.; Sangineni, R.; Kumar Nayak, S.; Kumar Maiti, P. Dissolved Gas Analysis (DGA) of Thermally Aged Blended Transformer Oil. In Proceedings of the 2020 IEEE Conference on Electrical Insulation and Dielectric Phenomena (CEIDP), East Rutherford, NJ, USA, 18–30 October 2020; pp. 204–207. [Google Scholar]
- Maher, A.; Mansour, D.E.A.; Helal, K.; Abd El Aal, R.A.A. Dissolved gas analysis and dissipation factor measurement of mineral oil-based nanofluids under thermal and electrical faults. High Volt. 2023, 8, 455–465. [Google Scholar] [CrossRef]
- Wang, X.F.; Wang, Z.D.; Liu, Q.; Dyer, P. Dissolved gas analysis of thermal faults in transformer liquids simulated using immersed heating method. IEEE Trans. Dielectr. Electr. Insul. 2018, 25, 1749–1757. [Google Scholar] [CrossRef]
- Zhong, M.; Cao, Y.; He, G.; Feng, L.; Tan, Z.; Mo, W.; Fan, J. Dissolved gas in transformer oil forecasting for transformer fault evaluation based on HATT-RLSTM. Electr. Power Syst. Res. 2023, 221, 109431. [Google Scholar] [CrossRef]
- Association, N.F.P.; Association, N.F.P. National Electrical Code 2014; National Fire Protection Association: Quincy, MA, USA, 2013. [Google Scholar]
- Cai, S.; Chen, C.; Guo, H.; Chen, S.; Zhou, Z.; Guo, Z. Fire resistance test of transformers filled with natural ester insulating liquid. J. Eng. 2019, 2019, 1560–1564. [Google Scholar] [CrossRef]
- Mehta, D.M.; Kundu, P.; Chowdhury, A.; Lakhiani, V.K.; Jhala, A.S. A review on critical evaluation of natural ester vis-a-vis mineral oil insulating liquid for use in transformers: Part 1. IEEE Trans. Dielectr. Electr. Insul. 2016, 23, 873–880. [Google Scholar] [CrossRef]
- Oparanti, S.O.; Fofana, I.; Jafari, R.; Zarrougui, R. A state-of-the-art review on green nanofluids for transformer insulation. J. Mol. Liq. 2024, 396, 124023. [Google Scholar] [CrossRef]


| Transformer Oil | Type | Specifications |
|---|---|---|
| MO | Paraffinic | Nonring long-chained |
| Naphthenic | Saturated ring | |
| Aromatic | Nonsaturated ring | |
| Synthetic oil | Polyalphaolefins | Polymerization of hydrocarbon molecules |
| Polyglycols | Oxidation of ethylene and propylene | |
| Synthetic ester | Reaction of acids and alcohols with water | |
| Organic oil | Soybean oil Coconut oil Cottonseed oil Rapeseed oil | Non-toxic, biodegradable, low inflammable, high breakdown voltage, flash point, acidity, viscosity, and pour point |
| Properties | MO | Synthetic Oil | Organic Oil | Test Method |
|---|---|---|---|---|
| Breakdown voltage (kV) | 30–85 | 45–70 | 82–97 | IEC 60156 [12] |
| Relative permittivity at 25 °C | 2.1–2.5 | 3.0–3.5 | 3.1–3.3 | IEC 60247 [13] |
| Viscosity at 0 °C (mm2/s) | <76 | 26–50 | 77–143 | ISO 3104 [14] |
| Viscosity at 40 °C (mm2/s) | 3–16 | 14–29 | 16–37 | ISO 3104 [14] |
| Viscosity at 100 °C (mm2/s) | 2–2.5 | 4–6 | 4–8 | ISO 3104 [14] |
| Pour point (°C) | −30 to −60 | −40 to −50 | −19 to −33 | ISO 3016 [15] |
| Flash point (°C) | 100–170 | 250–270 | 315–328 | ISO 2592 [16] |
| Fire point (°C) | 180–185 | 300–310 | 350–360 | ISO 2592 [16] |
| Density at 20 °C (kg/dm3) | 0.83–0.89 | 0.90–1.00 | 0.87–0.92 | ISO 3675 [17] |
| Specific heat (J/g·K) | 1.6–2.0 | 1.8–2.3 | 1.5–2.1 | ASTM E1269 [18] |
| Thermal conductivity (W/m·K) | 0.11–0.16 | 0.15 | 0.16–0.17 | ASTM D7896 [19] |
| References | Formula | |
|---|---|---|
| Wilk et al. [30] | (1) | |
| (2) | ||
| Li et al. [31] | (3) | |
| (4) | ||
| Li et al. [32] | (5) | |
| Kannaiyan et al. [33] | (6) | |
| Moldoveanu et al. [34] | (7) | |
| Reddy et al. [35] | (8) | |
| Radkar et al. [36] | (9) | |
| Dalkılıç et al. [37] | Hybrid NPs | (10) |
| Kakavandi et al. [38] | Hybrid NPs and two base fluids | (11) |
| Zeta Potential (±mV) | Stability |
|---|---|
| 0 | Lack of stability |
| 0–15 | Marginally stable |
| 15–30 | Moderate stability |
| 30–45 | Satisfactory stability (sedimentation occurs) |
| 45–60 | Outstanding stability (minimal sedimentation) |
| ≥60 | Exceptional stability |
| No. | Ref. | Year | NPs | Concentrations (wt%) | Results |
|---|---|---|---|---|---|
| 1 | [108] | 2014 | MWCNTs | 0.001; 0.01 | The optimal concentration of 0.001 wt% resulted in a 4.6% increase in flash point, whereas concentrations higher than 0.01 wt% led to a decrease in the flash point. |
| 2 | [109] | 2013 | MWCNTs | 0.1; 0.2; 0.5 | Increasing the concentration of carbon nanotubes up to 0.2 wt% resulted in a flash point increase of about 13%. However, with concentrations up to 0.5 wt%, the flash point showed a decreasing trend. |
| 3 | [111] | 2017 | AGQD | 0.001 | A significant increase in flash point was observed when 0.001 wt% of AGQD was added to the transformer oil. |
| 4 | [78] | 2021 | TiO2; ZnO | 0.00001; 0.00003; 0.00006; 0.00008; 0.0001 | The addition of both types of nanomaterials caused an increase in the flash point of the oil blend. However, the increase caused by ZnO NPs was greater compared to the increase caused by TiO2 NPs. |
| 5 | [107] | 2013 | Al; Cu; CuO; Al2O3 | 0.005; 0.023; 0.045; 0.45; 0.9 | The flash point values of Al2O3, aluminum, CuO, and copper-based NFs show significant increases for various concentration. Copper NP-based transformer oil shows the highest enhancement of flash point. |
| 6 | [66] | 2017 | Fe3O4; ZnO; SiO2 | 0.032; 0.064; 0.096; 0.128; 0.16 | The flash point increases with the rising concentration of all types of NPs. |
| 7 | [110] | 2017 | CCTO | 0.003; 0.006; 0.028 | The flash point increases as the concentration of CCTO in the MO increases. |
Disclaimer/Publisher’s Note: The statements, opinions and data contained in all publications are solely those of the individual author(s) and contributor(s) and not of MDPI and/or the editor(s). MDPI and/or the editor(s) disclaim responsibility for any injury to people or property resulting from any ideas, methods, instructions or products referred to in the content. |
© 2024 by the authors. Licensee MDPI, Basel, Switzerland. This article is an open access article distributed under the terms and conditions of the Creative Commons Attribution (CC BY) license (https://creativecommons.org/licenses/by/4.0/).
Share and Cite
Khoirudin; Kristiawan, B.; Sukarman; Abdulah, A.; Santoso, B.; Wijayanta, A.T.; Aziz, M. Flash Point Improvement of Mineral Oil Utilizing Nanoparticles to Reduce Fire Risk in Power Transformers: A Review. Fire 2024, 7, 305. https://doi.org/10.3390/fire7090305
Khoirudin, Kristiawan B, Sukarman, Abdulah A, Santoso B, Wijayanta AT, Aziz M. Flash Point Improvement of Mineral Oil Utilizing Nanoparticles to Reduce Fire Risk in Power Transformers: A Review. Fire. 2024; 7(9):305. https://doi.org/10.3390/fire7090305
Chicago/Turabian StyleKhoirudin, Budi Kristiawan, Sukarman, Amri Abdulah, Budi Santoso, Agung Tri Wijayanta, and Muhammad Aziz. 2024. "Flash Point Improvement of Mineral Oil Utilizing Nanoparticles to Reduce Fire Risk in Power Transformers: A Review" Fire 7, no. 9: 305. https://doi.org/10.3390/fire7090305