Abstract
To explore the evacuation situation of the underground space in the Starting Area of Guangzhou International Financial City under fire, personal evacuation was simulated with Pathfinder in three zones. Then, the visual animation and the human flow rate diagram were obtained and analyzed. A fire-risk assessment model based on a combined weighting and the technique for order of preference by similarity to ideal solution (TOPSIS) is proposed to assess the fire risk of three zones. First, six second-level indices were determined from three aspects: regional safety evacuation, regional fire prevention, and regional fire extinguishment. The value of regional safety evacuation was determined by the results of the evacuation simulation. Second, the subjective and objective weights of the second-level indices were determined based on the analytic hierarchy process and entropy weight method, respectively, and a combined weighting method was adopted to reflect the subjective and objective weights. Next, TOPSIS was used to calculate the relative closeness between each scheme and the ideal scheme. The relative closeness is an evaluation index used to determine the fire-risk level of three zones. It was found that the fire-risk level of Zone Ⅰ is high, requiring large-scale rectification. The fire-risk level of Zone Ⅱ is low, and the fire toughness is strong. The fire-risk level of Zone Ⅲ is medium and needs local rectification.
1. Introduction
The development of underground spaces in the Guangzhou International Financial City saves resources and improves land benefits. However, it may lead to large fire loads, poor ventilation and lighting, and difficult evacuation. In the case of a fire, personal safety and normal operation of the financial center will be severely affected [,]. On 26 September 2022, a fire occurred in a large underground outlet store in Yuseong, Daejeon, South Korea, causing the death of two people and severely injuring one person. On 18 February 2023, a fire occurred in the underground garage of the Tiandi Building in the Huangpu District of Shanghai, which caused property loss. Therefore, it is critical to simulate evacuation and evaluate risk in Guangzhou International Financial City under fire to protect property and maintain social stability.
At present, evacuation simulation is mainly based on software including AnyLogic, Pathfinder, and Repast [,,,]. Feng et al. [] used AnyLogic to complete the environmental and visitor behavior modeling of a gold museum and analyzed the personal evacuation process and potential safety hazards. Qin et al. [] utilized the Pathfinder software to simulate evacuation in a special subway station. Evacuations in dissimilar statuses were analyzed by setting up a fire scenario and changing the flow rate at the station. Moreover, several methods for fire-risk assessment have been developed [,,]. Lu et al. [] designed an indicator attribute threshold interval to classify and quantify different fire-risk category data and used a Random Forest model to establish a stadium fire-risk assessment model. Casallas et al. [] built an early alert system using two machine learning techniques to calculate the meteorological conditions of two Colombian areas. Omidvari et al. [] established a model based on the analytic hierarchy process (AHP) and consequence analysis logic to determine the factors influencing fire risk in an education center. However, these fire-risk assessment methods ignore a combination of subjective and objective methods in determining the index weight.
In this paper, the evacuation of three underground zones in Guangzhou International Financial City was simulated with Pathfinder, and the visual evacuation animation and the human flow rate diagram were obtained. Then, the evacuation time obtained by simulation was taken as one of the indices. A combined weighting method that considers a subjective method (AHP) and an objective method (the entropy weight method) were applied to determine the index weight. Next, the technique for order of preference by similarity (TOPSIS) was used to calculate the distance between the scheme to be evaluated and the positive and negative ideal solutions. Finally, the relative closeness between each scheme and the ideal scheme is determined and the fire risk of three zones is evaluated.
2. Evacuation Simulation
2.1. Simulation Model
Guangzhou International Financial City is located southeast of Tianhe District, Guangzhou City, starting from Zhongshan Avenue and Huangpu Avenue in the north, bordering the Pearl River in the south and Tianhe District in the east, with a total area of 8 square kilometers (Figure 1). The 14th Five-Year Industrial Development Plan of Guangzhou International Financial City was officially released in February 2022. According to the plan, the Financial City will be built as the largest underground city in China, with an underground space of approximately 1.8 million square meters, also making it the deepest in Guangzhou.
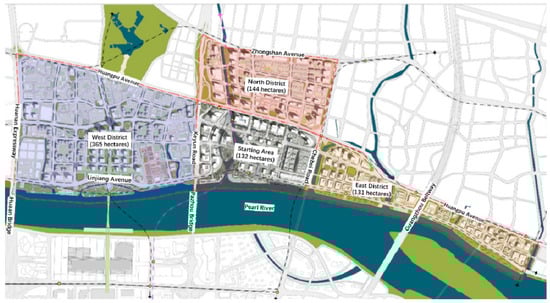
Figure 1.
Geographical location map of Guangzhou International Financial City.
Figure 2 shows a BIM ichnography of the Starting Area in Guangzhou International Financial City. The BIM of Zones I to III were imported into Pathfinder, as shown in Figure 2. The Pathfinder models for underground Zones I to III are shown in Figure 3, Figure 4 and Figure 5.
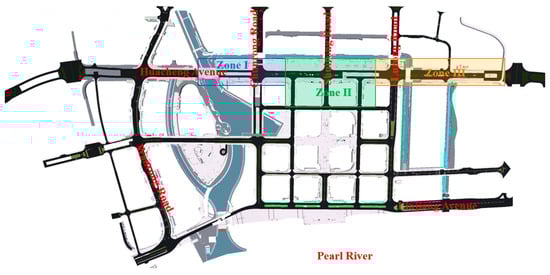
Figure 2.
BIM ichnography of the Starting Area in Guangzhou International Financial City.
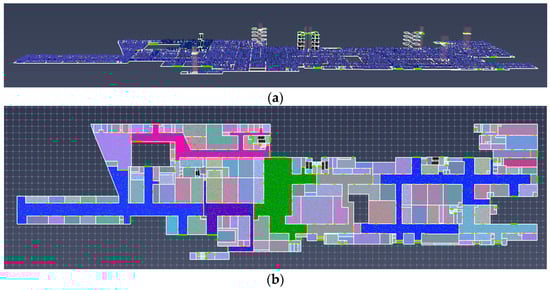
Figure 3.
The simulation model of Zone Ⅰ: (a) overall view; (b) plan view.
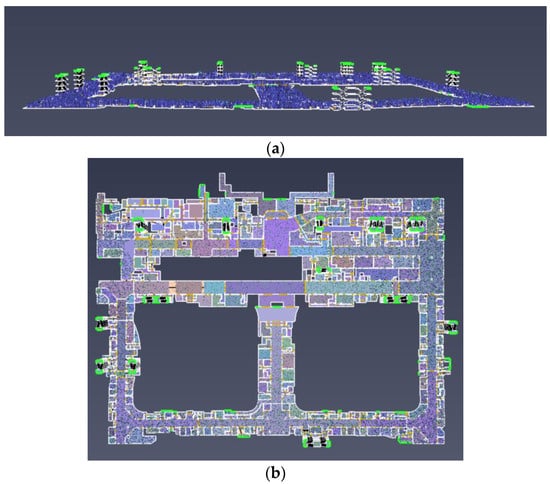
Figure 4.
The simulation model of Zone Ⅱ: (a) overall view; (b) plan view.
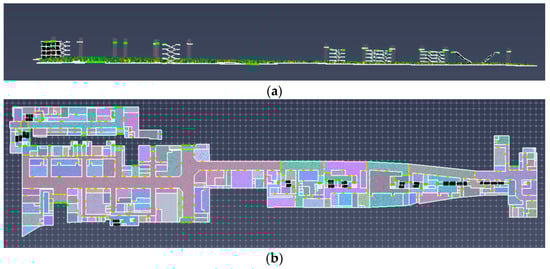
Figure 5.
The simulation model of Zone Ⅲ: (a) overall view; (b) plan view.
According to research on crowd evacuation speed and adult body size [,], parameters for the underground evacuation model of the Financial City were set as shown in Table 1. An old man or woman refers to a man or woman over the age of 60. An adult man or woman refers to a man or woman between the ages of 18 and 60. A child refers to a man or woman under the age of 18. People are distributed evenly in space, and the crowd density is 0.3 (1/m2). The operating conditions were set as open the fire door, stop the fire elevator, and no failure of the emergency exit, where a fire door is a door with a fire-resistance rating (sometimes referred to as a fire protection rating for closures) used as part of a passive fire protection system to reduce the spread of fire and smoke between separate compartments of a structure and to enable safe egress from a building, structure, or ship. A fire elevator is an elevator with certain functions used by fire fighters for firefighting and rescue when a fire breaks out in a building. Therefore, the fire elevator has high fire protection requirements, and its fire protection design is very important. The combined use of regular and emergency exits allows for faster evacuation, and emergency exits provide alternative means of evacuation if regular exits are inaccessible. An emergency exit’s path usually ends in an outward-opening door with a crash bar with exit signs pointing to it.

Table 1.
Crowd composition and moving speed of simulation model.
2.2. Simulation Results
2.2.1. Simulation Result of Zone Ⅰ
- (1)
- Visualization of evacuation simulation for Zone Ⅰ
Figure 6 shows the visualization result of the evacuation simulation for Zone Ⅰ. A total of 9658 people, which is the maximum number of evacuees in the model, are set according to the fire evacuation design. Within 5 s of the start of the evacuation, congestion quickly appeared near doors in Zone Ⅰ. After 30 s, serious congestion occurred at exits ①, ②, ③, ④, ⑤, ⑥, ⑦, ⑧, and ⑨ and stairs No. 1. After 80 s, exits ①, ②, ③, ④, ⑤, and ⑥ still experienced serious congestion, and the congestion of other exits was relieved. After 115 s, only exits ①, ④, and ⑤ still remained congested. After 135 s, only the corner near the exit ④ was congested until the end of the evacuation, and the total evacuation time was 169.3 s.
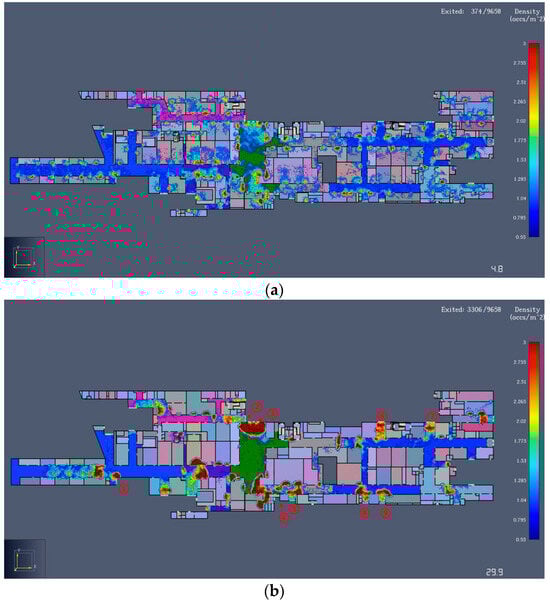
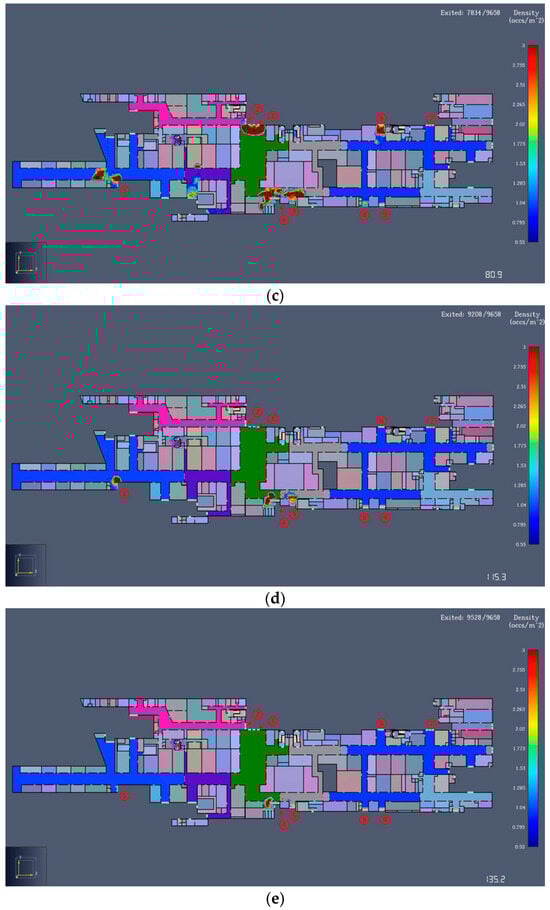
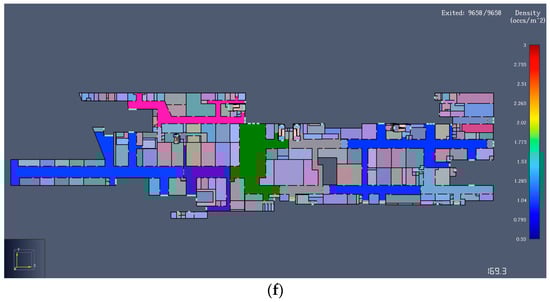
Figure 6.
Visualization result of evacuation simulation for Zone Ⅰ: (a) 4.8 s; (b) 30 s; (c) 80 s; (d) 115 s; (e) 135 s; (f) 169.3 s.
- (2)
- Personal flow rate analysis of some exits in Zone Ⅰ
Figure 7 shows the personal flow rate diagram of some exits in Zone Ⅰ. There are multiple doors at each exit, which are represented by curves of different colors. The personal flow rate of exits ②, ③, ⑥, ⑦, ⑧, and ⑨ reached the highest in about 60 s, 30 s, 20 s, 30 s, 20 s, and 30 s, respectively, while the rate decreased after 80 s, 120 s, 110 s, 70 s, 100 s, and 70 s, respectively, that is, the congestion was alleviated.
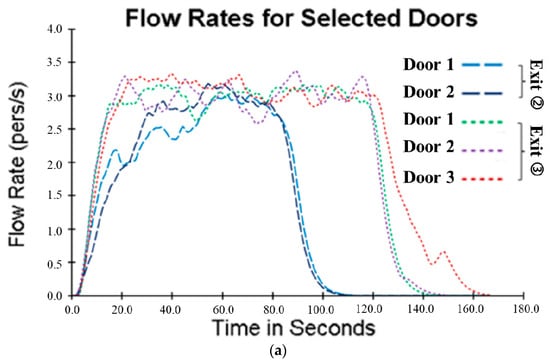
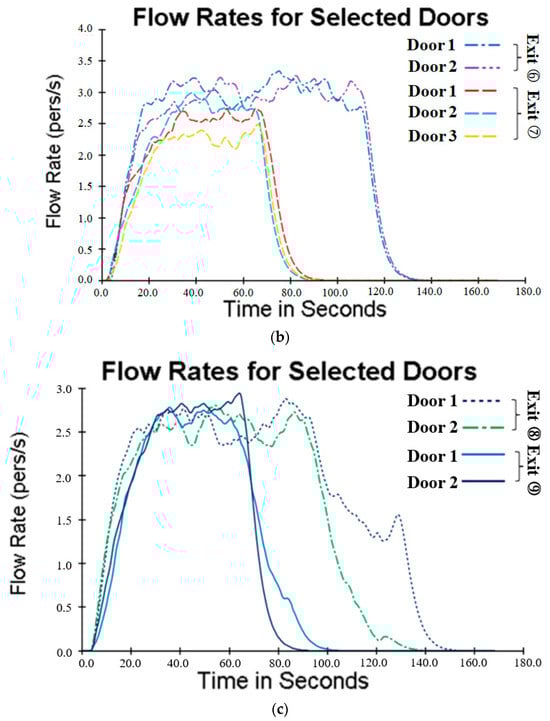
Figure 7.
The personal flow rate diagram of some exits in Zone Ⅰ: (a) exits ② and ③; (b) exits ⑥ and ⑦; (c) exits ⑧ and ⑨.
- (3)
- Suggestions for optimizing Zone Ⅰ
(a) There is a large area of congestion in the early stage of evacuation in the room near room a, as shown in Figure 8. It is recommended to add an exit.
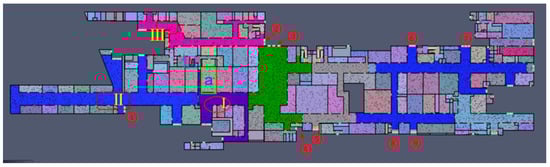
Figure 8.
Recommended area for optimization in Zone Ⅰ.
(b) Exit ③ experiences long-term serious congestion during the overall evacuation process. It is suggested to connect the exits ② and ③ and widen the evacuation width of exit ③ to reduce the congestion.
(c) Zones I, II, and III are congested for a long time due to corners. It is recommended to reoptimize the corner design. Stairs No. 1 are single run stairs, so the evacuation width is insufficient, and it is recommended to modify them into double run stairs.
(d) The congestion of exits ⑥ and ⑧ is more serious than that of exits ⑦ and ⑨, so it is suggested to add evacuation guidance to balance the number of evacuees on both sides of the exit.
2.2.2. Simulation Result of Zone Ⅱ
- (1)
- Visualization of evacuation simulation for Zone Ⅱ
Figure 9 shows the visualization result of the evacuation simulation for Zone Ⅱ. After 15 s, exits ⑧, ⑨, and ⑳ began to experience more serious congestion. Exit ① and the exit in Zone Ⅲ also experienced different degrees of congestion. After 28 s, the congestion was severe at exits ⑫ and ⑳. After 32 s, the congestion at exit ⑩ became worse. After 50 s, the crowds were mainly concentrated at exits ⑨, ⑩, ⑫, and ⑳; however, fewer people were at exit ⑪, which was close to exit ⑩. After 126 s, in addition to the large crowd at exit ⑩, the rest of the stairs had only a small number of people, and the crowd in the room had been basically evacuated. After 231 s, a small number of persons remained at exits ⑬, ⑮, and ⑯, and the rest had been evacuated. A total of 15,169 people were evacuated in Zone Ⅱ, and it took 303 s.
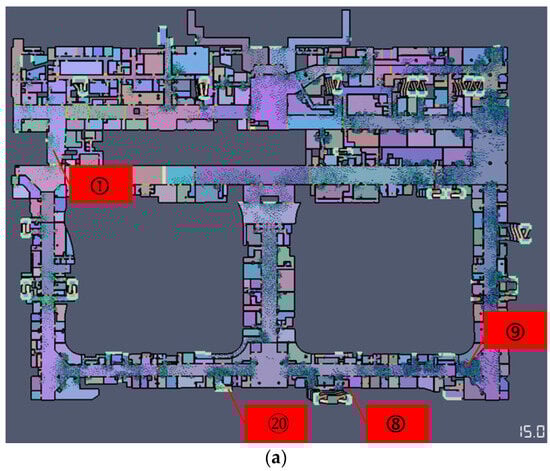
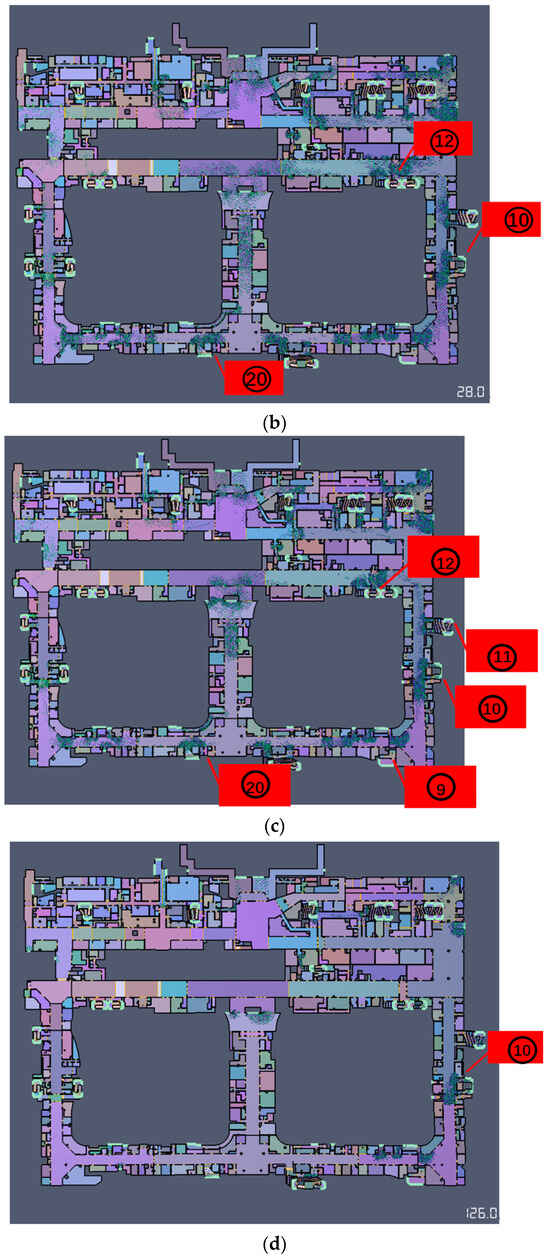
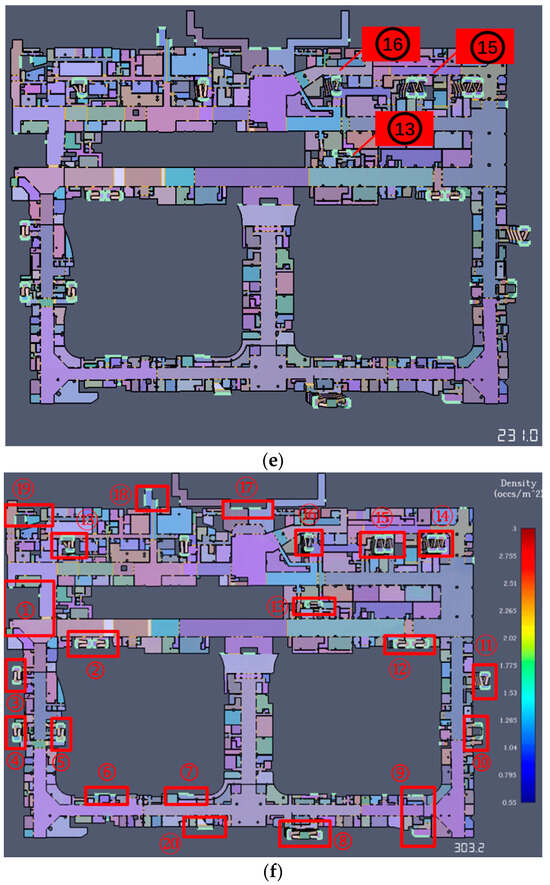
Figure 9.
The personal flow rate diagram of some exits in Zone Ⅱ: (a) 15 s; (b) 28 s; (c) 50 s; (d) 126 s; (e) 231 s; (f) 303 s.
- (2)
- Personal flow rate analysis of some exits in Zone Ⅱ
Figure 10 shows the personal flow rate diagram of some exits in Zone Ⅱ. Exits ⑨, ⑩, and ⑪ began to have serious congestion after 12 s, 15 s, and 32 s, respectively. After 50 s, the crowd was mainly concentrated at exit ⑩, and few people were at exits ⑨ and ⑪. After 210 s, there were still many people at exit ⑩, and except for a small number of people on the stairs, the crowd was basically evacuated.
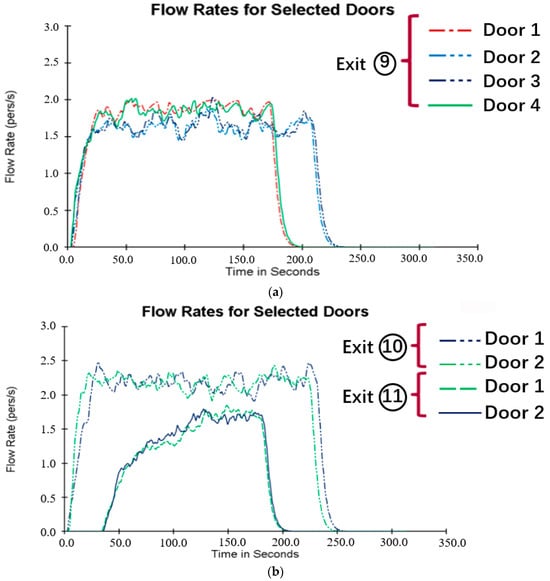
Figure 10.
The personal flow rate diagram of some exits in Zone Ⅱ: (a) exit ⑨; (b) exits ⑩ and ⑪.
- (3)
- Suggestions for optimizing Zone Ⅱ
(a) Exit ⑨ is in the lower part of Zone II, and many people evacuate through this exit, but the exit is small and thus the congestion time is long. It is recommended to direct people to other exits to prevent overcrowding.
(b) Exit ⑩ is in the hub zone with a large flow of people and experiences obvious congestion. Exit ⑪ is close to exit ⑩, but the personal flow rate of exit ⑪ is much lower than that of exit ⑩. Therefore, it is recommended to guide some people from exit ⑩ to exit ⑪ for evacuation.
2.2.3. Simulation Result of Zone Ⅲ
- (1)
- Visualization of evacuation simulation for Zone Ⅲ
Figure 11 shows the visualization result of the evacuation simulation for Zone Ⅲ. A total of 6599 people, which is the maximum number of evacuees in the model, are set according to the fire evacuation design. After about 7 s, congestion quickly appeared near the exits. At 34 s, there was severe congestion at exits ②, ⑦, ⑧, ⑨, ⑩, ⑪, and ⑮ and stairs No. 4, No. 6, No. 7, and No. 8. At 70 s, the congestion was relieved, but the exits ②, ⑨, ⑩, and ⑪ and the stairs No. 4, No. 6, No. 7, and No. 8 remained heavily congested, with the evacuation stairs No. 8 being the most seriously affected. At 101 s, only evacuation stairs No. 1 and No. 4 to 8 remained congested. After 183.5 s, only evacuation stairs No. 7 and No. 8 were congested, and the evacuation took 214.8 s to complete.
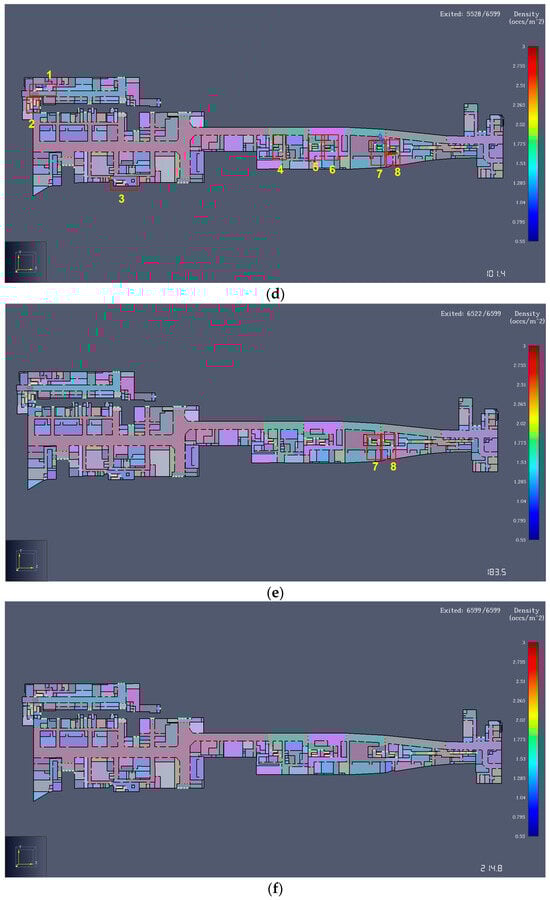
Figure 11.
The personal flow rate diagram of some exits in Zone Ⅲ: (a) 7 s; (b) 34 s; (c) 70 s; (d) 101 s; (e) 183.5 s; (f) 214.8 s.
- (2)
- Personal flow rate analysis of some exits and stairs in Zone Ⅲ
Figure 12 shows the personal flow rate diagram of some exits in Zone Ⅲ. The personal flow rate of exits ⑦ and ⑧ peaked at around 60 s and began to decline, and the evacuation efficiency of the two exits was a little different. The flow rate of exits ② and ⑨ was smaller than that of exits ⑦ and ⑧, but the evacuation time of exits ② and ⑨ was greater than that of exits ⑦ and ⑧. Exits ⑩, ⑪, ⑭, and ⑮ were the main evacuation exits in Zone Ⅲ. Exit ⑪ causes longer evacuation times due to the fewer number of evacuation doors and the larger flow rate compared with other exits.
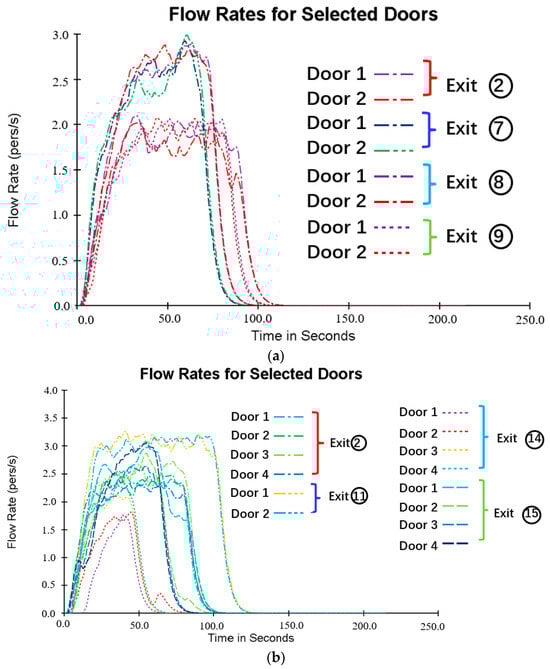
Figure 12.
The personal flow rate diagram of some exits in Zone Ⅲ: (a) exits ②, ⑦, ⑧, and ⑨; (b) exits ⑩, ⑪, ⑭, and ⑮.
Figure 13 shows the personal flow rate diagram of the stairs in Zone Ⅲ. The flow rate in stairs No. 2 is zero. According to Figure 11, people near stairs No. 2 are inclined to choose exits ④ and ⑤ according to the shortest path principle, which results in congestion at exit ④ in the initial stage of evacuation. Due to the fact that there is no other exit near the evacuation stairs No. 4, the large flow rate was maintained until the end of the evacuation. The evacuation efficiency of stairs No. 5 to No. 8 was basically the same. There were more people near stairs No. 8, so the evacuation time was longer than that of stairs No. 5.
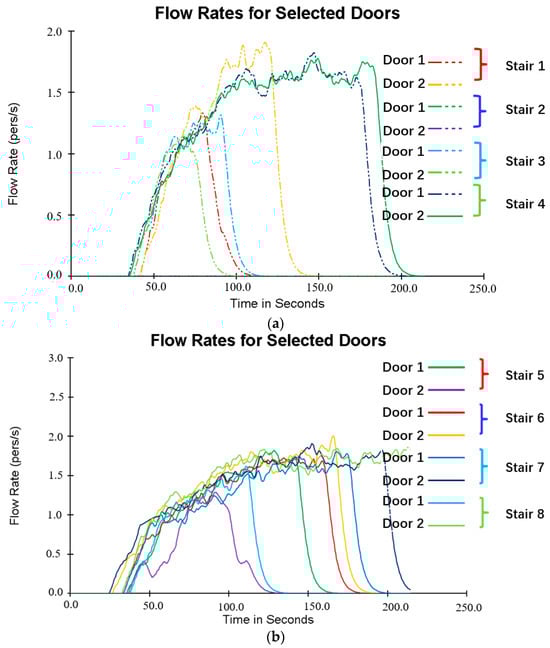
Figure 13.
The personal flow rate diagram of stairs in Zone Ⅲ: (a) stairs No. 1 to 4; (b) stairs No. 5 to 8.
- (3)
- Suggestions for optimizing Zone Ⅲ
(a) Exits ⑩ and ⑭ are located opposite from each other, and while exit ⑩ is prone to being congested, the number of evacuees at exit ⑭ is small. Therefore, it is recommended to direct the crowd of exit ⑩ to exit ⑭ to improve the evacuation efficiency.
(b) It is recommended to strengthen the evacuation guidelines for stairs No. 3 and No. 2, and guide people of exits ②, ⑦, and ⑧ to stairs No. 3 or No. 2 to reduce the evacuation intensity and time of exits ②, ⑦, and ⑧.
(c) It is suggested that evacuation stairs No. 7 and No. 8 be partially evacuated to exits ⑫ and ⑬ to improve evacuation efficiency.
(d) The evacuation crowds at exits ⑩, ⑪, ⑭, and ⑮ are dense, so it is recommended to strengthen on-site management to avoid stampedes.
3. Index Weight Calculation Based on Combination of Subjective and Objective Weights
3.1. Index Weight Calculation Based on AHP
3.1.1. Selection of Destination and Index Layers
During the decision analysis process, the AHP generally starts from the decision-making objectives of the system to hierarchize and organize the problem and then build a hierarchical structure. Based on this, a multilevel analysis structural model was developed. Based on the design standards and reference [] and fully integrating the opinions of engineers and experts, a hierarchy table was constructed (Table 2).
Table 2.
Hierarchical table and symbolic representation.
3.1.2. Construction of Judgment Matrix
A pairwise comparison method was introduced to establish a judgment matrix to provide reliable data [,,]. By comparing these two factors, the importance of each index can be determined quantitatively. Let aij be the weight of the ith index relative to the jth index if they belong to the same index as the upper layer. If x elements are to be compared relative to the index of the upper layer, the corresponding judgment matrix is extended to an x-order matrix, and aij = 1/aji. Table 3 lists the valuation criteria for ranking the relative importance of the two indices.
Table 3.
Valuation criteria of the relative importance of two indices.
Furthermore, the importance of the index was evaluated based on the actual situation of the project []. Based on the hierarchy and index importance in Table 2 and Table 3, the judgment matrices of the destination layer and the two index layers were constructed, as listed in Table 4, Table 5 and Table 6.
Table 4.
Judgment matrix of A.
Table 5.
Judgment matrix of B2.
Table 6.
Judgment matrix of B3.
3.1.3. Weight Calculation and Consistency Test
Let the judgment matrix of an index be , the weight vector of the index relative to the lower index layer, and U is the eigenvector corresponding to the maximum eigenvalue of Q. Let be the kth element of U. can be determined using Equation (1):
where l is the element number of U. Furthermore, can be expressed as follows:
Constructing a judgment matrix can achieve comparatively excellent results in reducing the interference of other factors, objectively pointing out the similarities and differences in the influence of a pair of factors and providing credible data. However, there are still shortcomings, i.e., a degree of inconsistency exists. Therefore, it was necessary to conduct a consistency check. The consistency ratio, CR, is defined as follows:
where CI is the consistency index, which can be determined using Equation (4), and RI is the average random consistency index, which is related only to matrix order, l.
CR < 0.1 is regarded as the acceptable standard of consistency of the judgment matrix. If the requirements are not satisfied, judgment matrix Q continues to be modified. Subsequently, the weight vector of the judgment matrix that satisfied the consistency test is calculated.
Based on Table 2 and Equation (1), the weight vector of the destination layer relative to the first-level evaluation index can be determined as follows:
Similarly, the weight vectors of B1, B2, and B3 relative to the second-level indices , , and are obtained as follows:
The above calculation passed the consistency test. Let the weight vector of the second-level index obtained by AHP be W1, where the value of each element is its weight in the first-level index multiplied by the weight of the first-level index in the destination layer. The calculation results are as follows:
3.2. Index Weight Calculation Based on Entropy Weight Method
3.2.1. Original Data of Zones Ⅰ to Ⅲ in Financial City
In this study, the entropy weight method was used as an objective evaluation method to calculate the index weight. When the entropy value of information is high, its weight is low [,]. The original index data of Zones Ⅰ to Ⅲ in Financial City are listed in Table 7. The regional indices in Table 2 are equal to the original index data divided by the regional area in Table 7. For example, the regional evacuation time (C1) is equal to the evacuation time divided by the regional area. The value of regional safety evacuation time is determined by the results of evacuation simulation, as shown in Figure 6, Figure 9, and Figure 11. The average area ratio of the fire protection zones (C2) is equal to the average area of the fire protection zones divided by the regional area.
Table 7.
Original index data of Zones Ⅰ to Ⅲ in Financial City.
3.2.2. Standardization of Original Data
For positive indices, the standardized formula is expressed as follows:
where represents the initial data of the jth evaluation index in the ith evaluation object; is the standardized value of ; is the minimum value of the jth evaluation index in all evaluation objects; is the maximum value of the jth evaluation index in all evaluation objects.
For negative indices, the standardized formula is expressed as follows:
In this paper, except for C2, which is a negative index, all the indices are positive. The original data after standardization are listed in Table 8.
Table 8.
Result of the standardized data.
3.2.3. Calculation of Information Entropy and Weight
Let be the proportion of the ith standardized value in the jth index. can be expressed as follows:
where m is the zone number, that is, m = 3. The information entropy of the jth index, , can be expressed as follows:
The difference coefficient of the jth index is calculated according to the information entropy, which can be expressed as follows:
Let the weight vector obtained by entropy weight method be , where n represents the numbers of the evaluation index, and is the weight of the jth index calculated by the entropy weight method, which can be expressed as follows:
The calculation results of the information entropy and weight of indices are shown in Table 9.
Table 9.
Information entropy and weight.
3.3. Combined Weighting Method
The combined weighting method is a linear combination of weights obtained using different methods to determine the most reliable index weights [,]. The combination of the AHP and entropy weight method was adopted in this study to eliminate their individual shortcomings and improve their results. The optimal combination weight, W, is defined as follows:
where and are the weight coefficients of the AHP and entropy weight method, respectively. and can be expressed as follows:
where is the transposition of . By substituting Equation (9) and the values in Table 9 into Equations (16) and (17), the combined weights of the indices are as follows:
4. Fire Risk Assessment of Urban Underground Space Based on TOPSIS
TOPSIS is an effective multi-index evaluation method that has been verified in practice. In this method, the construction of positive and negative ideal solutions is the core of the evaluation problem. Based on the relative closeness between each scheme and the ideal scheme, the optimal actual scheme is selected [,,].
The decision matrix, B, consists of elements, and is defined as the ith row and the jth column element, which can be determined by Table 9. Then, the weighted decision matrix is constructed, and its solution is as follows:
where is the combined weight of the jth index. Furthermore, positive ideal solution and negative ideal solution are determined. and are defined as the jth index values of and , respectively, and their values are derived as follows:
The distance between the scheme to be evaluated and the positive and negative ideal solutions is then calculated. The distance from the ith scheme to the positive ideal solution, , can be expressed as follows:
The distance from the ith scheme to the negative ideal solution, , can be expressed as follows:
The relative closeness between each scheme and the ideal scheme, , is expressed as follows:
Based on the “red, orange, yellow, and blue” safety risk–control system proposed by the China Emergency Management Bureau, the requirements of fire prevention codes for building design, and the recommendations of experts in the fire control field, the urban underground fire risk was divided into three levels according to the relatively close degree (Table 10).
Table 10.
Urban underground fire-risk assessment level.
Finally, the relative closeness of Zones Ⅰ to Ⅲ in Financial City was calculated using MATLAB, and the fire risk level was obtained using the values in Table 10, as listed in Table 11. The fire risk level obtained in this paper cannot be verified from “real fires” as no one wants a fire to happen. However, after the risk assessment results in Table 11 were obtained in this study, three experts in the project management team of Guangzhou International Financial City (a design engineer, a safety manager in a construction unit, and an operations manager of an operation unit) were consulted through expert interviews. They believed that the evaluation results in this study are reasonable.
Table 11.
Fire risk level of underground space of Zones Ⅰ to Ⅲ in Financial City.
5. Conclusions
Firstly, evacuation simulation models were established based on Pathfinder for three zones of Guangzhou International Financial City, and the visual animation and the human flow rate diagram were obtained and analyzed. Then, an urban underground risk-assessment method based on the combined weighting method and TOPSIS was developed. The proposed method was applied to Zones Ⅰ to Ⅲ in Financial City. This process can be summarized in the following three steps:
(1) Based on analytic hierarchy process (AHP), six second-level indices are determined from three aspects: regional safety evacuation, regional fire prevention, and regional fire extinguishment. The value of regional safety evacuation was determined by the results of the evacuation simulation. A judgment matrix is constructed and then the subjective weight vector of second-level indices is determined.
(2) According to the data of Zones Ⅰ to Ⅲ in Financial City under the above second-level indices, the objective weight of the indices is obtained by the entropy weight method, and then the weight vector considering subjectivity and objectivity is determined by the combined weighting method.
(3) The relatively close degree between each scheme and the ideal scheme is calculated by TOPSIS, and it is used as an evaluation index to obtain the fire risk level of Zones Ⅰ to Ⅲ in Financial City. The fire risk level of Zone Ⅰ is high, requiring large-scale rectification. The fire risk level of Zone Ⅱ is low, and the fire toughness is strong. The fire risk level of Zone Ⅲ is medium and needs local rectification.
Author Contributions
Author Contributions: Conceptualization, P.L. and X.B.; methodology, D.W.; software, H.L.; validation, J.F. and P.L.; formal analysis, P.L. and X.B.; investigation, P.L. and X.B.; resources, D.W. and L.L.; data curation, P.L.; writing—original draft preparation, P.L. and L.L.; writing—review and editing, X.B. and L.L.; visualization, J.F.; supervision, X.B. and L.L.; project administration, C.H. and X.X.; funding acquisition, X.B., C.H. and L.L. All authors have read and agreed to the published version of the manuscript.
Funding
This research was supported by the National Key R&D Program of China (No. 2019YFC1511104), the National Natural Science Foundation of China (No. 52090084), the Guangdong Basic and Applied Basic Research Foundation (Nos. 2023A1515011433 and 2024A1515011928), the Shenzhen Natural Science Fund (the Stable Support Plan Program 20220810155553002), and the Peacock team plan of Shenzhen (Grant No. KQTD20200909113951005).
Institutional Review Board Statement
Not applicable.
Informed Consent Statement
Not applicable.
Data Availability Statement
The original contributions presented in the study are included in the article, further inquiries can be directed to the corresponding author.
Conflicts of Interest
Author Daochu Wang, Xiaofeng Xie and Jianhao Fan was employed by the Guangzhou Construction Engineering Co., Ltd. The remaining authors declare that the research was conducted in the absence of any commercial or financial relationships that could be construed as a potential conflict of interest.
References
- Li, Y.Z.; Ingason, H. Overview of research on fire safety in underground road and railway tunnels. Tunn. Undergr. Sp. Tech. 2018, 81, 568–589. [Google Scholar] [CrossRef]
- Wang, N.; Gao, Y.; Li, C.; Gai, W. Integrated agent-based simulation and evacuation risk-assessment model for underground building fire: A case study. J. Build. Eng. 2021, 40, 102609. [Google Scholar] [CrossRef]
- Qin, J.; Liu, C.; Huang, Q. Simulation on fire emergency evacuation in special subway station based on Pathfinder. Case Stud. Therm. Eng. 2020, 21, 100677. [Google Scholar] [CrossRef]
- Ronchi, E.; Arias, S.; La Mendola, S.; Johansson, N. A fire safety assessment approach for evacuation analysis in underground physics research facilities. Fire Saf. J. 2019, 108, 102839. [Google Scholar] [CrossRef]
- Sun, Q.; Turkan, Y. A BIM-based simulation framework for fire safety management and investigation of the critical factors affecting human evacuation performance. Adv. Eng. Inf. 2020, 44, 101093. [Google Scholar] [CrossRef]
- Feng, X.; Gao, M.; Zhou, Y.; Li, J. Simulation and Optimization of Emergency Evacuation in Gold. Museum Based on AnyLogic; IOP Publishing: Bristol, UK, 2020; p. 32080. [Google Scholar]
- Rani, G.; Siddiqui, N.A.; Yadav, M.; Ansari, S. Hierarchical integrated spatial risk assessment model of fire hazard for the core city areas in India. Land. Use Policy 2023, 126, 106536. [Google Scholar] [CrossRef]
- Granda, S.; Ferreira, T.M. Assessing Vulnerability and Fire Risk in Old Urban Areas: Application to the Historical Centre of Guimarães. Fire Technol. 2019, 55, 105–127. [Google Scholar] [CrossRef]
- Nan, S.; Li, K.; Li, P.; Tang, F.; Baolati, J.; Zou, Y.; Tu, J.; Jin, Y. A Novel Method for Priority Assessment of Electrical Fire Risk in Typical Underwater Equipment Cabins in China. Fire Technol. 2022, 58, 2441–2462. [Google Scholar] [CrossRef]
- Lu, Y.; Fan, X.; Zhang, Y.; Wang, Y.; Jiang, X. Machine learning models using SHapley Additive exPlanation for fire risk assessment mode and effects analysis of stadiums. Sensors 2023, 23, 2151. [Google Scholar] [CrossRef]
- Casallas, A.; Jiménez-Saenz, C.; Torres, V.; Quirama-Aguilar, M.; Lizcano, A.; Lopez-Barrera, E.A.; Ferro, C.; Celis, N.; Arenas, R. Design of a forest fire early alert system through a deep 3D-CNN structure and a WRF-CNN bias correction. Sensors 2022, 22, 8790. [Google Scholar] [CrossRef]
- Omidvari, M.; Mansouri, N.; Nouri, J. A pattern of fire risk assessment and emergency management in educational center laboratories. Saf. Sci. 2015, 73, 34–42. [Google Scholar] [CrossRef]
- Ding, N.; Chen, T.; Zhu, Y.; Lu, Y. State-of-the-art high-rise building emergency evacuation behavior. Phys. A Stat. Mech. Its Appl. 2021, 561, 125168. [Google Scholar] [CrossRef]
- Nair Shalliker, V.; Yap, S.; Nunez, C.; Egger, S.; Rodger, J.; Patel, M.I.; O’Connell, D.L.; Sitas, F.; Armstrong, B.K.; Smith, D.P. Adult body size, sexual history and adolescent sexual development, may predict risk of developing prostate cancer: Results from the New South Wales Lifestyle and Evaluation of Risk Study (CLEAR). Int. J. Cancer 2017, 140, 565–574. [Google Scholar] [CrossRef] [PubMed]
- Choi, M.; Jun, S. Fire Risk Assessment Models Using Statistical Machine Learning and Optimized Risk Indexing. Appl. Sci. 2020, 10, 4199. [Google Scholar] [CrossRef]
- Gulum, P.; Ayyildiz, E.; Gumus, A.T. A two level interval valued neutrosophic AHP integrated TOPSIS methodology for post-earthquake fire risk assessment: An application for Istanbul. Int. J. Disast Risk Reduct. 2021, 61, 102330. [Google Scholar] [CrossRef]
- Kokangül, A.; Polat, U.; Dağsuyu, C. A new approximation for risk assessment using the AHP and Fine Kinney methodologies. Saf. Sci. 2017, 91, 24–32. [Google Scholar] [CrossRef]
- Li, M.; Wang, H.; Wang, D.; Shao, Z.; He, S. Risk assessment of gas explosion in coal mines based on fuzzy AHP and bayesian network. Process Saf. Environ. 2020, 135, 207–218. [Google Scholar] [CrossRef]
- Kumari, B.; Pandey, A.C. Geo-informatics based multi-criteria decision analysis (MCDA) through analytic hierarchy process (AHP) for forest fire risk mapping in Palamau Tiger Reserve, Jharkhand state, India. J. Earth Syst. Sci. 2020, 129, 1–16. [Google Scholar] [CrossRef]
- Bai, M.; Liu, Q. Evaluating Urban Fire Risk Based on Entropy-Cloud Model Method Considering Urban Safety Resilience. Fire 2023, 6, 62. [Google Scholar] [CrossRef]
- Li, W.; Li, H.; Liu, Y.; Wang, S.; Pei, X.; Li, Q. Fire risk assessment of high-rise buildings under construction based on unascertained measure theory. PLoS ONE 2020, 15, e239166. [Google Scholar] [CrossRef]
- Chunyi, W.; Xinsheng, N.; Ming, L.; Lei, F.; Litong, Q. A Combined Weighting Method for Power System Restoration Decision Making; IEEE: New York, NY, USA, 2011; pp. 1223–1227. [Google Scholar]
- Ma, Z.; Song, J.; Zhang, J. Energy consumption prediction of air-conditioning systems in buildings by selecting similar days based on combined weights. Energ. Build. 2017, 151, 157–166. [Google Scholar] [CrossRef]
- Yazir, D. Application of IF-TOPSIS method on fixed fire fighting systems for cargo hold fires on the dry/bulk cargo ships. Ocean. Eng. 2022, 260, 111891. [Google Scholar] [CrossRef]
- Yang, X.; Xiong, S.; Li, H.; He, X.; Ai, H.; Liu, Q. Research on Forest Fire Helicopter Demand. Forecast. Based on Index. Fuzzy Segmentation and TOPSIS; IEEE: New York, NY, USA, 2019; pp. 1–8. [Google Scholar]
- Liu, L.; Wan, X.; Li, J.; Wang, W.; Gao, Z. An Improved Entropy-Weighted Topsis Method for Decision-Level Fusion Evaluation System of Multi-Source Data. Sensors 2022, 22, 6391. [Google Scholar] [CrossRef] [PubMed]
Disclaimer/Publisher’s Note: The statements, opinions and data contained in all publications are solely those of the individual author(s) and contributor(s) and not of MDPI and/or the editor(s). MDPI and/or the editor(s) disclaim responsibility for any injury to people or property resulting from any ideas, methods, instructions or products referred to in the content. |
© 2024 by the authors. Licensee MDPI, Basel, Switzerland. This article is an open access article distributed under the terms and conditions of the Creative Commons Attribution (CC BY) license (https://creativecommons.org/licenses/by/4.0/).