Article

An Experimental Insight into the Use of N-Butanol as a Sustainable Aviation Fuel

1
Romanian Research and Development Institute for Gas Turbines—COMOTI, 220D Iuliu Maniu, 061126 Bucharest, Romania
2
Faculty of Aerospace Engineering, National University of Science and Technology Politehnica Bucharest, 1–7 Polizu Street, 1, 011061 Bucharest, Romania
*
Author to whom correspondence should be addressed.
Fire 2024, 7(9), 313; https://doi.org/10.3390/fire7090313
Submission received: 2 July 2024 / Revised: 30 August 2024 / Accepted: 30 August 2024 / Published: 6 September 2024
(This article belongs to the Special Issue Efficient Combustion of Low-Carbon Fuels)

Abstract

:
This study investigates the performance and environmental impact of n-butanol blended with Jet-A fuel in turbo engines, aiming to assess its viability as a sustainable aviation fuel (SAF). The research involves the experimental testing of various blends, ranging from low to high concentrations of n-butanol, to determine their effects on engine performance and emissions. The experimental setup includes comprehensive measurements of engine parameters such as thrust, fuel consumption rates, and exhaust gas temperatures. Emissions of sulfur dioxide (SO2), and carbon monoxide (CO) are also analyzed to evaluate environmental impacts. Key findings indicate that n-butanol/Jet-A blends can significantly enhance combustion efficiency and reduce emissions compared to conventional Jet-A fuel. Higher n-butanol concentrations lead to improved thermal efficiency and lower SO2 and CO emissions. This study underscores the potential of n-butanol as an SAF for turbo engines, highlighting its ability to mitigate environmental impacts while maintaining or improving engine performance. This research supports the feasibility of integrating n-butanol into Jet-A blends for turbo engine applications, emphasizing their role in achieving more environmentally friendly aviation operations.

1. Introduction

Current research is focused on climate change, biofuels, engine technologies, and the environmental impact of alternative fuels. It highlights the importance of integrating adaptation measures into projections of climate change impacts on health outcomes, noting that doing so generally reduces adverse effects. There is a call for better data and models that dynamically account for these adaptations, along with recommendations for policymakers to incorporate these considerations into health planning to more effectively mitigate climate change effects [1].
The current state and future potentials of biofuels within a circular bioeconomy framework are also being studied by various research groups. They discuss various biofuels like biodiesel, bioethanol, and biogas, emphasizing their environmental benefits, such as waste reduction and lower carbon emissions. However, the economic and policy challenges are also pointed out, underscoring the need for advancements in biotechnological processes and integrated biorefineries to enhance efficiency and sustainability. Future directions including the improvement of feedstock availability, fostering technological innovations, and developing supportive policies aiming to advance a sustainable bioeconomy are also suggested and explored [2,3,4].
There is an underappreciated role of bio-alcohols like methanol, ethanol, and butanol as sustainable aviation fuels (SAFs); however, the research indicates that these alcohols improve combustion efficiency and reduce emissions compared to classic aviation fuels (e.g., Jet A), with methanol and ethanol being particularly effective. This study highlights the environmental and performance benefits of using these alcohols in turbocharged spark-ignition engines and as additives to gasoline. However, while ethanol and methanol blends enhance engine efficiency and reduce emissions, butanol slightly increases CO emissions. Overall, hydrogen emerges as the most sustainable option for reducing greenhouse gas emissions, especially when it is produced from renewable sources [5,6,7,8].
Finally, the influence of bio-alcohols on engine performance is studied, particularly in ethanol–gasoline blends. Studies show that these blends improve combustion efficiency and reduce emissions, although they may increase fuel consumption due to alcohol’s lower energy density. Of great importance are government policies related to ethanol production, particularly in the U.S., where policies like the Renewable Fuel Standard (RFS) have played a critical role. The RFS emphasizes the environmental benefits of ethanol and other alcohol fuels but stresses the need to balance policy, market conditions, and technological advancements for future growth [9,10,11].
As for the use of alcohols in turbo engines, multiple studies on alternative fuels for aviation engines were undertaken. Some of the studies evaluate the combustion of biodiesel-based sustainable aviation fuel (SAF) in turbo engines, finding that it reduces CO2 and NOx emissions while maintaining stable performance akin to conventional jet fuel [12]. Other studies explore the use of recycled sunflower and palm oil-derived biodiesel in micro-turbo engines, highlighting the environmental benefits and improved engine performance; they also examine various alternative fuels in microturbine and turbofan engines, showing that they can sustain or enhance performance while reducing NOx and particulate emissions [13]. Additionally, ethanol blends with Jet A-1 fuel are investigated, demonstrating improved combustion efficiency and reduced emissions, indicating ethanol’s potential to enhance aviation sustainability [14]. Collectively, these studies underscore the promise of biodiesel and ethanol blends in advancing aviation’s environmental sustainability through reduced emissions and improved engine performance.
There are also papers that examine the certification process of adapting the carburetor of an aircraft engine to run on ethanol as a primary fuel, discussing technical and regulatory considerations. It emphasizes the observed performance and emission characteristics during testing, demonstrating ethanol’s feasibility as an alternative fuel for light aircrafts and highlighting its environmental benefits. Litt et al., simulate the effects of alternative the fuels used in turbofan engines, employing advanced modeling to evaluate their impact on performance and emissions. Their study provides insights into how these fuels can potentially mitigate environmental impacts in commercial aviation. Additionally, Gawron et al., investigate a miniature turbojet engine fueled by Jet A-1 blended with alcohol, analyzing combustion efficiency and emissions such as NOx and particulate matter (PM). Their findings suggest that alcohol blends can improve combustion efficiency, reduce emissions, and are particularly beneficial for small-scale turbojet applications. Altogether, these studies highlight the advantages of using ethanol-based blends in light aircrafts, the simulation benefits for turbofan engines, and performance enhancements with alcohol blends in miniature turbojets, contributing to sustainable aviation by enhancing engines’ efficiency and reducing gaseous emissions [15,16,17,18].
Blends made of alcohols and different aviation fuels have been studied in terms of engine performance, gaseous emissions, and their overall usage as SAFs; for instance, ethanol’s application in small turbojet engines emphasizes its potential to improve engine performance and reduce emissions, thereby promoting its role as a sustainable aviation fuel [19]. Cican et al. [20] analysed bioethanol blends in micro-turbojet engines, finding that they enhance combustion efficiency and decrease gaseous emissions, highlighting their suitability for micro-turbojet applications. Some researchers have experimented with butyl butyrate and ethanol blends in gas turbine combustors, demonstrating their ability to reduce emissions and enhance combustion efficiency [21]. Additionally, Cican et al., evaluate methanol/Jet-A blends for turbo engines, showing promising results in improving engine efficiency and reducing environmental impact. Together, these studies show the advancements in alternative fuel blends such as ethanol, bioethanol, butyl butyrate, and methanol, emphasizing their potential to enhance both performance and sustainability in the aviation industry. Ongoing research promises further improvements in efficiency and environmental benefits, contributing to the evolution of more sustainable aviation propulsion systems [22].
The current paper explores the use of n-butanol in a compact turbojet engine, aiming to assess its feasibility as a potential fuel for small turbojet engines in a Jet A/n-butanol blend. Building on prior research, this study focuses on evaluating the operational parameters of the micro-turbo engines used in small aircrafts such as drones and aero-models. Additionally, it investigates transient processes, including engine stability during start-up and abrupt accelerations and decelerations, while analyzing gaseous emissions like CO and SO2.
This research involves varying the Jet A/n-butanol compositions in the blends and comparing them against a benchmark of classical aviation fuel—Jet A with 5% Aeroshell 500 Oil (Ke). Specifically, blends with 10%, 20%, and 30% (wt.%) n-butanol were analyzed to understand their impact on the engine’s performance and gaseous emissions. This comparative analysis aims to provide insights and take a step forward in relation to the potential benefits and challenges of using n-butanol as a renewable component in aviation fuel blends, potentially advancing the development of more sustainable and efficient micro-turbojet engines for unmanned aerial vehicles (UAVs) and similar applications.

2. Materials and Methods

The following five types of fuels were examined: Jet A aviation fuel +5% Aeroshell 500 Oil (Ke); n-butanol (B) and blends of Ke+ 10%B, Ke+ 20%B, and Ke+ 30%B (these are mass percentages). This chapter will detail the experimental evaluation of several physical–chemical properties of the fuel samples. Additionally, testing will be performed by running a micro-turbojet engine on these fuels and blends.

2.1. Blend Characterization

The fuel characterization was carried out experimentally by measuring various parameters such as density, kinematic viscosity, flash point, lower calorific value, FT-IR analysis, and elemental analysis.
Density was measured for all samples at a temperature of 22 °C following SR EN ISO 3675/2002 standards [23], using a graduated cylinder and a thermal densimeter manufactured by Termodensirom SA, Bucharest, Romania. Flash point was determined for all samples according to ASTM D92 standards [24], using a Cleveland flash point tester provided by Scavini, Italy. Kinematic viscosity was measured for all samples at 40 °C in accordance with SR EN ISO 3104/2002 standards [25], using a viscometer supplied by Scavini, Italy. The lower calorific value was determined for all samples following ASTM D240-17 standards [26]. An IKA WERKE C 2000 calorimeter sourced from Cole-Parmer, St. Neots, UK, was used, as well as a C 5012 calorimeter bomb manufactured by IKA Analisentechnik GmbH, Staufen, Germany. Fourier transform infrared spectroscopy (FTIR) analysis was conducted using a Spectrum Oil Express Series 100 spectrometer, version 3.0, provided by Perkin Elmer, Romanian representative located in Tâncăbești, Romania, along with its dedicated software (Spectrum OilExpress v3.0.0 provided by Perkin Elmer along with the spectometer).
Elemental analysis was performed on all five samples to identify the primary elements (C, N, H, and O), following the ASTM D 5291-16 standards [27].
Further details about the fuel characterization process can be found in [22].

2.2. Theoretical Combustion Process

After determining the elemental composition (as shown in Table 1), the minimum air quantities required for stoichiometric combustion for Jet A + 5% Aeroshell 500, butanol (B), and the respective blends were calculated, as well as the resulting amounts of CO2 and H2O from stoichiometric combustion.
For the necessary calculations, the general formula considered for hydrocarbons is CcHhOo [22], with specific fractions for each element gC, gH, gO, and gN.
Calculating the required amount of oxygen for stoichiometric combustion is essential for obtaining information about the combustion process and facilitating a comprehensive understanding of the involved chemical reactions. This can be achieved using Equation (1), as follows:
M o = 2.667 g C + 8 g H g c
Using Equation (1), the quantity of air for stoichiometric combustion can be calculated as follows:
M a i r = 4.35 M o
Using Equations (3) and (4), the quantity of CO2 and H2O produced during the combustion process can be calculated as follows:
C O 2 = 44 g C 12
H 2 O = 9 g H

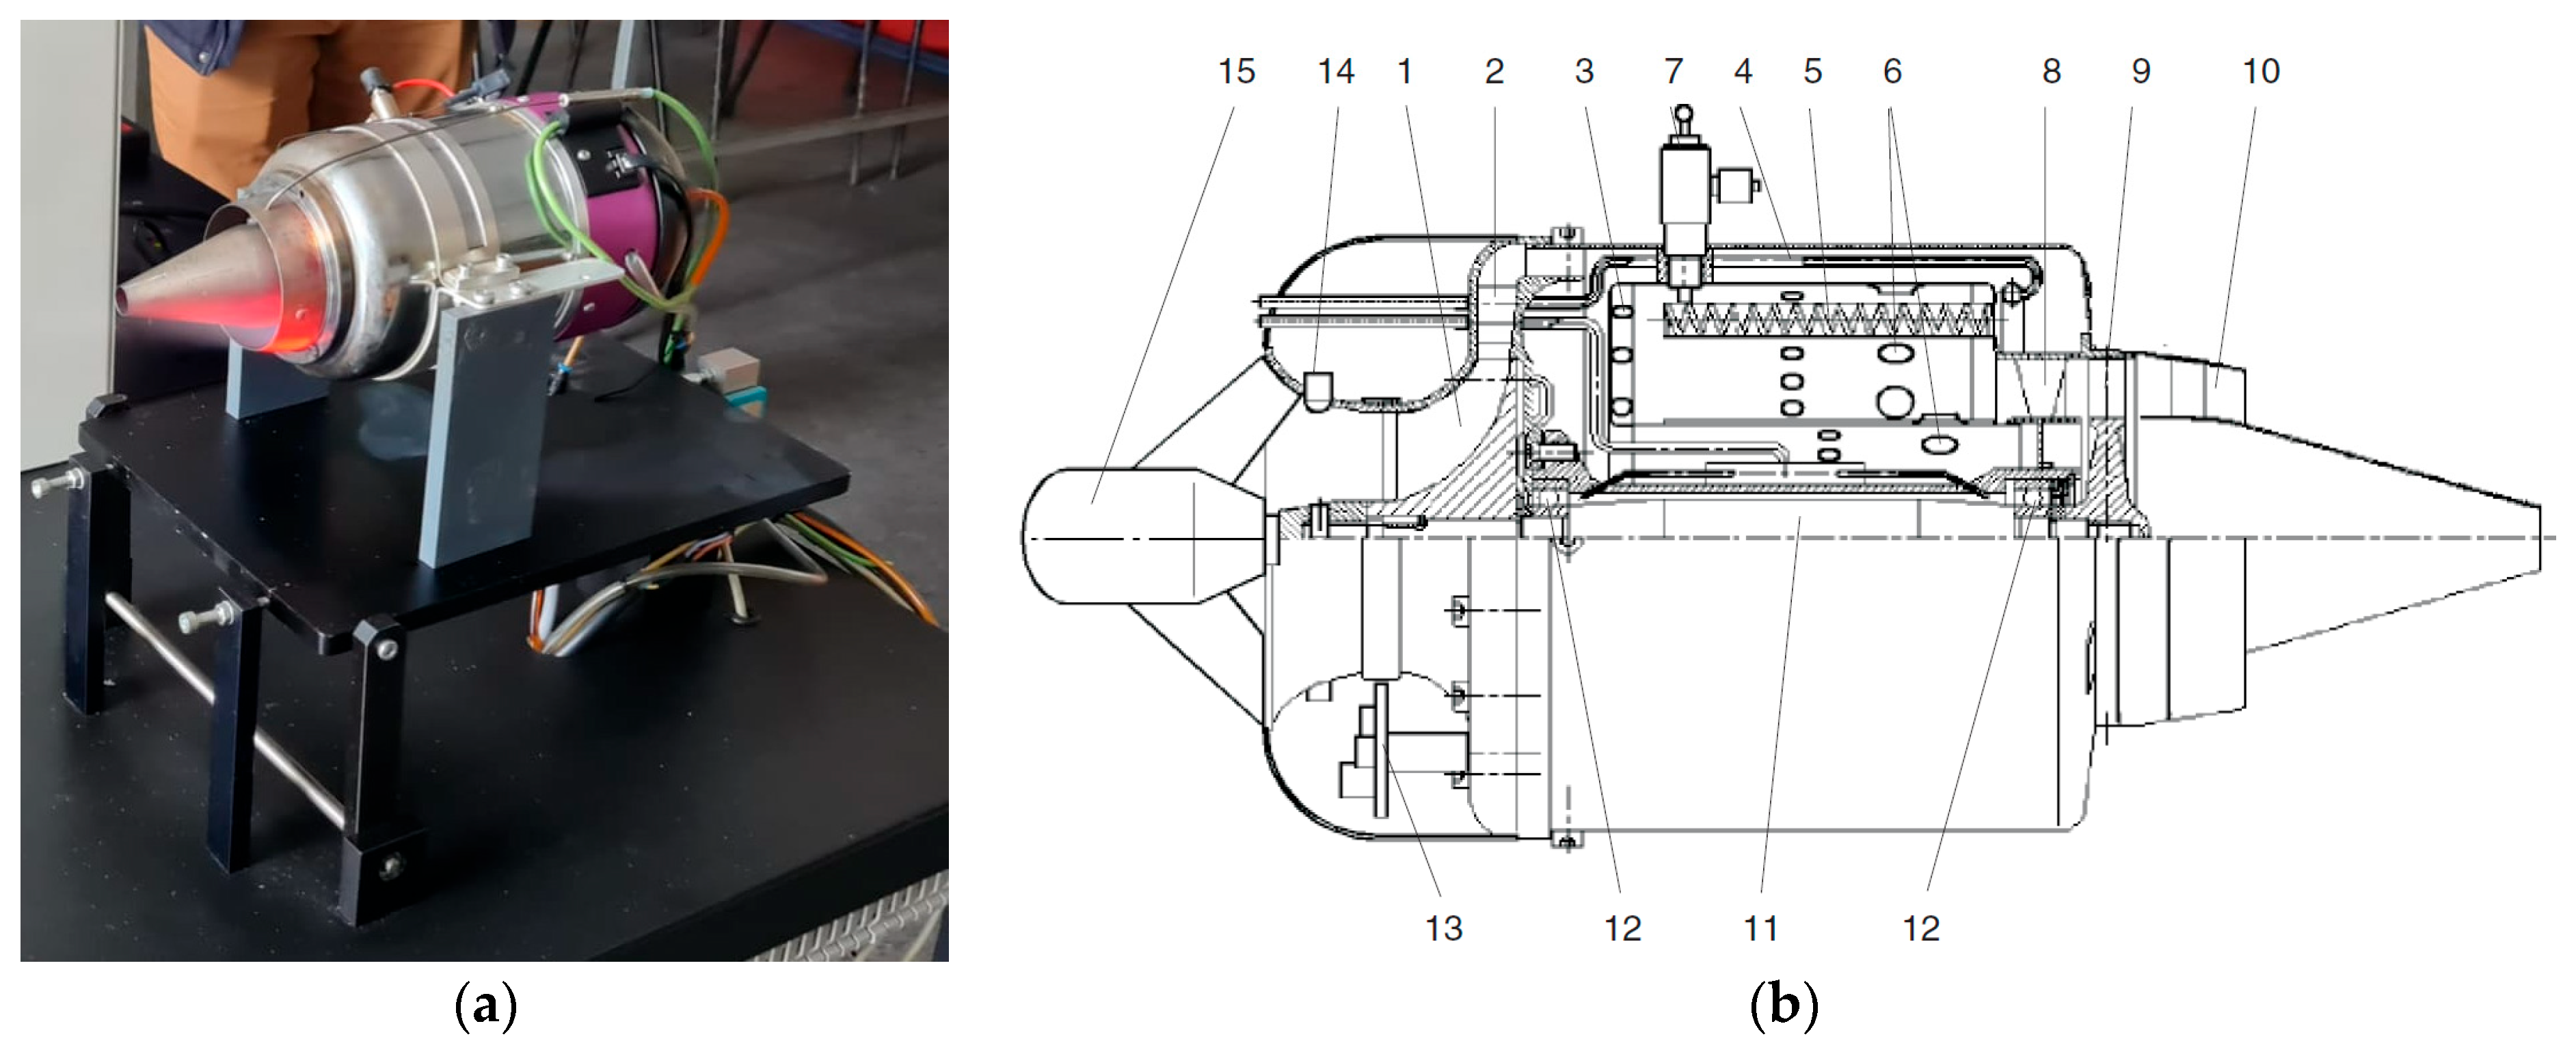
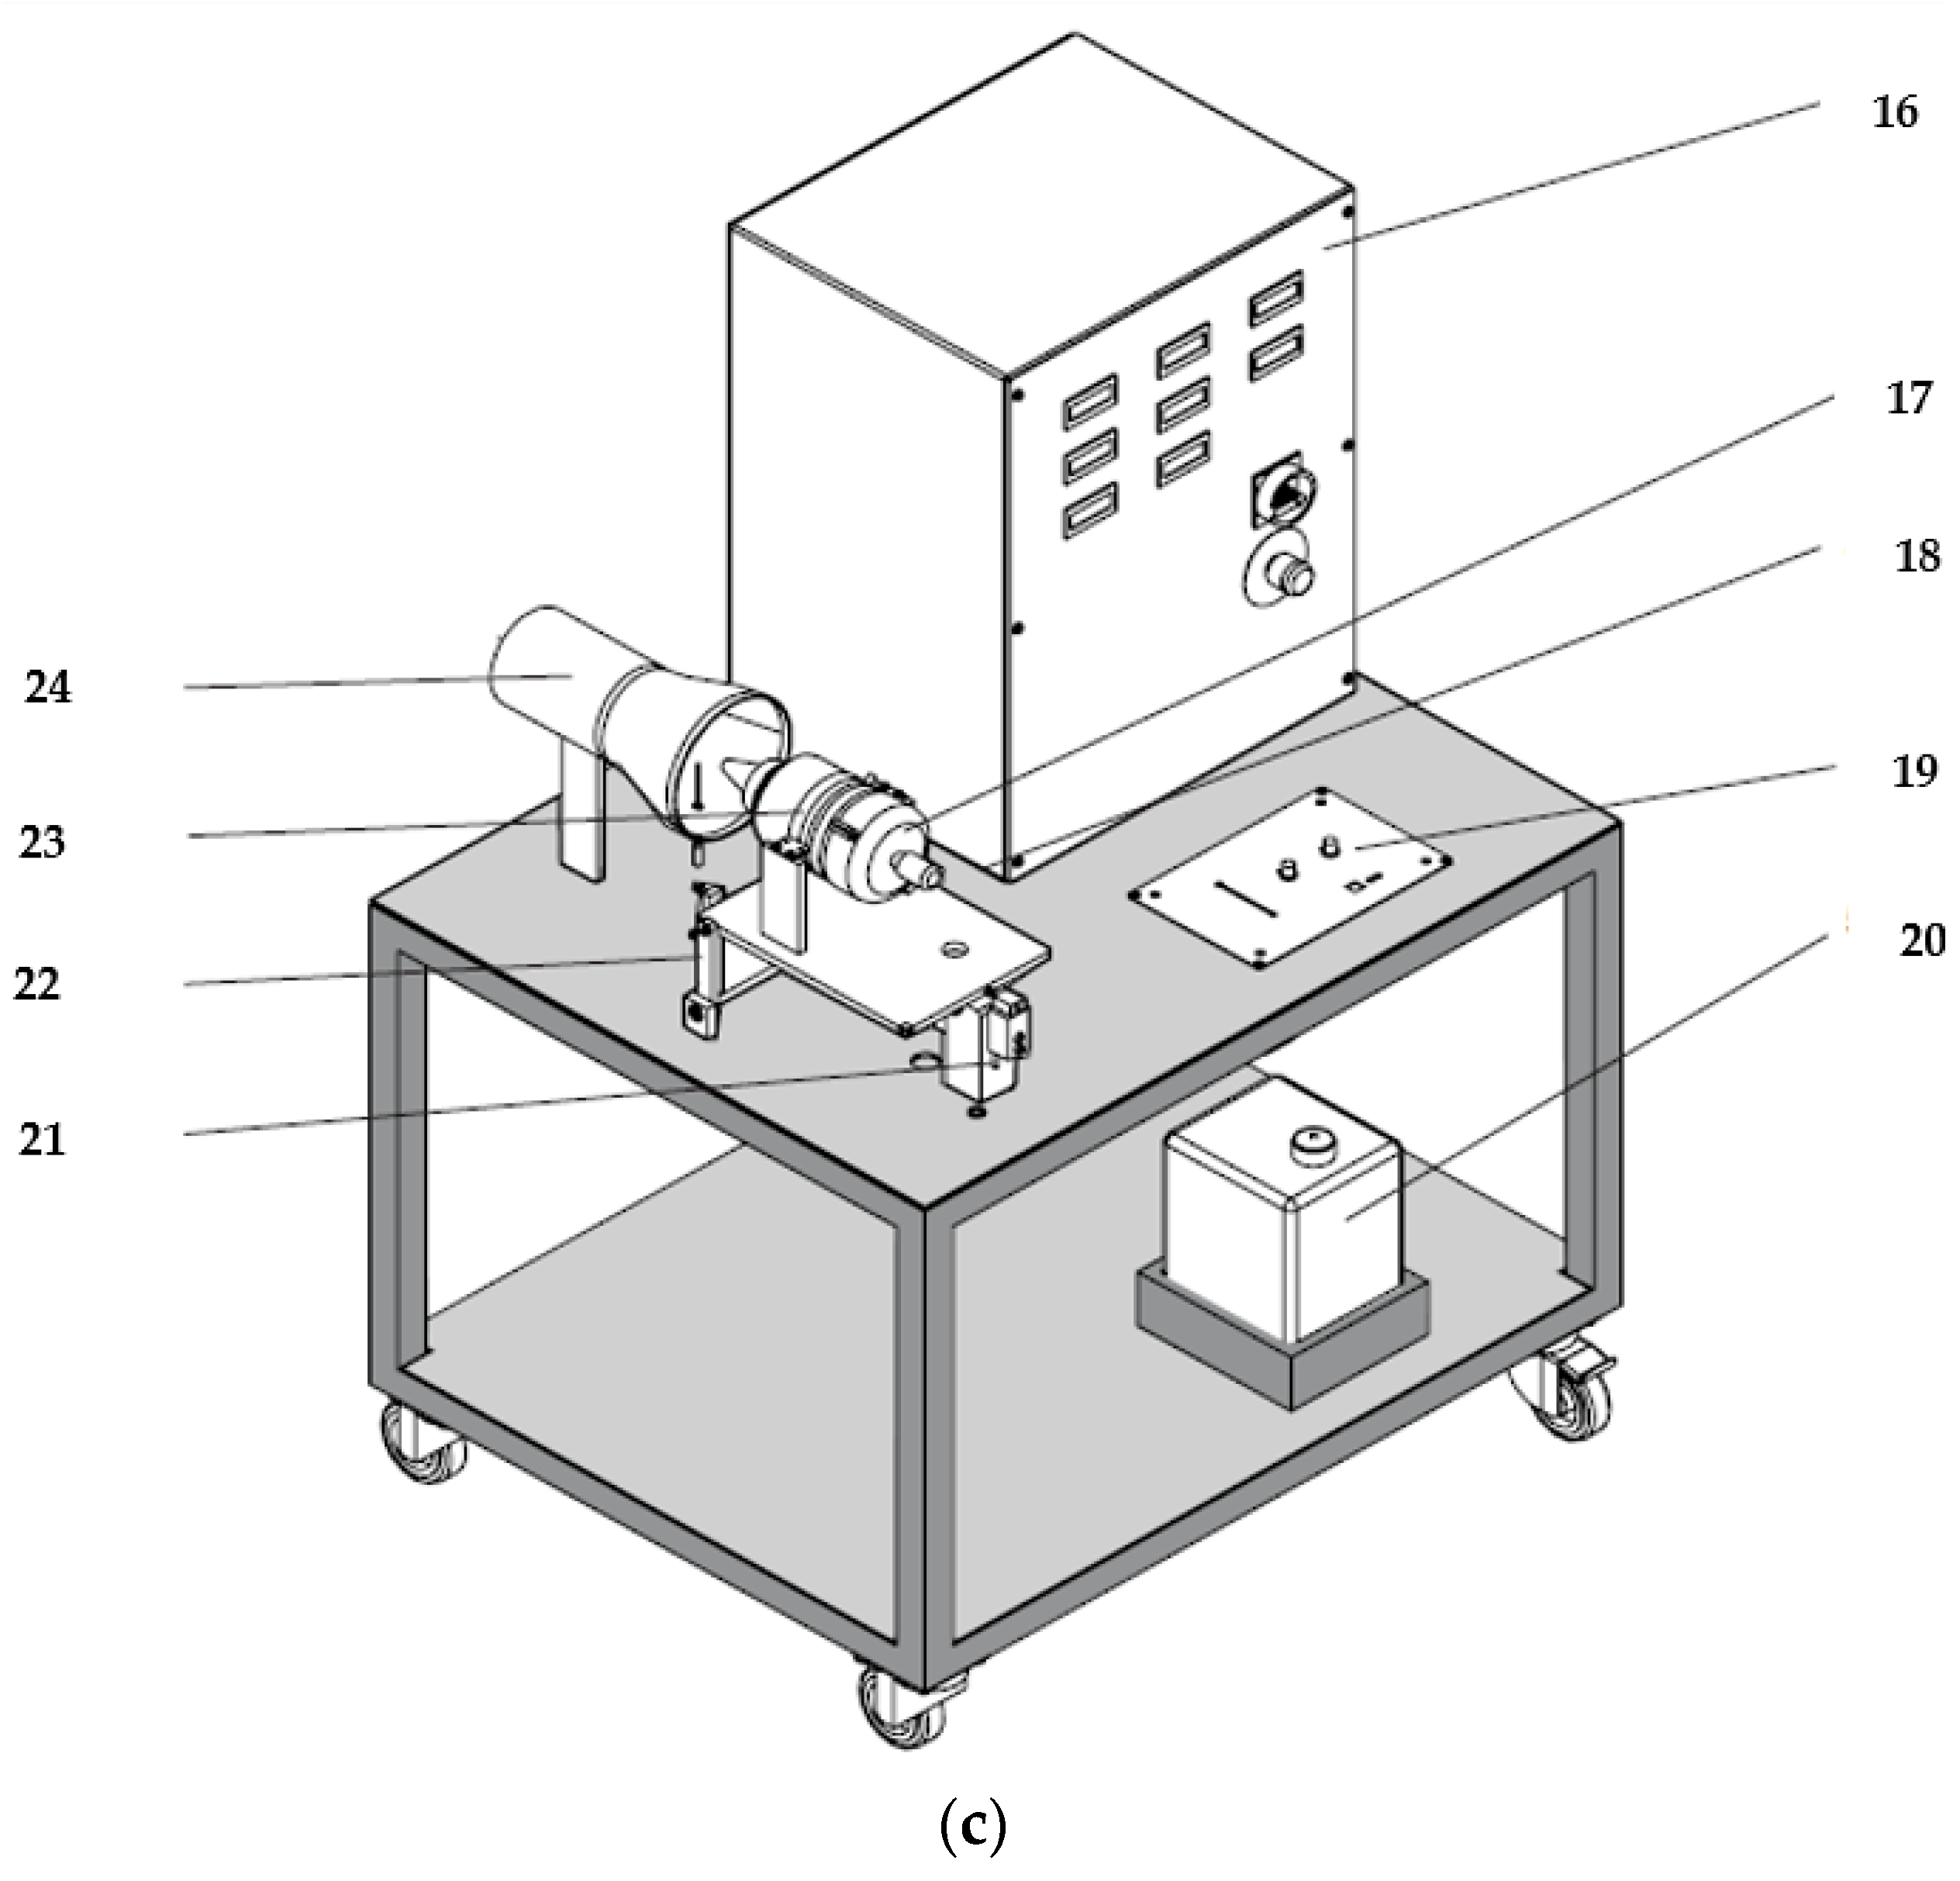
2.3. Turbo Engine Testing Methodology

The experiments were conducted using the Jet CAT P80® micro-turbojet engine provided by GUNT Hamburg, Germany [28]. Figure 1 shows the test stand and its main components.
The turbo engine consists of an axial turbine linked directly to a radial compressor and an annular combustion chamber. These elements, along with the intermediate bearing housing, form a compact unit originally intended for use in model airplanes. The process starts with the rapid rotation of the compressor wheel (1), which spins at speeds between 35,000 and 115,000 rpm, accelerating the intake air. This air then enters the aluminum diffuser (2), where its kinetic energy is converted into pressure.
At the inlet of the combustion chamber (3), a portion of the air is redirected to the front of the flame tube (4). Simultaneously, liquid fuel is introduced from the rear into specialized evaporator tubes (5) where it is converted into gas. This gaseous fuel is then mixed with the primary air towards the front of the combustion chamber and is ignited. The flame tube is cooled externally by secondary air, which is channeled through bores (6), to reduce the extremely high combustion temperatures (approximately 2000 °C) to the acceptable turbine inlet temperature range of 600–800 °C. An igniter glow plug (7) initiates the combustion process during start-up. The resulting combustion gasses flow into the turbine’s diffuser (8), gaining velocity before entering the axial wheel (9). In the turbine, these gasses transfer their energy to drive the compressor wheel, experiencing partial relaxation and cooling in the process. Finally, the gasses are expelled through the thrust nozzle (10) at approximately 600 °C. The turbine and compressor wheels are mounted on a shared shaft (11), which is supported by ball bearings (12) within the bearing housing, and are cooled by the compressor air. The front hood contains the electronics (13) responsible for the starter motor (15), temperature monitoring, and speed measurement (14).
The following additional components are included: (16) the switch cupboard with indicators; (17) the inlet nozzle for air flow measurement; (18) the turbine desk; (19) the gas turbine control panel; (20) the fuel tank; (21) the force sensor for thrust measurement; (22) the bearing of the turbine desk; (23) the jet turbine; and (24) the mixing tube.
The micro-turbo engine is operated from a control panel positioned in front of the turbine. It contains the status displays of the control electronics (19). The turbine’s power is adjusted via the throttle slide control. An electric fuel pump delivers the fuel to the turbine’s evaporator tubes. The rotation speed of the pump, and thus the fuel quantity, is controlled and monitored by the control electronics. A quick-acting gate valve shuts off the fuel flow in an emergency.
The automatic starter system consists of a high-power DC motor. It drives the compressor wheel via an automatic cone clutch. At a specific minimum speed, the glow plug is activated and the auxiliary fuel is fed into the glow plug via a solenoid valve. After ignition, the electric motor accelerates the turbine. At a specific temperature in the combustion chamber, the main fuel supply is activated and the auxiliary fuel is shut off. The electric motor continues to assist the start-up. The entire start-up process is monitored via the speed and turbine temperature and is electronically controlled.
The micro-turbojet engine used for the experiments is of the turbojet type, as shown in Figure 1. More information about its description can be found in [29].
To record the parameters of interest during the experiments, a series of sensors measure and record thrust, temperature in front of the turbine, temperature after the compressor, RPM, pressure at the combustion chamber outlet, fuel flow, and airflow. The instrumentation of the micro-turbojet engine allows for the continuous recording of all these parameters at intervals of one second.
Type K thermocouples were used for temperature measurements, while a root-extracting static pressure sensor was used to measure the nozzle pressure at the air inlet. This uses the UNICON-P Pressure Converter produced by GHM GROUP (Martens, Germany). A root-extracting pressure sensor from Huba Control, Switzerland, was utilized to measure pressures in the combustion chamber. Thrust was measured using a KM701 K 200 N 000 Z force transducer with a sensitivity of 2 mV/N, produced by MEGATRON Elektronik GmbH & Co. KG, Based Putzbrunn, Germany. Additionally, a tachometer was employed to measure speed, and the fuel flow was measured using fuel from the fuel pump actuator.
Since this type of turbojet engine is not equipped with an oil pump, the bearings are lubricated with fuel; therefore, 5% Aeroshell 500 oil is added to the fuel.
Tests were conducted under the three most important operating regimes of the micro-turbojet engine—idle, cruise, and maximum. To ensure a better measurement accuracy, the micro-turbojet engine was maintained in each regime for approximately two minutes, during which the parameters were recorded and averaged.
When the micro-turbo engine operates with its designated fuel (Ke in our case), its automatic control system knows that at a certain throttle percentage, it will have a specific rotational speed. When a different fuel with different properties is used, such as n-butanol in our case, the turbine’s delivered power will be lower, causing the micro-turbo engine’s speed to decrease. However, the automatic control system kicks in and will supply more fuel to the combustion chamber to ensure that the micro-turbo engine maintains the same rotational speed at the same throttle percentage, regardless of the type of fuel used.

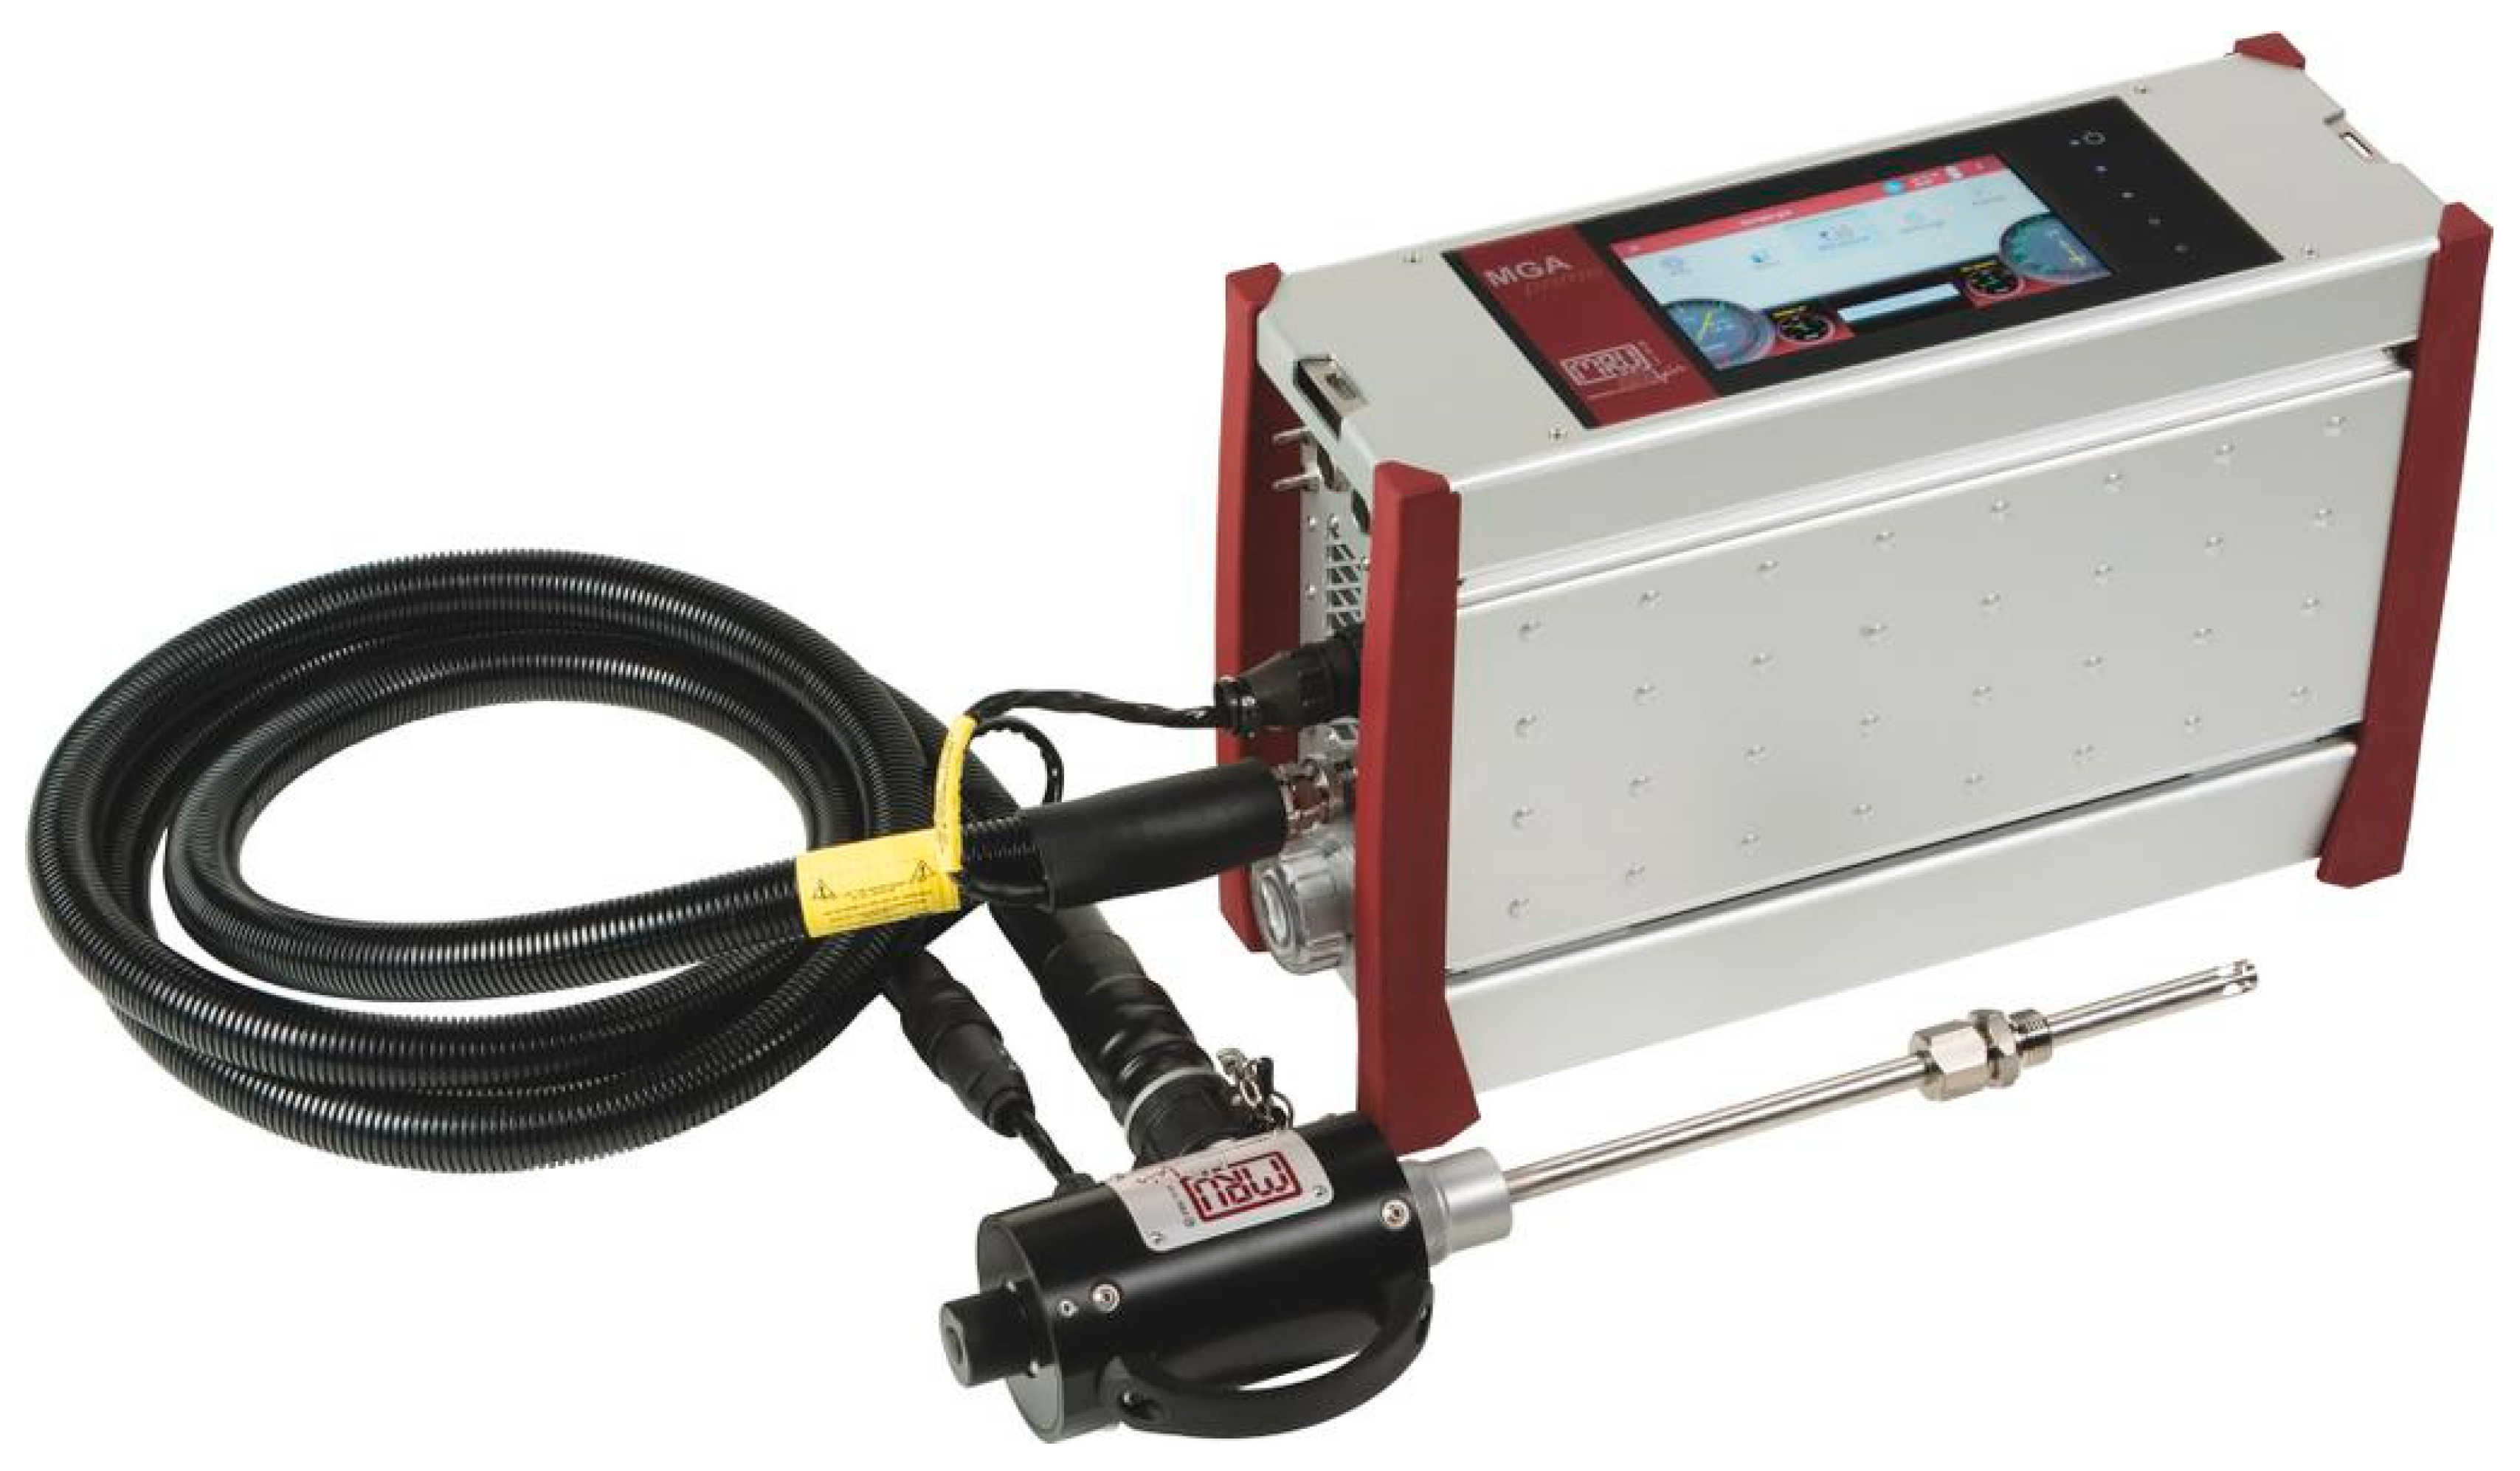
2.4. Gaseous Emission Measurements

Gaseous emission measurements were conducted using the MRU Vario Plus analyzer (Messgeräte für Rauchgase und Umweltschutz GmbH, Neckarsulm-Obereisesheim, Germany), as shown in Figure 2. Simultaneously, the analyzer measured various gas components, including those of interest, namely CO and SO2. The measuring range for sulfur dioxide (SO2) was 0–2000 ppm with an accuracy of ± 10 ppm or 5%; for carbon monoxide (CO), the measuring range was 0–4000 ppm with an accuracy of ± 10 ppm or 5%.

3. Results and Discussion

3.1. Experimental Results for the Physical–Chemical Properties of Fuel Blends

The experimentally determined values for the physical–chemical properties are presented in Table 1.
Based on the data from Table 1, elemental analysis shows that the carbon and hydrogen content decreases as the alcohol concentration in the blends increases, while the oxygen content increases. This change can reduce CO2 emissions during combustion due to reduced oxygen demand. Additionally, the flash point, kinematic viscosity, and density decrease proportionally to the increase in alcohol percentage, highlighting its significant impact on physical properties. FT-IR analysis is essential for detecting chemical changes in fuels, especially when alcohols or biodiesel are added. The FTIR spectra presented in Figure 3 reflect the changes in Ke, Ke+ 10%B, Ke+ 20%B, Ke+ 30%B, and 100%B.
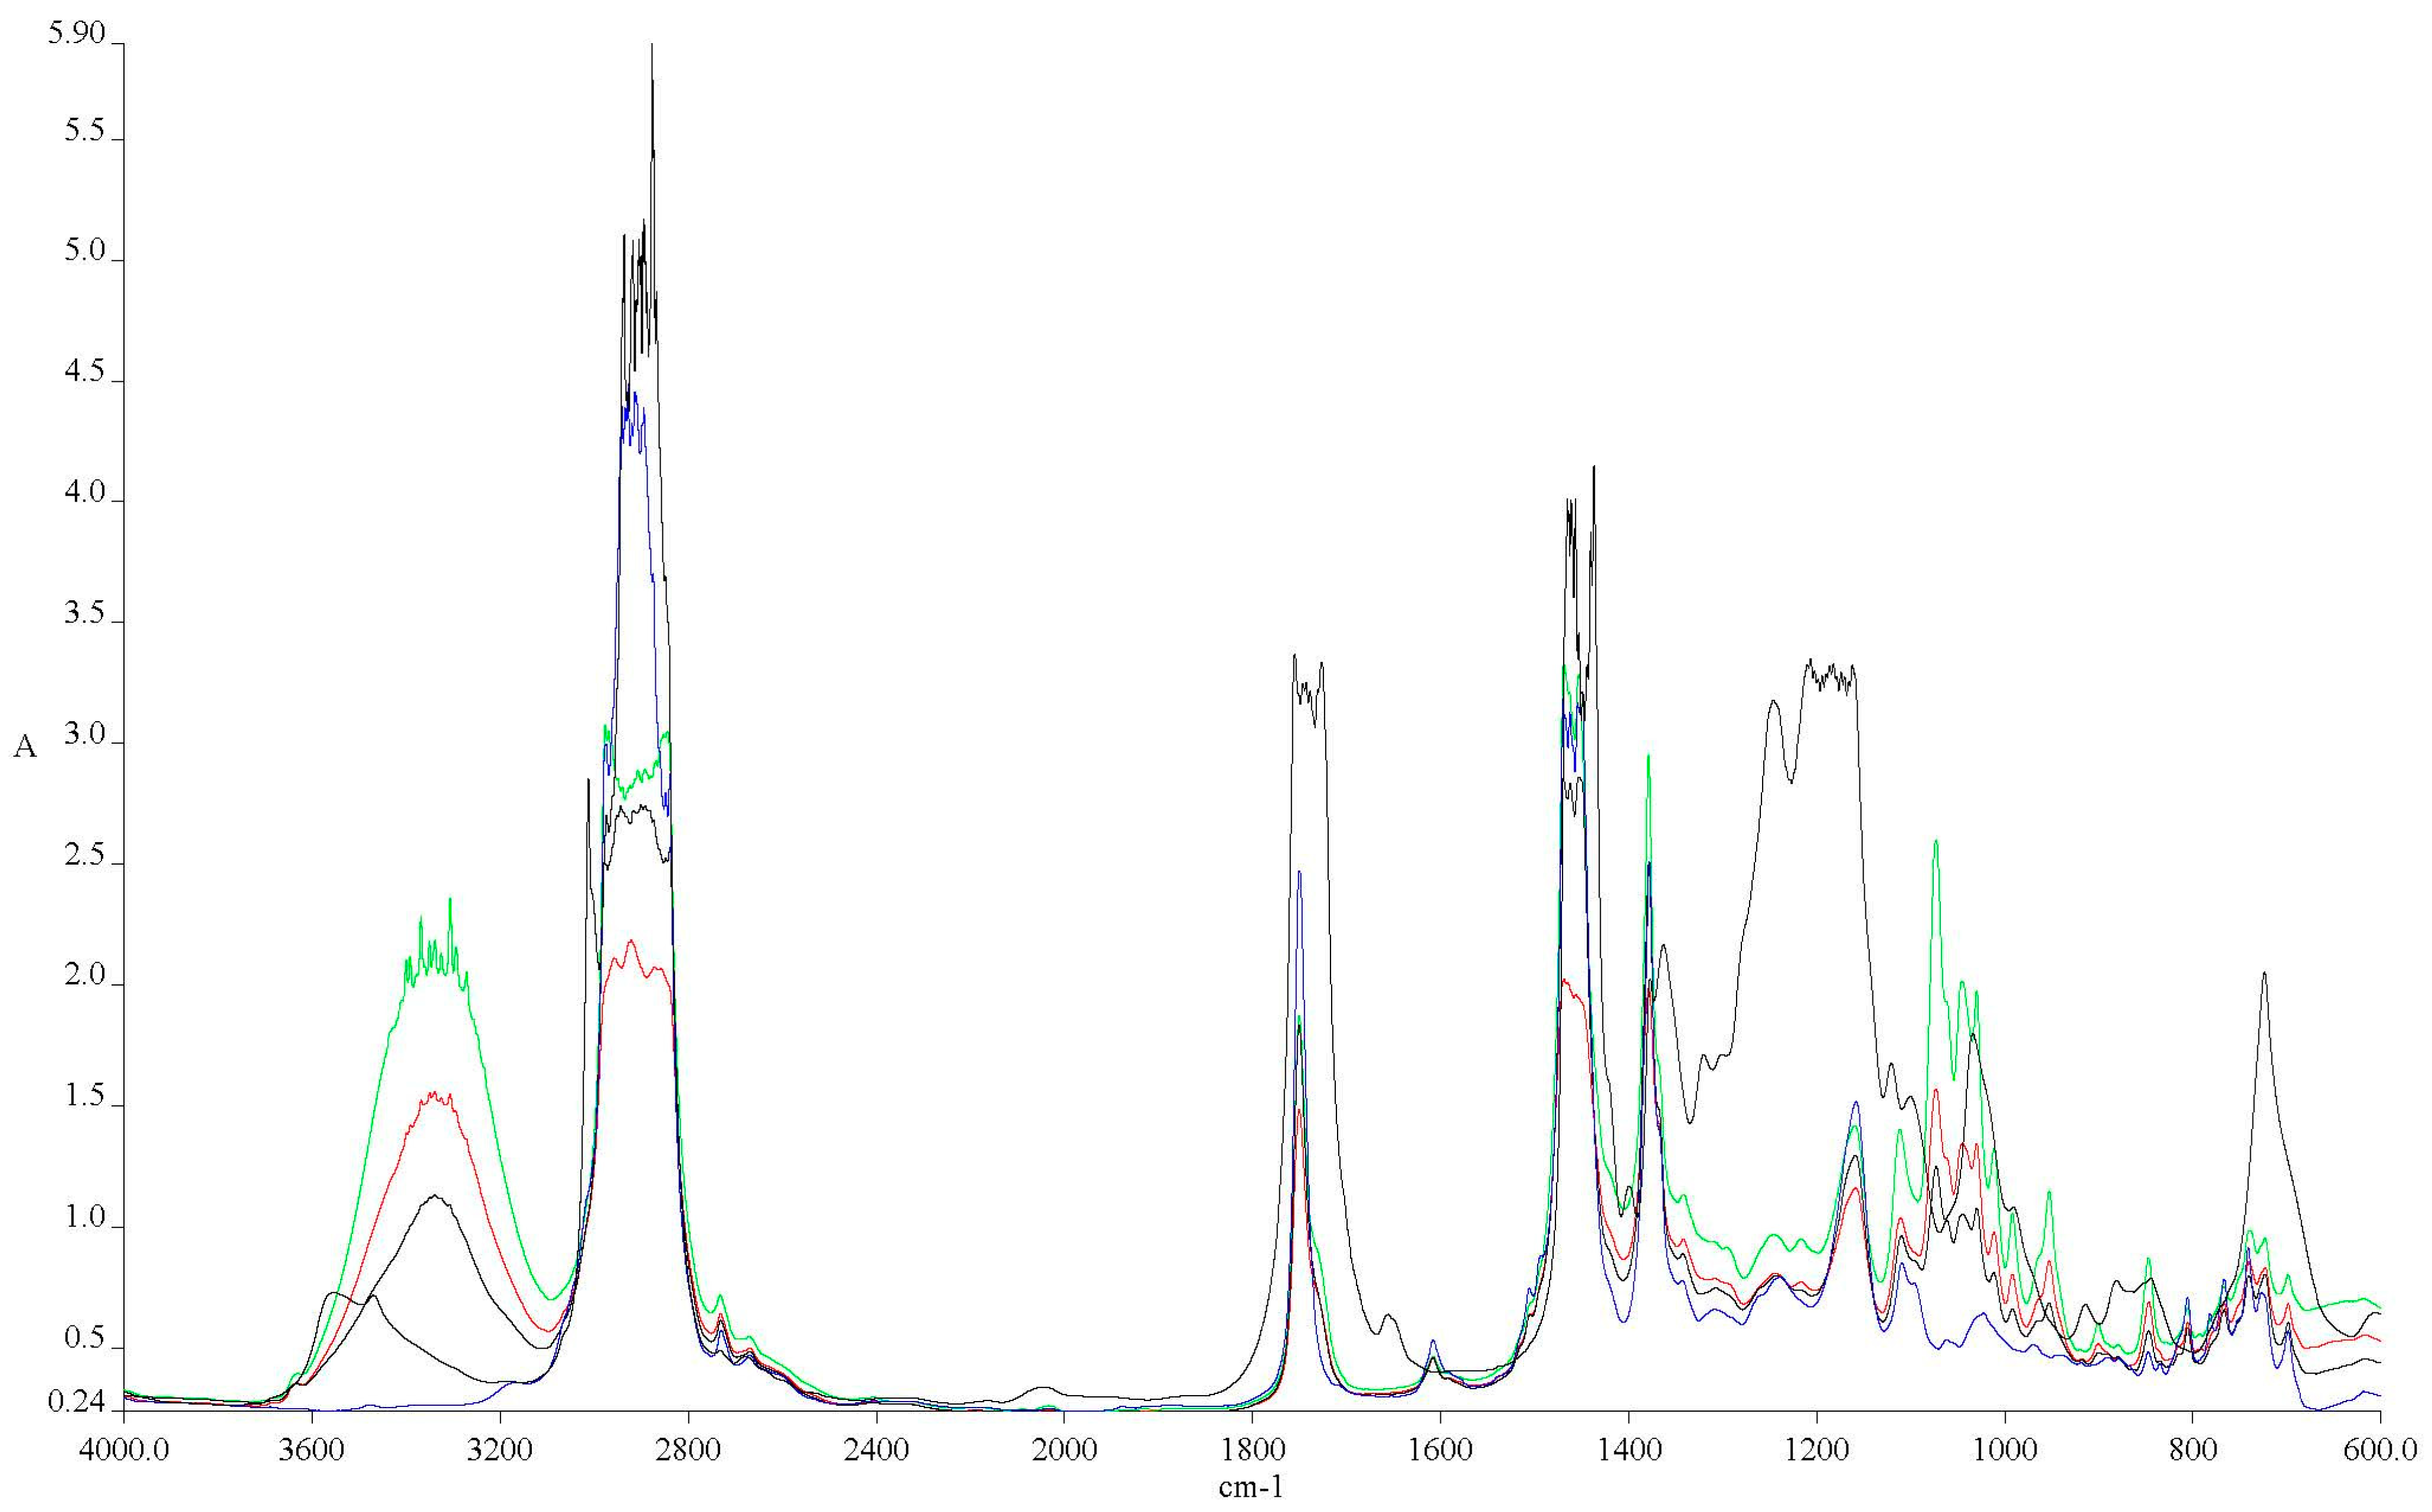
  • The main differences between the spectra of conventional aviation fuel (Ke) and the blends are observed at 3200–3600 cm−1 in Figure 3, indicating the introduction of the hydroxyl group (-O-H) into the molecular structure.
  • Higher alcohol concentrations result in larger peaks in the mentioned spectra.
  • At 1750 cm−1, the presence of oxygen bonded to a carbon atom (C-O) is highlighted.
  • Methylene groups (-CH2) at 1450 cm−1 show a slight decrease compared to the Ke spectrum.
  • Radiation absorbed at 1350 cm−1 shows an increase in methyl groups (–CH3).
  • At 1000 cm−1, the C-OH bond is highlighted, which increases with alcohol concentration, similar to the –OH group.
  • The intensities of these features were observed to increase with alcohol concentration in each of the analyzed spectra [30].

3.2. Combustion Reaction Analysis

According to Equations (1)–(4), the summarized values are displayed in Table 2, where Mo denotes the oxygen quantity needed for the stoichiometric reaction, Mair indicates the required air quantity, and CO2 and H2O represent the quantities of carbon dioxide and water produced from the combustion of one kilogram of fuel at stoichiometric conditions.
An inverse correlation is observed between the necessary air volume and the concentration of alcohol. This trend is linked to a rise in oxygen levels as alcohol concentrations increase. Moreover, there is a consistent decrease in CO2 levels with higher alcohol concentrations. These observations emphasize the complex interaction between alcohol content, oxygen levels, and the resulting CO2 concentrations during the stoichiometric combustion process.

3.3. Micro-Turbojet Engine Test Stand Experiments

In this chapter, only four fuel blends were used (Ke, Ke+ 10%B, Ke+ 20%B, and Ke+ 30%B).
The starting procedure of turbo engines is a process that concludes when the turbo engine reaches idle mode. The primary aim of this test is to evaluate the ignition process when the micro-turbo engine operates with the four studied fuel types. Figure 4 depicts the variation in the engine speed vs. time, while Figure 5 and Figure 6 illustrate the variation in combustion temperature and fuel flow rate vs. engine speed.
Figure 4 demonstrates a correlation between the starting time and the concentration of n-butanol, with Ke showing the shortest starting time. Figure 5 indicates a minor decrease in fuel temperature during the starting process, which is attributed to the influx of outside air into the combustion chamber by the electric starter. Moreover, the ignition timeframe, as depicted in Figure 5, extends with higher n-butanol concentrations. Additionally, Figure 5 shows that as the alcohol concentration increases, the temperature ahead of the turbine decreases during the starting process, resulting in a delay. Figure 6 highlights a reduction in the fuel flow rate required for the starting process with increasing n-butanol concentration. This is attributed to Ke’s higher starting temperature, which necessitates a larger initial fuel quantity. However, after reaching the operating temperature, the variation in fuel flow rate reverses, indicating higher rates for fuel blends and lower rates for Ke. This dynamic interaction is essential for comprehending the behavior of fuel blends during both the initial “cold” phase and the subsequent operational periods of the starting procedure.
To evaluate the micro-turbojet engine’s stability regarding the combustion process, a so called “sudden procedure” was performed. This involves a rapid acceleration from idle to maximum, maintaining maximum speed for 30 s, and then an abrupt deceleration from maximum to idle. Figure 7, Figure 8 and Figure 9 show variations in the temperature ahead of the turbine, fuel flow rate, and thrust vs. RPM during rapid acceleration and deceleration for all four fuel samples studied.
From the above figures, it can be observed that the micro-turbo engine underwent rapid acceleration from idle to near maximum, remained at that regime for several seconds, and then abruptly decelerated. During this operation, the combustion temperature decreased as the alcohol concentration increased; however, this decrease did not jeopardize the engine’s operation and integrity. The fuel flow rate increased as the alcohol concentration increased, as was expected due to the lower calorific value of alcohol.
Continuing on from the transient regimes, the next stage involves maintaining the engine at three important stable conditions—idle, cruise, and maximum throttle. Figure 10, Figure 11 and Figure 12 show the variations in the temperature in front of the turbine, fuel flow, and thrust for the analyzed fuels. These parameters were chosen because they are the most critical ones in an engine’s operation.
Figure 10 provides a graphical representation of the temperature variations in front of the turbine for all three operating regimes and tested fuels.
The analysis indicates that the engine integrity was maintained, as the maximum turbine working temperature of 800 °C was neither reached nor exceeded. In the idle and cruise regimes, the temperature at the turbine inlet for butanol blends is lower compared to the Jet A reference; however, at maximum regime, the turbine inlet temperature shows slightly higher values for butanol blends.
Figure 11 presents the fuel flow rate in liters per hour, revealing a significant increase across all three regimes and tested fuel blends. This observation suggests a notable impact on fuel consumption under different operating conditions, including specific consumption.
Figure 12 illustrates the variations in thrust (F) according to the operating regime and tested fuel blend. In regimes 1 and 2, thrust variations are negligible, but a decrease is observed in regime 3. Additionally, thrust decreases with increasing alcohol concentration. Overall, the analysis of these figures leads to the conclusion that the functionality and integrity of the engine remains intact and unaffected throughout the test, highlighting the engine’s robustness under various operating conditions and fuel blends.
Since the engine is able to record the air flow rate and compressor’s compression ratio, the operating line of the micro-turbo engine for the four studied fuels was plotted in Figure 13, while Figure 14 illustrates the variation in the micro-engine’s operating line during rapid acceleration and deceleration (variation in compressor pressure range πc (“which can reach a maximum value of around 2.2”) vs. air flow M ˙ a , where M ˙ a is expressed in [kg/s].
Analyzing Figure 13, it can be observed that the working line shifts when using butanol blends compared to the base fuel—kerosene. This shift is not significant and does not endanger the operation of the micro-turbo engine. Examining Figure 14, it is evident that the working line during rapid acceleration and deceleration deviates considerably from the working line established based on the quasi-stationary regimes for all tested fuels, but without causing a surge.
For the analysis of the environmental impact of butanol, the concentration of CO and SO2 was recorded in Figure 15 and Figure 16, which illustrate the variations in CO and SO2 levels across all blends and under all three regimes.
As observed in Figure 15, the CO concentration increases with a higher alcohol concentration. This is because alcohol introduces more oxygen into the blend, actively participating in the combustion reaction. Additionally, as the concentration increases, the amount of air needed for the stoichiometric reaction decreases, leading to a less efficient combustion and increased CO formation. The temperature strongly influences CO formation, with lower fuel temperatures resulting in higher CO production, rather than CO2 production. As expected, the CO concentration rises across the regimes as fuel flow increases.
Regarding SO2 formation, its variation is independent of alcohol concentration. In fact, compared to pure Ke, adding alcohol increases the SO2 concentration due to the additional oxygen introduced by the alcohol. In terms of regimes, it appears that for pure Ke, the maximum regime is most efficient in terms of SO2 production because of the higher burning temperatures. However, for blends with added alcohol, the idle regime seems most efficient, likely due to the oxygen introduced by the alcohol.

3.4. Micro-TurboJet Engine Performance Analysis

The performance calculation of the micro-turbo engine is based on reference [31]. Equation (1) is used to determine the specific consumption. Since the micro-turbo engine’s instrumentation records the fuel flow in L/s, it needs to be converted to kg/s, which requires knowledge of the density that has been measured.
S = 3600 · M ˙ f F k g N · h
where Mf is the fuel flow in kg/s, and F is the thrust.
The next important step is determining the combustion efficiency (ηb) based on experimental measurements. Equation (6) is used to determine combustion efficiency, providing a quantitative measure of the combustion process.
η b = M ˙ f + M ˙ a c p _ c o m b · T _ c o m b M ˙ a · c p _ c o m p · T _ c o m p M ˙ f · L C P
where LCP—lower calorific power; cp—specific heat capacity; Tcomb—temperature in front of the combustion chamber (which was recorded); M ˙ a —the air flow; and Tcomp—temperature after the compressor.
The thermal efficiency of an engine with this parameter, denoted by Equation (7), provides a quantitative measure and indicates the capability of converting thermal energy into mechanical work.
η T = M ˙ a + M ˙ f v e 2 2 M ˙ f L C P = M ˙ a + M ˙ f F M ˙ a + M ˙ f 2 2 M ˙ f L C P
The variation in specific consumption for all the tested fuel blends is presented in Figure 17.
As observed, specific consumption increases with higher alcohol concentration, as is expected due to n-butanol’s lower calorific value compared to that of Jet A. Incorporating n-butanol into aviation fuel would require larger tank capacities to offset the increased consumption. This is reflected in aircraft design and considerations for storing new fuels.
Figure 18 illustrates the combustion efficiency across the three studied regimes and n-butanol concentrations.
Based on Figure 18, it can be observed that combustion efficiency decreases when using Jet A and n-butanol blends for the first two studied regimes. This behavior is expected since the engine is not working at its full parameters and fuel combustion is poor. Only in regime 3 is combustion efficiency approximately equal across all tested fuel samples. Nevertheless, since the oxygenated fuels that are brought into the fuel mixtures have lower energy content, the engine is keeping the combustion efficiency at its maximum by increasing the fuel consumption, as shown in Figure 17.
The thermal efficiency of the microturbine engine is presented in Table 3 based on Equation (7).
The first observation from Table 3 is that the thermal efficiency is significantly lower for microturbines compared to large aviation turbo engines. It can also be noted that the thermal efficiency is slightly higher when increasing the concentration of n-butanol in the tested samples. This highlights the influence of fuel composition on the thermal efficiency of the microturbine engine, emphasizing the need for specific considerations and adjustments in evaluating the efficiency of micro-turbo engine configurations.

4. Conclusions

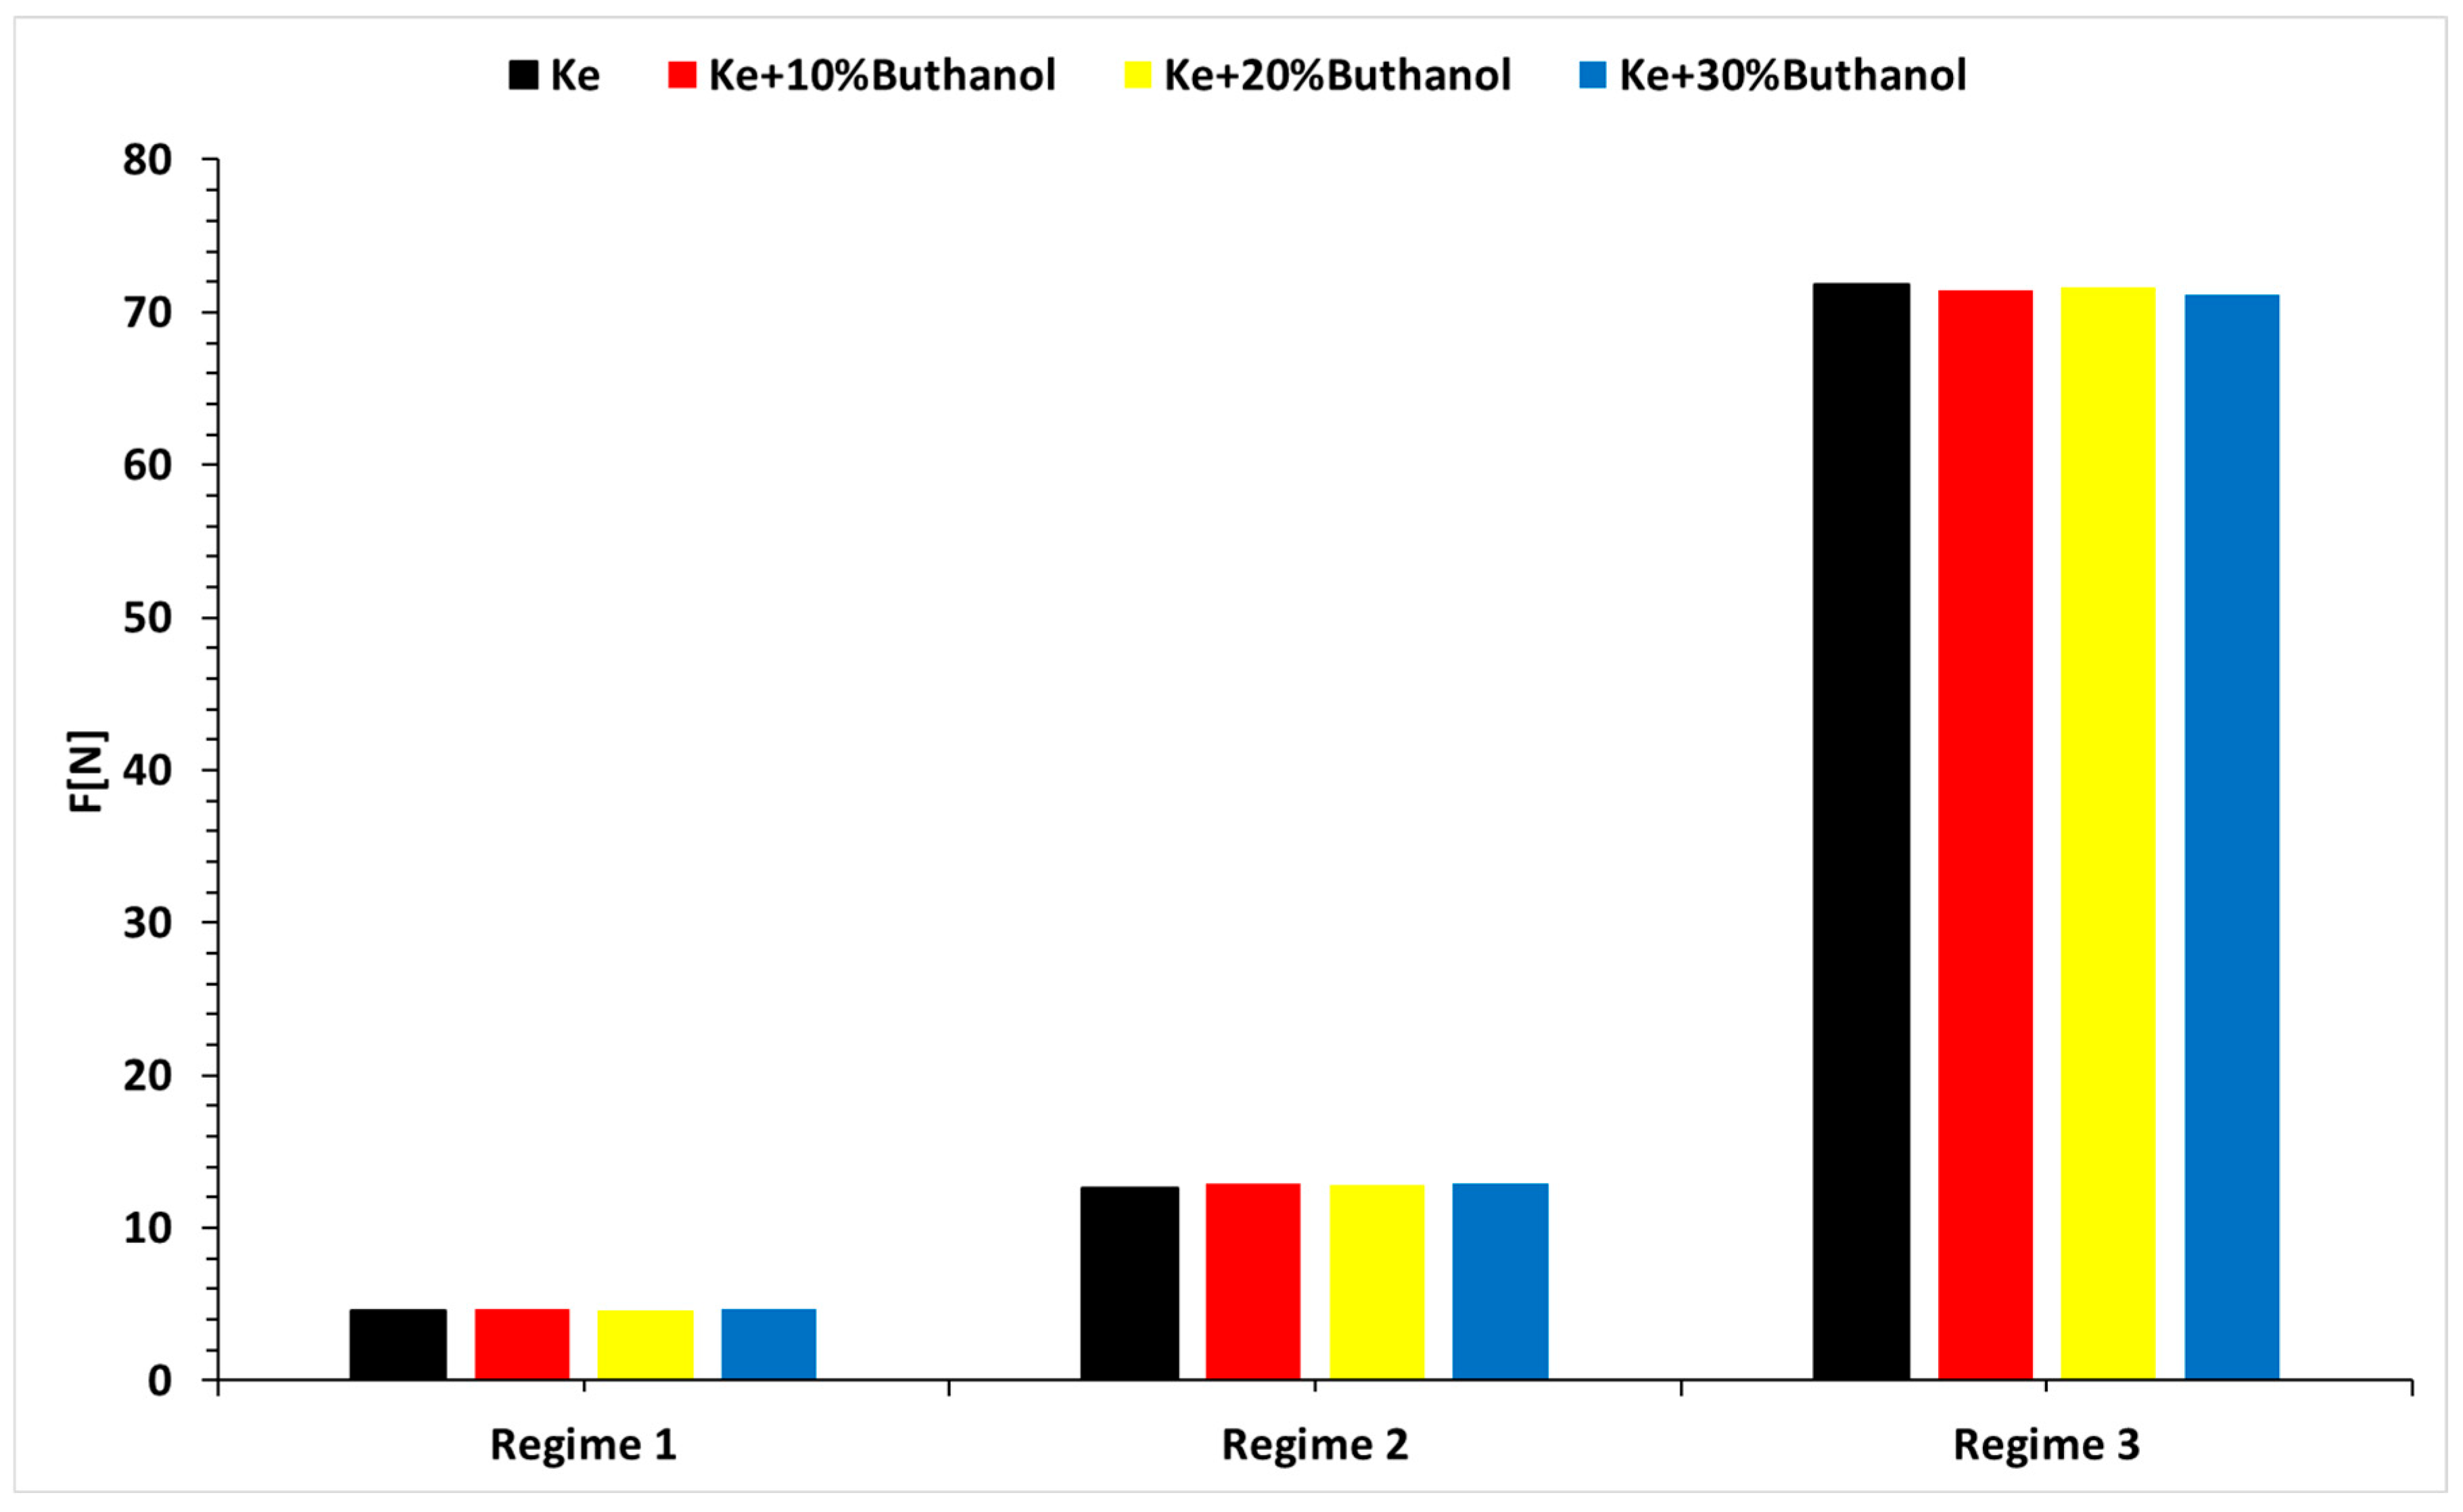
  • The experimental evaluations conducted on the Jet CAT P80® micro-turbo engine demonstrate that the inclusion of n-butanol in conventional fuel does not compromise the functionality of the turbo engines.
  • The calorific power of the fuel blends experiences a decrease with increasing n-butanol concentration, resulting in a corresponding rise in specific fuel consumption. The lower percentage of carbon in n-butanol, used for blending with Ke (kerosene), contributes to reduced CO2 emissions upon combustion.
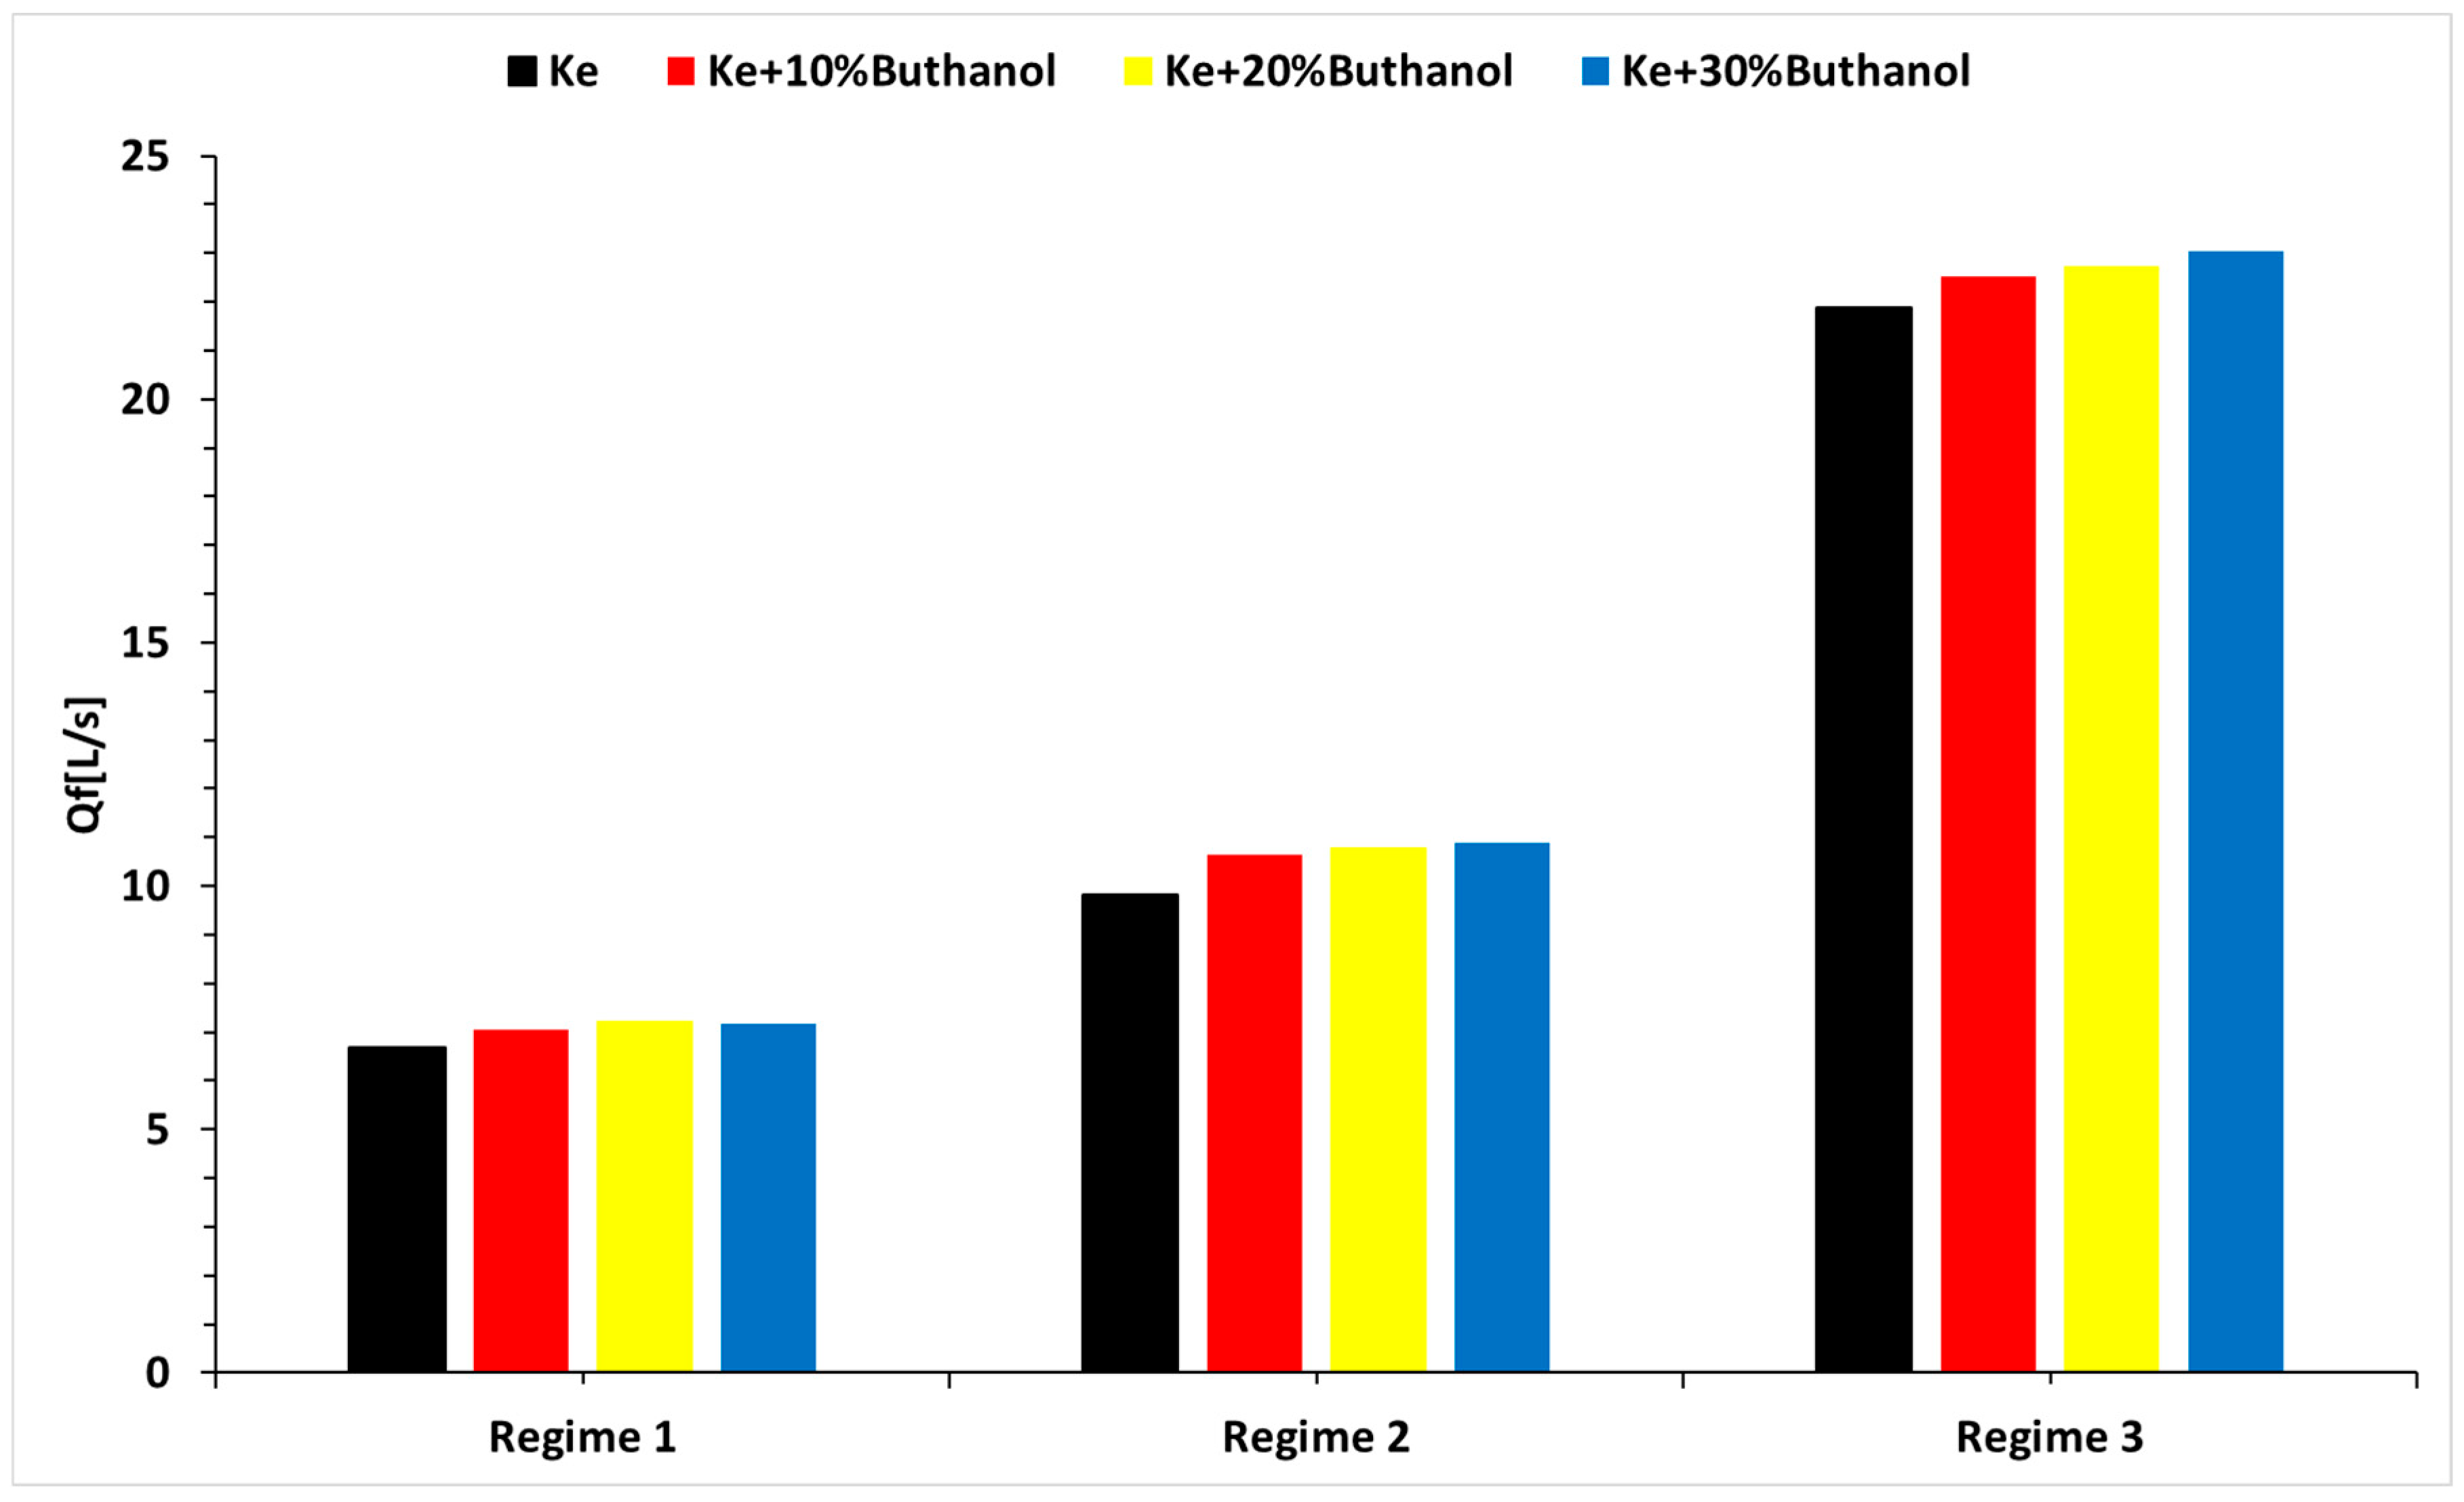
  • Regarding engine performance, there is a proportional increase in specific fuel consumption with higher n-butanol percentages in the tested blends, a trend that is attributed to their respective calorific powers.
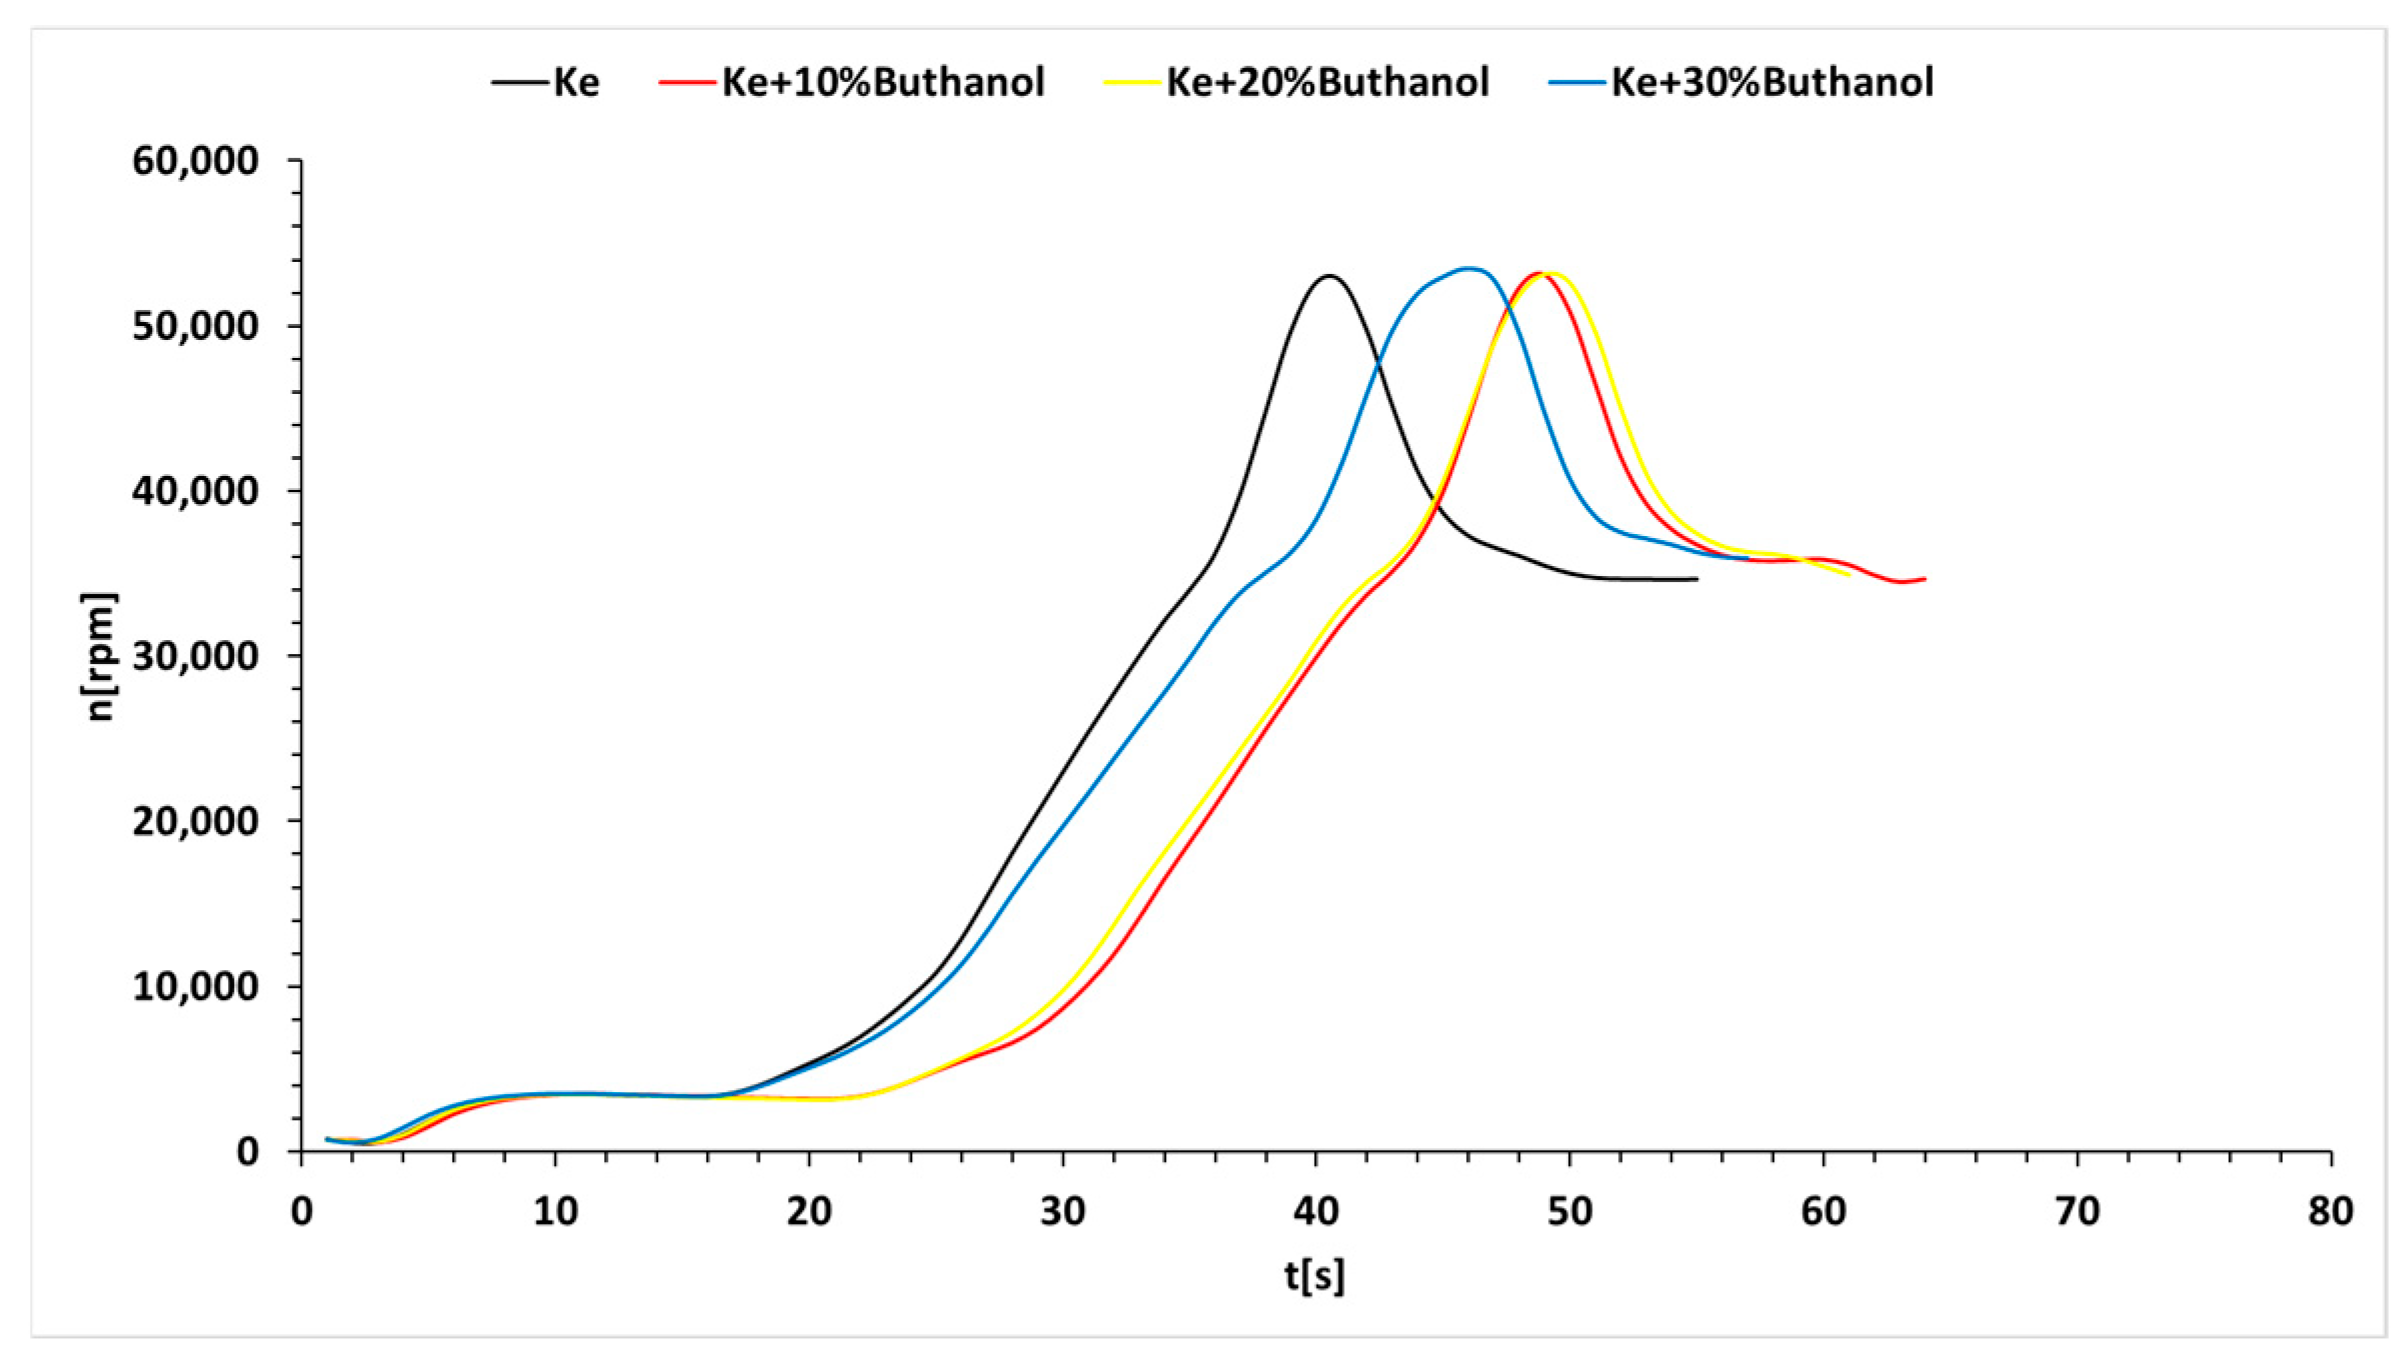
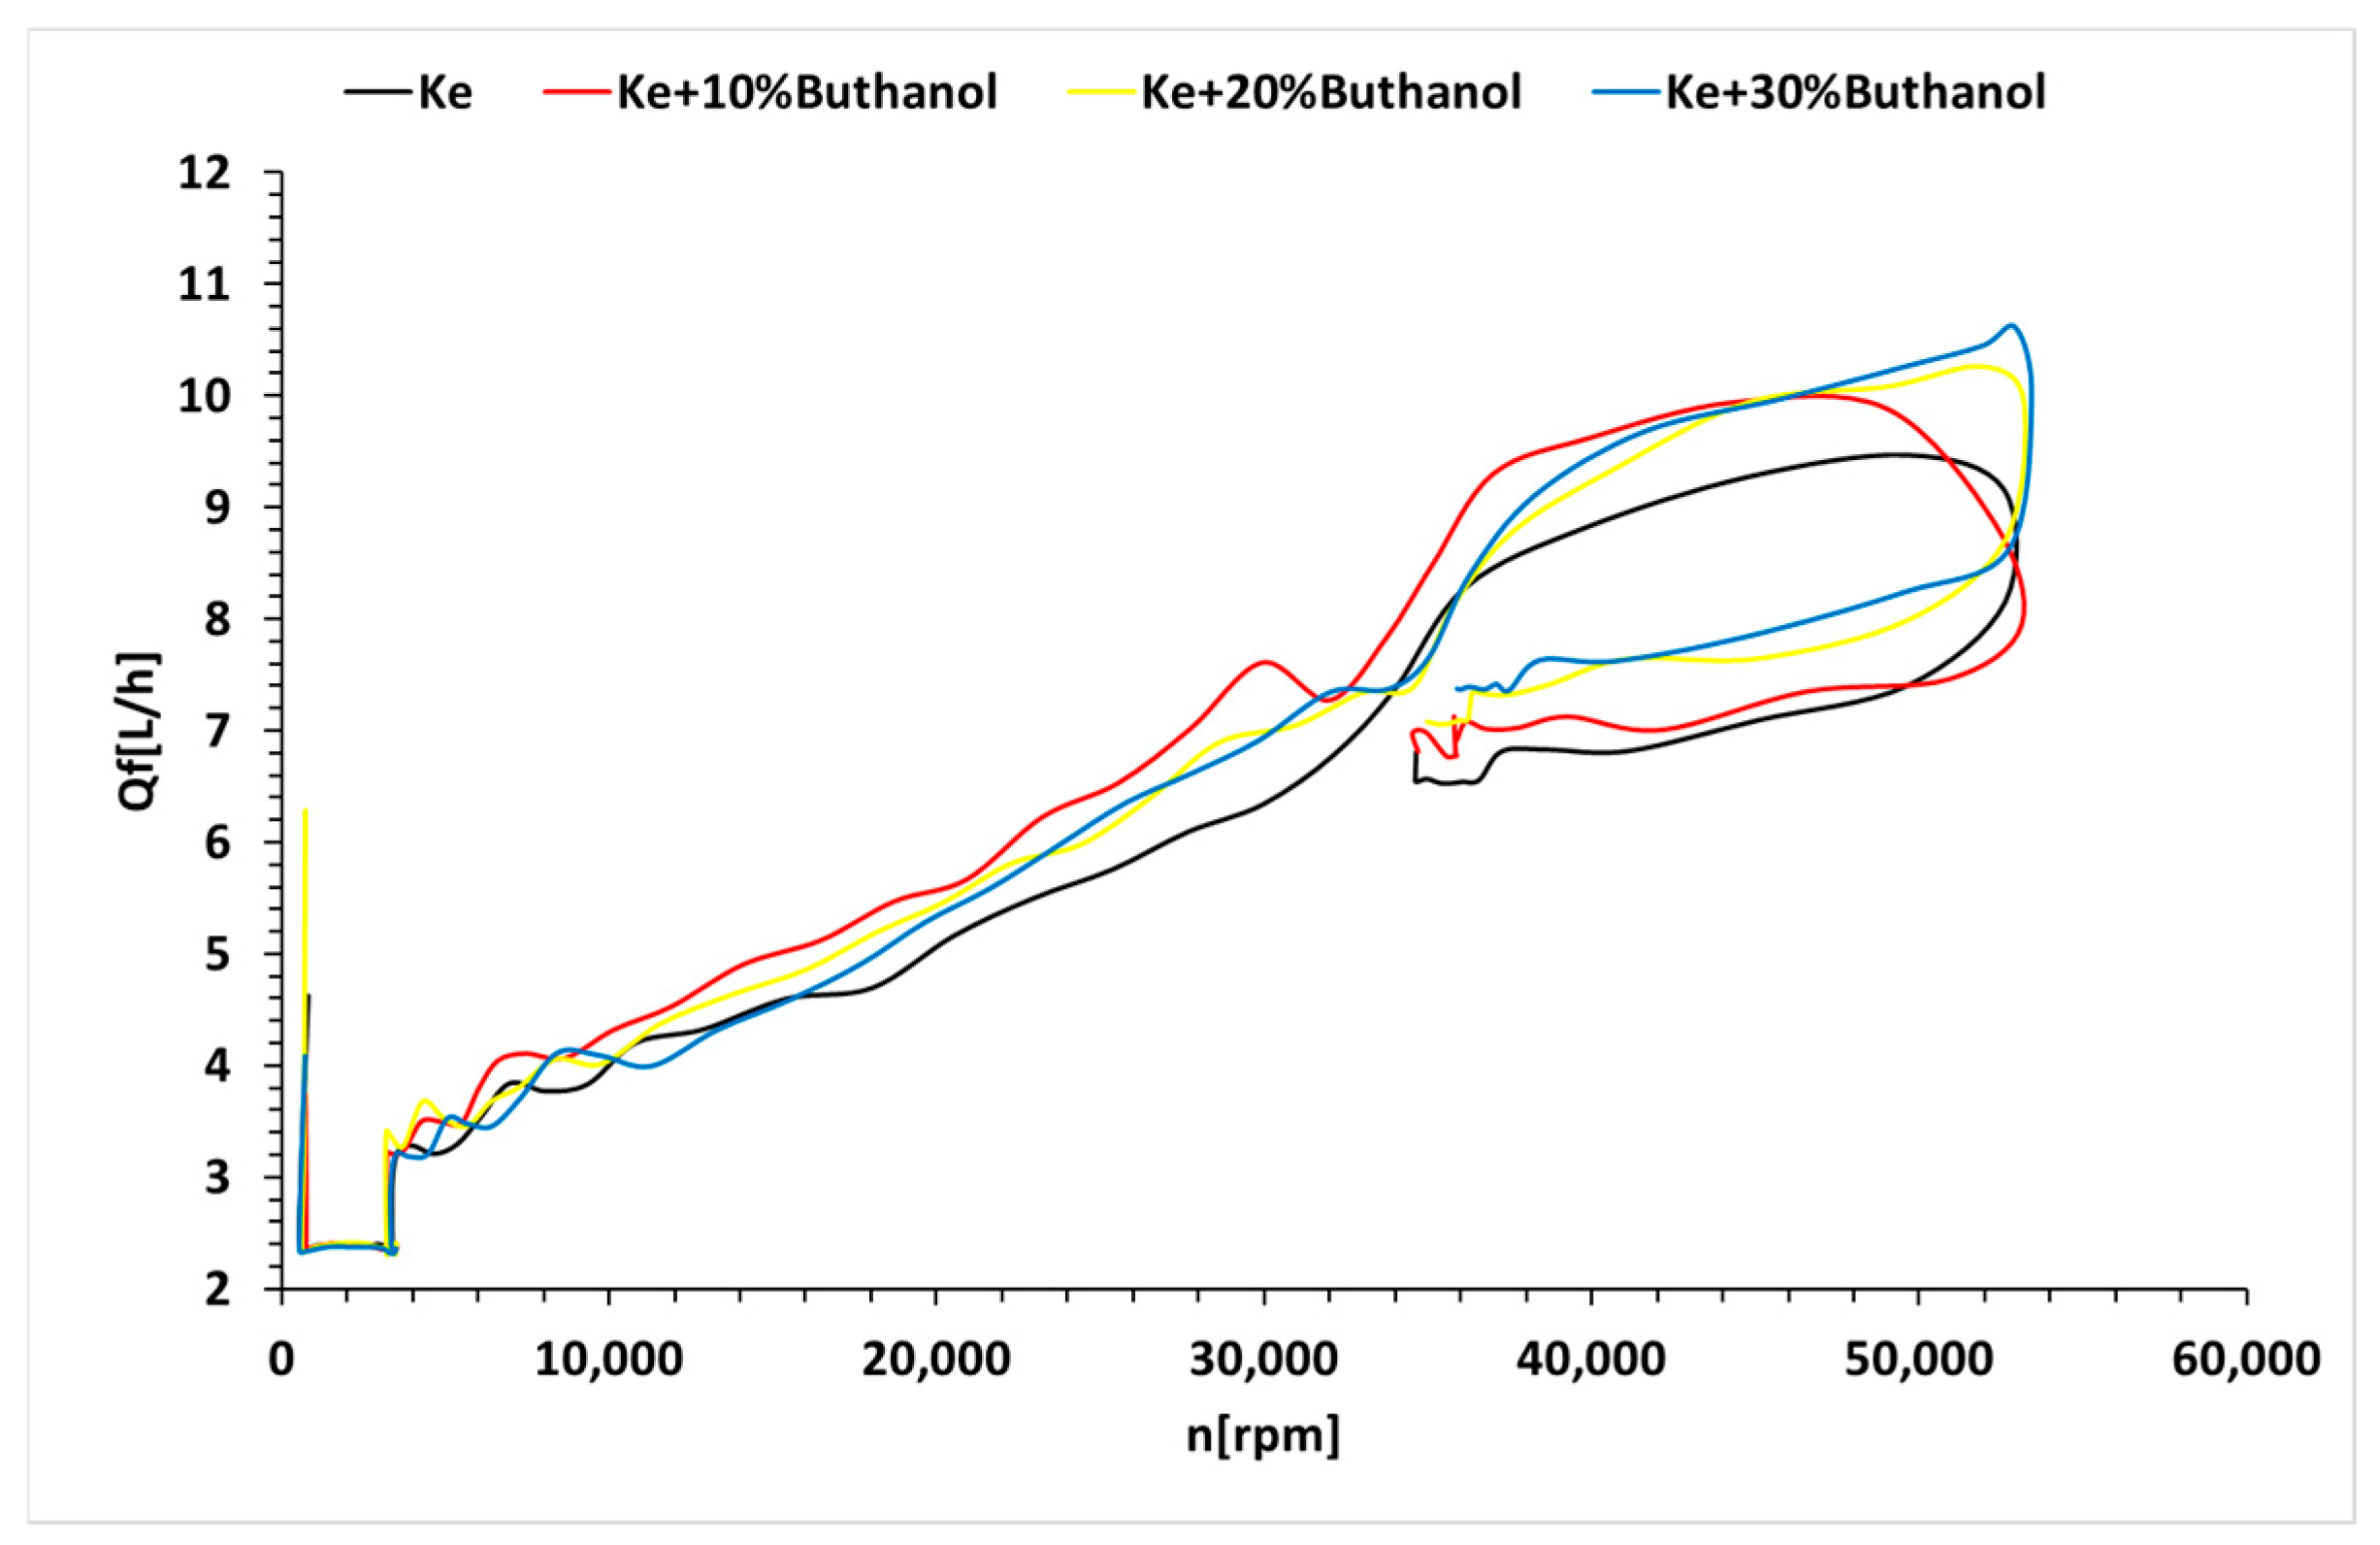
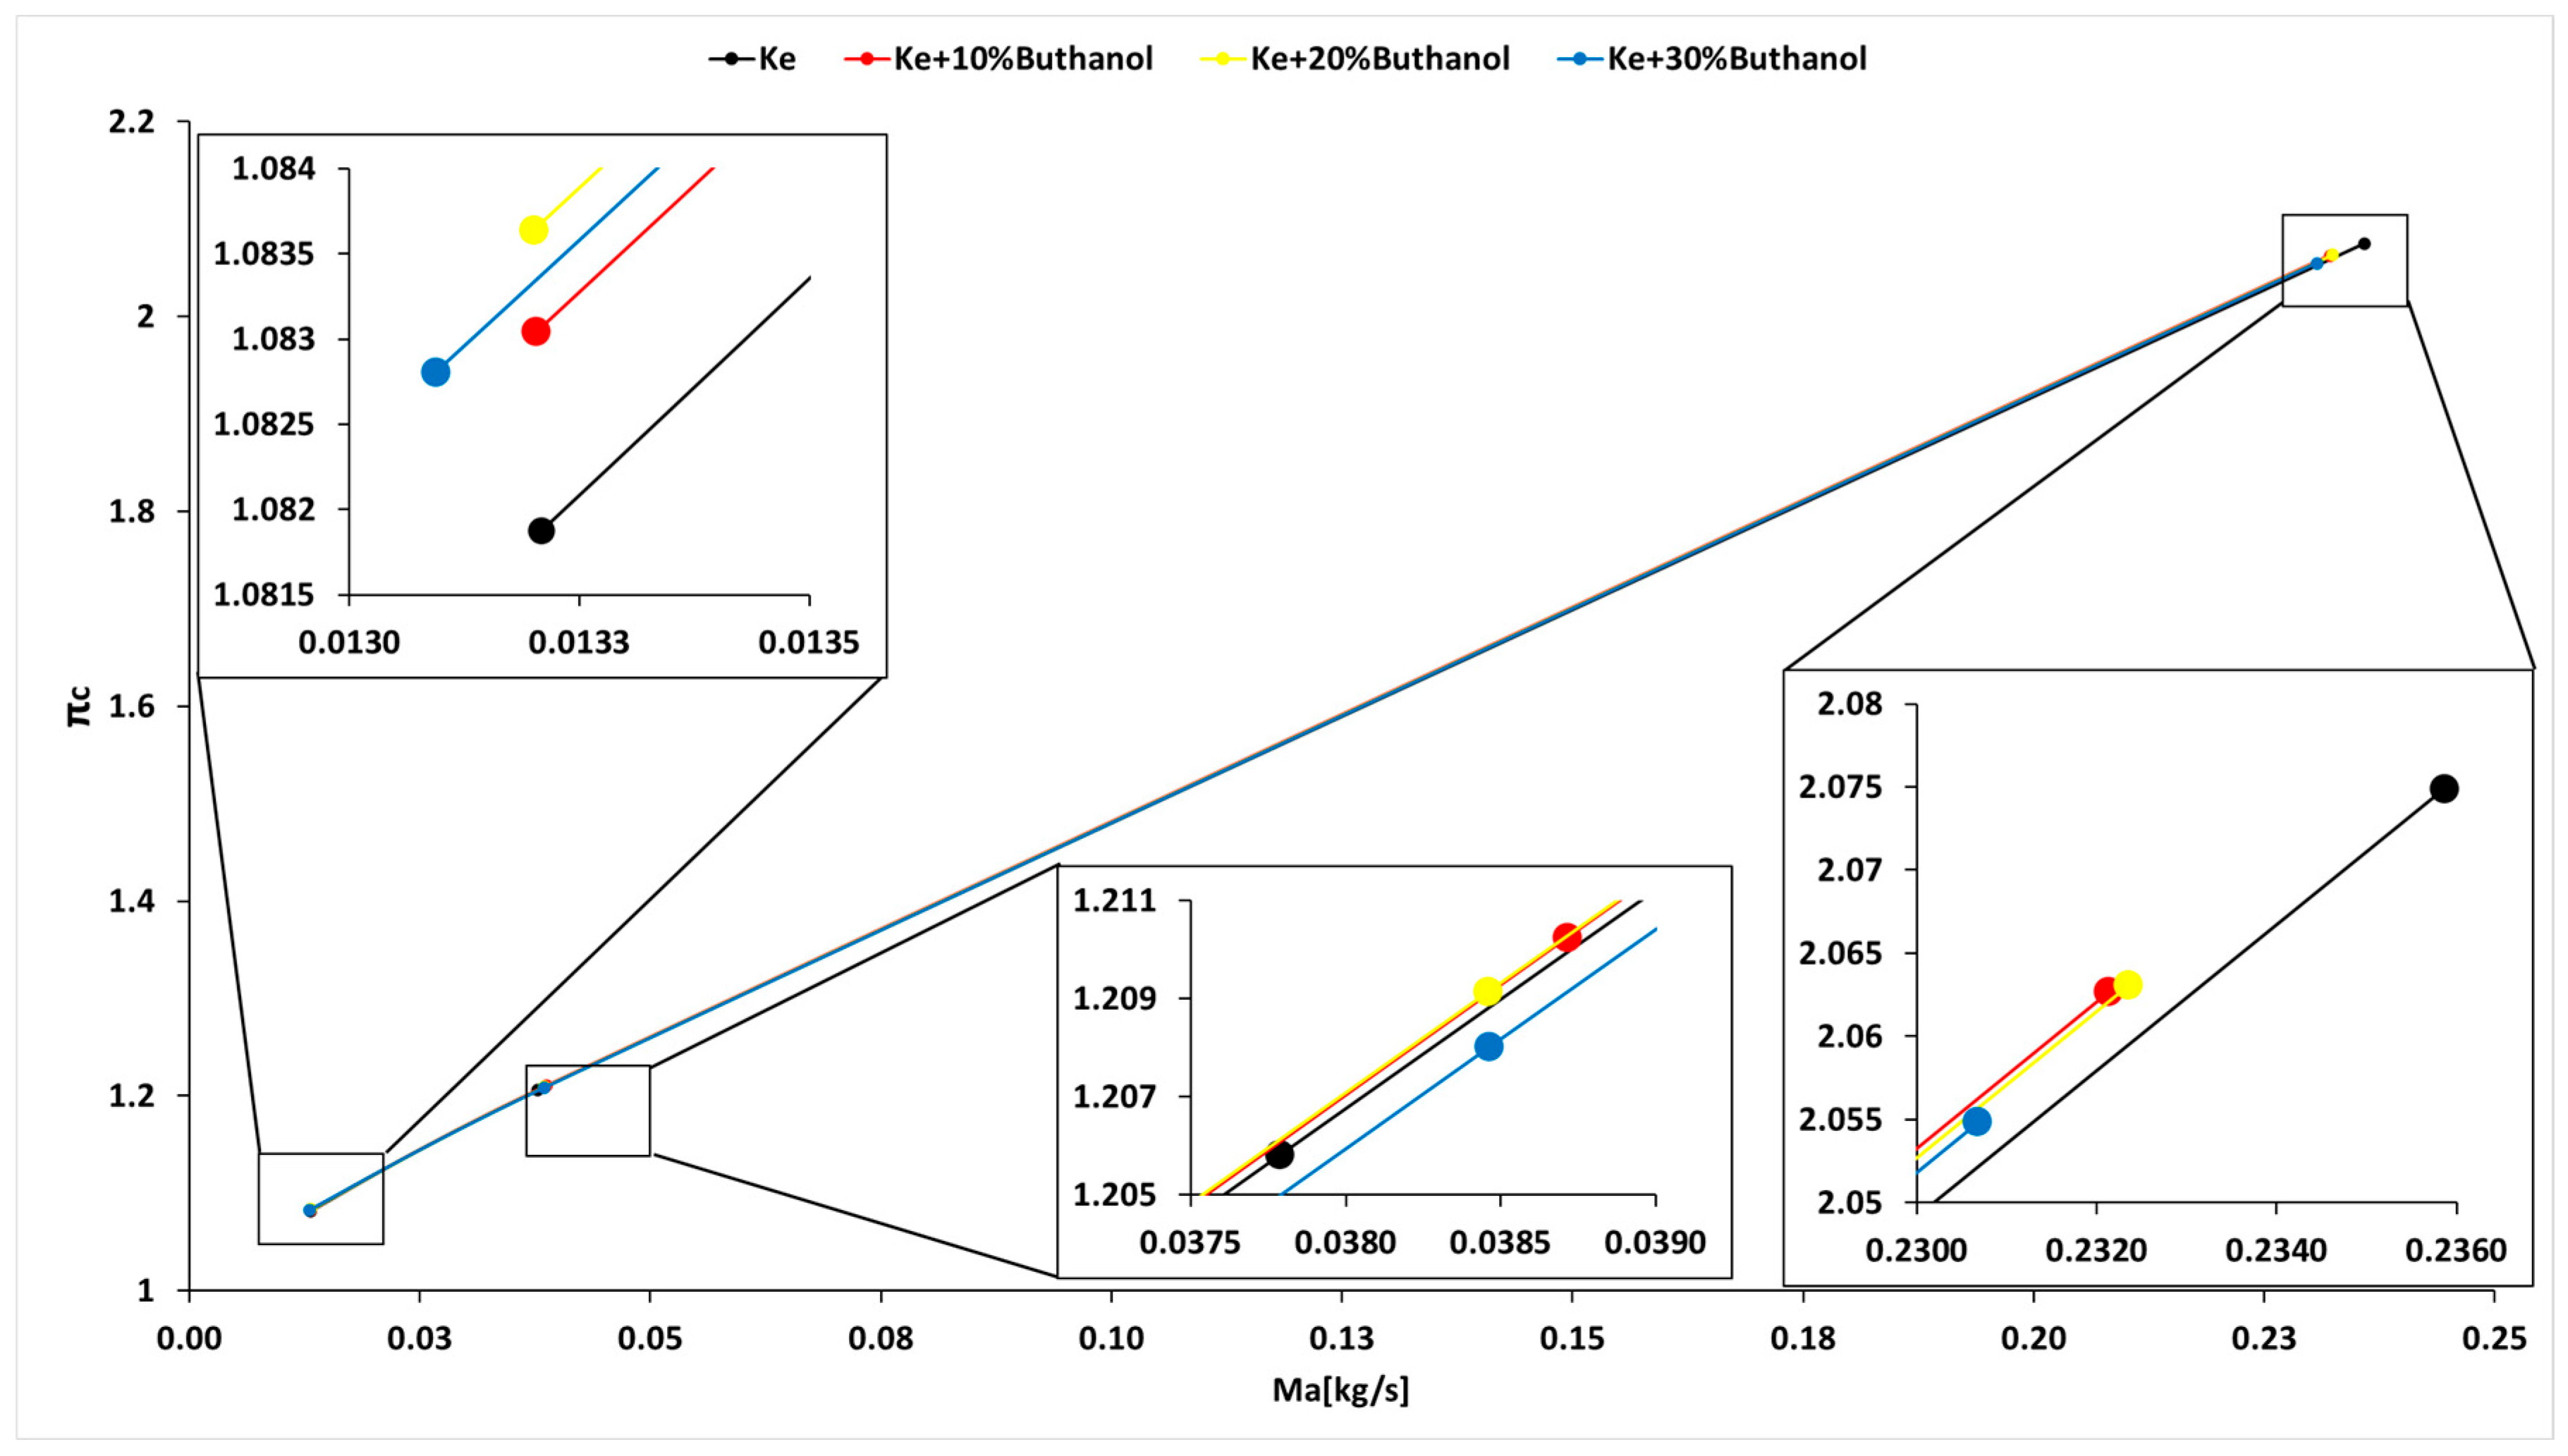
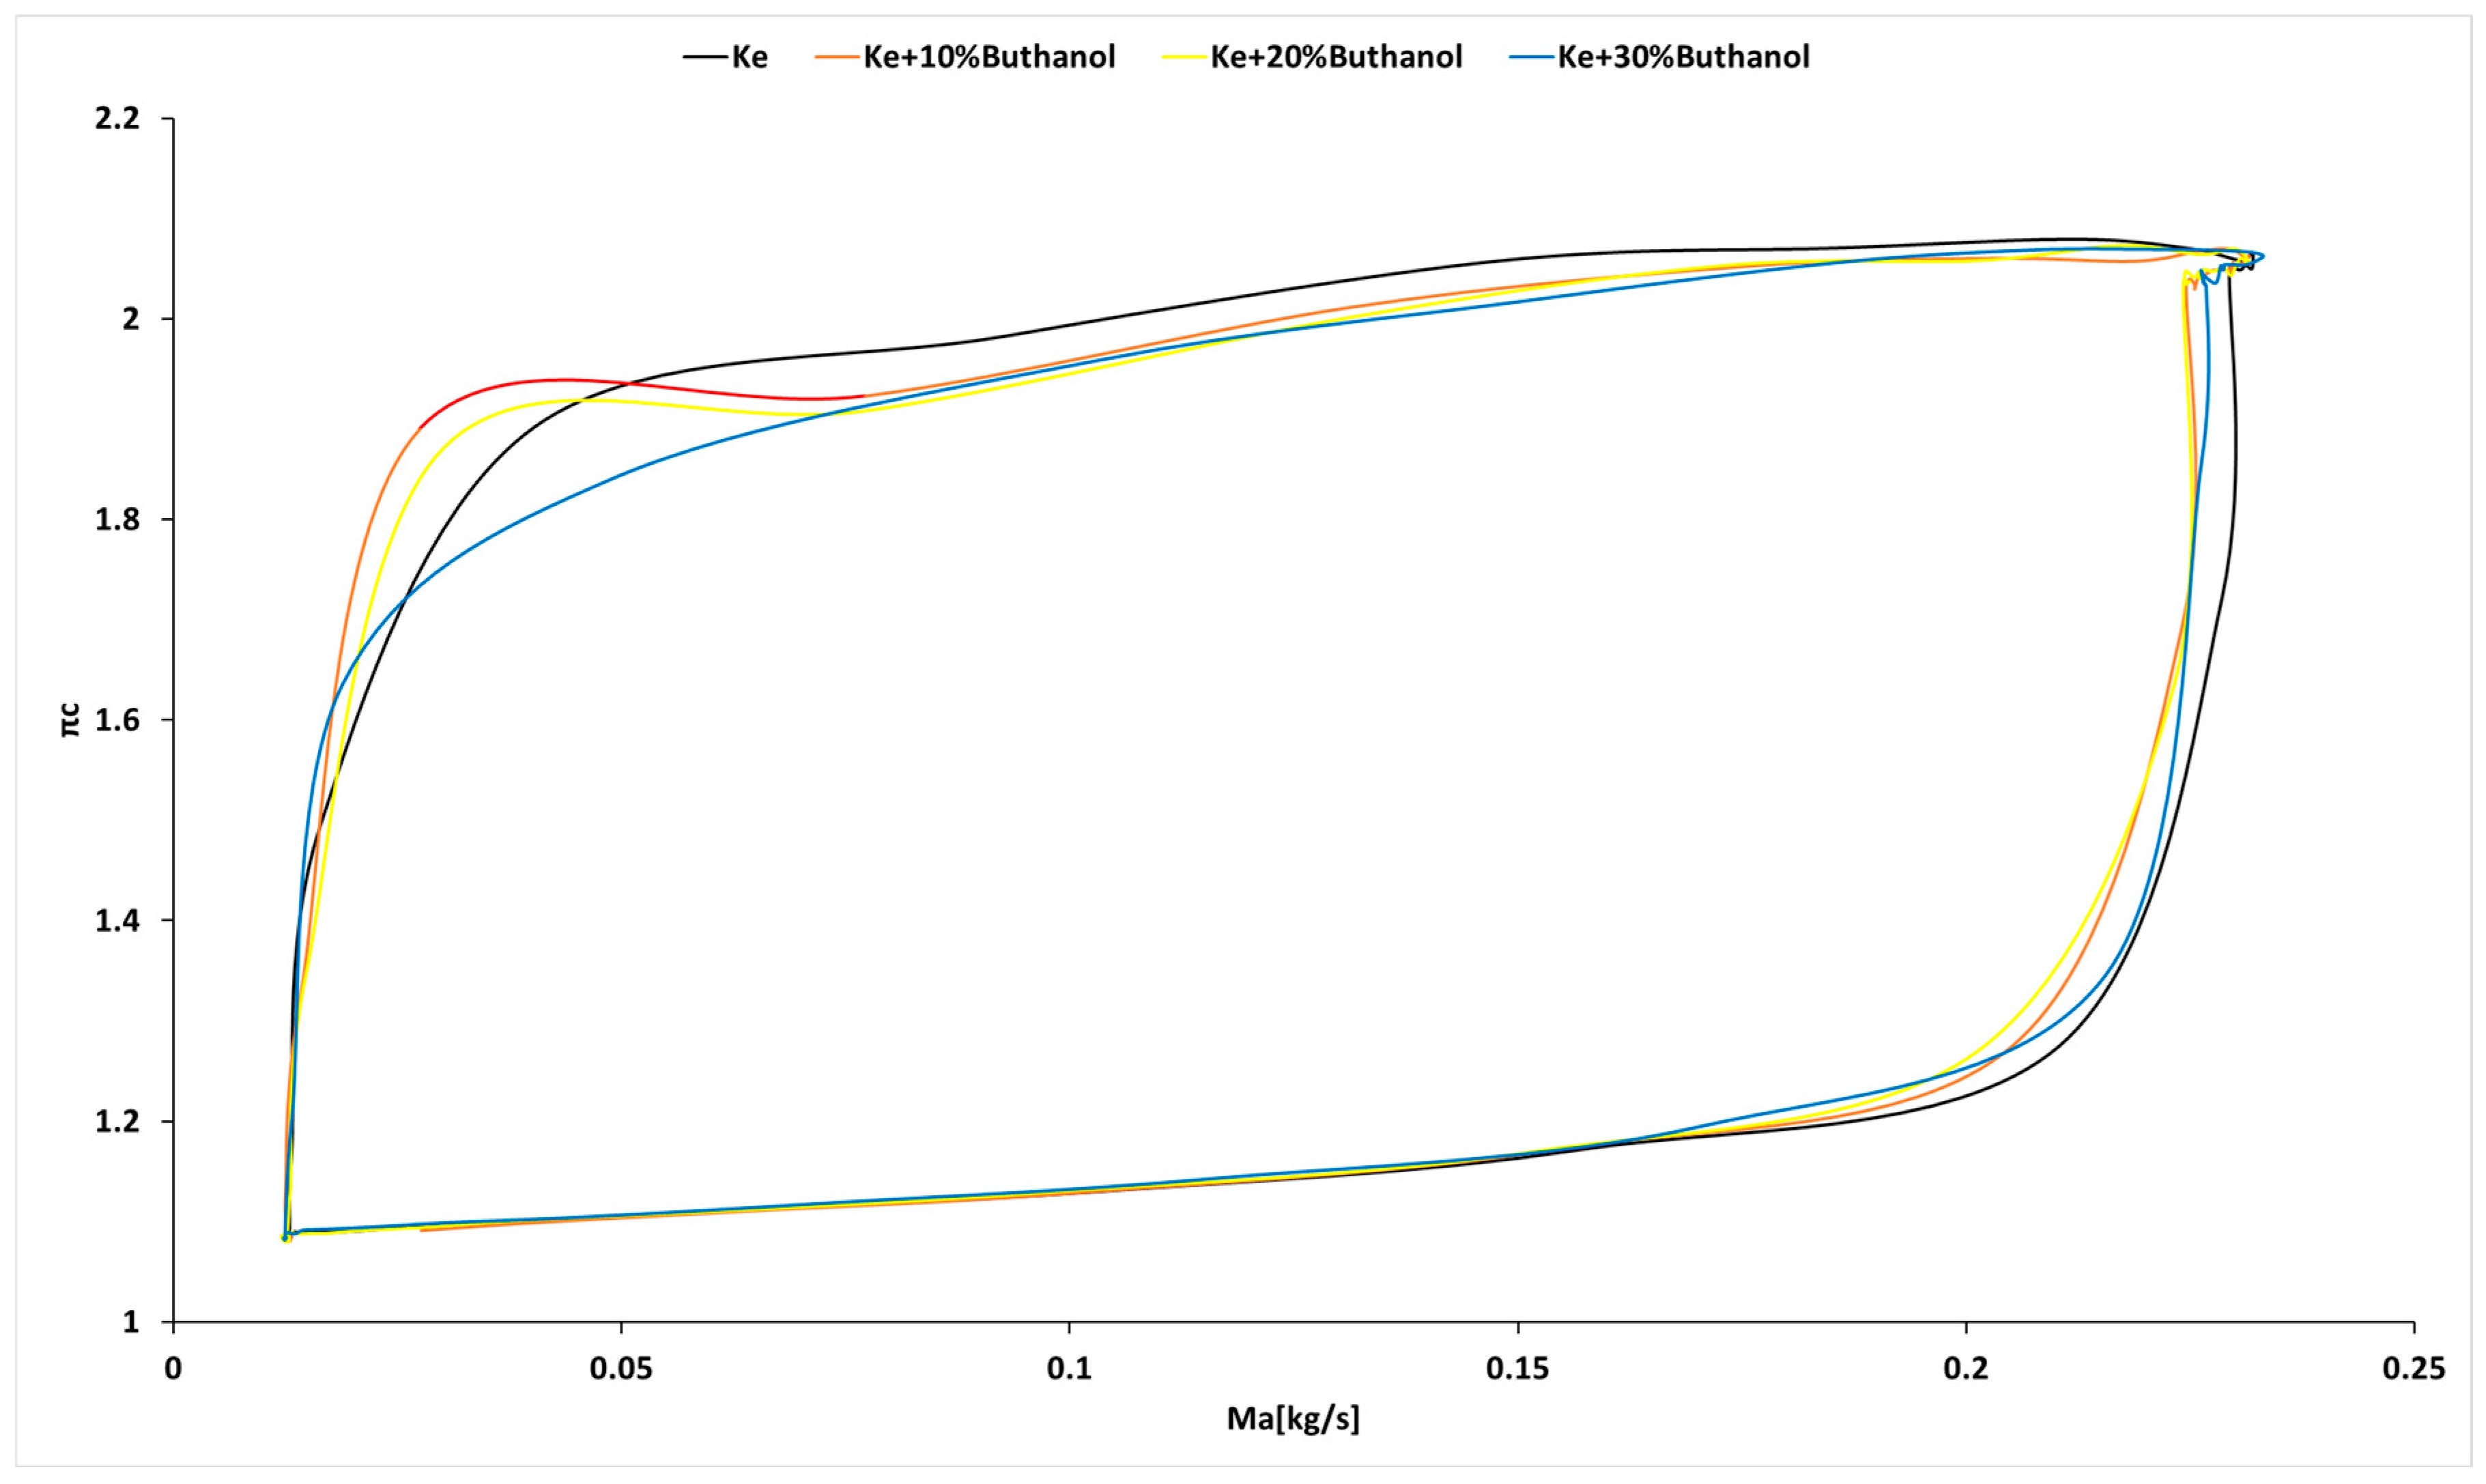
  • As for transient regimes, the micro-turbo engine performed well, with deviations from the kerosene-only case being insignificant both in the starting procedure and in the sudden acceleration and deceleration procedures. The operating line of the micro-turbo engine shows no significant deviations when using kerosene and butanol blends, indicating an acceptable stability in transient regimes.
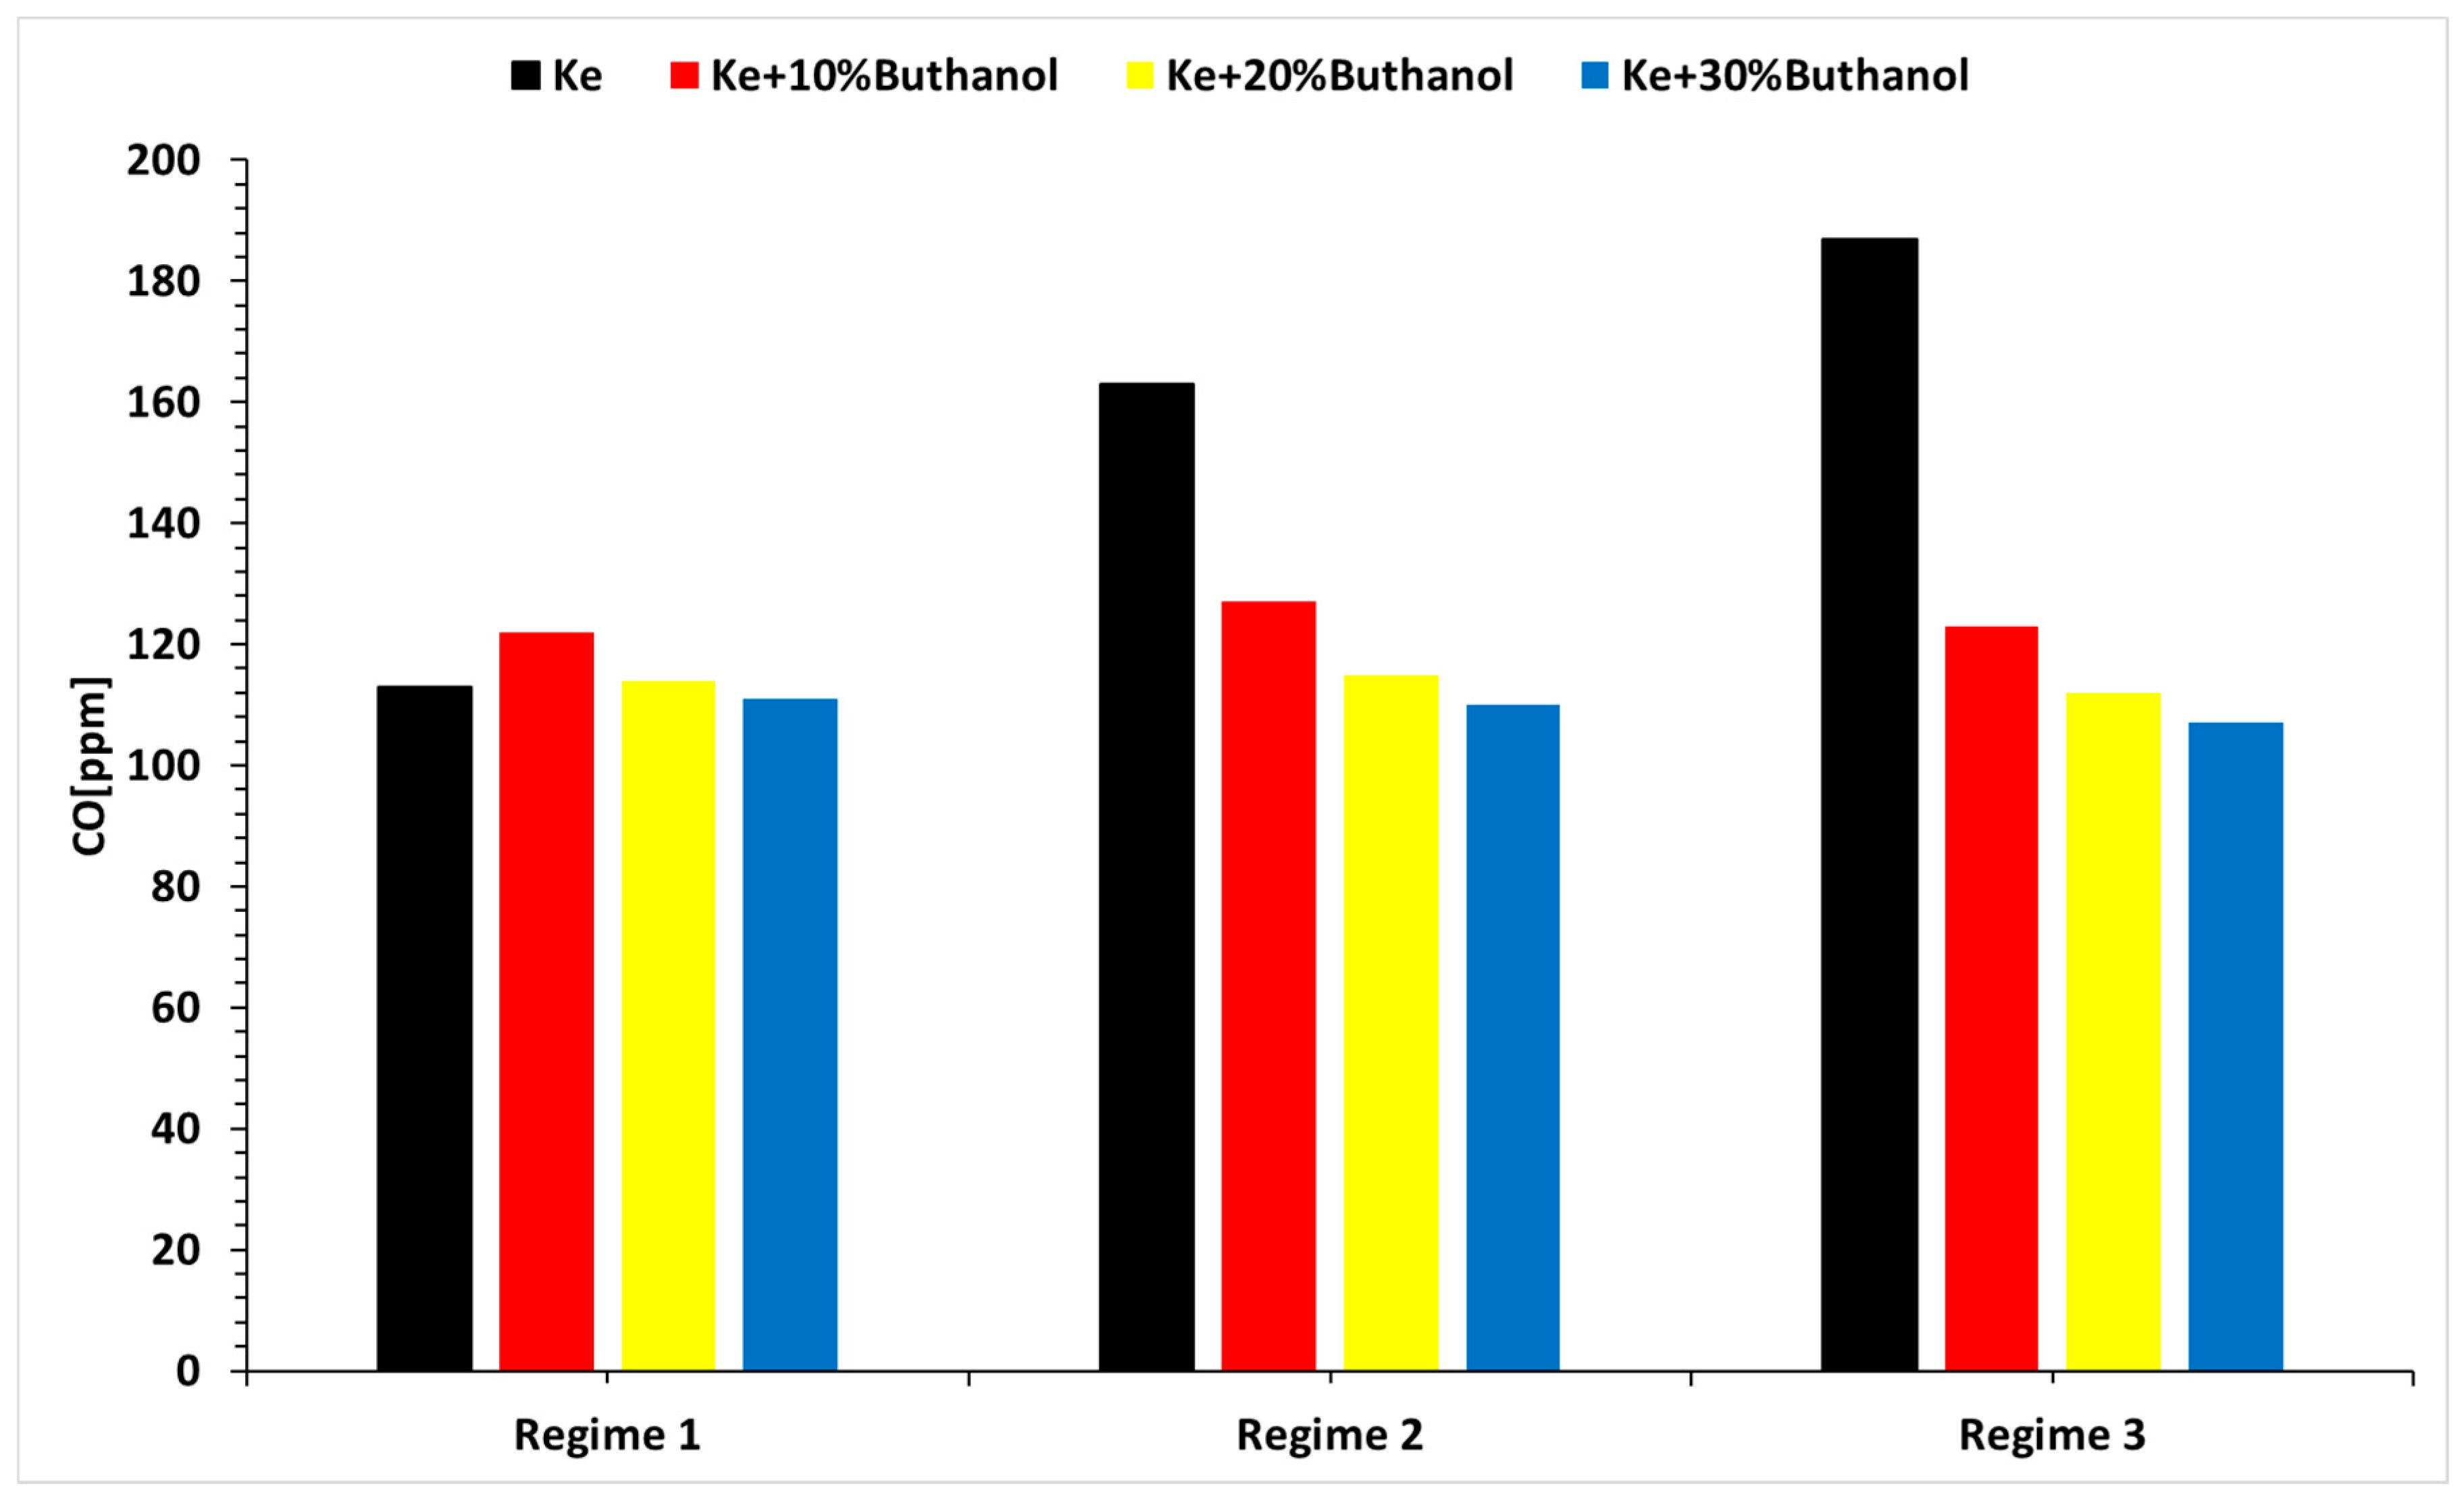
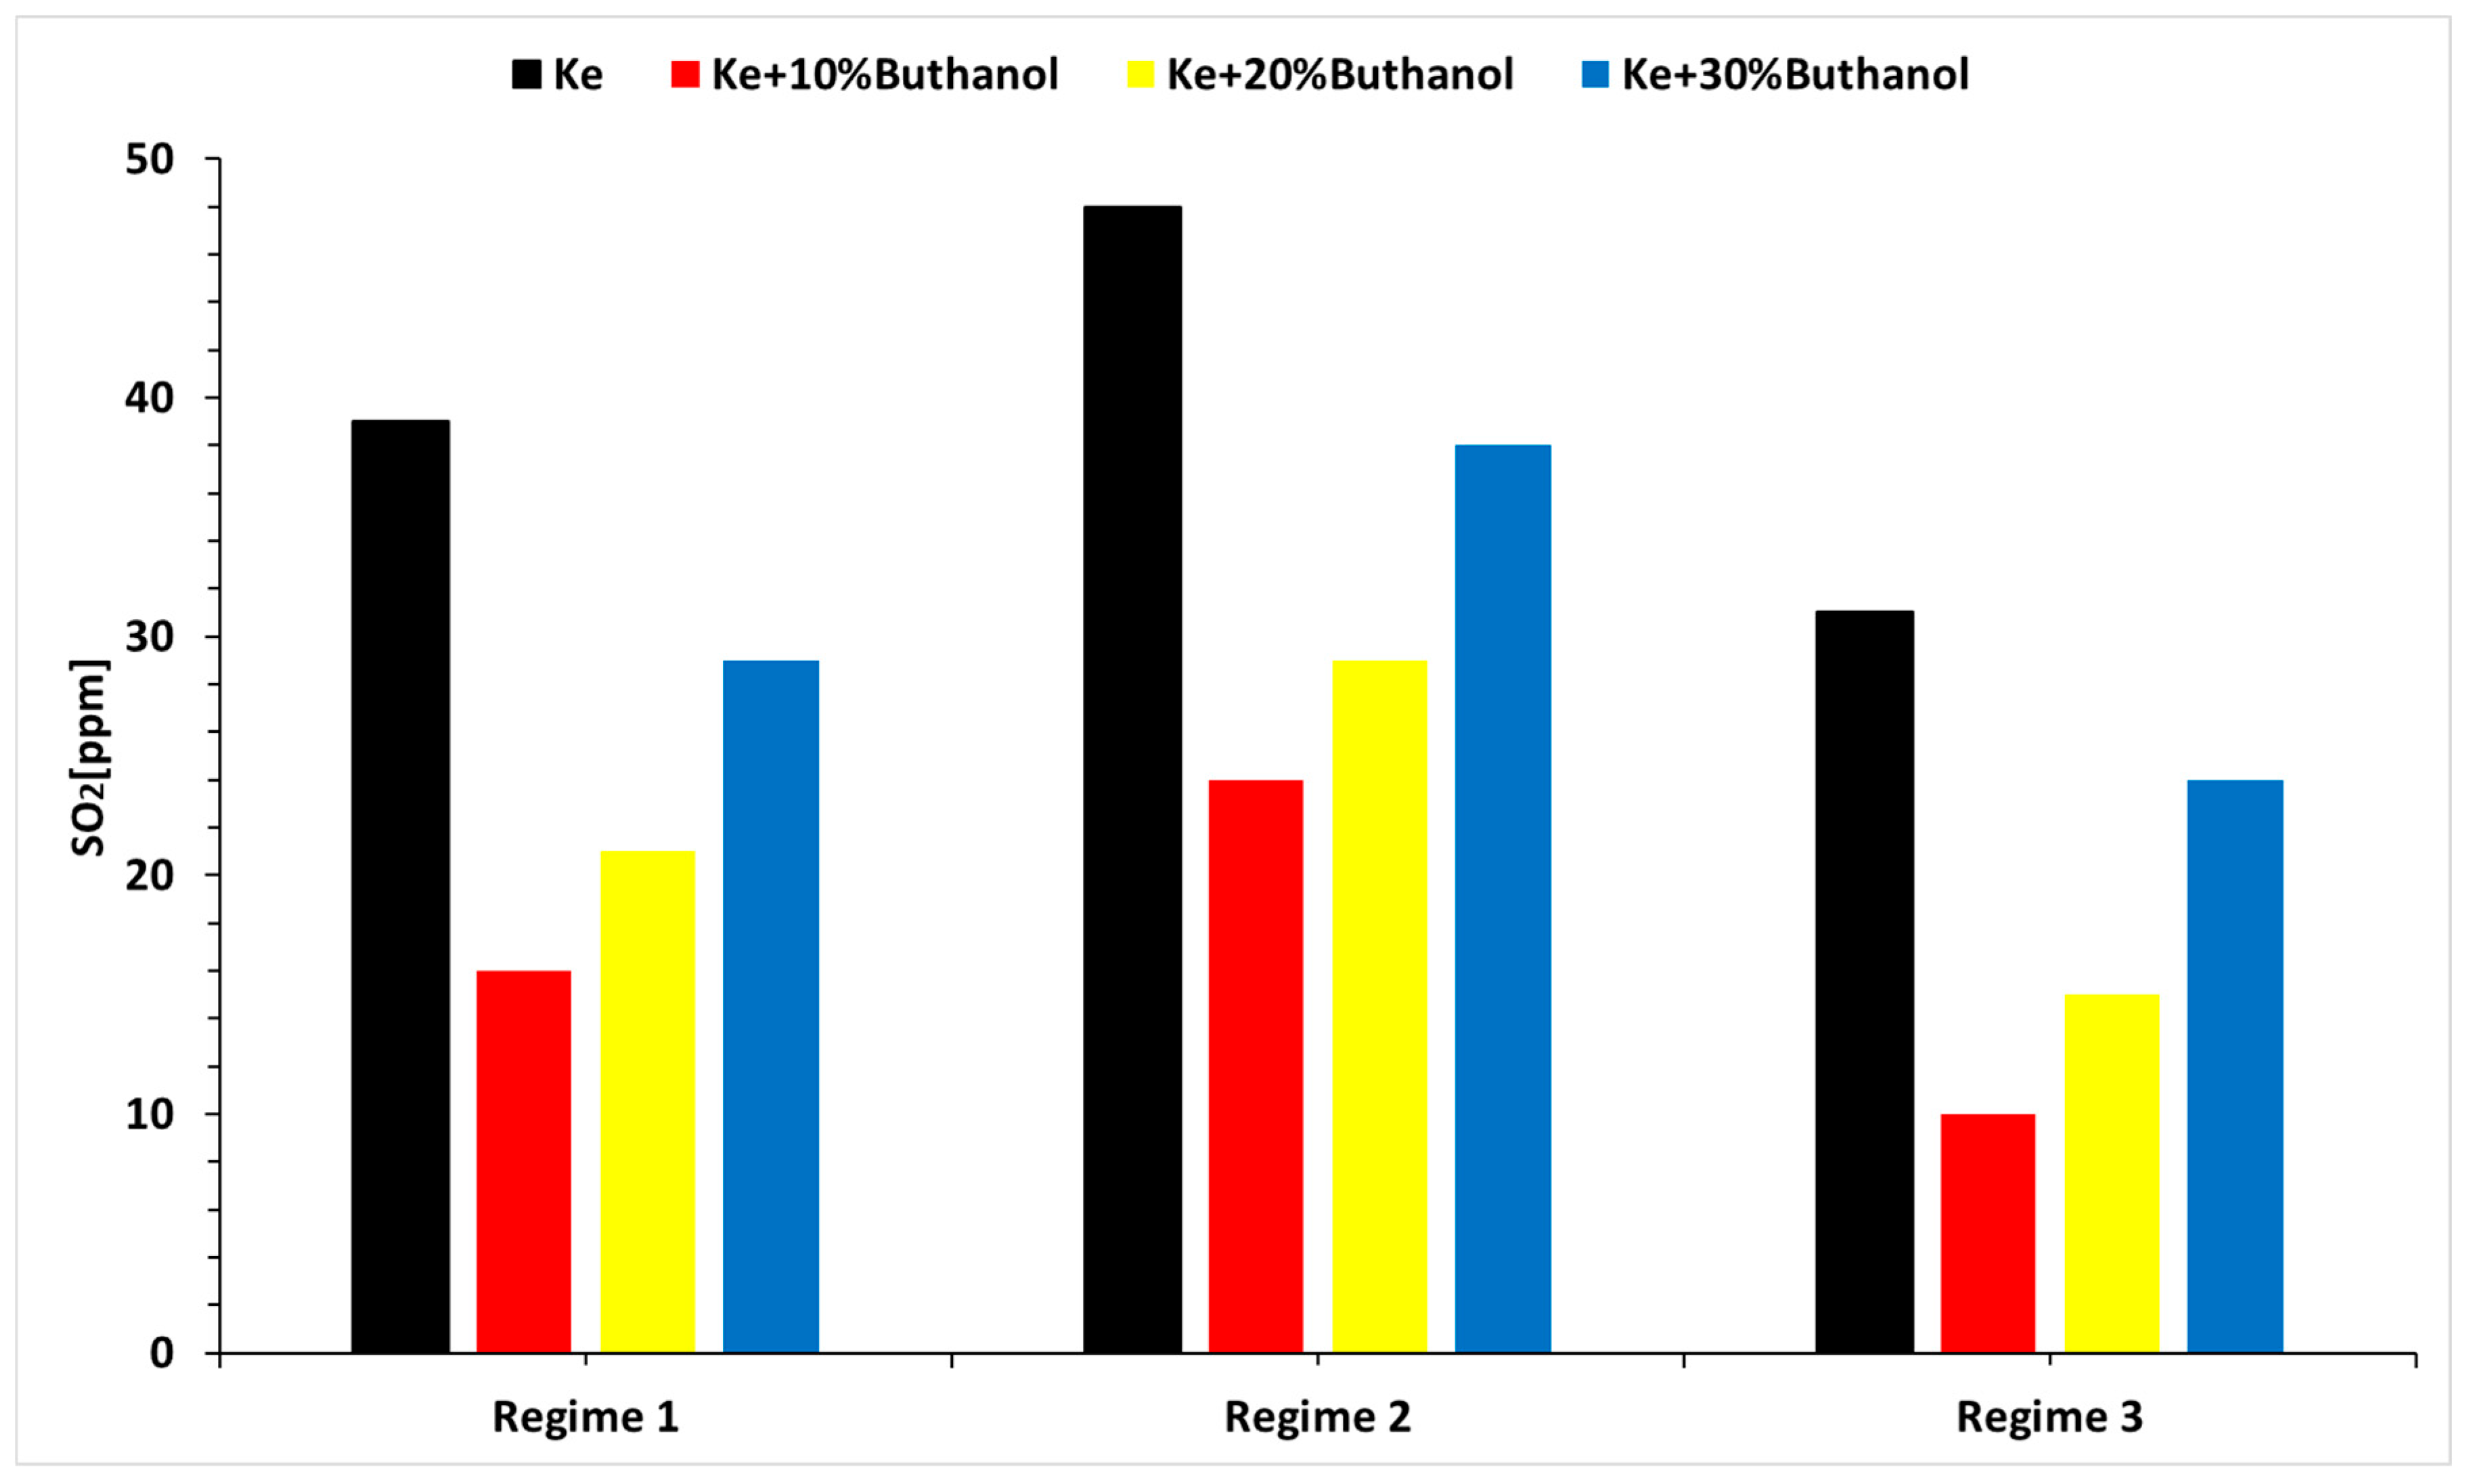
  • The concentrations of CO and SO2 primarily vary with operational regimes and then with alcohol concentrations.
  • The main conclusion is that the tested fuel blends, namely Ke+ 10%B, Ke+ 20%B, and Ke+ 30%B, are considered suitable for aviation applications using micro-turbo engines. Throughout the experiments, the integrity of the engine remained intact, confirming their viability for practical use in aviation.
  • Following experiments on the Jet Cat P80 microturbine engine, it was found that its integrity and functionality were not compromised.
  • It can be observed that the calorific power of Jet A and n-butanol blends decreases as the alcohol concentration in the blends increases.
  • The amount of CO2 produced during combustion decreases with increasing n-butanol concentration, attributable to the lower carbon content in n-butanol compared to Jet A.
  • There is an increase in the specific fuel consumption of the microturbine engine, which is attributed to the calorific power of alcohol.
  • The concentration of CO and SO2 is lower when using n-butanol blends.
  • The primary finding is that the evaluated fuel mixtures—specifically Ke+ 10%B, Ke+ 20%B, and Ke+ 30%B—are deemed appropriate for aviation applications employing micro-turbo engines.

Author Contributions

Conceptualization, G.C. and R.M.; methodology, G.C. and R.M.; validation, R.M. and G.C.; investigation, R.M.; data curation, R.M. and G.C.; writing—original draft preparation, R.M. and G.C.; writing—review and editing, R.M. and G.C. All authors have read and agreed to the published version of the manuscript.

Funding

This work was carried out through the “Nucleu” Program within the National Research Development and Innovation Plan 2022–2027, with the support of MCID, project no. PN 23.12.01.01.

Data Availability Statement

Data are available on request to the corresponding author. The data are not publicly available due to IPR agreement signed by authors with the funding institution. All data to be made public must undergo institution’s internal check and approval.

Acknowledgments

The author would like to acknowledge the financial and technical support from INCDT COMOTI.

Conflicts of Interest

The authors declare no conflicts of interest.

References

  1. Cordiner, R.; Wan, K.; Hajat, S.; Macintyre, H.L. Accounting for adaptation when projecting climate change impacts on health: A review of temperature-related health impacts. Environ. Int. 2024, 188, 108761. [Google Scholar] [CrossRef]
  2. Wei, H.; Liu, W.; Chen, X.; Yang, Q.; Li, J.; Chen, H. Renewable bio-jet fuel production for aviation: A review. Fuel 2019, 254, 115599. [Google Scholar] [CrossRef]
  3. Ye, Y.; Guo, W.; Ngo, H.H.; Wei, W.; Cheng, D.; Bui, X.T.; Hoang, N.B.; Zhang, H. Biofuel production for circular bioeconomy: Present scenario and future scope. Sci. Total Environ. 2024, 935, 172863. [Google Scholar] [CrossRef]
  4. De Oliveira Gonçalves, F.; Lopes, E.S.; Lopes, M.S.; Maciel Filho, R. Thorough evaluation of the available light-duty engine technologies to reduce greenhouse gases emissions in Brazil. J. Clean. Prod. 2022, 358, 132051. [Google Scholar] [CrossRef]
  5. Tian, Z.; Zhen, X.; Wang, Y.; Liu, D.; Li, X. Comparative study on combustion and emission characteristics of methanol, ethanol and butanol fuel in TISI engine. Fuel 2020, 259, 116199. [Google Scholar] [CrossRef]
  6. Jhang, S.R.; Lin, Y.C.; Chen, K.S.; Lin, S.L.; Batterman, S. Evaluation of fuel consumption, pollutant emissions and well-to-wheel GHGs assessment from a vehicle operation fueled with bioethanol, gasoline and hydrogen. Energy 2020, 209, 118436. [Google Scholar] [CrossRef]
  7. Osman, S.; Sapunaru, O.V.; Sterpu, A.E.; Chis, T.V.; I.Koncsag, C. Impact of Adding Bioethanol and Dimethyl Carbonate on Gasoline Properties. Energies 2023, 16, 1940. [Google Scholar] [CrossRef]
  8. Iliev, S. A Comparison of Ethanol, Methanol, and Butanol Blending with Gasoline and Its Effect on Engine Performance and Emissions Using Engine Simulation. Processes 2021, 9, 1322. [Google Scholar] [CrossRef]
  9. Tibaquirá, J.E.; Huertas, J.I.; Ospina, S.; Quirama, L.F.; Niño, J.E. The effect of using ethanol-gasoline blends on the mechanical, energy and environmental performance of in-use vehicles. Energies 2018, 11, 221. [Google Scholar] [CrossRef]
  10. Turner, J.; Lewis, A.G.; Akehurst, S.; Brace, C.J.; Verhelst, S.; Vancoillie, J.; Sileghem, L.; Leach, F.; Edwards, P.P. Alcohol fuels for spark-ignition engines: Performance, efficiency and emission effects at mid to high blend rates for binary mixtures and pure components. Automob. Eng. 2018, 232, 36–56. [Google Scholar] [CrossRef]
  11. Newes, E.; Clark, C.M.; Vimmerstedt, L.; Peterson, S.; Burkholder, D.; Korotney, D.; Inman, D. Ethanol production in the United States: The roles of policy, price, and demand. Energy Policy 2022, 161, 112713. [Google Scholar] [CrossRef]
  12. Mirea, R.; Cican, G. Lab Scale Investigation of Gaseous Emissions, Performance and Stability of an Aviation Turbo-Engine While Running on Biodiesel Based Sustainable Aviation Fuel. Inventions 2024, 9, 16. [Google Scholar] [CrossRef]
  13. Przysowa, R.; Gawron, B.; Białecki, T.; Łęgowik, A.; Merkisz, J.; Jasiński, R. Performance and Emissions of a Microturbine and Turbofan Powered by Alternative Fuels. Aerospace 2021, 8, 25. [Google Scholar] [CrossRef]
  14. Labeckas, G.; Slavinskas, S.; Laurinaitis, K. Effect of jet A-1/ethanol fuel blend on HCCI combustion and exhaust emissions. J. Energy Eng. 2018, 144, 04018047. [Google Scholar] [CrossRef]
  15. Shauck, M.E.; Tubbs, J.; Zanin, M.G. Certification of a Carburater Aircraft Engine on Ethanol Fuel. Available online: https://afdc.energy.gov/files/pdfs/2896.pdf (accessed on 18 May 2024).
  16. Litt, J.S.; Chin, J.C.; Liu, Y. Simulating the Use of Alternative Fuels in a Turbofan Engine; Glenn Research Center, National Aeronautics and Space Administration (NASA): Cleveland, OH, USA, 2013.
  17. Gawron, B.; Białecki, T.; Dziegielewski, W.; Kaźmierczak, U. Performance and emission characteristic of miniature turbojet engine FED Jet A-1/alcohol blend. J. KONES 2016, 23, 123–130. [Google Scholar] [CrossRef]
  18. Mendez, C.J.; Parthasarathy, R.N.; Gollahalli, S.R. Performance and emission characteristics of butanol/Jet A blends in a gas turbine engine. Appl. Energy 2014, 118, 135–140. [Google Scholar] [CrossRef]
  19. Andoga, R.; Főző, L.; Schrötter, M.; Szabo, S. The Use of Ethanol as an Alternative Fuel for Small Turbojet Engines. Sustainability 2021, 13, 2541. [Google Scholar] [CrossRef]
  20. Cican, G.; Deaconu, M.; Mirea, R.; Cucuruz, A.T. Influence of Bioethanol Blends on Performances of a Micro Turbojet Engine. Rev. Chim. 2020, 71, 229–238. [Google Scholar] [CrossRef]
  21. Chen, L.; Zhang, Z.; Lu, Y.; Zhang, C.; Zhang, X.; Zhang, C.; Roskilly, A.P. Experimental study of the gaseous and particulate matter emissions from a gas turbine combustor burning butyl butyrate and ethanol blends. Appl. Energy 2017, 195, 693–701. [Google Scholar] [CrossRef]
  22. Cican, G.; Mirea, R.; Rimbu, G. Experimental Evaluation of Methanol/Jet-A Blends as Sustainable Aviation Fuels for Turbo-Engines: Performance and Environmental Impact Analysis. Fire 2024, 7, 155. [Google Scholar] [CrossRef]
  23. SR EN ISO 3675/2003; Crude Petroleum and Liquid Petroleum Products—Laboratory Determination of Density—Hydrometer Method. European Committee for Standardization: Bucharest, Romania, 2003.
  24. ASTM D92-05a; Standard Test Method for Flash and Fire Points by Cleveland Open Cup Tester. ASTM International: West Conshohocken, PA, USA, 2009.
  25. SR EN ISO 3104/2002; Petroleum Products. Transparent and Opaque Liquids. Determination of Kinematic Viscosity and Calculation of Dynamic Viscosity. European Committee for Standardization: Bucharest, Romania, 2002.
  26. ASTM D240-17; Standard Test Method for Heat of Combustion of Liquid Hydrocarbon Fuels by Bomb Calorimeter. ASTM International: West Conshohocken, PA, USA, 2017.
  27. ASTM D5291-16; Standard Test Methods for Instrumental Determination of Carbon, Hydrogen, and Nitrogen in Petroleum Products and Lubricants. ASTM International: West Conshohocken, PA, USA, 2016.
  28. Jet Cat USA. Jet Cat Instruction Manual. U.S. Patent No. 6216440, 17 April 2001.
  29. Cican, G. Experimental Transient Process Analysis of Micro-Turbojet Aviation Engines: Comparing the Effects of Diesel and Kerosene Fuels at Different Ambient Temperatures. Energies 2024, 17, 1366. [Google Scholar] [CrossRef]
  30. Boehm, R.C.; Yang, Z.; Bell, D.C.; Feldhausen, J.; Heyne, J.S. Lower heating value of jet fuel from hydrocarbon class concentration data and thermo-chemical reference data: An uncertainty quantification. Fuel 2022, 311, 122542. [Google Scholar] [CrossRef]
  31. Mattingly, J. Elements of Propulsion: Gas Turbines and Rockets, 2nd ed.; American Institute of Aeronautics and Astronautics: Reston, VA, USA, 2006. [Google Scholar]
Figure 1. The microturbine engine test stand. (a) Real engine setup; (b) engine schematic; and (c) measurement setup scheme.
Fire 07 00313 g001aFire 07 00313 g001b
Figure 2. MRU analyzer.
Fire 07 00313 g002
Figure 3. FTIR spectra of Ke (green), Ke+ 10%B (purple), Ke+ 20%B (blue), Ke+ 30%B (red), and 100%B (black).
Fire 07 00313 g003
Figure 4. The variation in n vs. time.
Fire 07 00313 g004
Figure 5. The variation in T_comb vs. RPM.
Fire 07 00313 g005
Figure 6. The variation in Qf (fuel flow) vs. RPM.
Fire 07 00313 g006
Figure 7. The variation in temperature in front of the turbine vs. RPM.
Fire 07 00313 g007
Figure 8. The variation in Qf vs. RPM.
Fire 07 00313 g008
Figure 9. The variation in F (thrust) vs. RPM.
Fire 07 00313 g009
Figure 10. Variation in the temperature in front of the turbine as a function of regime and fuel blend.
Fire 07 00313 g010
Figure 11. Variation in fuel flow as a function of regime and fuel blend.
Fire 07 00313 g011
Figure 12. Variation in F as a function of regime and fuel blend.
Fire 07 00313 g012
Figure 13. Micro-turbo engine operating line.
Fire 07 00313 g013
Figure 14. Variation in the micro-turbo engine operating line during rapid acceleration and deceleration.
Fire 07 00313 g014
Figure 15. The variation in CO concentration for the three regimes and the four fuels analyzed.
Fire 07 00313 g015
Figure 16. The variation in SO2 concentration for the three regimes and the four fuels analyzed. SO2 concentration vs. regime and blend.
Fire 07 00313 g016
Figure 17. The variation in the specific consumption for the three regimes and the four fuels analyzed.
Fire 07 00313 g017
Figure 18. The variation in the combustion efficiency for the three regimes and the four fuels analyzed.
Fire 07 00313 g018
Table 1. The experimentally determined values for the physical–chemical properties.
SampleFlash Point
[°C]
Kinematic Viscosity at 40 °C
[cSt]
Density at 22 °C
[g/cm3]
Low Calorific Power
[kJ/kg]
Elemental
Analysis
[%wt.]
Ke42.31.390.81742.39C% = 85.17
H% = 13.31
N% = 0.07
O% = 1.45
Ke+ 10%B33.91.510.81640.93C% = 83.13
H% = 13.33
N% = 0.06
O% = 3.46
Ke+ 20%B33.71.630.81639.46C% = 81.09
H% = 13.35
N% = 0.06
O% = 5.48
Ke+ 30%B33.11.740.81537.99C% = 79.05
H% = 13.36
N% = 0.05
O% = 7.49
B352.5730.8127.7C% = 64.76
H% = 13.49
N% = 0
O% = 21.59
Table 2. Calculated values for 1 kg of fuel blend.
BlendMO [kg]Mair [kg]CO2 [kg]H2O [kg]
Ke3.3214.453.121.20
Ke+ 10%B3.2514.133.051.20
Ke+ 20%B3.1813.822.971.20
Ke+ 30%B3.1013.492.901.20
B2.6711.602.371.21
Table 3. Thermal efficiency at the maximum regime for all tested blends.
FuelKe+ 5% Aeroshell 500 OilKe+ 10%BKe+ 20%BKe+ 30%B
η T [%]5.0845.1495.3215.423
Disclaimer/Publisher’s Note: The statements, opinions and data contained in all publications are solely those of the individual author(s) and contributor(s) and not of MDPI and/or the editor(s). MDPI and/or the editor(s) disclaim responsibility for any injury to people or property resulting from any ideas, methods, instructions or products referred to in the content.

