

Soil and Water Bioengineering in Fire-Prone Lands: Detecting Erosive Areas Using RUSLE and Remote Sensing Methods

 ,
,  ,
,  and
and 
Abstract
:1. Introduction
- To estimate water-induced pre- and post-fire soil erosion in the temperate Andes using RUSLE and S2 data;
- To locate areas of high erosion for potential implementation of SWBE measures;
- To compare these located areas with optical, high-resolution UAV data.
2. Materials and Methods
2.1. Soil and Water Bioengineering in Fire-Prone Areas
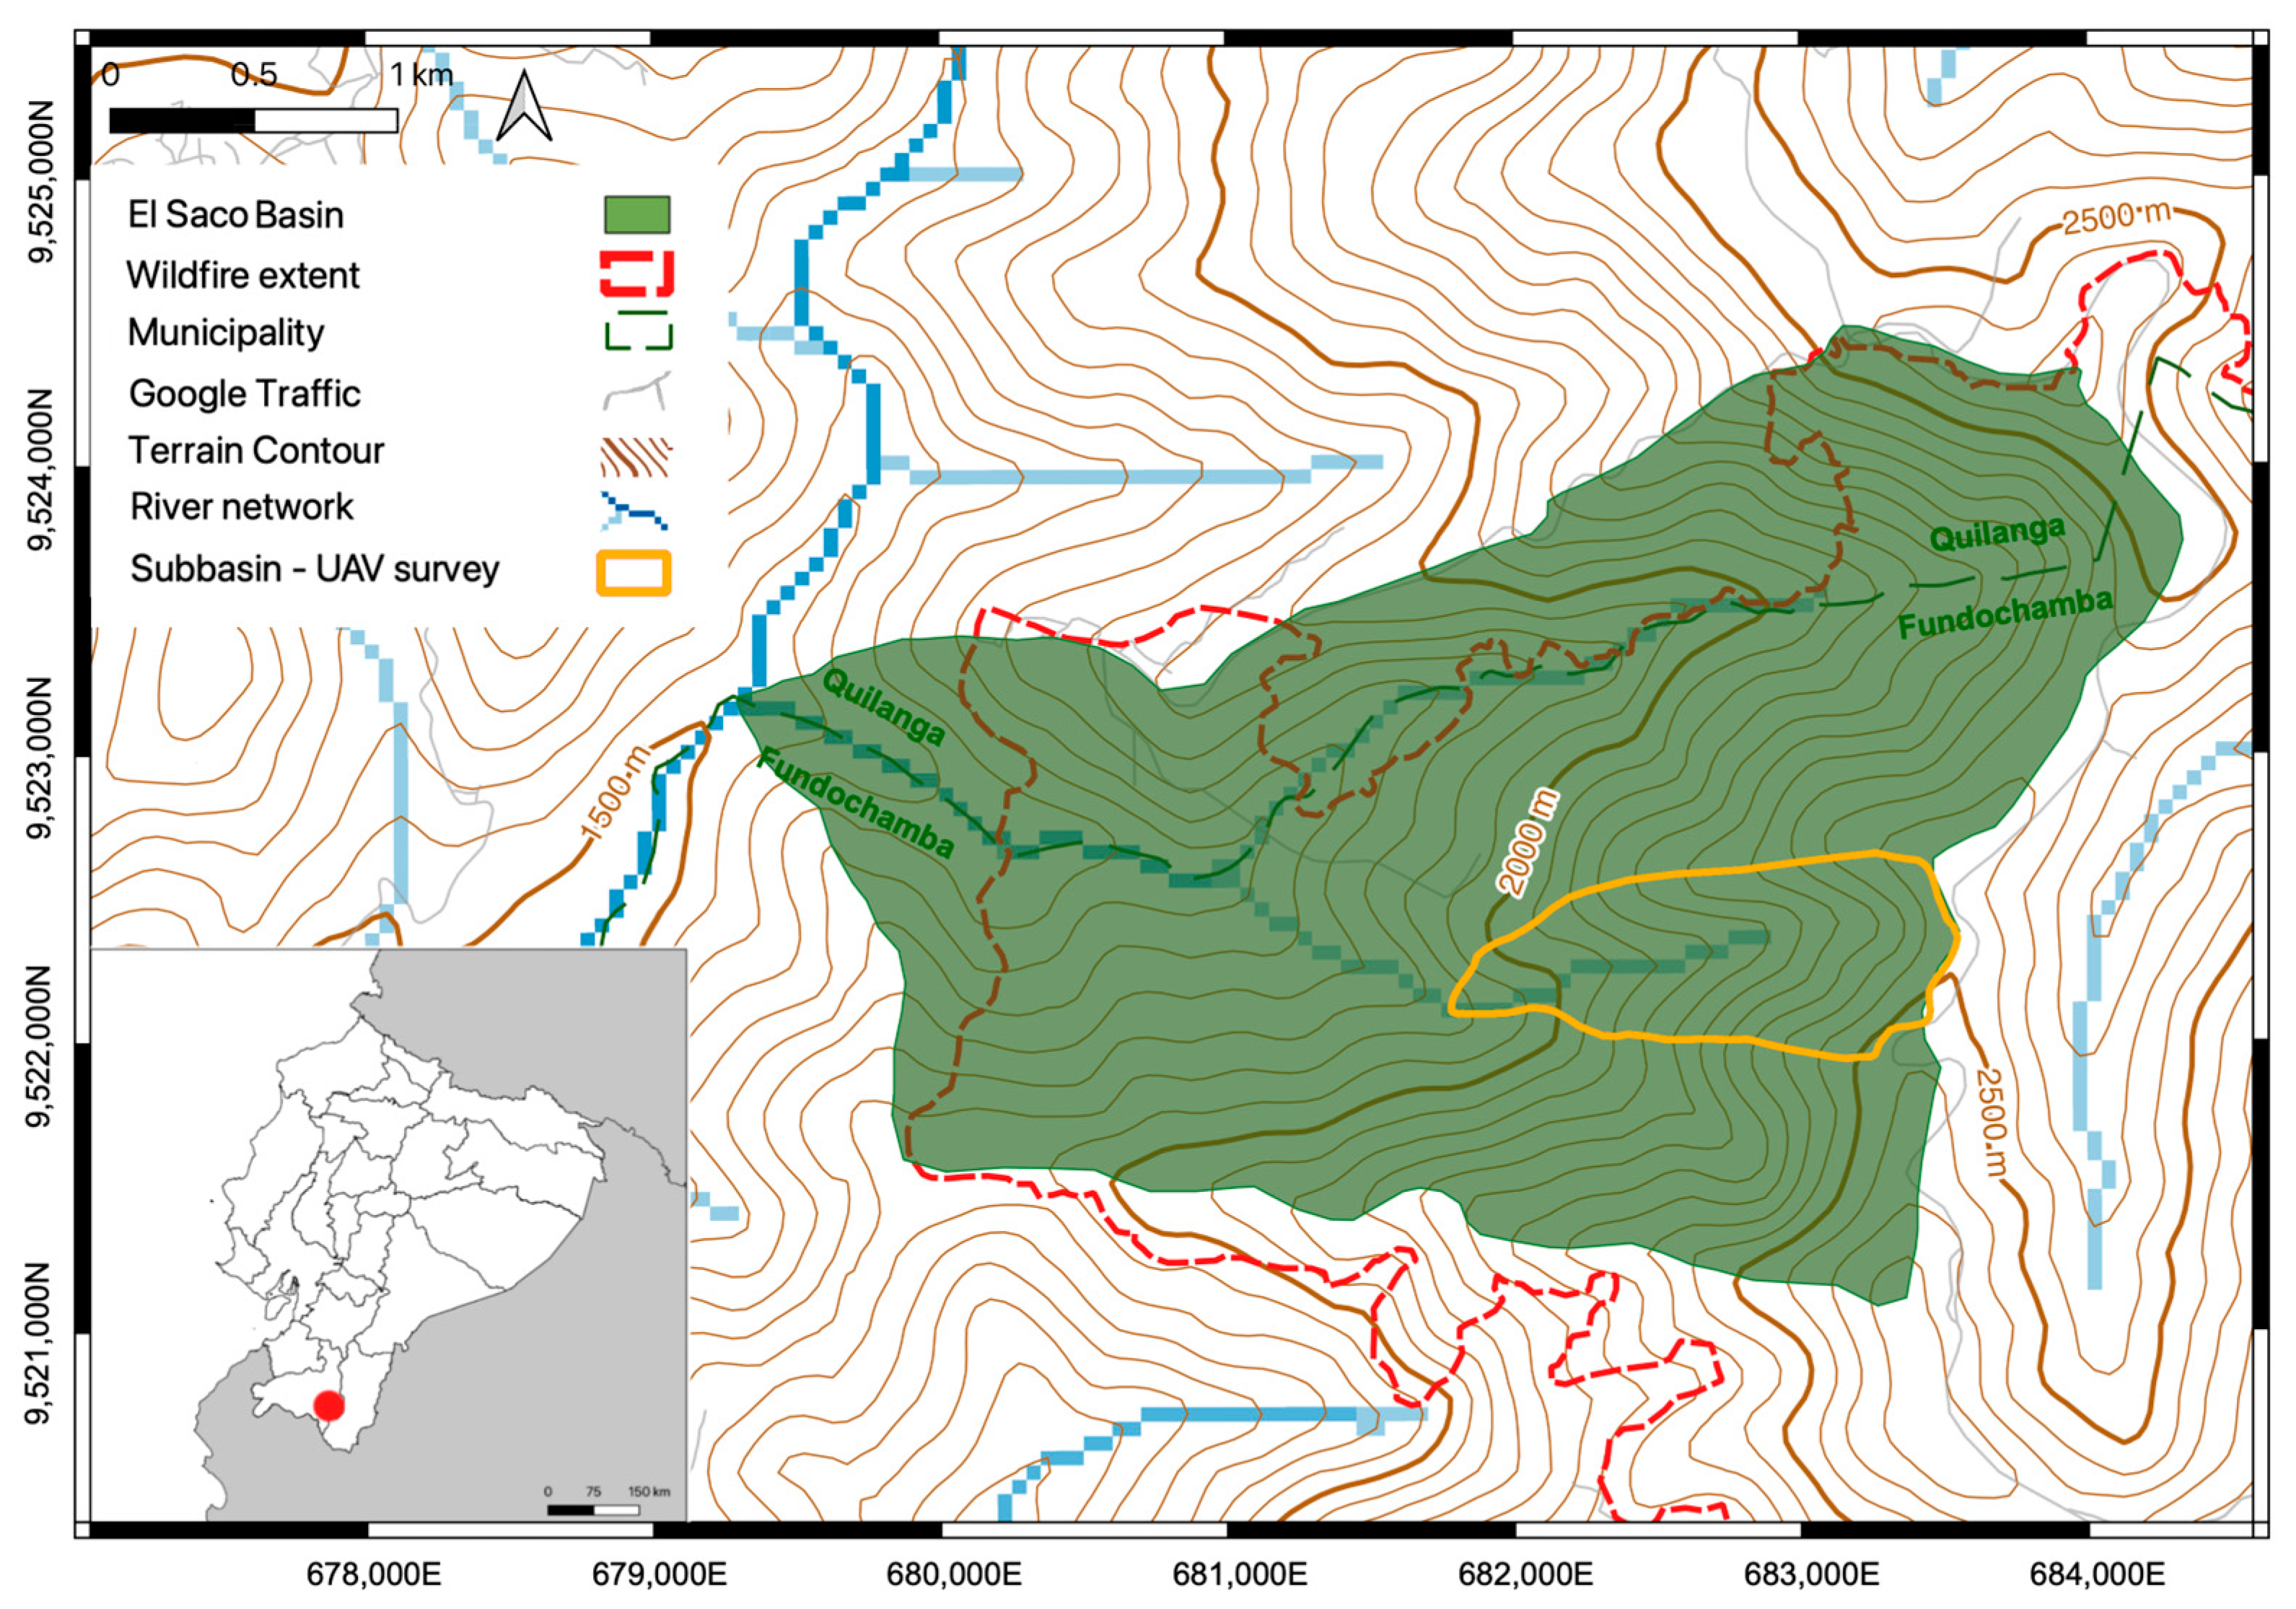
2.2. Study Site
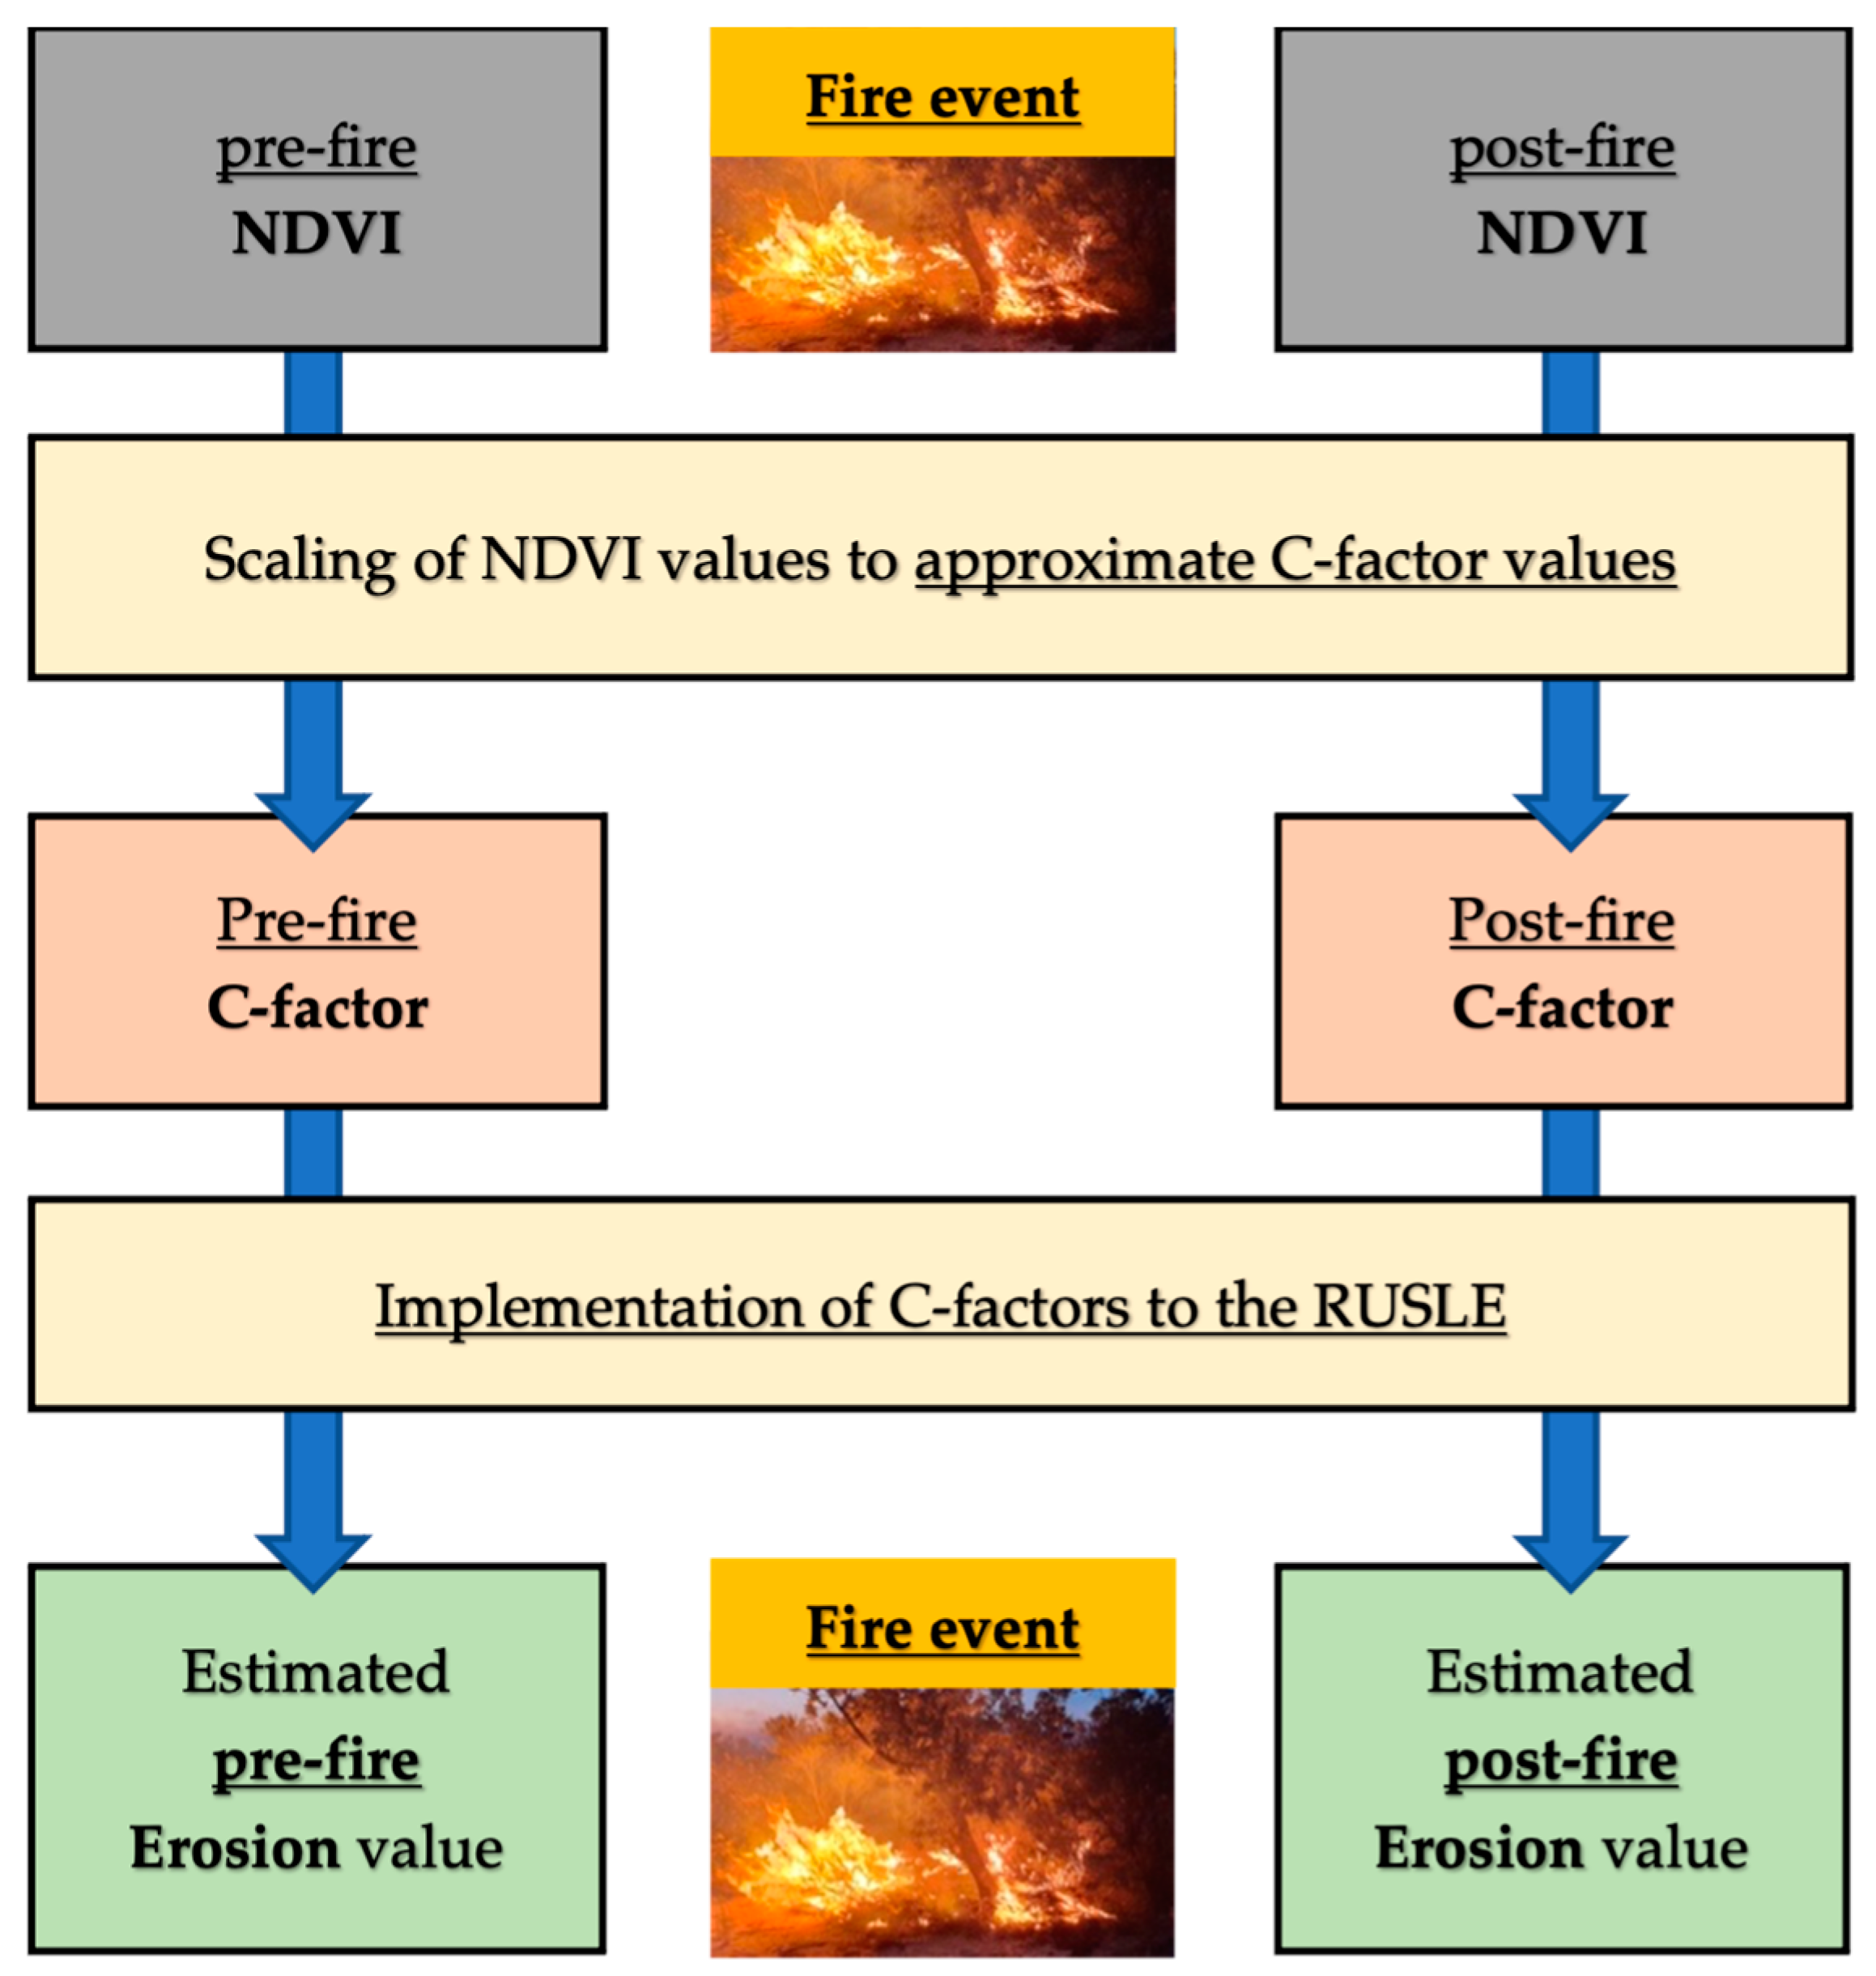
2.3. Work Flow
2.4. Revised Universal Soil Loss Equation (RUSLE)
2.4.1. Rainfall Erosivity (R)
2.4.2. Soil Erodibility (K)
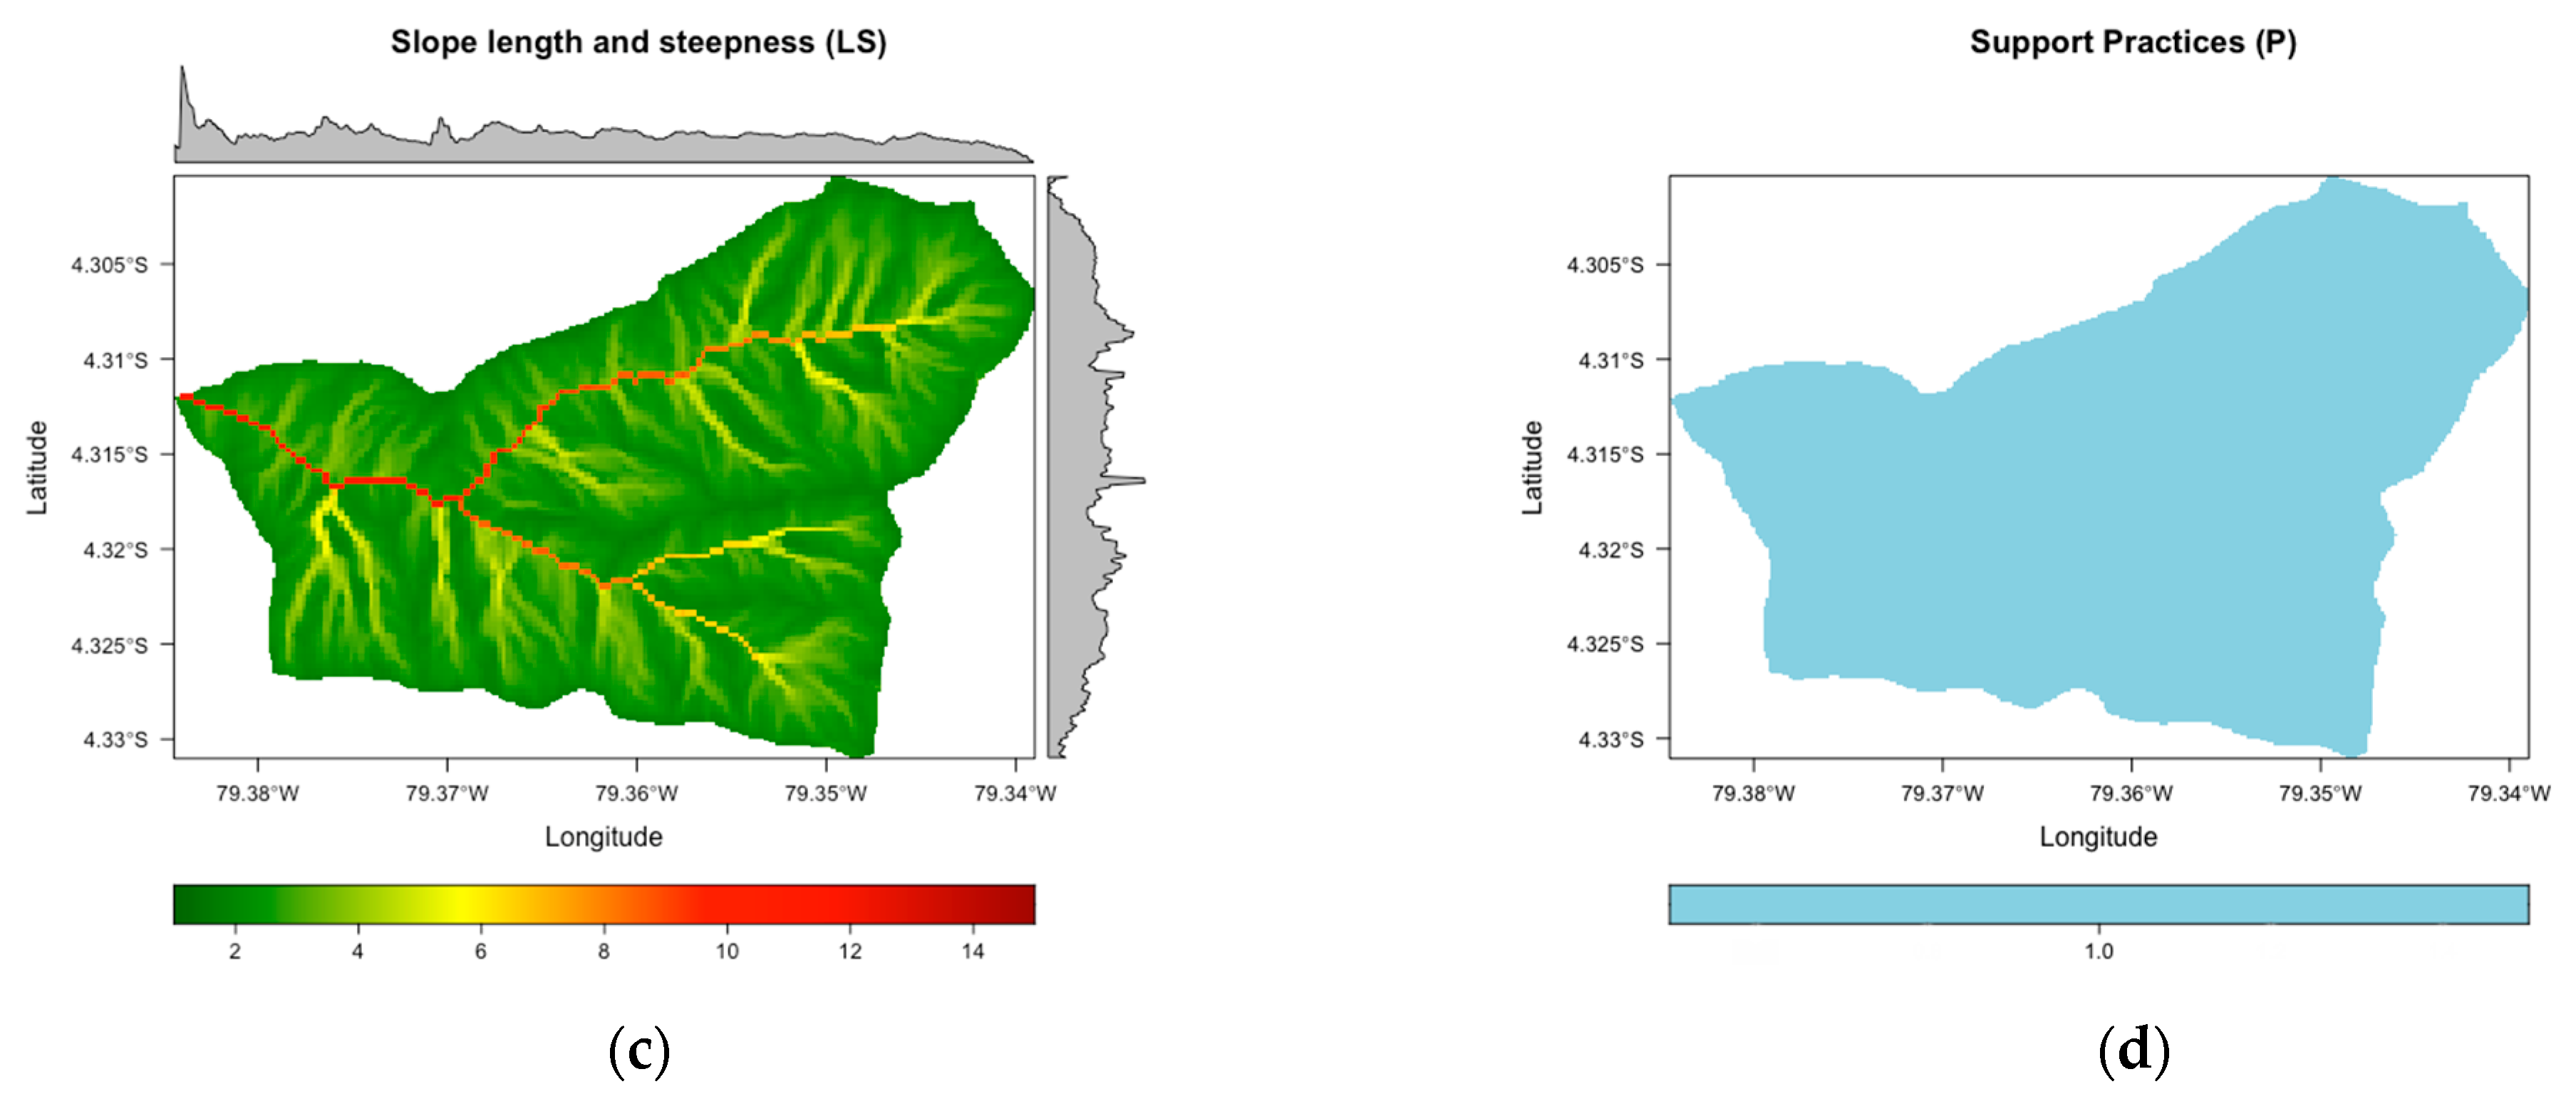
2.4.3. Slope Length and Steepness (LS)
2.4.4. Support Practices (P)
2.4.5. The (Plant-)Cover Management Factor (C)
- At the beginning of the rainy season in November (S2 Pair 1),
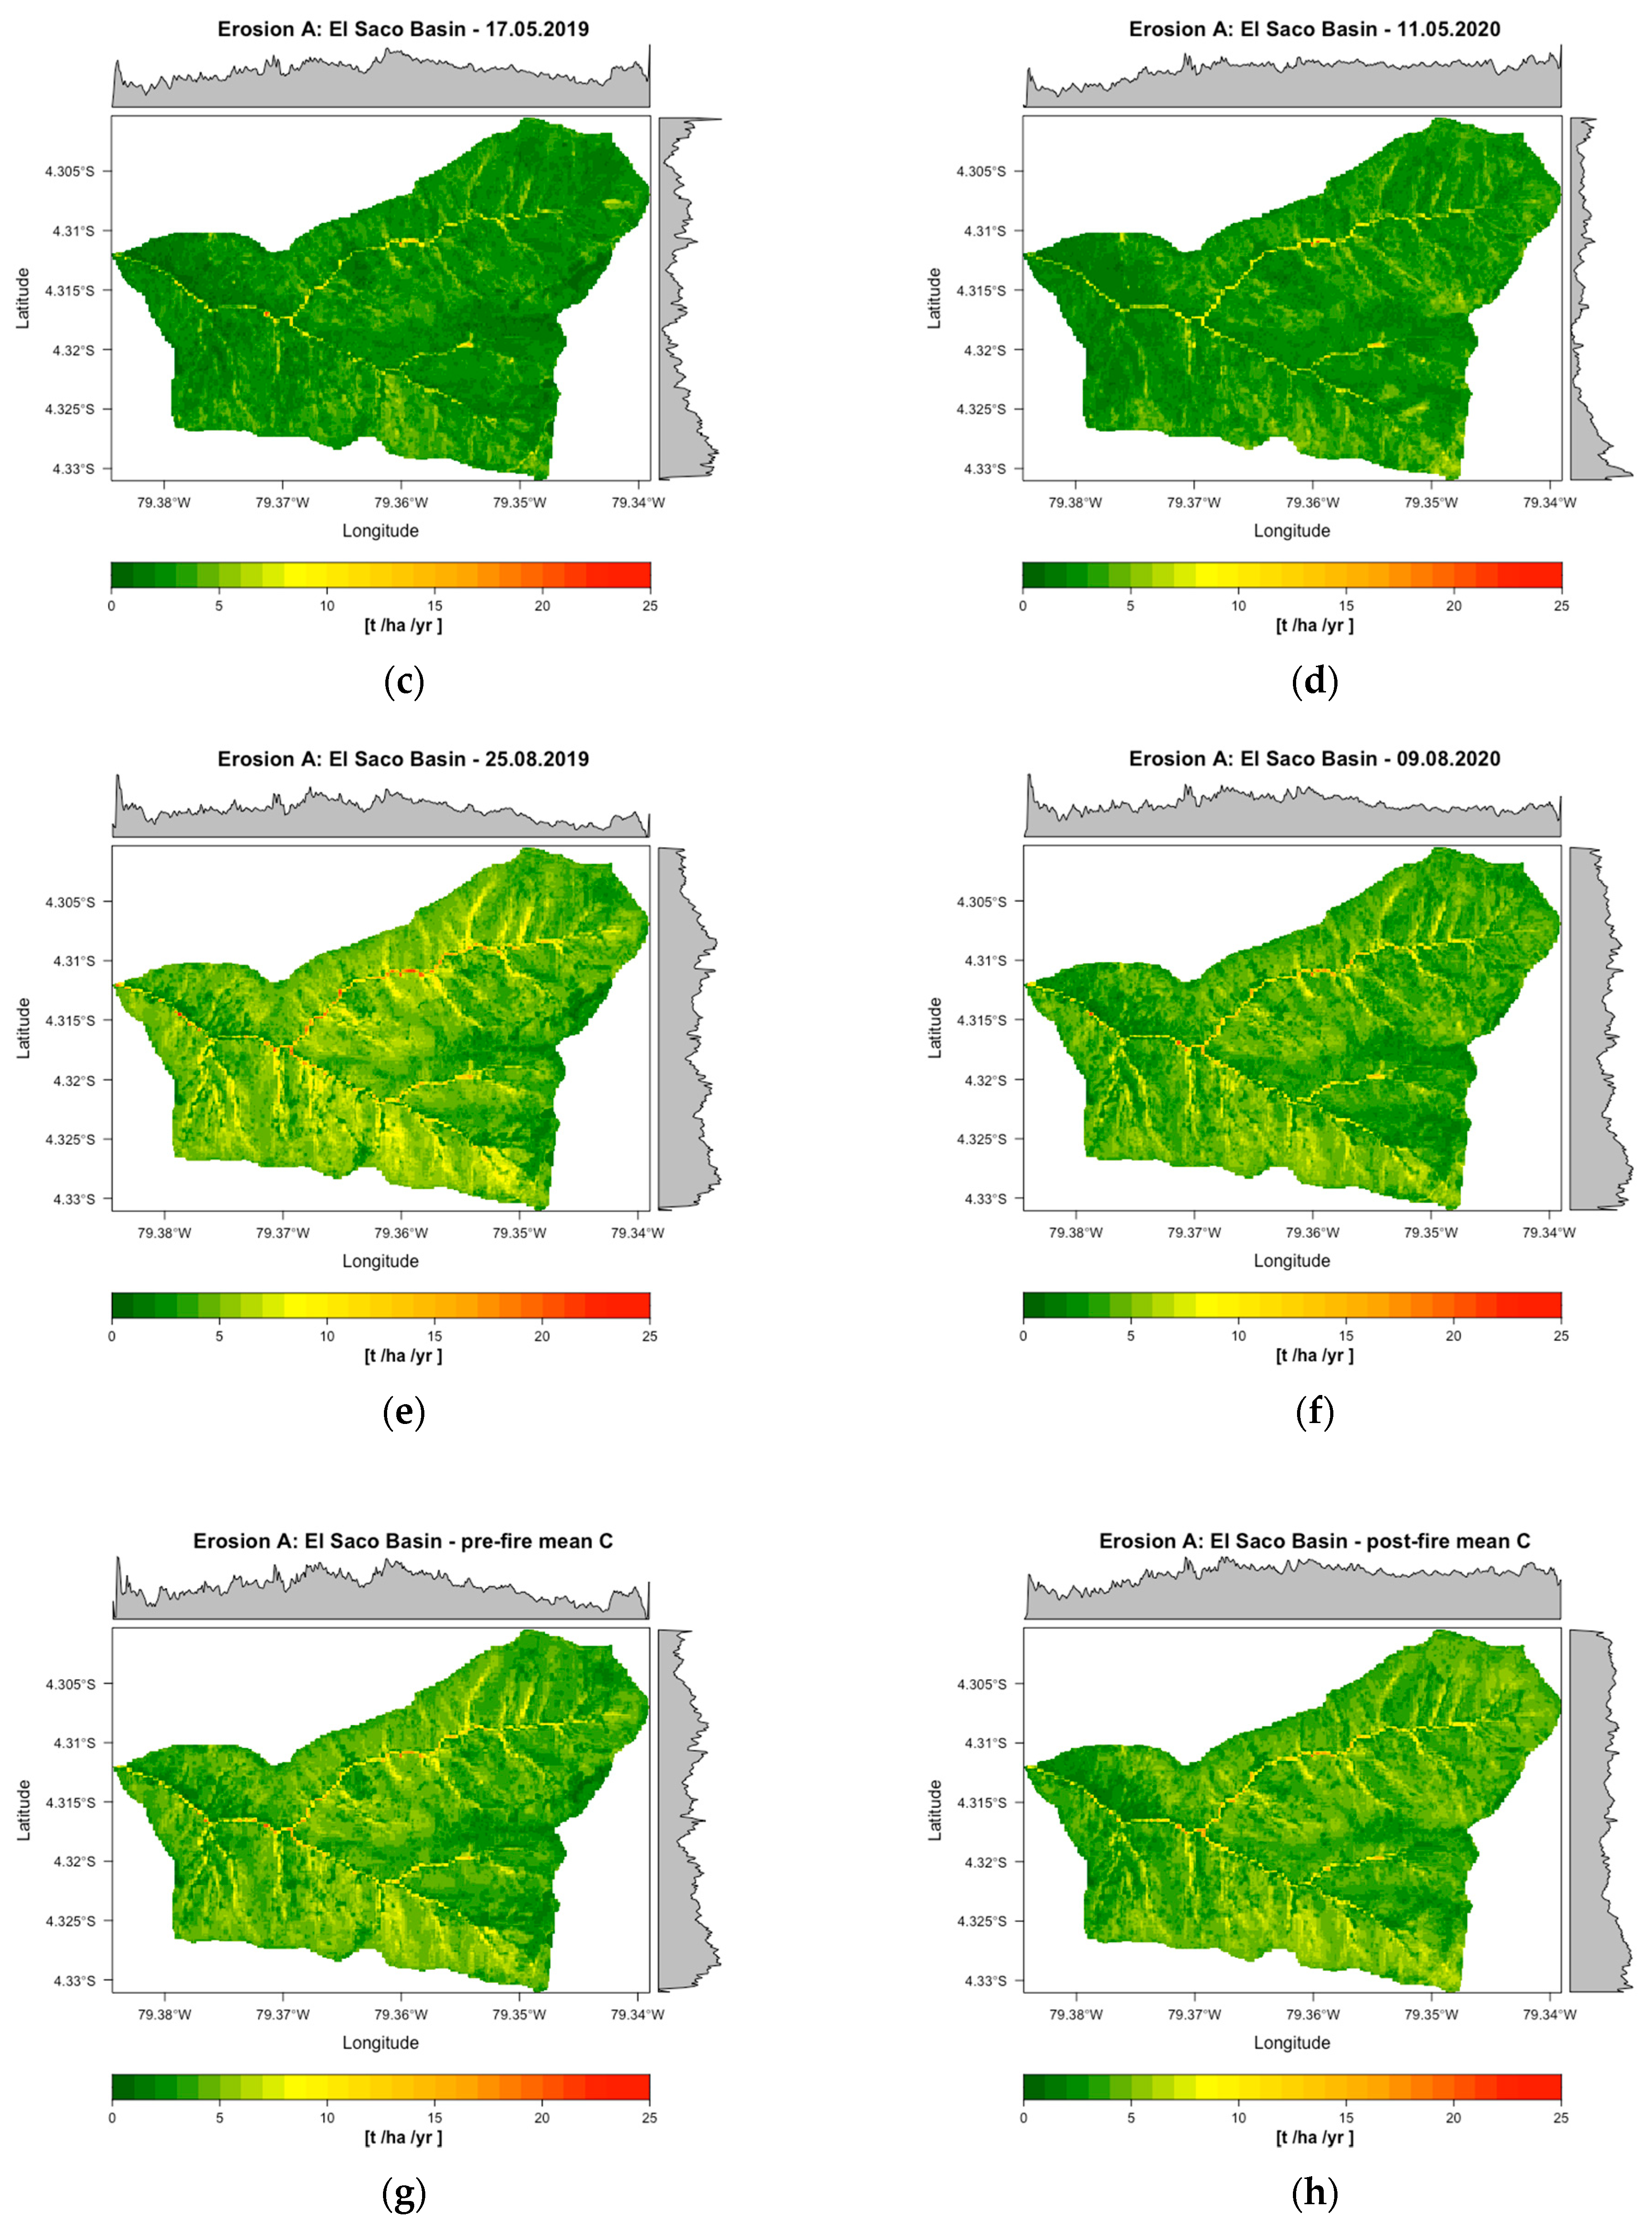
- At the end of the rainy season in May (S2 Pair 2), and
- During the dry season in August (S2 Pair 3).
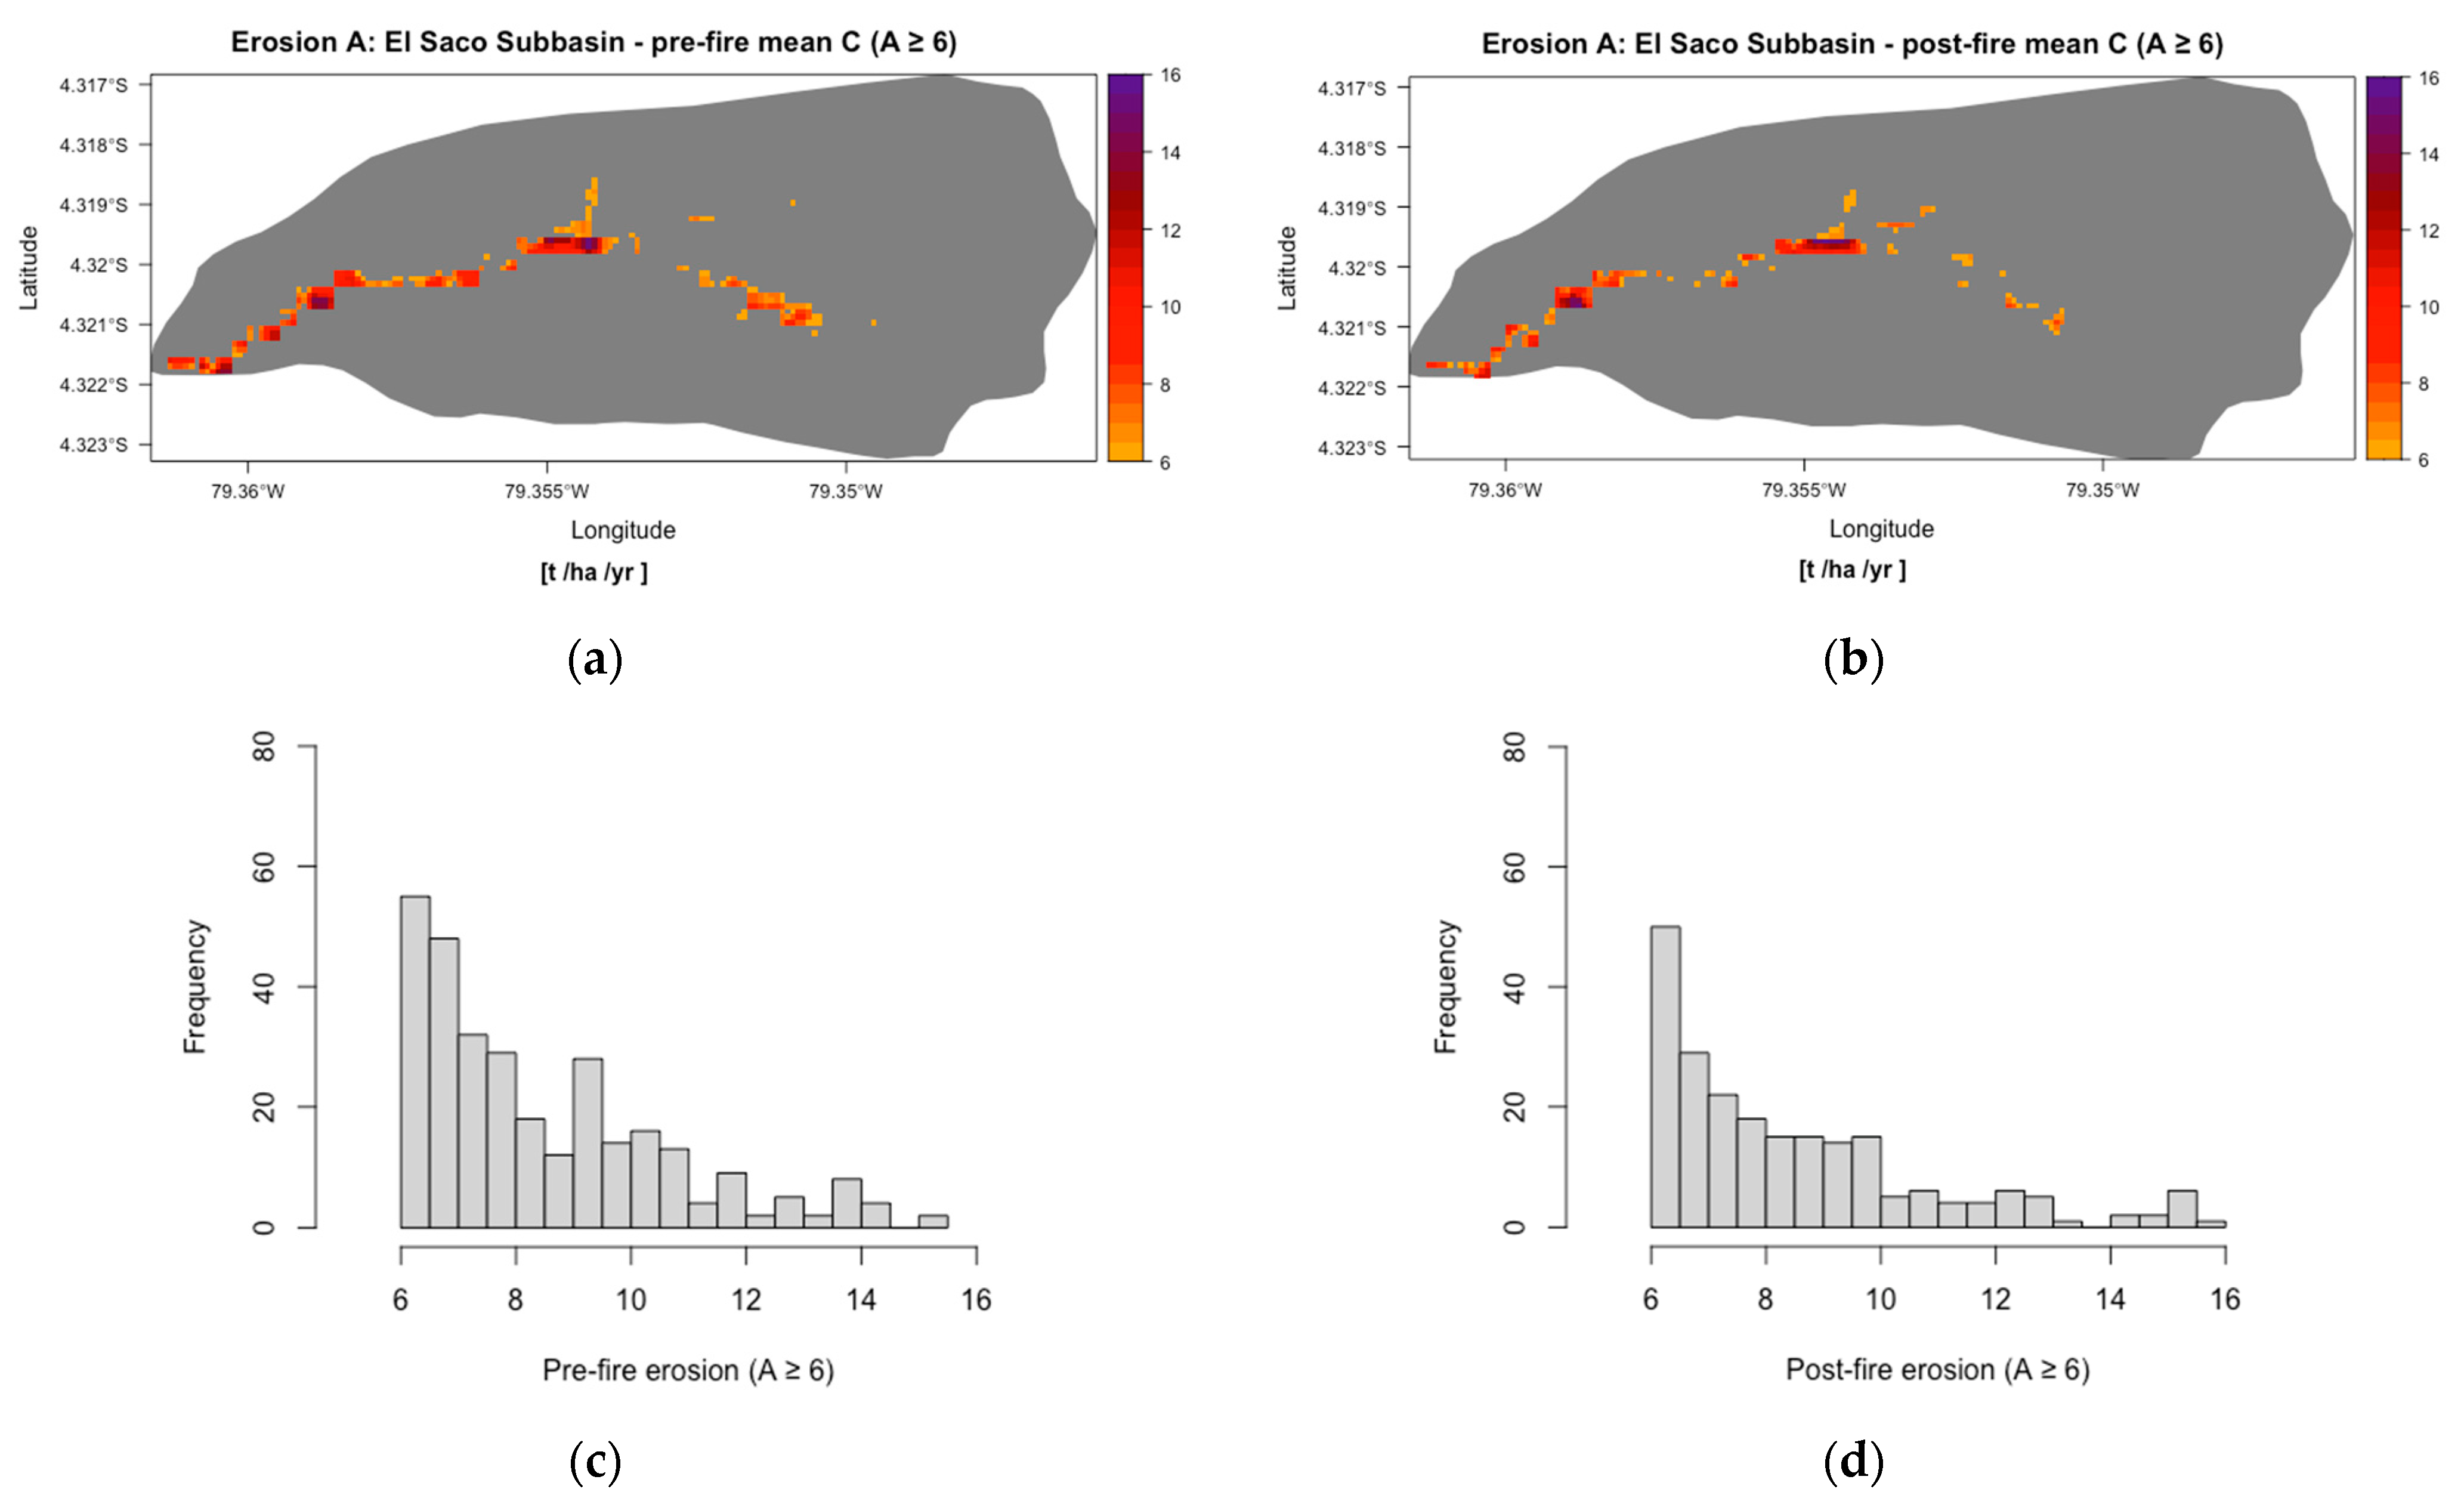
2.5. Spatial Definition of Highly Erosive Areas for Potential Implementation of SWBE
2.6. Optical Validation of the Estimated Erosion Areas
3. Results
3.1. Erosion Estimation in Pre- and Post-Fire Conditions Using the RUSLE
3.2. Area of High Erosion for Potential Implementation of Soil and Water Bioengineering
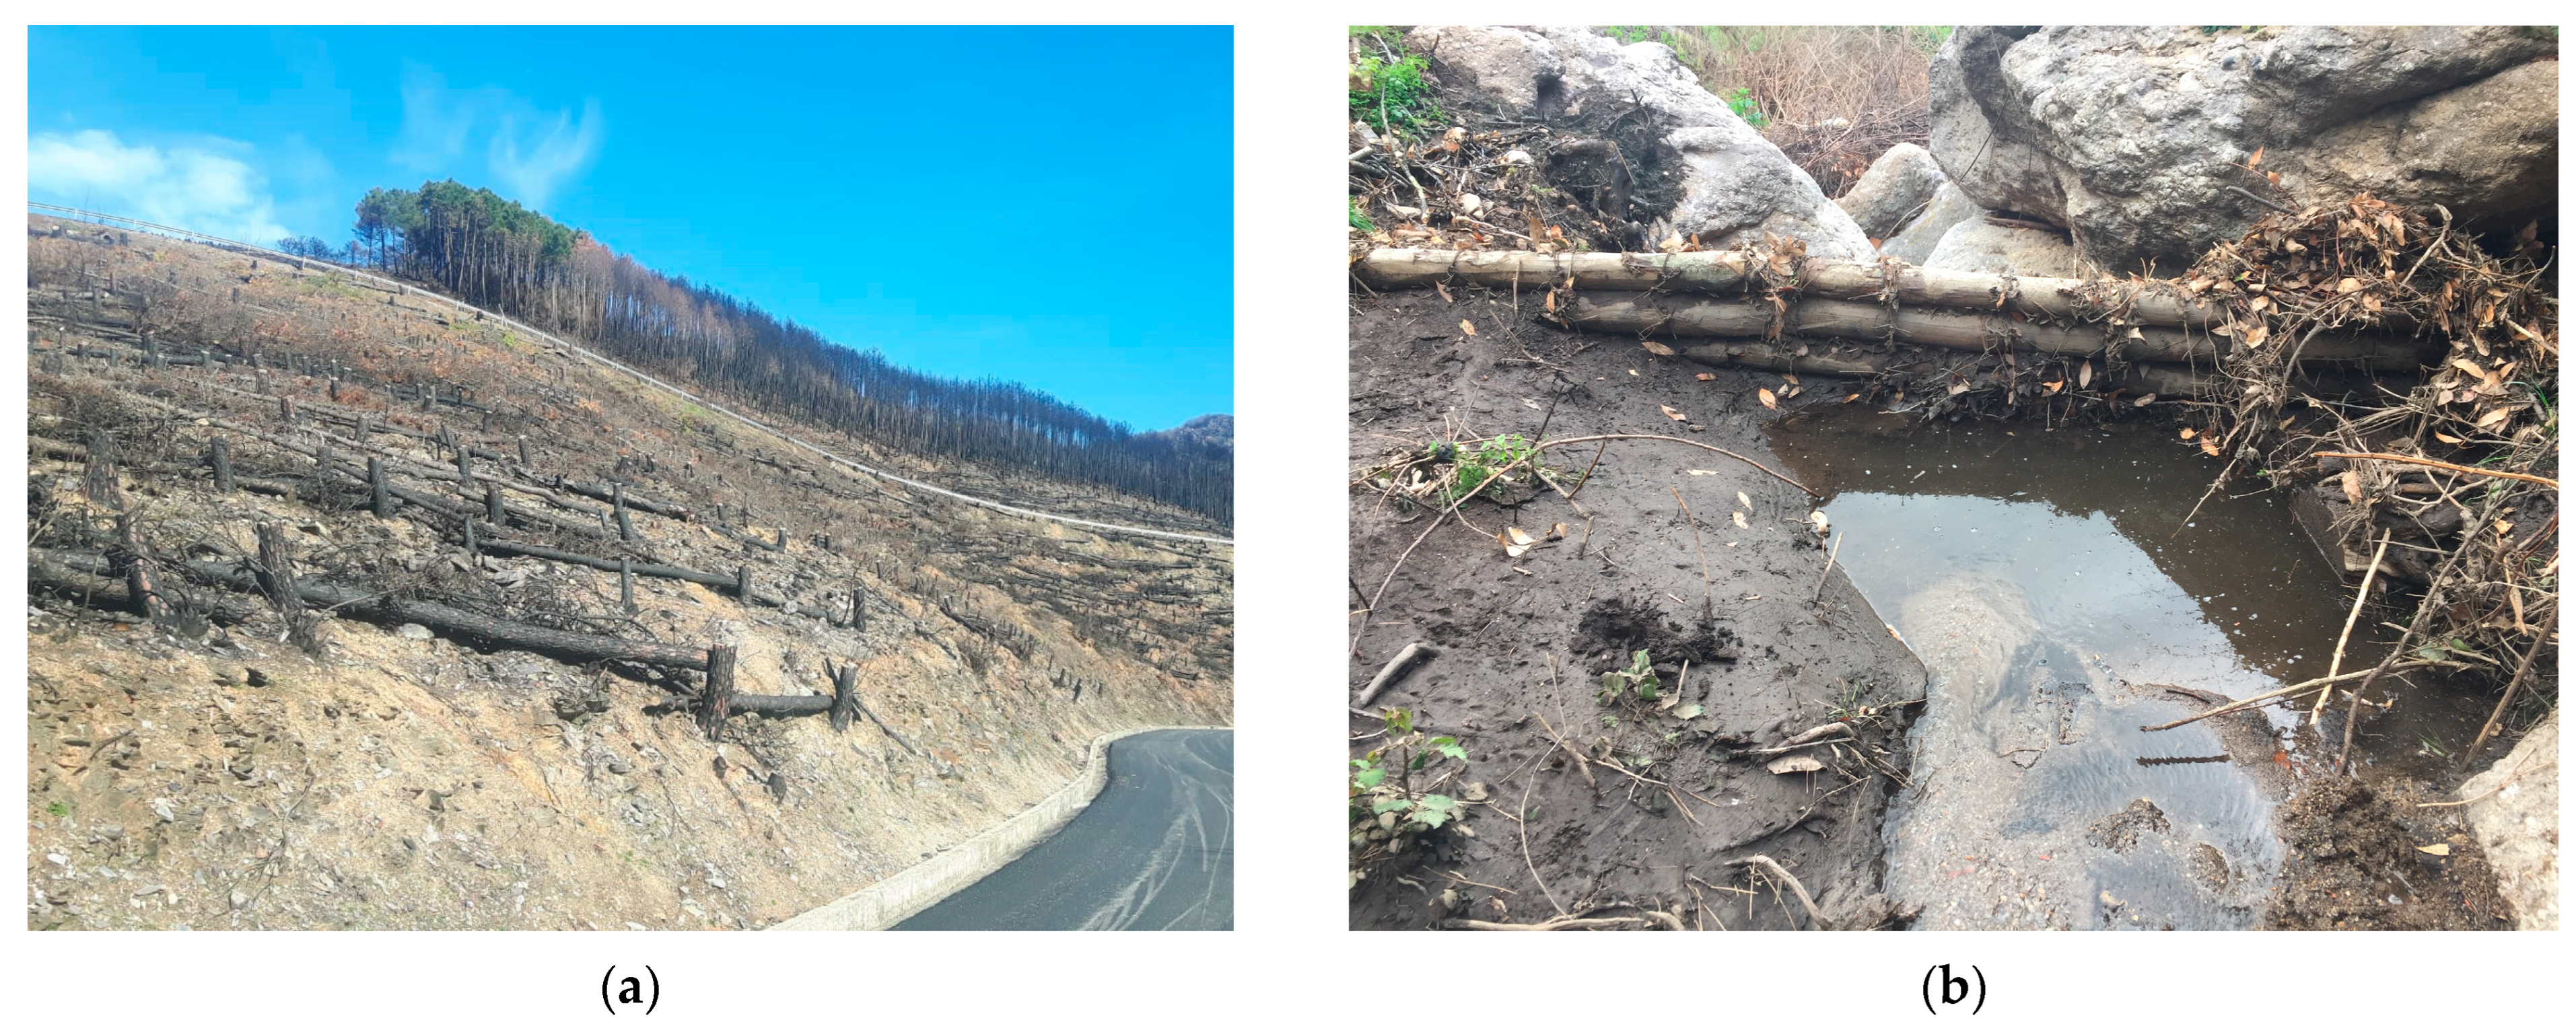
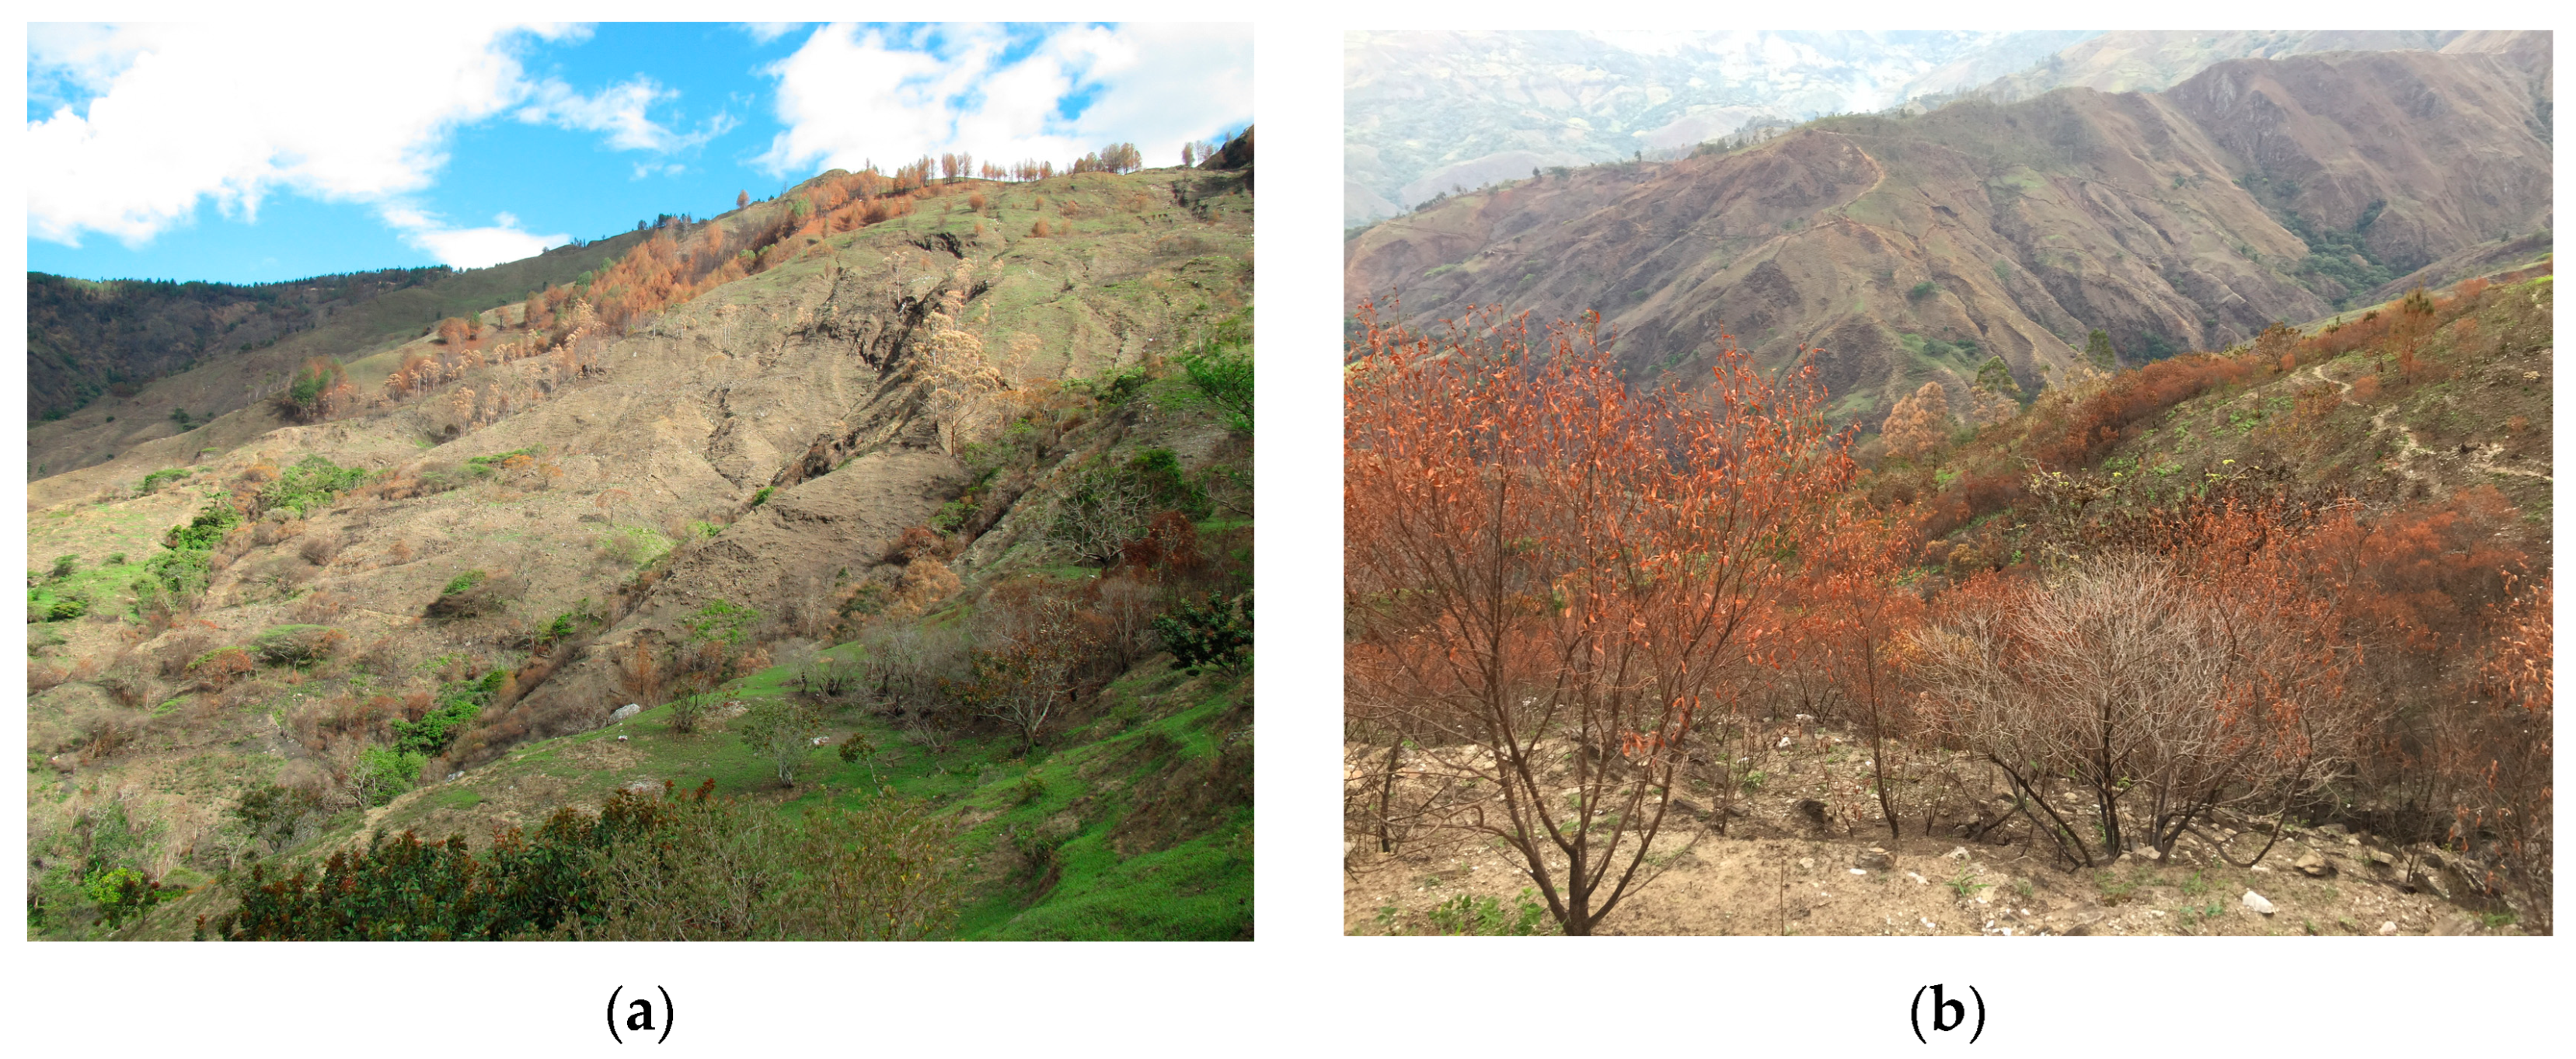
3.3. Comparison of Located Areas with Optical, High-Resolution UAV Images
4. Discussion
5. Conclusions
Author Contributions
Funding
Institutional Review Board Statement
Informed Consent Statement
Data Availability Statement
Acknowledgments
Conflicts of Interest
Appendix A
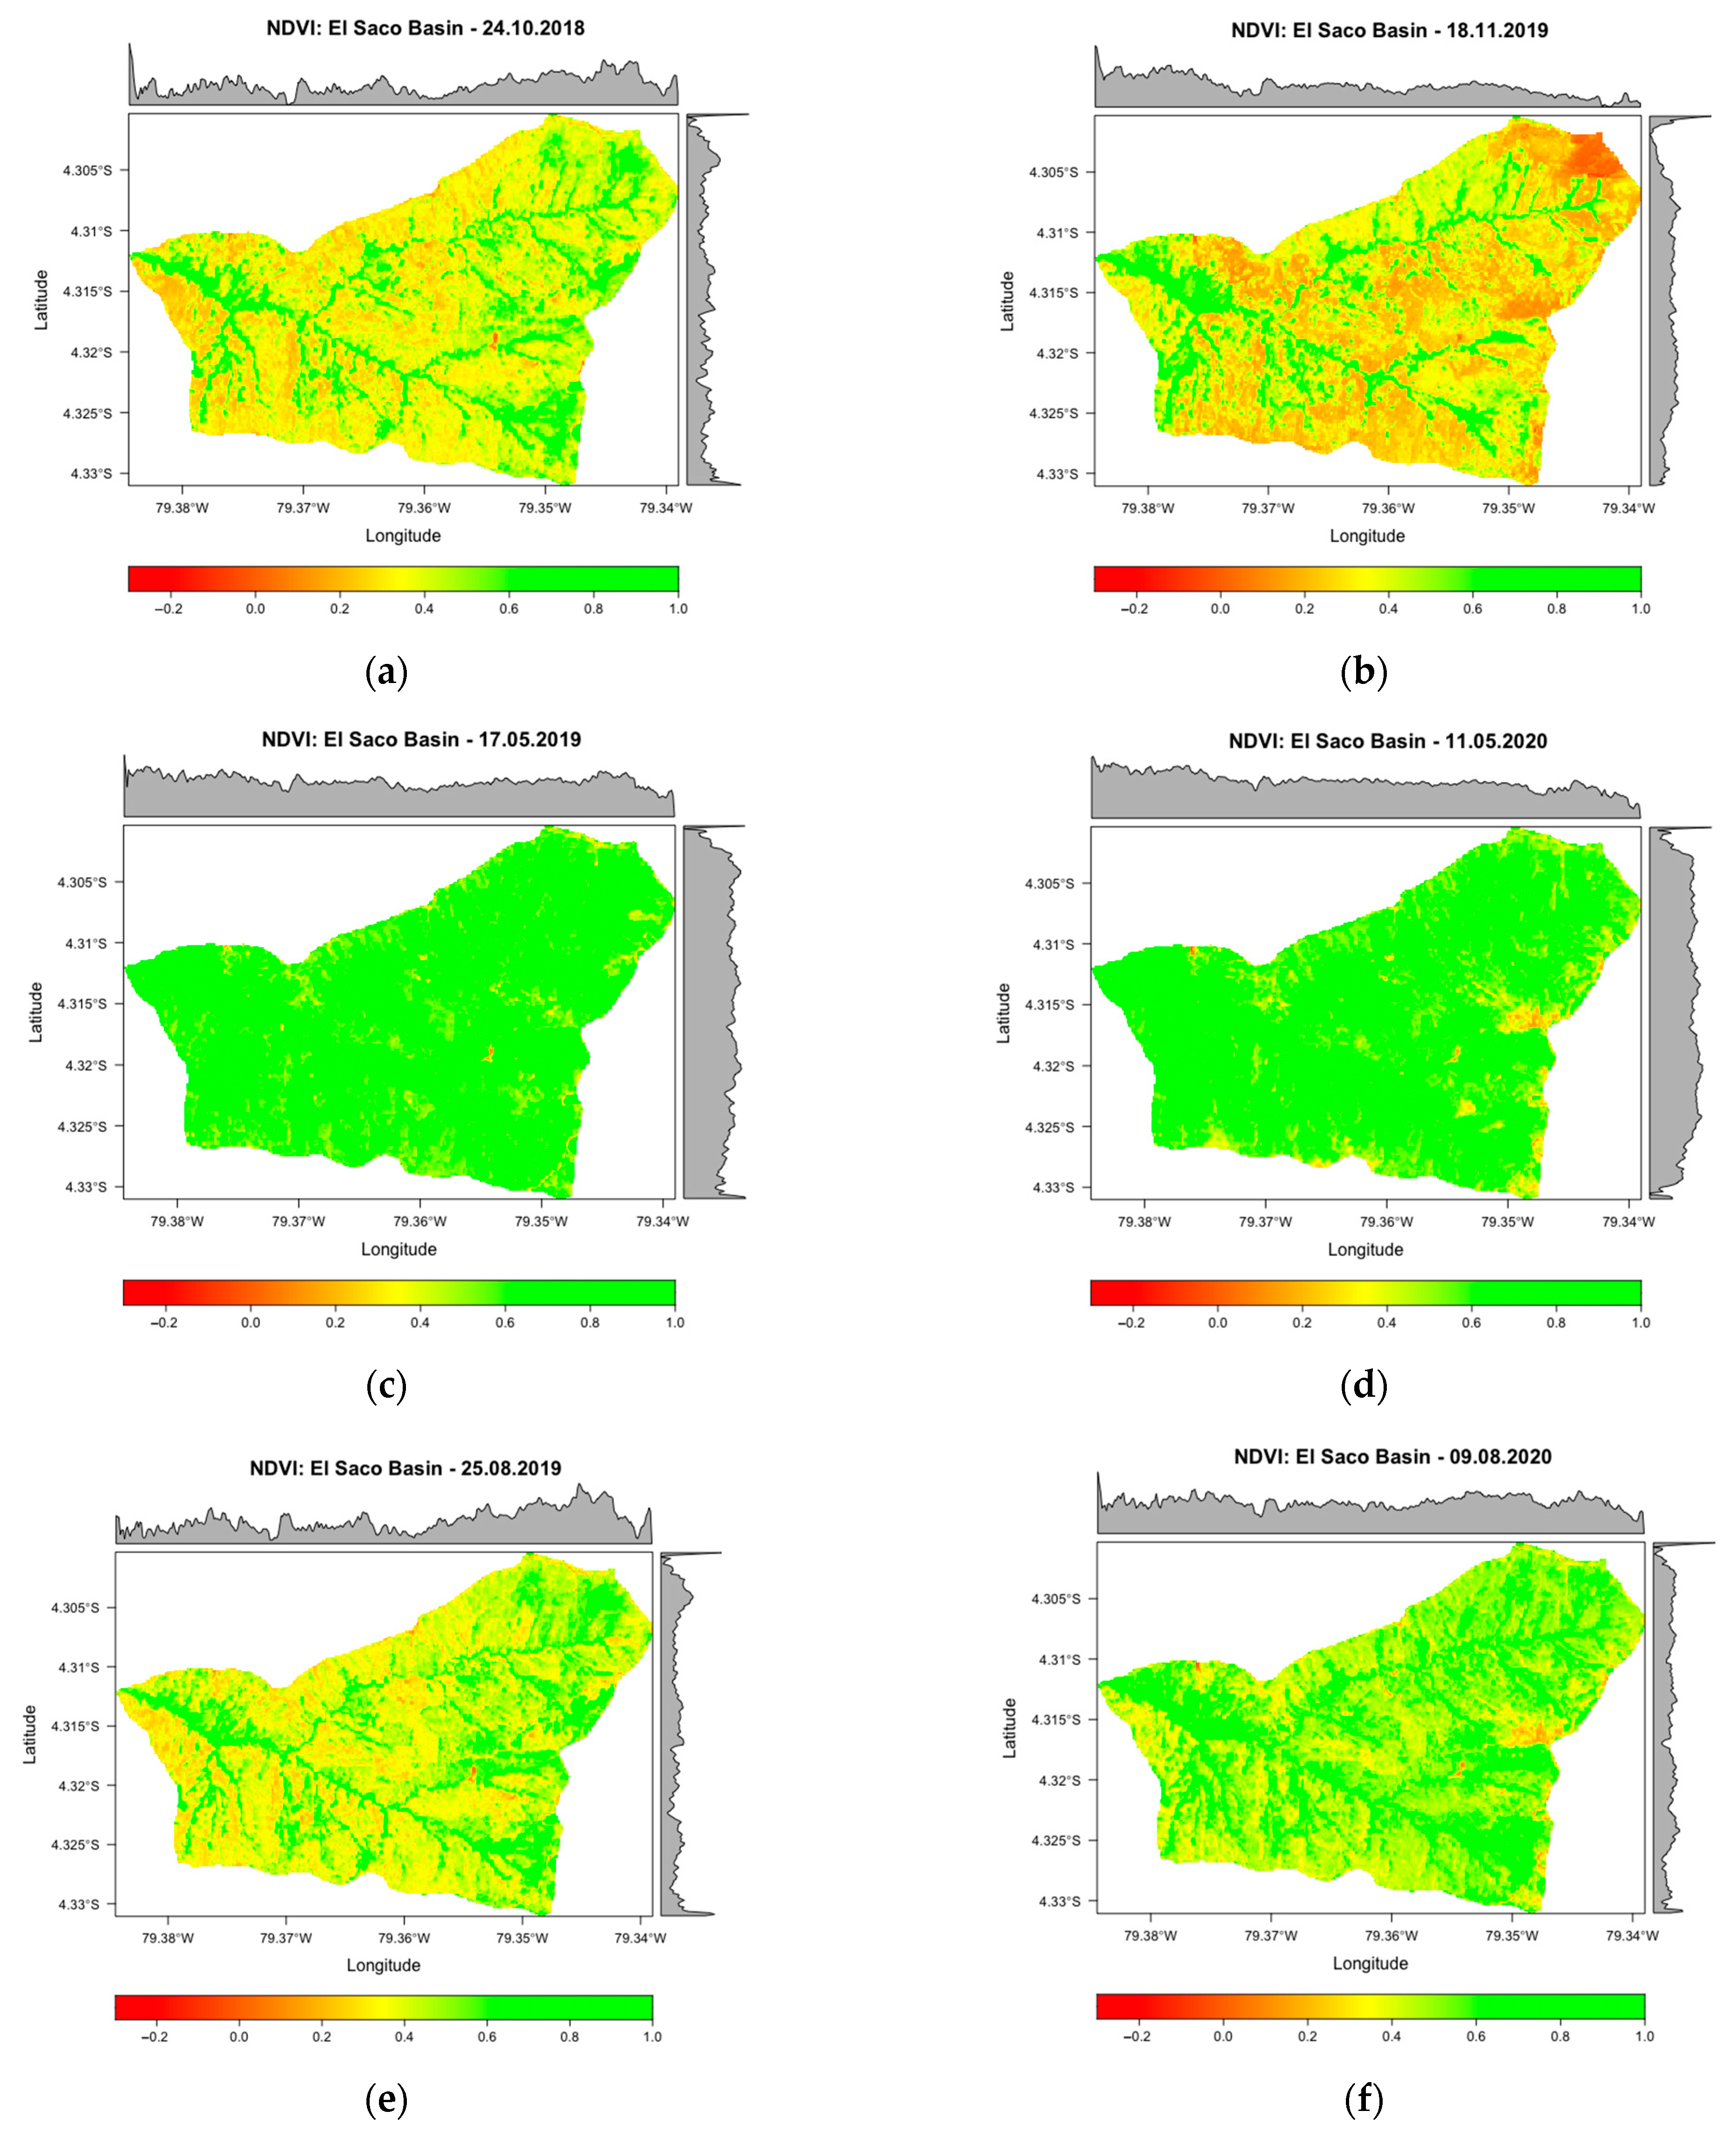
Statistical and Graphical Description of the NDVI Pairs in Pre- and Post-Fire Conditions at the Basin El Saco

| NDVI Values at El Saco Basin | ||||||||
|---|---|---|---|---|---|---|---|---|
| S2 Pair | NDVI—Date | Min | 1st Qu. | Median | Mean | 3rd Qu. | Max | St. Dev. |
| 1 | 24 October 2018 | 0.0239 | 0.3188 | 0.3880 | 0.4241 | 0.4961 | 0.9238 | 0.1453 |
| 2 | 17 May 2019 | 0.0758 | 0.6250 | 0.6931 | 0.6972 | 0.7740 | 0.9863 | 0.1048 |
| 3 | 25 August 2019 | 0.0344 | 0.3555 | 0.4271 | 0.4545 | 0.5296 | 0.9378 | 0.1336 |
| Fire Event | ||||||||
| 1 | 18 November 2019 | −0.0836 | 0.2404 | 0.3286 | 0.3670 | 0.4517 | 0.9216 | 0.1738 |
| 2 | 11 May 2020 | −0.0073 | 0.6014 | 0.6736 | 0.6651 | 0.7447 | 0.9174 | 0.1105 |
| 3 | 9 August 2020 | −0.0087 | 0.4570 | 0.5261 | 0.5393 | 0.6136 | 0.9521 | 0.1207 |
References
- Chen, Y.; Hall, J.; Van Wees, D.; Andela, N.; Hantson, S.; Giglio, L.; Van Der Werf, G.R.; Morton, D.C.; Randerson, J.T. Multi-Decadal Trends and Variability in Burned Area from the 5th Version of the Global Fire Emissions Database (GFED5). Earth Syst. Sci. Data Discuss. 2023, 15, 5227–5259. [Google Scholar] [CrossRef]
- UNDRR. Wildfires in Latin America. A Preliminary Analysis, Messages and Resources for RC/UNCT; UNDRR: Geneva, Switzerland, 2021. [Google Scholar]
- Van der Werf, G.R.; Randerson, J.T.; Collatz, G.J.; Giglio, L. Carbon Emissions from Fires in Tropical and Subtropical Ecosystems. Glob. Chang. Biol. 2003, 9, 547–562. [Google Scholar] [CrossRef]
- Rulli, M.C.; Offeddu, L.; Santini, M. Modeling Post-Fire Water Erosion Mitigation Strategies. Hydrol. Earth Syst. Sci. 2013, 17, 2323–2337. [Google Scholar] [CrossRef]
- FAO Regional Assessment of Soil Changes in Latin America and the Caribbean. In Status of the World’s Soil Resources; FAO: Rome, Italy, 2015; ISBN 9789251090046.
- Mastrolonardo, G.; Castelli, G.; Certini, G.; Maxwald, M.; Trucchi, P.; Foderi, C.; Errico, A.; Marra, E.; Preti, F. Post-Fire Erosion and Sediment Yield in a Mediterranean Forest Catchment in Italy. Int. J. Sediment. Res. 2024, 39, 464–477. [Google Scholar] [CrossRef]
- Borrelli, P.; Alewell, C.; Alvarez, P.; Anache, J.A.A.; Baartman, J.; Ballabio, C.; Bezak, N.; Biddoccu, M.; Cerdà, A.; Chalise, D.; et al. Soil Erosion Modelling: A Global Review and Statistical Analysis. Sci. Total Environ. 2021, 780, 146494. [Google Scholar] [CrossRef]
- Maxwald, M.; Crocetti, C.; Ferrari, R.; Petrone, A.; Rauch, H.P.; Preti, F. Soil and Water Bioengineering Applications in Central and South America: A Transferability Analysis. Sustainability 2020, 12, 10505. [Google Scholar] [CrossRef]
- Lammeranner, W.; Rauch, H.P.; Laaha, G. Implementation and Monitoring of Soil Bioengineering Measures at a Landslide in the Middle Mountains of Nepal. Plant Soil 2005, 278, 159–170. [Google Scholar] [CrossRef]
- Rey, F.; Burylo, M. Can Bioengineering Structures Made of Willow Cuttings Trap Sediment in Eroded Marly Gullies in a Mediterranean Mountainous Climate? Geomorphology 2014, 204, 564–572. [Google Scholar] [CrossRef]
- Kettenhuber Wolff, P.L.; dos Santos Sousa, R.; Dewes, J.J.; Rauch, H.P.; Sutili, F.J.; Hörbinger, S. Performance Assessment of a Soil and Water Bioengineering Work on the Basis of the Flora Development and Its Associated Ecosystem Processes. Ecol. Eng. 2023, 186, 106840. [Google Scholar] [CrossRef]
- Maxwald, M. Transferability Analysis as a Supporting Tool for the Uptake of Soil and Water Bioengineering Measures in Fire Prone Areas. Ph.D. Thesis, University of Florence, Florence, Italy, 2022. [Google Scholar]
- Carrión-Paladines, V.; Hinojosa, M.B.; Álvarez, L.J.; Reyes-Bueno, F.; Quezada, L.C.; García-Ruiz, R. Effects of the Severity of Wildfires on Some Physical-Chemical Soil Properties in a Humid Montane Scrublands Ecosystem in Southern Ecuador. Fire 2022, 5, 66. [Google Scholar] [CrossRef]
- Maxwald, M.; Immitzer, M.; Rauch, H.P.; Preti, F. Analyzing Fire Severity and Post-Fire Vegetation Recovery in the Temperate Andes Using Earth Observation Data. Fire 2022, 5, 211. [Google Scholar] [CrossRef]
- Wischmeier, W.H.; Smith, D.D. Predicting Rainfall Erosion Losses. A Guide to Conservation Planning, 537th ed.; U.S. Department of Agriculture: Charlottesville, VA, USA, 1978. [Google Scholar]
- De Girolamo, A.M.; Cerdan, O.; Grangeon, T.; Ricci, G.F.; Vandromme, R.; Lo Porto, A. Modelling Effects of Forest Fire and Post-Fire Management in a Catchment Prone to Erosion: Impacts on Sediment Yield. Catena 2022, 212, 106080. [Google Scholar] [CrossRef]
- Rulli, M.C.; Rosso, R. Hydrologic Response of Upland Catchments to Wildfires. Adv. Water Resour. 2007, 30, 2072–2086. [Google Scholar] [CrossRef]
- Borrelli, P.; Ballabio, C.; Yang, J.E.; Robinson, D.A.; Panagos, P. GloSEM: High-Resolution Global Estimates of Present and Future Soil Displacement in Croplands by Water Erosion. Sci. Data 2022, 9, 406. [Google Scholar] [CrossRef] [PubMed]
- Ochoa-Cueva, P.; Fries, A.; Montesinos, P.; Rodríguez-Díaz, J.A.; Boll, J. Spatial Estimation of Soil Erosion Risk by Land-Cover Change in the Andes OF Southern Ecuador. Land. Degrad. Dev. 2013, 26, 565–573. [Google Scholar] [CrossRef]
- Henry, A.; Mabit, L.; Jaramillo, R.E.; Cartagena, Y.; Lynch, J.P. Land Use Effects on Erosion and Carbon Storage of the Río Chimbo Watershed, Ecuador. Plant Soil 2013, 367, 477–491. [Google Scholar] [CrossRef]
- Casanova-Ruiz, G.; Delgado, D.; Panchana, R. Estimation of Sediment Volumes Due to Rainfall Erosion Using RUSLE Model in Basins of the Province of Manabí, Ecuador. Rev. De Teledetec. 2024, 2024, 1–21. [Google Scholar] [CrossRef]
- Morales Corozo, J.P. Microzonificación Urbana En Zonas Perifericas Degradadas Por Erosión En La Parroquia Lumbaqui, Ecuador. Rev. Científica Ecociencia 2022, 9, 77–91. [Google Scholar] [CrossRef]
- Ministry of Agriculture and Livestock of Ecuador (MAG); SERVIR-Amazonia; Alliance Bioversity-CIAT. Spatio-Temporal Monitoring of Soil Erosion for Ecuador. Available online: https://servirglobal.net/services/spatio-temporal-monitoring-soil-erosion-ecuador (accessed on 16 February 2024).
- Renard, K.G.; Foster, G.R.; Weesies, G.A.; Porterr, J.P. RUSLE: Revised Universal Soil Loss Equation. J. Soil. Water Conserv. 1991, 46, 30–33. [Google Scholar]
- Renard, K.G.; Foster, G.R.; Weesies, G.A.; McCool, D.K.; Yoder, D.C. Predicting Soil Erosion by Water: A Guide to Conservation Planning With the Revised Universal Soil Loss Equation (RUSLE); United States Department of Agriculture (USDA), Ed.; United States Department of Agriculture (USDA): Washington, DC, USA, 1997; Volume 703, ISBN 0-16-048938-5. [Google Scholar]
- Efthimiou, N.; Psomiadis, E.; Panagos, P. Fire Severity and Soil Erosion Susceptibility Mapping Using Multi-Temporal Earth Observation Data: The Case of Mati Fatal Wildfire in Eastern Attica, Greece. Catena 2020, 187, 104320. [Google Scholar] [CrossRef]
- Gallo, B.C.; Magalhães, P.S.G.; Demattê, J.A.M.; Cervi, W.R.; Carvalho, J.L.N.; Barbosa, L.C.; Bellinaso, H.; de Mello, D.C.; Veloso, G.V.; Alves, M.R.; et al. Soil Erosion Satellite-Based Estimation in Cropland for Soil Conservation. Remote Sens. 2023, 15, 20. [Google Scholar] [CrossRef]
- European Space Agency. European Union Copernicus Open Access Hub. Available online: https://scihub.copernicus.eu/twiki/do/view/SciHubWebPortal/TermsConditions (accessed on 30 September 2021).
- João, T.; João, G.; Bruno, M.; João, H. Indicator-Based Assessment of Post-Fire Recovery Dynamics Using Satellite NDVI Time-Series. Ecol. Indic. 2018, 89, 199–212. [Google Scholar] [CrossRef]
- Escuin, S.; Navarro, R.; Fernández, P. Fire Severity Assessment by Using NBR (Normalized Burn Ratio) and NDVI (Normalized Difference Vegetation Index) Derived from LANDSAT TM/ETM Images. Int. J. Remote Sens. 2008, 29, 1053–1073. [Google Scholar] [CrossRef]
- Romo Leon, J.R.; van Leeuwen, W.J.D.; Casady, G.M. Using MODIS-NDVI for the Modeling of Post-Wildfire Vegetation Response as a Function of Environmental Conditions and Pre-Fire Restoration Treatments. Remote Sens 2012, 4, 598–621. [Google Scholar] [CrossRef]
- Rauch, H.P.; von der Thannen, M.; Raymond, P.; Mira, E.; Evette, A. Ecological Challenges* for the Use of Soil and Water Bioengineering Techniques in River and Coastal Engineering Projects. Ecol. Eng. 2022, 176, 106539. [Google Scholar] [CrossRef]
- Stokes, A.; Sotir, R.; Chen, W.; Ghestem, M. Soil Bio- and Eco-Engineering in China: Past Experience and Future Priorities. Ecol. Eng. 2010, 36, 247–257. [Google Scholar] [CrossRef]
- Maxwald, M.; Rauch, H.P.; Correa, R. Übertragbarkeitsanalyse Für Die Implementierung Ingenieurbiologischer Maßnahmen in Feuergefährdeten Gebieten. Ingenieurbiologie 2023, 2, 24–34. [Google Scholar]
- Hörbinger, S.; Rauch, H.P.; Maxwald, M. Initiale Vegetationsentwicklung Auf Einer Waldbrandfläche in Hallstatt, Oberösterreich. Ingenieurbiologie 2023, 33, 39–46. [Google Scholar]
- Fernández, C.; Vega, J.A.; Vieira, D.C.S. Assessing Soil Erosion after Fire and Rehabilitation Treatments in NW Spain: Performance of Rusle and Revised Morgan-Morgan-Finney Models. Land. Degrad. Dev. 2010, 21, 58–67. [Google Scholar] [CrossRef]
- Girona-García, A.; Vieira, D.C.S.; Silva, J.; Fernández, C.; Robichaud, P.R.; Keizer, J.J. Effectiveness of Post-Fire Soil Erosion Mitigation Treatments: A Systematic Review and Meta-Analysis. Earth Sci. Rev. 2021, 217, 103611. [Google Scholar] [CrossRef]
- Robichaud, P.R.; Pierson, F.B.; Brown, R.E.; Wagenbrenner, J.W. Measuring Effectiveness of Three Postfire Hillslope Erosion Barrier Treatments, Western Montana, USA. Hydrol. Process 2008, 22, 159–170. [Google Scholar] [CrossRef]
- Gobierno Autónomo Descentralizado del Canton. Quilanga Plan de Ordenamiento Territorial Del Cantón Quilanga, Tema: Precipitación. 2014. [Google Scholar]
- Alcaldia Del Cantón Quilanga Incendio Forestal En Quilanga. Available online: https://www.facebook.com/fredy.cuevarojas.1/videos/145016750072990/ (accessed on 17 October 2021).
- Almagro, A.; Thomé, T.C.; Colman, C.B.; Pereira, R.B.; Marcato Junior, J.; Rodrigues, D.B.B.; Oliveira, P.T.S. Improving Cover and Management Factor (C-Factor) Estimation Using Remote Sensing Approaches for Tropical Regions. Int. Soil. Water Conserv. Res. 2019, 7, 325–334. [Google Scholar] [CrossRef]
- Lanorte, A.; Cillis, G.; Calamita, G.; Nolè, G.; Pilogallo, A.; Tucci, B.; De Santis, F. Integrated Approach of RUSLE, GIS and ESA Sentinel-2 Satellite Data for Post-Fire Soil Erosion Assessment in Basilicata Region (Southern Italy). Geomat. Nat. Hazards Risk 2019, 10, 1563–1595. [Google Scholar] [CrossRef]
- Schuerz, C.; Herrnegger, M. Input Data Generation for the RUSLE. In Soil Erosion Risk Modelling with R; Austrian Development Cooperation: Vienna, Austria, 2019. [Google Scholar]
- Alberto, J.; Bustamante, C.; Eitzinger, A. Assessment of Water Erosion Risk in the Subwatershed Alamor, River Catamayo-Chira, Ecuador. Master’s Thesis, University of Salzburg, Salzburg, Austria, January 2020. [Google Scholar]
- QGIS Project QGIS Documentation. 28.1.6. Interpolation. Available online: https://docs.qgis.org/3.34/en/docs/user_manual/processing_algs/qgis/interpolation.html (accessed on 12 September 2024).
- Papuga, K.; Kaszubkiewicz, J.; Wilczewski, W.; Stas, M.; Belowski, J.; Kawałko, D. Soil Grain Size Analysis by the Dynamometer Method-A Comparison to the Pipette and Hydrometer Method. Soil. Sci. Annu. 2018, 69, 17–27. [Google Scholar] [CrossRef]
- Batjes, N.H.; Ribeiro, E.; van Oostrum, A. Standardised Soil Profile Data to Support Global Mapping and Modelling (WoSIS Snapshot 2019). Earth Syst. Sci. Data 2020, 12, 299–320. [Google Scholar] [CrossRef]
- Williams, J.R. The EPIC Model-Soil Erosion. In Computer Models of Watershed Hydrology; Singh, V.P., Ed.; Water Resources Publications: Highlands Ranch, CO, USA, 1995; pp. 909–1000. [Google Scholar]
- Souris, M. Marc Souris Directeur de Recherche, IRD. Available online: http://www.savgis.org/ecuador.htm (accessed on 12 December 2022).
- Desmet, P.J.J.; Govers, G. A GIS Procedure for Automatically Calculating the USLE LS Factor on Topographically Complex Landscape Units Carbon Cycling in Soils Subject to Sediment Deposition View Project Accurately Simulating Transient Landscape Evolution View Project. J. Soil Water Conserv. 1996, 51, 427–433. [Google Scholar]
- Borrelli, P.; Robinson, D.A.; Fleischer, L.R.; Lugato, E.; Ballabio, C.; Alewell, C.; Meusburger, K.; Modugno, S.; Schütt, B.; Ferro, V.; et al. An Assessment of the Global Impact of 21st Century Land Use Change on Soil Erosion. Nat. Commun. 2017, 8, 2013. [Google Scholar] [CrossRef]
- Monfreda, C.; Ramankutty, N.; Foley, J.A. Farming the Planet: 2. Geographic Distribution of Crop Areas, Yields, Physiological Types, and Net Primary Production in the Year 2000. Glob. Biogeochem. Cycles 2008, 22, GB1022. [Google Scholar] [CrossRef]
- Bontemps, S.; Boettcher, M.; Brockmann, C.; Kirches, G.; Lamarche, C.; Radoux, J.; Santoro, M.; Van Bogaert, E.; Wegmüller, U.; Herold, M.; et al. Multi-Year Global Land Cover Mapping at 300 M and Characterization for Climate Modelling: Achievements of the Land Cover Component of the ESA Climate Change Initiative. In Proceedings of the International Archives of the Photogrammetry, Remote Sensing and Spatial Information Sciences-ISPRS Archives; International Society for Photogrammetry and Remote Sensing, Berlin, Germany, 11–15 May 2015; Volume 40, pp. 323–328. [Google Scholar]
- van der Knijff, J.M.; Jones, R.J.A.; Montanarella, L. Soil Erosion Risk Assessment in Europe; European Commission: Brussels, Belgium, 2000. [Google Scholar]
- Durigon, V.L.; Carvalho, D.F.; Antunes, M.A.H.; Oliveira, P.T.S.; Fernandes, M.M. NDVI Time Series for Monitoring RUSLE Cover Management Factor in a Tropical Watershed. Int. J. Remote Sens. 2014, 35, 441–453. [Google Scholar] [CrossRef]
- Alvarez, P.; Moreno Romero, G.; Quinde, J.D.; Palacios, L. Distribución Espacial de Erosión Hídrica En El Cantón Macará, Provincia de Loja, Utilizando El Modelo RUSLE y SIG. In Restauración del Paisaje en Latinoamérica: Experiencias y Perspectivas Futuras; Universidad Nacional de Loja, CONDESAN: Loja, Ecuador, 2017; pp. 128–143. [Google Scholar]
- RUS Copernicus Burned Area Mapping with Sentinel-2 Using SNAP. Available online: https://rus-copernicus.eu/portal/wp-content/uploads/library/education/training/HAZA02_BurnedArea_Portugal_Tutorial.pdf (accessed on 7 December 2022).
- Azli, A.D.; Yong, Y. Estimation of Soil Volumetric Erosion Using GPS and Unmanned Aerial Vehicle: Case Study at Persiaran Satelit. J. Adv. Geospat. Sci. Technol. 2022, 2, 27–41. [Google Scholar]


| S2 Pair | S2 Satellite | Date | Sun Zenith Angle | Sun Azimuth Angle |
|---|---|---|---|---|
| 1 | B | 24 October 2018 | 20.85 | 113.03 |
| 2 | A | 17 May 2019 | 32.33 | 42.67 |
| 3 | A | 25 August 2019 | 28.14 | 58.03 |
| Fire Event | ||||
| 1 | B | 18 November 2019 | 24.54 | 129.68 |
| 2 | A | 11 May 2020 | 31.46 | 44.37 |
| 3 | A | 9 August 2020 | 31.50 | 50.73 |
| C-Factor Values at El Saco Basin | ||||||||
|---|---|---|---|---|---|---|---|---|
| S2 Pair | C—Date | Min | 1st Qu. | Median | Mean | 3rd Qu. | Max | St. Dev. |
| 1 | 24 October 2018 | 0.0038 | 0.0252 | 0.0306 | 0.0288 | 0.0341 | 0.0488 | 0.0073 |
| 2 | 17 May 2019 | 0.0007 | 0.0113 | 0.0153 | 0.0151 | 0.0187 | 0.0462 | 0.0052 |
| 3 | 25 August 2019 | 0.0031 | 0.0235 | 0.0286 | 0.0278 | 0.0322 | 0.0483 | 0.0067 |
| Fire Event | ||||||||
| 1 | 18 November 2019 | 0.0039 | 0.0274 | 0.0336 | 0.0317 | 0.0380 | 0.0542 | 0.0087 |
| 2 | 11 May 2020 | 0.0041 | 0.0128 | 0.0163 | 0.0167 | 0.0199 | 0.0504 | 0.0055 |
| 3 | 9 August 2020 | 0.0024 | 0.0193 | 0.0237 | 0.0230 | 0.0271 | 0.0504 | 0.0060 |
| Calculated Erosion [A in t ha−1 yr−1] Using C-Factors from Different S2 Dates | |||||||||
|---|---|---|---|---|---|---|---|---|---|
| S2 Pair | C-Date | Min | 1st Qu. | Median | Mean | 3rd Qu. | Max | St. Dev. | |
| Pre-fire | 1 | 24 October 2018 | 0.62 | 3.94 | 4.78 | 4.94 | 5.69 | 24.21 | 1.79 |
| 2 | 17 May 2019 | 0.09 | 1.91 | 2.48 | 2.58 | 3.08 | 23.83 | 1.08 | |
| 3 | 25 August 2019 | 0.55 | 3.72 | 4.50 | 4.71 | 5.39 | 23.93 | 1.78 | |
| 4 | multi-temp—mean C | 0.61 | 3.24 | 3.94 | 4.08 | 4.68 | 21.49 | 1.48 | |
| Fire Event | |||||||||
| Post-fire | 1 | 18 November 2019 | 0.61 | 4.24 | 5.24 | 5.39 | 6.34 | 26.18 | 1.91 |
| 2 | 11 May 2020 | 0.61 | 2.14 | 2.69 | 2.84 | 3.34 | 23.64 | 1.08 | |
| 3 | 9 August 2020 | 0.39 | 3.11 | 3.79 | 3.94 | 4.54 | 24.48 | 1.43 | |
| 4 | multi-temp—mean C | 0.61 | 3.28 | 3.94 | 4.06 | 4.66 | 23.40 | 1.34 | |
| S2 Pair | Date | Mean Delta [t ha−1 yr−1] | Post-Fire Change [%] |
|---|---|---|---|
| 1 | 24 October 2018–18 November 2019 | 0.45 | 9.14 |
| 2 | 17 May 2019–11 May 2020 | 0.27 | 10.32 |
| 3 | 25 August 2019–9 August 2020 | −0.77 | −16.26 |
| 4 | Post-fire mean C–Pre-fire mean C | −0.02 | −0.44 |
Disclaimer/Publisher’s Note: The statements, opinions and data contained in all publications are solely those of the individual author(s) and contributor(s) and not of MDPI and/or the editor(s). MDPI and/or the editor(s) disclaim responsibility for any injury to people or property resulting from any ideas, methods, instructions or products referred to in the content. |
© 2024 by the authors. Licensee MDPI, Basel, Switzerland. This article is an open access article distributed under the terms and conditions of the Creative Commons Attribution (CC BY) license (https://creativecommons.org/licenses/by/4.0/).
Share and Cite
Maxwald, M.; Correa, R.; Japón, E.; Preti, F.; Rauch, H.P.; Immitzer, M. Soil and Water Bioengineering in Fire-Prone Lands: Detecting Erosive Areas Using RUSLE and Remote Sensing Methods. Fire 2024, 7, 319. https://doi.org/10.3390/fire7090319
Maxwald M, Correa R, Japón E, Preti F, Rauch HP, Immitzer M. Soil and Water Bioengineering in Fire-Prone Lands: Detecting Erosive Areas Using RUSLE and Remote Sensing Methods. Fire. 2024; 7(9):319. https://doi.org/10.3390/fire7090319
Chicago/Turabian StyleMaxwald, Melanie, Ronald Correa, Edwin Japón, Federico Preti, Hans Peter Rauch, and Markus Immitzer. 2024. "Soil and Water Bioengineering in Fire-Prone Lands: Detecting Erosive Areas Using RUSLE and Remote Sensing Methods" Fire 7, no. 9: 319. https://doi.org/10.3390/fire7090319