
Numerical Study on the Effect of Tunnel Slope on Smoke Exhaust Performance in Metro Tunnels

Abstract
:1. Introduction
2. Numerical Simulation
2.1. Introduction of Software
2.2. Physical Model
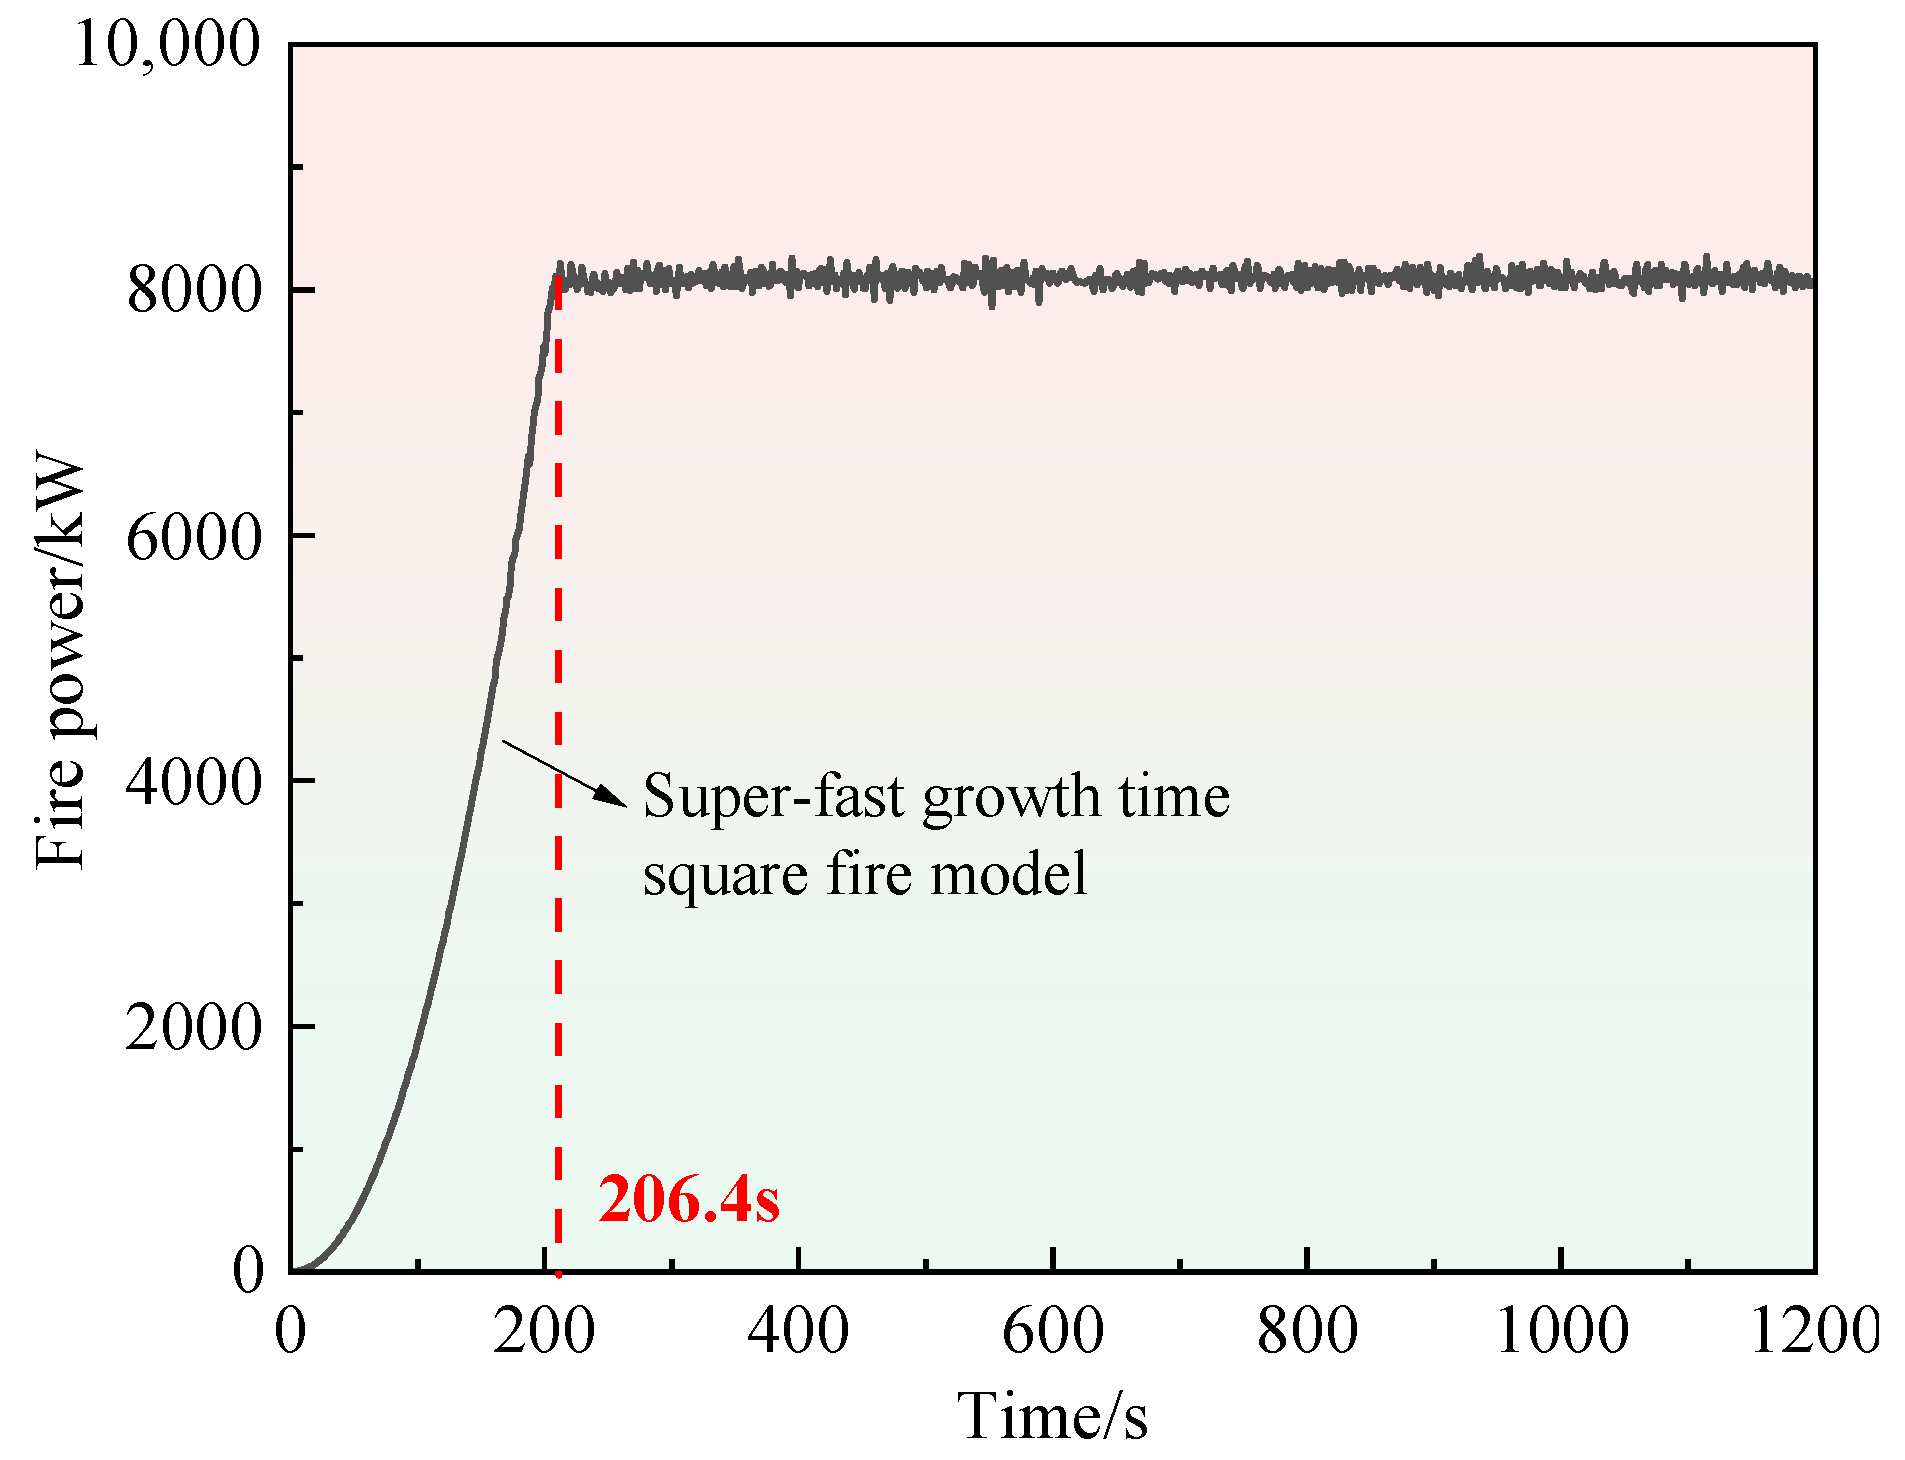
2.3. Fire Scenario
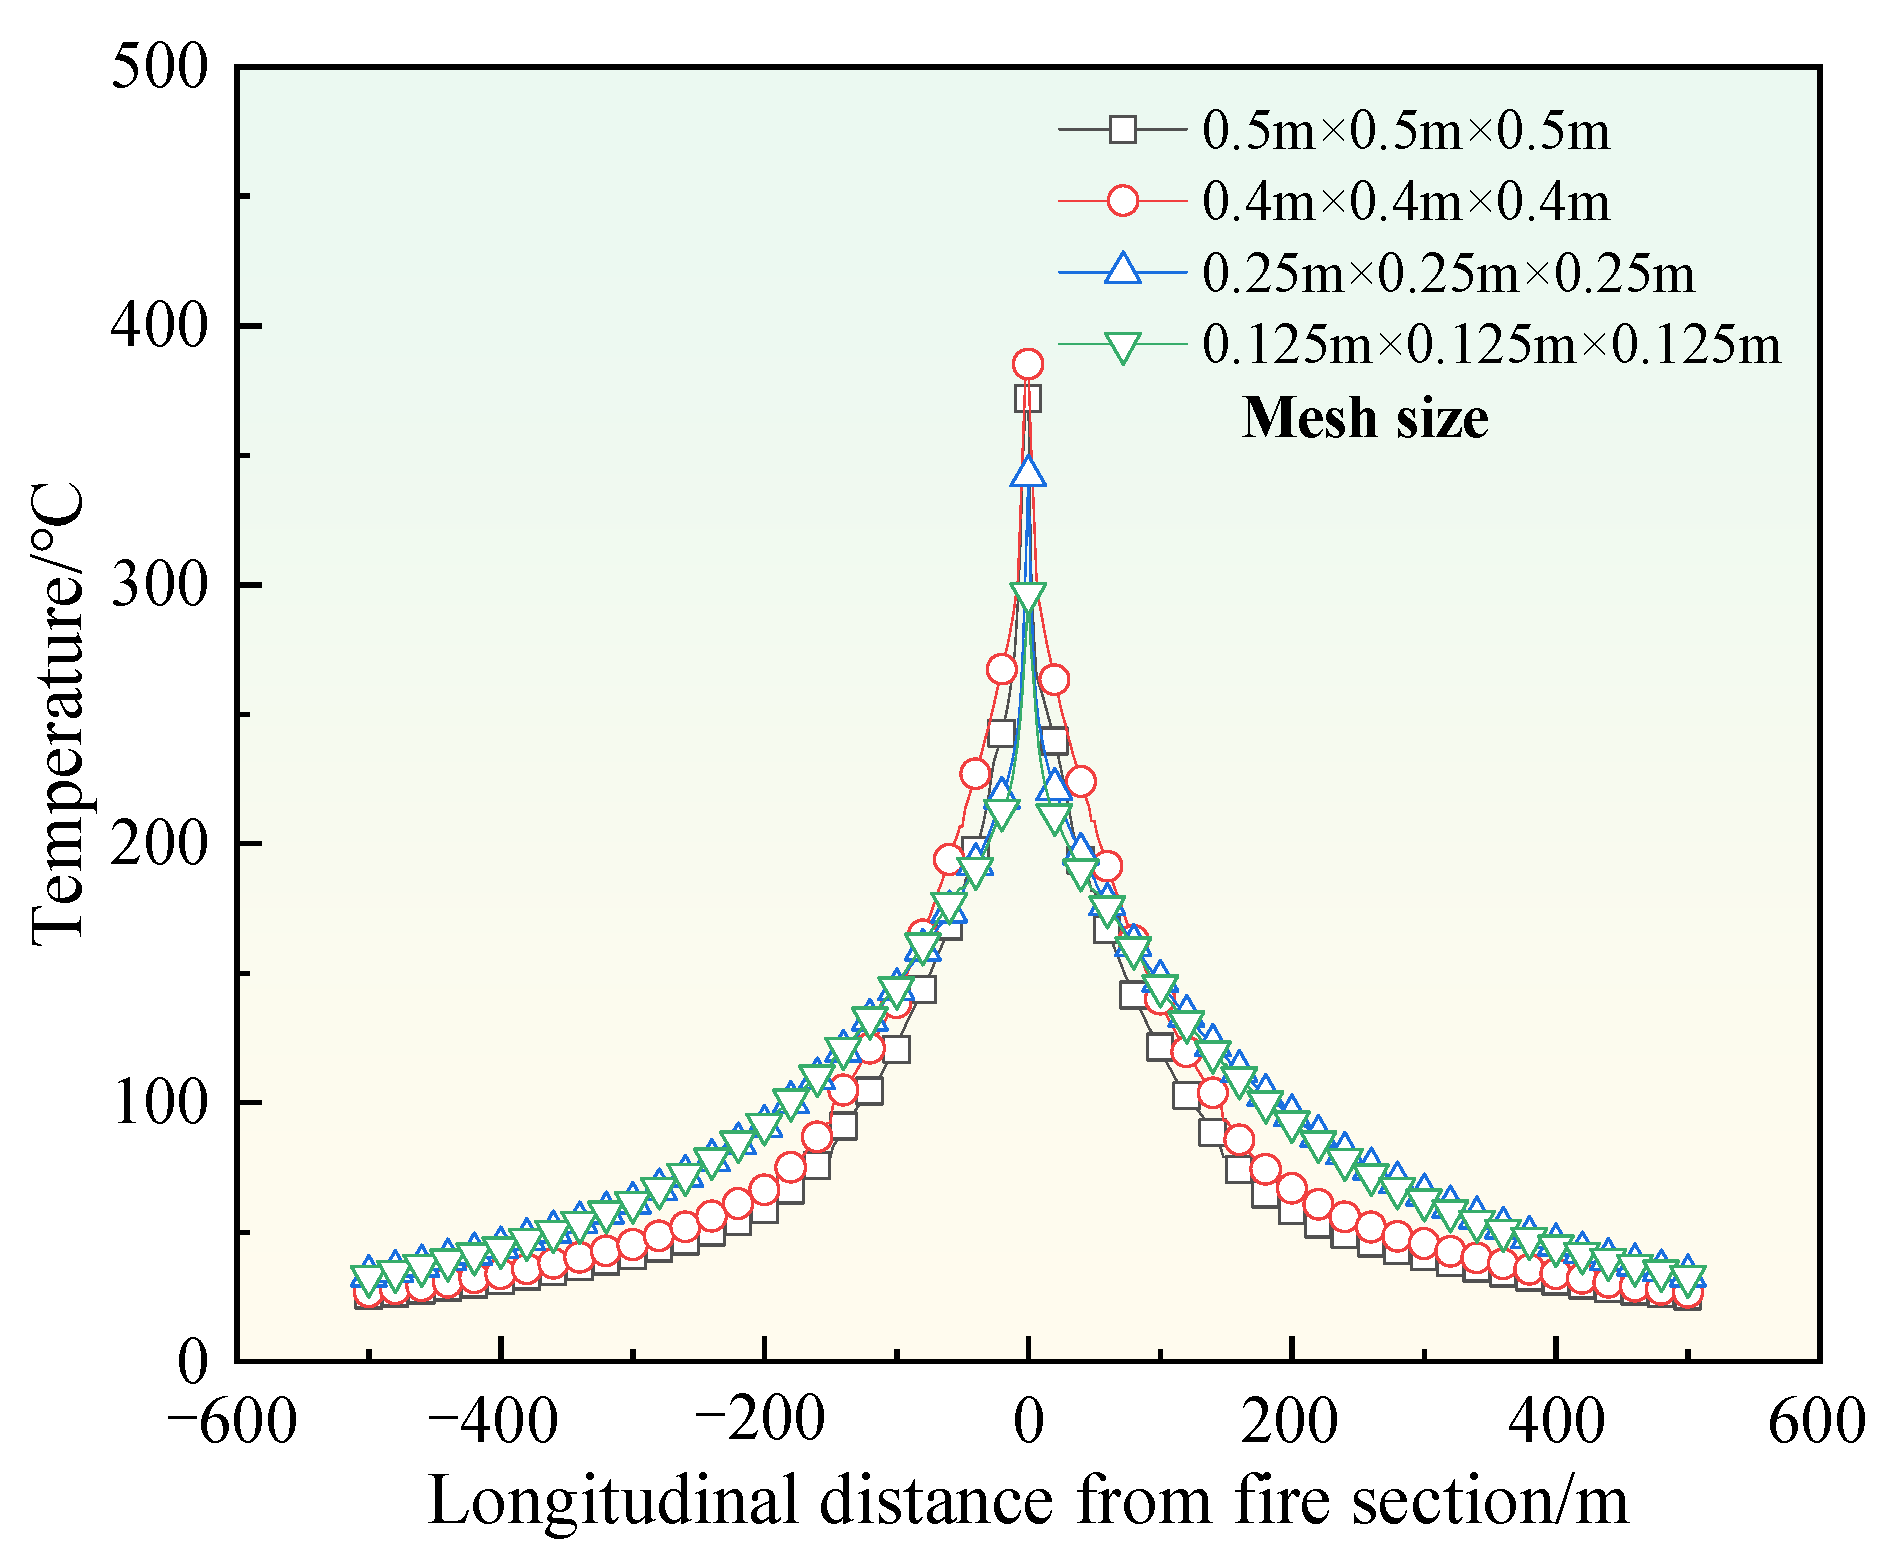
2.4. Mesh Refinement and Boundary Conditions
3. Analysis and Discussion
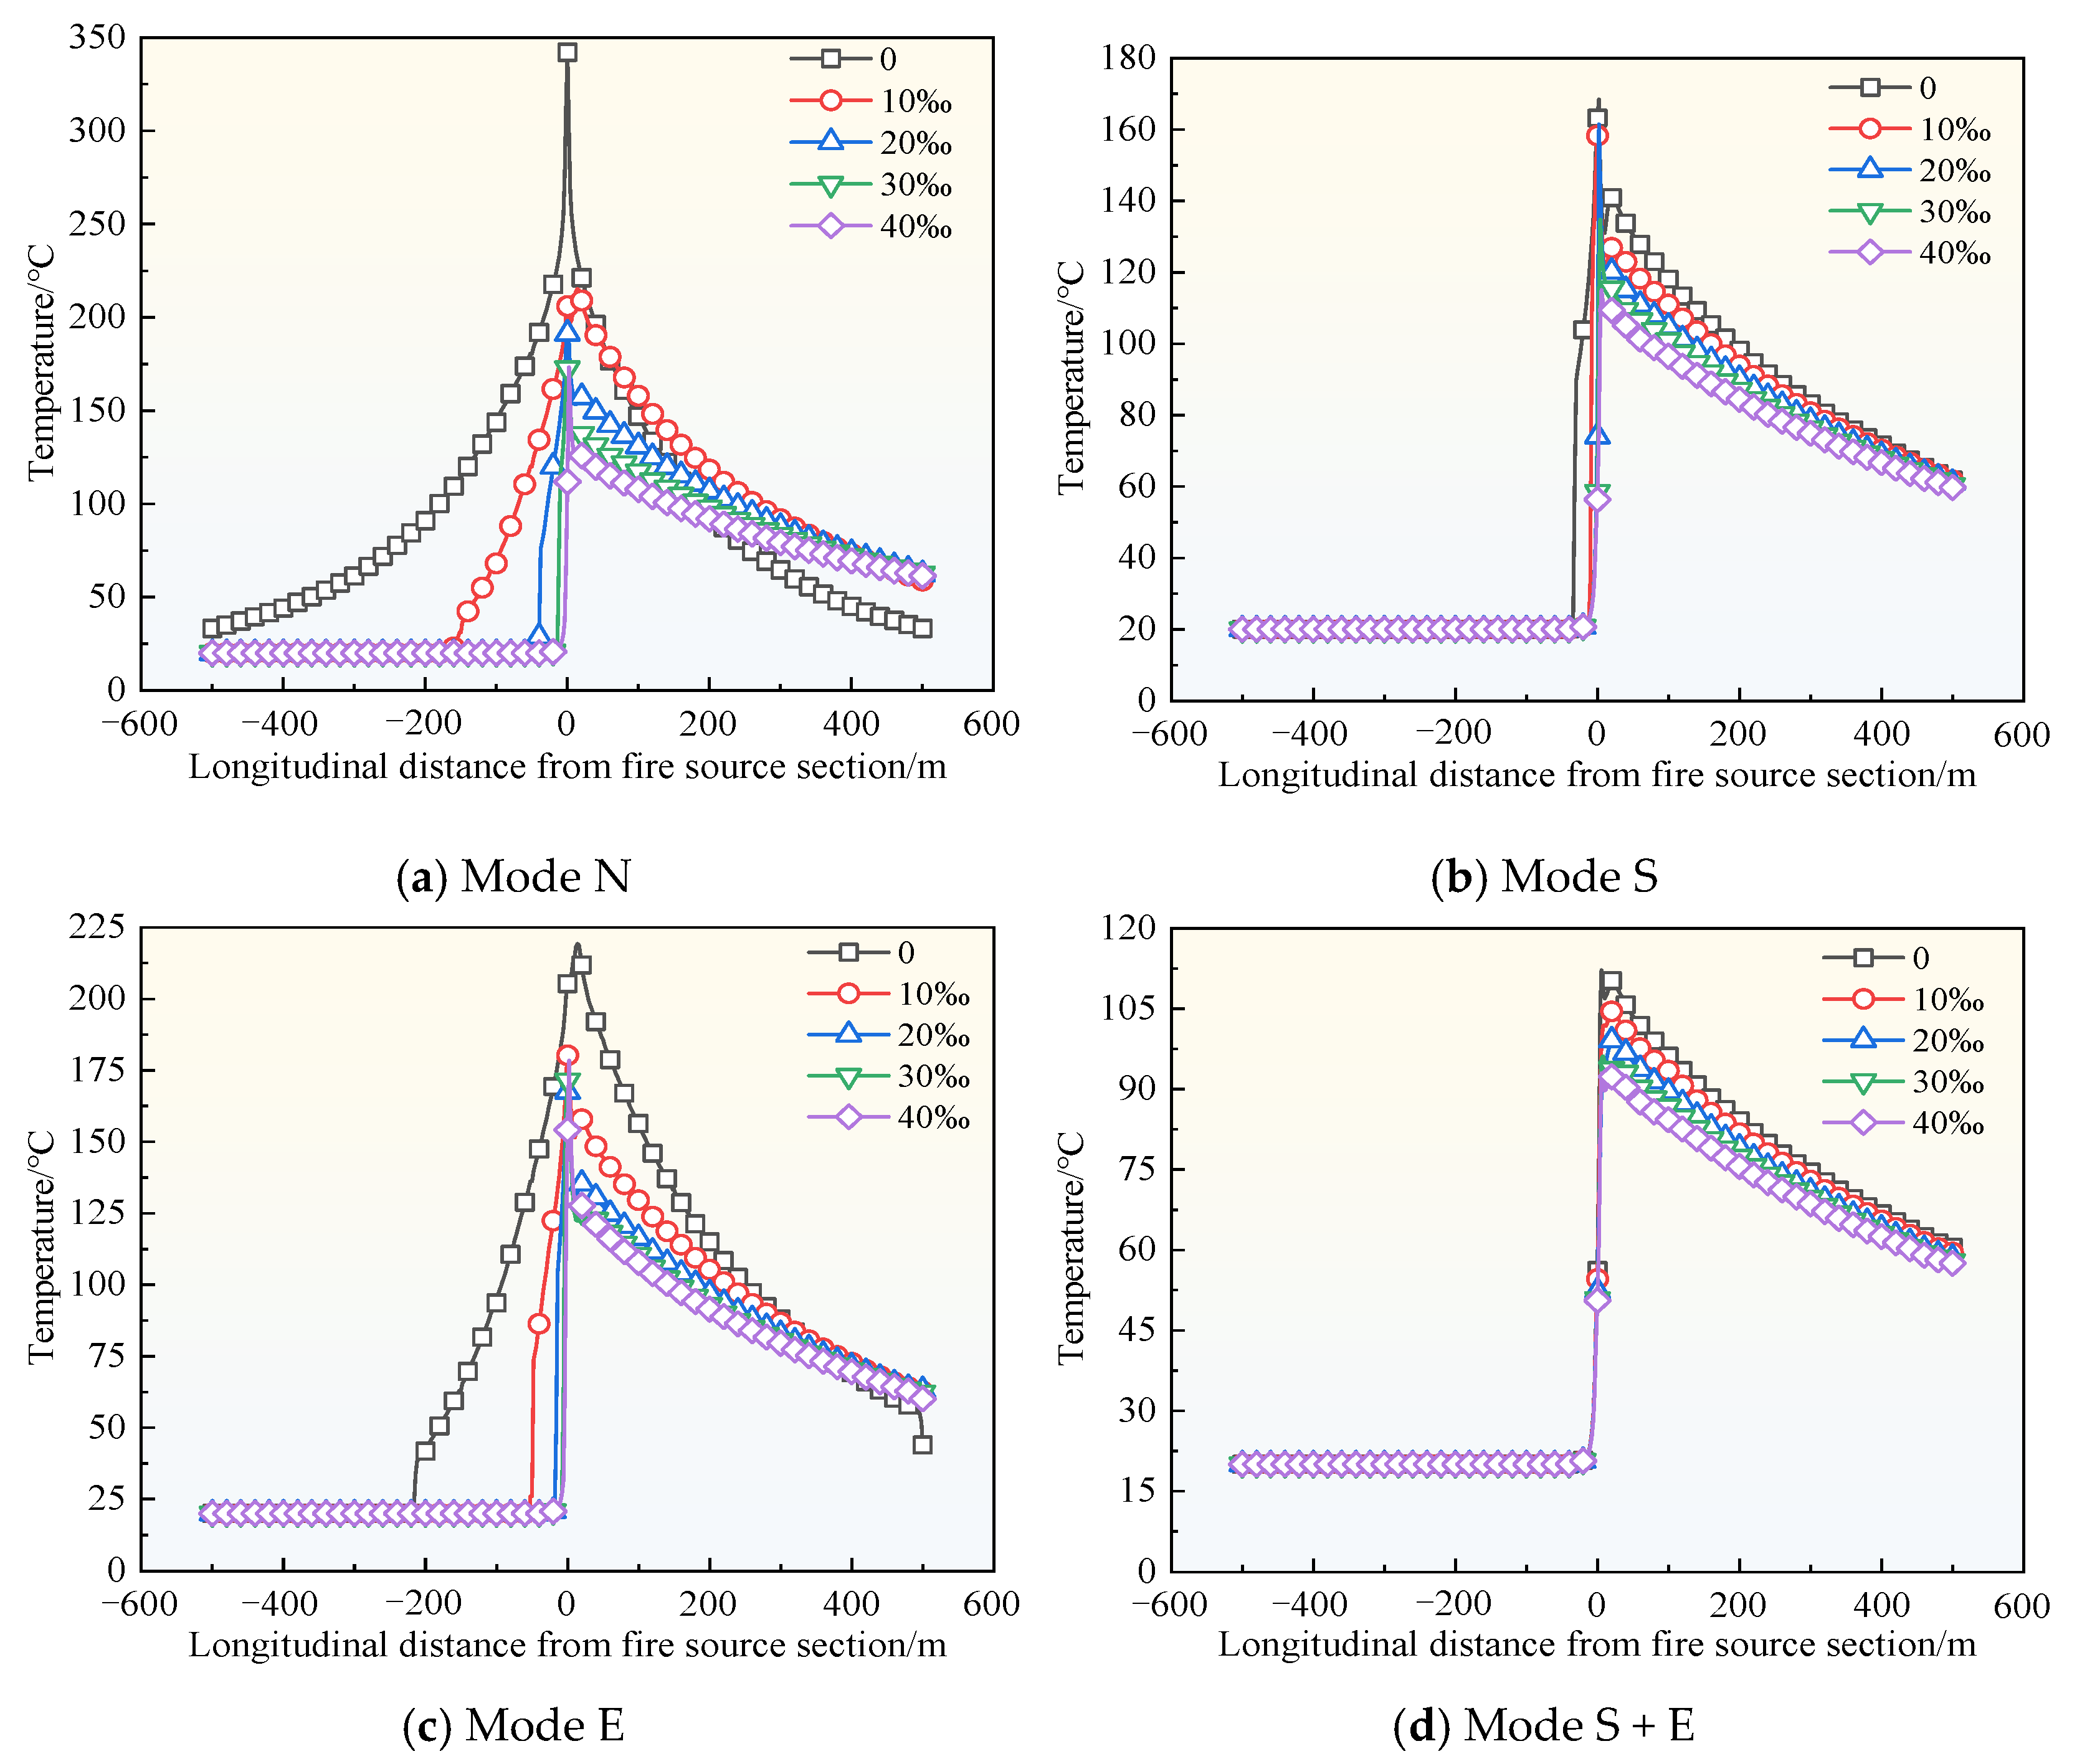
3.1. Longitudinal Distribution of Tunnel Ceiling Temperature
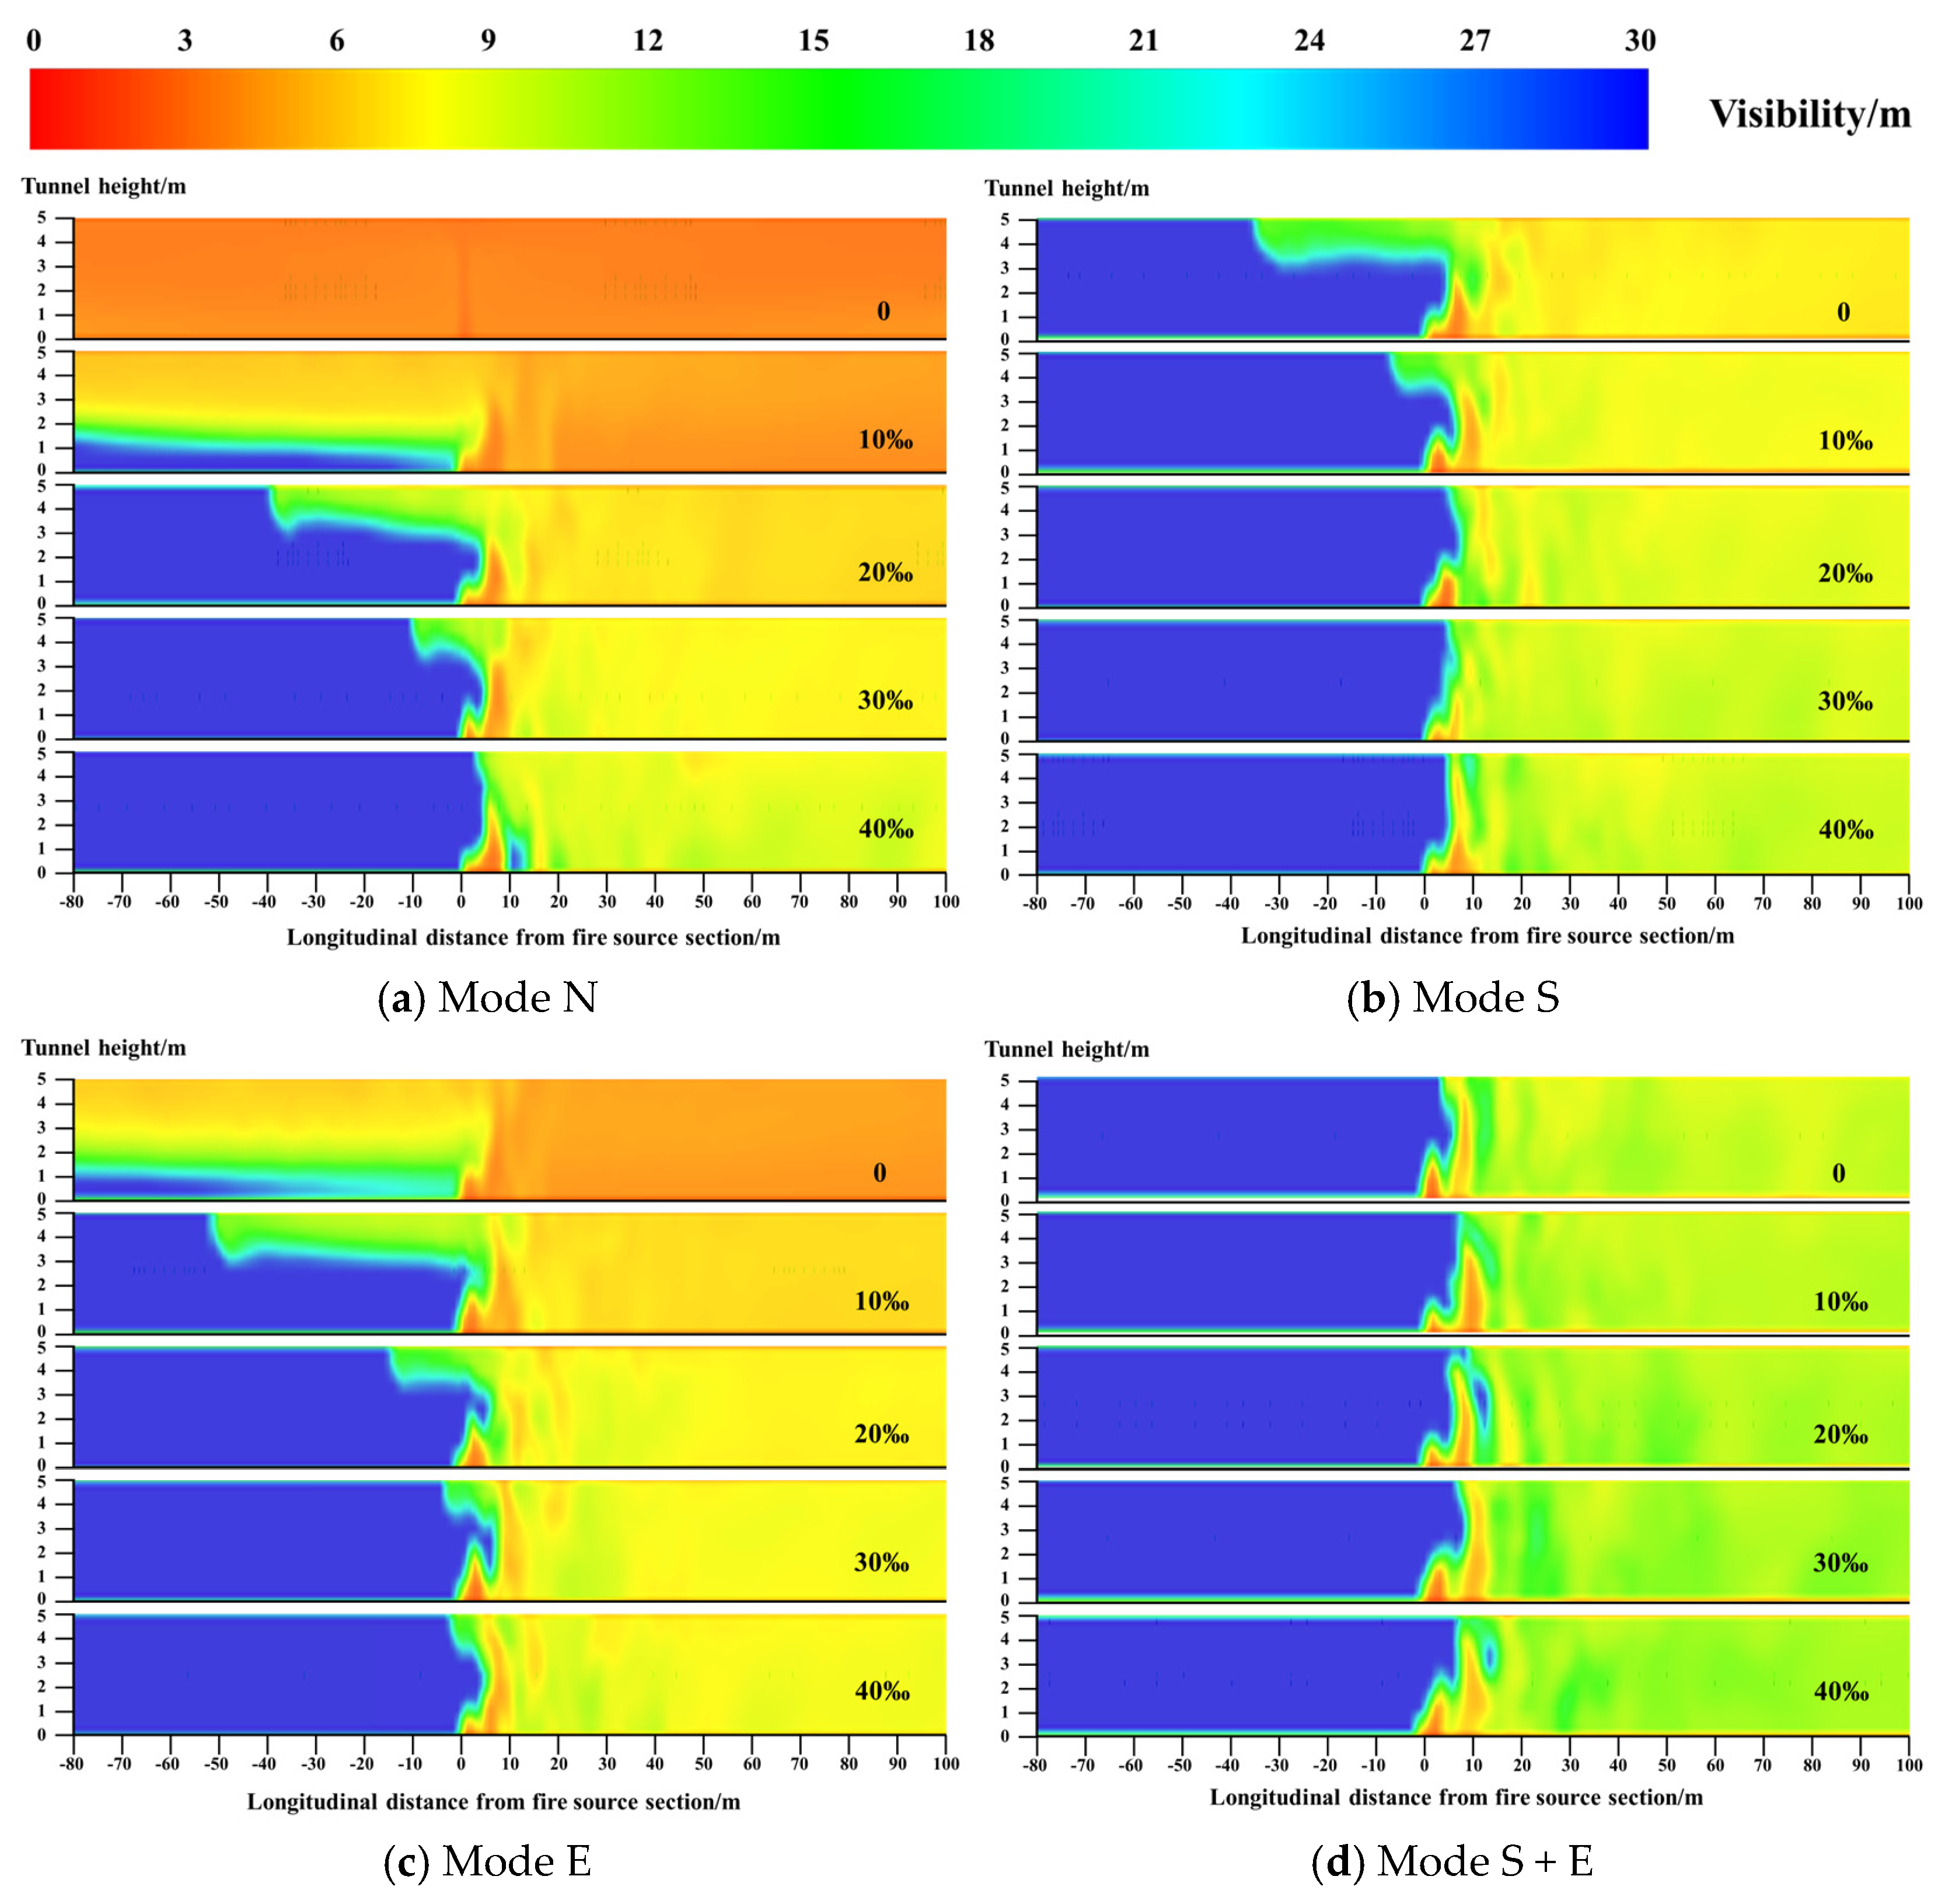
3.2. Visibility Distribution
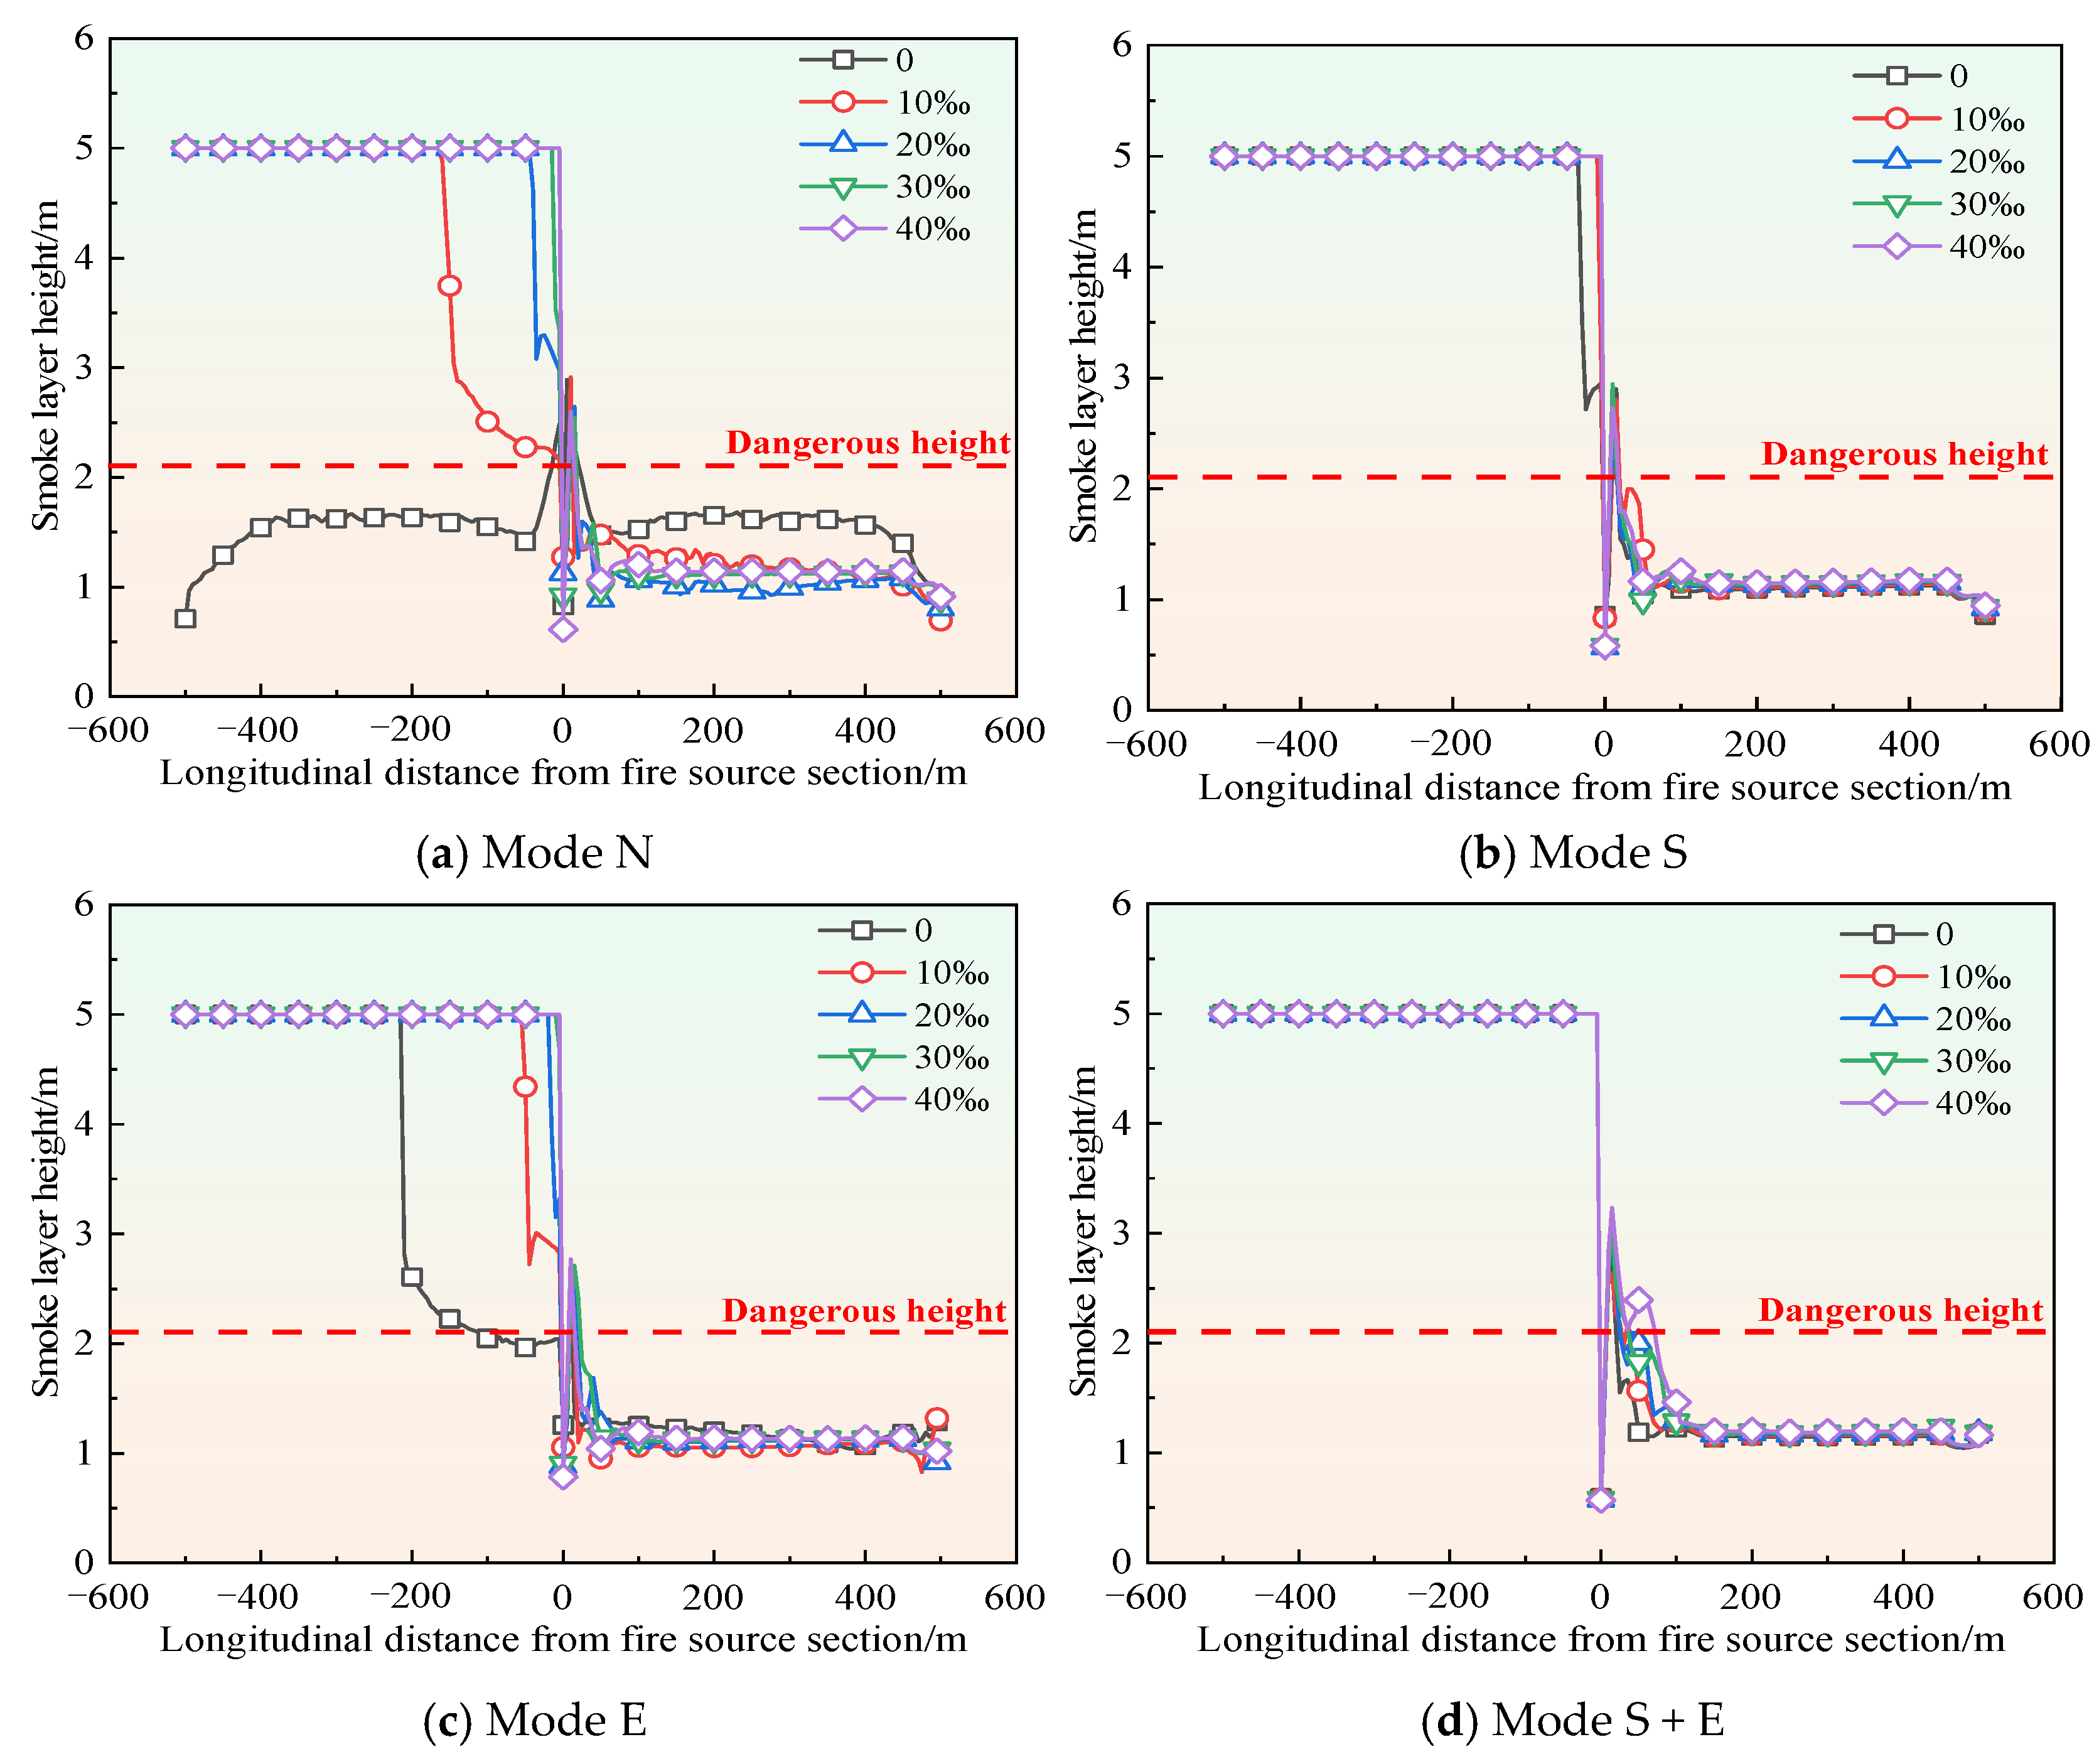
3.3. Smoke Layer Height
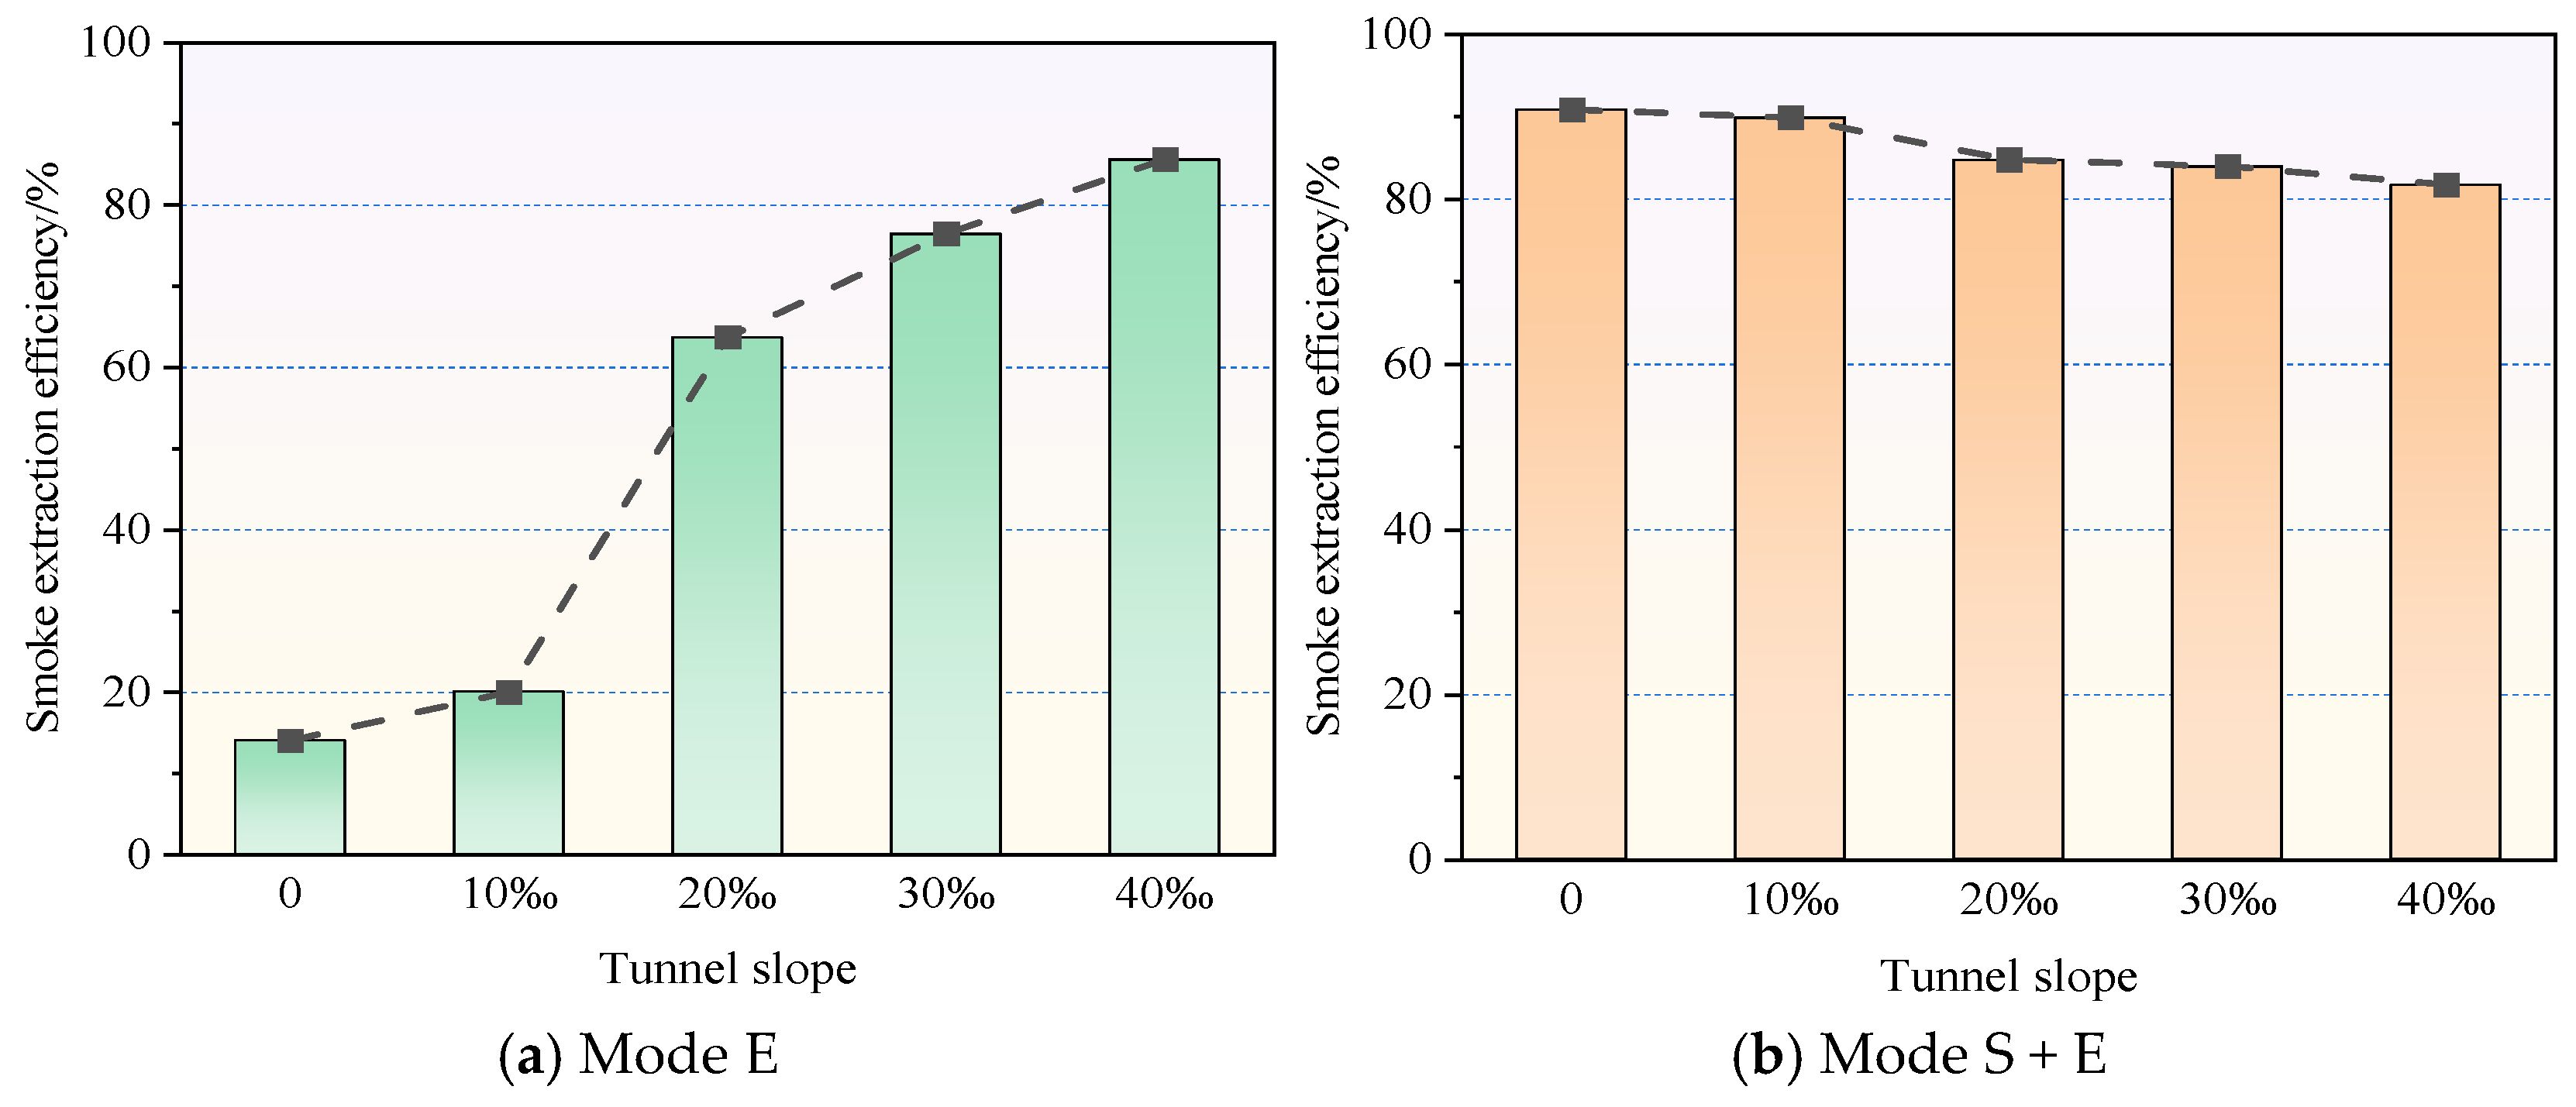
3.4. Smoke Exhaust Efficiency
4. Conclusions
Author Contributions
Funding
Institutional Review Board Statement
Informed Consent Statement
Data Availability Statement
Acknowledgments
Conflicts of Interest
References
- Hu, J.; Yang, M.; Zhen, Y. A review of resilience assessment and recovery strategies of urban rail transit networks. Sustainability 2024, 16, 6390. [Google Scholar] [CrossRef]
- Han, B.M.; Yu, Y.R.; Xi, Z.; Sun, Y.J.; Lu, F.; Li, S.W.; Li, Z.Y.; Huang, S.Q.; Hu, J.F.; Sang, Y.L.; et al. Statistical analysis of urban rail transit operations worldwide in 2023: A review. Urban Rapid Rail Transit 2024, 37, 1–9. [Google Scholar]
- China Railway First Survey and Design Institute Group Co., Ltd. Feasibility Study Report of Urumqi Rail Transit Line 1 Project (Santunbei-Airport)—Special Report on the Safety of Single-Side Slope; China Railway First Survey Design Institute Group Co., Ltd.: Xi’an, China, 2013. [Google Scholar]
- Yang, Y.; Liu, C.; Long, Z.; Qiu, P.; Chen, J.; Zhong, M. Full-scale experimental study on fire under vehicle operations in a sloped tunnel. Int. J. Therm. Sci. 2020, 158, 106524. [Google Scholar] [CrossRef]
- Yang, Y.; Long, Z.; Cheng, H.; Chen, J.; Liu, C.; Zhong, M. Experimental and numerical study of smoke temperature distribution characteristics in a sloped tunnel. Sustain. Cities Soc. 2021, 73, 103091. [Google Scholar] [CrossRef]
- Yan, Z.; Gou, Q.; Zhu, H. Full-scale experiments on fire characteristics of road tunnel at high altitude. Tunn. Undergr. Space Technol. 2017, 66, 134–146. [Google Scholar] [CrossRef]
- Li, J.; Li, Y.F.; Cheng, C.H.; Chow, W.K. A study on the effects of the slope on the critical velocity for longitudinal ventilation in tilted tunnels. Tunn. Undergr. Space Technol. 2019, 89, 262–267. [Google Scholar] [CrossRef]
- Hu, L.H.; Chen, L.F.; Wu, L.; Li, Y.F.; Zhang, J.Y.; Meng, N. An experimental investigation and correlation on buoyant gas temperature below ceiling in a slopping tunnel fire. Appl. Therm. Eng. 2013, 51, 246–254. [Google Scholar] [CrossRef]
- Wan, H.; Gao, Z.; Han, J.; Ji, J.; Ye, M.; Zhang, Y. A numerical study on smoke back-layering length and inlet air velocity of fires in an inclined tunnel under natural ventilation with a vertical shaft. Int. J. Therm. Sci. 2019, 138, 293–303. [Google Scholar] [CrossRef]
- Yang, Y.; Liu, C.; Qiu, P.; Long, Z.; Zhong, M. Full-scale experimental study of a fire under a vehicle in a sloped tunnel. J. Tsinghua Univ. Sci. Technol. 2020, 60, 1030–1038. [Google Scholar] [CrossRef]
- Yang, Y.; Cheng, H.; Long, Z.; Chen, J.; Liu, C.; Zhong, M. Experimental study on effect of blockage on smoke temperature in tunnel fire. China Saf. Sci. J. 2022, 32, 135–141. [Google Scholar]
- Zhong, M.; Liu, C.; Yang, Y. Study on ventilation mode for train fire in metro tunnel with single-side slope. J. Saf. Sci. Technol. 2018, 14, 5–13. [Google Scholar]
- Yang, D.; Ding, Y.; Du, T.; Mao, S.; Zhang, Z. Buoyant back-layering and the critical condition for preventing back-layering fluid in inclined tunnels under natural ventilation: Brine water experiments. Exp. Therm. Fluid Sci. 2018, 90, 319–329. [Google Scholar] [CrossRef]
- Wang, J.; Gao, D.; Kong, X.; Jiang, X.; Lu, K. Water spray effects on fire smoke temperature distribution beneath a symmetrical V-shaped tunnel ceiling. Case Stud. Therm. Eng. 2023, 51, 103568. [Google Scholar] [CrossRef]
- Jiang, X.; Liao, X.; He, Z. Maximum temperature of smoke beneath the ceiling in the herringbone slope tunnel fire. J. Saf. Environ. 2018, 18, 925–929. [Google Scholar]
- Guo, X.; Pan, X.; Wang, Z.; Yang, J.; Hua, M.; Jiang, J. Numerical simulation of fire smoke in extra-long river-crossing subway tunnels. Tunn. Undergr. Space Technol. 2018, 82, 82–98. [Google Scholar] [CrossRef]
- Weng, M.C.; Lu, X.L.; Liu, F.; Shi, X.P.; Yu, L.X. Prediction of backlayering length and critical velocity in metro tunnel fires. Tunn. Undergr. Space Technol. 2015, 47, 64–72. [Google Scholar] [CrossRef]
- Beijing Urban Construction Design and Development Group Co., Ltd. Feasibility Study Report of Beijing Metro Line 19 Phase I Project; Beijing Urban Construction Design and Development Group Co., Ltd.: Beijing, China, 2015. [Google Scholar]
- Guangzhou Metro Design and Research Institute Co., Ltd. Summary of Guangzhou Metro Line 4 Engineering Design; People’s Communications Press: Beijing, China, 2013. [Google Scholar]
- GB 51298-2018; Standard for Fire Protection Design of Metro. China Planning Press: Beijing, China, 2018.
- Morgan, J.H. SFPE Handbook of Fire Protection Engineering; Springer: New York, NY, USA, 2016; p. 3443. [Google Scholar]
- GB 50157-2013; Code for Design of Metro. China Construction Industry Press: Beijing, China, 2013.
- McGrattan, K.; Forney, G.P. Fire Dynamics Simulator (Version 5) Use’s Guide; NIST Special Publication: Gaithersburg, MD, USA, 2008. [Google Scholar]
- Li, Y.; Ingason, H. The maximum ceiling gas temperature in a large tunnel fire. Fire Saf. J. 2012, 48, 38–48. [Google Scholar] [CrossRef]
- Zhu, C.; Gao, M. Numerical simulation on personnel evacuation microenvironment in underground railway tunnel fire. Build. Sci. 2011, 27, 104–108. [Google Scholar]
- GB 51251-2017; Technical Standard for Smoke Management System in Buildings. China Planning Press: Beijing, China, 2017.
- Xu, Z.; Zhao, J.; Liu, Q.; Chen, H.; Liu, Y.; Geng, Z.; He, L. Experimental investigation on smoke spread characteristics and smoke layer height in tunnels. Fire Mater. 2019, 43, 303–309. [Google Scholar] [CrossRef]
- Shi, Y.; Qian, S.; Zhao, P.; Guo, P.; Gao, Z. Influence of smoke exhaust volume and smoke vent layout on the ceiling centralized smoke exhaust effect in tunnel fires. Fire 2024, 7, 78. [Google Scholar] [CrossRef]
- Zukoski, E.E. Combustion Fundamentals of Fire; Academic Press: London, UK, 1995. [Google Scholar]
- Ingason, H.; Li, Y.; Lönnermark, A. Tunnel Fire Dynamics; Springer: New York, NY, USA, 2015. [Google Scholar]


| Experimental Condition | Tunnel Slope | Ventilation Mode |
|---|---|---|
| 1–5 | 0, 10‰, 20‰, 30‰, 40‰ | Natural ventilation (N) |
| 6–10 | Single-side air supply (S) | |
| 11–15 | Single-side smoke exhaust (E) | |
| 16–20 | Air supply + smoke exhaust (S + E) |
Disclaimer/Publisher’s Note: The statements, opinions and data contained in all publications are solely those of the individual author(s) and contributor(s) and not of MDPI and/or the editor(s). MDPI and/or the editor(s) disclaim responsibility for any injury to people or property resulting from any ideas, methods, instructions or products referred to in the content. |
© 2025 by the authors. Licensee MDPI, Basel, Switzerland. This article is an open access article distributed under the terms and conditions of the Creative Commons Attribution (CC BY) license (https://creativecommons.org/licenses/by/4.0/).
Share and Cite
Yang, Y.; Zhang, Q. Numerical Study on the Effect of Tunnel Slope on Smoke Exhaust Performance in Metro Tunnels. Fire 2025, 8, 28. https://doi.org/10.3390/fire8010028
Yang Y, Zhang Q. Numerical Study on the Effect of Tunnel Slope on Smoke Exhaust Performance in Metro Tunnels. Fire. 2025; 8(1):28. https://doi.org/10.3390/fire8010028
Chicago/Turabian StyleYang, Yuxuan, and Qianbo Zhang. 2025. "Numerical Study on the Effect of Tunnel Slope on Smoke Exhaust Performance in Metro Tunnels" Fire 8, no. 1: 28. https://doi.org/10.3390/fire8010028
APA StyleYang, Y., & Zhang, Q. (2025). Numerical Study on the Effect of Tunnel Slope on Smoke Exhaust Performance in Metro Tunnels. Fire, 8(1), 28. https://doi.org/10.3390/fire8010028