
Research on Safety Risk Assessment Grading by Combining AHP-FCE and Risk Matrix Method-Taking Emergency Industrial Park of Fangshan District in Beijing as an Example


Abstract
:1. Introduction
2. Materials and Methods
2.1. Research Basis and Method of Safety Risk Assessment Model in Parks
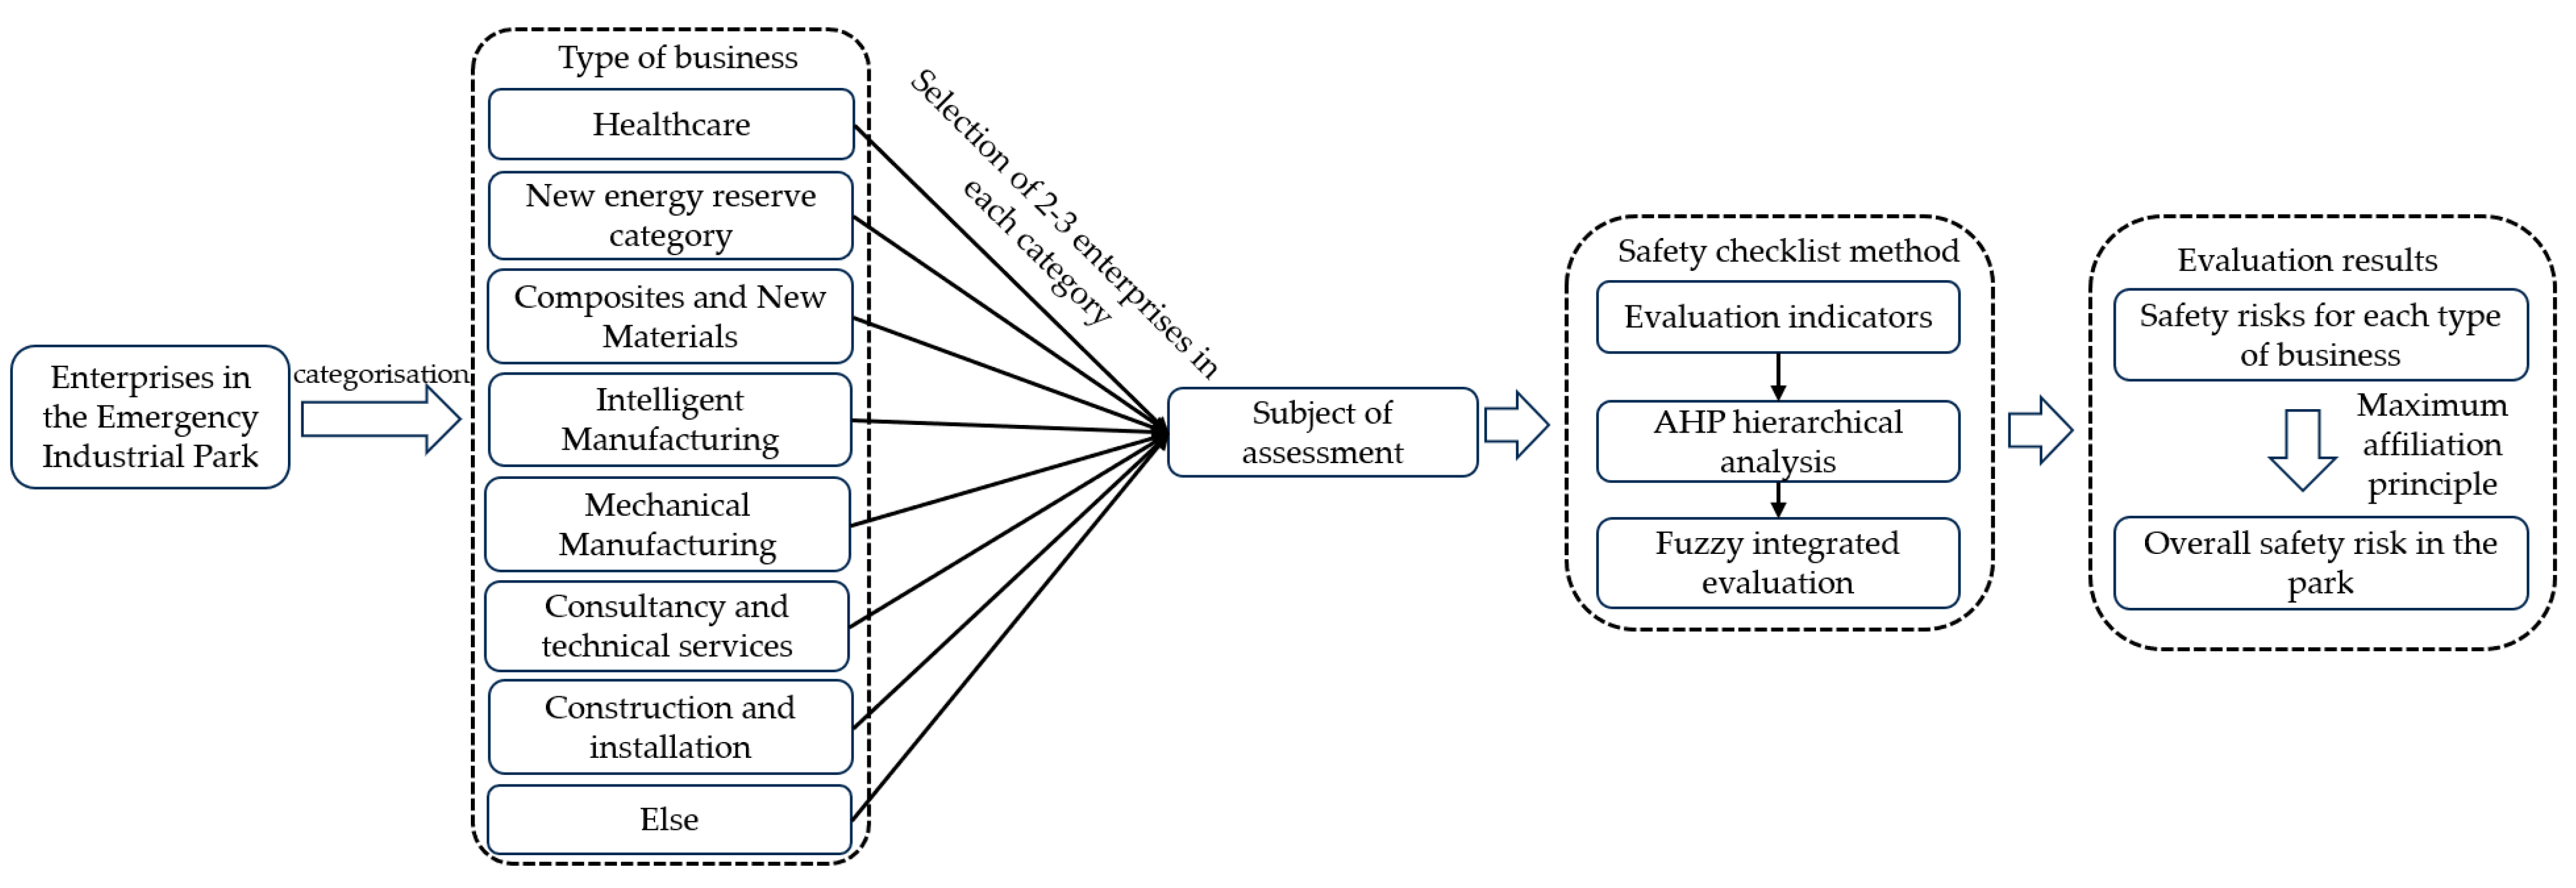
2.1.1. Classification of Typical Enterprises in the Park
2.1.2. Risk Assessment Model Based on AHP-FCE
2.1.3. Application Method of the Risk Assessment Model
2.2. Research Basis and Application Results of Safety Risk Classification Model in Parks
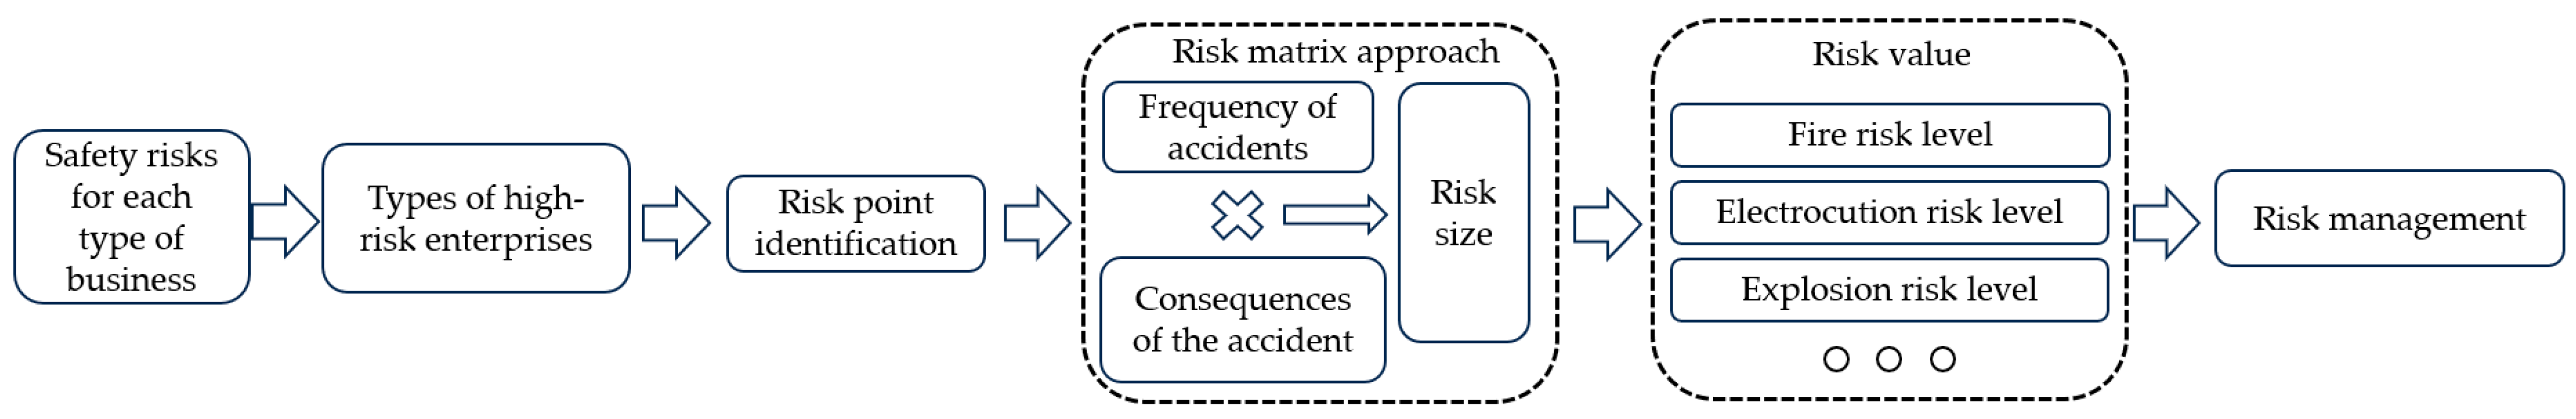
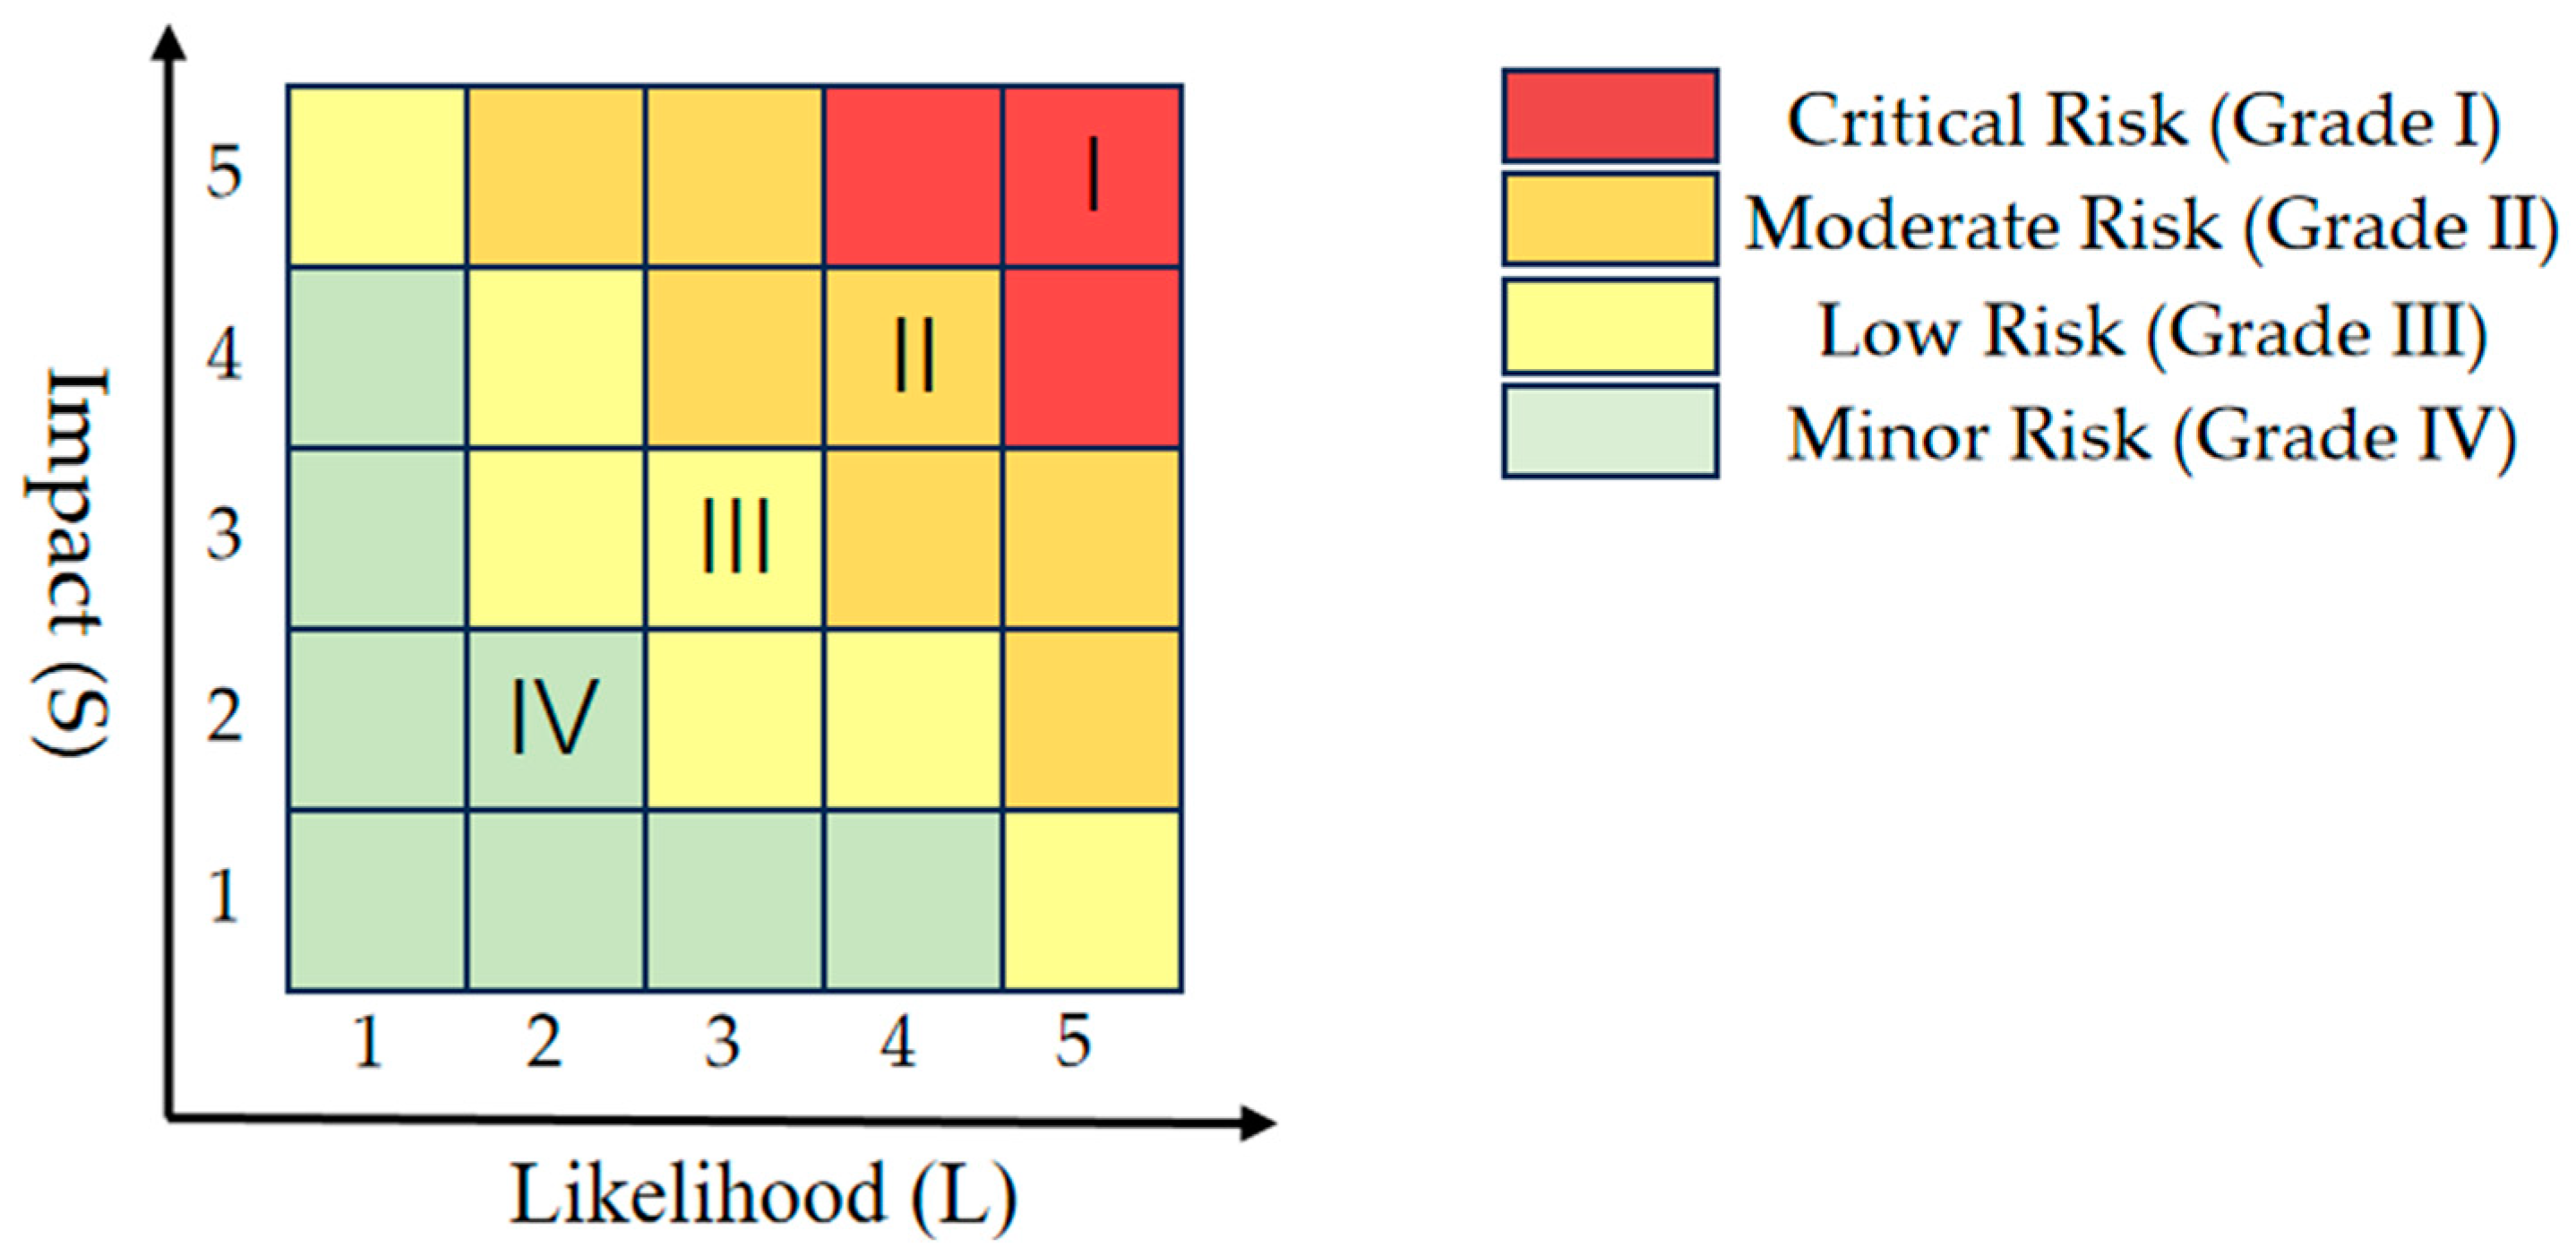
2.2.1. Risk Grading Model Based on the Risk Matrix Method
2.2.2. Application Method of the Risk Grading Model
3. Results
3.1. Model Establishment
3.2. Case Study
3.2.1. Calculation of Indicator Weights
3.2.2. Fuzzy Comprehensive Evaluation
3.2.3. Safety Risk Assessment Grading Model
4. Discussion and Conclusions
Author Contributions
Funding
Institutional Review Board Statement
Informed Consent Statement
Data Availability Statement
Conflicts of Interest
Appendix A

| Assessment Module—B | First-Level Indicator—C | Second-Level Indicator—D | Third-Level Indicator—E |
|---|---|---|---|
| Safety management and risk control | Regulations and governing documents | Mechanisms for management of production safety | Work safety accountability |
| Work safety assessment mechanism | |||
| Targeted management of production safety | |||
| Contractor management system | |||
| Safety training and education | Training plans | ||
| Training records | |||
| Education and training hours | |||
| Assessment of the effectiveness of safety education and training | |||
| Inputs to production safety | Safety cost management system | ||
| Plan for the use of production safety costs. | |||
| Extraction of production safety costs | |||
| Risk management and emergency response | Routine check-ups of hidden dangers | Safety risk and risk identification mechanism | |
| Frequency and coverage of safety inspections | |||
| Identification and rectification of hidden dangers | |||
| Major accident risk situation | |||
| Emergency preparedness and response | Emergency planning | ||
| Emergency exercise plan | |||
| Emergency exercise implementation | |||
| Emergency supplies and equipment | |||
| Emergency communications and information dissemination | |||
| Offline office space | Fire safety | Fire-fighting equipment and facilities | Completeness of the building’s fire protection system |
| Configuration and integrity of the enterprise’s firefighting equipment | |||
| Fire escape accessibility | |||
| Availability of emergency supplies | |||
| Electrical safety | Electrical equipment facilities | Maintenance of electrical equipment | |
| Electrical wiring regulation and safety | |||
| Electrical safety management system | Safety management system | ||
| Production area | Base building and environment | Building layout risks | Production area |
| Potential for expansion of the accident | |||
| Risk of meteorological conditions at the site | Extreme temperatures | ||
| Humidity changes | |||
| Inundation | |||
| Geological risks at the site | Geological conditions | ||
| Earthquake risk | |||
| Whole production process | Production equipment risks | Equipment structural integrity | |
| Equipment life expectancy | |||
| Maintenance of equipment | |||
| Production process risks | Potential for fire and explosion accidents | ||
| Potential for electrocution | |||
| Probability of fall-from-height accidents | |||
| Potential for poisoning accidents | |||
| Potential for object strike accidents | |||
| Possibility of mechanical accidents | |||
| Risks in the storage and transport of production materials | Type of material produced | ||
| Reasonableness of mode of transport | |||
| Pipeline status | |||
| Maintenance of equipment and facilities | Maintenance of equipment and facilities | ||
| Fire protection system | Monitoring and early warning systems | ||
| Automatic fire extinguishing systems | |||
| Configuration of other fire-fighting facilities | |||
| Operation and maintenance of fire-fighting facilities | |||
| Hazardous waste treatment | Solid, liquid, and gas waste treatment | ||
| Storage areas | Warehouse building design and environment | Building design | Reasonableness of mode of transport |
| Potential for expansion of the accident | |||
| Warehouse facility safety | Fire protection system | Monitoring and early warning systems | |
| Automatic fire extinguishing systems | |||
| Configuration of other fire-fighting facilities | |||
| Operation and maintenance of fire-fighting facilities | |||
| Maintenance of facilities | Maintenance of facilities | ||
| Warehouse cargo safety | Storage safety | Material type | |
| Material storage method | |||
| Storage of flammable, explosive, and toxic hazardous chemicals | |||
| Significant sources of danger | |||
| Transport safety | Inbound and outbound process standardization and safety | ||
| Cargo safety monitoring measures | |||
| R&D center area | R&D center facility safety | R&D center fire-fighting facilities | Monitoring and early warning systems |
| Configuration of fire-fighting facilities | |||
| Maintenance of fire-fighting facilities | |||
| Operation of the fire-fighting system | |||
| R&D center electrical wiring and equipment | Safety of electrical equipment itself | ||
| Electrical wiring laying normality and safety | |||
| Whole process of experimental testing | Safety of laboratory equipment | Completeness of safety devices for experimental equipment | |
| Age of laboratory equipment | |||
| Maintenance of laboratory equipment | |||
| Experimental process risks | Operating temperatures | ||
| Operating pressure | |||
| Hazardous waste treatment | Solid, liquid, and gas waste treatment |
Appendix B
| Assessment Module—B | Evaluation Weight | First-Level Indicator—C | Evaluation Weight | Second-Level Indicator—D | Evaluation Weight | Third-Level Indicator—E | Evaluation Weight | Third-Level Index Evaluation Items | Evaluation Score |
| Safety management and risk control | 0.1 | Regulations and governing documents | 0.667 | Mechanisms for management of production safety | 0.548 | Work safety accountability | 0.532 | System improvement | 100 |
| Imperfect system | 60 | ||||||||
| Unestablished system | 0 | ||||||||
| Work safety assessment mechanism | 0.257 | System improvement | 100 | ||||||
| Imperfect system | 60 | ||||||||
| Unestablished system | 0 | ||||||||
| Targeted management of production safety | 0.128 | Clear goal | 100 | ||||||
| Unclear goal | 60 | ||||||||
| Failure to establish goals | 0 | ||||||||
| Contractor management system | 0.083 | System improvement | 100 | ||||||
| Imperfect system | 60 | ||||||||
| Unestablished system | 0 | ||||||||
| Safety training and education | 0.241 | Training plans | 0.087 | Present | 100 | ||||
| Not present | 0 | ||||||||
| Training records | 0.142 | Integrity | 100 | ||||||
| Incomplete | 0 | ||||||||
| Education and training hours | 0.296 | Achieved | 100 | ||||||
| Not achieved | 0 | ||||||||
| Assessment of the effectiveness of safety education and training | 0.473 | Outstanding | 100 | ||||||
| Pass | 60 | ||||||||
| Fail | 0 | ||||||||
| Inputs to production safety | 0.211 | Safety cost management system | 0.539 | Integrity | 100 | ||||
| Incomplete | 0 | ||||||||
| Plan for the use of production safety costs | 0.297 | Integrity | 100 | ||||||
| Incomplete | 0 | ||||||||
| Extraction of production safety costs | 0.164 | Integrity | 100 | ||||||
| Incomplete | 0 | ||||||||
| Risk management and emergency response | 0.333 | Routine check-ups of hidden dangers | 0.889 | Safety risk and risk identification mechanism | 0.413 | System improvement | 100 | ||
| Imperfect system | 60 | ||||||||
| Unestablished system | 0 | ||||||||
| Frequency and coverage of safety inspections | 0.200 | Compliant | 100 | ||||||
| Non-compliant | 0 | ||||||||
| Identification and rectification of hidden dangers | 0.258 | Complete rectification | 100 | ||||||
| Partial rectification | 50 | ||||||||
| Not rectified | 0 | ||||||||
| Major accident risk situation | 0.129 | Non-existence | 100 | ||||||
| Critical risk: remediation ongoing | 50 | ||||||||
| Critical risk: unaddressed | 0 | ||||||||
| Emergency preparedness and response | 0.111 | Emergency planning | 0.389 | Integrity | 100 | ||||
| Incomplete | 0 | ||||||||
| Emergency exercise plan | 0.160 | Integrity | 100 | ||||||
| Incomplete | 0 | ||||||||
| Emergency exercise implementation | 0.264 | On schedule | 100 | ||||||
| Behind schedule | 0 | ||||||||
| Emergency supplies and equipment | 0.117 | Compliant with regulations | 100 | ||||||
| Non-compliance | 0 | ||||||||
| Emergency communications and information dissemination | 0.070 | Integrity | 100 | ||||||
| Incomplete | 0 | ||||||||
| Offline office space | 0.100 | Fire safety | 0.667 | Fire-fighting equipment and facilities | 1.000 | Completeness of the building’s fire protection system | 0.396 | Integrity | 100 |
| Incomplete | 0 | ||||||||
| Configuration and integrity of the enterprise’s firefighting equipment | 0.239 | Integrity | 100 | ||||||
| Incomplete | 0 | ||||||||
| Fire escape accessibility | 0.194 | Smooth | 100 | ||||||
| Obstructed | 0 | ||||||||
| Availability of emergency supplies | 0.171 | Integrity | 100 | ||||||
| Incomplete | 0 | ||||||||
| Electrical safety | 0.333 | Electrical equipment facilities | 0.750 | Maintenance of electrical equipment | 0.167 | Scheduled maintenance | 100 | ||
| Unscheduled maintenance | 0 | ||||||||
| Electrical wiring regulation and safety | 0.833 | Compliant with regulations | 100 | ||||||
| Non-compliance | 0 | ||||||||
| Electrical safety management system | 0.250 | Safety management system | 1.000 | Integrity | 100 | ||||
| Incomplete | 0 | ||||||||
| Production area | 0.4 | Base building and environment | 0.250 | Building layout risks | 0.557 | Production area | 0.750 | Compliant with regulations | 100 |
| Non-compliance | 0 | ||||||||
| Potential for expansion of the accident | 0.250 | Little possibility | 100 | ||||||
| High possibility | 80 | ||||||||
| Risk of meteorological conditions at the site | 0.320 | Extreme temperatures | 0.525 | Low sensitivity | 100 | ||||
| High sensitivity | 80 | ||||||||
| Humidity changes | 0.334 | Low sensitivity | 100 | ||||||
| High sensitivity | 80 | ||||||||
| Inundation | 0.142 | Not likely to happen | 100 | ||||||
| Likely to occur | 80 | ||||||||
| Geological risks at the site | 0.123 | Geological conditions | 0.889 | Not likely to happen | 100 | ||||
| Likely to occur | 80 | ||||||||
| Earthquake risk | 0.111 | Not likely to happen | 100 | ||||||
| Likely to occur | 80 | ||||||||
| Whole production process | 0.750 | Production equipment risks | 0.069 | Equipment structural integrity | 0.623 | Integrity | 100 | ||
| Incomplete | 0 | ||||||||
| Equipment life expectancy | 0.137 | Compliant with regulations | 100 | ||||||
| Non-compliance | 0 | ||||||||
| Maintenance of equipment | 0.239 | On schedule | 100 | ||||||
| Behind schedule | 0 | ||||||||
| Production process risks | 0.257 | Potential for fire and explosion accidents | 0.381 | Little possibility | 100 | ||||
| High possibility | 80 | ||||||||
| Potential for electrocution | 0.138 | Little possibility | 100 | ||||||
| High possibility | 80 | ||||||||
| Probability of fall-from-height accidents | 0.070 | Little possibility | 100 | ||||||
| High possibility | 80 | ||||||||
| Potential for poisoning accidents | 0.256 | Little possibility | 100 | ||||||
| High possibility | 80 | ||||||||
| Potential for object strike accidents | 0.046 | Little possibility | 100 | ||||||
| High possibility | 80 | ||||||||
| Possibility of mechanical accidents | 0.108 | Little possibility | 100 | ||||||
| High possibility | 80 | ||||||||
| Risks in the storage and transport of production materials | 0.170 | Type of material produced | 0.126 | Property stability | 100 | ||||
| Qualitative instability | 80 | ||||||||
| Reasonableness of mode of transport | 0.416 | Rational | 100 | ||||||
| Unreasonable | 0 | ||||||||
| Pipeline status | 0.458 | Compliant/not involved | 100 | ||||||
| Non-conformity | 0 | ||||||||
| Maintenance of equipment and facilities | 0.059 | Maintenance of equipment and facilities | 1.000 | On schedule | 100 | ||||
| Behind schedule | 0 | ||||||||
| Fire protection system | 0.330 | Monitoring and early warning systems | 0.450 | Yes | 100 | ||||
| No | 0 | ||||||||
| Automatic fire extinguishing systems | 0.211 | Yes | 100 | ||||||
| No | 0 | ||||||||
| Configuration of other fire-fighting facilities | 0.074 | Meets the requirements | 100 | ||||||
| Non-conformity | 0 | ||||||||
| Operation and maintenance of fire-fighting facilities | 0.265 | On schedule | 100 | ||||||
| Behind schedule | 0 | ||||||||
| Hazardous waste treatment | 0.116 | Solid, liquid, and gas waste treatment | 1.000 | Meets the requirements | 100 | ||||
| Inconformity | 0 | ||||||||
| Storage areas | 0.2 | Warehouse building design and environment | 0.096 | Building design | 1.000 | Reasonableness of mode of transport | 0.750 | Meets the requirements | 100 |
| Non-conformity | 0 | ||||||||
| Potential for expansion of the accident | 0.250 | Little possibility | 100 | ||||||
| High possibility | 80 | ||||||||
| Warehouse facility safety | 0.284 | Fire protection system | 0.750 | Monitoring and early warning systems | 0.462 | Yes | 100 | ||
| No | 0 | ||||||||
| Automatic fire extinguishing systems | 0.291 | Yes | 100 | ||||||
| No | 0 | ||||||||
| Configuration of other fire-fighting facilities | 0.071 | Meets the requirements | 100 | ||||||
| Non-conformity | 0 | ||||||||
| Operation and maintenance of fire-fighting facilities | 0.177 | On schedule | 100 | ||||||
| Behind schedule | 0 | ||||||||
| Maintenance of facilities | 0.250 | Maintenance of facilities | 1.000 | On schedule | 100 | ||||
| Behind schedule | 0 | ||||||||
| Warehouse cargo safety | 0.619 | Storage safety | 0.500 | Material type | 0.151 | Stabilized | 100 | ||
| Instability | 0 | ||||||||
| Material storage method | 0.090 | Meets the requirements | 100 | ||||||
| Non-conformity | 0 | ||||||||
| Storage of flammable, explosive, and toxic hazardous chemicals | 0.311 | Meet the requirements | 100 | ||||||
| Non-conformity | 0 | ||||||||
| Significant sources of danger | 0.448 | Not constituted | 100 | ||||||
| Constituted | 80 | ||||||||
| Transport safety | 0.500 | Inbound and outbound process standardization and safety | 0.889 | Meets the requirements | 100 | ||||
| Non-conformity | 0 | ||||||||
| Cargo safety monitoring measures | 0.111 | System improvement | 100 | ||||||
| Imperfect system | 0 | ||||||||
| R&D center area | 0.2 | R&D center facility safety | 0.167 | R&D centerfire-fighting facilities | 0.833 | Monitoring and early warning systems | 0.421 | Yes | 100 |
| No | 0 | ||||||||
| Configuration of fire-fighting facilities | 0.219 | System improvement | 100 | ||||||
| Imperfect system | 0 | ||||||||
| Maintenance of fire-fighting facilities | 0.128 | On schedule | 100 | ||||||
| Behind schedule | 0 | ||||||||
| Operation of the fire-fighting system | 0.232 | Meets the requirements | 100 | ||||||
| Non-conformity | 0 | ||||||||
| R&D centerelectrical wiring and equipment | 0.167 | Safety of electrical equipment itself | 0.500 | Meets the requirements | 100 | ||||
| Non-conformity | 0 | ||||||||
| Electrical wiring laying normality and safety | 0.500 | Meets the requirements | 100 | ||||||
| Non-conformity | 0 | ||||||||
| Whole process of experimental testing | 0.833 | Safety of laboratory equipment | 0.159 | Completeness of safety devices for experimental equipment | 0.731 | System improvement | 100 | ||
| Imperfect system | 0 | ||||||||
| Age of laboratory equipment | 0.119 | Meets the requirements | 100 | ||||||
| Non-conformity | 0 | ||||||||
| Maintenance of laboratory equipment | 0.149 | On schedule | 100 | ||||||
| Behind schedule | 0 | ||||||||
| Experimental process risks | 0.589 | Operating temperatures | 0.500 | −50 °c~100 °c | 100 | ||||
| 100~2000 °c; ≤−50 °c | 90 | ||||||||
| >2000 °c | 80 | ||||||||
| Operating pressure | 0.500 | ≤0.1 mpa | 100 | ||||||
| 0.1~10 mpa | 90 | ||||||||
| 10 mpa~100 mpa | 80 | ||||||||
| >100 mpa | 70 | ||||||||
| Hazardous waste treatment | 0.252 | Solid, liquid, and gas waste treatment | 1.000 | Meets the requirements | 100 | ||||
| Non-conformity | 0 |
References
- Peng, Z.; Lan, Y. Balance of Supply and Demand of Safety and Emergency Products and Services: Intelligent and Coordinated Development of Industry and Culture. J. Beijing Univ. Aeronaut. Astronaut. (Soc. Sci. Ed.) 2024, 37, 15–25. [Google Scholar]
- Liu, B.; Li, L.; Li, N. Research on Fire Risk Assessment Methods for Chemical Industrial Parks. In Proceedings of the Academic Work Committee of the China Fire Protection Association on Fire Technology (2024)—Fire Risk Assessment Techniques; Shenyang Fire Research Institute of Emergency Management Department: Shenyang, China; Key Laboratory of Fire Prevention and Control Technology in Liaoning Province: Shenyang, China; National Engineering Research Center for Fire Protection and Emergency Rescue: Shenyang, China, 2024; pp. 6–9. [Google Scholar] [CrossRef]
- Zhao, D.; Guo, F.; Ge, Z.; Qiao, G. Hebei Keer Chemical “2-28” major explosion accident traceability. Labor Prot. 2012, 11, 29–33. [Google Scholar]
- Sun, Y. Empty tank operation to change the real tank of high temperature curing detonation of combustion stairs blocked cargo elevator stops helplessly jumping casualties tragic—Wuhan City, Hubei Province, Topchoice Industrial Park “8.26” aerosol cans explode and burn the analysis of larger accidents. Jilin Labor Prot. 2020, 3, 37–40. [Google Scholar]
- Chen, D. Chinese counterparts analyze South Korea’s “2-11” explosion accident. China Pet. Chem. Ind. Monit. 2022, 3, 74–75. [Google Scholar]
- Shi, F. Research on Accident Risk Analysis of Major Hazardous Sources and Emergency Rescue Systems in Chemical Parks; Central South University: Changsha, China, 2022. [Google Scholar]
- Shen, B. Quantitative Research on Fire Safety Risk of a High-Tech Industrial Park Based on Bayesian Network; Shanghai University of Applied Sciences: Shanghai, China, 2022. [Google Scholar]
- Kadri, F.; Châtelet, E.; Chen, G. Method for quantitative assessment of domino effect caused by overpressure. In Proceedings of the European Safety and Reliability Conference, Boulogne-Billancourt, France, 16–20 September 2012. [Google Scholar]
- Ikwan, F.; Sanders, D.; Hassan, M. Safety evaluation of leak in a storage tank using fault tree analysis and risk matrix analysis. J. Loss Prev. Process Ind. 2021, 73, 104597. [Google Scholar] [CrossRef]
- Yin, Q.; Wan, J.; Cai, Z.; Huang, X.; Zhou, F. Quantitative Evaluation of Lightning Safety Risk in Chemical Industry Zone Based on PSR Model. Guangdong Chem. 2023, 50, 90–93. [Google Scholar]
- Wang, Y.; Wang, Y. Application of Regional Quantitative Safety Risk Assessment of Chemical Industry Park. Ind. Saf. Environ. Prot. 2018, 44, 50–53. [Google Scholar]
- Zhang, Y.; Fu, L.; Bi, J. Research on the risk assessment system of environmental emergencies in industrial parks of Jiangsu Province. Environ. Pollut. Prev. 2020, 42, 1430–1435. [Google Scholar]
- Cao, Y. Application of Quantitative Risk Assessment Software in the Safety Risk Assessment Process of Chemical Industrial Parks. Anhui Chem. Ind. 2024, 50, 88–90. [Google Scholar]
- Kong, X.; Chen, S.; Su, M.; Wang, R.; Duo, Y. Study on index system construction and evaluation model of safety organization resilience in chemical industry parks. J. Saf. Sci. Technol. 2023, 19 (Suppl. S2), 27–32. [Google Scholar]
- Yuan, B.; Yang, J.; Luo, X.; Su, X. Evaluation method of safety resilience of chemical industry park based on fuzzy matter element. J. Saf. Environ. 2023, 23, 2624–2629. [Google Scholar]
- Wang, S.; Zhao, N. Research on safety risk assessment of chemical industrial park based on AHP-Fuzzy. Shandong Chem. Ind. 2023, 52, 226–229. [Google Scholar]
- Tao, T.; Zhou, Y.; Zhou, H.; Lu, Y. Research on comprehensive security risk assessment of small and medium-sized industrial parks based on hierarchical analysis-fuzzy comprehensive security assessment model. Ind. Saf. Environ. Prot. 2023, 49, 26–28. [Google Scholar]
- Yuan, C.B. Application of Analytic Hierarchy Process-Fuzzy Comprehensive Evaluation Method in Safety Assessment of Chemical Industrial Parks. Contemp. Chem. Res. 2016, 12, 33–34. [Google Scholar]
- Han, Q. Application of safety check form method in safety evaluation and its improvement. Petrochem. Saf. Technol. 2003, 19, 13–16. [Google Scholar]
- Chen, G.; Zhang, X.; Xu, S.; Yang, W.; Miao, Y.; Wu, Z.; Gao, J. Quantitative Evaluation Method and Practice of Emergency Response Capability for Accident and Disaster in High-rise Public Buildings. J. Saf. Environ. 2023, 23, 1415–1422. [Google Scholar]
- Pang, Y.; Liu, K. Consistency Check of Analytic Hierarchy Process is Not a Necessary Condition for Ranking. J. Hebei Univ. Archit. Technol. 2002, 19, 76–78. [Google Scholar]
- Wang, C. Research on the Application of AHP-Fuzzy Comprehensive Evaluation Method in Job Evaluation and Performance Assessment; North China Electric Power University: Baoding, China, 2005. [Google Scholar]
- Chen, S.; Chen, H. A risk evaluation model of submarine collective escaping capsules based on the expert weight and risk matrix. Chin. J. Ship Res. 2013, 8, 13–16. [Google Scholar]
- Li, S.; Yan, Z.; Duan, Y. Application of Risk Matrix in Classification of Dangerous and Hazardous Factors. China Saf. Sci. J. 2010, 20, 83–87. [Google Scholar]

| Types of Enterprises in Emergency Industrial Parks | Specificities |
|---|---|
| Healthcare enterprises | Healthcare enterprises include biotechnology enterprises, pharmaceutical manufacturers, etc. These enterprises are mainly engaged in activities such as drug production and the use of medical equipment, and the risks involved mainly include poisoning or explosions. |
| New energy storage enterprises | Enterprises in the new energy storage category are mainly engaged in the research, development, production, and application of energy storage and power generation technologies. The risks of this type of enterprise mainly include fires, explosions, and the leakage of hazardous substances in the energy storage system. |
| Composite materials and new materials | The enterprises in the category of composites and new materials are mainly engaged in the research, development, and production of new materials, such as high-performance composites, nanomaterials, and other aspects. The main risks of this category of enterprises include fires and the explosion of raw materials. |
| Intelligent manufacturing enterprises | Enterprises in the intelligent manufacturing category are mainly engaged in the development and application of high-tech manufacturing equipment and systems, including automated production lines and intelligent control systems. The main risks for enterprises in this category include fires, mechanical injuries, and object strikes. |
| Machinery manufacturing enterprises | Machinery manufacturing enterprises focus on the design, production, and maintenance of various types of machinery and equipment, including industrial machinery and engineering equipment. The main risks of this type of business include object strikes, mechanical injuries, and poisoning. |
| Consulting and technical service enterprises | Consulting and technical services enterprises provide professional consulting services and technical support, including engineering consulting and technical assessment. This type of enterprise is not responsible for the production of products, so it does not have the risks associated with the production process or the risk of waste, and the risks that may be involved include fires, electric shocks, and so on. |
| Construction enterprises | Enterprises in the construction category are mainly engaged in the design, construction, and management of building projects. The main risks of this type of business include electrocution and vehicle injuries. |
| Assessment Module (B) | First-Level Indicator (C) |
|---|---|
| Safety management and risk control | Regulations and governing documents Risk management and emergency response |
| Offline office space | Fire safety Electric safety |
| Production area | Base building and environment The whole production process |
| Storage areas | Warehouse building design and environment Warehouse facility safety Warehouse cargo safety |
| R&D center area | R&D center facility safety The whole process of experimental testing |
| n | 1 | 2 | 3 | 4 | 5 | 6 | 7 | 8 | 9 | 10 | 11 |
| RI | 0 | 0 | 0.58 | 0.90 | 1.12 | 1.24 | 1.32 | 1.41 | 1.45 | 0.49 | 0.52 |
| Assessment Module | Medical and Healthcare | New Energy Storage Category | Composite Materials, New Materials | Intelligent Manufacturing | Mechanical Manufacturing | Construction Category | Consultancy, Technical Services |
|---|---|---|---|---|---|---|---|
| Safety management and risk control | 0.106 | 0.132 | 0.124 | 0.104 | 0.100 | 0.200 | 0.350 |
| Office area | 0.094 | 0.168 | 0.176 | 0.100 | 0.060 | 0.130 | 0.650 |
| Production area | 0.400 | 0.443 | 0.350 | 0.450 | 0.490 | 0.670 | —— |
| Storage areas | 0.075 | —— | —— | 0.209 | 0.110 | —— | —— |
| R&D area | 0.325 | 0.257 | 0.350 | 0.137 | 0.240 | —— | —— |
| Retrieved Value | Frequency of Accident |
|---|---|
| 1 | The city has not experienced this |
| 2 | There has been at least one occurrence in the city within the past 10 years |
| 3 | There have been more than two occurrences in the city within the past 10 years |
| 4 | There have been more than six occurrences in the city within the past 10 years |
| 5 | There has been more than one occurrence in the city within the past year |
| Retrieved Value | Threat Level | Number of Deaths (Persons) | Number of Injuries (Persons) | Property Damage (Millions) |
|---|---|---|---|---|
| 1 | Negligible | 0 | 0 | <50 |
| 2 | Low | [1,3) | [1,10) | [50,1000) |
| 3 | General | [3,10) | [10,50) | [1000,5000) |
| 4 | Comparatively Large | [10,30) | [50,100) | [5000,10,000) |
| 5 | Catastrophic | ≥30 | ≥100 | ≥10,000 |
| A | B1 | B2 | B3 | B4 | B5 |
|---|---|---|---|---|---|
| B1 | 1 | 1/2 | 1/3 | 1/2 | 1 |
| B2 | 2 | 1 | 1/5 | 1/3 | 1/3 |
| B3 | 3 | 5 | 1 | 3 | 4 |
| B4 | 2 | 3 | 1/3 | 1 | 2 |
| B5 | 1 | 3 | 1/4 | 1/2 | 1 |
| Matrix | n | CI | RI | CR | Consistency Test | ||
|---|---|---|---|---|---|---|---|
| A–B | 5.357 | 5 | 0.08925 | 1.12 | 0.07968 | √ | |
| B1–C | 2 | 2 | 0 | 0 | 0 | √ | |
| B2–C | 2 | 2 | 0 | 0 | 0 | √ | |
| B3–C | 2 | 2 | 0 | 0 | 0 | √ | |
| B4–C | 3.087 | 3 | 0.043 | 0.520 | 0.083 | √ | |
| B5–C | 2 | 2 | 0 | 0 | 0 | √ |
| Target Layer A | Layer B Weights | Layer C Weights | Layer D Weights | Layer E Weights | Ei Relative to A Weights |
|---|---|---|---|---|---|
| The safety risk level of the enterprise | B1-0.104 | C1-0.667 | D1-0.548 | E1-0.532 | 0.020223 |
| E2-0.257 | 0.00977 | ||||
| E3-0.128 | 0.004866 | ||||
| …… | …… | …… | …… | …… | |
| B5-0.137 | C11-0.833 | D26-0.589 | E75-0.5 | 0.033609 | |
| E76-0.5 | 0.033609 | ||||
| D27-0.252 | E77-1 | 0.028758 |
| Layer E | Excellent | Average | Poor |
|---|---|---|---|
| E1 | 0.2 | 0.6 | 0.2 |
| E2 | 0.2 | 0.2 | 0.6 |
| E3 | 0.2 | 0.6 | 0.2 |
| …… | …… | …… | …… |
| E75 | 0.8 | 0.2 | 0 |
| E76 | 0.6 | 0.4 | 0 |
| E77 | 0.8 | 0.2 | 0 |
| Layer D | Excellent | Average | Poor |
|---|---|---|---|
| D1 | 0.2166 | 0.4806 | 0.3028 |
| D2 | 0.5054 | 0.3826 | 0.112 |
| D3 | 0.5562 | 0.325 | 0.1188 |
| …… | …… | …… | …… |
| D25 | 0.3524 | 0.3012 | 0.3464 |
| D26 | 0.7 | 0.3 | 0 |
| D27 | 0.8 | 0.2 | 0 |
| Layer C | Excellent | Average | Poor |
|---|---|---|---|
| C1 | 0.357856 | 0.42415 | 0.217993 |
| C2 | 0.296212 | 0.434804 | 0.268984 |
| C3 | 0.2956 | 0.509 | 0.1954 |
| …… | …… | …… | …… |
| C9 | 0.1194 | 0.5261 | 0.3545 |
| C10 | 0.25781 | 0.571511 | 0.170678 |
| C11 | 0.669932 | 0.274991 | 0.055078 |
| Layer B | Excellent | Average | Poor |
|---|---|---|---|
| B1 | 0.337329 | 0.427698 | 0.234973 |
| B2 | 0.338707 | 0.414445 | 0.246849 |
| B3 | 0.442933 | 0.347666 | 0.209401 |
| B4 | 0.199787 | 0.526243 | 0.27397 |
| B5 | 0.601107 | 0.32451 | 0.074383 |
| Layer A | Excellent | Average | Poor |
|---|---|---|---|
| A | 0.39238 | 0.396817 | 0.210803 |
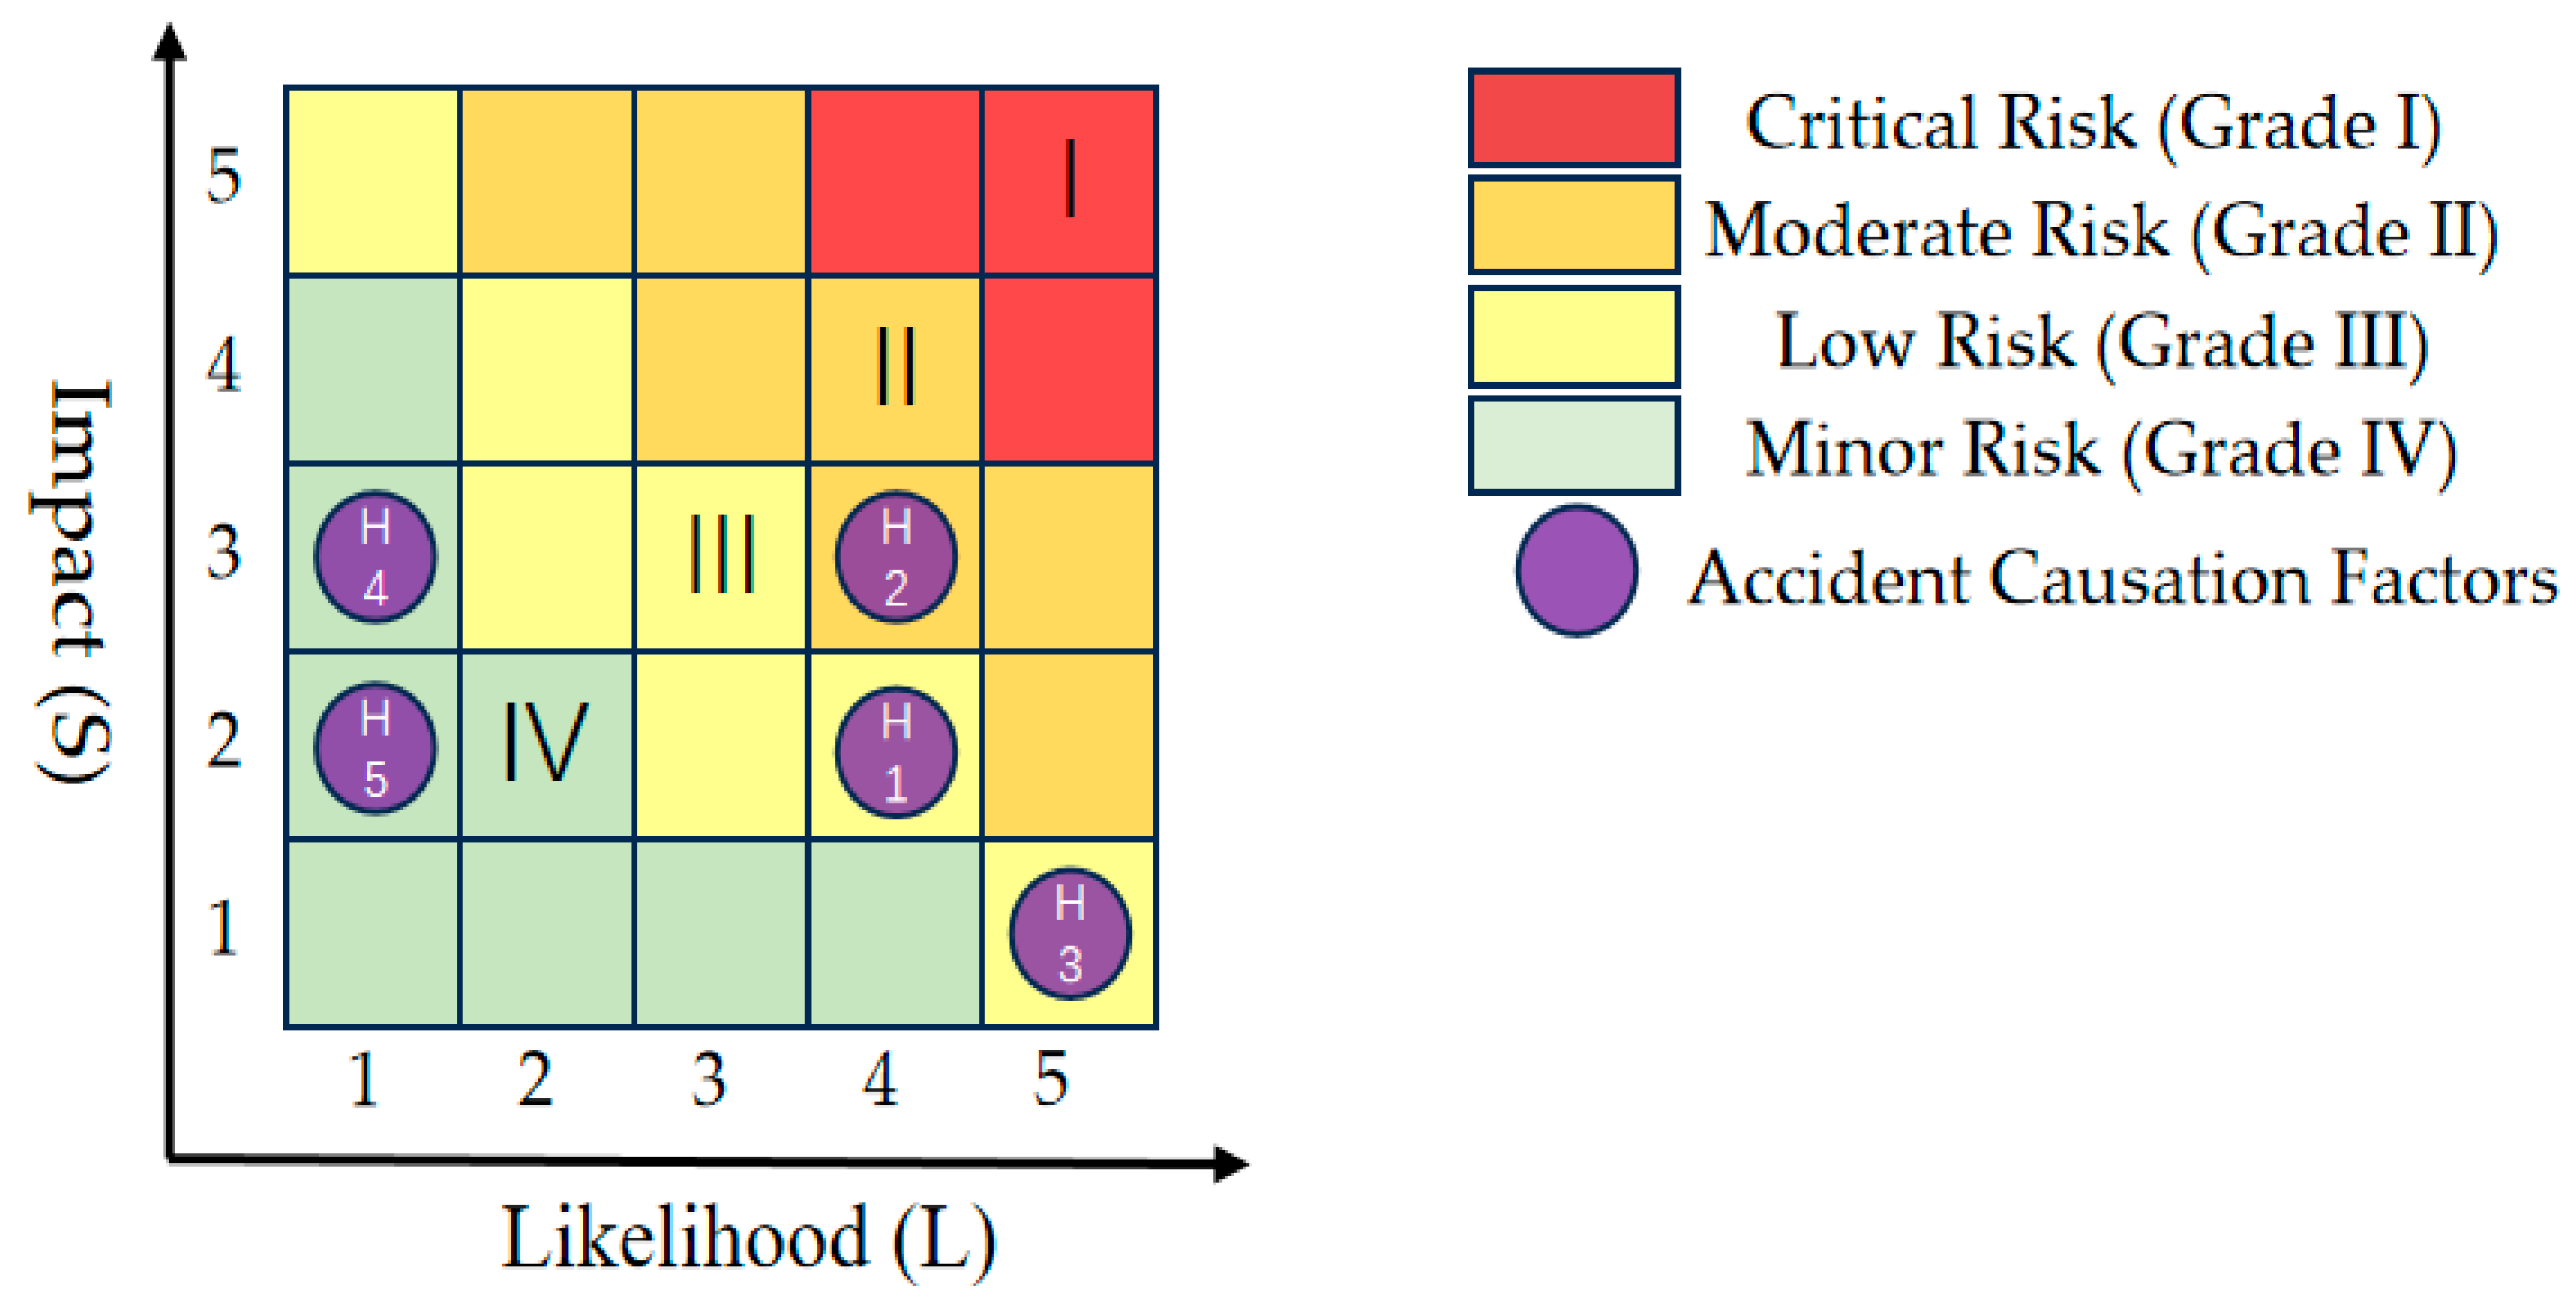
| Risk | Accident Causation Factors | Number |
|---|---|---|
| Fire | Electrical overheating, aging, or overload | H1 |
| Improper electrical wiring and poor connections | H2 | |
| Improper smoking or smoking in non-smoking areas | H3 | |
| Incomplete fire protection facilities | H4 | |
| Improper storage and management of flammable materials | H5 |
| Number | L | S | R |
|---|---|---|---|
| H1 | 4 | 2 | 8 |
| H2 | 4 | 3 | 12 |
| H3 | 5 | 1 | 5 |
| H4 | 1 | 3 | 3 |
| H5 | 1 | 2 | 2 |
Disclaimer/Publisher’s Note: The statements, opinions and data contained in all publications are solely those of the individual author(s) and contributor(s) and not of MDPI and/or the editor(s). MDPI and/or the editor(s) disclaim responsibility for any injury to people or property resulting from any ideas, methods, instructions or products referred to in the content. |
© 2025 by the authors. Licensee MDPI, Basel, Switzerland. This article is an open access article distributed under the terms and conditions of the Creative Commons Attribution (CC BY) license (https://creativecommons.org/licenses/by/4.0/).
Share and Cite
Chen, Z.; Pan, A.; Tan, L.; Ma, Q. Research on Safety Risk Assessment Grading by Combining AHP-FCE and Risk Matrix Method-Taking Emergency Industrial Park of Fangshan District in Beijing as an Example. Fire 2025, 8, 169. https://doi.org/10.3390/fire8050169
Chen Z, Pan A, Tan L, Ma Q. Research on Safety Risk Assessment Grading by Combining AHP-FCE and Risk Matrix Method-Taking Emergency Industrial Park of Fangshan District in Beijing as an Example. Fire. 2025; 8(5):169. https://doi.org/10.3390/fire8050169
Chicago/Turabian StyleChen, Zhuo, Aolan Pan, Luyao Tan, and Qiuju Ma. 2025. "Research on Safety Risk Assessment Grading by Combining AHP-FCE and Risk Matrix Method-Taking Emergency Industrial Park of Fangshan District in Beijing as an Example" Fire 8, no. 5: 169. https://doi.org/10.3390/fire8050169
APA StyleChen, Z., Pan, A., Tan, L., & Ma, Q. (2025). Research on Safety Risk Assessment Grading by Combining AHP-FCE and Risk Matrix Method-Taking Emergency Industrial Park of Fangshan District in Beijing as an Example. Fire, 8(5), 169. https://doi.org/10.3390/fire8050169