
A Prototype Forest Fire Decision Support System for Uttarakhand, India


 , ,
, , 
Simple Summary
Abstract
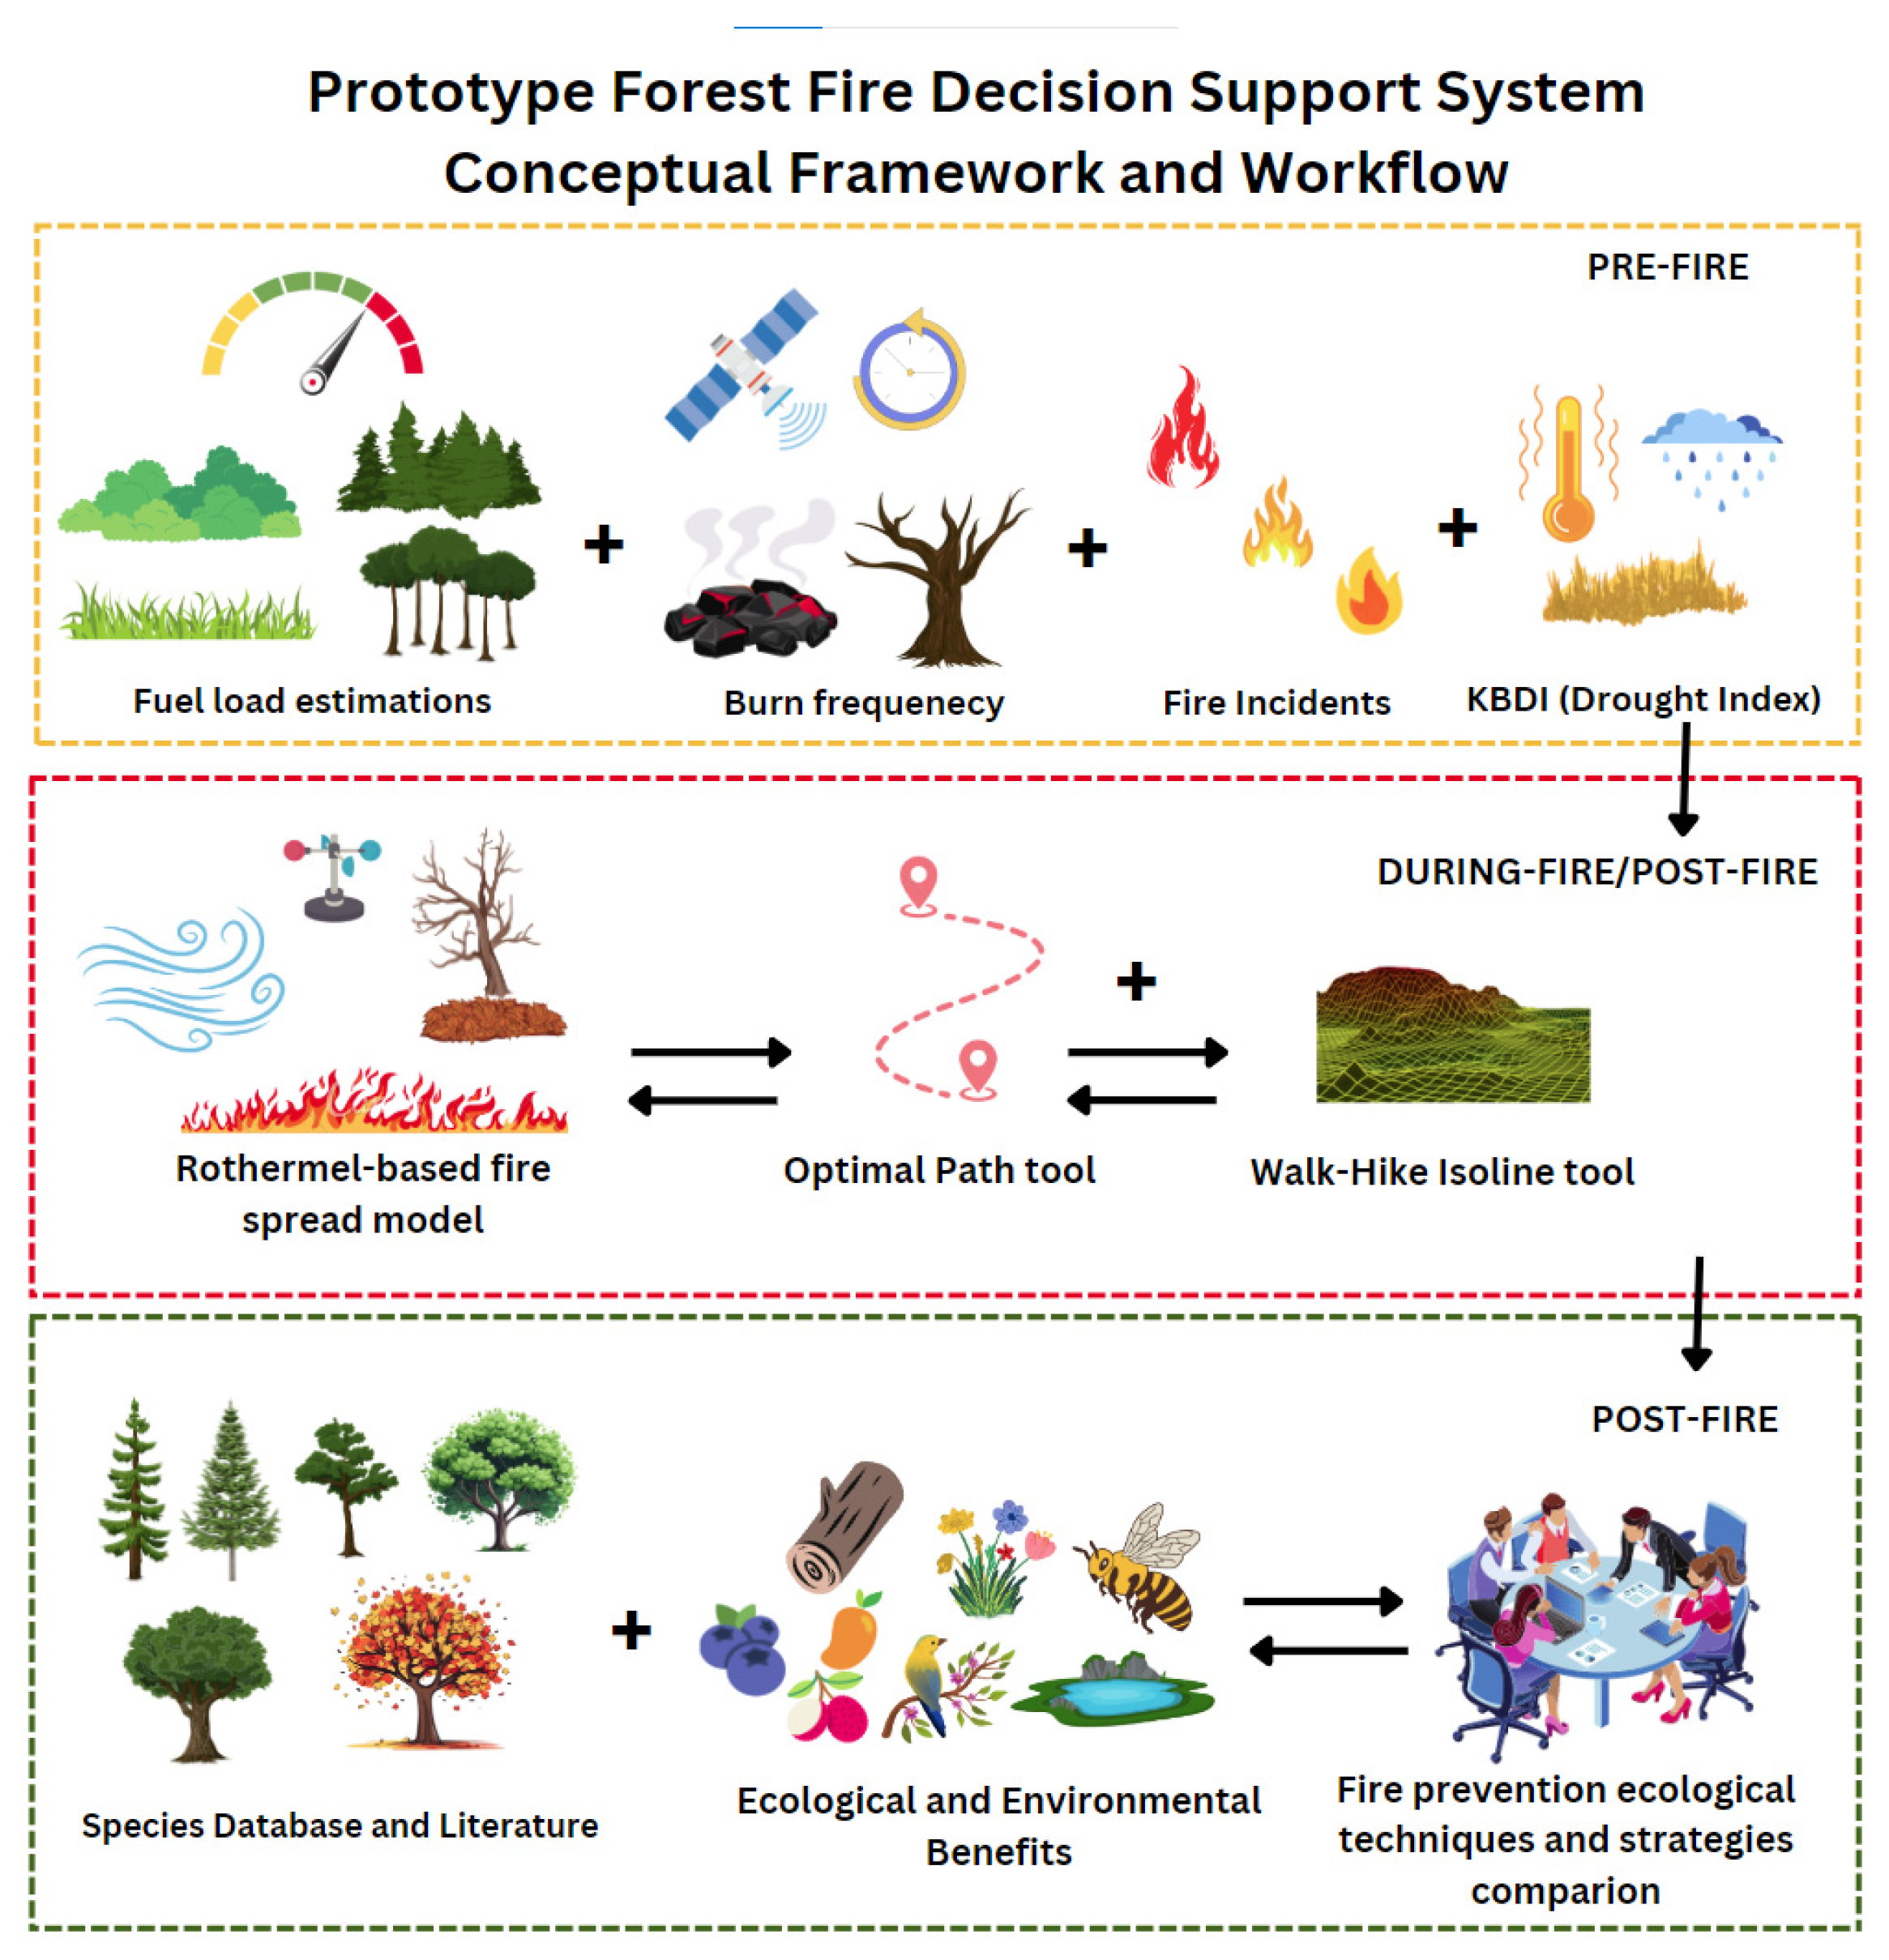
1. Introduction
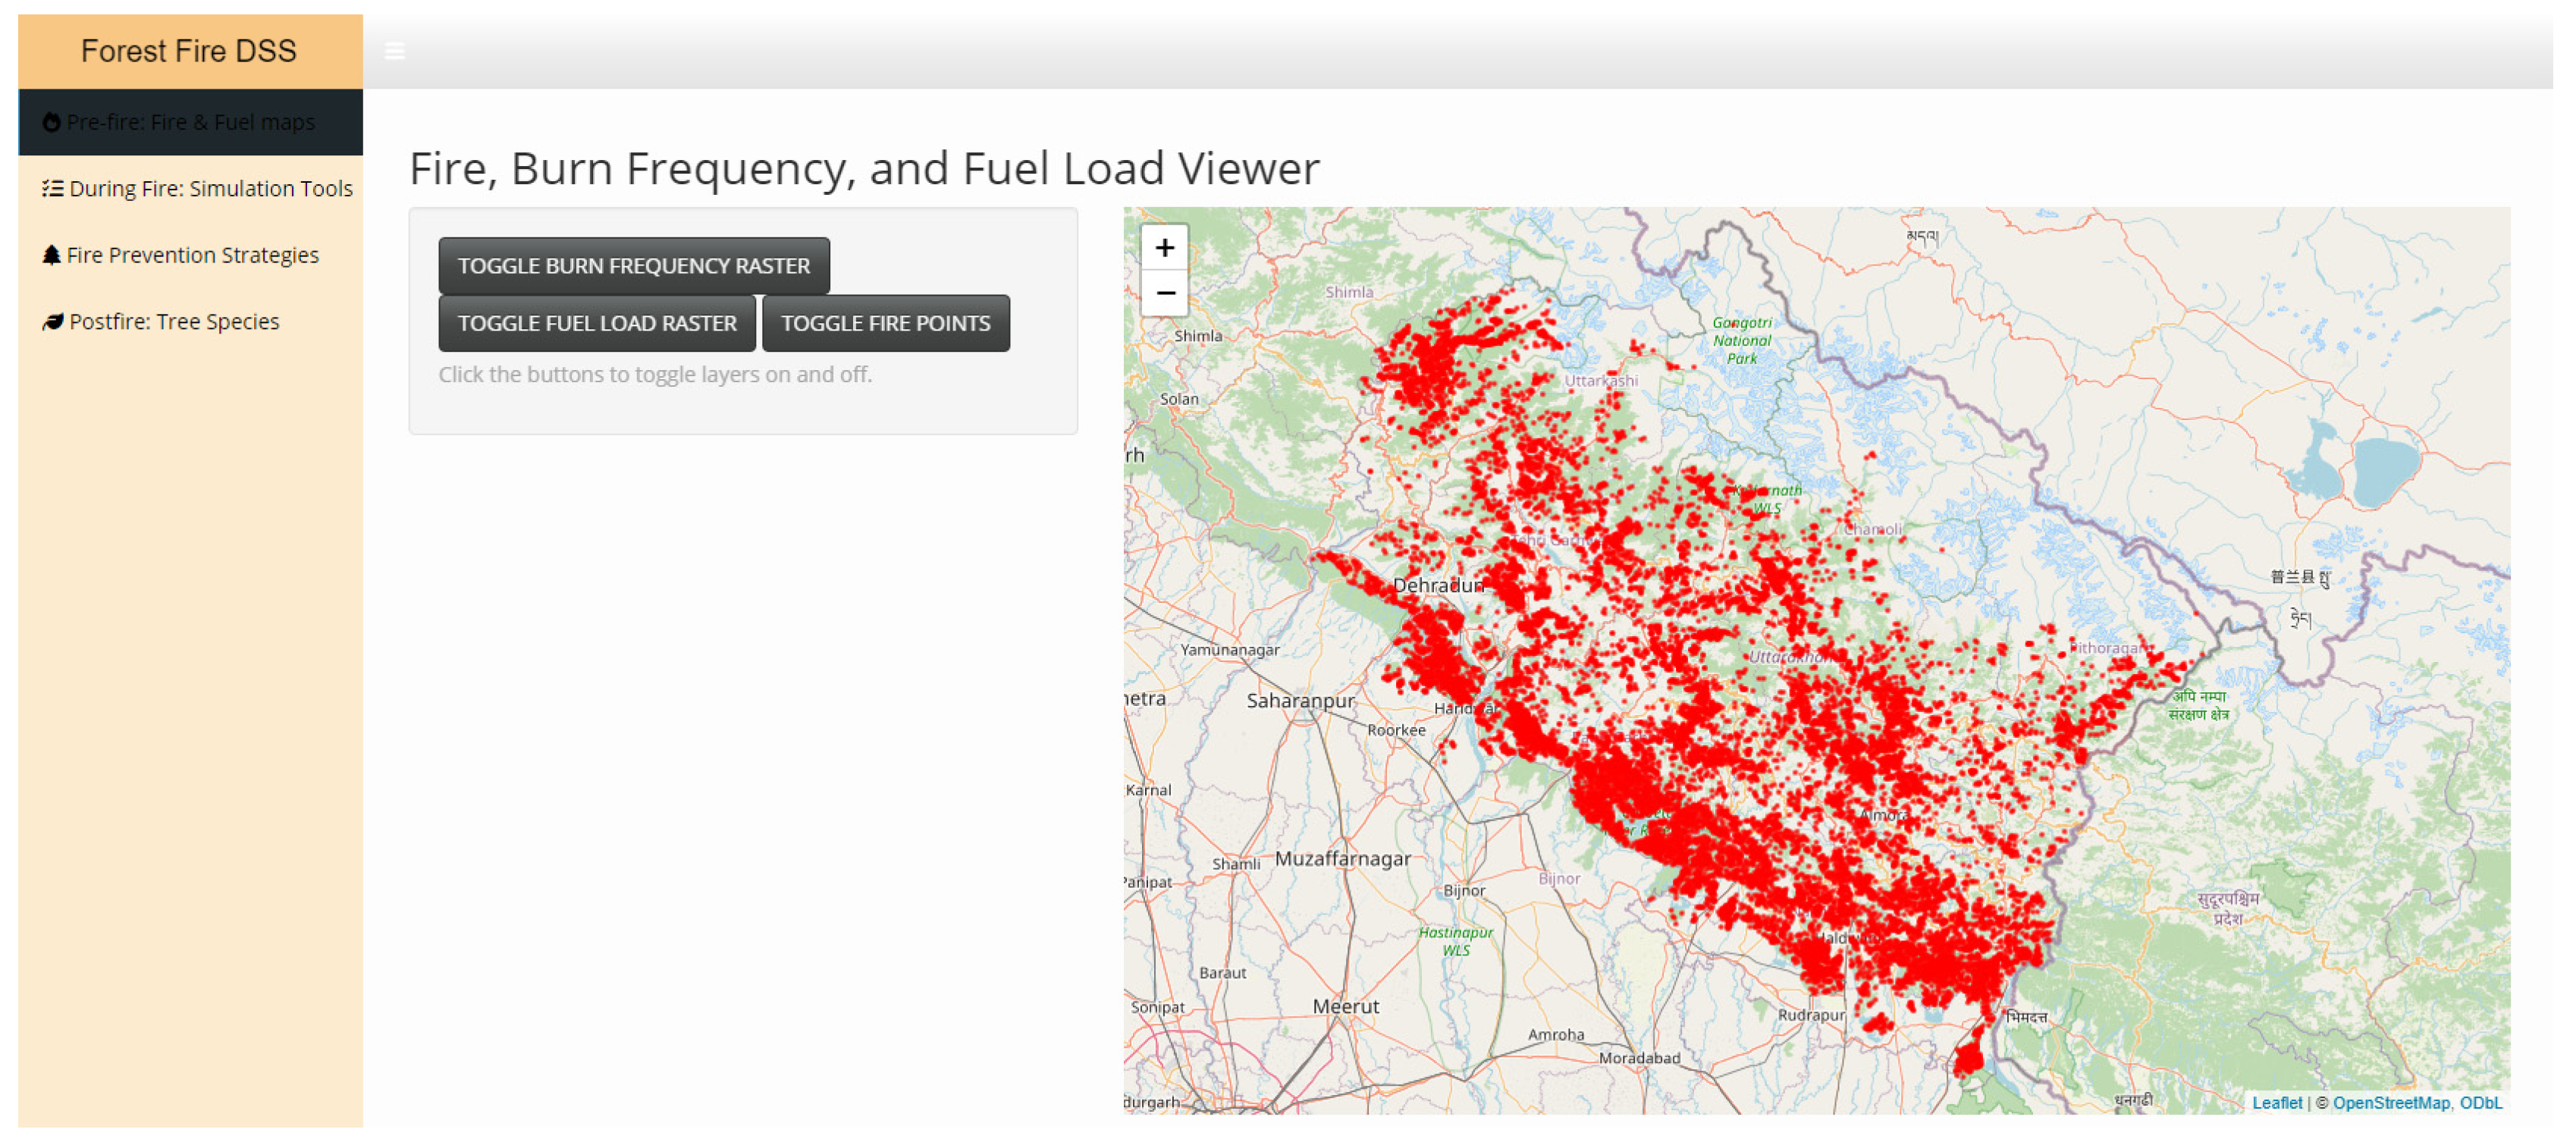
- Wildfire Risk and Fuel Management tools
- Fuel load mapping to identify risk zones;
- Fire burn frequency data for fire regime analysis;
- Fire incident data with which to understand ignition trends seasonally and spatially.
- 2.
- Fire Management tools
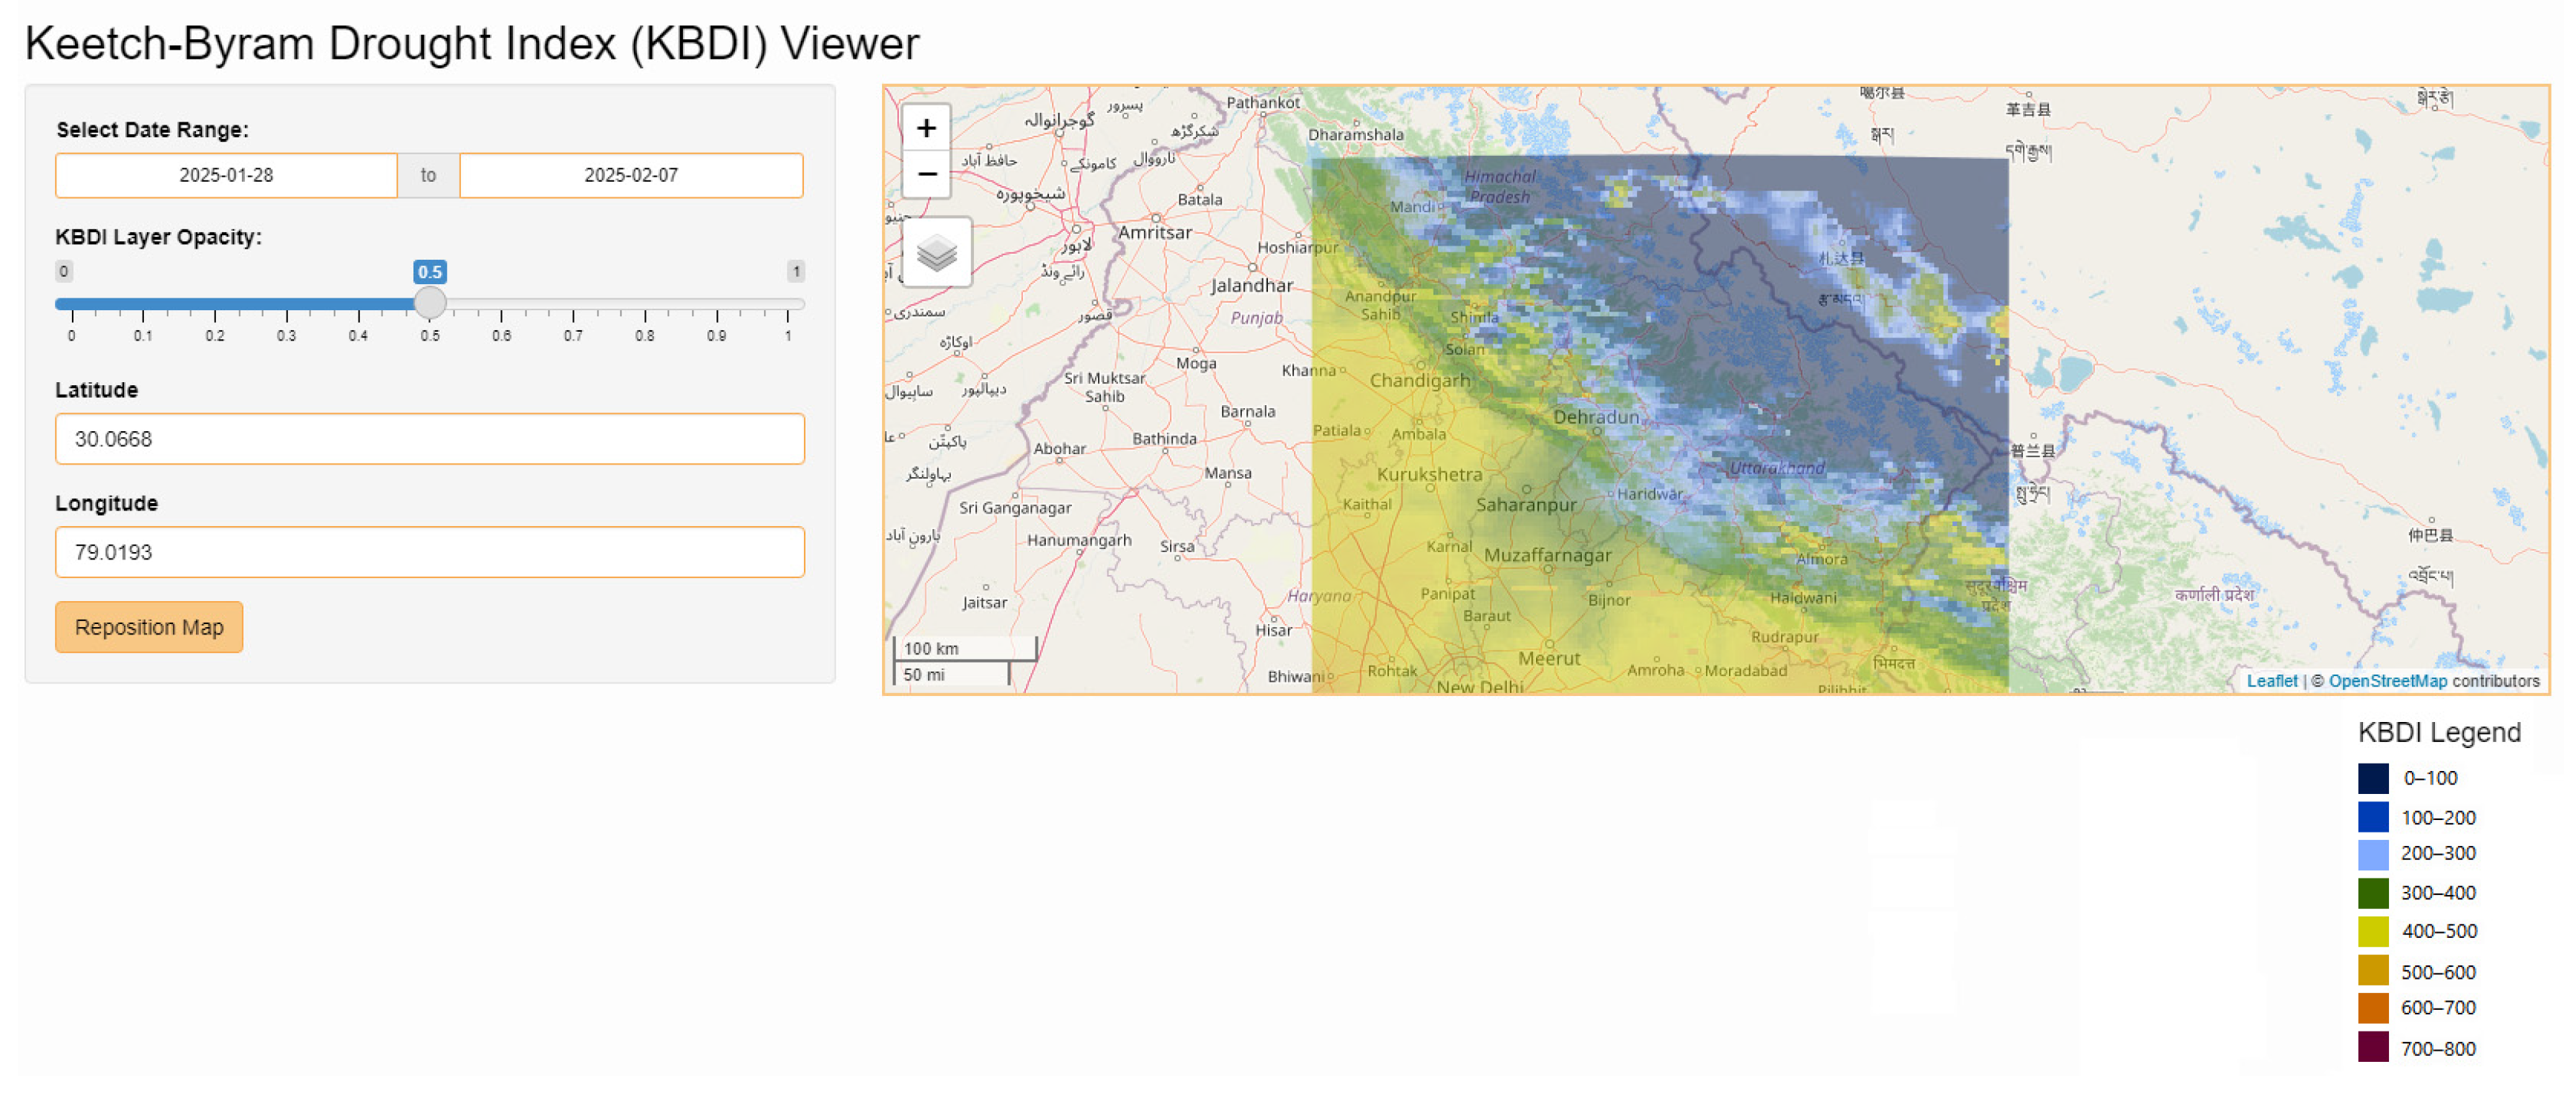
- KBDI viewer for quantifying forest fire risk;
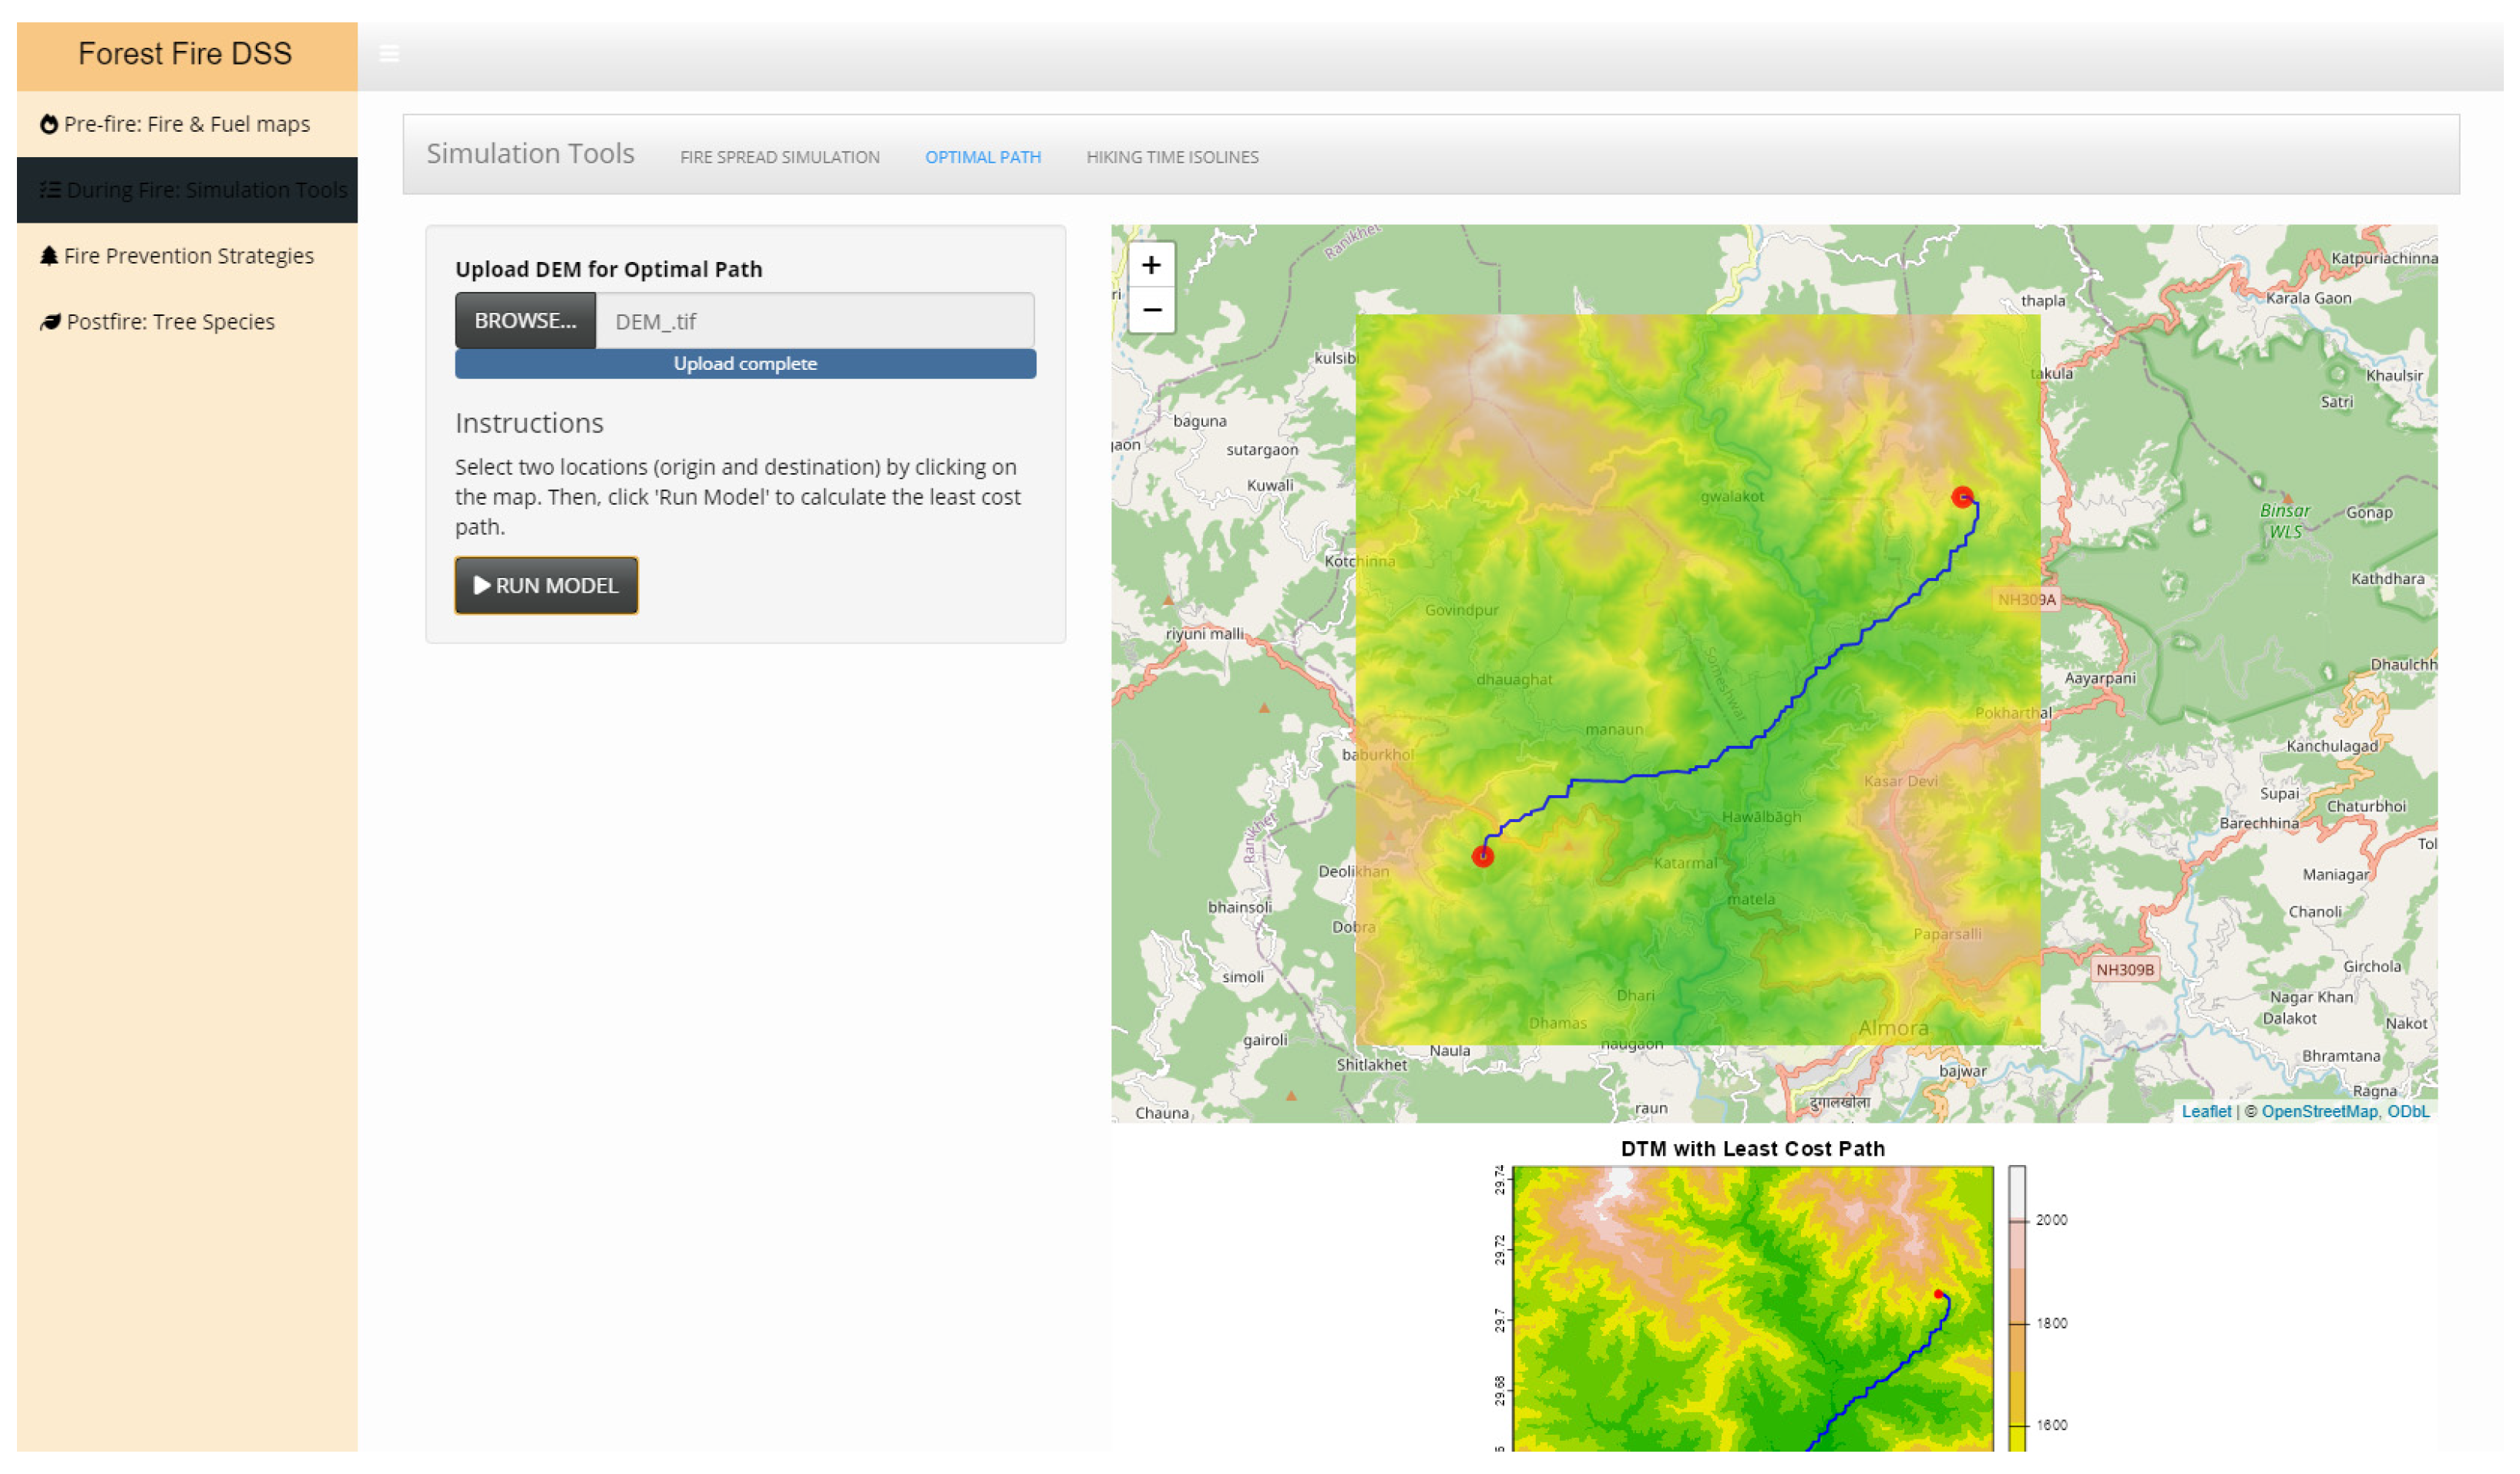
- Optimal path tool for aiding navigation and planning in rugged terrains;
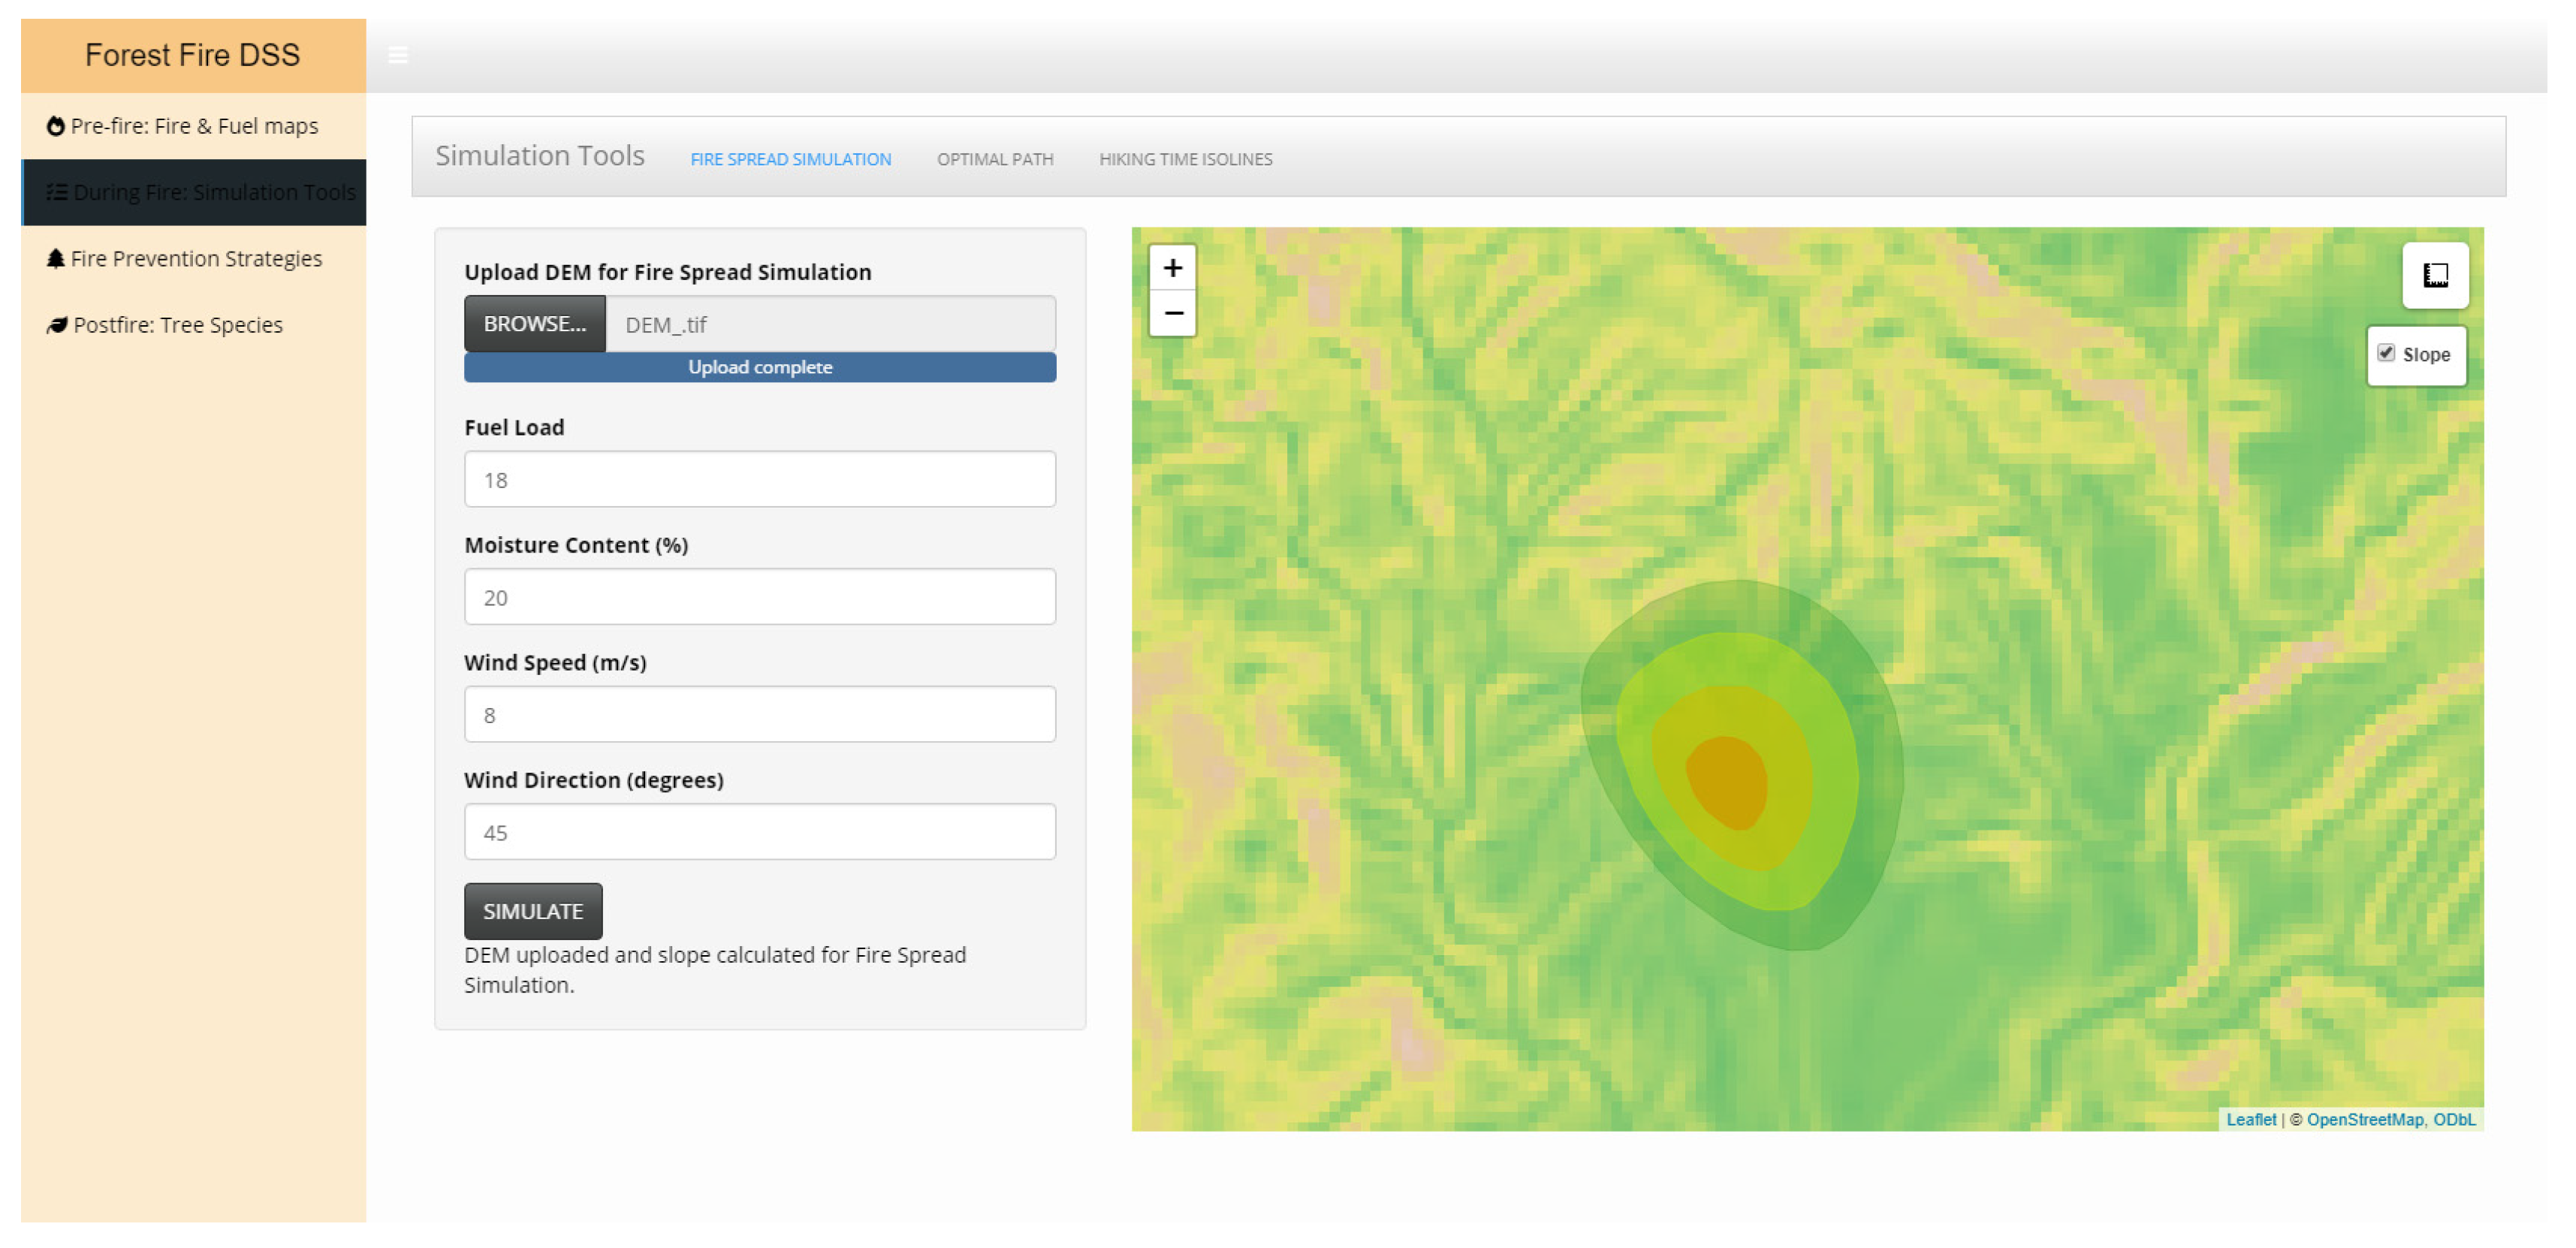
- Rothermel fire spread model for the simplistic visualization of fire spread;
- Walk–hike time isoline tools for optimizing firefighter team deployment.
- 3.
- Post-Fire Restoration and Fire Prevention tools
- The tree selection tool for restoration efforts with fire resilience;
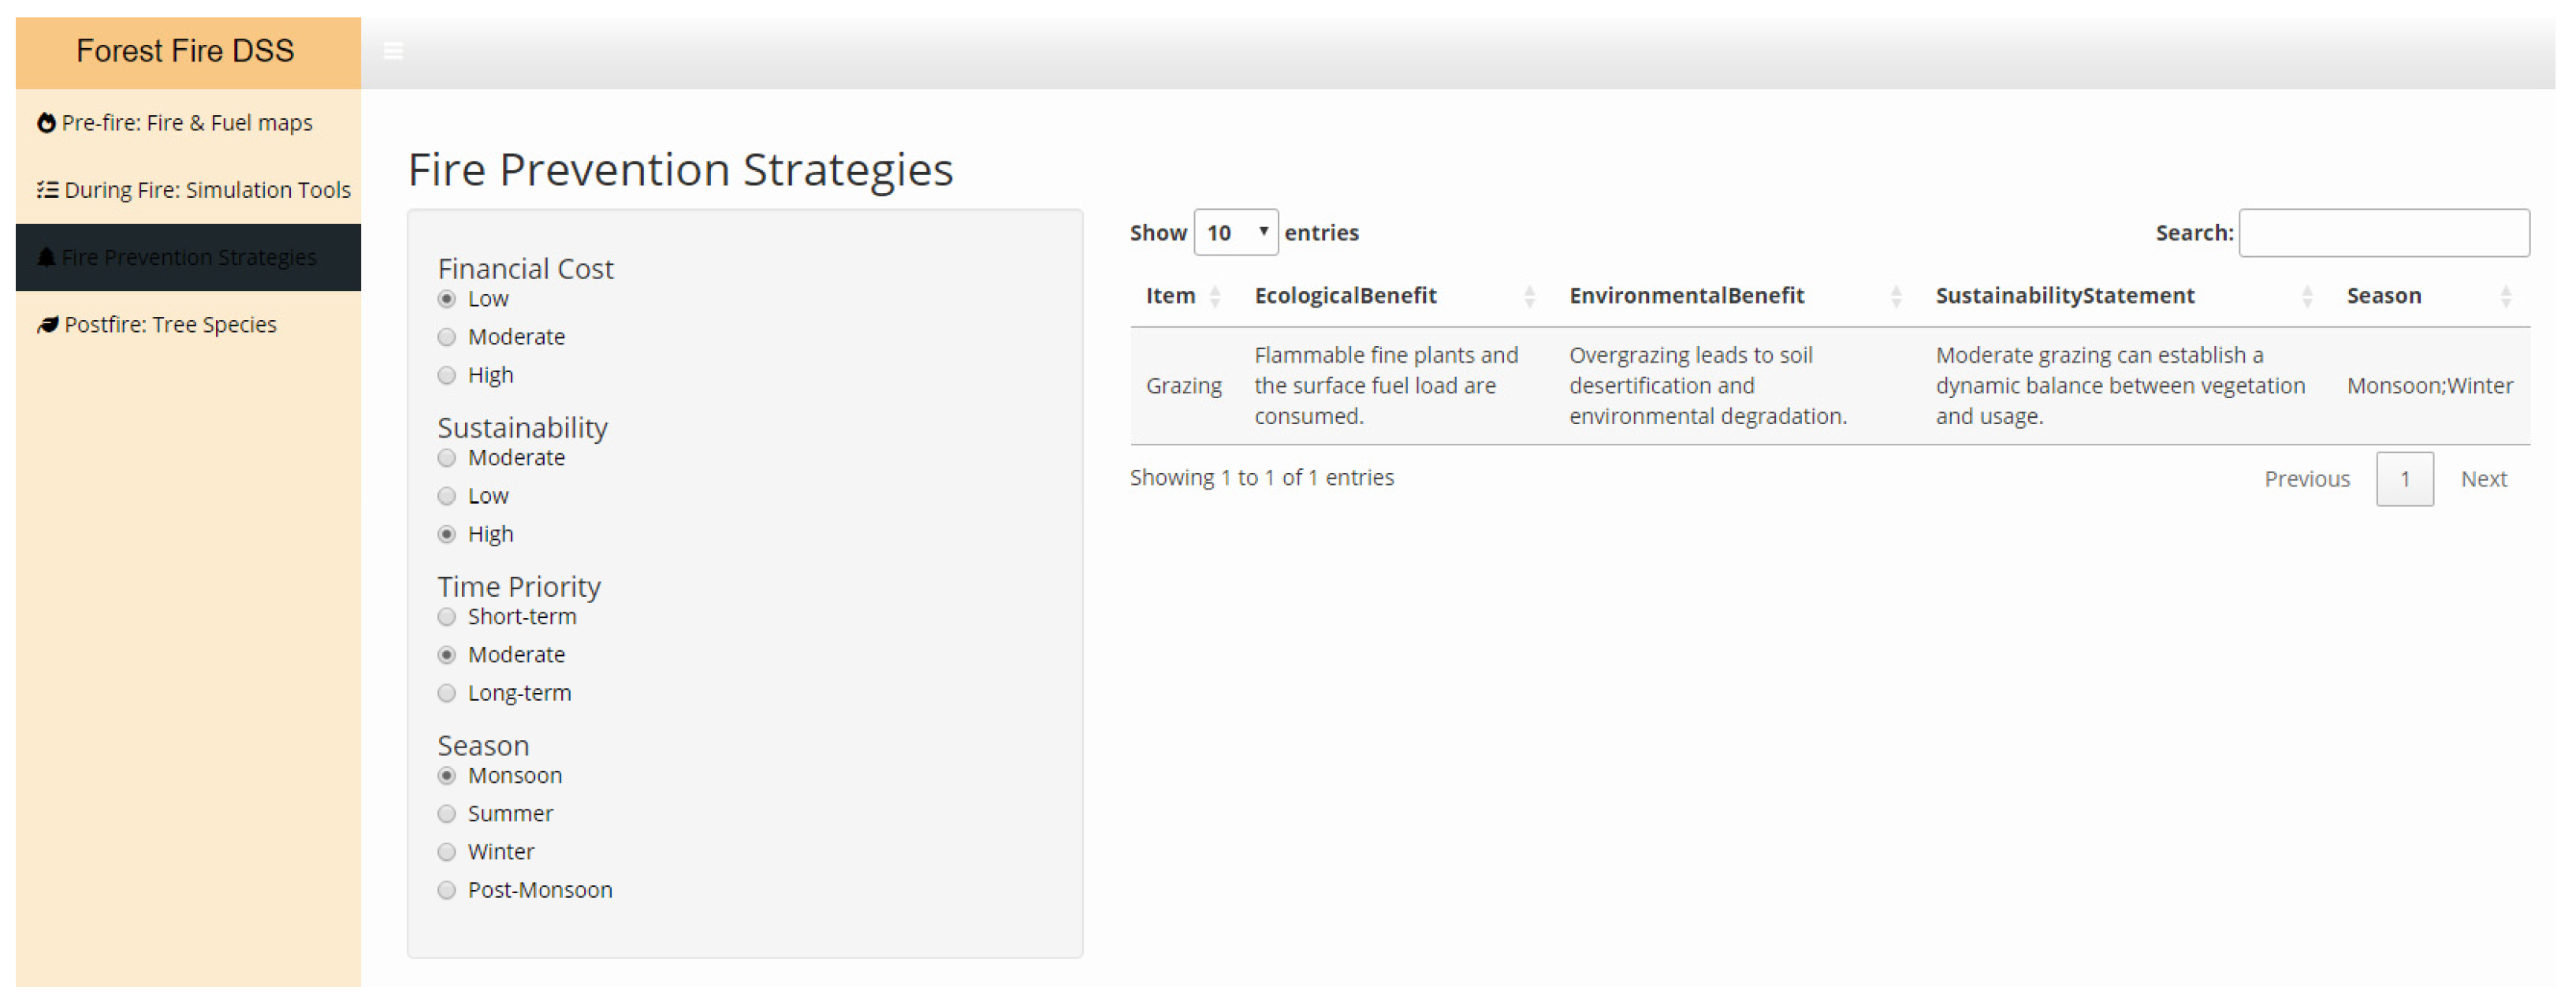
- The fire prevention strategies comparison tool enables science-based mitigation planning.
2. Materials and Methods
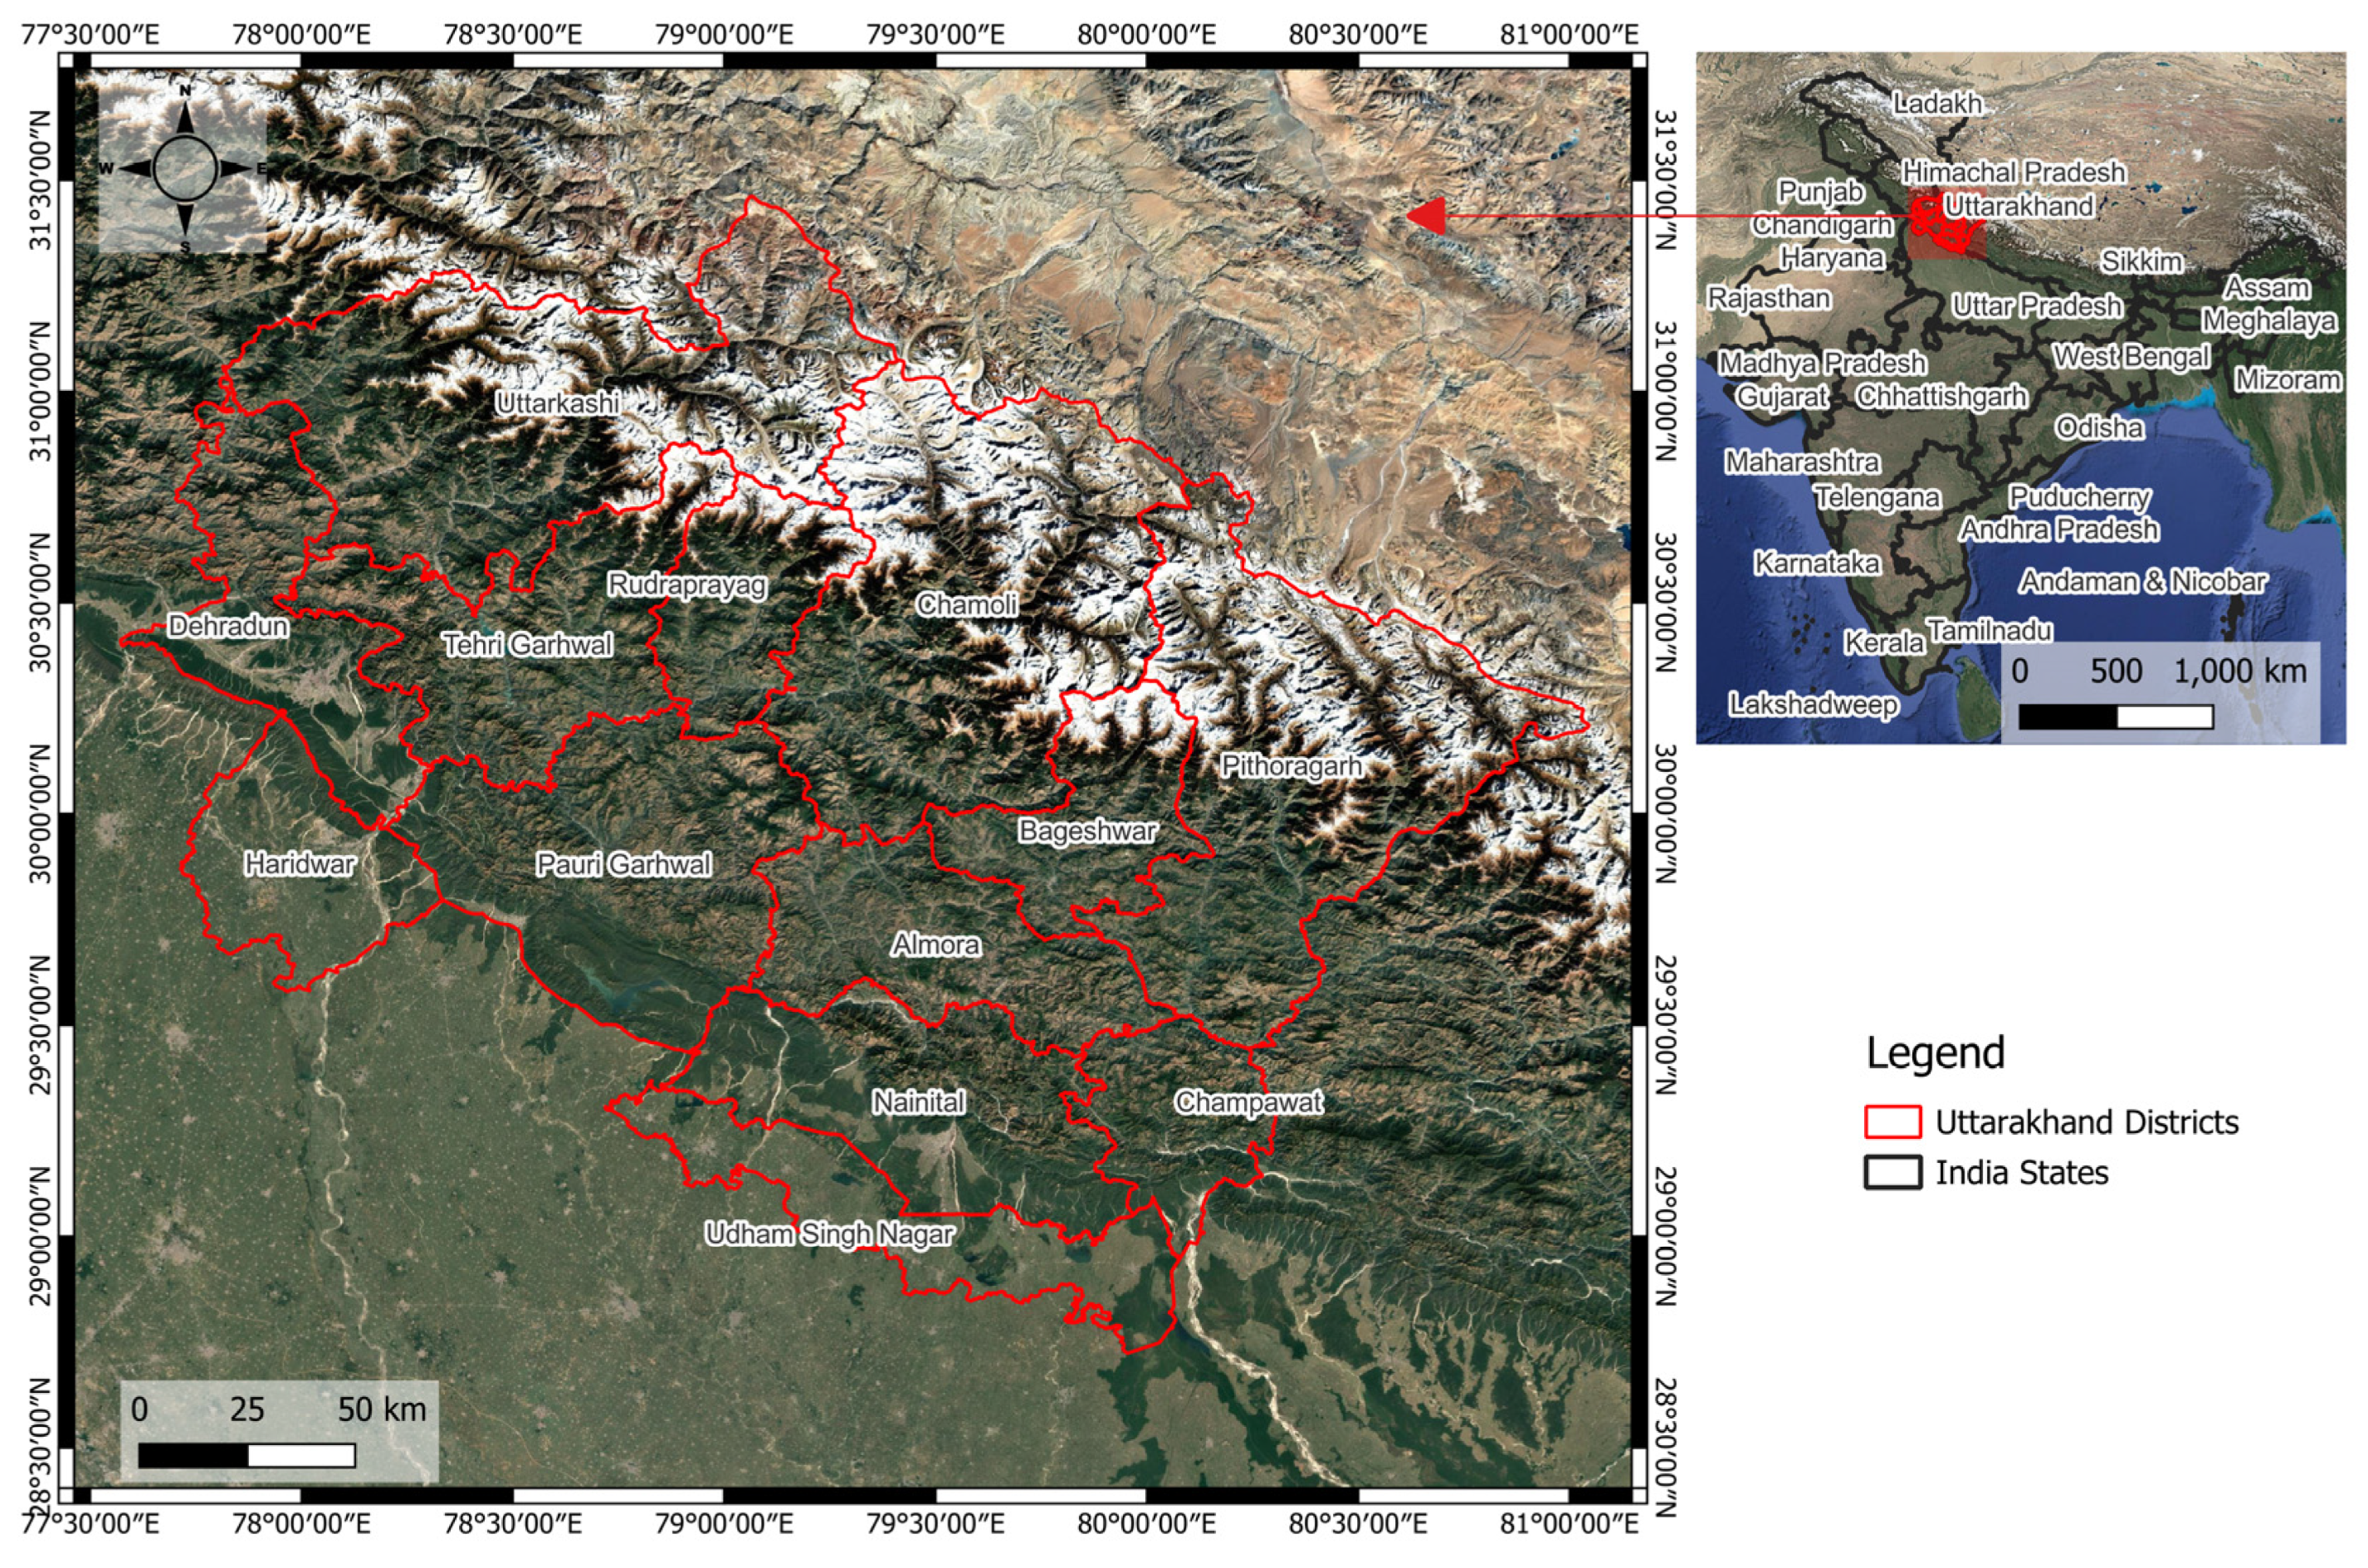
- Pre-fire (visualization) tools: fuel load, fire (burn) frequency, fire incidents, and optimal path and hiking time isoline tools (Area of interest: Uttarakhand, India).
- During-fire spatial decision support tools: Rothermel-based fire spread tool, optimal path tool, and walk–hike time isoline tools (area of interest/sample terrain: Almora, Uttarakhand, India, although the user can use this analysis on any digital elevation model file).
- Post-fire planning information tools: tree selection tool for the comparison of restoration and ecological fire prevention techniques (area of interest: Uttarakhand, India).
2.1. Fuel Load Estimations
2.2. Rothermel-Based Spatial Fire Spread
2.3. Fire (Burn) Frequency
2.4. Optimal Path Tool
2.5. Walk–Hike Time Isoline Tool
2.6. Visualization Layers and Statistical Analysis
2.7. Post-Fire Restoration Tree Selection Tool and Comparison of Fire Prevention Strategies
3. Results
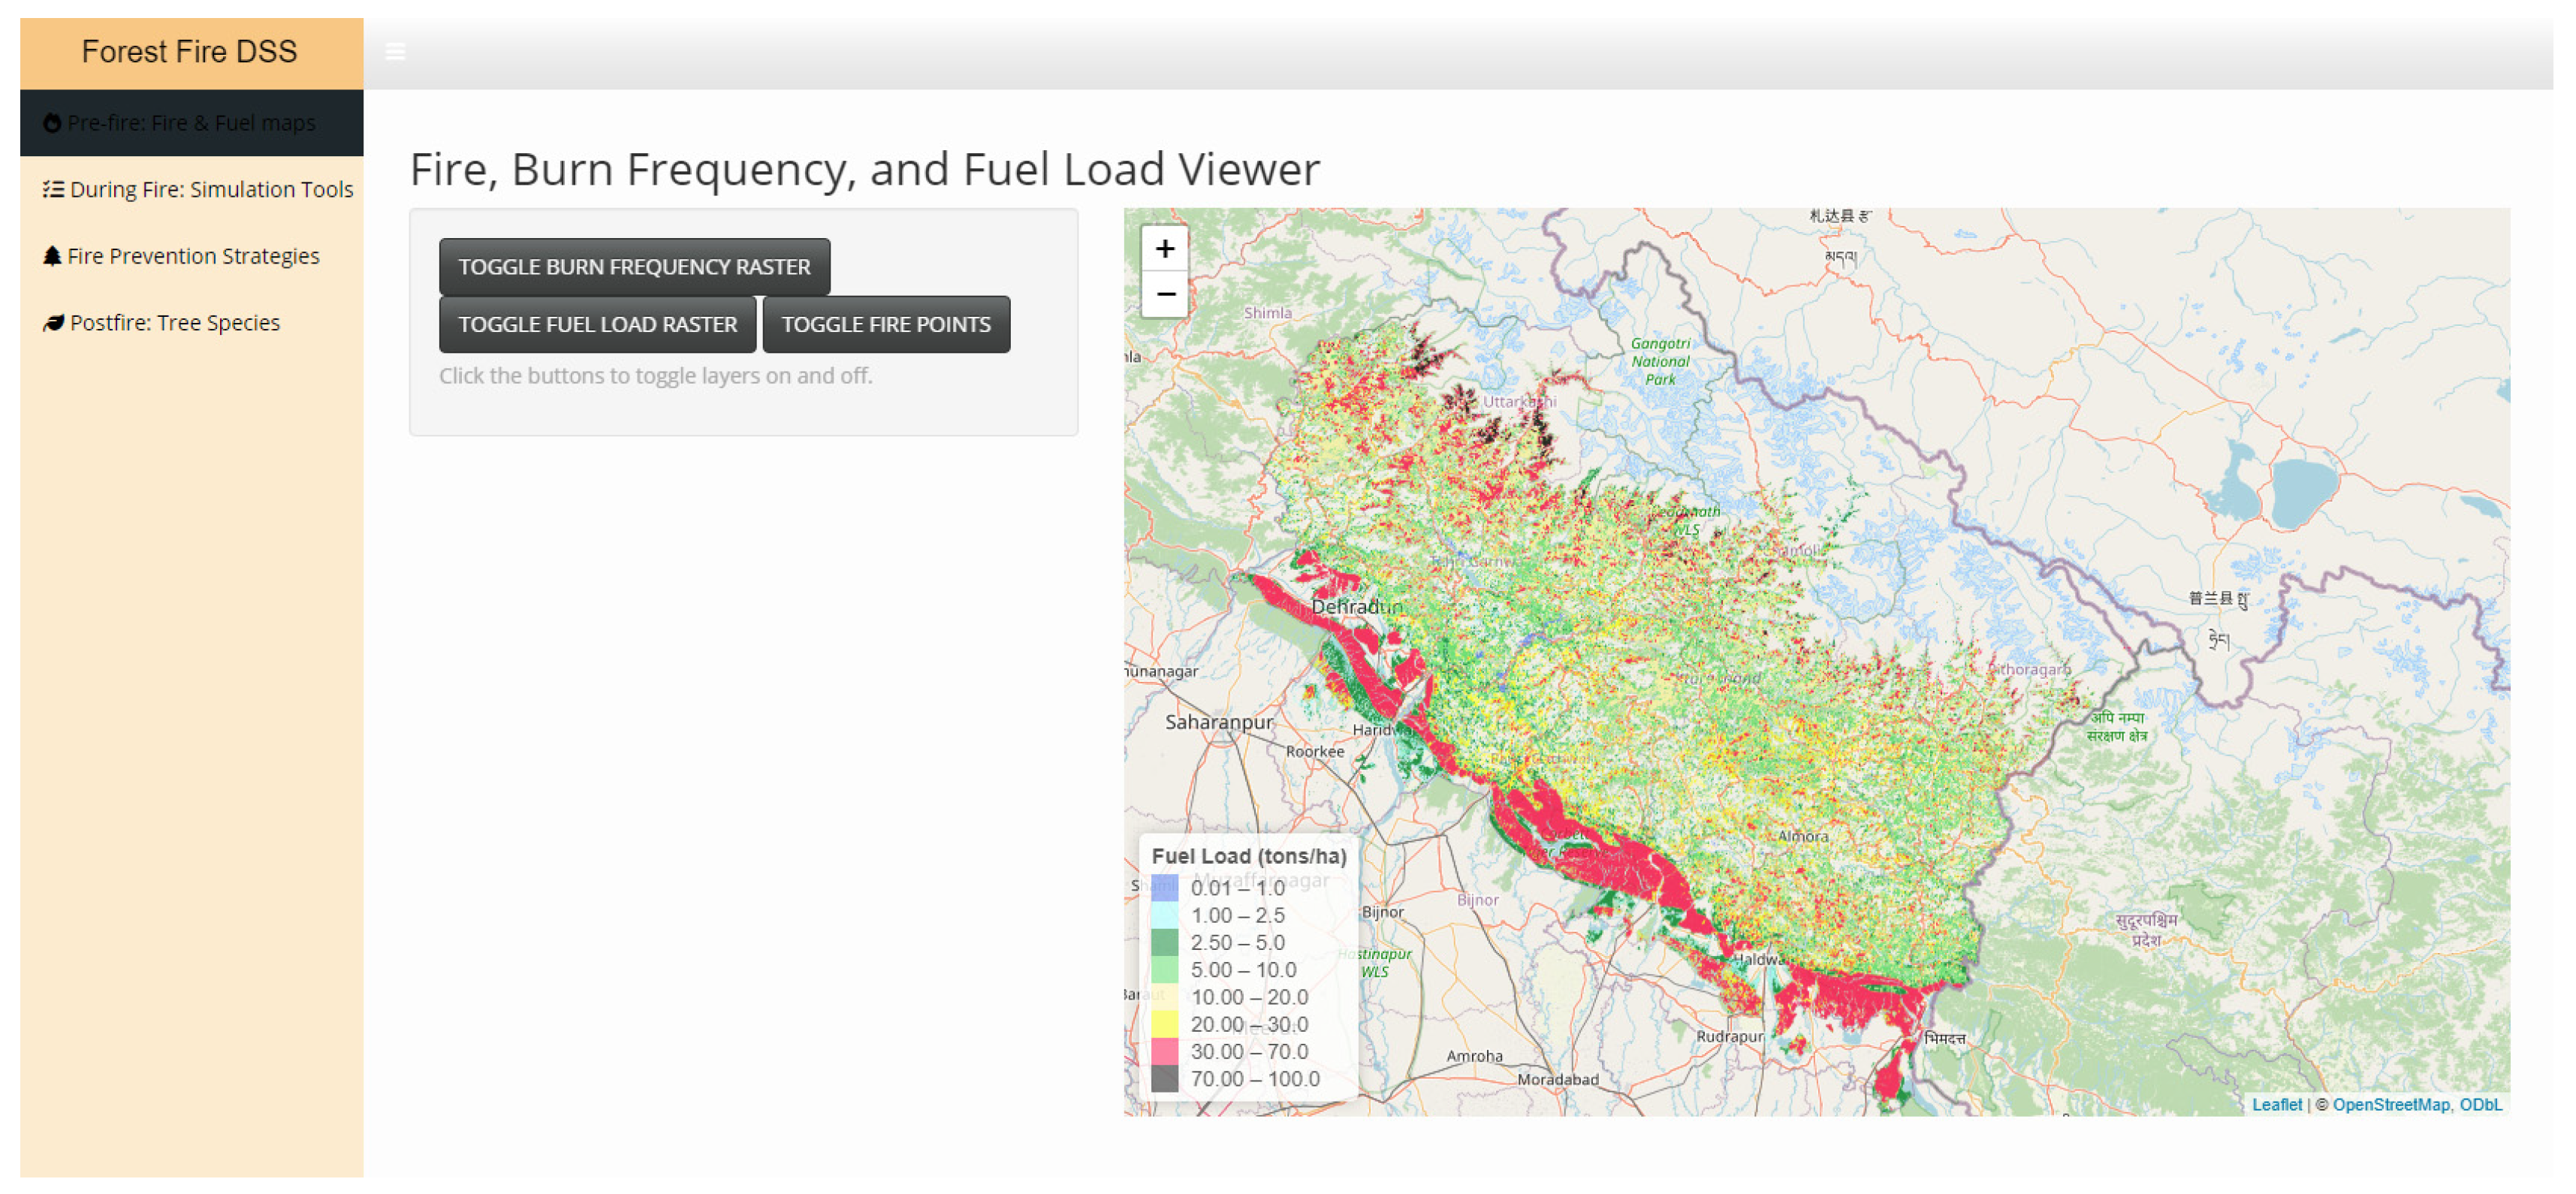
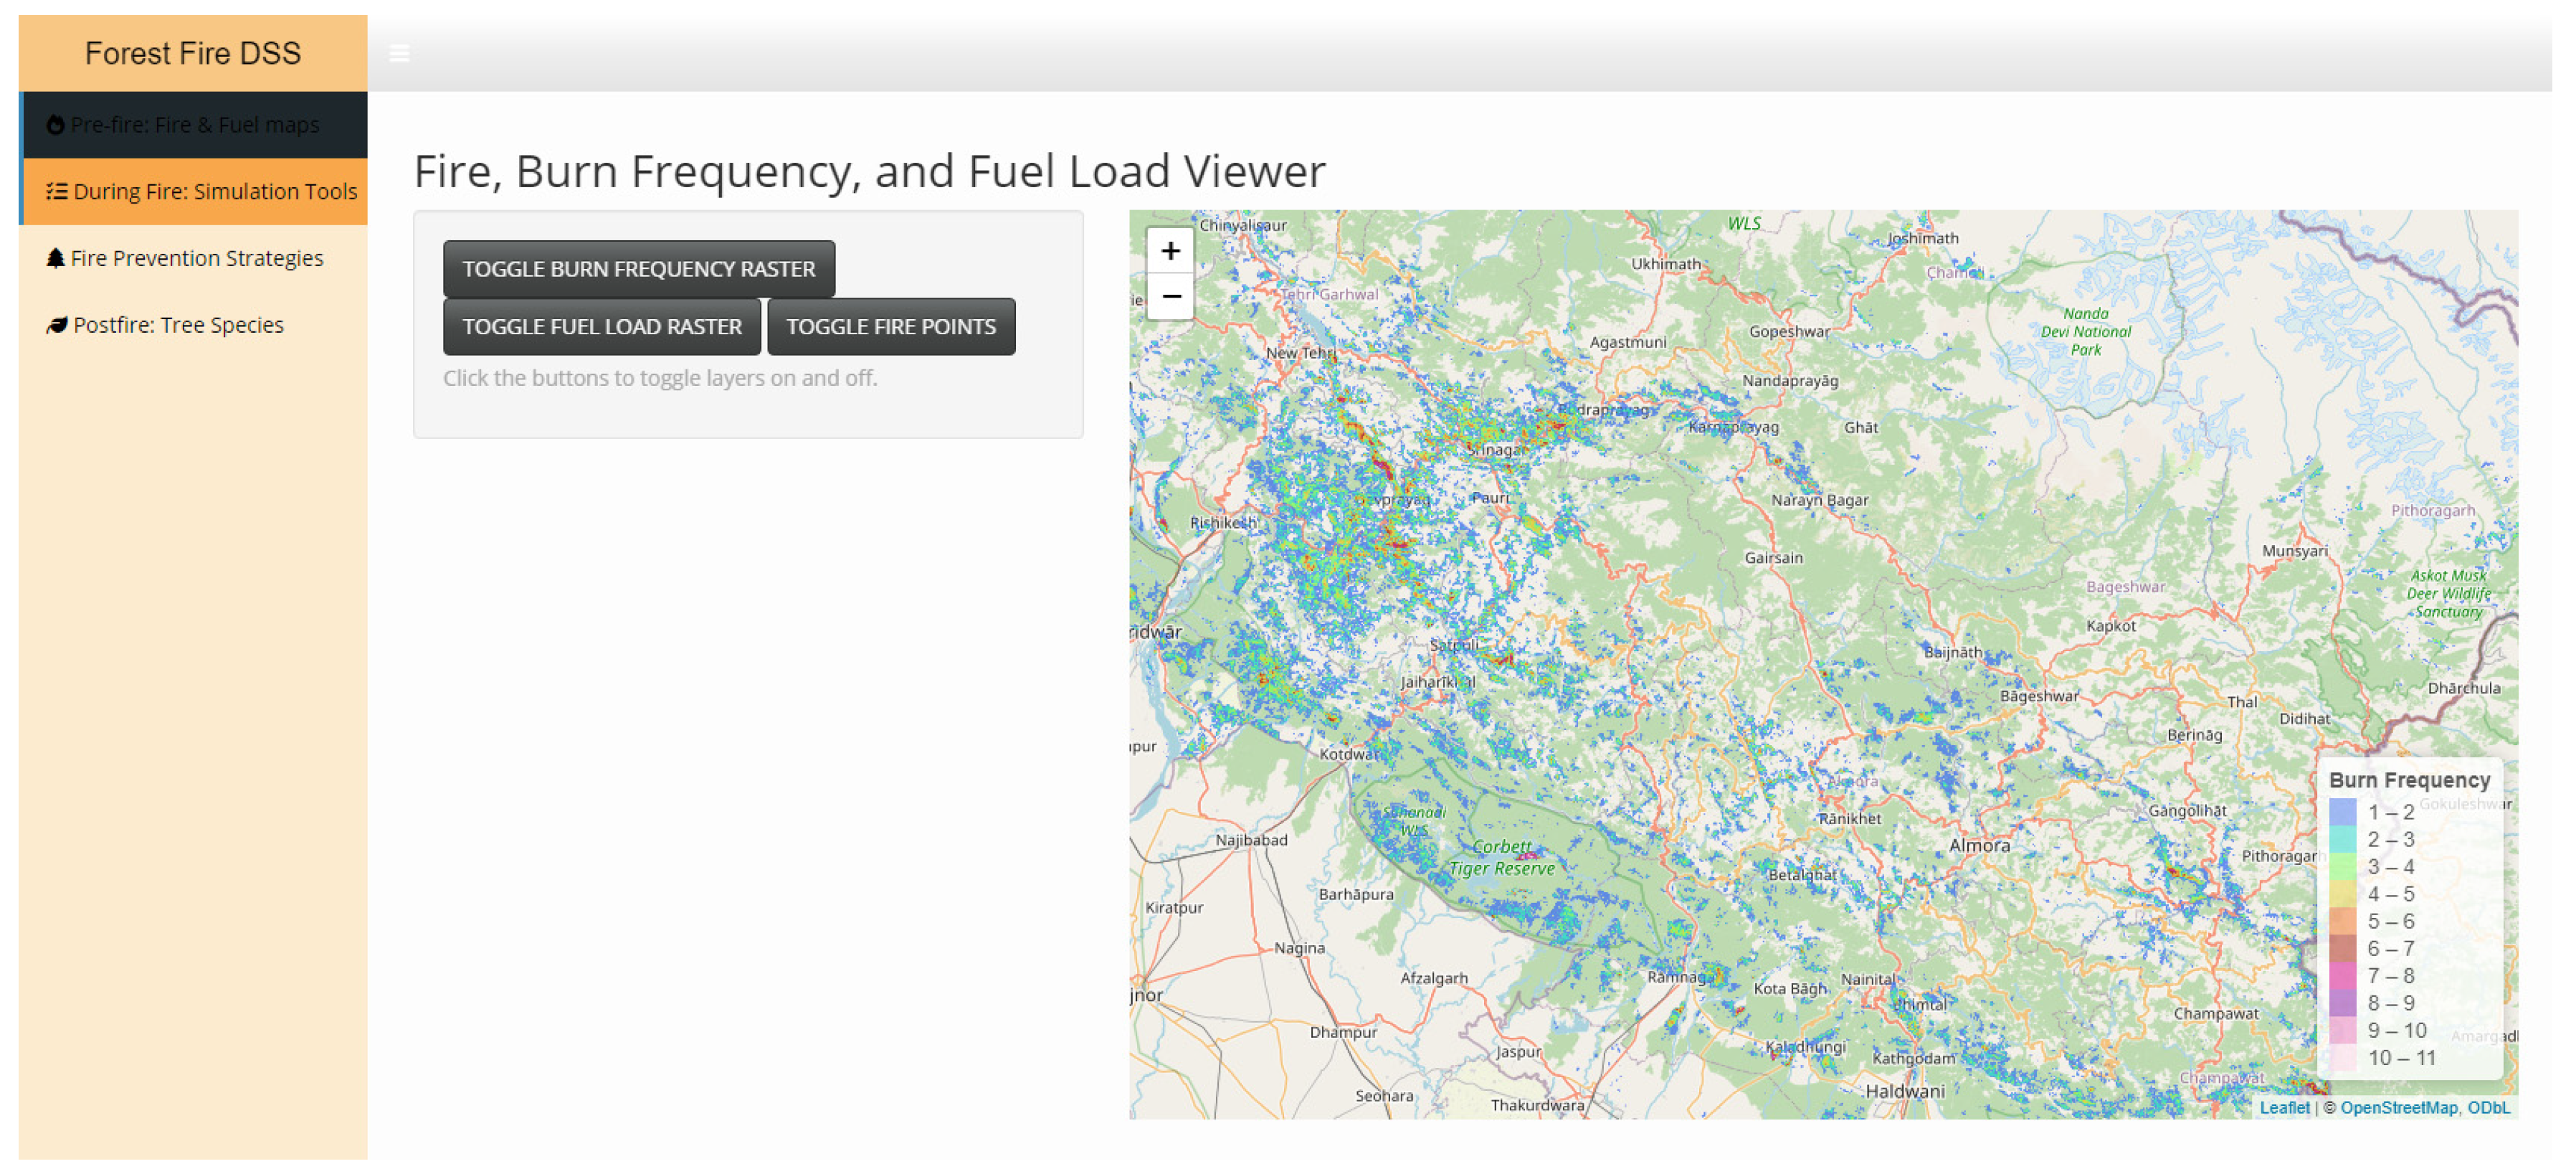
3.1. Spatial Maps Visualization
3.2. Rothermel-Based Fire Spread Simulation Tool
3.3. Optimal Path Tool Utility
3.4. The Benefits of the Walk–Hike Time Isoline Tool
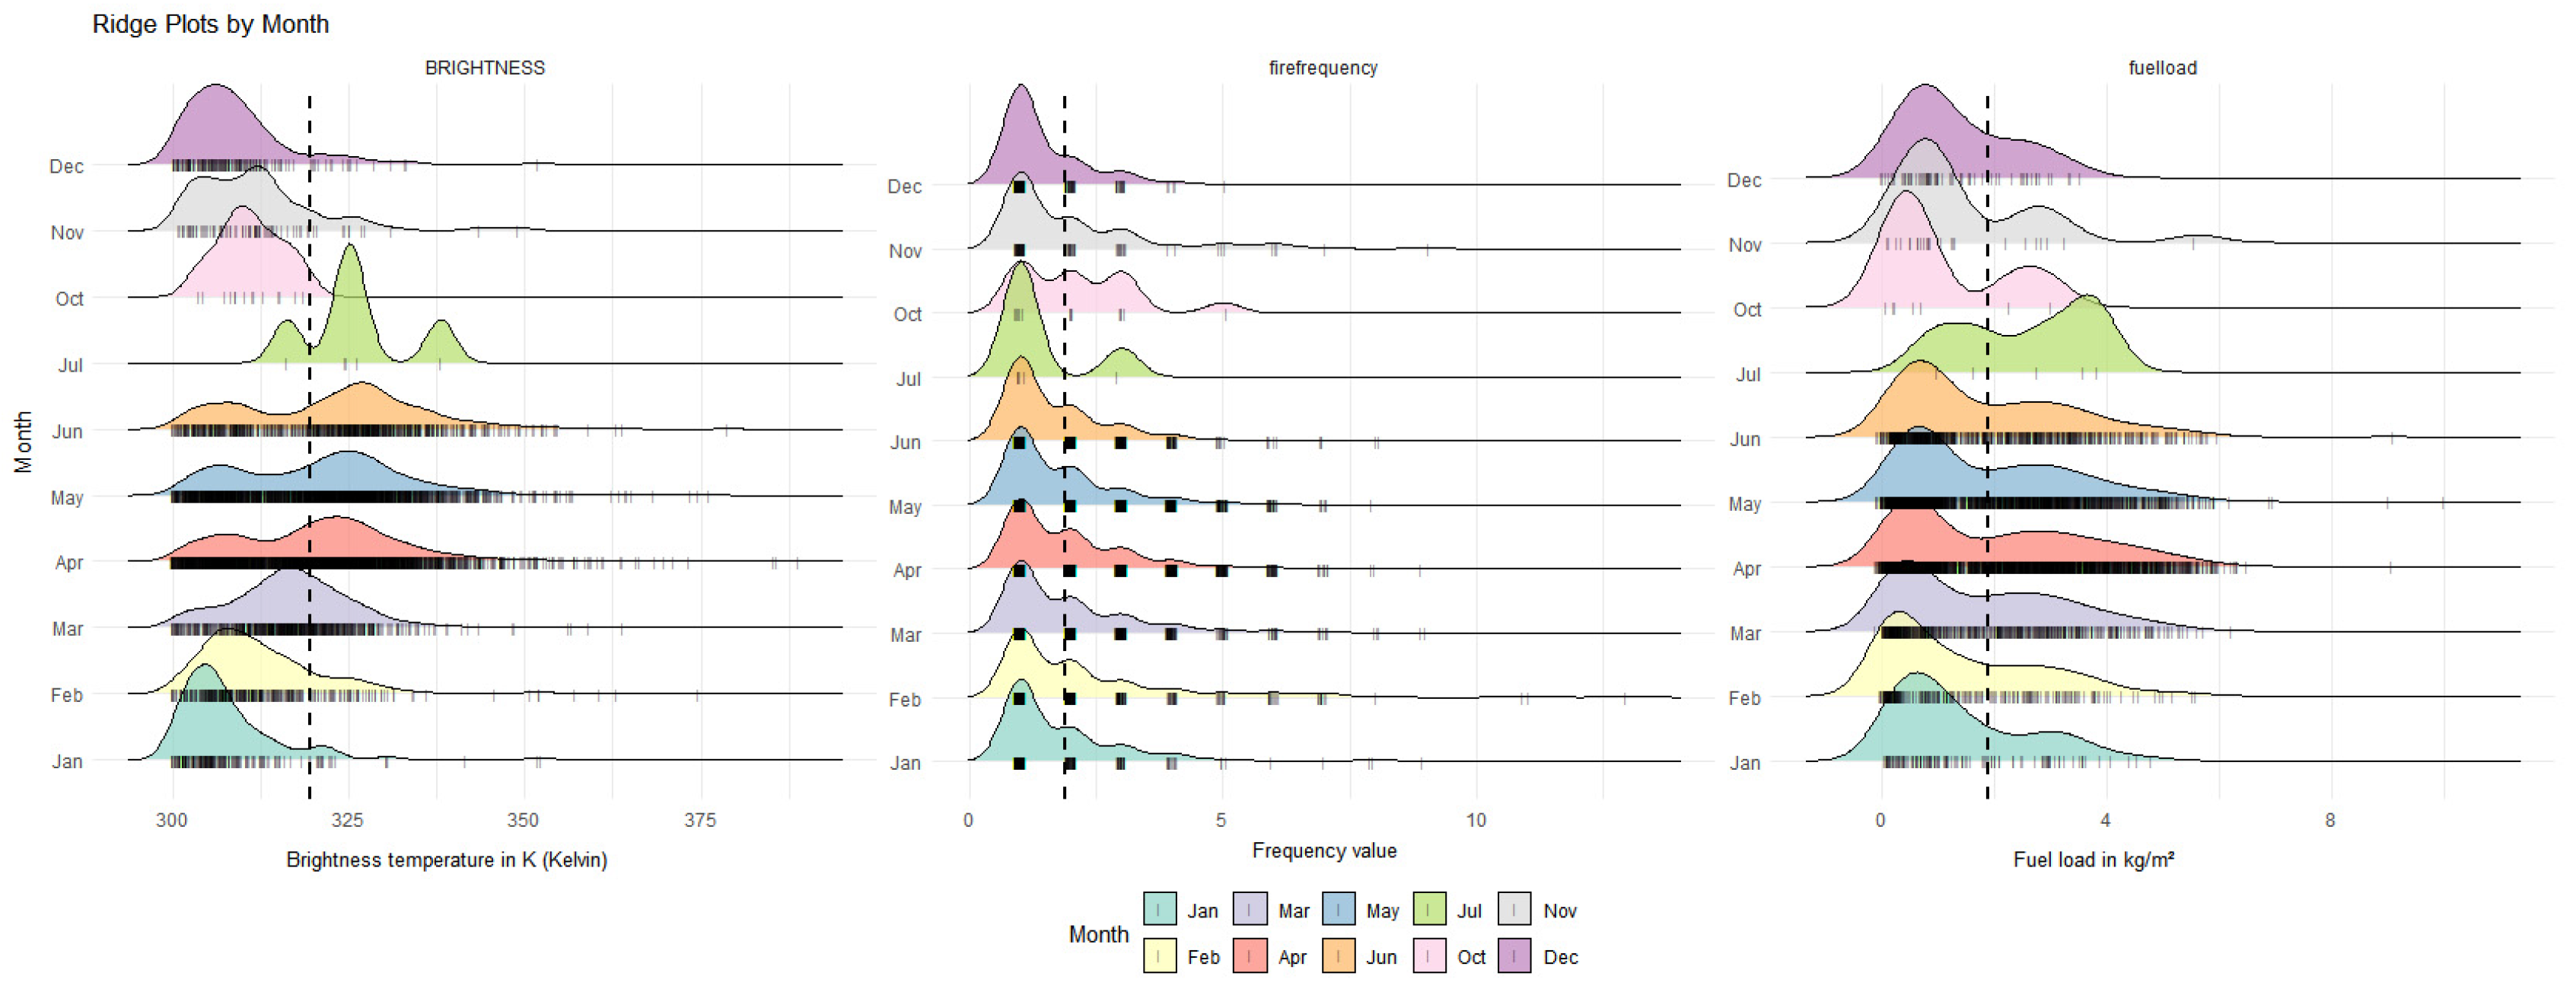
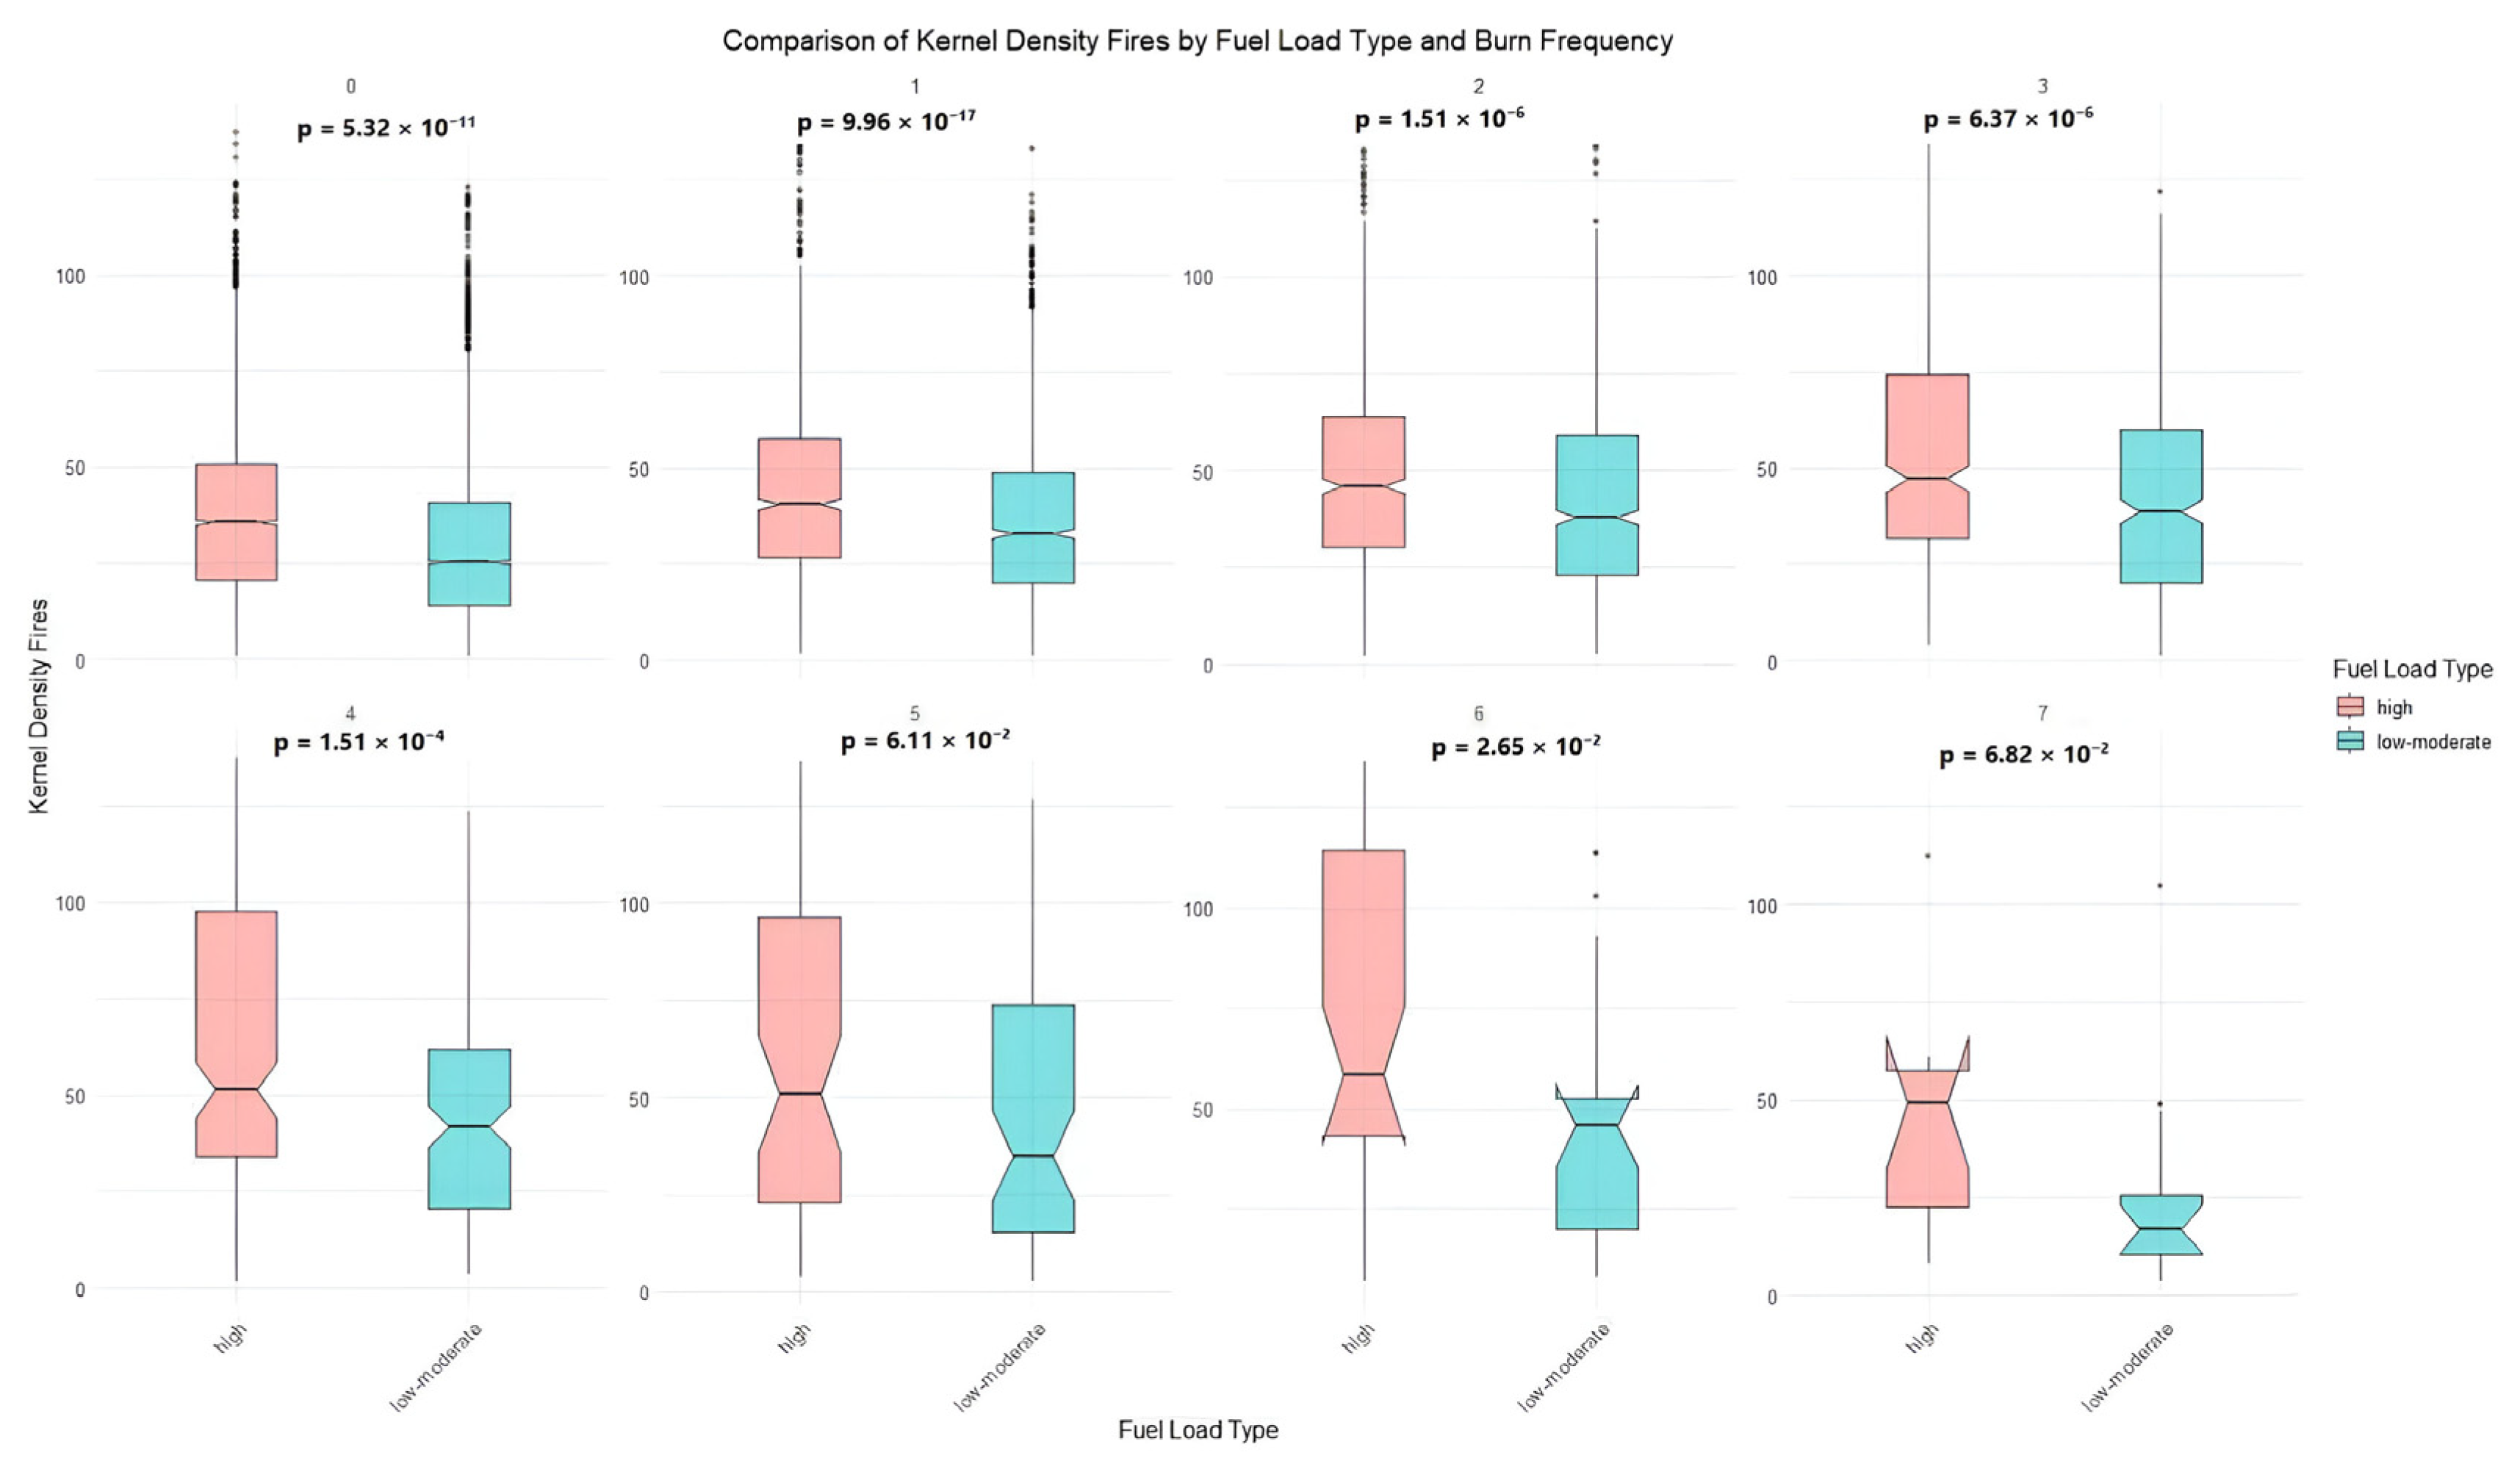
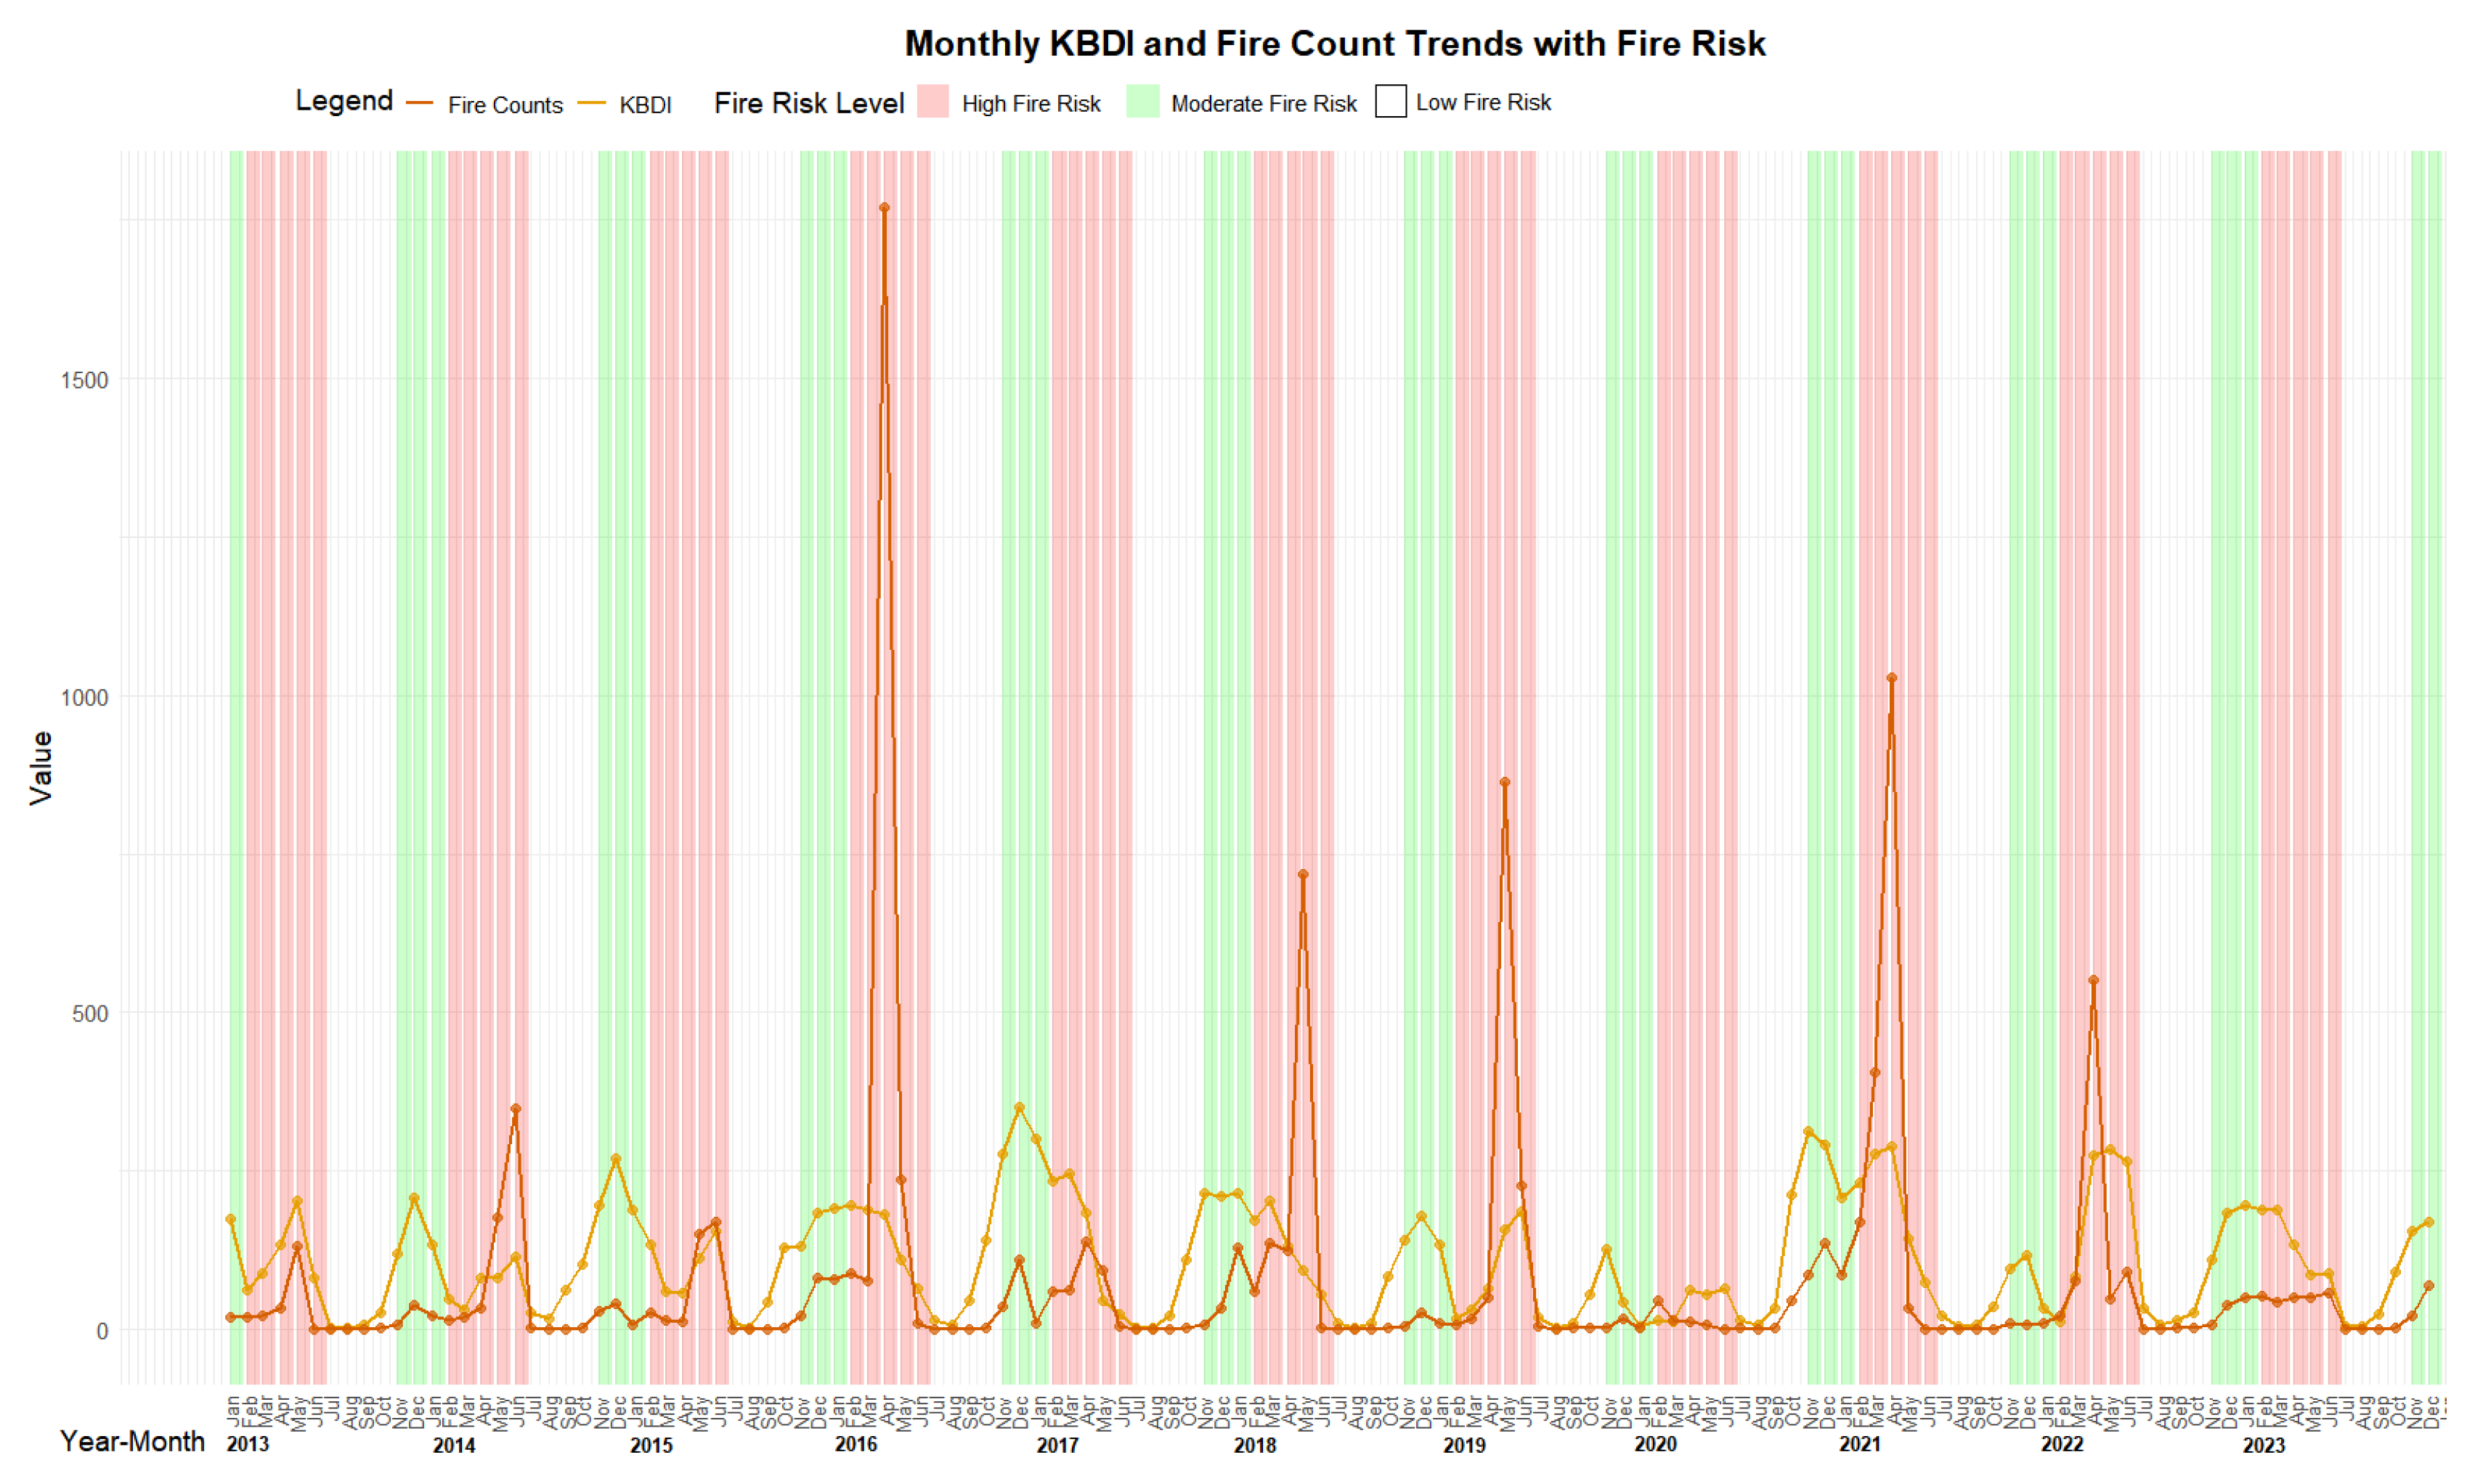
3.5. Statistical Analysis
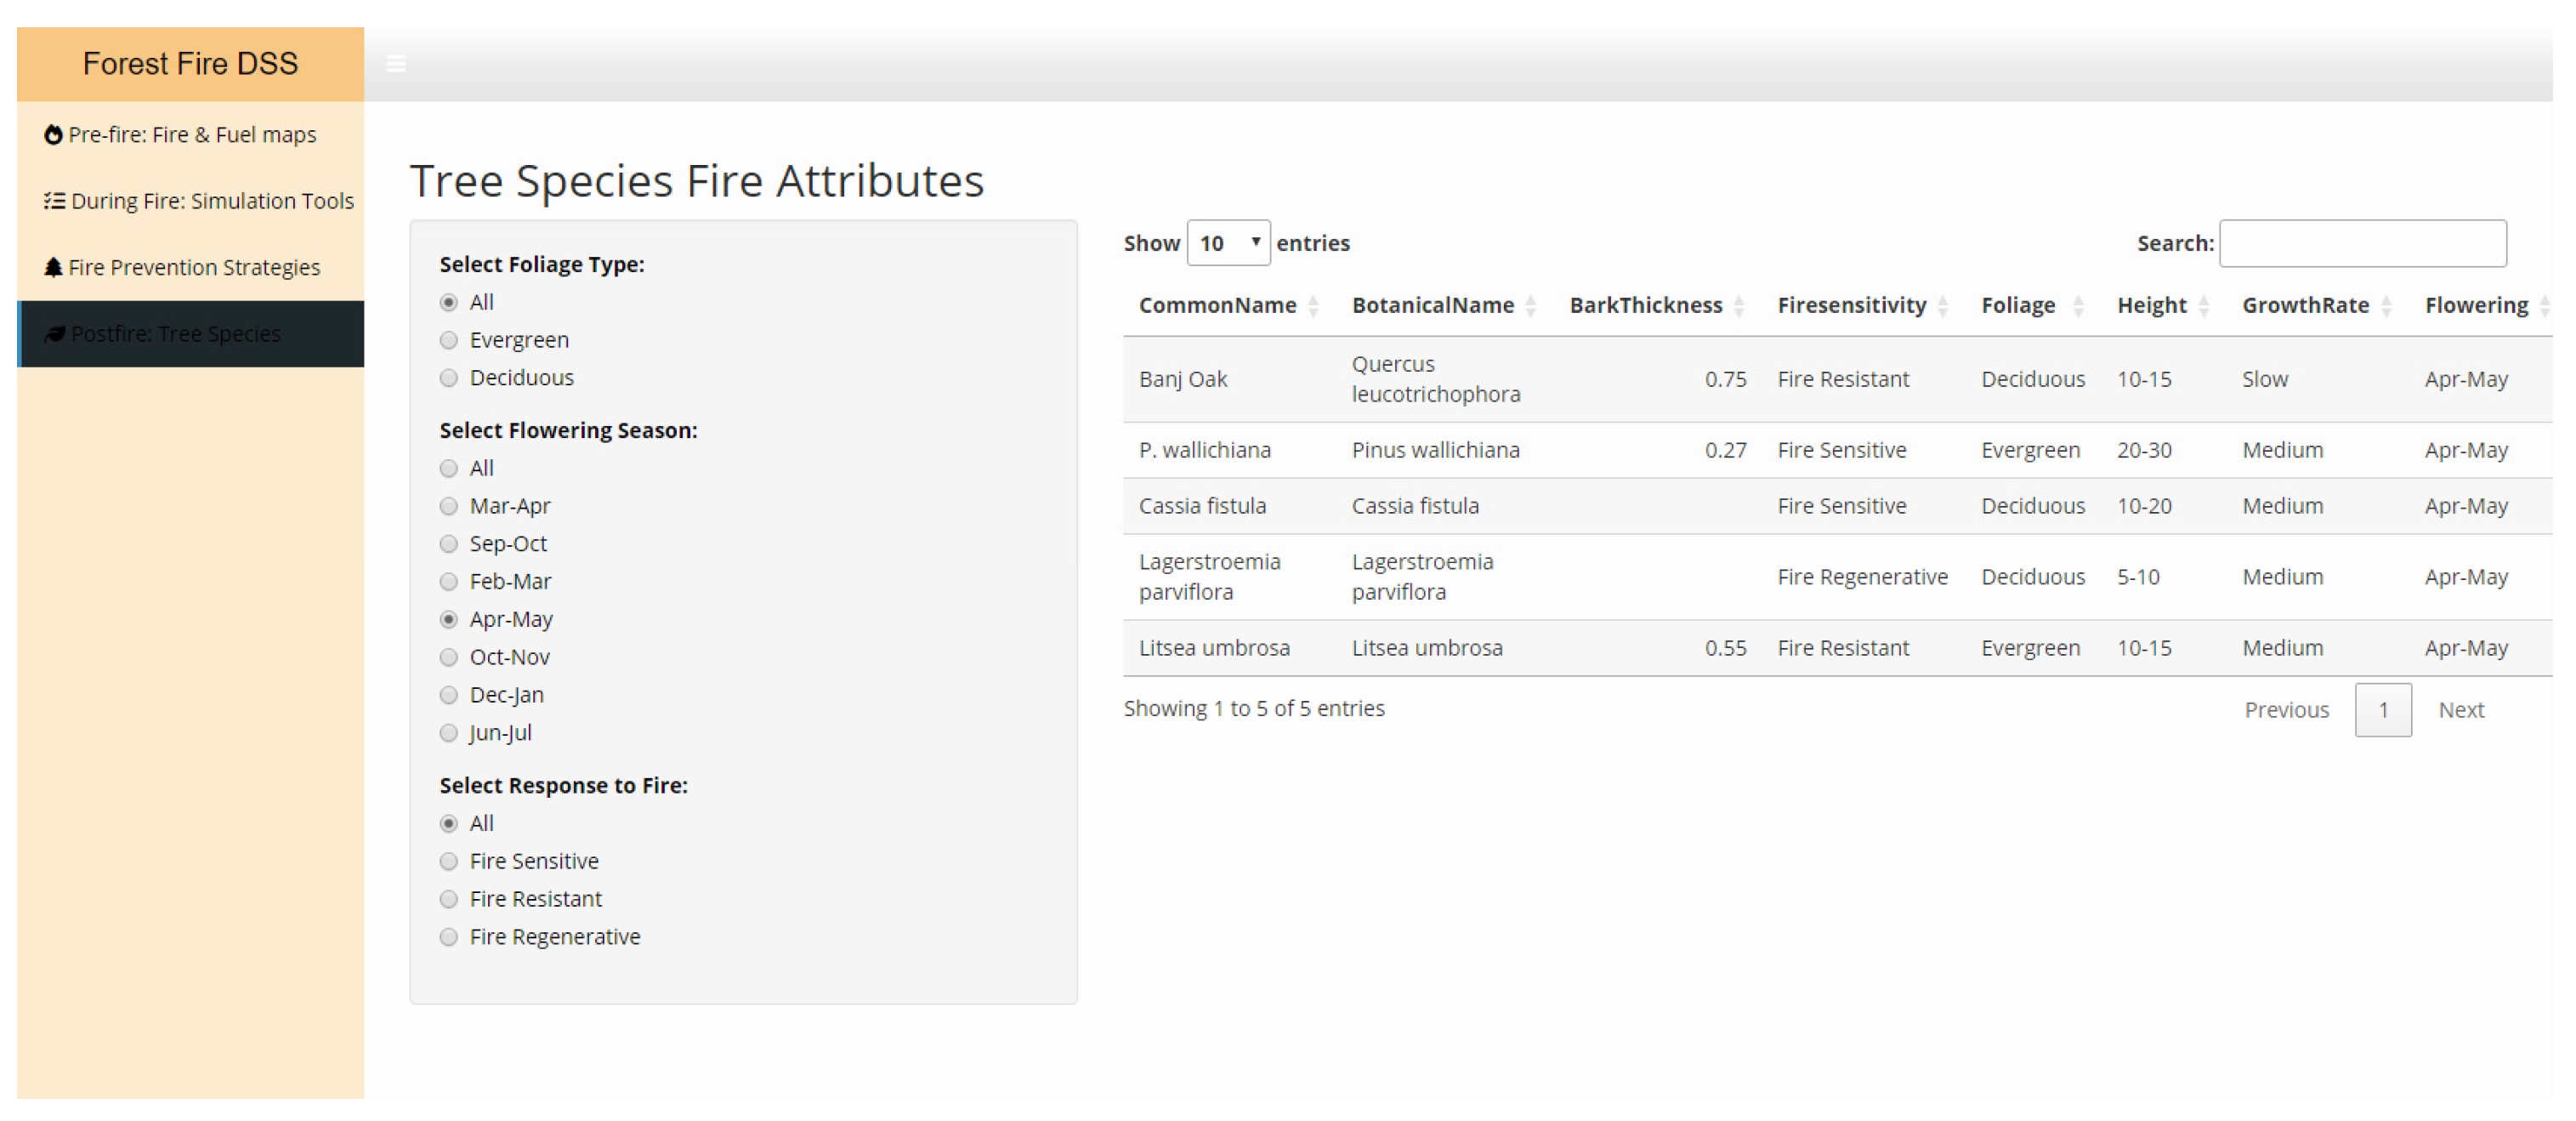
3.6. Tree Selection Tool for Restoration (Post-Fire) and Fire Prevention Strategies Comparison Tabs
4. Discussion
5. Conclusions
Author Contributions
Funding
Data Availability Statement
Conflicts of Interest
Abbreviations
References
- Colavito, M. The human dimensions of spatial, pre-wildfire planning decision support systems: A review of barriers, facilitators, and recommendations. Forests 2021, 12, 483. [Google Scholar] [CrossRef]
- Rodríguez Trejo, D.A.; Martínez Muñoz, P.; Pulido Luna, J.A.; Martínez Lara, P.J.; Cruz López, J.D. Combustibles, comportamiento del fuego y emisiones en un pastizal y una sabana artificiales en Chiapas. Rev. Biol. Trop. 2020, 68, 641–654. [Google Scholar]
- Lee, B.S.; Alexander, M.E.; Hawkes, B.C.; Lynham, T.J.; Stocks, B.J.; Englefield, P. Information systems in support of wildland fire management decision making in Canada. Comput. Electron. Agric. 2002, 37, 185–198. [Google Scholar]
- Cardenas, M.E.; Vázquez, J.C.; Castillo, J.J.; Villena Ruiz, S. Sistema de predicción de incendios forestales basado en el índice FWI para la provincia de Córdoba. In Proceedings of the XV Workshop de Investigadores en Ciencias de la Computación, Lima, Peru, 21–23 September 2016. [Google Scholar]
- Sakellariou, S.; Tampekis, S.; Samara, F.; Sfougaris, A.; Christopoulou, O. Review of state-of-the-art decision support systems (DSSs) for prevention and suppression of forest fires. J. For. Res. 2017, 28, 1107–1117. [Google Scholar]
- Keramitsoglou, I.; Kiranoudis, C.T.; Sarimvels, H.; Sifakis, N. A multidisciplinary decision support system for forest fire crisis management: DSS for forest fire crisis management. Environ. Manag. 2004, 33, 212–225. [Google Scholar]
- Kalabokidis, K.; Xanthopoulos, G.; Moore, P.; Caballero, D.; Kallos, G.; Llorens, J.; Roussou, O.; Vasilakos, C. Decision support system for forest fire protection in the Euro-Mediterranean region. Eur. J. For. Res. 2012, 131, 597–608. [Google Scholar]
- Stephens, S.L.; Ruth, L.W. Federal forest-fire policy in the United States. Ecol. Appl. 2005, 15, 532–542. [Google Scholar]
- Ponce-Calderón, L.P.; Rodríguez-Trejo, D.A.; Villanueva-Díaz, J.; Bilbao, B.A.; Álvarez-Gordillo GD, C.; Vera-Cortés, G. Historical fire ecology and its effect on vegetation dynamics of the Lagunas de Montebello National Park, Chiapas, Mexico. Iforest Biogeosciences For. 2021, 14, 548. [Google Scholar]
- Sapkota, L.M.; Shrestha, R.P.; Jourdain, D.; Shivakoti, G.P. Factors affecting collective action for forest fire management: A comparative study of community forest user groups in Central Siwalik, Nepal. Environ. Manag. 2015, 55, 171–186. [Google Scholar]
- Chuntanaparb, L.; Chamchong, C.; Hoamuangkaew, W.; Ongprasert, P.; Limchoowong, S.; Pragtong, K.; Subansenee, W.; Yukong, W.; Tan-kim-yong, U. Community Allies: Forest Co-Management in Thailand; Poffenberger, M., McGean, B., Eds.; (No. 2). Research Network Report; Center for Southeast Asia Studies, University of California: Berkeley, CA, USA, 1993. [Google Scholar]
- Picado, W.; Chaves, C.C. Incendiarismo y Pirocultura en el Bosque Tropical Seco de Costa Rica. La Historia del Fuego como Historia Aplicada. Historia Ambiental Latinoamericana Y Caribeña (HALAC). Rev. De La Solcha 2021, 11, 173–213. [Google Scholar] [CrossRef]
- Ponce Calderón, L.P.; Neger, C.; Limón Aguirre, F. Cultural fire management in the Sierra de Santa Martha. Rev. Mex. De Sociol. 2024, 86, 381–412. [Google Scholar]
- Kartodihardjo, H.; Murtilaksono, K. Paradox and implication of policy of land and forest fire control: Case study of Indonesia. In Research Abstracts and Key Policy Questions—Methodology Workshop on Environmental Services and Land Use Change, Proceedings of the Bridging the Gap between Policy and Research in Southeast Asia, Chiang Mai, Thailand, 31 May–2 June 1999; Tomich, T.P., Thomas, D.E., van Noordwijk, M., Eds.; Indonesia Report Number 10; ASB: Bogor, Indonesia, 1999; Available online: https://apps.worldagroforestry.org/Units/Library/Books/Book%2092/research%20abstracts%20and%20key%20policy%20questions/html/paradox_and_implication.htm?n=26 (accessed on 1 April 2025).
- Karki, S. Community Involvement in and Management of Forest Fires in South East Asia; Project FireFight South East Asia: Jakarta, Indonesia, 2002. [Google Scholar]
- Joseph, S.; Anitha, K.; Murthy, M.S.R. Forest fire in India: A review of the knowledge base. J. For. Res. 2009, 14, 127–134. [Google Scholar]
- Kumar, S.; Kumar, A. Hotspot and trend analysis of forest fires and its relation to climatic factors in the western Himalayas. Nat. Hazards 2022, 114, 3529–3544. [Google Scholar]
- Oliveira, S.L.; Pereira, J.M.; Carreiras, J.M. Fire frequency analysis in Portugal (1975–2005), using Landsat-based burnt area maps. Int. J. Wildland Fire 2011, 21, 48–60. [Google Scholar]
- Castellnou, M. Nuevas metodologías de prevención de grandes incendios. In Proceedings of the Congreso Forestal Ibérico, Castelo Branco, Portugal, 17–19 December 2000. [Google Scholar]
- Pereira Junior, A.C.; Oliveira, S.L.; Pereira, J.M.; Turkman MA, A. Modelling fire frequency in a Cerrado savanna protected area. PLoS ONE 2014, 9, e102380. [Google Scholar]
- Malamud, B.D.; Millington, J.D.; Perry, G.L. Characterizing wildfire regimes in the United States. Proc. Natl. Acad. Sci. USA 2005, 102, 4694–4699. [Google Scholar]
- Galizia, L.F.; Curt, T.; Barbero, R.; Rodrigues, M. Assessing the accuracy of remotely-sensed fire datasets across the Southwestern Mediterranean basin. Nat. Hazards Earth Syst. Sci. Discuss. 2020, 2020, 1–19. [Google Scholar]
- Ponce-Calderón, L.P.; Limón-Aguirre, F.; Rodríguez, I.; Rodríguez-Trejo, D.A.; Bilbao, B.A.; Álvarez-Gordillo, G.D.C.; Villanueva-Díaz, J. Fire management in pyrobiocultural landscapes, Chiapas, Mexico. Trop. For. Issues 2022, 61, 53–59. [Google Scholar] [CrossRef]
- Rodríguez-Trejo, D.A.; Ponce-Calderón, L.P.; Tchikoué, H.; Martínez-Domínguez, R.; Martínez-Muñoz, P.; Pulido-Luna, J.A. Towards integrated fire management in Mexico’s Megalopolis region: A diagnosis. Trop. For. Issues 2022, 61, 80–86. [Google Scholar]
- Jurvélius, M. HEALTH AND PROTECTION|forest fires (prediction, prevention, preparedness and suppression). In Encyclopedia of Forest Sciences; Academic Press: Cambridge, MA, USA, 2004; pp. 334–339. [Google Scholar] [CrossRef]
- Galizia, L.F.; Curt, T.; Barbero, R.; Rodrigues, M. Understanding fire regimes in Europe. Int. J. Wildland Fire 2021, 31, 56–66. [Google Scholar]
- Reddy, C.S.; Jha, C.S.; Manaswini, G.; Alekhya, V.P.; Pasha, S.V.; Satish, K.V.; Diwakar, P.G.; Dadhwal, V.K. Nationwide assessment of forest burnt area in India using Resourcesat-2 AWiFS data. Curr. Sci. 2017, 112, 1521–1532. [Google Scholar]
- Li, Y.; Quan, X.; Liao, Z.; He, B. Forest fuel loads estimation from Landsat ETM+ and ALOS PALSAR data. Remote Sens. 2021, 13, 1189. [Google Scholar] [CrossRef]
- Bar, S.; Parida, B.R.; Pandey, A.C.; Kumar, N. Pixel-based long-term (2001–2020) estimations of forest fire emissions over the Himalaya. Remote Sens. 2022, 14, 5302. [Google Scholar] [CrossRef]
- Aragoneses, E.; García, M.; Ruiz-Benito, P.; Chuvieco, E. Mapping forest canopy fuel parameters at European scale using spaceborne LiDAR and satellite data. Remote Sens. Environ. 2024, 303, 114005. [Google Scholar]
- Wang, Z.; Zlatanova, S.; Moreno, A.; Van Oosterom, P.; Toro, C. A data model for route planning in the case of forest fires. Comput. Geosci. 2014, 68, 1–10. [Google Scholar]
- Lin, K.; Zhang, L.; Huang, L.; Feng, Z.; Chen, T. Improved particle swarm path planning algorithm with multi-factor coupling in forest fire spread scenarios. Fire 2023, 6, 202. [Google Scholar] [CrossRef]
- Toth, C.; Grejner-Brzezinska, D.A.; Oh, J.H.; Markiel, J.N. Terrain-based navigation: A tool to improve navigation and feature extraction performance of mobile mapping systems. Bol. Ciências Geodésicas 2009, 15, 807–823. [Google Scholar]
- Google Play Store. Google Play Store [Website]. 2025. Available online: https://play.google.com/ (accessed on 7 February 2025).
- App Store. App Store [Website]. 2025. Available online: https://www.apple.com/in/app-store/ (accessed on 7 February 2025).
- Andrews, P.L. The Rothermel Surface Fire Spread Model and Associated Developments: A Comprehensive Explanation, Gen. Tech. Rep. RMRS-GTR-371; U.S. Department of Agriculture, Forest Service, Rocky Mountain Research Station: Fort Collins, CO, USA, 2018; 121. Available online: https://www.fs.usda.gov/rm/pubs_series/rmrs/gtr/rmrs_gtr371.pdf (accessed on 1 March 2025).
- Ning, J.; Liu, H.; Yu, W.; Deng, J.; Sun, L.; Yang, G.; Wang, M.; Yu, H. Comparison of Different Models to Simulate Forest Fire Spread: A Case Study. Forests 2024, 15, 563. [Google Scholar] [CrossRef]
- Calkin, D.E.; Cohen, J.D.; Finney, M.A.; Thompson, M.P. How risk management can prevent future wildfire disasters in the wildland-urban interface. Proc. Natl. Acad. Sci. USA 2014, 111, 746–751. [Google Scholar]
- Fayet, C.M.; Verburg, P.H. Modelling opportunities of potential European abandoned farmland to contribute to environmental policy targets. Catena 2023, 232, 107460. [Google Scholar]
- Souza-Alonso, P.; Saiz, G.; García, R.A.; Pauchard, A.; Ferreira, A.; Merino, A. Post-fire ecological restoration in Latin American forest ecosystems: Insights and lessons from the last two decades. For. Ecol. Manag. 2022, 509, 120083. [Google Scholar]
- Ryu, S.R.; Choi, H.T.; Lim, J.H.; Lee, I.K.; Ahn, Y.S. Post-fire restoration plan for sustainable forest management in South Korea. Forests 2017, 8, 188. [Google Scholar] [CrossRef]
- Werbin, Z.R.; Heidari, L.; Buckley, S.; Brochu, P.; Butler, L.J.; Connolly, C.; Houttuijn Bloemendaal, L.; McCabe, T.D.; Miller, T.K.; Hutyra, L.R. A tree-planting decision support tool for urban heat mitigation. PLoS ONE 2020, 15, e0224959. [Google Scholar]
- Yadav, N.; Rakholia, S.; Yosef, R. A Prototype Decision Support System for Tree Selection and Plantation with a Focus on Agroforestry and Ecosystem Services. Forests 2024, 15, 1219. [Google Scholar] [CrossRef]
- Noonan-Wright, E.K.; Opperman, T.S.; Finney, M.A.; Zimmerman, G.T.; Seli, R.C.; Elenz, L.M.; Calkin, D.E.; Fiedler, J.R. Developing the US Wildland Fire Decision Support System. J. Combust. 2011, 2011, 168473. [Google Scholar] [CrossRef]
- Potapov, P.; Li, X.; Hernandez-Serna, A.; Tyukavina, A.; Hansen, M.C.; Kommareddy, A.; Pickens, A.; Turubanova, S.; Tang, H.; Silva, C.E.; et al. Mapping global forest canopy height through integration of GEDI and Landsat data. Remote Sens. Environ. 2021, 253, 112165. [Google Scholar]
- Forest Survey of India. Atlas-Forest Types of India. Forest Survey of India; Ministry of Environment and Forests, Govt. of India: Dehradun, India, 2011; 210p. [Google Scholar]
- Long, T.; Zhang, Z.; He, G.; Jiao, W.; Tang, C.; Wu, B.; Zhang, X.; Wang, G.; Yin, R. 30 m resolution global annual burned area mapping based on Landsat Images and Google Earth Engine. Remote Sens. 2019, 11, 489. [Google Scholar] [CrossRef]
- NASA FIRMS. MODIS Collection 6 Hotspot/Active Fire Detections MCD14ML distributed from NASA FIRMS. 2024. Available online: https://earthdata.nasa.gov/firms (accessed on 1 April 2025).
- Takeuchi, W.; Darmawan, S.; Shofiyati, R.; Khiem, M.V.; Oo, K.S.; Pimple, U.; Heng, S. Near-real time meteorological drought monitoring and early warning system for croplands in asia. In Proceedings of the Asian Conference on Remote Sensing 2015: Fostering Resilient Growth in Asia, Quezon City, Philippines, 19–23 October 2015; Volume 1, pp. 171–178. [Google Scholar]
- Lewis, J. Probabilistic modelling for incorporating uncertainty in least cost path results: A postdictive Roman road case study. J. Archaeol. Method Theory 2021, 28, 911–924. [Google Scholar]
- Alberti, G. movecost: An R package for calculating accumulated slope-dependent anisotropic cost-surfaces and least-cost paths. SoftwareX 2019, 10, 100331. [Google Scholar]
- Vattakaven, T.; George, R.M.; Balasubramanian, D.; Réjou-Méchain, M.; Muthusankar, G.; Ramesh, B.R.; Prabhakar, R. India Biodiversity Portal: An integrated, interactive and participatory biodiversity informatics platform. Biodivers. Data J. 2016, 4, e10279. [Google Scholar]
- Gumber, S.; Singh, R.D.; Ram, J.; Tewari, A.; Singh, S.P. Bark thickness analysis of four dominant tree species of Central Himalayan forests varying in exposure to surface fires. Trees 2021, 36, 685–695. [Google Scholar] [CrossRef]
- Binjola, R.; Dobhal, S.; Lal, P. A Review On The Current Status Of Forest Fire In Uttarakhand State Of India. J. Glob. Ecol. Environ. 2022, 16, 26–33. [Google Scholar]
- Wang, H.; Zhang, K.; Qin, Z.; Gao, W.; Wang, Z. Refining Ecological Techniques for Forest Fire Prevention and Evaluating Their Diverse Benefits. Fire 2024, 7, 129. [Google Scholar] [CrossRef]
- Deltell, L.; Santana, V.M.; Jaime Baeza, M. Allometric equations to calculate living and dead fuel loads in Mediterranean species. Eur. J. For. Res. 2024, 143, 739–749. [Google Scholar]
- Nguyen, T.H.; Jones, S.; Reinke, K.J.; Soto-Berelov, M. Estimating fine fuel loads in Eucalypt forests using forest inventory data and a modelling approach. For. Ecol. Manag. 2024, 561, 121851. [Google Scholar]
- Zianis, D.; Muukkonen, P.; Mäkipää, R.; Mencuccini, M. Biomass and Stem Volume Equations for Tree Species in Europe; Finnish Society of Forest Science, Finnish Forest Research Institute: Uusimaa, Finland, 2005. [Google Scholar]
- Jenkins, J.C.; Chojnacky, D.C.; Heath, L.S.; Birdsey, R.A. National-scale biomass estimators for United States tree species. For. Sci. 2003, 49, 12–35. [Google Scholar]
- Westfall, J.A.; Coulston, J.W.; Gray, A.N.; Shaw, J.D.; Radtke, P.J.; Walker, D.M.; Weiskittel, A.R.; MacFarlane, D.W.; Affleck, D.L.; Zhao, D.; et al. A National-Scale Tree Volume, Biomass, and Carbon Modeling System for the United States, Gen. Tech. Rep. WO-104; US Department of Agriculture, Forest Service: Washington, DC, USA, 2024; Volume 104.
- Singh, A.P. Associations of butterflies across different forest types in Uttarakhand, western Himalaya, India: Implications for conservation planning. J. Threat. Taxa 2022, 14, 20346–20370. [Google Scholar]
- Cruz, M.G.; Alexander, M.E. The 10% wind speed rule of thumb for estimating a wildfire’s forward rate of spread in forests and shrublands. Ann. For. Sci. 2019, 76, 1–11. [Google Scholar]
- Zhang, Y.L.; Tian, L.L. Examining and reforming the rothermel surface fire spread model under no-wind and zero-slope conditions for the Karst ecosystems. Forests 2023, 14, 1088. [Google Scholar] [CrossRef]
- Hua, J.; Zhang, S.; Gao, H.; Chen, X.; Li, X.; Liu, J. Optimizing the Rothermel Model For Easily Predicting Spread Rate of Forest Fire. Math. Comput. For. Nat. Resour. Sci. 2020, 12, 62. [Google Scholar]
- Geng, D.; Yang, G.; Ning, J.; Li, A.; Li, Z.; Ma, S.; Wang, X.; Yu, H. Modification of the Rothermel model parameters–the rate of surface fire spread of Pinus koraiensis needles under no-wind and various slope conditions. Int. J. Wildland Fire 2024, 33, WF23118. [Google Scholar] [CrossRef]
- Andrade, C.; Bugalho, L. Multi-indices Diagnosis of the conditions that led to the two 2017 major wildfires in Portugal. Fire 2023, 6, 56. [Google Scholar] [CrossRef]
- Deng, L.; Yan, E.; Jiang, J.; Mo, D. Estimating Fine Fuel Load Using Sentinel-2A Imagery and Machine Learning: A Case Study in the Mountainous Forests of Changsha, China. Remote Sens. 2023, 15, 5721. [Google Scholar] [CrossRef]
- Nolan, R.H.; Price, O.F.; Samson, S.A.; Jenkins, M.E.; Rahmani, S.; Boer, M.M. Framework for assessing live fine fuel loads and biomass consumption during fire. For. Ecol. Manag. 2022, 504, 119830. [Google Scholar] [CrossRef]
- Jhariya, M.K.; Bargali, S.S.; Swamy, S.L.; Kittur, B. Vegetational structure, diversity and fuel load in fire affected areas of tropical dry deciduous forests in Chhattisgarh. Vegetos 2012, 25, 210–224. [Google Scholar]
- Singh, S.; Suresh Babu, K.V. Forest fire susceptibility mapping for uttarakhand state by using geospatial techniques. In Recent Technologies for Disaster Management and Risk Reduction: Sustainable Community Resilience & Responses; Springer International Publishing: Cham, Switzerland, 2021; pp. 173–188. [Google Scholar]
- Forest Survey of India. State of Forest Report 2021. 2021. Available online: https://fsi.nic.in/forest-report-2021-details (accessed on 1 April 2025).
- Pandolf, K.B.; Givoni, B.; Goldman, R.F. Predicting energy expenditure with loads while standing or walking very slowly. J. Appl. Physiol. 1977, 43, 577–581. [Google Scholar] [CrossRef]
- Giglio, L.; Csiszar, I.; Justice, C.O. Global distribution and seasonality of active fires as observed with the Terra and Aqua Moderate Resolution Imaging Spectroradiometer (MODIS) sensors. J. Geophys. Res. Biogeosciences 2006, 111. [Google Scholar] [CrossRef]
- Sitanggang, I.S.; Syaufina, L.; Trisminingsih, R.; Ramdhany, D.; Nuradi, E.; Hidayat, M.F.A.; Rahmawan, H.; Wulandari; Ardiansyah, F.; Albar, I.; et al. Indonesian forest and land fire prevention patrol system. Fire 2022, 5, 136. [Google Scholar] [CrossRef]
- Lourenço, M.; Oliveira, L.B.; Oliveira, J.P.; Mora, A.; Oliveira, H.; Santos, R. An integrated decision support system for improving wildfire suppression management. ISPRS Int. J. Geo Inf. 2021, 10, 497. [Google Scholar] [CrossRef]
- Yang, H.; Cai, H.; Yang, G.; Geng, D.; Sun, L. Predicting the rate of spread of mixed-fuel surface fires in northeastern China using the Rothermel wildfire behaviour model: A laboratory study. J. For. Res. 2024, 35, 108. [Google Scholar] [CrossRef]
- Plucinski, M.P.; Tartaglia, E.; Huston, C.; Stephenson, A.G.; Dunstall, S.; McCarthy, N.F.; Deutsch, S. Exploring the influence of the Keetch–Byram Drought Index and McArthur’s Drought Factor on wildfire incidence in Victoria, Australia. Int. J. Wildland Fire 2023, 33, WF23073. [Google Scholar] [CrossRef]
- Singh, R.D.; Gumber, S.; Tewari, P.; Singh, S.P. Nature of forest fires in Uttarakhand: Frequency, size and seasonal patterns in relation to pre-monsoonal environment. Curr. Sci. 2016, 111, 398–403. [Google Scholar]
- Supernant, K. Modeling Métis mobility? Evaluating least cost paths and indigenous landscapes in the Canadian west. J. Archaeol. Sci. 2017, 84, 63–73. [Google Scholar]
- Sati, V.P.; Kumar, S. Declining agriculture in Garhwal Himalaya: Major drivers and implications. Cogent Soc. Sci. 2023, 9, 2167571. [Google Scholar] [CrossRef]
- Kishwan, J. REDD+ and its implementation in the Himalayan region: Policy issues. In Climate Change in the Himalayas; Academic Press: Cambridge, MA, USA, 2023; pp. 121–139. [Google Scholar]
- Fidelis, A.; Alvarado, S.T.; Barradas, A.C.S.; Pivello, V.R. The year 2017: Megafires and management in the Cerrado. Fire 2018, 1, 49. [Google Scholar] [CrossRef]
- Bilbao, B.; Steil, L.; Urbieta, I.R.; Anderson, L.; Pinto, C.; Gonzalez, M.C.; Millan, A.; Falleiro, R.M.; Morici, E.; Ibarnegaray, V.; et al. Wildfires. In Adaptation to Climate Change Risks in Ibero-American Countries RIOCCADAPT Report; Moreno, J.M., Laguna-Defior, C., Barros, V., Calvo Buendia, E., Marengo, J.A., Oswald Spring, U., Eds.; McGraw Hill: Madrid, Spain, 2020; pp. 435–496. [Google Scholar]
- Clark, M.B.; Nkonya, E.; Galford, G.L. Flocking to fire: How climate and natural hazards shape human migration across the United States. Front. Hum. Dyn. 2022, 4, 886545. [Google Scholar] [CrossRef]


| Component | Data Source and References | Rationale | Existing Gaps |
|---|---|---|---|
| Fuel load | Global Ecosystem Dynamics Investigation (GEDI); Forest Survey of India (FSI); [45,46] | Since different forest types (e.g., Sal, Chir Pine, Mixed Conifers) have varied fuel load capacities, mapping them helps identify high-risk zones | Lack of existing Lidar-based fuel load estimates for Uttarakhand |
| Fire (burn) frequency | Global Annual Burned Area Maps—(GABAM); [47] | Historical fire occurrences help understand fire regimes (frequency, seasonality, and intensity). It helps in decision-making for fire suppression, resource allocation, and restoration efforts | Lack of readily available visualization and absence of detailed satellite-based fire regime maps |
| Fire incidents (2000–2024) | MODIS Collection 6 and 6.1; [48] | Fire incident datasets complement burn frequency data by providing ignition trends | Fire incidents were available on FSI and NASA FIRMS but lacked detailed statistical analysis. |
| KBDI (Keetch–Byram Drought Index) | Institute of Industrial Science, The University of Tokyo, Japan; [49] | KBDI helps forest managers assess wildfire risk by quantifying soil and duff dryness, enabling proactive fire prevention, resource allocation, and decision-making | Widely used in fire danger rating systems globally. However, no region-specific and online accessible fire management tool utilizing KBDI has been developed for Uttarakhand, India. |
| Optimal path tool | User-generated; leastcostpath R package [50] | Helps fire management teams find the quickest, least energy-intensive routes for fire suppression and escape planning | Tool/algorithm not available on commonly used navigation/field apps: Google Maps; Qfield; Waze; Gaia; Apple Maps; Field Maps ESRI, etc. |
| Rothermel-based spatial fire spread tool | User-generated; general R packages: Leaflet; raster | Simulates fire spread under various conditions to help proactive fire management and planning | Despite the widespread use of the Rothermel fire spread model globally, no dedicated web or GIS-based application has been developed specifically for Uttarakhand, India |
| Walk–hike time isoline tools | User-generated; movecost R package; [51] | Helps in optimizing deployment locations for fire response teams | Tool/algorithm not available on commonly used navigation/field apps: Google Maps; Qfield; Waze; Gaia; Safari; Field Maps ESRI, etc., or any known online web/mobile app yet |
| Tree selection tool for post-fire restoration | India Biodiversity Portal; bibliographic literature; [52,53,54] | Attributes like bark thickness, foliage type, and fire sensitivity ensure that restored forests are more resilient to future fires—THEY aid in ecosystem recovery, aligning species selection with fire prevention strategies | There is a lack of such a web application for Uttarakhand, India, that accounts for tree selection for restoration |
| Fire Prevention strategies comparison tab | Ecological Techniques for Forest Fire Prevention|Fire|MDPI [55] | Helps forest managers implement long-term, science-based fire mitigation plans | There is an absence of existing tools that discuss the comparison of these fire prevention techniques |
| Forest Type | a | b | c | Description |
|---|---|---|---|---|
| Deodar | 0.005 | 2.4 | 0.9 | Large trees with high biomass per unit DBH increase. |
| Sal | 0.005 | 2.4 | 0.9 | Similar to Deodar but with slightly lower DBH. |
| Scrub | 0.002 | 1.9 | 0.7 | Sparse vegetation with lower wood density. |
| Banj Oak | 0.006 | 2.45 | 0.9 | Denser wood, moderate DBH, and high height dependency. |
| Chir | 0.004 | 2.4 | 0.9 | Moderate wood density, similar to Sal, but slightly lower biomass. |
| Mixed Conifers | 0.006 | 2.55 | 0.9 | Dense conifer species with high DBH sensitivity. |
| Shisham | 0.004 | 2.55 | 0.9 | Moderately dense species with high DBH dependency. |
Disclaimer/Publisher’s Note: The statements, opinions and data contained in all publications are solely those of the individual author(s) and contributor(s) and not of MDPI and/or the editor(s). MDPI and/or the editor(s) disclaim responsibility for any injury to people or property resulting from any ideas, methods, instructions or products referred to in the content. |
© 2025 by the authors. Licensee MDPI, Basel, Switzerland. This article is an open access article distributed under the terms and conditions of the Creative Commons Attribution (CC BY) license (https://creativecommons.org/licenses/by/4.0/).
Share and Cite
Yadav, N.; Rakholia, S.; Moore, P.; Ponce-Calderón, L.P.; S R, M.K.; Yosef, R. A Prototype Forest Fire Decision Support System for Uttarakhand, India. Fire 2025, 8, 149. https://doi.org/10.3390/fire8040149
Yadav N, Rakholia S, Moore P, Ponce-Calderón LP, S R MK, Yosef R. A Prototype Forest Fire Decision Support System for Uttarakhand, India. Fire. 2025; 8(4):149. https://doi.org/10.3390/fire8040149
Chicago/Turabian StyleYadav, Neelesh, Shrey Rakholia, Peter Moore, Laura Patricia Ponce-Calderón, Mithun Kumar S R, and Reuven Yosef. 2025. "A Prototype Forest Fire Decision Support System for Uttarakhand, India" Fire 8, no. 4: 149. https://doi.org/10.3390/fire8040149
APA StyleYadav, N., Rakholia, S., Moore, P., Ponce-Calderón, L. P., S R, M. K., & Yosef, R. (2025). A Prototype Forest Fire Decision Support System for Uttarakhand, India. Fire, 8(4), 149. https://doi.org/10.3390/fire8040149