Abstract
Mapping potential fire intensity is a fundamental tool for fire management planning. Despite the wide use of Fire Radiative Power (FRP) as an indicator of expected fire intensity and fire emissions, very few studies have spatially analyzed the role of remotely sensed proxies of vegetation productivity to explain FRP. The current study aimed at modeling and mapping the relationships between aboveground biomass and Moderate Resolution Imaging Spectroradiometer (MODIS) maximum FRP, at 1 km pixel, in 2011–2020, for each of 46 fuel regions in the entirety of Mexico. Maximum FRP–biomass relationships supported a novel hypothesis of varying constraints of fire intensity. In lower-productivity areas, such as semiarid shrub- and grass-dominated ecosystems, fine fuel loads limited fire occurrence and FRP was positively related to biomass. In the more productive areas, such as temperate or tropical forests, a humped relationship of FRP against biomass was observed, suggesting an intermediate-productivity hypothesis of maximum fire intensity within those regions. In those areas, the highest fire intensity was observed in the intermediate biomass areas, where surface (timber understory) and crown fuel availability, together with higher wind penetration, can result in crown fires. On the contrary, within the most productive areas, the lowest intensity occurred, likely due to weather and fuel (timber litter) limitations.
Keywords:
FRP; varying constraints hypothesis of fire intensity; fire hazard; fuels; biomass; carbon 1. Introduction
Understanding the role of vegetation type and fuel availability in the spatial distribution of fire occurrence and fire intensity is a key component of fire management decision making processes [1,2,3]. Spatially explicit fire occurrence and intensity prediction can aid in prioritizing fuel treatment and prepositioning of fire suppression crews, and can minimize associated environmental, economic and social impacts [3,4,5]. It is also required to improve the effectiveness of the strategic allocation of resources for fire prevention and suppression [6,7,8].
1.1. Fire Occurrence and Intensity Prediction
Fire risk spatial assessment generally comprises three components, fire occurrence, fire intensity and fire impacts, sometimes including exposure and vulnerability in the latter (e.g., [2,9,10]). Most previous statistical analyses at spatial scales have focused on the first component, aiming to explain the most likely locations for fires to occur based on climatic, anthropogenic and vegetation drivers (e.g., [11,12,13]). Of those spatial factors, the biomass quantity and structure are the only physical parameter that can be managed to reduce the negative impacts of intense forest fires (e.g., [14,15,16]). Some studies have accordingly analyzed fire occurrence probability against proxies of biomass productivity such as tree cover [17], aboveground biomass [18,19], leaf area index [20] or NDVI [21,22]. Some of those previous studies have observed maximum fire occurrence at intermediate productivity levels [18,19,20,21,22]. Those observations seem to support the hypotheses of maximum fire occurrence at intermediate productivity levels (e.g., [23,24]) or the varying constraint theories of fire occurrence (e.g., [24,25,26]). However, to the best of our knowledge, those hypotheses of fire occurrence have not been tested to examine the spatial drivers of fire intensity related to vegetation productivity across varying fuel and ecoregions.
Regarding fire intensity, most landscape-scale intensity mapping analyses have used GIS tools applying field- or laboratory-calibrated [27,28,29] fire behavior simulation models (e.g., [30,31,32]). However, those empirical simulation models are subject to several sources of uncertainty (e.g., [10,33,34,35]) and are consequently the subject of ongoing research (e.g., [36,37]). Furthermore, some of the detailed surface and crown fuel characteristics used as inputs in those models are also subject to uncertainty (e.g., [10,34]) and can be challenging to map using remote sensing (e.g., [38,39]). While some pioneer studies have been able to use multispectral imagery (e.g., [40,41]), airborne and terrestrial LIDAR [42] or tree canopy density (e.g., [43,44]) to estimate and map surface fuel loads with varying levels of accuracy, those relationships are likely ecosystem-specific and require large amounts of field data for their development [40,41,42,43,44]. Furthermore, in contrast to a large number of spatial studies analyzing the drivers of fire occurrence (e.g., [11,12,13,17,18,19,20,21,22,45,46]), studies performing statistical spatial analyses of landscape-scale large datasets of observed fire intensity against its fuel or climatic drivers are relatively more limited, partly driven by previous scarcity of fire intensity data [47].
1.2. Remote Sensing of Fire Intensity and Severity
One alternative to overcome limitations inherent to fuel and fire field data scarcity is to take advantage of the recent availability of large datasets of remotely sensed imagery, which represent an unprecedented opportunity for improving our large-scale knowledge of the drivers of fire intensity and severity (e.g., [47,48,49]). In this sense, MODIS and VIIRS active fires provide proxies of fire intensity that can be related to field-observed flame length [50] and fuel consumption (e.g., [51,52]). In addition, coarse- to medium-resolution multispectral indices have been largely validated against field-observed burn severity (e.g., [53,54,55]).
Furthermore, in recent years, there has been an increasing availability of freely available multispectral indices from medium- to coarse-resolution sensors and, consequently, a growing availability of previously overlooked maps of vegetation characteristics such as tree height [56], tree cover (e.g., [57,58]) and aboveground biomass (e.g., [59]). In order to minimize some of the abovementioned uncertainties and potential propagation errors [10], inherent to the more detailed approaches attempting to map surface fuel loads from multispectral imagery or tree canopy density (e.g., [40,41,43,44]), and then relate those hard-to map variables to limited samples of field-observed flame length, some recent studies have explored alternative, remotely sensed approaches. In particular, some recent studies have proposed to directly explore simple, empirical landscape-scale relationships between easily observed vegetation indices or total vegetation productivity variables (e.g., tree height, cover, aboveground biomass) and remotely sensed proxies of fire severity (e.g., [48,49,60,61,62]) or intensity (e.g., [47,63,64,65,66]).
1.2.1. Relating Fire Severity to Vegetation Productivity
Based on field-validated maps of fire severity, some recent pioneer studies, generally at the fire event scale, have successfully explained it from vegetation productivity variables or proxies such as aboveground biomass [62], tree height [67,68], canopy cover [61,69,70], NDWI [60,61,71], NDVI or EVI [48,49,71,72], AET [73], FAPAR [74] and Leaf Area Index [75]. Depending on the heterogeneity in the assessed vegetation types and on the range of variation in observed dendrometric characteristics and burn severity, those previous studies have documented that the relationships of burn severity and the analyzed proxies of total vegetation productivity were either positive (e.g., [48,67,68,71]), negative (e.g., [69,70]) or humped (e.g., [61,74]).
However, several challenges are still the subject of ongoing research for mapping and explaining burn severity [76], including the development of automated downloads of medium-resolution imagery using tools such as Google Earth Engine (e.g., [53,77,78]), together with its site- or ecoregion-specific validation (e.g., [53,54,55,78,79,80]). Because of these challenges, with the notable exception of a few studies in the USA, such as [73,81], the majority of the research on analyzing and mapping the vegetation drivers of burn severity has been conducted at the scale of one (e.g., [62,68,71,75]) or several specific wildfires (e.g., [60,61,74]).
1.2.2. Fire Intensity from Fire Radiative Power
The wide availability of a long time series of 1 km to 375 m resolution active fire registers (e.g., MODIS and VIIRS) represents an unprecedented opportunity to monitor the spatial patterns of fire intensity and associated fuel consumption and emissions (e.g., [51,52]). Active fires have been used to remotely monitor fire intensity through measurements of Fire Radiative Power (FRP), which is available at near-real time (10-15 min) from geostationary satellites such as GOES [82], SEVIRI [83,84,85,86] and Himawarii [87] and at daily time intervals from polar-orbiting satellites such as MODIS and VIIRS [51,52,83,88]. Several studies have demonstrated the potential of active fires’ FRP to distinguish fire intensity differences between fire fronts or backfires, surface or crown fires (e.g., [64,89]) and even to monitor levels of suppression difficulty registered in field records (e.g., field-observed torching or extreme fire behavior) [90]. In addition, some studies have successfully related field-observed flame length or fireline intensity to drone-measured FRP [50] or to active fire-based FRP at the fire front [86]. Furthermore, some studies have suggested potential relationships between FRP-measured fire intensity and dNBR-observed fire severity (e.g., [91,92,93]), while others have recently related FRP to field-observed tree mortality (e.g., [94,95]).
Fire radiative energy (FRE), obtained as time-integrated FRP, has been related to fuel consumption [51,52,88,96]. Furthermore, several studies have developed emission coefficients by relating FRP and particulate matter contents from aerosol optical depth measurements (e.g., [52,97,98,99,100]). Based on those consumption and emission coefficients, FRE has been largely used to estimate fire emissions at national to global scales (e.g., [51,52,99,100,101]). Several operational systems rely on FRP observations to map fire emissions [52], including the global fire assimilation systems (GFASs) [102], the Fire Energetics and Emissions Research system from NASA [99], IS4FIRES [103] and the Blended Global Biomass Burning Emissions (GBBEPs) [104]. While some studies have explored the potential of active fires to monitor daily fire progression (e.g., [105,106,107,108]), to assess fire occurrence likelihood (e.g., [46]) and to evaluate and recalibrate the daily progress predicted by fire spread prediction models (e.g., [36,37]), fewer studies have taken advantage of the Fire Radiative Power contained in those active fires to analyze the driving factors of fire intensity (e.g., [47]).
1.2.3. Relating Fire Radiative Power to Vegetation Productivity
The vast majority of the literature has analyzed an average or range of FRP values by vegetation types [109,110,111,112]. In contrast, studies analyzing the variation in FRP within those vegetation types in relation to vegetation characteristics such as tree cover are still extremely scarce [47,63,64,65,66]. The results of those very few studies have varied depending on the climatic and fuel constraints in the specific area studied. On the one hand, some studies have documented higher FRP values by increasing tree cover in some specific ecosystems, such as in boreal forests [64] or in tropical forests subject to slash and burn activities [63]. Contrarily, some others have documented negative effects of tree cover on FRP and fire temperature in fuel-limited areas such as Southern Africa [65], possibly related to a higher intensity being associated with areas with higher grass and shrub cover [66] in those fine fuel-driven ecosystems [20]. In a global analysis, the study by [47] documented that, while on average FRP increased positively with tree cover, complex and likely ecosystem-specific interactions between fuel availability and weather limitations to fire intensity influenced those relationships. There is consequently a large knowledge gap on the relationships between remotely sensed vegetation productivity and Fire Radiative Power, and how it varies between and within different ecoregions with varying climatic and human conditions.
Furthermore, the majority of those previous studies have been conducted using coarse-scale analysis units, such as the temporal averages of FPR and NDVI over an entire ecoregion (without considering the internal spatial variations in NDVI within ecoregions) [113], the average observed FRP for 4–5 tree cover classes over an entire analysis region (e.g., [63]), or at coarse-scale (0.25–0.5°) grid scales (e.g., [47,66]). To the best of our knowledge, there is no previous study that has attempted to analyze the spatial relationships of FRP with aboveground biomass at the scale of 1 km, for a large variety of ecoregions.
1.3. Study Goals
The current study aimed at modeling and mapping the relationships between aboveground biomass and remotely sensed fire intensity, in the period of 2011–2020, for the entire country of Mexico. Specifically, we aimed at analyzing, for each of the 46 fuel regions in Mexico, the relationships between aboveground carbon density (AGCD) and MODIS maximum FRP kernel density (KFRP), at 1 km pixel, using percentile regression (spline) models. Finally, the study aimed at mapping the resulting maximum expected fire intensity (KFRP, MW/km2) based on the fitted models for each fuel region and AGCD (Mg C/ha) at 1 km for the entire country of Mexico. The resulting maximum fire intensity map will be integrated into the Forest Fire Danger Forecast System of Mexico (SPPIF) (https://forestales.ujed.mx/incendios2/ (accessed on 20 January 2025)) to support fire management planning.
1.4. Study Hypotheses: Varying Constraints of Fire Intensity
The study area represents a wide range of vegetation and climatic conditions, ranging from arid and semiarid shrublands and grasslands to temperate and tropical forests [18], together with large variations in human influence between regions [19]. Because of this ample variation in vegetation, climatic and anthropogenic conditions, our study allowed us to propose and test a novel hypothesis to explain expected fire intensity as determined by biomass productivity. This can be considered an expansion of the varying constraints hypotheses of fire occurrence [23,24,25,26], but now applied to fire intensity, as evaluated by a large dataset of remotely sensed FRP in a variety of vegetation types and ecoregions.
Specifically, we hypothesized that fire intensity will be subject to varying constraints, such as fuel availability or weather (moisture and/or wind) limitations, which are directly or indirectly related to vegetation productivity. In fuel-limited ecosystems (arid or semiarid climates and low-productivity regions), higher intensity is expected with increasing biomass, caused by increasing fine fuel availability. On the other hand, lower intensity is expected in the highest biomass, very dense and very tall, wetter and most productive forests. This is expected because of weather limitations to fire intensity (higher moisture and lower wind penetration) and fuel bed properties that constrain fire behavior (timber litter fuel types, lower grass and shrub loads, and lower vertical continuity). Accordingly, we propose that, within the more productive ecosystems, the maximum fire intensity is expected to be at intermediate productivity levels (an intermediate-productivity hypothesis, applied to fire intensity). Note that this humped behavior of the FRP–biomass relationship is expected only in the more productive vegetation types and regions, where constraints to fire intensity are expected to exist at both extremes of the curve. Finally, we also hypothesize that the biomass–FRP relationships (the value at which maximum FRP will be reached, and the maximum FRP value reached) will vary between vegetation types and regions because of our hypothesized theory of varying constraints of fire intensity.
2. Materials and Methods
2.1. Study Area: Fuels and Forest Regions
The study area was the entire country of Mexico. We used the classification of forest fuel types proposed for Mexico by [18], obtained from the fuel beds map in [114] and the vegetation and land use map (1:250,000, Series VI) from the National Institute of Geography and Statistics (INEGI) [115]. Figure 1 shows the fuel types map at the national level. The regionalization of the fuels (Figure 2) was based on the regions proposed by [18,19], following the Level 3 Ecoregions map of North America (North American Level 3 Ecoregions Map, EPA, https://www.epa.gov/eco-research/ecoregions-north-america (accessed on 20 January 2025)) and considering the observed spatial patterns of MODIS FRP kernel density (Section 2.3). A description of the human and climatic characteristics of the analyzed regions can be found in [19].
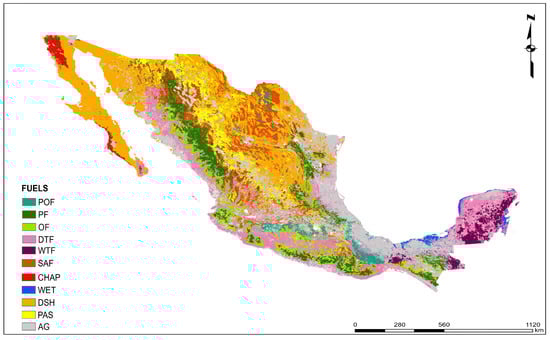
Figure 1.
Forest fuels map of Mexico. POF: pine–oak forest; PF: pine forest; OF: oak forest; WTF: wet tropical forest; DTF: dry tropical forest; SAF: semiarid forests; CHAP: chaparral; WET: wetland; DSH: desert (arid) shrubland; PAS: natural pasture land (grassland); AG: agriculture or not forested.
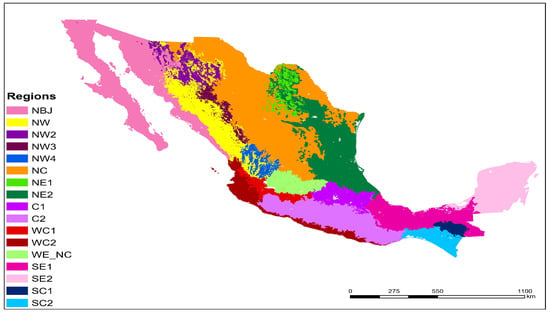
Figure 2.
Regions of analysis, based on the ecoregions of Mexico from [18,19]. NBJ: Northern Baja California; NW: Northwest; NW2: Northwest 2; NW3: Northwest 3; NW4: Northwest 4; NC: North-Central; NE1: Northeast 1; NE2: Northeast 2; C1: Central 1; C2: Central 2; WC1: West-Central 1; WC2: West-Central 2; WE_NC: Western North-Central; SE1: Southeast 1; SE2: Southeast 2; SC1: South-Central 1; SC2: South-Central.
2.2. Total Aboveground Carbon Density Data (AGCD)
The aboveground carbon density (AGCD) from the study in [59] was used. This map was obtained from Landsat images and ALOS PALSAR radar data of 2010–2011, calibrated against ground biomass data from 16,906 plots of Mexico’s national forest and soil inventory. The AGCD map was resampled to a 1 km resolution to match the pixel size of the MODIS sensor.
2.3. Active Fires
For the analysis of fire intensity, FRP values (MW/km2) from active fires were used, derived from the MODIS sensor (Moderate-Resolution Imaging Spectroradiometer, 1000 m) for the period 2011–2020; these were downloaded from the Fire Information for Resource Management System (FIRMS) (Table 1).

Table 1.
Characteristics of the remote sensing data used from the MODIS sensor.
2.4. FRP Normalization and Kernel Density of Normalized FRP
Active fires FRP was normalized in order to minimize the effects of pixel size (bow-tie) on observed fire intensity, based on Equation (1) [116]:
where FRPN = normalized FRP (MW/km2); FRP = Fire Radiative Power (MW); and PA = Pixel Area (km2), calculated following Equation (2):
where S = Scan; T = Track.
For each 1 km pixel of the Mexican Republic, the maximum FRPN value in the study period was calculated. Subsequently, a kernel density was calculated at a 5 km bandwidth for each 1 km cell using ArcGIS 10.6.1 software. This process generated the map of the kernel density of maximum observed FRPN (KD FRPN). We intersected the KD FRPN with active fire-based perimeters from the Mexican Fire Danger System (SPPIF) (http://forestales.ujed.mx/incendios2/ (accessed on 20 January 2025)). Active fire perimeters available in the SPPIF were calculated from MODIS and VIIRS active fires based on the convex hull algorithm in [105]. Fire perimeter-intersected KD FRPN and 1 km AGCD and fuel region values were extracted to each MODIS active fire observed during the study period (Figure 3).
2.5. Modeling the Relationship Between AGCD and KD FRPN
For each of the analyzed 46 fuel regions, we calculated percentiles 90 to 99 of KD FRPN, and the number of active fire observations, for each AGCD value. The focus of our analysis on the higher percentiles, 90–99, was justified by the two fire management applications of the expected maximum fire intensity map. First, in order to support the spatial planning of fire prevention activities, we aimed to spatially map the maximum fire intensity for fuel type and AGCD that can be expected under the highest fire danger conditions, in order to represent the maximum expected hazard for each 1 km pixel, under a worst-case scenario. Secondly, ongoing research in Mexico, beyond forecasting the expected daily number of fires (e.g., [117,118], http://forestales.ujed.mx/incendios2/ accessed on 20 January 2025), is also aiming to develop spatio-temporal daily predictions of maximum expected fire intensity from daily weather, fuel types and forest biomass. Under this ongoing research, MODIS fire intensity is expected to be explained by multiplicative regression models, combining a spatial variable (the maximum expected fire intensity by fuel and biomass, as modeled in the current study) multiplied by reducing factors (fitted regression models based on daily weather against FRP), with the latter accounting for the lower fire intensities expected on wetter, less windy days.
In order to spatially model the maximum expected fire intensity in the current study, we fitted a spline function, weighted by the number of observations of each AGCD category, to predict the KD FRPN percentiles from AGCD, for each fuel type and region. The optimum smoothing parameter (λ) and number of knots (k) of the spline function were selected for each model based on maximizing the value of the R2adj statistic, and minimizing the value of GCV (Generalized Cross-Validation) [119], based on Equations (3) and (4):
where: and are the observed and estimated values of the dependent variable, respectively; is the average value of the dependent variable; is the total number of observations used to fit the model, is the number of model parameters and νλ is the trace of the smoothing matrix.
2.6. Mapping Maximum Expected Fire Intensity
Figure 3 summarizes the flowchart of the data creation, analysis and mapping methodology. Predicted KD FRPN values were obtained based on the fitted spline function of each fuel region for every AGCD level. Predicted values were plotted against the full observed KD FRPN dataset and against the observed KD FRPN percentile. Also, plots were generated for every fuel region of the AGCD against the relativized predicted KD FRPN (%), obtained by dividing predicted KD FRPN values by the maximum KD FRPN predicted for every fuel region analyzed. Predicted KD FRPN values were mapped in ArcGis 10.6.1 based on the AGCD [59], fuel (Figure 1) and region (Figure 2) maps by applying each fuel region-specific fitted spline percentile models (Figure 3).

Figure 3.
Flowchart of the methodology for dataset creation, analysis and mapping of maximum fire intensity by fuel type-region and aboveground biomass.
Figure 3.
Flowchart of the methodology for dataset creation, analysis and mapping of maximum fire intensity by fuel type-region and aboveground biomass.

3. Results
3.1. Fuel-Specific Relationships Between KD FRPN and AGCD
The goodness of fit of the spline models to predict percentiles of KD FRPN from AGCD for the 46 fuel regions analyzed is shown in Table 2. Most best-fit models were obtained with 99th percentiles, while some models performed better using the 95th percentiles (Figure 3 and Supplementary Figures S1–S6). The maximum predicted KD FRPN, based on the fitted model, is also shown in Table 2.
Table 2.
Goodness of fit and maximum predicted KD FRPN for each of the 46 analyzed fuel regions.
In general, very high predicted KD FRPN maximum values were observed for the dry tropical forests in the South-Central region (Table 2), with the highest values in the Yucatan peninsula (region SE2, with a maximum KD FRPN of 1307 MW/km2), in the Central-Western region of the country (with values of 1023 and 842 MW/km2 for WC2 and C2), Southeast-Central area (SE1 and SC2 with 446 and 482 MW/km2) and in the NBJ region (630 MW/km2). Wet tropical forests in the SE2 region also showed high maximum KD FRPN values (550 MW/km2), but these were lower than those observed for DTF within the same region (Table 2). High KD FRPN values were also observed for pine and chaparral forests in Northern Baja California (1298 MW/km2), pine forests in the regions SC1 and NW (804 and 514 MW/km2, respectively), pine–oak forests in the WC1 and SE1 regions (599 and 612 MW/km2), and semiarid forests in the NC, NE1 and WC1 regions (579–645 MW/km2) (Table 2). Oak forests showed intermediate to high maximum KFRP values (248–419 MW/km2). Conversely, desert shrublands in regions NC, NBJ and NE showed low maximum KD FRPN values (generally <300 MW/km2) compared to maximum values of >600 MW/km2 for temperate, semiarid and chaparral forests within the same regions (Table 2).
Plots of observed and predicted KD FRPN against AGCD are shown in Figure 4 and Supplementary Figures S1–S6. For some of the analyzed fuels, such as chaparral of Northern Baja California or semiarid forests in the West-Central region (Figure 4a and Figure 4b, respectively), a positive relationship was observed (i.e., increasing fire intensity with increasing biomass). On the contrary, for many of the analyzed fuels, a humped relationship between fire intensity and biomass was observed (Figure 4c,d and Supplementary Figures S1–S6).
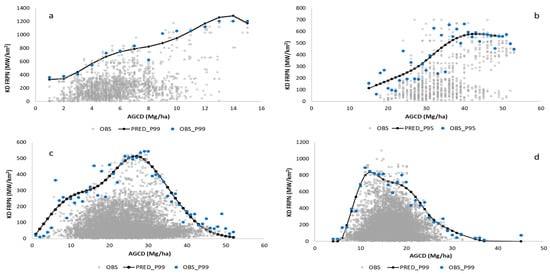
Figure 4.
Observed against predicted fire intensity for selected fuel regions. (a): chaparral forest in NBJ; (b): semiarid forest in WC1; (c): pine forests in NW; (d): dry tropical forest in C2 region; AGCD: aboveground carbon density (Mg C/ha); KD FRPN: kernel density of FRPN (MW/km2); OBS: observed KD FRPN; PRED_Pi: predicted KD FRPN with fitted spline for the specified i percentile (99th or 95th, selected based on goodness of fit for each fuel region). OBS_Pi: observed i percentile of KD FRPN.
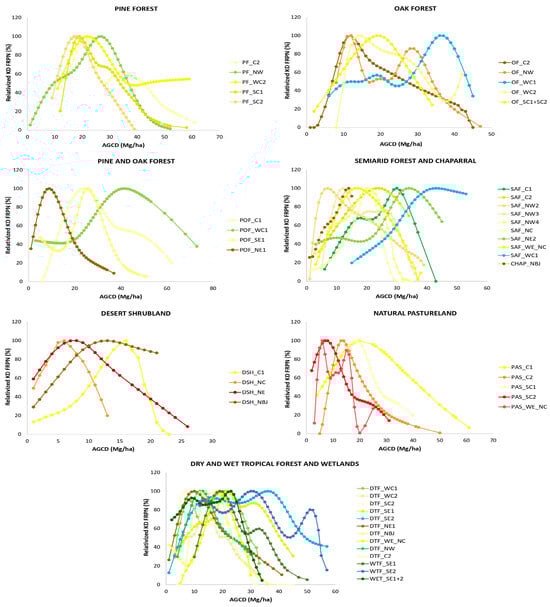
The AGCD at which the maximum KD FRPN was observed varied largely between regions as shown in the relativized (maximum-normalized) comparison of fitted models (Figure 5; plots for each fuel region are shown in Figure 4 and Supplementary Figures S1–S6). For example, for oaks, semiarid forests and desert shrublands, the maximum KD FRPN was observed for lower AGCD (15 Mg C/ha) values in regions such as NC, WE_NC, NW2 and NW3, compared to higher AGCD (>15–30 Mg C/ha) FRP peaks in the same fuels in Western and Central regions (Figure 5). In pine–oak forests in region WC1, and in tropical forests in region SE2, the maximum KD FRPN was observed at AGCD > 30 Mg C/ha.
3.2. Mapping Maximum Predicted Fire Intensity
The predicted map of maximum kernel density of FRPN for Mexico, based on the models adjusted for each fuel region, is shown in Figure 6(1). A good agreement can be observed between the predicted maximum KD FRPN values on the map and the distribution of historical FRP records from active fire data across the country (Figure 6(2)).
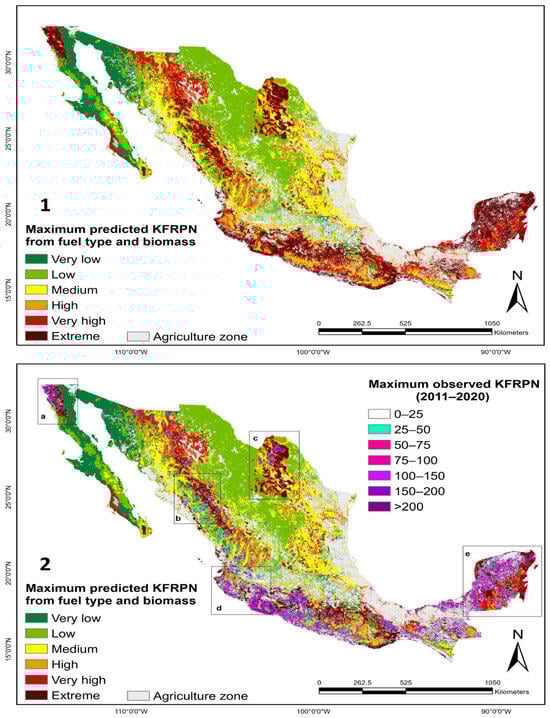
Figure 6.
Maps of predicted (1) and observed and predicted (2) fire intensity. (1): predicted maximum kernel density of FRPN; (2): observed MODIS kernel density of FRPN during the study period (2011–2020). Letters (a–e) in (2) and black squares indicate the five regional windows which are analyzed in detail in Figure 7. KFRPN: kernel density of FRPN (MW/km2); Very low = 1–50 MW/km2; Low = 100–150 MW/km2; Medium = 150–250 MW/km2; High = 250–300 MW/km2; Very high = 300–550 MW/km2; Extreme: >550 MW/km2.
Detailed regional examples of the mapped intensity are shown in Figure 7. For the arid, shrub-dominated NBJ (Figure 7a) and NE1 regions (Figure 7b), the highest KD FRPN values were observed in areas with relatively low AGCD levels (up to 15 Mg C/ha), for which the maximum fire intensity was predicted. In the NW region (Figure 7c) and the C1-2 and WC1-2 regions (Figure 7d), the highest fire intensity was predicted for intermediate AGCD levels (from 15 to 35 Mg C/ha), with a decrease in KD FRPN values towards the higher biomass levels (>35 Mg C/ha). In the SE2 tropical forest region (Figure 7e), the highest KD FRPN values were observed and predicted at intermediate levels of 20 to 35 Mg C/ha.
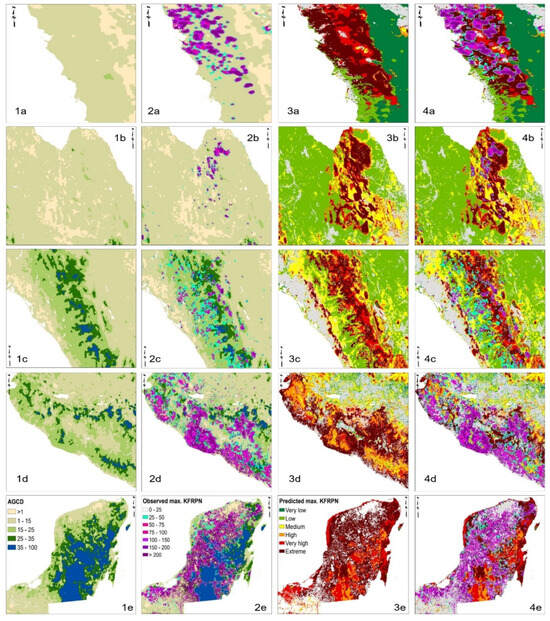
Figure 7.
Local window maps of aboveground biomass (1), aboveground biomass against MODIS observed kernel density of FRPN (2); predicted maximum kernel density of FRPN (3); and predicted against observed kernel density of FRPN (4). Letters (a–e) after numbers 1 to 4 denote the location of the local detail windows as shown in Figure 6(2). KFRPN: kernel density of FRPN; Very low = 1–50 MW/km2; Low = 100–150 MW/km2; Medium = 150–250 MW/km2; High = 250–300 MW/km2; Very high = 300–550 MW/km2; Extreme: >550 MW/km2.
4. Discussion
The Discussion is divided in two sections, the first one dealing with observed variations in the maximum fire intensity between vegetation types and regions and the second one focusing on the spatially explicit modeling of variations in fire intensity within each vegetation type and region. First, we performed an evaluation of remotely sensed fire intensity covering an ample variety of forest ecosystems, ranging from desert shrublands, semiarid and temperate forests to tropical forests. These observations expand our previous knowledge of FRP variations between vegetation units (e.g., [98,120,121]), considering an ample variety of human and climatic conditions [19]. Second, but most importantly, our study goes beyond characterizing differences in FRP between vegetation types (e.g., [109,110,111,112,120,121]) to analyze how the 1 km spatial variation in fire intensity within each of those fuel types and regions is related to internal variations in vegetation productivity (aboveground biomass).
In ecological terms, this supports our proposed expansion of the previously suggested ecological hypothesis regarding varying constraints of fire occurrence (e.g., [24,25,26]) and maximum fire occurrence at an intermediate productivity (e.g., [23,24]). This novel hypothesis is spatially analyzed and demonstrated by modeling the finer-scale variation in fire intensity within vegetation types for a large variety of forest ecosystems and climatic areas. These findings expand our knowledge of within-fuel fire intensity variations, and how they can be affected by finer-scale vegetation characteristics that had been generally overlooked in the previous research on FRP characterization and prediction.
4.1. Variations in Fire Intensity Between Fuel Types and Regions
Our study corroborates that FRP values can vary not only between vegetation types but can also largely vary between regions with different climatic and human conditions (e.g., [98,112,120,121]). In particular, our study expands previous analyses of fire intensity, covering an ample geographical area with a large variety of forest ecosystems, as well as climatic and human conditions, that had been scarcely investigated in terms of remotely sensed fire intensity (e.g., [122,123,124]).
Our observed high intensity in Mexican temperate to semiarid pine and pine–oak forests supports previous observations of higher FRP in conifer forests than in shrubs in the USA, Australia and Brazil by [110] or in Boreal Alaska, by [125]. It also corroborates, based on a 1 km national scale analysis for Mexico, the results of [112], who observed, based on MODIS FRP at 0.25°, that temperate forests globally generally showed a fire regime with high FRP and a high average burned area. The high FRP values observed in semiarid forests in Northern Mexico also agree with observations of high FRP in areas with sparse tree canopies in dry climates, such as the open woodlands of Australia [109] or West Africa [66], or in areas of sparse tree vegetation globally by [112,120,121,126].
On the other hand, our lower observed fire intensity in lower-productivity fuel types such as pasture-dominated grasslands agree with the observations in [65,66] of higher FRP in woodland-dominated savannas than in grass savannas in Africa, or those of higher FRP in shrubs than grasses in the USA, Australia and Brazil in [110]. Furthermore, the very low observed lower intensity in highly fuel-limited vegetation types such as desert shrublands corroborates previous observations of lower FRP values in areas of low fuel loads in desertic shrub and grasslands in Africa [111] and previous observations of low fire occurrence in those ecosystem types in Mexico (e.g., [12,18,117,127]). In addition, these observations confirm the potential of remotely sensed FRP to distinguish between fuel types where higher or lower fire intensity is expected (e.g., [29,34]), supporting the challenge of mapping fuel models and expected fire potential (e.g., [38,39,114]).
Finally, the high intensities observed in tropical forests and, particularly, dry tropical forests in the South-Central region by our study corroborate the previous fire emissions observations in those ecosystems in Mexico from [122,123]. Mexican tropical forests were documented by [123] to provide the largest C emissions (close to one-third of the national total), out of which 70% originated from dry tropical forests. Our observed higher fire intensity in dry tropical forests than in wet tropical forests corroborates similar previous observations of fire emissions by [122], who observed that dry tropical forests represented 50% of fire emissions in their study area in Central and Southern Mexico, while wet tropical forests only contributed to less than 1% of fire emissions. Based on potential fire regimes, Mexican tropical forests are characterized by fire-sensitive species (e.g., [128,129]), since they had not frequently burnt intensely by natural causes prior to human intervention. Nevertheless, human pressure by agricultural activities such as agricultural expansion or hunting has resulted in frequent, intense fires in tropical forests in Central and Southern Mexico (e.g., [19,130,131]) and in other tropical areas (e.g., [132,133,134]).
4.2. Variations in Fire Intensity Within Fuel Types
4.2.1. Fire Intensity Within Semiarid Forests, Shrublands and Pasture
Our observed lower intensity values in the lowest biomass range of the majority of the biomass-fire intensity curves can possibly be attributed to fuel limitation in areas where both fuel loads and connectivity [135] are limited (e.g., [136,137,138,139]). Therefore, our observations of lower intensities in fuel-limited areas suggest that, beyond explaining fire occurrence, the varying constraints hypothesis (e.g., [24,25,26,140,141]) can be expanded by our proposed ecological hypothesis of expected limitations to fire intensity under lower fuel biomass loads and continuity, as corroborated here by a very large sample of remotely sensed FRP values in a large number of semiarid ecosystems.
Some of our models showed increasing FRP in the full range of observed productivity, such as chaparral forests in Northern Baja California (Figure 4a) or semiarid forests in the Western-Central region (Figure 4b). In those regions, the highest FRP likely corresponded to either the shrubs with the highest biomass (Figure 4a) or to adjacent semiarid forests that experienced crown fire (Figure 4b). These observations of increasing FRP with aboveground biomass in these fuels, and also in the lower productivity range of all semiarid forests (Supplementary Figure S2), seem to agree with the previous observations of higher FRP with increasing precipitation (a likely proxy of fine fuel load) and percentage of grass cover in fuel-limited ecosystems in West Africa by [66]. Also, for the lower biomass areas of semiarid regions, where vegetation is dominated by shrub and grass fuels, our observed increase in fire intensity with increasing biomass seems to suggest that the expected increasing flame length with increasing fine fuel load observed by laboratory (e.g., [29]) and field studies (e.g., [27]) can be monitored and modeled using remotely sensed FRP and biomass. Further, our results might also support previous observations of the potential of remotely sensed fire radioactive power to explain flame length in shrublands (e.g., the study in [50] using UAV FRP), by relating MODIS observed fire intensity with expected increasing flame length with increasing biomass in these shrub-dominated fuel types.
On the other hand, several semiarid shrub- and grass-dominated regions displayed some limitation to fire intensity in the higher biomass regions (Supplementary Figure S2). Considering the relatively high biomasses at which these FRP limitations were observed, these areas possibly corresponded to adjacent denser-tree forests, possibly with limited vertical continuity because of their expected high crown base height (e.g., [18,41,138,139]), resulting in weather (surface wind and moisture) and fuel limitations to fire intensity. This would support our proposed hypothesis of both fuel and weather limitations to fire intensity in those more productive areas (i.e., a varying constraints or intermediate-productivity hypothesis to explain fire intensity).
In semiarid- to Mediterranean-climate environments, shrub and grass fuel accumulation is related to plant age and potential productivity determined by climatic and edaphic constraints and is largely influenced by fire frequency (e.g., [136,137,142,143]). Shrub- and grass-dominated semiarid regions in Mexico are expected to have a natural regime of infrequent, severe fires, often leading to stand replacement from the self-regeneration of shrub- and fire-adapted species (e.g., [129,138]). Although our results confirm the occurrence of high-intensity fires, human activities such as agricultural or urban expansion have possibly increased fire frequency compared to historical natural regimes in these semiarid regions in Mexico (e.g., [18,19]), similar to what has been observed in Western US shrublands (e.g., [143,144]) or in many semiarid grassland and shrubland regions globally (e.g., [145,146]). On the other hand, frequent fire suppression (e.g., [18,19]), limiting fire spread to permit the natural renovation of grasses and shrubs, might paradoxically lead to increased potential burn intensity because of fuel accumulation. These challenges highlight the need for the development and application of fire policies supporting ecosystem-specific fire management decisions based on expected fire intensity and species fire adaptations as a consequence of fire regimes (e.g., [2,3,139,147]).
4.2.2. Fire Intensity Within Pine and Oak Forests
Our observations of the highest intensity at intermediate productivity levels in temperate ecosystems are likely related to fuel and moisture limitations to fire intensity at extreme (lowest and highest) biomass values. This would support our proposed expansion of the intermediate productivity (e.g., [23,24]) and varying constraints hypotheses of fire occurrence (e.g., [24,25,26]) for also explaining fire intensity within temperate ecosystems. In transition areas from semiarid shrubby to temperate woody vegetation, higher fuel dryness can be expected (e.g., [117,148]). In addition, high surface and crown fuel availability is also expected in those areas, characterized by secondary wood vegetation, and low and medium tree heights with timber understory fuel models with a low crown base height and small fuel gap (e.g., [41,138,139]). Stands comprising smaller trees are more prone to high-intensity crown fires due to high vertical continuity (e.g., [75,149,150]) This high surface and crown fuel availability, combined with high fuel dryness and wind penetration (e.g., [151,152]), has resulted in the national documentation of larger and more intense fires in those transition areas [123,124]. In addition, our higher observed intensity with increasing biomass in the low- to medium-productivity range of temperate forests might support previous observations in other fuel-limited ecosystems of increased burn severity with increasing indicators of total vegetation productivity such as aboveground biomass [62], canopy cover [68] and NDWI [71]. This also could support those positively relating burn severity to crown biomass [153], crown bulk density [60], tree height heterogeneity [71,75] and surface and crown fuel density [68].
Contrarily, in the denser, high-productivity old-growth temperate forests, our observed lower intensity suggests both fuel and weather influences in limiting intense fire spread. On the one hand, very dense, old-growth temperate forests have higher fuel moisture and lower wind penetration than more open stands (e.g., [18,117,148]), conditions that are conducive to lower expected fire intensity (e.g., [29,150]). In addition, in the temperate forests with the highest tree density, the surface fuel load comprises timber litter, which, because of its higher compaction compared to fine fuels such as shrubs and pasture, results in a lower expected flame length [29,139]. Finally, the very high crown base height of old-growth temperate Mexican forests is expected to result in a resilient structure in those fire-adapted ecosystems (e.g., [18,154]). This latter hypothesis would support previous observations of lower burn severity with higher values of crown base height (e.g., [60,68,149]).
The observed maximum intensity at intermediate biomass levels in pine and oak forests agrees with the expected burn severity based on potential fire regimes for those areas in Mexico (e.g., [129,138]) and the conceptual fire regimes proposed elsewhere (e.g., [131,155]). For example, the conceptual model of fire regimes by [155] proposes that stand-replacing fires are expected at intermediate site productivity, while predictable surface and stand-thinning fires are expected at the lowest and highest productivity levels, respectively. In Mexico, Jardel et al. [129,138] also proposed that frequent, low-severity fires are expected in timber litter-dominated denser stands in wetter, more productive climates (classified as fire-dependent temperate ecosystems). Contrarily, more severe fires are expected in the dry-temperate to semiarid pine and oak forests (termed fire-influenced ecosystems), where surface and crown fuel potential is higher and species are adapted to infrequent, stand-replacing severe fire events [129,138].
Although, to the best of our knowledge, this is the first study documenting those variations in remotely sensed active fire intensity (MODIS FRP) against aboveground biomass, our observed tendencies seem to support previous studies that, using medium-resolution sensors in relatively ample ecoregion areas under temperate to Mediterranean climates, have found a humped relationship of burn severity and proxies of forest productivity (e.g., [61,74]).
4.2.3. Fire Intensity Within Tropical Forests
In the case of dry tropical forests, high vertical continuity and total fuel availability can be expected in medium-biomass areas, where available fuel comprises shrubby vegetation and low-height trees (e.g., [129,138,139]). Although fire behavior as a function of vegetation height has been less documented in the field for tropical Mexican ecosystems (e.g., [156]), our remotely observed FRP tendencies suggest that, under dry conditions, areas of intermediate biomass in dry tropical forests and wetlands are likely to have a large fuel availability that can support very intense fires. This is aggravated by the previously documented correlation between years of high fuel moisture stress with high fire activity (e.g., [117,118]) and high fire intensity and emissions in Mexican dry tropical forests [122,123].
Tropical woody forests are mainly composed of fire-sensitive species [128] that can suffer high mortality after wildfires. Fire-affected areas become more susceptible to recurrent fires as tree cover decreases, which results in increased fuel dryness and load in more open areas (e.g., [133,134,157]). The deforested and disturbed habitat provides spaces for the invasion of exotic grasses that makes the native plant species more vulnerable to frequent and potentially more intense fires (e.g., [133,158]). In this sense, intermediate-biomass areas are possibly connected to agricultural expansion into already fire-degraded tropical forests by human causes, including slash and burn agriculture, which has been documented to cause frequent fires in Mexican ecosystems (e.g., [130,131]) and in other tropical areas (e.g., [134,159,160]).
Our remotely sensed observations of lower intensity in denser, higher-biomass tropical forests provides evidence that the varying constraints [24,25,26] or intermediate-productivity hypotheses (e.g., [23,140]) can be expanded beyond occurrence to also explain the observed lower fire intensity in denser, wetter tropical forests. In those areas, fire intensity is likely limited by a higher fuel moisture, lower wind penetration and lower fuel availability, both in terms of available fine fuel load and lower vertical continuity (e.g., [18,138,139]). This is even more marked in wet tropical forests, which not only have a comparatively lower fire intensity, possibly linked to their evergreen nature and lower moisture stress [117,118], but also showed higher fire intensity limitations under denser canopy conditions in this study.
In addition, lower fire intensities in denser, less degraded areas are possibly linked to lower human accessibility. One example is the low intensity observed in our study in the interior of the Calakmul natural protected area in the Yucatan peninsula (Figure 7(4e)), which is away from populations and road access (e.g., [18,19,123]). On the other hand, human activities such as slash and burn activities might be related to the observed maximum FRP at very high biomass values in regions such as WC1 temperate forests and SE2 tropical forests. In those areas, the high observed fire intensities might be related to deforestation, which has been documented in Mexico for those regions (e.g., [22,130,161]). This would agree with the observed highest FRP values in the densest tropical forests of Brazil, which are subject to harvesting and burning of the entire harvested biomass (e.g., [63]).
While the current study represents a useful, first step towards the spatial characterization and prediction of remotely sensed fire intensity across and within a large variety of vegetation and climatic types, future studies should expand this initial effort by considering additional sources of vegetation and fire intensity data. Regarding vegetation, the recent availability of a global vegetation height map at 30 m (e.g., [56]) could be explored to more clearly differentiate varying situations of open against closed and tall against low plots, and how they influence fire intensity. The recent global availability of satellite LIDAR data such as GEDI, which has been successfully used to map not only tree height (e.g., [56]) but also crown base height [162], should be explored to better improve our understanding of the role of vertical fuel continuity in facilitating crown fires. Current ongoing research projects in Mexico, funded by NORTHCOM-USFS and World Bank to support CONAFOR fire management capacities, are aiming to use UAV with LIDAR and field surface and crown fuel inventory in GEDI footprints towards this goal. Finally, future studies will aim to predict daily FRP from MODIS, VIIRS and GOES sensors, combining the observed role of biomass with wind and moisture forecasts (e.g., [90]), to support fire management decision making.
5. Conclusions
The current study analyzed and mapped, for the first time, the relationships between remotely sensed fire intensity (MODIS FRP) and aboveground biomass at 1 km for a large variety of vegetation types and ecoregions, ranging from arid and semiarid shrublands to temperate and tropical forests. The results reveal the potential of MODIS FRP, combined with remotely sensed biomass, to spatially identify the most hazardous areas, where high intensities and crown fires are expected. The resulting expected wall-to-wall maximum fire intensity, obtained for the entire country, can be fundamental in guiding fire management decision making, including a more efficient prioritization of fire prevention, suppression and post-fire monitoring and restoration planning.
Furthermore, the observed tendencies in the fuel- and region-specific biomass–fire intensity relationships confirmed our novel proposed hypothesis of varying constraints of fire intensity. On the one hand, in the ecosystems with lower productivity, such as chaparral fuels or some semiarid forests, where fine fuels dominate the fuel complex, fire intensity was confirmed to be limited by fuel availability. In the lower-productivity range of those fuel-limited ecosystems, as hypothesized, we observed a positive, non-linear relationship between fire intensity and aboveground biomass (mainly comprising grasses, shrubs and, occasionally, some small trees). On the other hand, in more productive ecosystems, such as temperate or tropical forests and in the highest biomass range of semiarid forests, as expected, a humped relationship of fire intensity and biomass was observed. Maximum fire intensity in those more productive ecosystems was observed at intermediate biomass levels, where fuels are expected to comprise a timber understory which, combined with a low tree crown base height and higher wind penetration than denser stands, results in the highest intensity, possibly associated with crown fires. On the contrary, increasing biomass above this intermediate biomass threshold results in lower fire intensity, likely caused by a higher fuel gap (lower vertical continuity), weather limitations (less wind penetration, higher moisture) and decreased loads of fine fuels (understory shrub and grasses), which are replaced by more compacted, less hazardous fuels (timber litter).
In summary, these results support our novel proposed hypothesis of varying constraints to fire intensity: fine fuel loads limit fire occurrence in lower-productivity ecoregions dominated by grasses and shrubs; maximum fire intensity is observed in medium to high-productivity areas (with timber understory fuel models and low crown base height); and, finally, weather (wind and moisture) and surface and crown fuel limit fire intensity in the denser areas of the most productive ecoregions.
These results suggest that analyzing the FRP–biomass relationships can provide useful information to map expected fire hazards at a national level (1 km resolution), by delineating spatial units based on maximum expected fire intensity. This can aid in the complex task of mapping fuel types and fire potential and might benefit from future studies examining further fuel variables such as tree crown base height or fuel gap, to expand our knowledge of the driving mechanisms of fire behavior and consequently improve fire management planning. The approach demonstrated in this study can be applied in other countries to support fire intensity and hazard forecasting. Finally, future studies will evaluate the spatio-temporal prediction of FRP considering both the examined role of biomass combined with dynamic moisture and wind forecasts, to support in the daily prediction of fire intensity and suppression difficulty to support fire management decision making.
Supplementary Materials
The following supporting information can be downloaded at https://www.mdpi.com/article/10.3390/fire8020054/s1. Figure S1: Observed against predicted kernel density of FRPN for pine and pine–oak forests; Figure S2: Observed against predicted kernel density of FRPN for semiarid forests; Figure S3: Observed against predicted kernel density of FRPN for oak forests and natural pasturelands; Figure S4: Observed against predicted kernel density of FRPN for dry tropical forests; Figure S5: Observed against predicted kernel density of FRPN for wet tropical forests and wetlands; Figure S6: Observed against predicted kernel density of FRPN for desert shrublands.
Author Contributions
Conceptualization: D.J.V.-N., J.G.Á.-G. and A.D.R.-G.; Data curation: M.E.D.-A., A.I.S.-C. and C.I.B.-H.; Formal analysis: D.A.T.-O. and D.J.V.-N.; Methodology: D.J.V.-N., J.B.-R., J.G.Á.-G. and A.D.R.-G.; Software: J.B.-R. and M.E.D.-A.; Writing—original draft: D.J.V.-N. and D.A.T.-O.; Writing—review and editing: J.G.Á.-G., J.J.C.R., P.M.L.-S., E.J.J.-P., D.P.-S. and A.D.R.-G. All authors have read and agreed to the published version of the manuscript.
Funding
Funding for this study was provided by CONAFOR/CONACYT Project “CO-2018-2-A3-S-131553, Reforzamiento al Sistema Nacional de Predicción de Peligro de Incendios Forestales de México para el pronóstico de conglomerados y área quemada (2019–2022)”, for the enhancement of the Forest Fire Danger Prediction System of Mexico, to map and forecast active fire perimeters and burned area, funded by the Sectorial Fund for forest research, development and technological innovation “Fondo Sectorial para la investigación, el desarrollo y la innovación tecnológica forestal”.
Institutional Review Board Statement
Not applicable.
Informed Consent Statement
Not applicable.
Data Availability Statement
MODIS active fires are freely available from FIRMS https://firms.modaps.eosdis.nasa.gov/ (accessed on 20 January 2025). The aboveground biomass map of Mexico from Cartus et al. [59] is publicly available from https://doi.org/10.3390/rs6065559 (accessed on 20 January 2025).
Acknowledgments
We thank the personnel from the Fire Management Agency from the National Forest Comission (CONAFOR) César Alberto Robles Gutiérrez, Fabiola Isabel Esquerra Manjarrez, Úrsula Berenice García Herrera, Alicia Verónica Salas Partida and Juan Miguel Campos Muñoz for their administrative and technical support to secure funding and manage research projects that have guaranteed the continuous functioning and expansion of the National Forest Fire Prediction System of Mexico (SPPIF) (http://forestales.ujed.mx/incendios2/ accessed on 20 January 2025). Their leadership and continuous operational feedback has been key to advance forest fire management research and to promote the development and application of continuously updated technological innovations to support forest fire management in Mexico. We also acknowledge CONAHCYT for the three Msc scholarships to Diana Aime Tinoco-Orozco and Mesías Edwin Dominguez-Amaya in the period 2021–2023 and to Adrian Israel Silva-Cardoza in the period 2019–2022 for the Msc Program of Geomatics applied to forest and natural resources from the Juarez State University of Durango, Mexico, as well as the three PhD scholarships from CONACYHT to Diana Aime Tinoco-Orozco and Mesías Edwin Dominguez-Amaya in the period 2024–to date and to Carlos Ivan Briones-Herrera in the period 2020–2023, for the Institutional Program of Doctorate in Agricultural and Forest Sciences at the Juarez State University of Durango, Mexico.
Conflicts of Interest
The authors declare no conflicts of interest.
References
- Ager, A.A.; Vaillant, N.M.; Finney, M.A. A comparison of landscape fuel treatment strategies to mitigate wildland fire risk in the urban interface and preserve old forest structure. For. Ecol. Manag. 2010, 259, 1556–1570. [Google Scholar] [CrossRef]
- Plana, E.; Serra, M.; Smeenk, A.; Regos, A.; Berchtold, C.; Huertas, M.; Fuentes, L.; Trasobares, A.; Vinders, J.N.; Colaço, C.; et al. Framing Coherence Across EU Policies Towards Integrated Wildfire Risk Management and Nature-Based Solutions. Fire 2024, 7, 415. [Google Scholar] [CrossRef]
- Pais, S.; Aquilué, N.; Honrado, J.P.; Fernandes, P.M.; Regos, A. Optimizing Wildfire Prevention through the Integration of Prescribed Burning into ‘Fire-Smart’ Land-Use Policies. Fire 2023, 6, 457. [Google Scholar] [CrossRef]
- Calkin, D.C.; Finney, M.A.; Ager, A.A.; Thompson, M.P.; Gebert, K.M. Progress towards and barriers to implementation of a risk framework for US federal wildland fire policy and decision making. For. Policy Econ. 2011, 13, 378–389. [Google Scholar] [CrossRef]
- Curt, T.; Fréjaville, T.; Lahaye, S. Modeling the spatial patterns of ignition causes and fire regime features in south France: Implications for fire prevention policy. Int. J. Wildland Fire 2016, 25, 785–796. [Google Scholar] [CrossRef]
- Silva, F.R.; Molina Martínez, J.R.; González-Cabán, A. A Methodology for Determining Operational Priorities for Prevention and Suppression of Wildland Fires. Int. J. Wildland Fire 2014, 24, 544–554. [Google Scholar] [CrossRef]
- Silva, F.R.; O’Connor, C.D.; Thompson, M.P.; Martinez, J.R.M.; Calkin, D.E. Modelling suppression difficulty: Current and future applications. Int. J. Wildland Fire 2020, 29, 752. [Google Scholar] [CrossRef]
- Lecina-Diaz, J.; Chas-Amil, M.L.; Aquilué, N.; Sil, Â.; Brotons, L.; Regos, A.; Touza, J. Incorporating fire-smartness into agricultural policies reduces suppression costs and ecosystem services damages from wildfires. J. Environ. Manag. 2023, 337, 117707. [Google Scholar] [CrossRef]
- Finney, M.A. The challenge of quantitative risk analysis for wildland fire. For. Ecol. Manag. 2005, 211, 97–108. [Google Scholar] [CrossRef]
- Thompson, M.P.; Calkin, D.E. Uncertainty and risk in wildland fire management: A review. J. Environ. Manag. 2011, 92, 1895–1909. [Google Scholar] [CrossRef]
- Oliveira, S.; Pereira, J.M.C.; San Miguel-Ayanz, J.; Lourenco, L. Exploring the spatial patterns of fire density in Southern Europe using geographically weighted regression. Appl. Geogr. 2014, 51, 143–157. [Google Scholar] [CrossRef]
- Ávila-Flores, D.; Pompa-García, M.; Antonio-Nemiga, X.; Rodríguez-Trejo, D.A.; Vargas-Pérez, E.; Santillan-Perez, J. Driving factors for forest fire occurrence in Durango State of Mexico: A geospatial perspective. Chin. Geogr. Sci. 2010, 20, 491–497. [Google Scholar] [CrossRef]
- Rodríguez, M.; Jiménez-Ruano, A.; Peña-Angulo, D.; de la Riva, J. A comprehensive spatial-temporal analysis of driving factors of human-caused wildfires in Spain using Geographically Weighted Logistic Regression. J. Environ. Manag. 2018, 255, 177–192. [Google Scholar] [CrossRef] [PubMed]
- Keane, R.E.; Agee, J.K.; Fulé, P. Ecological effects of large fires on US landscapes: Benefit or catastrophe? Int. J. Wildland Fire 2008, 17, 696–712. [Google Scholar] [CrossRef]
- Hurteau, M.; North, M. Fuel treatment effects on tree-based forest carbon storage and emissions under modeled wildfire scenarios. Front. Ecol. Environ. 2009, 7, 409–414. [Google Scholar] [CrossRef]
- Hurteau, M.D.; Brooks, M.L. Short- and long-term effects of fire on carbon in US dry temperate forest systems. Bioscience 2011, 61, 139–146. [Google Scholar] [CrossRef]
- Archibald, S.; Roy, D.P.; Van Wilgen, B.W.; Scholes, R.J. What limits fire? An examination of drivers of burnt area in Southern Africa. Glob. Change Biol. 2009, 15, 613–630. [Google Scholar] [CrossRef]
- Briones-Herrera, C.I.; Vega-Nieva, D.J.; Monjarás-Vega, N.A.; Flores-Medina, F.; López-Serrano, P.M.; Corral-Rivas, J.J.; Carrillo-Parra, A.; Pulgarín-Gámiz, M.A.; Alvarado-Celestino, E.; González-Cabán, A.; et al. Modeling and mapping forest fire occurrence from aboveground carbon density in Mexico. Forests 2019, 10, 402. [Google Scholar] [CrossRef]
- Monjarás-Vega, N.; Briones-Herrera, C.I.; Vega-Nieva, D.J.; Calleros-Flores, E.; Corral-Rivas, J.J.; López-Serrano, P.; Pompa-García, M.; Rodríguez-Trejo, D.; Carrillo-Parra, A.; González-Cabán, A.; et al. Predicting forest fire kernel density at multiple scales with geographically weighted regression in Mexico. Sci. Total Environ. 2020, 718, 137313. [Google Scholar] [CrossRef]
- Kahiu, M.N.; Hanan, N.P. Fire in subSaharan Africa: The fuel, cure and connectivity hypothesis. Glob. Ecol. Biogeogr. 2018, 27, 946–957. [Google Scholar] [CrossRef]
- Jiménez-Ruano, A.; Jolly, W.M.; Freeborn, P.H.; Vega-Nieva, D.J.; Monjarás-Vega, N.A.; Briones-Herrera, C.I.; Rodrigues, M. Spatial Predictions of Human and Natural-Caused Wildfire Likelihood across Montana (USA). Forests 2022, 13, 1200. [Google Scholar] [CrossRef]
- Toledo-Jaime, C.; Díaz-Avalos, C.; Chaudhuri, S.; Serra, L.; Juan, P. Understanding Wildfire Occurrence and Size in Jalisco, Mexico: A Spatio-Temporal Analysis. Mexico: A Spatio-Temporal Analysis. For. Ecol. Mgt. 2024, 573, 122349. [Google Scholar] [CrossRef]
- Pausas, J.G.; Ribeiro, E. The global fire–productivity relationship. Glob. Ecol. Biogeogr. 2013, 22, 728–736. [Google Scholar] [CrossRef]
- Bradstock, R.A. A biogeographic model of fire regimes in Australia: Current and future implications. Glob. Ecol. Biogeogr. 2010, 19, 145–158. [Google Scholar] [CrossRef]
- Krawchuk, M.A.; Moritz, M.A. Constraints on global fire activity vary across a resource gradient. Ecology 2011, 92, 121–132. [Google Scholar] [CrossRef]
- Camp, P.E.; Krawchuk, M.A. Spatially varying constraints of human-caused fire occurrence in British Columbia, Canada. Int. J. Wildland Fire 2017, 26, 219–229. [Google Scholar] [CrossRef]
- Fernandes, P.M.; Botelho, H.S.; Rego, F.C.; Loureiro, C. Empirical modelling of surface fire behaviour in maritime pine stands. Int. J. Wildland Fire 2009, 18, 698–710. [Google Scholar] [CrossRef]
- Finney, M.A. FARSITE—Fire Area Simulator—Model Development and Evaluation; Research Paper RMRS–RP–4; Forest Service, Rocky Mountain Research Station: Ogden, UT, USA, 2004; 47p.
- Scott, J.H.; Burgan, R.E. Standard Fire Behavior Fuel Models: A Comprehensive Set for Use with Rothermel’s Surface Fire Spread Model; Report no. General Technical Report RMRS-GTR-153; U.S. Department of Agriculture, Forest Service, Rocky Mountain Research Station: Fort Collins, CO, USA, 2005.
- Miller, C.; Ager, A. A review of recent advances in risk analysis for wildfire management. Int. J. Wildland Fire 2013, 22, 1–14. [Google Scholar] [CrossRef]
- Botequim, B.; Fernandes, P.; Borges, J.; González-Ferreiro, E.; Guerra, J. Improving silvicultural practices for Mediterranean forests through fire behaviour modelling using LiDAR-derived canopy fuel characteristics. Int. J. Wildland Fire 2019, 28, 823–839. [Google Scholar] [CrossRef]
- Rincón, T.; Alonso, L.; Picos, J.; Molina-Terrén, D.M.; Armesto, J. A Systematic Approach to Map and Evaluate the Wildfire Behavior at a Territorial Scale in the Northwestern Iberian Peninsula. Fire 2024, 7, 249. [Google Scholar] [CrossRef]
- Bachmann, A.; Allgöwer, B. Uncertainty propagation in wildland fire behaviour modeling. Int. J. Geogr. Inf. Sci. 2002, 16, 115–127. [Google Scholar] [CrossRef]
- Cruz, M.G.; Alexander, M.E. Assessing crown fire potential in coniferous forests of western North America: A critique of current approaches and recent simulation studies. Int. J. Wildland Fire 2010, 19, 377–398. [Google Scholar] [CrossRef]
- Jones, S.D.; Garvey, M.F.; Hunter, G.J. Where’s the fire? Quantifying uncertainty in a wildfire threat model. Int. J. Wildland Fire 2004, 13, 17–25. [Google Scholar] [CrossRef]
- Cardil, A.; Monedero, S.; Ramírez, J.; Silva, C.A. Assessing and reinitializing wildland fire simulations through satellite active fire data. J. Environ. Manag. 2019, 231, 996–1003. [Google Scholar] [CrossRef]
- Cardil, A.; Monedero, S.; Silva, C.A.; Ramirez, J. Adjusting the rate of spread of fire simulations in real-time. Ecol. Model. 2019, 395, 39–44. [Google Scholar] [CrossRef]
- Keane, R.E.; Burgan, R.; van Wagtendonk, J. Mapping wildland fuels for fire management across multiple scales: Integrating remote sensing, GIS, and biophysical setting. Int. J. Wildland Fire 2001, 10, 301–319. [Google Scholar] [CrossRef]
- Rollins, M.G.; Keane, R.E.; Parsons, R.A. Mapping fuels and fire regimes using remote sensing, ecosystem simulation, and gradient modeling. Ecol. Appl. 2004, 14, 75–95. [Google Scholar] [CrossRef]
- Arellano-Pérez, S.; Castedo-Dorado, F.; López-Sánchez, C.A.; González-Ferreiro, E.; Yang, Z.; Díaz-Varela, R.A.; Álvarez-González, J.G.; Vega, J.A.; Ruiz-González, A.D. Potential of Sentinel-2A Data to Model Surface and Canopy Fuel Characteristics in Relation to Crown Fire Hazard. Remote Sens. 2018, 10, 1645. [Google Scholar] [CrossRef]
- Flores-Medina, F.; Vega-Nieva, D.J.; Monjarás-Vega, N.; Briones-Herrera, C.I.; Corral-Rivas, J.J.; Calleros, E.; López-Serrano, P.M.; Alvarado, E.; González-Cabán, A.; Pérez-Salicrup, D.; et al. Mapping fuel loads and fire behavior from Sentinel in Durango, NW Mexico. In Proceedings of the 6th International Fire Behavior and Fuels Conference, Albuquerque, NM, USA, 29 April–3 May 2019; Available online: https://www.researchgate.net/profile/Favian-Flores-Medina/publication/333745210_Mapping_fuel_loads_and_fire_behavior_from_Sentinel_in_Durango/links/5d01b63ba6fdccd130969bf1/Mapping-fuel-loads-and-fire-behavior-from-Sentinel-in-Durango.pdf (accessed on 30 November 2024).
- Alonso-Rego, C.; Arellano-Pérez, S.; Guerra-Hernández, J.; Molina-Valero, J.A.; Martínez-Calvo, A.; Pérez-Cruzado, C.; Castedo-Dorado, F.; González-Ferreiro, E.; Álvarez-González, J.G.; Ruiz-González, A.D. Estimating Stand and Fire-Related Surface and Canopy Fuel Variables in Pine Stands Using Low-Density Airborne and Single-Scan Terrestrial Laser Scanning Data. Remote Sens. 2021, 13, 5170. [Google Scholar] [CrossRef]
- Castedo-Dorado, F.; Gómez-Vázquez, I.; Fernandes, P.M.; Crecente-Campo, F. Shrub fuel characteristics estimated from overstory variables in NW Spain pine stands. For. Ecol. Manag. 2012, 275, 130–141. [Google Scholar] [CrossRef]
- Castedo-Dorado, F.; Ruiz-González, A.D.; Hidalgo, J.A.V.; Arellano-Pérez, S.; Álvarez-González, J.G. Use of national forest inventory data to develop stand density driven models for understorey shrubs and overstorey fuel variables and associated temporal dynamics in commercial plantations. For. Ecol. Manag. 2024, 553, 121597. [Google Scholar] [CrossRef]
- Sá, A.C.L.; Pereira, J.M.C.; Charlton, M.E.; Mota, B.; Barbosa, P.M.; Fotheringham, A.S. The pyrogeography of sub-Saharan Africa: A study of the spatial non-stationarity of fire-environment relationships using GWR. J. Geogr. Syst. 2011, 13, 227–248. [Google Scholar] [CrossRef]
- Zhang, Y.; Lim, S.; Sharples, J.J. Modelling spatial patterns of wildfire occurrence in South-Eastern Australia. Geomat. Nat. Hazards Risk 2016, 7, 1800–1815. [Google Scholar] [CrossRef]
- Haas, O.; Prentice, I.C.; Harrison, S.P. Global environmental controls on wildfire burnt area, size, and intensity. Environ. Res. Lett. 2022, 17, 065004. [Google Scholar] [CrossRef]
- Parks, S.A.; Dobrowski, S.Z.; Panunto, M.H. What drives low-severity fire in the southwestern USA? For. Sci. 2018, 9, 165. [Google Scholar] [CrossRef]
- Parks, S.A.; Holsinger, L.M.; Panunto, M.H.; Jolly, W.M.; Dobrowski, S.Z.; Dillon, G.K. High-severity fire: Evaluating its key drivers and mapping its probability across western US forests. Environ. Res. Lett. 2018, 13, 044037. [Google Scholar] [CrossRef]
- Johnston, J.M.; Wooster, M.J.; Paugam, R.; Wang, X.; Lynham, T.J.; Johnston, L.M. Direct estimation of Byram’s fire intensity from infrared remote sensing imagery. Int. J. Wildland Fire 2017, 26, 668–684. [Google Scholar] [CrossRef]
- Ellicott, E.; Vermote, E. The science and application of satellite-based fire radiative energy. In Remote Sensing of Biomass—Principles and Applications; Thenkabail, P.S., Ed.; InTech: London, UK, 2012; pp. 178–192. [Google Scholar]
- Wooster, M.J.; Roberts, G.J.; Giglio, L.; Roy, D.P.; Freeborn, P.H.; Boschetti, L.; San-Miguel-Ayanz, J. Satellite remote sensing of active fires: History and current status, applications and future requirements. Remote Sens. Environ. 2021, 267, 112694. [Google Scholar] [CrossRef]
- Parks, S.A.; Holsinger, L.M.; Voss, M.A.; Loehman, R.A.; Robinson, N.P. Mean composite fire severity metrics computed with Google Earth Engine offer improved accuracy and expanded mapping potential. Remote Sens. 2018, 10, 879. [Google Scholar] [CrossRef]
- Moya, D.; Madrigal, J.; Fontúrbel, T.; Marino, E.; Hernando, C.; Guijarro, M.; de las Heras, J. Fire severity assessments in both the laboratory and the field. Fire Eff. Soil Prop. 2019, 241, 241–266. [Google Scholar]
- Fernández-García, V.; Santamarta, M.; Fernández-Manso, A.; Quintano, C.; Marcos, E.; Calvo, L. Burn severity metrics in fire-prone pine ecosystems along a climatic gradient using Landsat imagery. Remote Sens. Environ. 2018, 206, 205–217. [Google Scholar] [CrossRef]
- Potapov, P.; Li, X.; Hernandez-Serna, A.; Tyukavina, A.; Hansen, M.C.; Kommareddy, A.; Pickens, A.; Turubanova, S.; Tang, H.; Silva, C.E.; et al. Mapping global forest canopy height through integration of GEDI and Landsat data. Remote Sens. Environ. 2021, 253, 112165. [Google Scholar] [CrossRef]
- Hansen, M.C.; Potapov, P.V.; Moore, R.; Hancher, M.; Turubanova, S.A.; Tyukavina, A.; Townshend, J.R.G. High-resolution global maps of 21st-century forest cover change. Science 2013, 342, 850–853. [Google Scholar] [CrossRef] [PubMed]
- Hansen, M.C.; DeFries, R.S.; Townshend, J.R.G.; Carroll, M.; Dimiceli, C.; Sohlberg, R.A. Global percent tree cover at a spatial resolution of 500 m: First results of the MODIS vegetation continuous fields algorithm. Earth Interact. 2003, 7, 1–15. [Google Scholar] [CrossRef]
- Cartus, O.; Kellndorfer, J.; Walker, W.; Franco, C.; Bishop, J.; Santos, L.; Fuentes, M.M. A national, detailed map of forest aboveground carbon stocks in Mexico. Remote Sens. 2014, 6, 5559–5588. [Google Scholar] [CrossRef]
- Fernández-Alonso, J.M.; Vega, J.A.; Jiménez, E.; Ruiz-González, A.D.; Álvarez-González, J.G. Spatially modeling wildland fire severity in pine forests of Galicia, Spain. Eur. J. For. Res. 2017, 136, 105–121. [Google Scholar] [CrossRef]
- Fernández-García, V.; Beltrán-Marcos, D.; Fernández-Guisuraga, J.M.; Marcos, E.; Calvo, L. Predicting potential wildfire severity across Southern Europe with global data sources. Sci. Total Environ. 2022, 829, 154729. [Google Scholar] [CrossRef]
- Fernández-Guisuraga, J.M.; Suárez-Seoane, S.; Fernandes, P.M.; Fernández-García, V.; Fernández-Manso, A.; Quintano, C.; Calvo, L. Pre-fire aboveground biomass, estimated from LiDAR, spectral, and field inventory data, as a major driver of burn severity in maritime pine (Pinus pinaster) ecosystems. For. Ecosyst. 2022, 9, 100022. [Google Scholar] [CrossRef]
- Schroeder, W.; Csiszar, I.; Giglio, L.; Schmidt, C.C. On the use of fire radiative power, area, and temperature estimates to characterize biomass burning via moderate to coarse spatial resolution remote sensing data in the Brazilian Amazon. J. Geophys. Res. Atmos. 2010, 115, D21. [Google Scholar] [CrossRef]
- Wooster, M.J.; Zhang, Y.H. Boreal forest fires burn less intensely in Russia than in North America. Geophys. Res. Lett. 2004, 31, L20505. [Google Scholar] [CrossRef]
- Dwomoh, F.K.; Wimberly, M.C. Fire regimes and their drivers in the Upper Guinean Region of West Africa. Remote Sens. 2017, 9, 1117. [Google Scholar] [CrossRef]
- Eckmann, T.C.; Still, C.J.; Roberts, D.A.; Michaelsen, J.C. Variations in subpixel fire properties with season and land cover in Southern Africa. Earth Interact. 2010, 14, 1–29. [Google Scholar] [CrossRef]
- Viedma, O.; Quesada, J.; Torres, I.; De Santis, A.; Moreno, J.M. Fire severity in a large fire in a Pinus pinaster forest is highly predictable from burning conditions, stand structure, and topography. Ecosystems 2015, 18, 237–250. [Google Scholar] [CrossRef]
- Fernández-Guisuraga, J.M.; Fernandes, P.M. Using pre-fire high point cloud density LiDAR data to predict fire severity in Central Portugal. Remote Sens. 2023, 15, 768. [Google Scholar] [CrossRef]
- Wu, Z.; He, H.S.; Bobryk, C.W.; Liang, Y. Scale effects of vegetation and topography on burn severity under prevailing fire weather conditions in boreal forest landscapes of Northeastern China. Scand. J. For. Res. 2014, 29, 60–70. [Google Scholar] [CrossRef]
- Wu, Z.; He, H.S.; Liang, Y.; Cai, L.; Lewis, B.J. Determining relative contributions of vegetation and topography to burn severity from LANDSAT imagery. Environ. Manag. 2013, 52, 821–836. [Google Scholar] [CrossRef]
- García-Llamas, P.; Suárez-Seoane, S.; Taboada, A.; Fernández-Manso, A.; Quintano, C.; Fernández-García, V.; Calvo, L. Environmental drivers of fire severity in extreme fire events that affect Mediterranean pine forest ecosystems. For. Ecol. Manag. 2018, 433, 24–32. [Google Scholar] [CrossRef]
- Dillon, G.; Morgan, P.; Holden, Z. Mapping the potential for high-severity wildfire in the western United States. Fire Manag. Today 2011, 71, 25–28. [Google Scholar]
- Parks, S.A.; Parisien, M.A.; Miller, C.; Dobrowski, S.Z. Fire activity and severity in the western US vary along proxy gradients representing fuel amount and fuel moisture. PLoS ONE 2014, 9, e99699. [Google Scholar] [CrossRef]
- Beltrán-Marcos, D.; Suárez-Seoane, S.; Fernández-Guisuraga, J.M.; Azevedo, J.C.; Calvo, L. Fire regime attributes shape pre-fire vegetation characteristics controlling extreme fire behavior under different bioregions in Spain. Fire Ecol. 2024, 20, 47. [Google Scholar] [CrossRef]
- Viedma, O.; Chico, F.; Fernández, J.J.; Madrigal, C.; Safford, H.D.; Moreno, J.M. Disentangling the role of prefire vegetation vs. burning conditions on fire severity in a large forest fire in SE Spain. Remote Sens. Environ. 2020, 247, 111891. [Google Scholar] [CrossRef]
- Morgan, P.; Keane, R.E.; Dillon, G.K.; Jain, T.B.; Hudak, A.T.; Karau, E.C.; Sikkink, P.G.; Holden, Z.A.; Strand, E.K. Challenges of assessing fire and burn severity using field measures, remote sensing, and modelling. Int. J. Wildland Fire 2014, 23, 1045–1060. [Google Scholar] [CrossRef]
- Fernández-Guisuraga, J.M.; Fernández-Manso, A.; Quintano, C.; Fernández-García, V.; Cerrillo, A.; Marqués, G.; Cascallana, G.; Calvo, L. FIREMAP: Cloud-based software to automate the estimation of wildfire-induced ecological impacts and recovery processes using remote sensing techniques. Ecol. Inform. 2024, 81, 102591. [Google Scholar] [CrossRef]
- Silva-Cardoza, A.I.; Vega-Nieva, D.J.; Briseño-Reyes, J.; Briones-Herrera, C.I.; López-Serrano, P.M.; Corral-Rivas, J.J.; Parks, S.A.; Holsinger, L.M. Evaluating a New Relative Phenological Correction and the Effect of Sentinel-Based Earth Engine Compositing Approaches to Map Fire Severity and Burned Area. Remote Sens. 2022, 14, 3122. [Google Scholar] [CrossRef]
- Llorens, R.; Sobrino, J.A.; Fernández, C.; Fernández-Alonso, J.M.; Vega, J.A. A methodology to estimate forest fires burned areas and burn severity degrees using Sentinel-2 data. Application to the October 2017 fires in the Iberian Peninsula. Int. J. Appl. Earth Obs. Geoinf. 2021, 95, 102243. [Google Scholar] [CrossRef]
- Fernández, C.; Fernández-Alonso, J.M.; Vega, J.A.; Fontúrbel, T.; Llorens, R.; Sobrino, J.A. Exploring the use of spectral indices to assess alterations in soil properties in pine stands affected by crown fire in Spain. Fire Ecol. 2021, 17, 2. [Google Scholar] [CrossRef]
- Dillon, G.K.; Panunto, M.H.; Davis, B.; Morgan, P.; Birch, D.S.; Jolly, W.M. Development of a Severe Fire Potential Map for the Contiguous United States; General Technical Report RMRS GTR-415; U.S. Department of Agriculture, Forest Service, Rocky Mountain Research Station: Fort Collins, CO, USA, 2020; 107p. Available online: https://www.fs.usda.gov/rm/pubs_series/rmrs/gtr/rmrs_gtr415.pdf (accessed on 30 November 2024).
- Li, F.; Zhang, X.; Roy, D.P.; Kondragunta, S. Estimation of biomass-burning emissions by fusing the fire radiative power retrievals from polar-orbiting and geostationary satellites across the conterminous United States. Atmos. Environ. 2019, 211, 274–287. [Google Scholar] [CrossRef]
- Roberts, G.; Wooster, M.; Freeborn, P.H.; Xu, W. Integration of geostationary FRP and polar-orbiter burned area datasets for an enhanced biomass burning inventory. Remote Sens. Environ. 2011, 115, 2047–2061. [Google Scholar] [CrossRef]
- Roberts, G.; Wooster, M.J.; Perry, G.L.; Drake, N.; Rebelo, L.M.; Dipotso, F. Retrieval of biomass combustion rates and totals from fire radiative power observations: Application to southern Africa using geostationary SEVIRI imagery. J. Geophys. Res. Atmos. 2005, 110, D21. [Google Scholar] [CrossRef]
- Roberts, G.; Wooster, M.J.; Xu, W.; He, J. Fire activity and fuel consumption dynamics in sub-Saharan Africa. Remote Sens. 2018, 10, 1591. [Google Scholar] [CrossRef]
- Ruecker, G.; Leimbach, D.; Tiemann, J. Estimation of Byram’s Fire Intensity and Rate of Spread from Spaceborne Remote Sensing Data in a Savanna Landscape. Fire 2021, 4, 65. [Google Scholar] [CrossRef]
- Chatzopoulos-Vouzoglanis, K.; Reinke, K.J.; Soto-Berelov, M.; Jones, S.D. One year of near-continuous fire monitoring on a continental scale: Comparing fire radiative power from polar-orbiting and geostationary observations. Int. J. Appl. Earth Obs. Geoinf. 2023, 117, 103214. [Google Scholar] [CrossRef]
- Wooster, M.J.; Roberts, G.; Perry, G.L.; Kaufman, Y.J. Retrieval of biomass combustion rates and totals from fire radiative power observations: FRP derivation and calibration relationships between biomass consumption and fire radiative energy release. J. Geophys. Res. Atmos. 2005, 110, D24. [Google Scholar] [CrossRef]
- Smith, A.M.; Wooster, M.J. Remote classification of head and backfire types from MODIS fire radiative power and smoke plume observations. Int. J. Wildland Fire 2005, 14, 249–254. [Google Scholar] [CrossRef]
- Jolly, W.M.; Freeborn, P.H. Towards improving wildland firefighter situational awareness through daily fire behaviour risk assessments in the US Northern Rockies and Northern Great Basin. Int. J. Wildland Fire 2017, 26, 574–586. [Google Scholar] [CrossRef]
- Heward, H.; Smith, A.M.; Roy, D.P.; Tinkham, W.T.; Hoffman, C.M.; Morgan, P.; Lannom, K.O. Is burn severity related to fire intensity? Observations from landscape scale remote sensing. Int. J. Wildland Fire 2013, 22, 910–918. [Google Scholar] [CrossRef]
- Henry, M.C.; Maingi, J.K.; McCarty, J. Fire on the water towers: Mapping burn scars on Mount Kenya using satellite data to reconstruct recent fire history. Remote Sens. 2019, 11, 104. [Google Scholar] [CrossRef]
- Chatzopoulos-Vouzoglanis, K.; Reinke, K.J.; Soto-Berelov, M.; Jones, S.D. Are fire intensity and burn severity associated? Advancing our understanding of FRP and NBR metrics from Himawari-8/9 and Sentinel-2. Int. J. Appl. Earth Obs. Geoinf. 2024, 127, 103673. [Google Scholar] [CrossRef]
- Sparks, A.M.; Kolden, C.A.; Smith, A.M.; Boschetti, L.; Johnson, D.M.; Cochrane, M.A. Fire intensity impacts on post-fire temperate coniferous forest net primary productivity. Biogeosciences 2018, 15, 1173–2028. [Google Scholar] [CrossRef]
- Sparks, A.M.; Smith, A.M.; Talhelm, A.F.; Kolden, C.A.; Yedinak, K.M.; Johnson, D.M. Impacts of fire radiative flux on mature Pinus ponderosa growth and vulnerability to secondary mortality agents. Int. J. Wildland Fire 2017, 26, 2032–2034. [Google Scholar] [CrossRef]
- Wooster, M.J. Small-scale experimental testing of fire radiative energy for quantifying mass combusted in natural vegetation fires. Geophys. Res. Lett. 2002, 29, 23-1–23-4. [Google Scholar] [CrossRef]
- Ichoku, C.; Kaufman, Y.J. A method to derive smoke emission rates from MODIS fire radiative energy measurements. IEEE Trans. Geosci. Remote Sens. 2005, 43, 2636–2649. [Google Scholar] [CrossRef]
- Ichoku, C.; Giglio, L.; Wooster, M.J.; Remer, L.A. Global characterization of biomass-burning patterns using satellite measurements of fire radiative energy. Remote Sens. Environ. 2008, 112, 2950–2962. [Google Scholar] [CrossRef]
- Ichoku, C.; Ellison, L. Global top-down smoke-aerosol emissions estimation using satellite fire radiative power measurements. Atmos. Chem. Phys. 2014, 14, 6643–6667. [Google Scholar] [CrossRef]
- Mota, B.; Wooster, M.J. A new top-down approach for directly estimating biomass burning emissions and fuel consumption rates and totals from geostationary satellite fire radiative power (FRP). Remote Sens. Environ. 2018, 206, 45–62. [Google Scholar] [CrossRef]
- Ellicott, E.; Vermote, E.; Giglio, L.; Roberts, G. Estimating biomass consumed from fire using MODIS FRE. Geophys. Res. Lett. 2009, 36, L13401. [Google Scholar] [CrossRef]
- Kaiser, J.W.; Heil, A.; Andreae, M.O.; Benedetti, A.; Chubarova, N.; Jones, L.; Morcrette, J.J.; Razinger, M.; Schultz, M.G.; Suttie, M.; et al. Biomass burning emissions estimated with a global fire assimilation system based on observed fire radiative power. Biogeosciences 2012, 9, 527–554. [Google Scholar] [CrossRef]
- Sofiev, M.; Vankevich, R.; Lotjonen, M.; Prank, M.; Petukhov, V.; Ermakova, T.; Koskinen, J.; Kukkonen, J. An operational system for the assimilation of the 2013 satellite information on wild-land fires for the needs of air quality modelling and 2014 forecasting. Atmos. Chem. Phys. 2009, 9, 6833–6847. [Google Scholar] [CrossRef]
- Zhang, X.S.; Kondragunta, S.; Ram, J.; Schmidt, C.; Huang, H.C. Near-real-time global biomass burning emissions product from geostationary satellite constellation. J. Geophys. Res. Atmos. 2012, 117, 2176. [Google Scholar] [CrossRef]
- Briones-Herrera, C.I.; Vega-Nieva, D.J.; Monjarás-Vega, N.A.; Briseño-Reyes, J.; López-Serrano, P.M.; Corral-Rivas, J.J.; Alvarado-Celestino, E.; Arellano-Pérez, S.; Álvarez-González, J.G.; Ruiz-González, A.D.; et al. Near Real-Time Automated Early Mapping of the Perimeter of Large Forest Fires from the Aggregation of VIIRS and MODIS Active Fires in Mexico. Remote Sens. 2020, 12, 2061. [Google Scholar] [CrossRef]
- Briones-Herrera, C.I.; Vega-Nieva, D.J.; Briseño-Reyes, J.; Monjarás-Vega, N.A.; López-Serrano, P.M.; Corral-Rivas, J.J.; Alvarado, E.; Arellano-Pérez, S.; Jardel Peláez, E.J.; Pérez Salicrup, D.R.; et al. Fuel-Specific Aggregation of Active Fire Detections for Rapid Mapping of Forest Fire Perimeters in Mexico. Forests 2022, 13, 124. [Google Scholar] [CrossRef]
- Parks, S.A. Mapping day-of-burning with coarse resolution satellite fire-detection data. Int. J. Wildland Fire 2014, 23, 215–223. [Google Scholar] [CrossRef]
- Veraverbeke, S.; Sedano, F.; Hook, S.J.; Randerson, J.T.; Jin Yufang, J.; Brendan, R.M. Mapping the daily progression of large wildland fires using MODIS active fire data. Int. J. Wildland Fire 2014, 23, 655–667. [Google Scholar] [CrossRef]
- Oliveira, S.L.; Maier, S.W.; Pereira, J.M.; Russell-Smith, J. Seasonal differences in fire activity and intensity in tropical savannas of northern Australia using satellite measurements of fire radiative power. Int. J. Wildland Fire 2015, 24, 249–260. [Google Scholar] [CrossRef]
- Kganyago, M.; Shikwambana, L. Assessment of the characteristics of recent major wildfires in the USA, Australia and Brazil in 2018–2019 using multi-source satellite products. Remote Sens. 2020, 12, 1803. [Google Scholar] [CrossRef]
- Mupfiga, U.N.; Mutanga, O.; Dube, T.; Kowe, P. Spatial clustering of vegetation fire intensity using MODIS satellite data. Atmosphere 2022, 13, 1972. [Google Scholar] [CrossRef]
- García, M.; Pettinari, M.L.; Chuvieco, E.; Salas, J.; Mouillot, F.; Chen, W.; Aguado, I. Characterizing Global Fire Regimes from Satellite-Derived Products. Forests 2022, 13, 699. [Google Scholar] [CrossRef]
- Li, Y.; Janssen, T.A.; Chen, R.; He, B.; Veraverbeke, S. Trends and drivers of Arctic-boreal fire intensity between 2003 and 2022. Sci. Total Environ. 2024, 926, 172020. [Google Scholar] [CrossRef]
- Jardel, P.E.; Quintero, G.S.; Jiménez, L.A.; Graf, P.D.; Rodríguez, G.J. Generación de Modelos de Comportamiento del Fuego para los Tipos de Combustibles Forestales de México Informe del Proyecto: “Caracterización y Clasificación de Combustibles para Generar y Validar Modelos de Combustibles Forestales para México” CONAFOR-CONACyT 2014-CO2-251694. 2018. Available online: https://forestales.ujed.mx/incendios2/php/publicaciones_documentos/8_2_Jardel%20et%20al%2017a-ETAPA%20III%20Producto%204.1%20Modelos%20de%20combustibles.pdf (accessed on 30 November 2024).
- INEGI (Instituto Nacional de Estadística y Geografía-México). Guía Para la Interpretación de Cartografía: Uso del suelo y Vegetación. escala 1, 250, 000: Serie V; Instituto Nacional de Estadística y Geografía: Ciudad de México, México, 2011. [Google Scholar]
- Fu, Y.; Li, R.; Wang, X.; Bergeron, Y.; Valeria, O.; Chavardès, R.D.; Wang, Y.; Hu, J. Fire Detection and Fire Radiative Power in Forests and Low-Biomass Lands in Northeast Asia: MODIS versus VIIRS Fire Products. Remote Sens. 2020, 12, 2870. [Google Scholar] [CrossRef]
- Vega-Nieva, D.J.; Briseño-Reyes, J.; Nava-Miranda, M.G.; Calleros-Flores, E.; López-Serrano, P.M.; Corral-Rivas, J.J.; Montiel-Antuna, E.; Cruz-López, M.I.; Cuahutle, M.; Ressl, R.; et al. Developing Models to Predict the Number of Fire Hotspots from an Accumulated Fuel Dryness Index by Vegetation Type and Region in Mexico. Forests 2018, 9, 190. [Google Scholar] [CrossRef]
- Vega-Nieva, D.J.; Nava-Miranda, M.G.; Calleros-Flores, E.; López-Serrano, P.M.; Briseño-Reyes, J.; Corral-Rivas, J.J.; Cruz-López, M.I.; Cuahutle, M.; Ressl, R.; Alvarado-Celestino, E. Temporal patterns of fire density by vegetation type and region in Mexico and its temporal relationships with a monthly satellite fuel greenness index. Fire Ecol. 2019, 15, 28. [Google Scholar] [CrossRef]
- Maharani, M.; Saputro, D.R.S. Generalized cross validation (GCV) in smoothing spline nonparametric regression models. J. Phys. Conf. Ser. 2021, 1808, 012053. [Google Scholar] [CrossRef]
- Giglio, L.; Csiszar, I.; Justice, C.O. Global distribution and seasonality of active fires as observed with the Terra and Aqua Moderate Resolution Imaging Spectroradiometer (MODIS) sensors. J. Geophys. Res. Biogeosci. 2006, 111, G2. [Google Scholar] [CrossRef]
- Laurent, P.; Mouillot, F.; Moreno, M.V.; Yue, C.; Ciais, P. Varying relationships between fire radiative power and fire size at a global scale. Biogeosciences 2019, 16, 275–288. [Google Scholar] [CrossRef]
- Cruz-López, M.I.; Manzo-Delgado, L.D.L.; Aguirre-Gómez, R.; Chuvieco, E.; Equihua-Benítez, J.A. Spatial distribution of forest fire emissions: A case study in three Mexican ecoregions. Remote Sens. 2019, 11, 1185. [Google Scholar] [CrossRef]
- Corona-Núñez, R.O.; Li, F.; Campo, J.E. Fires represent an important source of carbon emissions in Mexico. Glob. Biogeochem. Cycles 2020, 34, e2020GB006815. [Google Scholar] [CrossRef]
- Neger, C.; León-Cruz, J.F.; Galicia Sarmiento, L.; Manzo-Delgado, L.D.L. Dinámica espaciotemporal, causas y efectos de los megaincendios forestales en México. Madera Bosques 2022, 28, 2. [Google Scholar] [CrossRef]
- Barrett, K.; Kasischke, E.S. Controls on variations in MODIS fire radiative power in Alaskan boreal forests: Implications for fire severity conditions. Remote Sens. Environ. 2013, 130, 171–181. [Google Scholar] [CrossRef]
- Luo, R.; Hui, D.; Miao, N.; Liang, C.; Wells, N. Global relationship of fire occurrence and fire intensity: A test of intermediate fire occurrence-intensity hypothesis. J. Geophys. Res. Biogeosci. 2017, 122, 1123–1136. [Google Scholar] [CrossRef]
- Manzo-Delgado, L.; Sánchez-Colón, S.; Álvarez, R. Assessment of seasonal forest fire risk using NOAA-AVHRR: A case study in central Mexico. Int. J. Remote Sens. 2009, 30, 4991–5013. [Google Scholar] [CrossRef]
- Rodríguez-Trejo, D.A. Fire regimes, fire ecology and fire management in Mexico. Ambio 2008, 37, 548–556. [Google Scholar] [CrossRef] [PubMed]
- Jardel, E.J.; Alvarado, E.; Morfín-Ríos, J.E.; Castillo-Navarro, F.; Flores-Garnica, J.G. Regímenes de incendios en ecosistemas forestales de México. In Impacto Ambiental de Incendios Forestales; Flores Garnica, J.G., Ed.; Mundi-Prensa, INIFAP y Colegio de Postgraduados: Mexico City, Mexico, 2009; p. 73Z100. [Google Scholar]
- Kauffman, J.B.; Steele, M.D.; Cummings, D.L.; Jaramillo, V.J. Biomass dynamics associated with deforestation, fire, and conversion to cattle pasture in a Mexican tropical dry forest. For. Ecol. Manag. 2003, 176, 1–12. [Google Scholar] [CrossRef]
- Myers, R.L.; Rodríguez-Trejo, D.A. Fire in tropical pine ecosystems. In Tropical Fire Ecology; Springer: Berlin/Heidelberg, Germany, 2009; pp. 557–605. [Google Scholar] [CrossRef]
- Hartung, M.; Carreño-Rocabado, G.; Peña-Claros, M.; van der Sande, M.T. Tropical dry forest resilience to fire depends on fire frequency and climate. Front. For. Glob. Change 2021, 4, 755104. [Google Scholar] [CrossRef]
- Armenteras, D.; González, T.M.; Retana, J. Forest fragmentation and edge influence on fire occurrence and intensity under different management types in Amazon forests. Biol. Conserv. 2013, 159, 73–79. [Google Scholar] [CrossRef]
- Silva Junior, C.H.; Aragão, L.E.; Fonseca, M.G.; Almeida, C.T.; Vedovato, L.B.; Anderson, L.O. Deforestation-induced fragmentation increases forest fire occurrence in central Brazilian Amazonia. Forests 2018, 9, 305. [Google Scholar] [CrossRef]
- O’Donnell, A.J.; Boer, M.M.; McCaw, W.L.; Grierson, P.F. Vegetation and landscape connectivity control wildfire intervals in unmanaged semi-arid shrublands and woodlands in Australia. J. Biogeogr. 2011, 38, 112–124. [Google Scholar] [CrossRef]
- Baeza, J.; Santana, V.M.; Pausas, J.G.; Vallejo, R. Successional trends in standing dead biomass in Mediterranean Basin species. Sci. J. Veg. Sci. 2011, 22, 467–474. [Google Scholar] [CrossRef]
- McColl-Gausden, S.C.; Bennett, L.T.; Duff, T.J.; Cawson, J.G.; Penman, T.D. Climatic and edaphic gradients predict variation in wildland fuel hazard in south-eastern Australia. Ecography 2020, 43, 443–455. [Google Scholar] [CrossRef]
- Peláez, E.J.J.; Gradilla, S.D.Q.; Jiménez, A.J.L.; Alvarado, E.; Salicrup, D.P.; Gómez, J.M.R.; Ríos, J.E.M.; Fuentes, J.M.M.; Navarro, F.C.; Pérez, D.G.; et al. Catálogo de Camas de Combustibles Forestales para México y Potencial de Incendios Asociado. Informe del Proyecto: “Caracterización y Clasificación de Combustibles para Generar y Validar Modelos de Combustibles Forestales para México” CONAFOR-CONACyT 2014-CO2-251694. 2018. Available online: https://forestales.ujed.mx/incendios2/php/publicaciones_documentos/8_1_Jardel%20et%20al%2017a-CATALOGO%20COMBFORMEX_2018.pdf (accessed on 30 November 2024).
- Jardel, P.E.; Gradilla, S.; Jiménez, A.; Pérez, J.; Gómez, J.; Salicrup, D. Guía Técnica Divulgativa para el Uso de Modelos de Comportamiento del Fuego para los Tipos de Combustibles Forestales de México. Informe del Proyecto: “Caracterización y Clasificación de Combustibles para Generar y Validar Modelos de Combustibles Forestales para México” CONAFOR-CONACyT 2014-CO2-251694. 2018. Available online: https://forestales.ujed.mx/incendios2/php/publicaciones_documentos/8_3_Jardel%20et%20al%2017a-ETAPA%20III%20Producto%204.3%20GU%C3%8DA%20MODELOS%20COMB.pdf (accessed on 30 November 2024).
- Pausas, J.G.; Bradstock, R.A. Fire persistence traits of plants along a productivity and disturbance gradient in mediterranean shrublands of south-east Australia. Glob. Ecol. Biogeogr. 2007, 16, 330–340. [Google Scholar] [CrossRef]
- Littell, J.S.; McKenzie, D.; Peterson, D.L.; Westerling, A.L. Climate and wildfire area burned in western US ecoprovinces, 1916–2003. Ecol. Appl. 2009, 19, 1003–1021. [Google Scholar] [CrossRef]
- Keeley, J.E.; Fotheringham, C.J.; Morais, M. Reexamining fire suppression impacts on brushland fire regimes. Science 1999, 284, 1829–1832. [Google Scholar] [CrossRef] [PubMed]
- Keeley, J.E.; Pfaff, A.H.; Safford, H.D. Fire suppression impacts on postfire recovery of Sierra Nevada chaparral shrublands. Int. J. Wildland Fire 2005, 14, 255–265. [Google Scholar] [CrossRef]
- Syphard, A.D.; Brennan, T.J.; Keeley, J.E. Chaparral landscape conversion in southern California. In Valuing Chaparral; Underwood, E.C., Safford, H.D., Molinari, N.A., Keeley, J.E., Eds.; Springer International Publishing: Basel, Switzerland, 2018; pp. 311–334. [Google Scholar]
- Bowman, D.M.; Balch, J.K.; Artaxo, P.; Bond, W.J.; Carlson, J.M.; Cochrane, M.A.; D’Antonio, C.M.; Defries, R.S.; Doyle, J.C.; Harrison, S.P.; et al. Fire in the Earth system. Science 2009, 324, 481–484. [Google Scholar] [CrossRef]
- Leys, B.A.; Marlon, J.R.; Umbanhowar, C.; Vannière, B. Global fire history of grassland biomes. Ecol. Evol. 2018, 8, 8831–8852. [Google Scholar] [CrossRef]
- Curt, T.; Frejaville, T. Wildfire policy in Mediterranean France: How far is it efficient and sustainable? Risk Anal. 2018, 38, 472–488. [Google Scholar] [CrossRef]
- Santiago-Pérez, A.L.; Jardel-Peláez, E.J.; Cuevas-Guzmán, R.; Huerta-Martínez, F.M. Vegetación de bordes en un bosque mesófilo de montaña del occidente de México. Bol. Soc. Bot. Méx. 2009, 85, 31–49. [Google Scholar] [CrossRef][Green Version]
- Botequim, B.; Garcia-Gonzalo, J.; Marques, S.; Ricardo, A.; Borges, J.G.; Tomé, M.; Oliveira, M.M. Developing wildfire risk probability models for Eucalyptus globulus stands in Portugal. iForest-Biogeosci. For. 2013, 6, 217–228. [Google Scholar] [CrossRef]
- Fernandes, P.M. Combining forest structure data and fuel modelling to classify fire hazard in Portugal. Ann. For. Sci. 2009, 66, 1–9. [Google Scholar] [CrossRef]
- Andrews, P.L. Modeling wind Adjustment Factor and Midflame Wind Speed for Rothermel’s Surface Fire Spread Model; General Technical Report RMRS-GTR-266; U.S. Department of Agriculture, Forest Service, Rocky Mountain Research Station: Fort Collins, CO, USA, 2012; p. 39.
- Massman, W.J.; Forthofer, J.M.; Finney, M.A. An improved canopy wind model for predicting wind adjustment factors and wildland fire behavior. Can. J. For. Res. 2017, 47, 594–603. [Google Scholar] [CrossRef]
- Lecina-Diaz, J.; Álvarez, A.; Retana, J. Extreme fire severity patterns in topographic, convective and wind-driven historical wildfires of Mediterranean pine forests. PLoS ONE 2014, 9, e85127. [Google Scholar] [CrossRef]
- Cortés-Montaño, C.; Fulé, P.Z.; Falk, D.A.; Villanueva-Díaz, J.; Yocom, L.L. Linking old-growth forest composition, structure, fire history, climate and land-use in the mountains of northern México. Ecosphere 2012, 3, 106. [Google Scholar] [CrossRef]
- Keeley, J.E.; Zedler, P.H. Evolution of life histories in Pinus. In Ecology and Biogeography of Pinus; Richardson, D.M., Ed.; Cambridge University Press: Cambridge, UK, 1998; pp. 219–250. [Google Scholar]
- Rodríguez-Trejo, D.A.; Pulido-Luna, J.A.; Martínez-Muñoz, P.; Martínez-Lara, P.J.; Monjarás-Vega, N.A. Análisis comparativo de quemas prescritas aplicadas a encinares tropicales. Agrociencia 2018, 52, 783–801. [Google Scholar]
- Cochrane, M.A.; Schulze, M.D. Fire as a recurrent event in tropical forests of the eastern Amazon: Effects on forest structure, biomass, and species composition. Biotropica 1999, 31, 2–16. [Google Scholar] [CrossRef]
- Hasnat, G.T.; Hossain, M.K. Global overview of tropical dry forests. In Handbook of Research on the Conservation and Restoration of Tropical Dry Forests; IGI Global: Hershey, PA, USA, 2019; pp. 1–23. [Google Scholar]
- Juárez-Orozco, S.M.; Siebe, C.; Fernández y Fernández, D. Causes and effects of forest fires in tropical rainforests: A bibliometric approach. Trop. Conserv. Sci. 2017, 10, 1940082917737207. [Google Scholar] [CrossRef]
- Devisscher, T.; Anderson, L.O.; Aragão, L.E.; Galván, L.; Malhi, Y. Increased wildfire risk driven by climate and development interactions in the Bolivian Chiquitania, Southern Amazonia. PLoS ONE 2016, 11, e0161323. [Google Scholar] [CrossRef]
- Manzo-Delgado, L.L.; López-García, J. Análisis espacial y temporal de áreas quemadas en 1998, 2003 y 2015 en la Reserva de la Biosfera Montes Azules, Chiapas, México. Bosque 2020, 41, 11–24. [Google Scholar] [CrossRef]
- Aragoneses, E.; García, M.; Ruiz-Benito, P.; Chuvieco, E. Mapping forest canopy fuel parameters at European scale using spaceborne LiDAR and satellite data. Remote Sens. Environ. 2024, 303, 114005. [Google Scholar] [CrossRef]


Disclaimer/Publisher’s Note: The statements, opinions and data contained in all publications are solely those of the individual author(s) and contributor(s) and not of MDPI and/or the editor(s). MDPI and/or the editor(s) disclaim responsibility for any injury to people or property resulting from any ideas, methods, instructions or products referred to in the content. |
© 2025 by the authors. Licensee MDPI, Basel, Switzerland. This article is an open access article distributed under the terms and conditions of the Creative Commons Attribution (CC BY) license (https://creativecommons.org/licenses/by/4.0/).