Abstract
Tholu Bommalu are typical leather puppets of the traditional Indian shadow theatre. Two of these objects are part of a collection in the International Puppets Museum “Antonio Pasqualino” (Palermo, Sicily, Italy), which can count on one hundred-seventy-three of artifacts. These Indian puppets were investigated to obtain information related to the use of dyes for their manufacturing through a multi-technical approach exploiting the combination of highly sensitive spectroscopic techniques. Wet cotton stubbons were used to entrap small particles of dyes on the fibers from the art objects for the consequent analyses. Visible Light Micro-Reflectance spectroscopy was employed for the preliminary identification of the molecular class of dyes directly on the swabs, while Surface Enhanced Raman Scattering allowed the identification of the specific dye. Several synthetic dyes belonging to different typologies of coloring compounds were identified. The study resulted in an interesting overview of dyes used in recent Tholu Bommalata manufacturing through the combination of micro-invasive techniques directly on the sampling substrate.
1. Introduction
Tholu Bommalata is the traditional shadow theatre of the Telugu Indian states of Andhra Pradesh, Telangana, and Karnataka. The expression literally means “dance of leather puppets”, from “atta”, meaning dance, and “Tholu Bommalu”, meaning leather puppets []. According to the literature, the use of these puppets dates back to 200 B.C. under the dynasty of Satavahana []. To realize a shadow theatre, puppeteers press the dolls behind a backlit screen, so the audience only see dancing shadows []. The main areas of storytelling are the Indian epics of Ramāyana and Mahabarata, and the sacred Hindū texts Purāṇa, even though nowadays, the epics are no longer narrated, replaced by contemporary themes such as reforestation or family life scenes. Dolls can be moved from anyone, but only a skillful sutradhar (literally “wire mover”) can give them life. He is the leader of a familiar-run troupe, where everyone has a specific role: dancer, singer, narrator, and actor []. In all the Indian traditional puppet theatres, Tholu Bommalu are the biggest ones (120–180 cm height), and those with the highest mobility have joints along the neck, arms, and legs []. Every puppet is made of leather, the origin of which was not arbitrary: at the beginning, deer was used to represent Gods, goat for saints or common people, and buffalo for demons, while today goat skin is the most used. Dolls are charged with an enormous spiritual value. Indeed, they are made of leather, an impure material for Indians, and, thus, they need a purification rite to represent sacred characters: several weeks before the performance, plenty of rituals are made to offer the puppets to Gods. At the end of each performance, people let them go to the banks of Gange River, as a real funeral []. According to sources [], the first puppeteers used to paint Tholu Bommalu with natural colors mixed with water, later replaced by synthetic dyes. Today, Tholu Bommalata is a kind of dying art: fifty years ago, more than 180 troupes were active in 30 different Indian districts; today there are only 9.
Here, we studied the two Tholu Bommalu (Figure 1), made in 1978 by the Ramana Murthy theatre, which are part of a 173-artifact collection stored at the International Puppets Museum “Antonio Pasqualino” in Palermo, Sicily, Italy. They represent Prince Rāma and Princess Sītā, the main characters of Ramāyana.
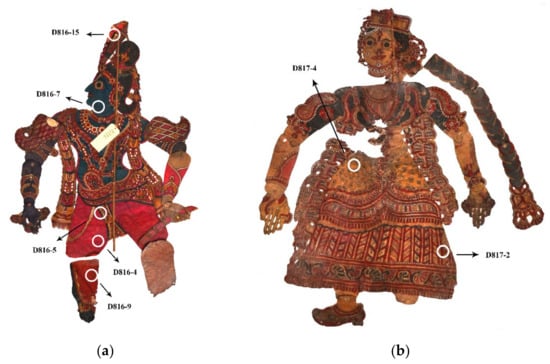
Figure 1.
Sampling areas from Tholu Bommalu of Rāma (a) and Sītā (b).
The Rāma puppet (Figure 1a), as seventh reincarnation of Visnu, is pictured in profile and with blue skin: both aspects represent divine characters. It also has almond-shaped eyes, a big nose, and thin lips; it is entirely decorated with rich jewels that underline his social status, everything made with pink, red, blue, violet, and black dyes. Both arms and legs were probably added to the puppet in a second stage, replacing missing parts: they indeed show different decorations and colors—blue and violet—than the rest of the puppet.
The Princess Sītā puppet (Figure 1b), as a not divine character, is pictured frontally, and entirely made with black, red, and yellow dyes. As with the other puppet, it has almond-shaped eyes, a big nose, but thicker lips. She wears a dress full of flower decorations and rings in her hands and nose. They both wear tilaka on their forehead, a sacred sign, the mark of God and symbol that purifies the body.
The Sītā and Rāma Tholu Bommalu are made of goat skin, identified by the Globe Institute of Copenhagen using ZooMS, short for Zoo Archaeology by Mass Spectrometry. It is a technique that uses the slow evolution of collagen as a molecular barcode to read the identity of leather or bones. The method uses a well-established approach, peptide mass fingerprinting, allied to high throughput Time of Flight Mass Spectrometry. Samples are identified by differences in the mass of the peptides, which arise as a result of sequence differences between species []. Each part of the body is a separated piece of leather, one linked to the other by a thin string, observed and identified as cotton by a light microscope []. Between the junctions, there is a little piece of leather that make this part more resistant in the points of greatest fragility. To be held by suthradar, they are assembled on a wooden stick, recognized as cane wood by light microscope observation []. They are full of holes of different shapes and sizes marking every decoration line: light can pass through them during the performance, producing an incredible effect of lights and shadows. Preparatory drawing is carved on one side of the leather, while both sides are colored with a translucent effect. There is a similar varnish layer upon the surface on both the sides: according to the literature [], it could be neem or coconut oil, used by puppeteers to preserve dolls from time damages.
As mentioned above, several colors were used to achieve the brilliant shades present in the puppets. During the conservation study of these objects, it was noticed that the related colorants were sensitive to water in terms of solubility. Consequently, it was evaluated that organic dyes could be present and their identification could be very interesting: with reference to the recent origin of the dolls, synthetic dyes could be used and their characterization could confirm the transition from natural dyes to synthetic ones in Tholu Bommalata production. For this aim, a multi-technical approach was dedicated to their identification and characterization. Visible light Fiber Optic Reflectance Spectroscopy [,,,], coupled to an optical microscope (micro-FORS), was employed to obtain preliminary information about the class of dyes: reflectance spectra were acquired directly on stubbons used to sample to dyes during the conservation treatments. The same samples were then analyzed with Surface Enhanced Raman Scattering (SERS) [,,,,,], which is based on the great enhancement of the Raman signal of an analyte in close proximity of a metal nanostructured substrate, allowing it to obtain vibrational spectra that, otherwise, would be affected by a dramatic fluorescence background. In the last decades, SERS spectroscopy has showed its great analytical potentiality [], and it is nowadays increasingly used for the characterization of colorants in art objects. Starting from its first application on ancient textiles [], this technique has been used for the identification of natural and synthetic dyes in paintings and dyed objects [,,]. The evolution from simple metal colloids to nanostructured SERS substrates [,,,,,] and metal-nanoparticles loaded sampling devices [,,,,,] provided several analytical strategies, which were exploited for the detection of both natural and synthetic dyes [,,,,,,,]. The main advantage of SERS is highly represented by high sensitivity, which is in charge for lower detection limit than High Performance Liquid Chromatography, while the main drawback is the low reproducibility which could derive from local interaction between the nanostructure and mixtures of analytes through different functional groups.
Here, the combination of SERS and FORS data allowed to individuate several synthetic dyes used for the manufacturing of these objects and provided new data for consequent further analyses.
2. Materials and Methods
2.1. Samples
Two leather puppets from the Tholu Bommalu collection stored at the International Puppets Museum “Antonio Pasqualino” were studied. Seven samples were collected by rubbing mildly sterile stubbons on the surface of the puppets, wet with distilled water, five from Rāma (D816-4, D816-5, D-816-7, D816-9, D816-15) (Figure 1a) and two from Sītā (D817-2, D817-4) (Figure 1b).
2.2. Visible Light Micro-Reflectance Spectroscopy Analysis
Visible Light Reflectance spectra were acquired through a BWTEK fiber optic spectrophotometer Exemplar LS, coupled to a microscope through a fiber optic cable and a specific adaptor. Sampling stubbons were observed at the microscope in order to individuate the most colored areas and, under illumination with an external light source (Tungsten lamp), visible light reflectance spectra were acquired. Three spectra were recorded for every stubbon (integration time: 4 s; scans: 5; integration step: 1 nm) and an average spectrum was obtained. For the spectral assignment, first derivative and apparent absorption (Log(1/R) conversion, where R is the Reflectance) analyses of the spectra were performed to confirm information deriving from simple reflectance spectrum [,,,]. In order to minimize interference of the cotton substrate, spectra of the stubbon were acquired where no dye particles or spots were present, and after processing, the deriving apparent absorption spectrum was subtracted, as a blank, from the sample ones. All the spectra were attributed through comparison to reference materials spectra, literature, and databases [,,,].
2.3. Raman and SERS Analysis
Conventional Raman and SERS experiments were performed with a Horiba Jobin-Yvon HR-Evolution spectrometer equipped with a microscope and a 632 nm laser. A motorized mapping stage was used for inspecting the sample and collecting the Raman signal from specific locations on the sample.
For conventional Raman measurements, a preliminary collection of spectra was carried out. Set conditions for the spectra acquisition were: 100× objective magnification and the laser intensity varied between 0.15 and 15 mW in order to maximize the Raman signal and to observe clear features of the investigated compounds. The Ag-reduced colloid was prepared according to the protocol developed by Leopold and Lendl []. Briefly, a solution of AgNO3 1 × 10⁻³ M in MilliQ Water was prepared. Separately, the same volumes of a solution of NH2OH·HCl 6 × 10⁻² M and a solution of NaOH 1 × 10⁻¹ M were mixed together. Ten mL of NH2OH·HCl solution was added to 100 mL of AgNO3 solution under stirring, with direct formation of a colloid. The colloid was left under stirring for 20 min, and it was used after its production. Aggregation of the colloid was induced by dropping 20 µL of 0.01 M MgSO4 solution: 200 µL of Ag colloid was inserted in an Eppendorf tube and 20 µL of 0.01 M MgSO4 solution was added and stirred to induce nanoparticle aggregation. The aggregated colloid was poured on some colored fibers sampled from the stubbons, and it was left to dry. SERS spectra were acquired in correspondence of Ag nanoclusters close to the stubbon fibers or on them. In order to evaluate eventual spectral interferences deriving from the colloid, spectra of the blank (200 µL of Ag colloid and 20 µL of MgSO4) were also collected in the dried form. Set conditions for the SERS spectra acquisition were: 50× objective magnification, laser intensity varied between 0.15 and 0.38 mW according to the sample, maximum accumulation time of 5 s per scan, 60 scans maximum. Generally, six spectra for every typology of analyzed sample were acquired. For the spectral band assignment and compound identification, experimental spectra were compared to databases and literature [,,,,,,,,,,,,].
3. Results
3.1. Visible Light Micro-Reflectance Spectroscopy Analysis
Sample D816-4, which derives from a pink-reddish area, presents a characteristic reflectance spectrum (Figure S1a, Supplementary Materials) where a first weak maximum is visible at 466 nm, followed by an increase of reflectance starting at 540 nm; the sigmoid curve presents a marked inflection point at 581 nm, while another one is observable at 690 to 695 nm. A less-defined inflection point should be present at 432 nm, but the individuation is not easy due to the higher noise at around 400 nm (lower intensity of the lamp emission). The related apparent absorption spectrum (Figure S1b, Supplementary Materials) presents a maximum at ~550 nm, with a shoulder at ~510 nm. A lower intensity band is observable at ~670 nm. The sample D816-9 presents similar features (Figure S2a, Supplementary Materials): the reflectance is the same in the 400–500 nm range, but it starts increasing around 510 nm with a complex trend. Indeed, several inflection points are observable, as highlighted from the first derivative spectrum. In particular, an inflection point is still visible at 560–580 nm, while, from the first derivative, the other ones should be present at 425, 617, and 648 nm, confirming the complexity of the spectrum. In the apparent absorption spectrum (Figure S2b, Supplementary Materials), there is a variation in intensity for the bands at 510 and 550 nm: the first one is more intense than the second, while a new low intensity band is observable ~600 nm. The band at 670 nm is not visible, whereas a new band is visible at ~690 nm.
In addition, for the sample D816-7 (Figure 2a), corresponding to a green-blue area of Rāma’s skin, the reflectance spectrum obtained complex results: two weak reflectance maxima are observable around 480 and 600 nm, while an increase of reflectance is observable over 615 nm, with an inflection point at 669 nm. With reference to the derivative spectrum, another inflection point is present at 651 nm, while less defined ones could be present at 431 and at 500 to 525 nm (the second results in a very flat maximum in the derivative spectrum). The corresponding apparent absorption spectrum presents a main maximum at ~643 nm, with a minor flat band around 500 nm (Figure 2b).
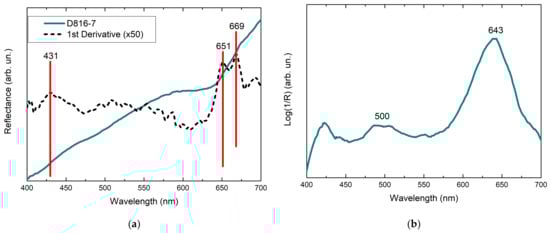
Figure 2.
(a) Visible light reflectance spectrum obtained for D816-7 sample with the corresponding first derivative (red lines highlight the inflection points) and (b) related apparent absorption spectrum (background subtracted).
The reflectance spectra obtained for the samples D816-5 and D816-15 do not present informative features (Figures S3 and S4, Supplementary Materials): the reflectance is very low, increasing without any evident spectral feature, and the spectral noise is remarkable. The related first derivative spectra are characterized by continuous oscillations and high noise, not allowing for a clear identification of the inflection points. The apparent absorption results in a spectrum where the presence of characteristic signals is not evident. Only a very low intensity band at around 690 nm is observable after background subtraction, but it cannot be excluded that the processing could be responsible for the artifacts in this case. The absence of clear absorption signals could be in agreement with the black color of the extracted dye.
For the Sītā puppet, the FORS spectrum acquired for the D817-2 sample presents a first reflectance increase over 410 nm, reaching a maximum at around 470 nm and followed by a great increase from 525 nm. The reflectance slope decreases over 600 nm, while, in the first derivative spectra, the inflection points are observable at 424, 570, and 655 nm (Figure 3a). In the apparent absorption spectrum, a defined band is centered at 530 nm, with a broadening at around 490 nm, while a low intensity broad band is visible at 680 nm (Figure 3b).
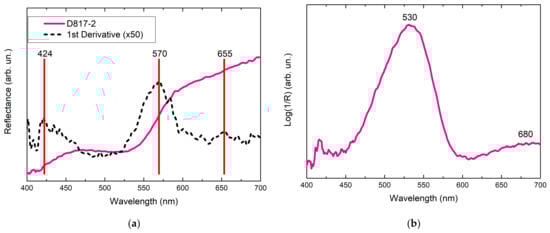
Figure 3.
(a) Visible light reflectance spectrum obtained for the D817-2 sample with the corresponding first derivative (red lines highlight the inflection points) and (b) related apparent absorption spectrum (background subtracted).
The D817-4 FORS spectrum presents a more complex behavior: the reflectivity (Figure S5a, Supplementary Materials) increases over 403 nm, the slope seems to decrease around 470 nm only to grow again over 480 nm; a second decrease of the slop is observable at 640 nm, but the reflectivity increases again to over 650 nm. The first derivative spectrum highlights an inflection point at 440 nm and a second one at 550–560 nm, but the features of the obtained derivative spectrum are less clear in comparison to the previous case. In the apparent absorption spectrum, two broad bands at 506 nm (with shoulder ~540 nm) and at 674 nm are observable (Figure S5b, Supplementary Materials).
3.2. Raman and SERS Analysis
Preliminary Raman analyses were performed directly on the samples focusing on dye spots or particles. However, the fluorescence background did not allow acquiring meaningful spectra. The collection of spectra at the highest intensity of the laser was attempted, but this only resulted in degradation of the sample with the formation of amorphous carbon or in the individuation of signals of the cellulose from the stubbons (Figure S6, Supplementary Materials).
With respect to the SERS spectra obtained for sample D816-4, it was possible to distinguish some common characteristic peaks (Figure 4, top). In particular, in most spectra, two broad bands around 461 and 477 cm−1 are observable, while more defined peaks appear at 622, 680, and 735 cm−1. At higher wavenumbers, two peaks are observable at 1004 and 1049 cm−1, and other bands are distinguishable at 1213, 1255, 1301, 1329, 1364, 1436, 1461, 1484, 1509, 1565, 1577, 1582, 1601, 1623, and 1646 cm−1. These signals change in intensity and width in the different spectra.
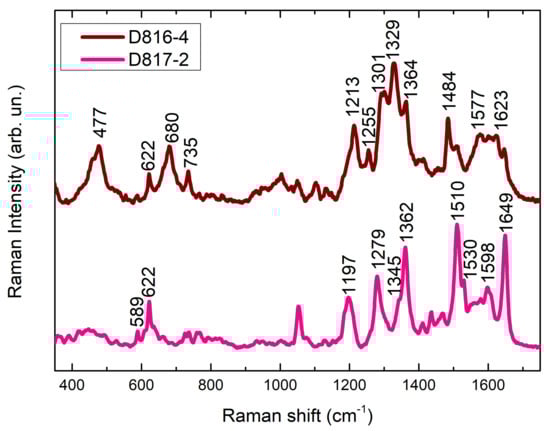
Figure 4.
Comparison of SERS spectra obtained for the D816-4 (top) and D817-2 (bottom) samples. Some peak wavenumbers are evidenced for clarity. The spectrum of sample D817-2 presents a clear correspondence with Rhodamine B SERS spectrum [] (literature spectrum not reported in the image).
All the spectra of the D816-9 sample (Figure S7, Supplementary Materials) present peaks at 452 (shoulder), 479, 680, 1002, 1049, 1207, 1447, 1485, 1578, and 1623 cm−1. It is interesting to notice that several bands observed for the D816-9 sample are also present in the spectra of the D816-4 sample.
In the case of sample D816-7, instead, the acquired spectra (Figure 5, top) present high reproducibility: there are peaks at 436, 457, 479, 530, 620, 644, 677, 693, 732, 761, 804, 827, and 918 cm−1, and defined signals at around 1030, 1176, 1221, 1298, 1364, 1399, 1429, 1476 (shoulder), 1530, 1586, and 1621 cm−1 are clearly observable. In two spectra, further sharp bands are distinguishable at 546, 601, 1488, and 1576 cm−1.
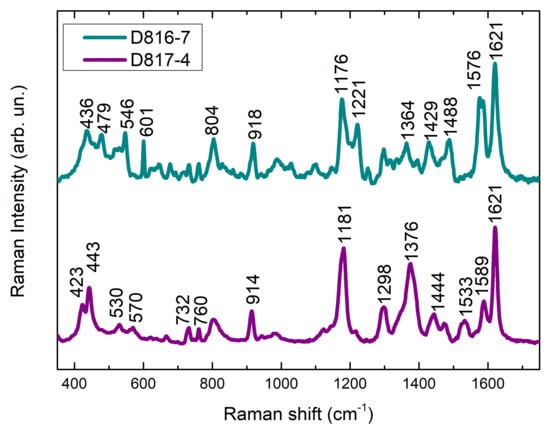
Figure 5.
Comparison of SERS spectra obtained for the D816-7 (top) and D817-4 (bottom) samples. Some peak wavenumbers are evidenced for clarity. The spectra of samples presents a clear correspondence with the SERS spectra of Malachite Green [,] (D816-7) and Crystal Violet [,,] (present in both the samples, see Discussion; literature spectra not reported in the image).
The SERS spectra obtained for D816-5 sample present a good reproducibility, even if their relative intensities can change in the different spectra. In most of them, peaks at 479, 656, 691, 733, 1139, 1225, 1300, 1340, 1443, 1458, 1585, and 1628 cm−1 are present. In some spectra, further peaks can be identified: one spectrum presents bands at 434, 518, 570, 716, 810, 1001, 1207, and 1315 cm−1, which result generally sharper than the above-mentioned ones (Figure 6, top), while in another spectrum, intense signals at 798, 1404, and 1539 cm−1 are observable. For the D816-15 sample, the spectra (Figure 6, bottom) present a general reproducibility, even if, also in this case, change in relative intensities are observed; the main spectral features are at 422, 440, 479, 519, 562, 593, 679, 717, 813, 857, 914, 1003, 1033, 1047, 1130, 1183, 1209, 1252, 1323, 1335, 1445, 1458 (shoulder), 1531, 1586, and 1627 cm−1. Some similarities with the spectra of sample D816-5 are evident.
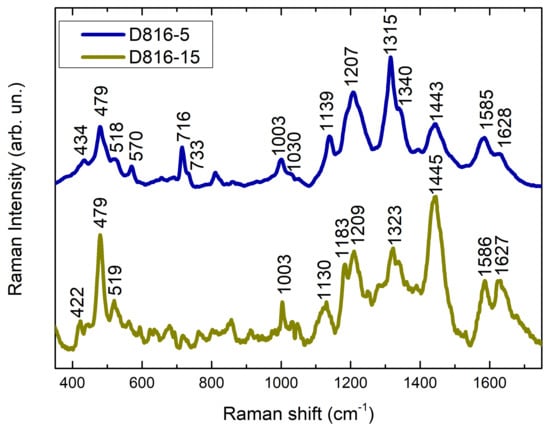
Figure 6.
Comparison of SERS spectra obtained for the D816-5 (top) and D816-15 (bottom) samples.
About the samples from Sītā puppet, the SERS spectra acquired show a great reproducibility. For the D817-2 sample, all the spectra present distinguishable peaks at 589, 622, 634 (shoulder), 661, 726, 737, 768, 1050, 1129, 1185 (shoulder), 1197, 1279, 1345 (shoulder), 1362, 1437, 1471, 1510, 1530, 1578, 1598, and 1649 cm−1 (Figure 4, bottom). The SERS spectra of the D817-4 sample (Figure 5, bottom), instead, present reproducible bands at 423, 443, 530, 570, 622, 636, 665, 732, 745 (shoulder), 760, 802, 834 (shoulder), 914, 944, 977, 1124, 1181, 1217, 1298, 1345 (shoulder), 1376, 1444, 1473, 1524, 1533, 1565, 1589, and 1621 cm−1. The general pattern of this spectra presents high similarity with the spectra obtained for the D816-7 sample.
4. Discussion
The main results obtained from data analysis are recapped in Table 1. From the FORS and SERS results, different typologies of synthetic dyes were undoubtedly used for the puppets’ manufacturing. In some cases, the identification of the present dyes is straightforward: for the D817-2 sample, the apparent absorption shoulder at 490 nm and the maximum at 530 nm are attributable to a xanthene pink dye [,]. Among the several colorants belonging to this family, which includes Eosin, Rhodamine, and Phloxine, the SERS spectrum (Figure 5, bottom) allows a clear identification of Rhodamine-based dyes [,,]. Moreover, among the two main dyes of this typology (Rhodamine B and Rhodamine 6G), the acquired spectra present higher similarities with the Rhodamine B spectra reported in the literature []. Analogously, the maximum at 640 nm observable in the apparent absorption spectra of the D816-7 sample suggests the presence of a triphenylmethane dye, such as Malachite Green and Patent Blue V []. The SERS spectra obtained for this sample confirm these preliminary data, because both their general patterns and the Raman bands are characteristic of this family of dyes. However, it is difficult to identify the specific dye: the experimental spectra, indeed, show great similarities with both Crystal Violet and Malachite Green dyes, both belonging to the same class []. In addition, Crystal Violet’s SERS spectrum is very similar to the Methyl Violet one; these three dyes should be thus considered for the attribution [,]. With reference to the acquired spectra (Figure 6, top), some bands (732, 760 cm−1) suggest the presence of Crystal Violet, while others (1176, 1221, 1364, 1399 cm−1) suggest the presence of Malachite Green. Taking into account the FORS spectra, a possible hypothesis consists in the identification of Malachite Green as the principal dye, with minor amounts of Crystal Violet (which, although in a minor quantity, is reported to be more easily detectable through SERS spectroscopy in comparison to Malachite Green) [].

Table 1.
Assignment of the dyes for the different samples, with reference to their appearance and their spectral features.
The presence of a triarylmethane dye is also suggested for the D817-4 sample, but, in this case, the identification of the molecule is clear: the SERS spectrum (Figure 5, bottom) presents a fulfilling matching with the SERS spectrum of Crystal Violet (or Methyl Violet), and there is no ambiguity with other compounds of the same class (e.g., fuchsine based dyes) [,], whose characteristic peaks are not evident in the spectra. Nevertheless, there is an actual contradiction with the FORS results: the main apparent absorption band of Crystal Violet should be at 594 nm, but it is not visible in the experimental spectrum. According to the literature, the main matching of the apparent absorption spectrum bands at 506 and 540 nm occurs with the spectra of orange mono-azo dyes, for instance, Lithol Fast Scarlet RNP or Orange II []. A possible hypothesis to explain this unusual behavior could be formulated with reference to the sampling area. The stubbon was used to sample the dye from a part of the puppet with an orange-yellow background, and this is in agreement with the bands observed in the FORS spectra. However, this area is decorated with a dark motif. Considering the high SERS detectability of Crystal and Methyl Violet, the minor amount of this dye present in the decoration represents the molecules effectively detected with this technique, while the orange dye (likely a mono-azo) could be not visible for a lower affinity to the silver nanoparticles or for the lower Raman cross-section.
For the remaining samples, the identification of the present dyes is less easy, but some hypotheses can be formulated. The FORS spectra obtained for the D816-4 sample suggest the presence of a xanthene dye: in particular, the apparent absorption bands at 501 and 550 nm present a good matching with the Visible Light absorption of Rhodamine B. Moreover, one of the SERS spectra (Figure 4, top) presents some peaks at 622, 735, 1051, 1364, 1510, and 1645 cm−1 (observable also in the spectrum of D817-2, with eventual reduced shifts in wavenumbers), which can confirm the presence of this colorant []. Other bands at 637, 714, 1329, 1452, 1577, and 1623 cm−1 could be indicative of Eosin Y [,,,]. For the D816-9 sample, even if some signals confirm the presence of Eosin Y (479, 1184, 1623 cm−1), the lower quality of the SERS spectra, along with the change in intensity in the apparent absorption spectra, does not allow for inferring any plausible hypothesis on the composition of the area. However, two samples derived from close areas of the same color and, thus, a similar composition is expected.
The two last samples, D816-5 and D816-15, represent the most complex ones for the interpretation. The FORS spectra are not really informative because of the low and noisy reflectivity spectra and consequent artifacts in the apparent absorption spectra. However, the SERS spectra (Figure 6) present several affinities, thus allowing to hypothesize a similar composition. With reference to the literature, it is hard to individuate a dye whose reported spectrum completely matches the experimental ones. Moreover, the variation in intensity of some peaks in different spectra suggests that several dyes could be present in mixture. For instance, peaks at 658, 1003, 1030, 1130, 1183, 1209, 1585, and 1627 cm−1 could be indicative of the presence of Sudan Black B [,], even if the relative intensity of bands does not match the literature spectrum of this dye [,]. On the other side, peaks observable in some spectra at 570, 733, 1323, 1443, and 1585 cm−1 could be indicative of the use of carminic acid dye [,], even if some characteristic signals are missing. Moreover, if Sudan Black B could represent the main colorant of the sampled black area, the carminic acid could not explain its color. In order to verify and confirm these hypotheses, a separative analytical technique should be used to discriminate the different colorants (for instance, High Performance Liquid Chromatography coupled to Photo-Diode-Array HPLC or High Resolution Mass Spectrometry).
From the analytical point of view, the combination of two laboratory spectroscopic techniques resulted useful for the identification of the present dyes. However, even if the micro-FORS provided preliminary hints, we remark that the acquisition of spectra on sampling stubbons resulted critical. If the acquired spectra resulted highly significant for the identification in some samples (e.g., D816-7, D817-2), the individuation of marker bands was not easy for other ones, especially if the concentration of the sampled dye was not high and the interference from the background—likely due to the fibrous stubbon matrix—was remarkable. For instance, in the case of the D816-5 and D816-15 samples, no main spectral feature is clearly observable. Nonetheless, the general performances obtained for the micro-FORS approach applied to the sampling stubbons suggest that an on-site FORS analysis would have provided remarkable results: the higher concentration of dyes on the objects and the absence of background interference from the stubbon would represent improvement factors for the acquisition of informative Vis-Light reflectance spectra. In this study, it was not possible to acquire FORS spectra in situ, however, its application presents a high potential not only for its non-invasiveness but also for the quality of obtained data. On the other side, the stubbon sampling was fundamental for the vibrational spectra collection. Indeed, the acquisition of on-site Raman spectra would likely not be useful for similar matrices. The portable Raman spectrometers are, in general, less performative than benchtop instruments, especially when highly fluorescent analytes are present, as in this case. Moreover, as highlighted by the preliminary measurement, the conventional Raman spectra resulted not useful for the identification of the synthetic dyes, and the micro-invasive addition of SERS colloid was fundamental in obtaining high quality vibrational spectra. Even in the case of samples containing Malachite Green and Crystal Violet, whose standard Raman spectra are reported in the literature, it was not possible to detect any clear spectral feature attributable to the dye. Probably, the high fluorescence of these dyes could be increased by the presence of degradation products and impurities from the art object. Moreover, focusing directly on the dye particles on the stubbons was more difficult in comparison to focusing on Ag nanoclusters close to them, because the fibers are more susceptible to move under the lens, with consequent loss of focus. Actually, for similar historical objects where the presence of synthetic dyes is highly probable due to the manufacturing period, a sampling could be necessary, but the high sensitivity of SERS spectroscopy allows for minimizing the number of sampled analytes (or the amount of analyzed sample). In order to maximize the results achievable through an integrated spectroscopic approach, the utilized protocol, enriched by a preliminary on-site FORS analysis, is suggested for similar matrices with synthetic dyes to address the following chromatographic analyses and when it is not possible to sample fragments for the analysis with low sensitivity methodologies.
5. Conclusions
In this study, a whole spectroscopic approach involving FORS and SERS spectroscopies was employed in order to identify different synthetic dyes used for the manufacturing of Tholu Bommalu leather puppets from the 1970s. The two techniques were directly applied on sampling stubbons, used for the extraction of the dyes from the objects of interest. This approach resulted successful for the identification of coloring molecules in some parts of the puppets: indeed, the data separately obtained from the two techniques reciprocally confirmed the attributions (Malachite Green and Crystal/Methyl Violet for the D816-7 sample, Rhodamine B for D817-2). In other cases (D816-4, D817-4) the use of SERS after FORS analyses provided further data and allowed to draw a richer picture on the composition of the materials: for the D816-4 sample, Rhodamine B was found in probable mixture with Eosin Y, while for the D817-4 sample, a combination of an azo dye for the yellow part and Crystal/Methyl Violet for the dark decorations was hypothesized. Finally, in the case of some areas (the D816-5, D816-9, and D816-15 samples), the analyses provided preliminary hypotheses about the colorants, which are likely present in mixture. The achieved results are of paramount importance in the perspective of selecting the proper methodology for a consequent separative analysis, which could confirm the results obtained from the spectroscopic approach and solve the doubts regarding the whole composition of complex mixtures of dyes. Moreover, the reported experiments confirmed the transition from natural dyes to synthetic ones in the manufacturing of Tholu Bommalu puppets.
Supplementary Materials
The following are available online at https://www.mdpi.com/article/10.3390/heritage4030101/s1, Figure S1: (a) Visible light reflectance spectrum obtained for the sample D816-4 with the corresponding first derivative (red lines highlight the inflection points) and (b) related apparent absorption spectrum (background subtracted); Figure S2: (a) Visible light reflectance spectrum obtained for the sample D816-4 with the corresponding first derivative (red lines highlight the inflection points) and (b) related apparent absorption spectrum (background subtracted); Figure S3: (a) Visible light reflectance spectrum obtained for the sample D816-5 with the corresponding first derivative (red lines highlight the inflection points) and (b) related apparent absorption spectrum (background subtracted); Figure S4: (a) Visible light reflectance spectrum obtained for the sample D816-15 with the corresponding first derivative (red lines highlight the inflection points) and (b) related apparent absorption spectrum (background subtracted); Figure S5: (a) Visible light reflectance spectrum obtained for the sample D817-4 with the corresponding first derivative (red lines highlight the inflection points) and (b) related apparent absorption spectrum (background subtracted); Figure S6: Conventional Raman spectra obtained for the samples in the range 350–1050 cm−1 (top) and in the range 1050-1750 cm−1 (bottom); Figure S7: SERS spectrum obtained for D816-9 sample.
Author Contributions
Conceptualization: A.C., I.S., A.N., B.G. and M.B.; investigation: A.C. (Raman and SERS spectra, interpretation of FORS spectra), A.B. (FORS spectra), A.N. (interpretation of FORS spectra); resources, P.P. and M.B.; main writing—preparation of original draft, A.C., I.S. and G.D.; writing—review and editing, A.C., I.S., G.D. and F.R.; supervision: R.C., P.P. and M.B. All authors have read and agreed to the published version of the manuscript.
Funding
This research received no external funding.
Institutional Review Board Statement
Not applicable.
Informed Consent Statement
Not applicable.
Data Availability Statement
Not applicable.
Acknowledgments
We are grateful to the International Puppets Museum “Antonio Pasqualino” in Palermo, Sicily, Italy, for the granted access to the historical objects and the collaboration on this research.
Conflicts of Interest
The authors declare no conflict of interest.
References
- Sahapedia. Available online: https://www.sahapedia.org/ (accessed on 29 June 2021).
- Autiero, S. Danzando Nella Luce. Il Teatro Delle Ombre Nell’India Meridionale. In Il Principe e la sua Ombra; National Museum of Oriental Art “G. Tucci”: Roma, Italy, 2013; p. 41. [Google Scholar]
- Chandra Sekhar, A. A Selected Crafts of Andhra Pradesh. In Census of India 1961; The Government Press: New Delhi, India, 1961. [Google Scholar]
- Sarma, D.; Homen, A. Storytelling and Puppet Traditions of India; Indira Gandhi National Centre for the Arts: New Delhi, India, 2010. [Google Scholar]
- Sorensen, N. Tolu Bommalu Kattu: Shadow Theater. J. South Asian Nat. His. 1975, 10, 1–19. [Google Scholar]
- Collins, M.; Buckely, M.; Grundy, H.; Thomas Oates, J.; Wilson, J.; van Doorn, N. ZooMS: The Collagen Barcode and Fingerprints. Spectrosc. Eur. 2010, 22, 6–10. [Google Scholar]
- Campo, G.; Bagan, R.; Oriols, N. Identificaciò de Fibres: Suports Tèxtils de Pintures; Genelaitat de Catalunya, Departament de Cultura i Mitjans de Comunicació: Barcelona, Spain, 2009. [Google Scholar]
- Ollendorf, A.L.; Mulholland, S.C.; Rapp, G.J. Phytolith Analysis as a Means of Plant Identification: Arundo Donax and Phragmites Communis. Ann. Bot. 1988, 61, 209–214. [Google Scholar] [CrossRef]
- Cosentino, A. FORS Spectral Database of Historical Pigments in Different Binders. E Conserv. J. 2015, 54–65. [Google Scholar] [CrossRef]
- Aceto, M.; Agostino, A.; Fenoglio, G.; Idone, A.; Gulmini, M.; Picollo, M.; Ricciardi, P.; Delaney, J.K. Characterisation of Colourants on Illuminated Manuscripts by Portable Fibre Optic UV-Visible-NIR Reflectance Spectrophotometry. Anal. Methods 2014, 6, 1488–1500. [Google Scholar] [CrossRef]
- Montagner, C.; Bacci, M.; Bracci, S.; Freeman, R.; Picollo, M. Library of UV-Vis-NIR Reflectance Spectra of Modern Organic Dyes from Historic Pattern-Card Coloured Papers. Spectrochim. Acta Part A Mol. Biomol. Spectrosc. 2011, 79, 1669–1680. [Google Scholar] [CrossRef]
- Bacci, M.; Picollo, M.; Trumpy, G.; Tsukada, M.; Kunzelman, D. Non-Invasive Identification of White Pigments on 20Th-Century Oil Paintings by Using Fiber Optic Reflectance Spectroscopy. J. Am. Inst. Conserv. 2007, 46, 27–37. [Google Scholar] [CrossRef]
- Pozzi, F.; Leona, M. Surface-Enhanced Raman Spectroscopy in Art and Archaeology. J. Raman Spectrosc. 2016, 47, 67–77. [Google Scholar] [CrossRef]
- Cesaratto, A.; Leona, M.; Pozzi, F. Recent Advances on the Analysis of Polychrome Works of Art: SERS of Synthetic Colorants and Their Mixtures with Natural Dyes. Front. Chem. 2019, 7, 1–12. [Google Scholar] [CrossRef]
- Chen, K.; Leona, M.; Vo-Dinh, K.C.; Yan, F.; Wabuyele, M.B.; Vo-Dinh, T. Application of Surface-Enhanced Raman Scattering (SERS) for the Identification of Anthraquinone Dyes Used in Works of Art. J. Raman Spectrosc. 2006, 37, 520–527. [Google Scholar] [CrossRef]
- Candela, R.G.; Lombardi, L.; Ciccola, A.; Serafini, I.; Bianco, A.; Postorino, P.; Pellegrino, L.; Bruno, M. Deepening inside the Pictorial Layers of Etruscan Sarcophagus of Hasti Afunei: An Innovative Micro-Sampling Technique for Raman/SERS Analyses. Molecules 2019, 24, 3403. [Google Scholar] [CrossRef]
- Ciccola, A.; Serafini, I.; Ripanti, F.; Vincenti, F.; Coletti, F.; Bianco, A.; Fasolato, C.; Montesano, C.; Galli, M.; Curini, R.; et al. Dyes from the Ashes: Discovering and Characterizing Natural Dyes from Mineralized Textiles. Molecules 2020, 25, 1417. [Google Scholar] [CrossRef]
- Germinario, G.; Ciccola, A.; Serafini, I.; Ruggiero, L.; Sbroscia, M.; Vincenti, F.; Fasolato, C.; Curini, R.; Ioele, M.; Postorino, P.; et al. Gel Substrates and Ammonia-EDTA Extraction Solution: A New Non-Destructive Combined Appraoch Useful for the Identification of Anthraquinone Dyes from Wool Textiles. Microchem. J. 2020, 155, 104780. [Google Scholar] [CrossRef]
- Stiles, P.L.; Dieringer, J.A.; Shah, N.C.; Van Duyne, R.P. Surface-Enhanced Raman Spectroscopy. Annu. Rev. Anal. Chem. 2008, 1, 601–626. [Google Scholar] [CrossRef] [PubMed]
- Guineau, B.; Guichard, V. Identification des colorants organiques naturels par microspectrometrie Raman de resonance et par effet Raman exalte de surface (SERS). In ICOM Committee for Conservation, 8th Triennial Meeting, Sydney, Australia, 6–11 September 1987: Preprints; ICOM: Paris, France, 1987; pp. 659–666. [Google Scholar]
- Leona, M.; Londero, P.S.; Lombardi, J.R. 10 Years of Surface-Enhanced Raman Spectroscopy in Art and Archaeology. Microsc. Microanal. 2014, 20 (Suppl. 3), 2006–2007. [Google Scholar] [CrossRef][Green Version]
- Serafini, I.; Ciccola, A. Nanotechnologies and Nanomaterials: An Overview for Cultural Heritage. In Nanotechnologies and Nanomaterials for Diagnostic, Conservation and Restoration of Cultural Heritage; Lazzara, G., Fakhrulli, R., Eds.; Elsevier: Amsterdam, The Netherlands, 2018; pp. 325–380. [Google Scholar]
- Bruni, S.; De Luca, E.; Guglielmi, V.; Pozzi, F. Identification of Natural Dyes on Laboratory-Dyed Wool and Ancient Wool, Silk, and Cotton Fibers Using Attenuated Total Reflection (ATR) Fourier Transform Infrared (FT-IR) Spectroscopy and Fourier Transform Raman Spectroscopy. Appl. Spectrosc. 2011, 65, 1017–1023. [Google Scholar] [CrossRef]
- Bruni, S.; Guglielmi, V.; Pozzi, F.; Mercuri, A.M. Surface-Enhanced Raman Spectroscopy (SERS) on Silver Colloids for the Identification of Ancient Textile Dyes. Part II: Pomegranate and Sumac. J. Raman Spectrosc. 2011, 42, 465–473. [Google Scholar] [CrossRef]
- Bruni, S.; Guglielmi, V.; Pozzi, F. Historical Organic Dyes: A Surface-Enhanced Raman Scattering (SERS) Spectral Database on Ag Lee-Meisel Colloids Aggregated by NaClO4. J. Raman Spectrosc. 2011, 42, 1267–1281. [Google Scholar] [CrossRef]
- Bruni, S.; Guglielmi, V.; Pozzi, F. Surface-Enhanced Raman Spectroscopy (SERS) on Silver Colloids for the Identification of Ancient Textile Dyes: Tyrian Purple and Madder. J. Raman Spectrosc. 2010, 41, 175–180. [Google Scholar] [CrossRef]
- Leona, M. Microanalysis of Organic Pigments and Glazes in Polychrome Works of Art by Surface-Enhanced Resonance Raman Scattering. Proc. Natl. Acad. Sci. USA 2009, 106, 14757–14762. [Google Scholar] [CrossRef] [PubMed]
- Nie, C.S.; Feng, Z. Simple Preparation Method for Silver SERS Substrate by Reduction of AgNO3 on Copper Foil. Appl. Spectrosc. 2002, 56, 300–305. [Google Scholar] [CrossRef]
- Platania, E.; Lofrumento, C.; Lottini, E.; Azzaro, E.; Ricci, M.; Becucci, M. Tailored Micro-Extraction Method for Raman/SERS Detection of Indigoids in Ancient Textiles. Anal. Bioanal. Chem. 2015, 407, 6505–6514. [Google Scholar] [CrossRef]
- Platania, E.; Lombardi, J.R.; Leona, M.; Shibayama, N.; Lofrumento, C.; Ricci, M.; Becucci, M.; Castellucci, E. Suitability of Ag-Agar Gel for the Microextraction of Organic Dyes on Different Substrates: The Case Study of Wool, Silk, Printed Cotton and a Panel Painting Mock-Up. J. Raman Spectrosc. 2014, 45, 1133–1139. [Google Scholar] [CrossRef]
- Ricci, M.; Lofrumento, C.; Castellucci, E.; Becucci, M. Microanalysis of Organic Pigments in Ancient Textiles by Surface-Enhanced Raman Scattering on Agar Gel Matrices. J. Spectrosc. 2016, 2016. [Google Scholar] [CrossRef]
- Lofrumento, C.; Ricci, M.; Platania, E.; Becucci, M.; Castellucci, E. SERS Detection of Red Organic Dyes in Ag-Agar Gel. J. Raman Spectrosc. 2013, 44, 47–54. [Google Scholar] [CrossRef]
- Leona, M.; Decuzzi, P.; Kubic, T.A.; Gates, G.; Lombardi, J.R. Nondestructive Identification of Natural and Synthetic Organic Colorants in Works of Art by Surface Enhanced Raman Scattering. Anal. Chem. 2011, 83, 3990–3993. [Google Scholar] [CrossRef]
- Doherty, B.; Brunetti, B.G.; Sgamellotti, A.; Miliani, C.A. Detachable SERS Active Cellulose Film: A Minimally Invasive Approach to the Study of Painting Lakes. J. Raman Spectrosc. 2011, 42, 1932–1938. [Google Scholar] [CrossRef]
- Pozzi, F.; Van Den Berg, K.J.; Fiedler, I.; Casadio, F.A. Systematic Analysis of Red Lake Pigments in French Impressionist and Post-Impressionist Paintings by Surface-Enhanced Raman Spectroscopy (SERS). J. Raman Spectrosc. 2014, 45, 1119–1126. [Google Scholar] [CrossRef]
- Calà, E.; Benzi, M.; Gosetti, F.; Zanin, A.; Gulmini, M.; Idone, A.; Serafini, I.; Ciccola, A.; Curini, R.; Whitworth, I.; et al. Towards the Identification of the Lichen Species in Historical Orchil Dyes by HPLC-MS/MS. Microchem. J. 2019, 150, 104140. [Google Scholar] [CrossRef]
- Castro, R.; Pozzi, F.; Leona, M.; Melo, M.J. Combining SERS and Microspectrofluorimetry with Historically Accurate Reconstructions for the Characterization of Lac Dye Paints in Medieval Manuscript Illuminations. J. Raman Spectrosc. 2014, 45, 1172–1179. [Google Scholar] [CrossRef]
- Cañamares, M.V.; Reagan, D.A.; Lombardi, J.R.; Leona, M. TLC-SERS of Mauve, the First Synthetic Dye. J. Raman Spectrosc. 2014, 45, 1147–1152. [Google Scholar] [CrossRef]
- Ciccola, A.; Tozzi, L.; Romani, M.; Serafini, I.; Ripanti, F.; Curini, R.; Vitucci, F.; Cestelli Guidi, M.; Postorino, P. Lucio Fontana and the Light: Spectroscopic Analysis of the Artist’s Collection at the National Gallery of Modern and Contemporary Art. Spectrochim. Acta Part A Mol. Biomol. Spectrosc. 2020, 236, 1–8. [Google Scholar] [CrossRef]
- Pérez-Arantegui, J.; Rupérez, D.; Almazán, D.; Díez-de-Pinos, N. Colours and Pigments in Late Ukiyo-e Art Works: A Preliminary Non-Invasive Study of Japanese Woodblock Prints to Interpret Hyperspectral Images Using in-Situ Point-by-Point Diffuse Reflectance Spectroscopy. Microchem. J. 2018, 139, 94–109. [Google Scholar] [CrossRef]
- Leopold, N.; Lendl, B. A New Method for Fast Preparation of Highly Surface-Enhanced Raman Scattering (SERS) Active Silver Colloids at Room Temperature by Reduction of Silver Nitrate with Hydroxylamine Hydrochloride. J. Phys. Chem. B 2003, 107, 5723–5727. [Google Scholar] [CrossRef]
- Sessa, C.; Weiss, R.; Niessner, R.; Ivleva, N.P.; Stege, H. Towards a Surface Enhanced Raman Scattering (SERS) Spectra Database for Synthetic Organic Colourants in Cultural Heritage. The Effect of Using Different Metal Substrates on the Spectra. Microchem. J. 2018, 138, 209–225. [Google Scholar] [CrossRef]
- Centeno, S.A.; Hale, C.; Carò, F.; Cesaratto, A.; Shibayama, N.; Delaney, J.; Dooley, K.; van der Snickt, G.; Janssens, K.; Stein, S.A. Van Gogh’s Irises and Roses: The Contribution of Chemical Analyses and Imaging to the Assessment of Color Changes in the Red Lake Pigments. Herit. Sci. 2017, 5, 1–11. [Google Scholar] [CrossRef]
- Schneider, S.; Brehm, G.; Freunscht, P. Comparison of Surface-Enhanced Raman and Hyper-Raman Spectra of the Triphenylmethane Dyes Crystal Violet and Malachite Green. Phys. Status Solidi 1995, 189, 37–42. [Google Scholar] [CrossRef]
- Cañamares, M.V.; Chenal, C.; Birke, R.L.; Lombardi, J.R. DFT, SERS, and Single-Molecule SERS of Crystal Violet. J. Phys. Chem. C 2008, 112, 20295–20300. [Google Scholar] [CrossRef]
- Gühlke, M.; Heiner, Z.; Kneipp, J. Surface-Enhanced Hyper-Raman and Raman Hyperspectral Mapping. Phys. Chem. Chem. Phys. 2016, 18, 14228–14233. [Google Scholar] [CrossRef]
- Greeneltch, N.G.; Davis, A.S.; Valley, N.A.; Casadio, F.; Schatz, G.C.; Van Duyne, R.P.; Shah, N.C. Near-Infrared Surface-Enhanced Raman Spectroscopy (NIR-SERS) for the Identification of Eosin Y: Theoretical Calculations and Evaluation of Two Different Nanoplasmonic Substrates. J. Phys. Chem. A 2012, 116, 11863–11869. [Google Scholar] [CrossRef]
- Narayanan, V.A.; Stokes, D.L.; Vo-Dinh, T. Vibrational Sprectral Analysis of Eosin Y and Erytheosin B—Intensity Studies for Quantiative Detection by Dyes. J. Raman Spectrosc. 1994, 24, 415–422. [Google Scholar] [CrossRef]
- Michaels, A.M.; Nirmal, M.; Brus, L.E. Surface Enhanced Raman Spectroscopy of Individual Rhodamine 6G Molecules on Large Ag Nanocrystals. J. Am. Chem. Soc. 1999, 121, 9932–9939. [Google Scholar] [CrossRef]
- Sun, C.H.; Wang, M.L.; Feng, Q.; Liu, W.; Xu, C.X. Surface-Enhanced Raman Scattering (SERS) Study on Rhodamine B Adsorbed on Different Substrates. Russ. J. Phys. Chem. A 2015, 89, 291–296. [Google Scholar] [CrossRef]
- Zhao, Y.; Yamaguchi, Y.; Liu, C.; Li, M.; Dou, X. Rapid and Quantitative Detection of Trace Sudan Black B in Dyed Black Rice by Surface-Enhanced Raman Spectroscopy (SERS). Spectrochim. Acta Part A Mol. Biomol. Spectrosc. 2019, 216, 202–206. [Google Scholar] [CrossRef]
- Muehlethaler, C.; Ng, K.; Gueissaz, L.; Leona, M.; Lombardi, J.R. Raman and SERS Characterization of Solvent Dyes: An Example of Shoe Polish Analysis. Dye. Pigment. 2017, 137, 539–552. [Google Scholar] [CrossRef]
- Whitney, A.V.; Van Duyne, R.P.; Casadio, F. An Innovative Surface-Enhanced Raman Spectroscopy (SERS) Method for the Identification of Six Historical Red Lakes and Dyestuffs. J. Raman Spectrosc. 2006, 37, 993–1002. [Google Scholar] [CrossRef]
- Cesaratto, A.; Lombardi, J.R.; Leona, M. Tracking Photo-Degradation of Triarylmethane Dyes with Surface-Enhanced Raman Spectroscopy. J. Raman Spectrosc. 2017, 48, 418–424. [Google Scholar] [CrossRef]
- Geiman, I.; Leona, M.; Lombardi, J.R. Application of Raman Spectroscopy and Surface-Enhanced Raman Scattering to the Analysis of Synthetic Dyes Found in Ballpoint Pen Inks. J. Forensic Sci. 2009, 54, 947–952. [Google Scholar] [CrossRef]
Publisher’s Note: MDPI stays neutral with regard to jurisdictional claims in published maps and institutional affiliations. |
© 2021 by the authors. Licensee MDPI, Basel, Switzerland. This article is an open access article distributed under the terms and conditions of the Creative Commons Attribution (CC BY) license (https://creativecommons.org/licenses/by/4.0/).