Abstract
This study describes the methodology and main results obtained after applying several geomatic techniques, based on the fusion of data acquired by several sensors, to document the recovery works carried out in an abandoned church. A century ago, the façade was moved to a museum to ensure its preservation. In addition to documentary purposes, a secondary goal is the virtual repositioning of a model of this element on that of the church. The method takes advantage of the potential of each technique, considering the acquisition of geometry based mainly on laser scanning techniques and radiometry on photogrammetry. The results include 3D models and orthoimages, which are used to perform a stratigraphic study. The 3D model of the façade has been repositioned in the general one, considering common geometries previously fitted in both models and repeating part of the photogrammetric process, using masks to define the image areas related to the church and the façade. Therefore, we obtained a 3D model with the façade included in it. This procedure has demonstrated its feasibility despite the existence of different environmental conditions in both areas. Using these results, we have also developed a BIM to allow for the management of future restoration works.
Keywords:
TLS; MMS; photogrammetry; UAV; spherical photogrammetry; 3D model; orthoimages; stratigraphic study; BIM 1. Introduction
The current development of geomatic techniques, including terrestrial laser scanning (TLS) and close-range photogrammetry (CRP), allows for the application and integration of products obtained from multiple sensors to document heritage sites. The advantages of this integration have been described in several studies [1,2,3,4,5,6], for example, to facilitate the acquisition of data, to obtain a full coverage of the object, even in complex scenes, and to improve the geometric and radiometric quality of the products. Most of the scenes studied in heritage sites can commonly be considered as complex, due to, among other environmental circumstances, their geometrical characteristics and location and accessibility [7].
Regarding geometrical characteristics, the presence of narrow spaces [8,9] makes simple data acquisition difficult or impossible in specific cases [7]. Therefore, in complex scenes, the integration of techniques plays a fundamental role in achieving the requirements of the study, taking into account the efficiency in data acquisition and processing. This efficiency supposes a fundamental aspect in this type of study due to the direct relation with cost. Regarding the efficiency of data acquisition in complex scenes, we must consider the need to capture a large number of scanning stations (TLS) and photographs (conventional photogrammetry) in order to cover the entire scene. This implies a considerable increase in cost, both in the field and in processing work, with respect to non-complex scenes. For this reason, some studies have recently focused on the improvement of this efficiency. Thus, some approaches have shown reductions in data acquisition work by increasing the field of view (FoV) of sensors, for example, in photogrammetry, through the use of wide-angle lenses [10,11,12,13,14], fisheye lenses [15,16,17,18,19,20,21,22,23,24], and 360-degree cameras [9,25,26,27,28,29,30,31,32]. The recent use of fisheye images and panoramic images has made it possible to develop photogrammetric studies in complex scenes that had been almost impossible using conventional images. Fangi [33] defined spherical photogrammetry (SP) as the use of these images for photogrammetric purposes. The efficiency of data acquisition is also improved by using real-time capture sensors, such as Mobile Mapping Systems (MMSs) [34,35,36,37,38,39,40,41,42], which are based on Simultaneous Localization and Mapping (SLAM). These systems usually compute their trajectory and orientation using SLAM (visual-SLAM or LiDAR-SLAM), supported by Global Navigation Satellite Systems (GNSS) (outdoor surveys) and Inertial Navigation System (INSs). The main product obtained with MMSs is a point cloud of the scene, which is generated mainly using light detection and range (LiDAR).
In terms of location and accessibility, complex scenes are characterized by areas that operators and sensors have difficulty accessing. Examples of these scenes include elevated areas, inaccessible areas, vertical shafts, etc. During the last few years, some approaches have been implemented to solve these difficulties, such as the use of masts to lift cameras [43,44,45] and include them in inaccessible spaces [46] and, more commonly, the use of Unmanned Aerial Vehicles (UAVs) [47,48,49,50]. The development of these platforms has undergone a great evolution in recent times, being commonly used in heritage sites. The great diversity of platforms (considering their weight, from light to heavy) has allowed for their use in multiple situations due to their capacities, size, and maneuverability.
All these improvements have been accompanied by significant developments in software and hardware capacities. In the first case, we highlight the development of image-based processing algorithms, such as the Structure from Motion (SfM) [51,52,53,54,55] and the dense Multi-View Stereo (MVS) [56,57], which have been implemented in several software applications (e.g., Agisoft Metashape), facilitating the use of geomatic techniques even by non-professional users.
The products obtained after the application of geomatic techniques (e.g., point clouds, 3D models, etc.) are mainly focused on documentation purposes. From this perspective, some studies describe their use in applications of virtual restorations and reconstructions [58,59], building information modelling (BIM) [60,61], etc. In the first case, we highlight those studies that describe the virtual repositioning of elements in their original locations, both of complete elements [62] and those divided into parts (virtual anastylosis) [63]. In these applications, one or several elements currently located outside their original locations were modeled and subsequently integrated into the site model, considering their presumed situation. This integration is mainly based on the fusion of 3D meshes, where the position of the element is usually located in the scene using old references or manually (e.g., using references based on old photographs and paintings [62]). On the other hand, heritage BIMs (HBIMs) have proven to be fundamental for documentation, management, conservation, visualization, risk detection, etc. A typical HBIM implementation can be divided into several stages, such as the identification of the purpose and determination of the level of development (LoD) [64], data acquisition and processing (geomatic techniques), and the development of the models, integrating geometry and the definitions of parametric families, considering semantic data [60].
In conclusion, the current development of geomatic techniques allows for a wide range of options to be applied individually or to be integrated into heritage documentation. The selection will depend on the requirements of each project. However, in the case of complex scenes, the application of different techniques is necessary to obtain feasible and complete products. This is the case with the study of the church of S. Miguel, described in this document, which focuses on the fusion of data acquired with various geomatic techniques to cover the whole scene, taking advantage of their potential. It also focuses on the virtual positioning of elements located outside the scene (e.g., the façade of the church is located in a museum) using some geometries fitted from both 3D models and by repeating part of the photogrammetric process to obtain an integrated 3D model. Among other aspects, the approaches developed to solve these issues represent the main novelties of this study.
1.1. Church of S. Miguel
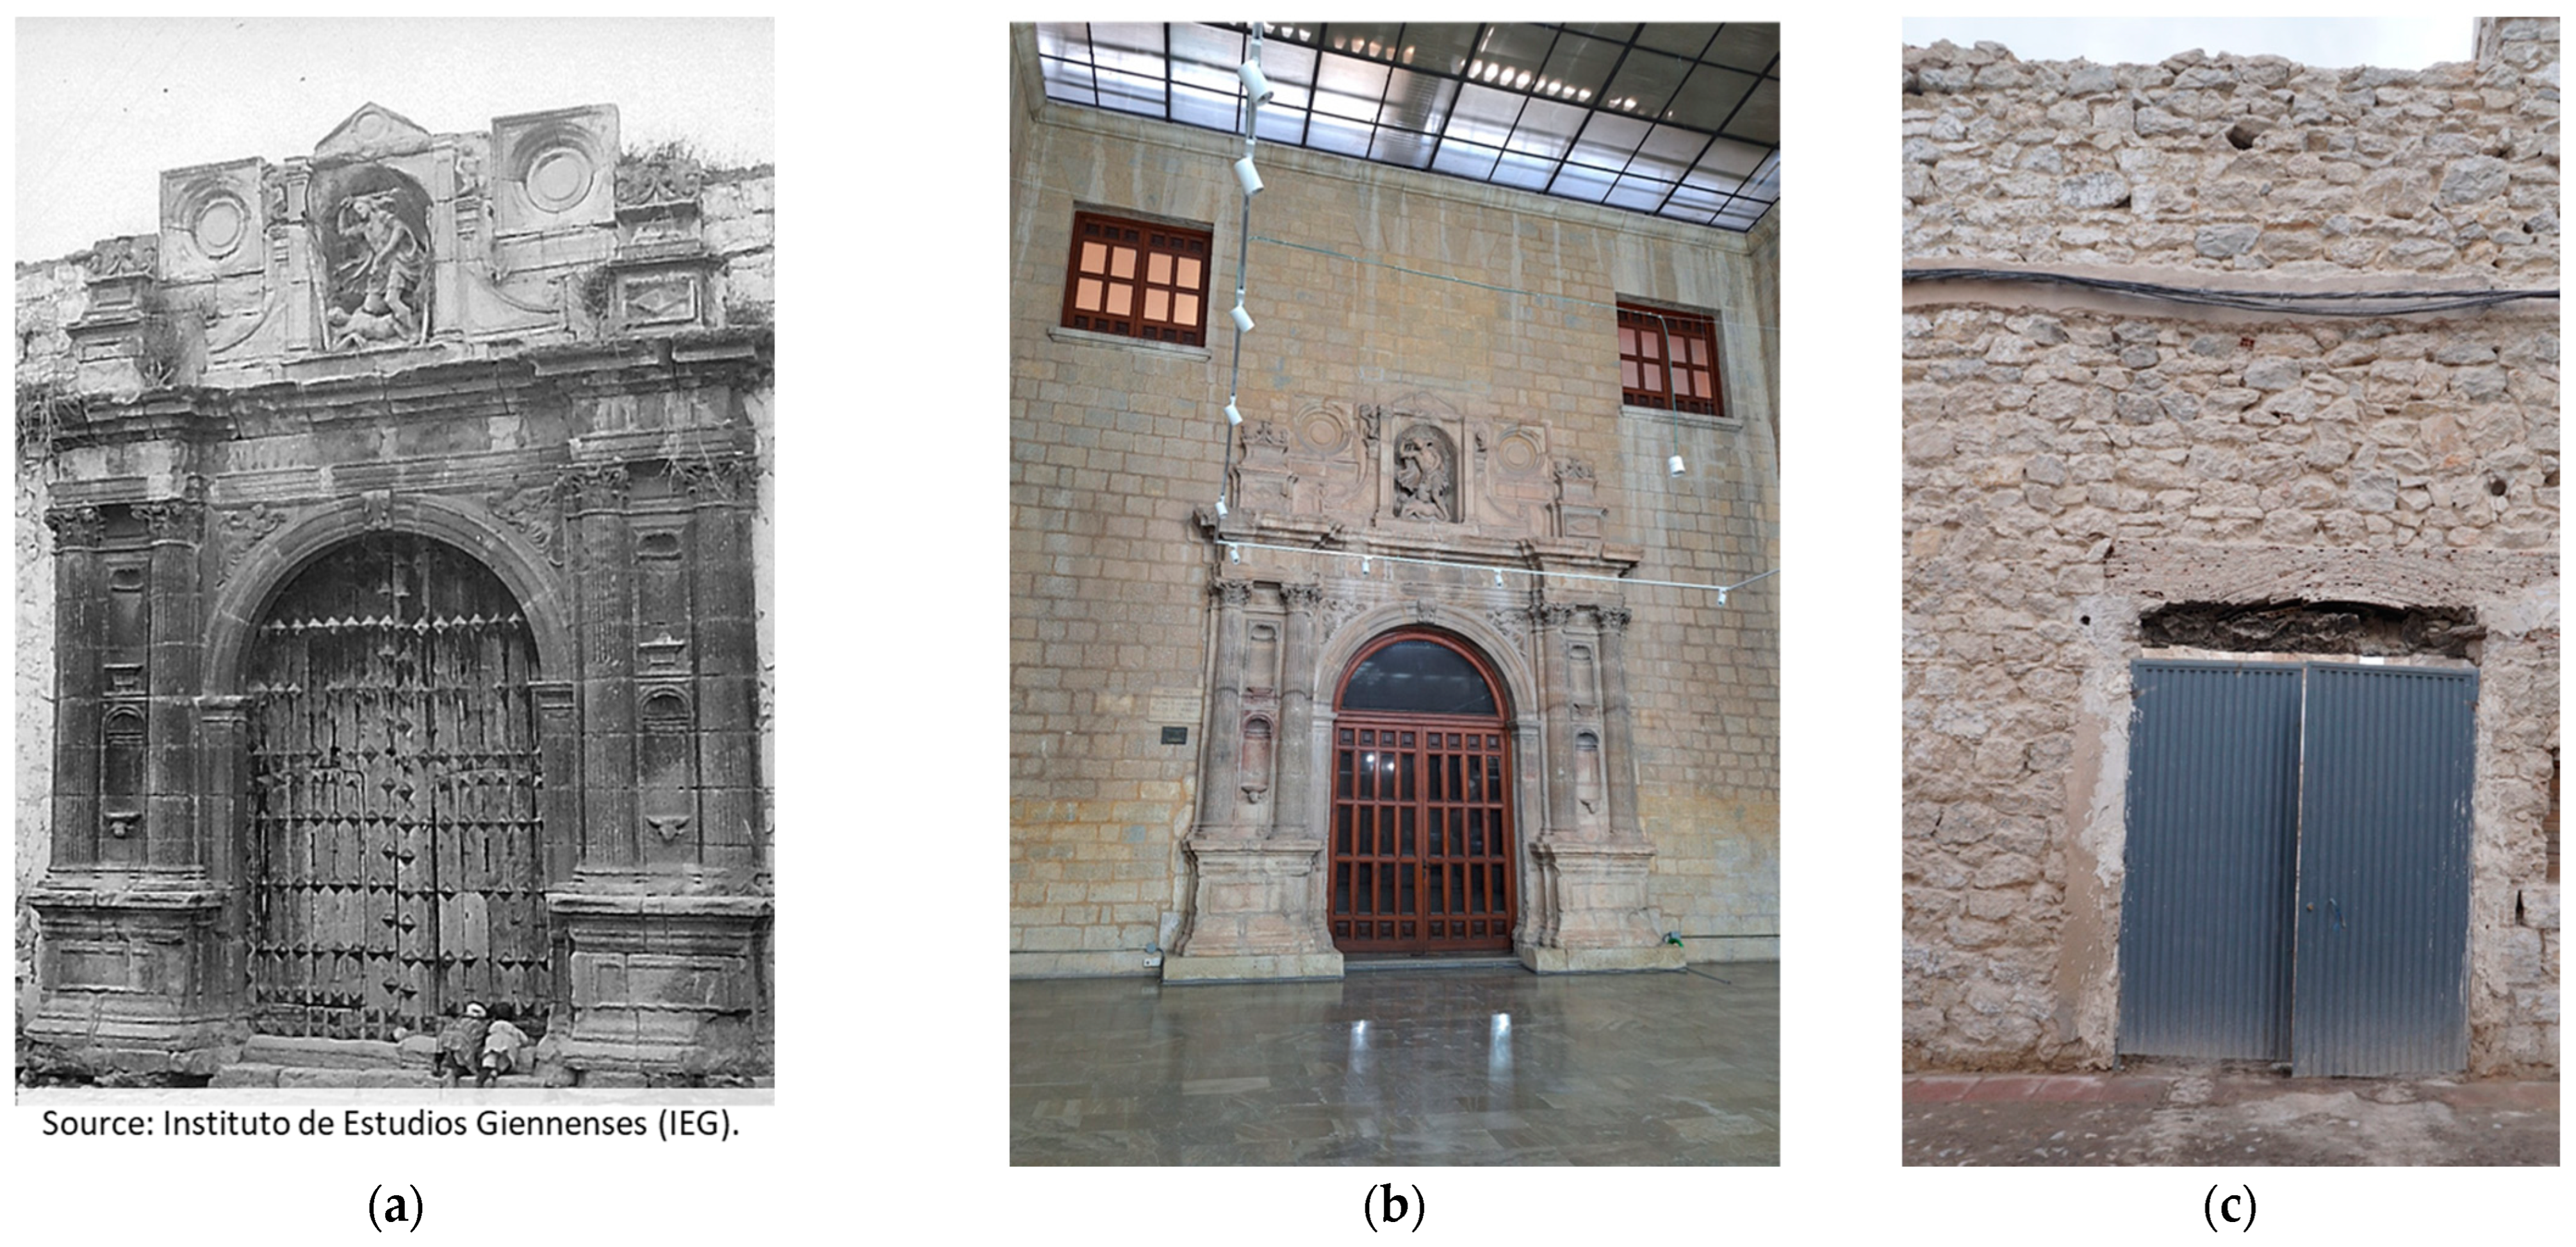
The church of S. Miguel is located in the historic center of Jaén. According to documentary sources, it was built in several stages during the 14th and 16th centuries. The first reference is dated 1311, when it was included as part of the eleven churches of the city. Initially, the plan was defined by a rectangular nave, with a semicircular apse at the head (Figure 1). The walls were composed of irregular masonry, reusing ashlars and construction elements from an earlier Roman construction, probably located in situ. The approximate dimensions of this nave are 25 m long and 11 m wide. In the 16th century, the church was enlarged to include a lateral nave to the west (Figure 1), a new tower, and the façade. This lateral nave gave access to the church through a pointed arch. It was defined by a rectangular space 18.5 m long and 4.5 m wide. The façade was dated to approximately 1561 and is remarkable for its classical structure, with great detail that contrasts with the modesty of the other elements of the church. For various centuries, this church had a certain notoriety in the city, with several reforms being documented; although, in the 19th century, it saw a great decline. Thus, the church underwent several collapses during this century, and finally it was closed in 1874. Subsequently, some spaces were occupied by five houses (Figure 1a) that took advantage of the remaining walls, although other structures were affected or removed. Despite these years of private use without concern for the heritage, the main walls, the apse, and other structures, such as two crypts and various chapels, one of them with a Gothic rib vault, are preserved in a more or less acceptable state of conservation. The inhabitants of the houses used some of these spaces as rooms or storerooms (as in the case of the crypts). Therefore, these spaces have been preserved as more or less unaltered since their ecclesiastical use (Figure 1b). However, the only conservation-oriented initiative developed in this church was related to the façade (Figure 2). Thus, the concern of several historians and local authorities worried about the decadence of Jaén’s heritage in the first decades of the 20th century managed to save the façade by dismantling it, moving it, and reassembling it in the Museum of Jaén between 1919 and 1920. Thanks to this change of location, the façade was safe from the deterioration that affected other structures. Figure 2 shows some views related to the façade, including a historical photograph with the façade in its original position taken prior its dismantling (Figure 2a), the current location of this reassembled façade in the Museum of Jaén (Figure 2b), and the current state of the location of the façade (Figure 2c). In 2022, the Jaén City Council initiated a project to return the use of this building to the city of Jaén. The first stage was developed from November 2022 to May 2023 and included a study of the structures, a stratigraphic analysis of the walls, and the performing of archaeological prospections. It also included the recovery of the main structure by eliminating non-original elements that were added after the closure of the church (Figure 1a). In addition, some elements were removed or restored in order to provide some security to the building. This study focuses on the geometric documentation of this stage, in order to obtain a first model of a certain resolution and accuracy of the state of the church. Future work will include the restoration of this space to be used for activities, which will give cultural dynamism to the old town of Jaén.
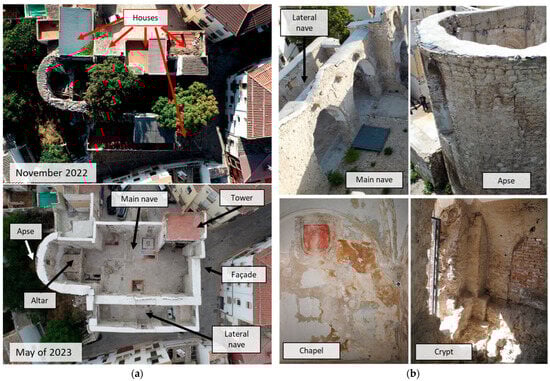
Figure 1.
Views of the church of S. Miguel: (a) views of the recovery intervention carried out from November 2022 (top) to May 2023 (bottom); (b) views of some exterior and interior structures.

Figure 2.
Views of the façade: (a) historical photograph with the façade in its original position; (b) current location in the Museum of Jaén; (c) current state of the location of the façade.
1.2. Objectives of the Study
The main objective of this study was to obtain a complete 3D documentation of the church representing the state of the building after the recovery intervention. This documentation consisted of 3D models and orthoimages. Both products will help to represent the geometry of the building, helping other researchers to develop further work, such as stratigraphic studies. In addition to the documentation of the state of the church, a secondary objective was to integrate the 3D model of the façade into the overall one, trying to simulate the original state of the building. Finally, we also included as an additional objective the development of a building information model (BIM) based on the products obtained in the previous stages.
These objectives and the geometric characteristics, location, and accessibility of the building decided the geomatic techniques to be used. From a geometric point of view, the church is divided into three naves separated by arcs and columns. The central nave contains an apse, where the altar is located. The presence of multiple spaces complicates data acquisition. There are two narrow crypts located under the floor of the church and under the altar and other small rooms, which were originally used as chapels, access stairs to other rooms, etc. In addition to these circumstances, there are elements surrounding the church (other buildings, vegetation, etc.) that complicate access to certain areas, causing significant occlusions. Finally, the original façade was located in a museum and presented with a different condition with respect to the church.
This manuscript is distributed into three sections: the first section describes the materials and the methodology applied to achieve the previously defined objectives; subsequently, the main results are described, including a discussion of them below; and the final section includes the main conclusions of this study and some proposals for future work.
2. Materials and Methods
Several geomatic techniques were selected by considering the characteristics of the church and the availability of sensors to achieve the objectives of the study. The goal was to ensure the complete coverage of the object (geometry and radiometry) and to obtain geometric products with a certain level of accuracy. In this sense, the project requirements implied a positional accuracy of a few centimeters. Evidently, these requirements and the complexity of the object forced us to implement geomatic surveys based on a fusion of techniques (a multi-sensor study). Table 1 summarizes the geomatic techniques used in this study, which were based on several sensors.

Table 1.
Sensors used in this study.
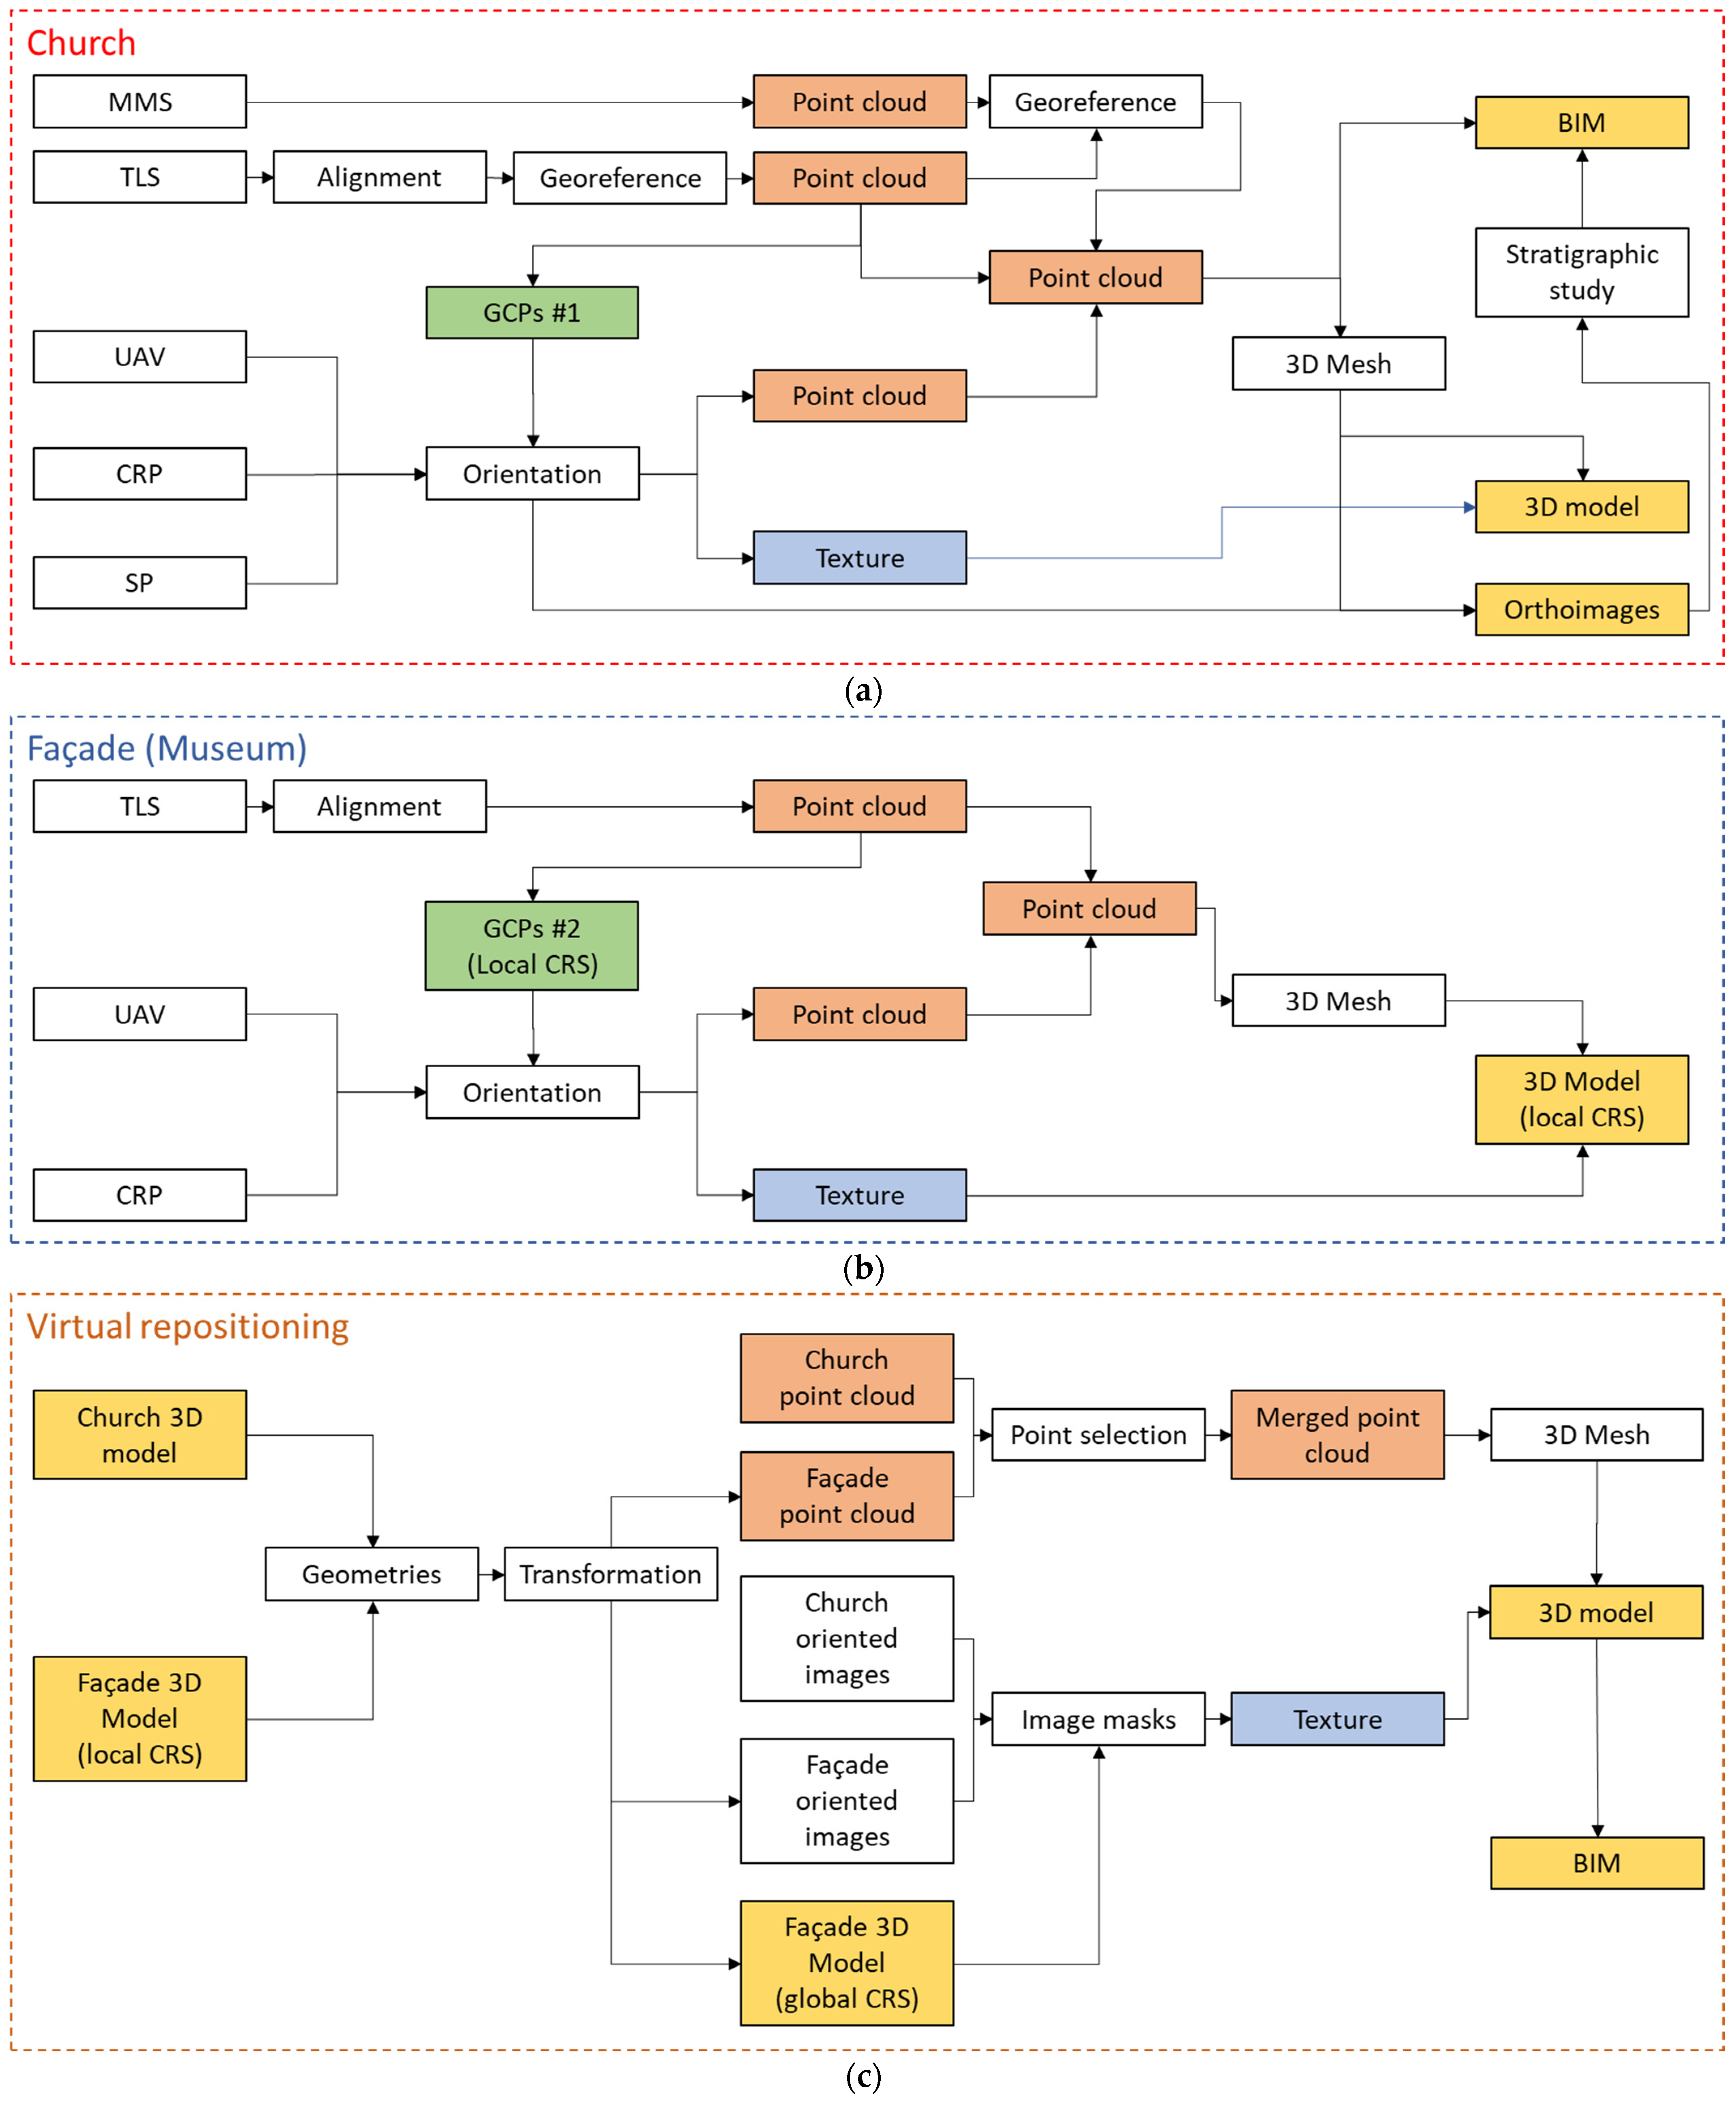
Considering the sensors selected, we developed a methodology divided into three main procedures, described in Figure 3: First, the procedures were applied to obtain a geometric documentation of the church (Figure 3a). Secondly, we used those developed to document the façade located in the museum (Figure 3b). Finally, we conducted a virtual repositioning of the 3D model of the façade on that of the church (Figure 3c).
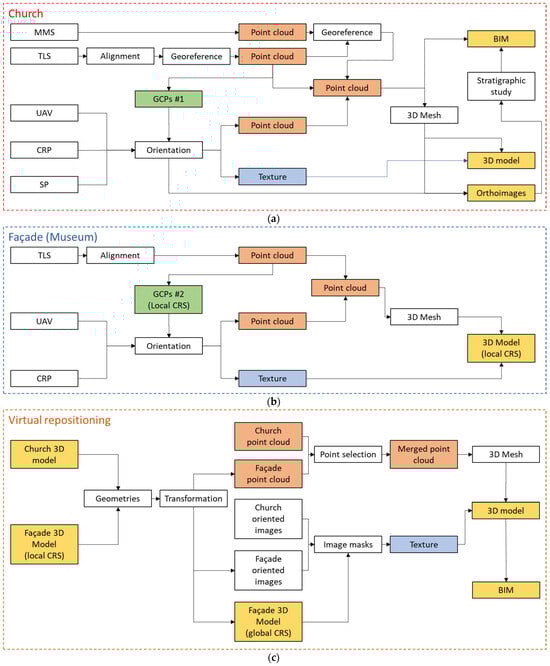
Figure 3.
Methodology proposed in this study: (a) documentation of the church; (b) documentation of the façade; and (c) virtual repositioning.
2.1. Procedures Developed in the Church
We selected three techniques based on five sensors to cover all spaces of the church: MMS, TLS, and photogrammetry (UAV, CRP, and SP) (Figure 4). Their use was adapted to the specific characteristics of each scene, although the data obtained from TLS were mainly used to document the geometry and as a reference base for the remaining techniques.
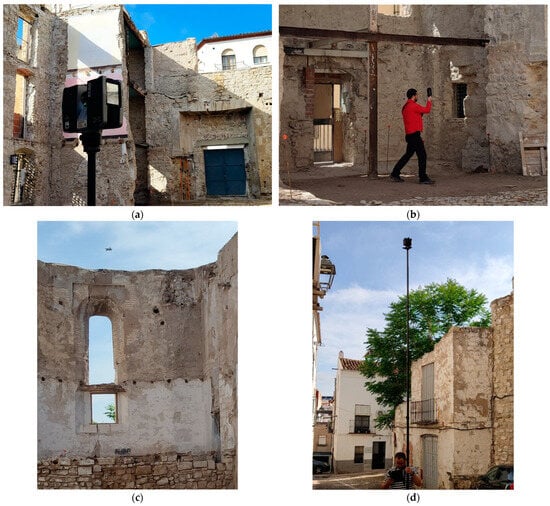
Figure 4.
Examples of the data acquisition techniques used to document the church: (a) TLS; (b) MMS; (c) UAV; and (d) SP.
The procedures carried out in this study are summarized below:
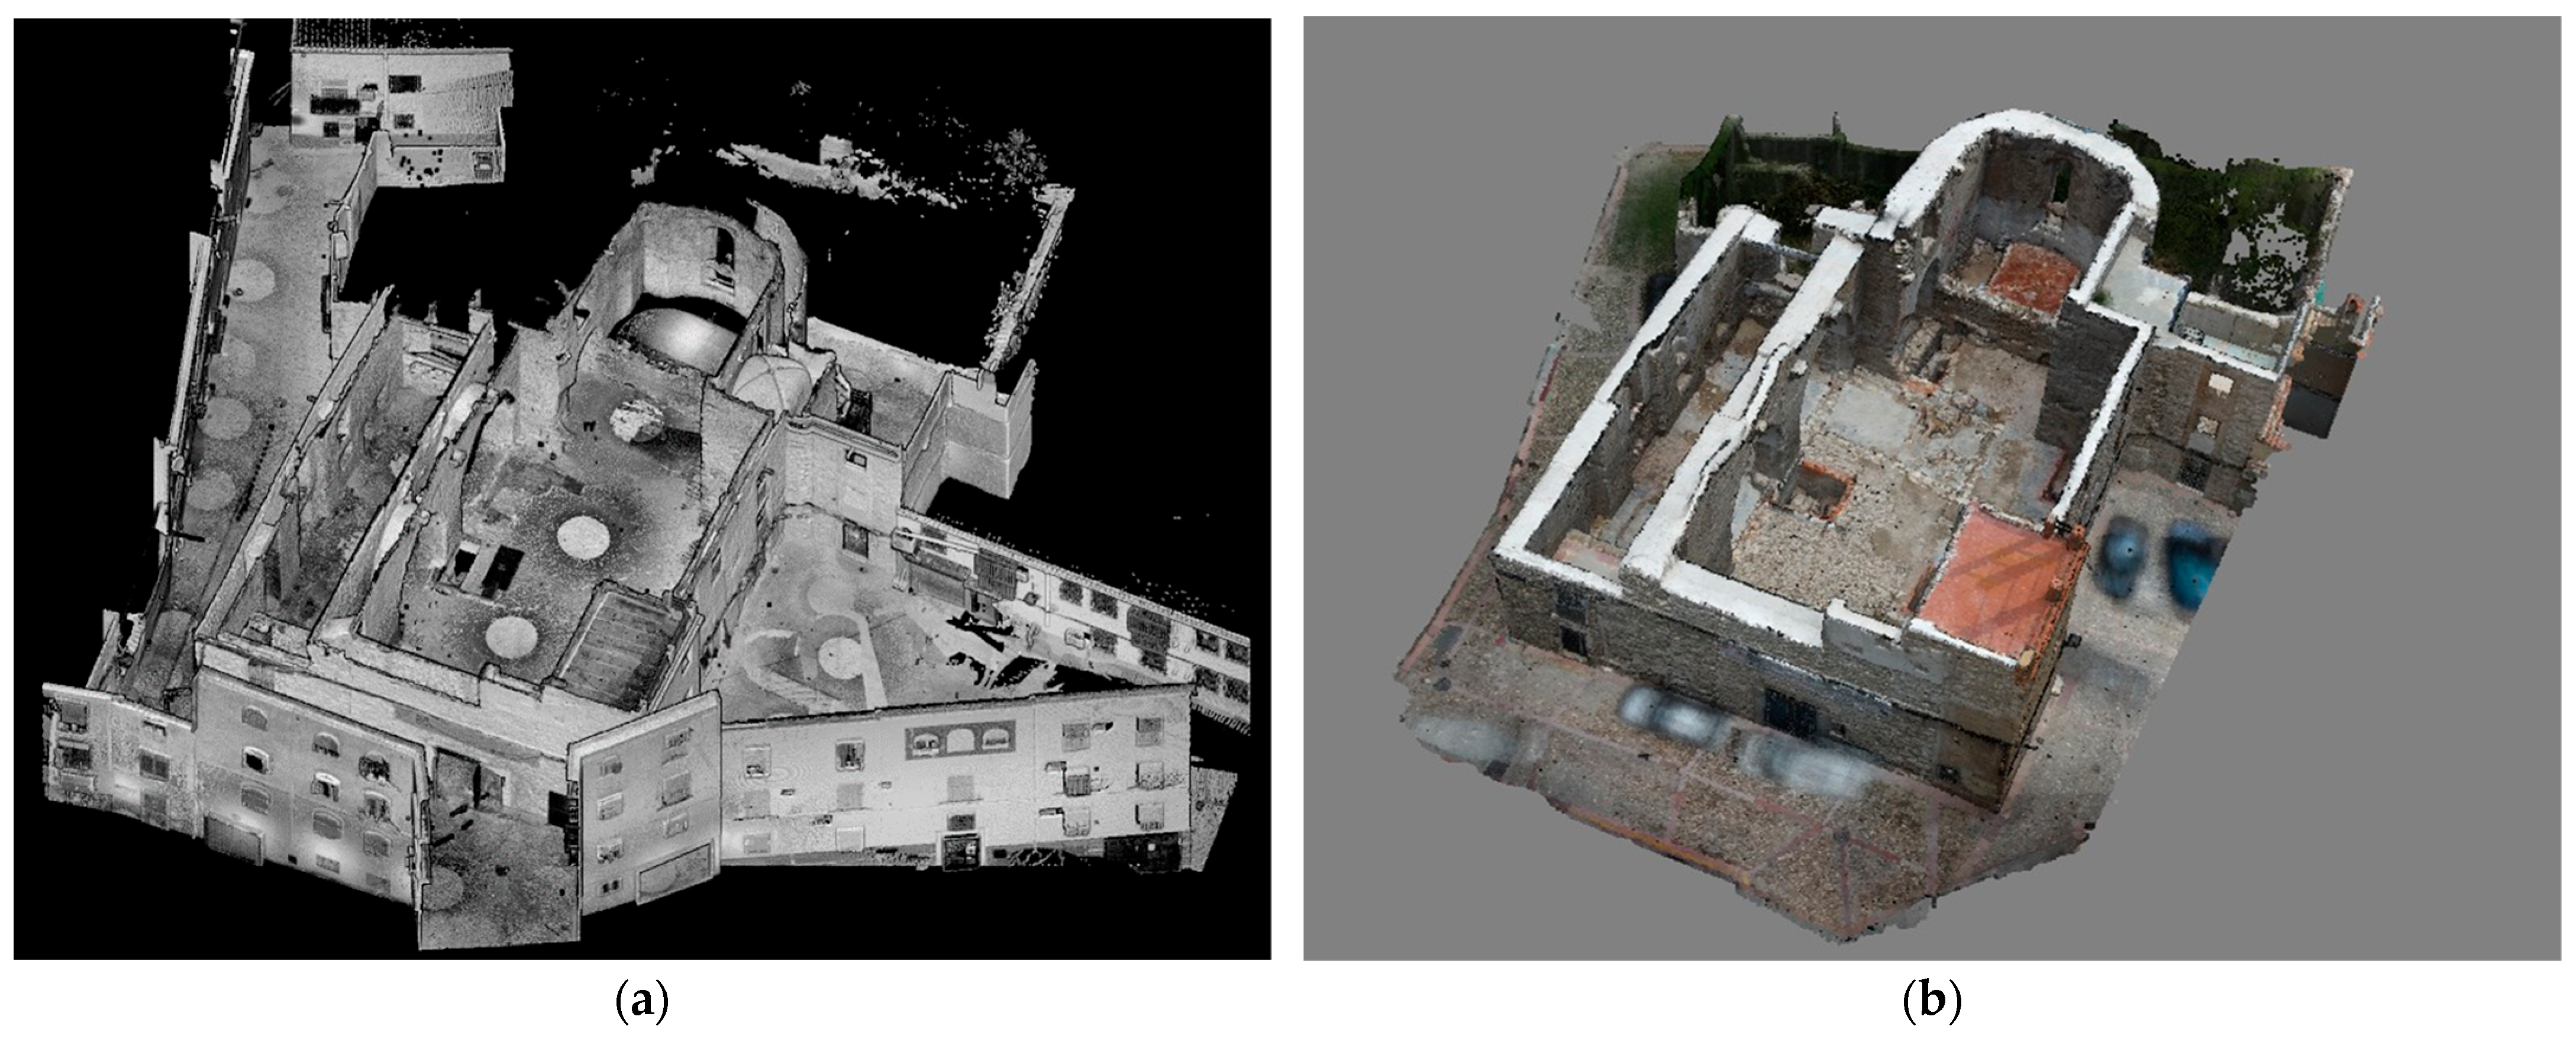
- TLS was focused on obtaining an accurate point cloud of the church and determining the coordinates of a set of Ground Control Points (GCPs #1), materialized on the object by means of targets, to be used in photogrammetric orientation procedures. Therefore, the final TLS point cloud was basic for the determination of the church’s geometry. This aspect implied the need for a large number of scanning stations to cover the entire scene. More specifically, we acquired 50 scans to cover most of the scene (Figure 4b). To improve the efficiency of the data acquisition, the scans were configured to avoid the possibility of obtaining color information at each point. This meant a capture time of about five minutes at each scanning station, considering a resolution value of about 12 mm at 10 m, guaranteeing a final point cloud with a minimum separation of less than one centimeter. Therefore, the scanner did not acquire images. We focused the acquisition of radiometric information on photogrammetry. The location of the scanning stations was planned in order to obtain complete coverage of the site. The distribution was also configured considering a large overlap between adjacent point clouds to facilitate alignment procedures. However, some zones, mainly located in higher areas, were not covered by this technique. Therefore, these areas were surveyed using photogrammetry. After TLS acquisition, all point clouds were relatively aligned, obtaining a complete point cloud (Figure 5a) using Faro Scene v.2023 and Maptek PointStudio v.2023 software. The Root Mean Squared Error (RMSE) of the alignment of all point clouds was about 13 mm. This point cloud was georeferenced to a global coordinate reference system (CRS) using external sources (an official LiDAR dataset of the zone);
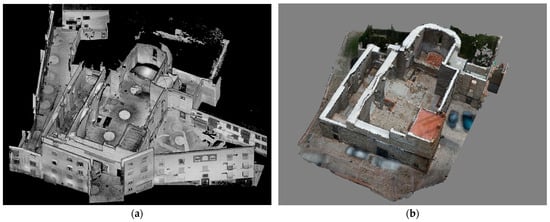 Figure 5. Examples of procedures developed in the church: (a) aligned TLS point cloud; (b) photogrammetric point cloud.
 - An MMS was applied in complex areas (narrow spaces) following planned trajectories of closed rings of a few meters in length (Figure 4a). The objective was to cover areas with gaps (considering other techniques) due to the complexity of the geometry or due to the presence of occlusions. These areas were illuminated by artificial light systems to facilitate sensor orientation (using Visual SLAM). We captured twelve point clouds following closed rings, obtaining a complete coverage of these complex zones. The point clouds were processed using Leica Cyclone Register 360 software. Georeferencing was carried out using the point cloud obtained from TLS. In this sense, all the point clouds obtained from MMSs were aligned, taking the TLS one as reference, using Maptek PointStudio v.2023 software. Therefore, the premise of MMS surveys was that all MMS point clouds had to share common areas with the reference point cloud (TLS). The RMSE of the alignment of all point clouds was about 26 mm;
- Photogrammetry was applied using techniques based on three sensors: UAV, CRP, and SP. The goals were to complete the point cloud in zones not covered by the TLS and to obtain a set of oriented images (covering the whole scene) in order to obtain textures and provide information for other products, such as orthoimages. The photogrammetric images were oriented using a set of well-distributed GCPs (GCPs #1). The UAV was essential for covering elevated areas (Figure 4c), where other techniques did not have access. We acquired more than 5100 images of the church, covering most of the scene, except for some complex spaces (e.g., niches). In the case of CRP, we used this technique to cover complex zones using the camera mounted together with an illumination system. In addition, we also acquired photographs of elevated zones using a mast and a remote device to control the camera. In this case, we acquired more than 975 images using this sensor. Photogrammetric surveys with both UAVs and CRP were used to obtain point clouds that guarantee the complete geometry of the church, adding those areas not covered by TLS. In addition, oriented photographs were used to obtain the texture of the object and orthoimages of the main elements. Finally, SP (360-degree camera) was used to complete the object texture in areas not covered by UAVs and CRP. The acquisition was very fast, due to the great coverage provided by the 360-degree images in each shot. We included a camera-mounted 360-degree illumination system to guarantee lighting conditions in indoor areas. In addition, we minimized the need of GCPs for the orientation procedure by using some known constraints (used as scale bars) after the extrinsic calibration of the 360-degree camera (see the example in [7]). The camera was mounted both on a tripod to cover narrow spaces and on the mast to reach elevated zones (Figure 4d). In total, we obtained about 3600 fisheye images, using this sensor at about 600 shooting stations. The image processing (e.g., orientation) of each technique and zone was developed individually and then merged, obtaining, as final products, a point cloud from photogrammetry (Figure 5b) (UAVs and CRP), a complete texture (UAVs, CRP, and SP), and 39 orthoimages (UAVs and CRP) of the main walls of the church. We used a set of well-distributed points to calculate the accuracy of the image orientation, showing different values depending on the zone and the sensor (Table 2). To perform these procedures, we used Agisoft Metashape v.2. The orthoimages were used to develop a stratigraphic study of the main elements of the church. This study was implemented using Autocad v.2021, where the polygons related to each stratigraphic unit were digitized.
Table 2. Accuracy of image orientation.
The accuracy obtained after processing the data sufficiently achieved the requirements of the project. The data fusion between MMSs, TLS, and photogrammetry was conducted using Maptek PointStudio v.2023. The procedure consisted of selecting points from the photogrammetric and MMS point clouds of those areas with gaps in the TLS point cloud. The criterion was to use first those points from the photogrammetric point cloud and then those from the MMS in zones where the previous one had gaps. This criterion was selected because of the reduction in noise detected in the photogrammetric point cloud with respect to the MMS. In any case, point selection (photogrammetric or MMSs) was supported using a distance threshold (5 cm) with respect to the TLS point cloud. Once the complete point cloud was obtained, we applied a distance filter of 1 cm to obtain a product with a homogenous density of points. The next step consisted of obtaining a 3D mesh and then a 3D model, including the photogrammetric texture (using Agisoft Metashape v.2). This product constitutes the main documentation of this study due to its capacity to be used for further archaeological and architectural research, virtual visualization, restoration works, etc.
In addition, we also developed a building information model (BIM) with a LOD of 200 in order to facilitate the management of further restoration works. To perform this BIM, we used Autodesk Revit v.2023 software. Firstly, we imported the point cloud of the church into this software. Subsequently, we defined objects (walls, floors, and ceilings) based on this point cloud to obtain the BIM model of the church. In addition, we used the results of the stratigraphic study to add attributes to the objects related to walls. Thus, the digitized polygons from the stratigraphic study were used to divide the modeled walls in the BIM. This procedure was carried out by importing and positioning the related stratigraphy in each wall. Dynamo for Revit v.2.13 software was used to develop a script to divide walls by considering each stratigraphic unit. This allowed us to manage the structural elements of the church, taking into account these results. Regarding complex scenes, all elements were modeled (parametric) except the crypts, which have been included as 3D models (non-parametric) due to their irregular geometry.
2.2. Procedures Developed in the Museum
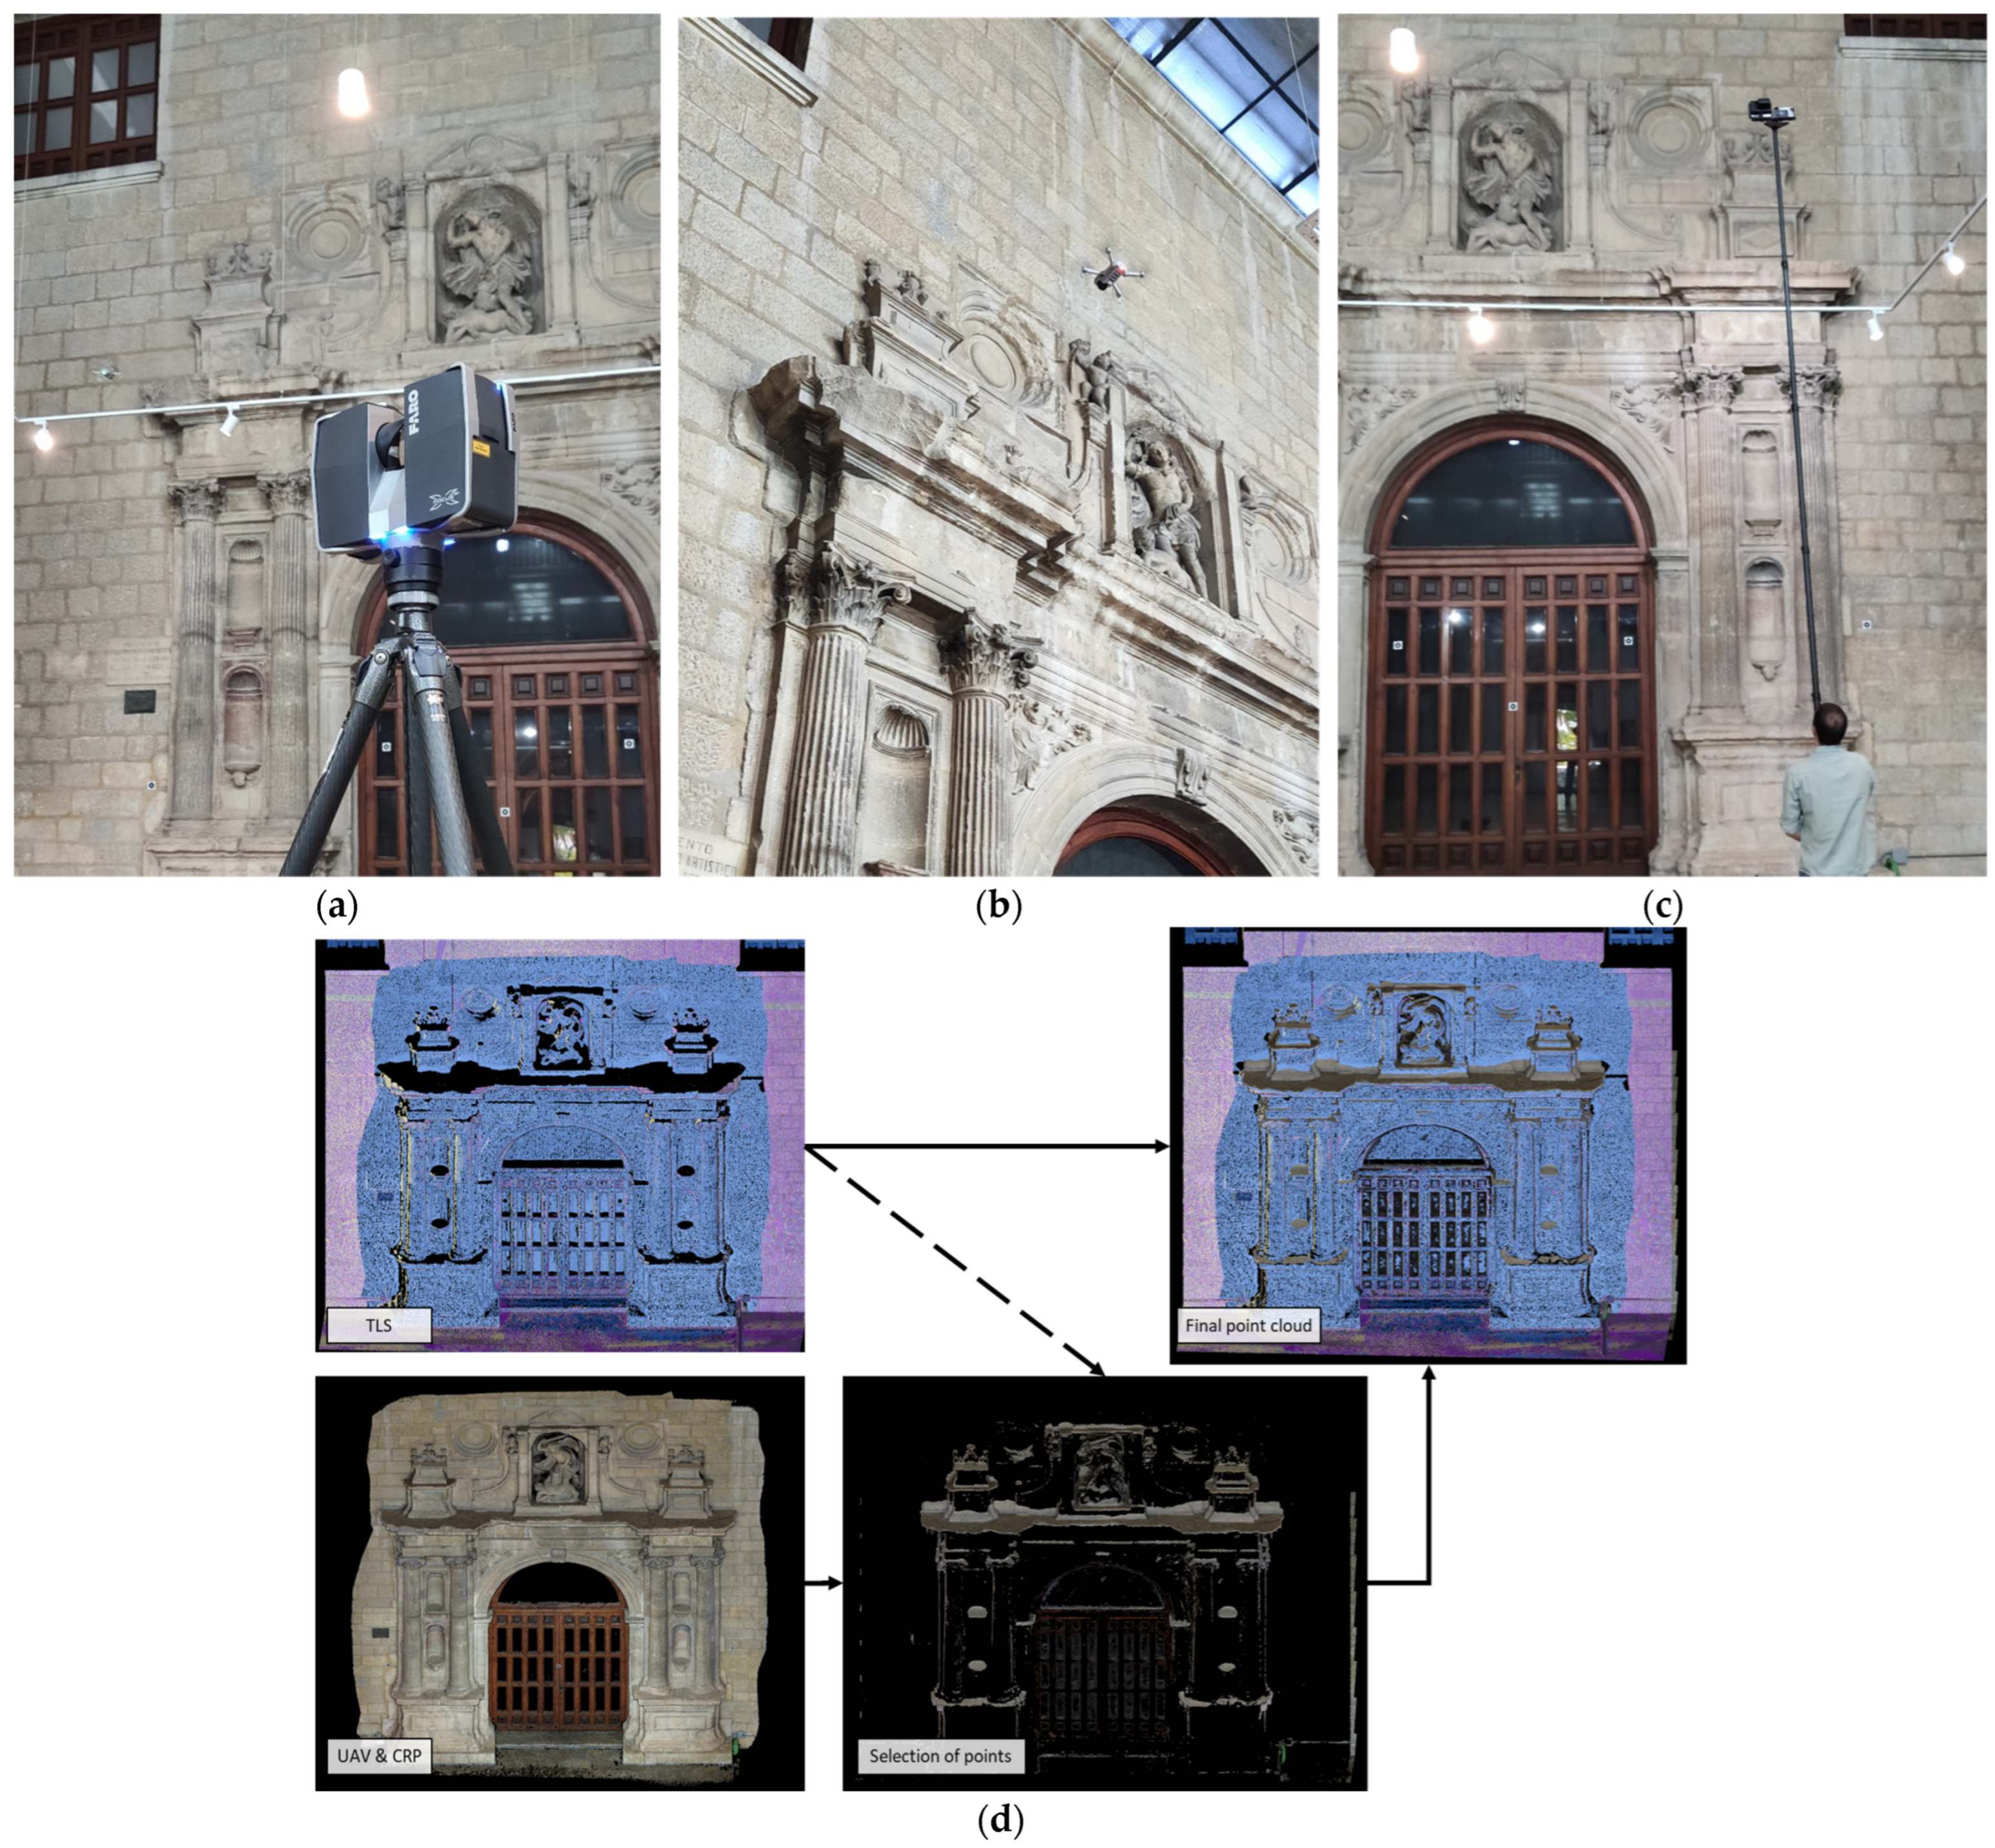
The techniques used to document the façade geometrically were TLS and photogrammetry (UAVs and CRP). TLS was used to define the geometry of the façade in the same way as the church. We obtained a more-or-less completed point cloud of this element after aligning four scans developed from different scan stations (Figure 6a). The alignment was relative and was based on the existence of a large overlap between single point clouds. The RMSE obtained in this procedure was about 9 mm. The aligned point cloud allowed us to obtain a set of coordinates (referred to a local CRS) of several well-distributed targets (GCPs #2) materialized over the scene. These GCPs were used for photogrammetric orientation procedures. The point cloud obtained by TLS covered almost the entire scene. However, some elevated zones were not covered. To document these gaps and provide a high-quality texture to the final model, we developed two photogrammetric surveys using two sensors. The UAV (Figure 6b) and CRP (Figure 6c) completed the scene with 680 and 323 images, respectively. Both sets of images were oriented using the GCPs (#2), obtaining an RMSE value of 2 mm. As results of the photogrammetric surveys, we obtained both a photogrammetric point cloud and a texture. The final point cloud was based on TLS by adding a selection of points extracted from the photogrammetric point cloud in uncovered areas (Figure 6d). Finally, the point cloud was filtered using a threshold of 5 mm in order to obtain a homogeneous density, and, together with the photogrammetric texture, a final 3D model was determined. This 3D model was referred to as a local CRS.
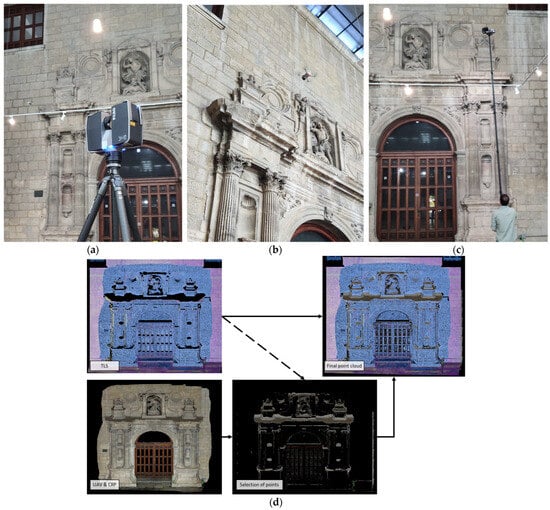
Figure 6.
Examples of data acquisition and processing techniques applied to document the façade: (a) TLS; (b) UAV; (c) CRP; and (d) integration of TLS (top) and photogrammetric (bottom) point clouds.
2.3. Procedures for Repositioning
The objective of this methodology was to reposition the 3D model of the original façade in the 3D model of the church. In this way, the procedure consisted of obtaining a virtual representation of the church with this important element that was removed approximately a century ago. To achieve this, we had to consider two main problems: first, both datasets referred to different CRSs; second, the fusion of both datasets was implemented in order to obtain a final combined 3D model.
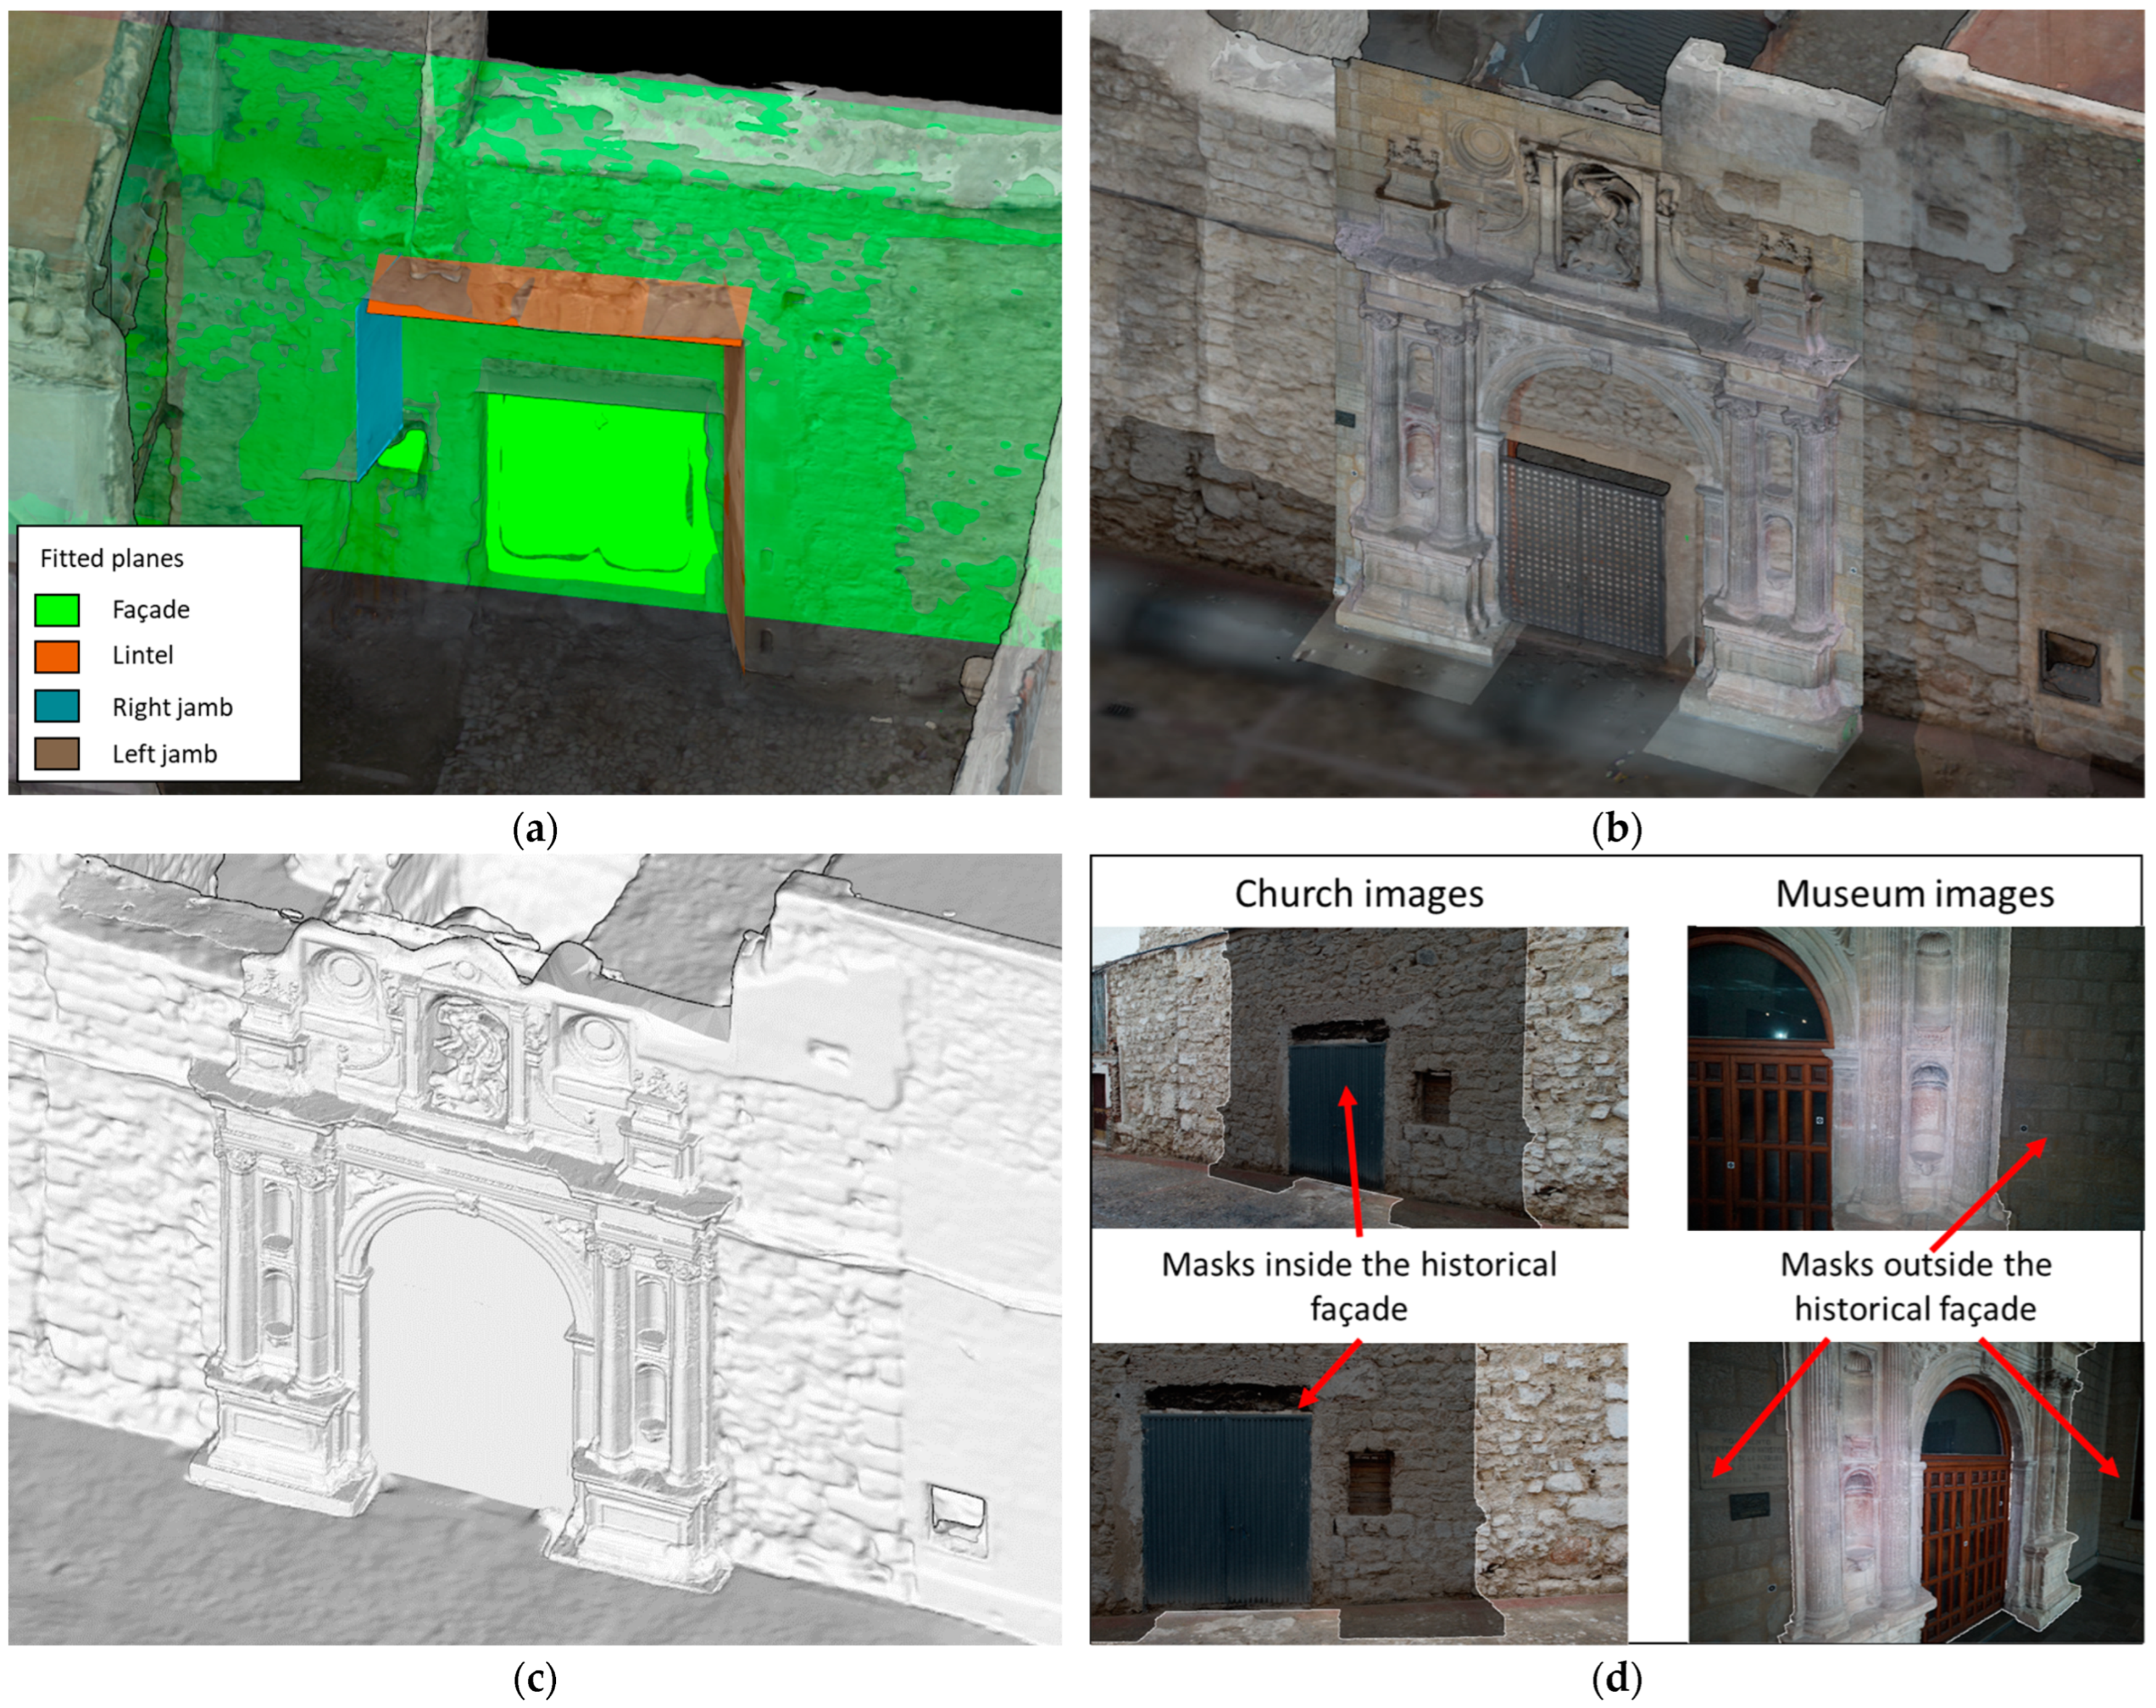
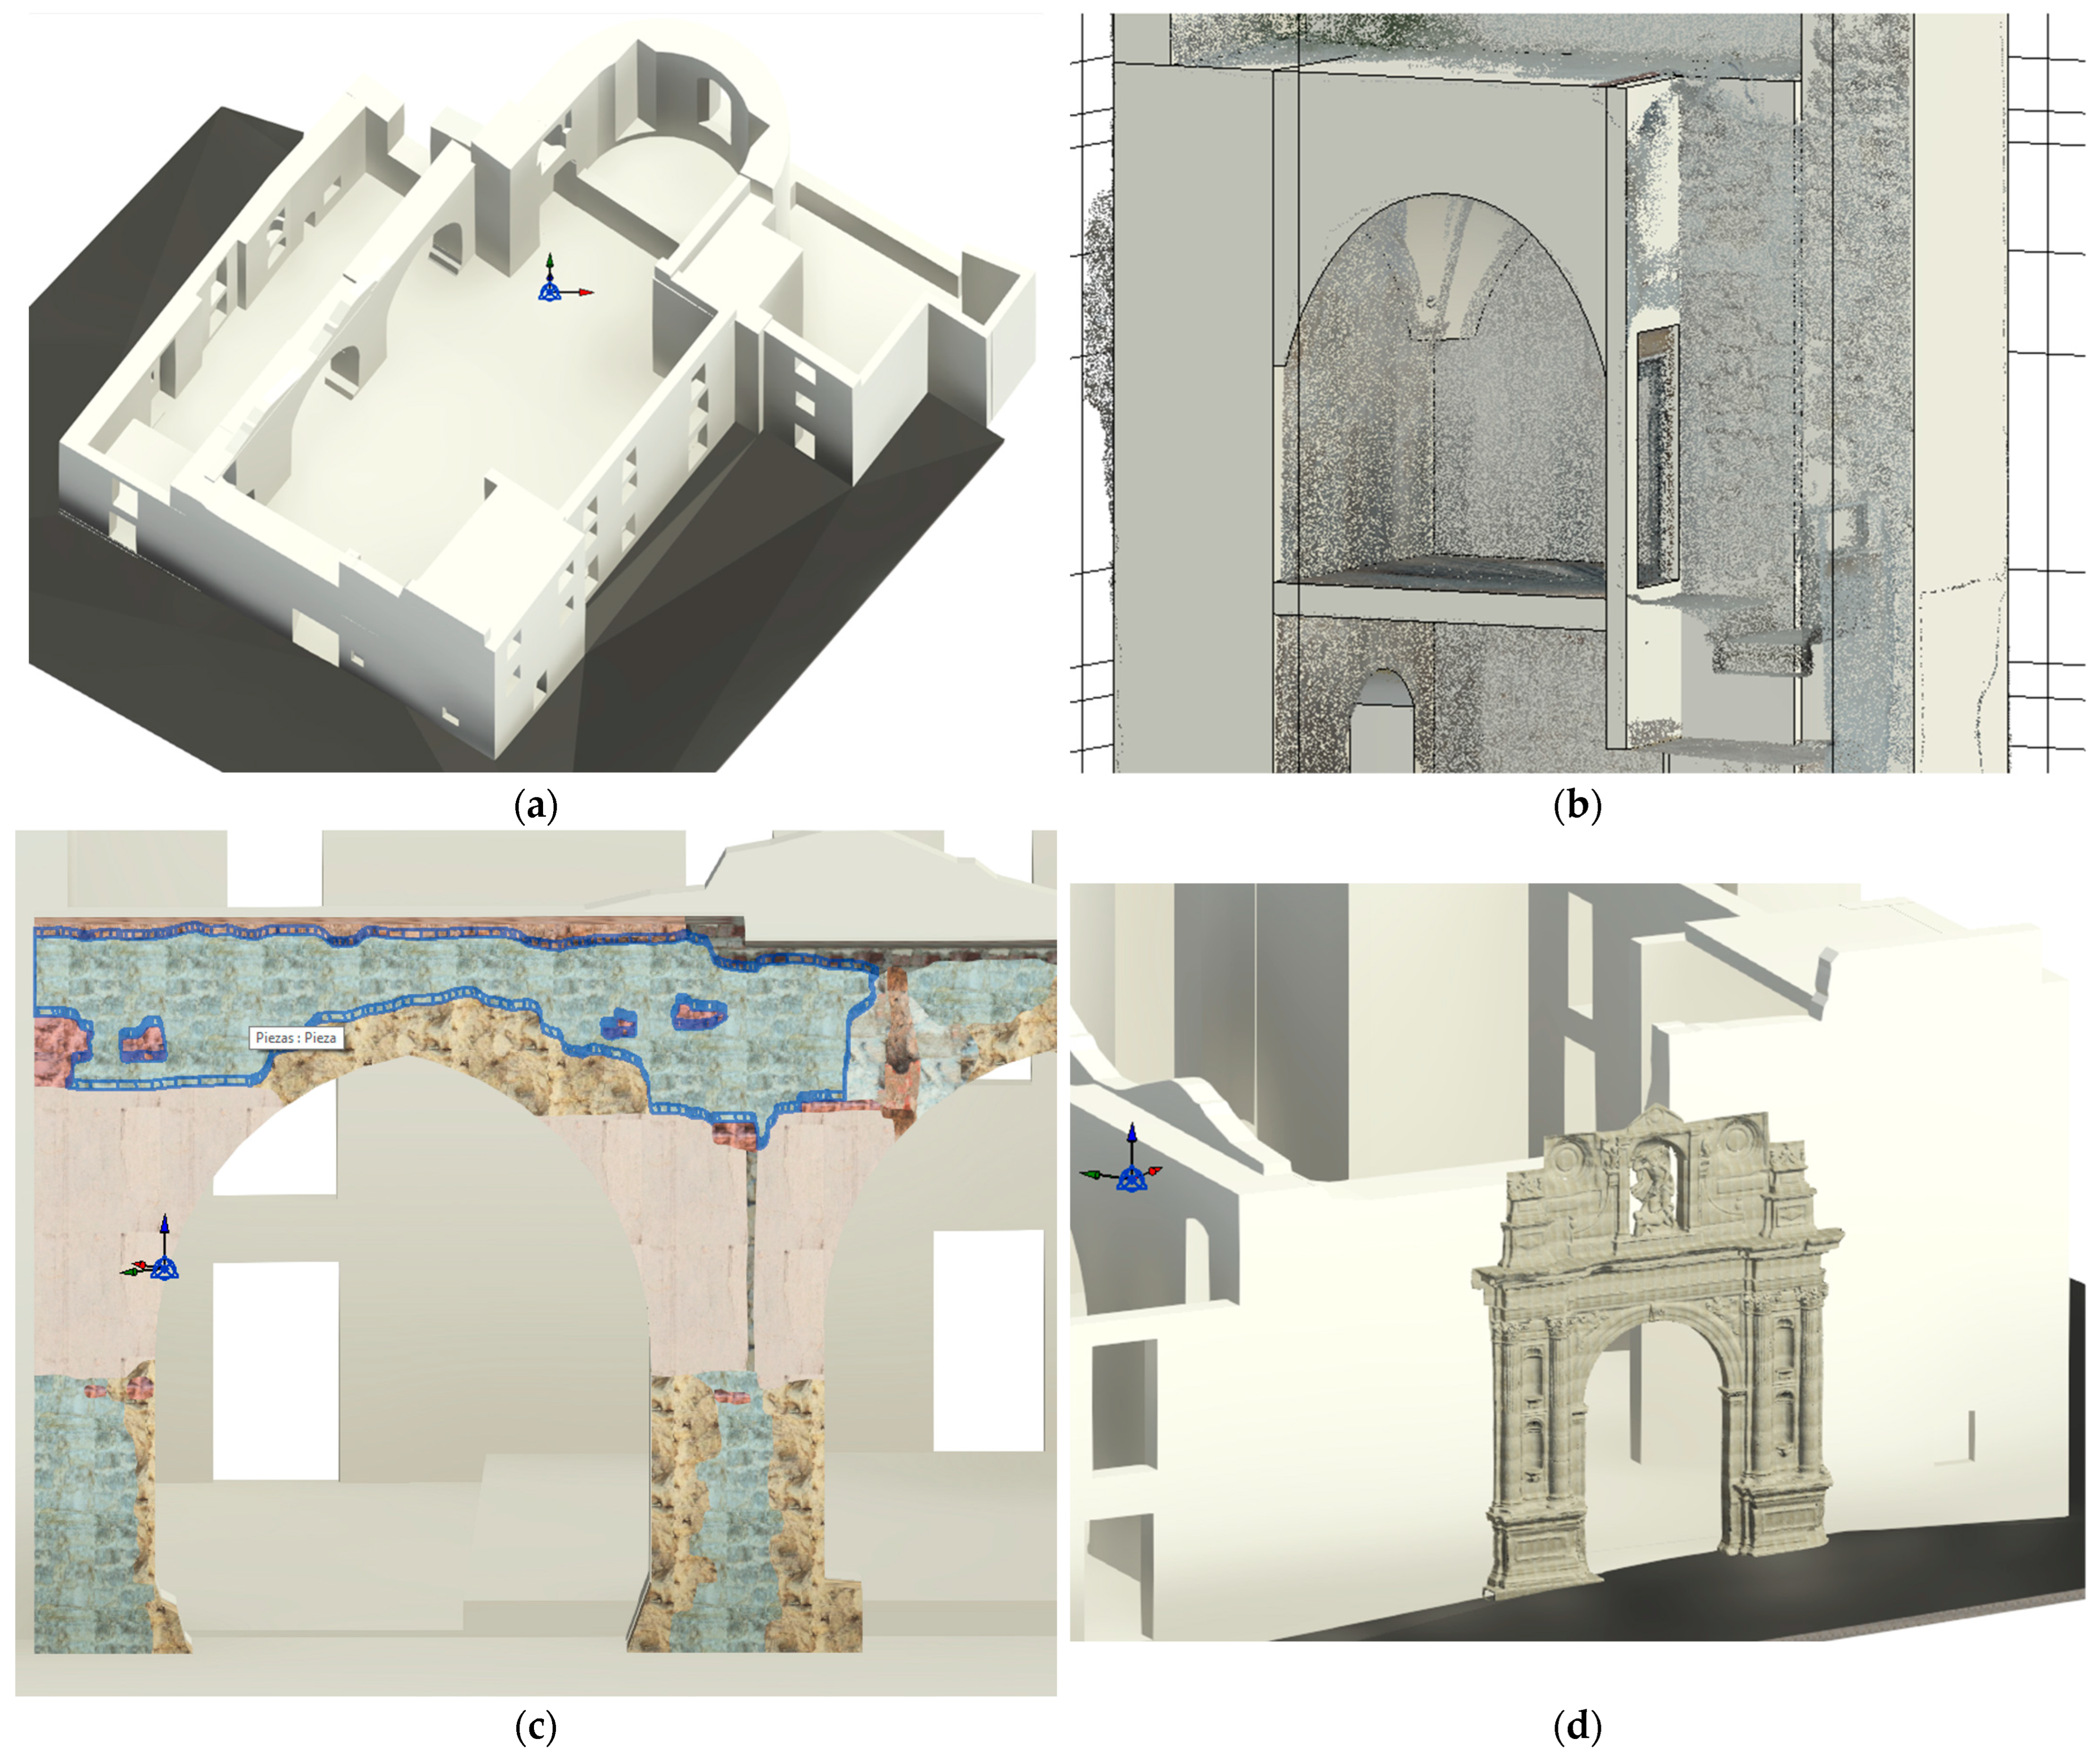
The CRS discrepancy was resolved using a 3D transformation applied to the 3D model of the façade (including the GCPs #2). The procedure was based on several well-defined common geometries in both models. These basic plane-defined geometries were fitted from a selection of vertexes extracted from the 3D models, in both cases following the procedure described by Mozas-Calvache et al. [65]. Therefore, we obtained two planes defining the façade wall in both the church and the museum. The transformation considered these planes to be coincident. Other fitted planes were obtained from the 3D model of the church, allowing us to define the doorway jambs and lintel (Figure 7a). These others were to coincide with the doorway of the façade. With these considerations in mind, we performed the transformation using Maptek PointStudio software by means of a 3D translation and an XY rotation, obtaining both 3D models referring to the same CRS (Figure 7b). The Z rotation was not included because both models were level.
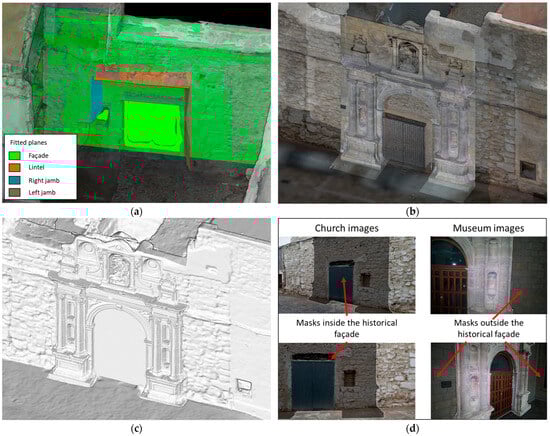
Figure 7.
Procedure for repositioning the façade: (a) obtaining geometries; (b) 3D transformation of the 3D model of the façade; (c) merged 3D mesh; and (d) examples of image masks.
The data fusion was carried out by repeating part of the photogrammetric process but modifying the point cloud and the images used. More specifically, we obtained a point cloud merged from a selection of points extracted from both datasets, considering the integration of the façade in the church. To perform this, we obtained the boundary of the façade from its 3D model and we removed those points of the church included within this boundary by considering a certain distance with respect to the main plane of the boundary. After that, we added in these areas those points extracted from the façade. This merged point cloud was used to obtain the 3D mesh (Figure 7c). On the other hand, we used the oriented images of the church and reoriented those images of the façade using the GCPs #2 after their transformation to the global CRS. The 3D model of the façade (global CRS) was used to define masks (Figure 7d) on images in order to avoid areas of the church project that coincided with the façade and vice versa. In this sense, we selected masks inside the façade area in those images captured in the church. On the other hand, we selected masks outside the façade in those images captured in the museum. Considering the 3D mesh and these oriented images with their masks, we obtained the final texturized 3D model. This 3D model supposed the virtual repositioning of the façade on the church and was also integrated into the BIM (non-parametric model) to perform simulations.
3. Results
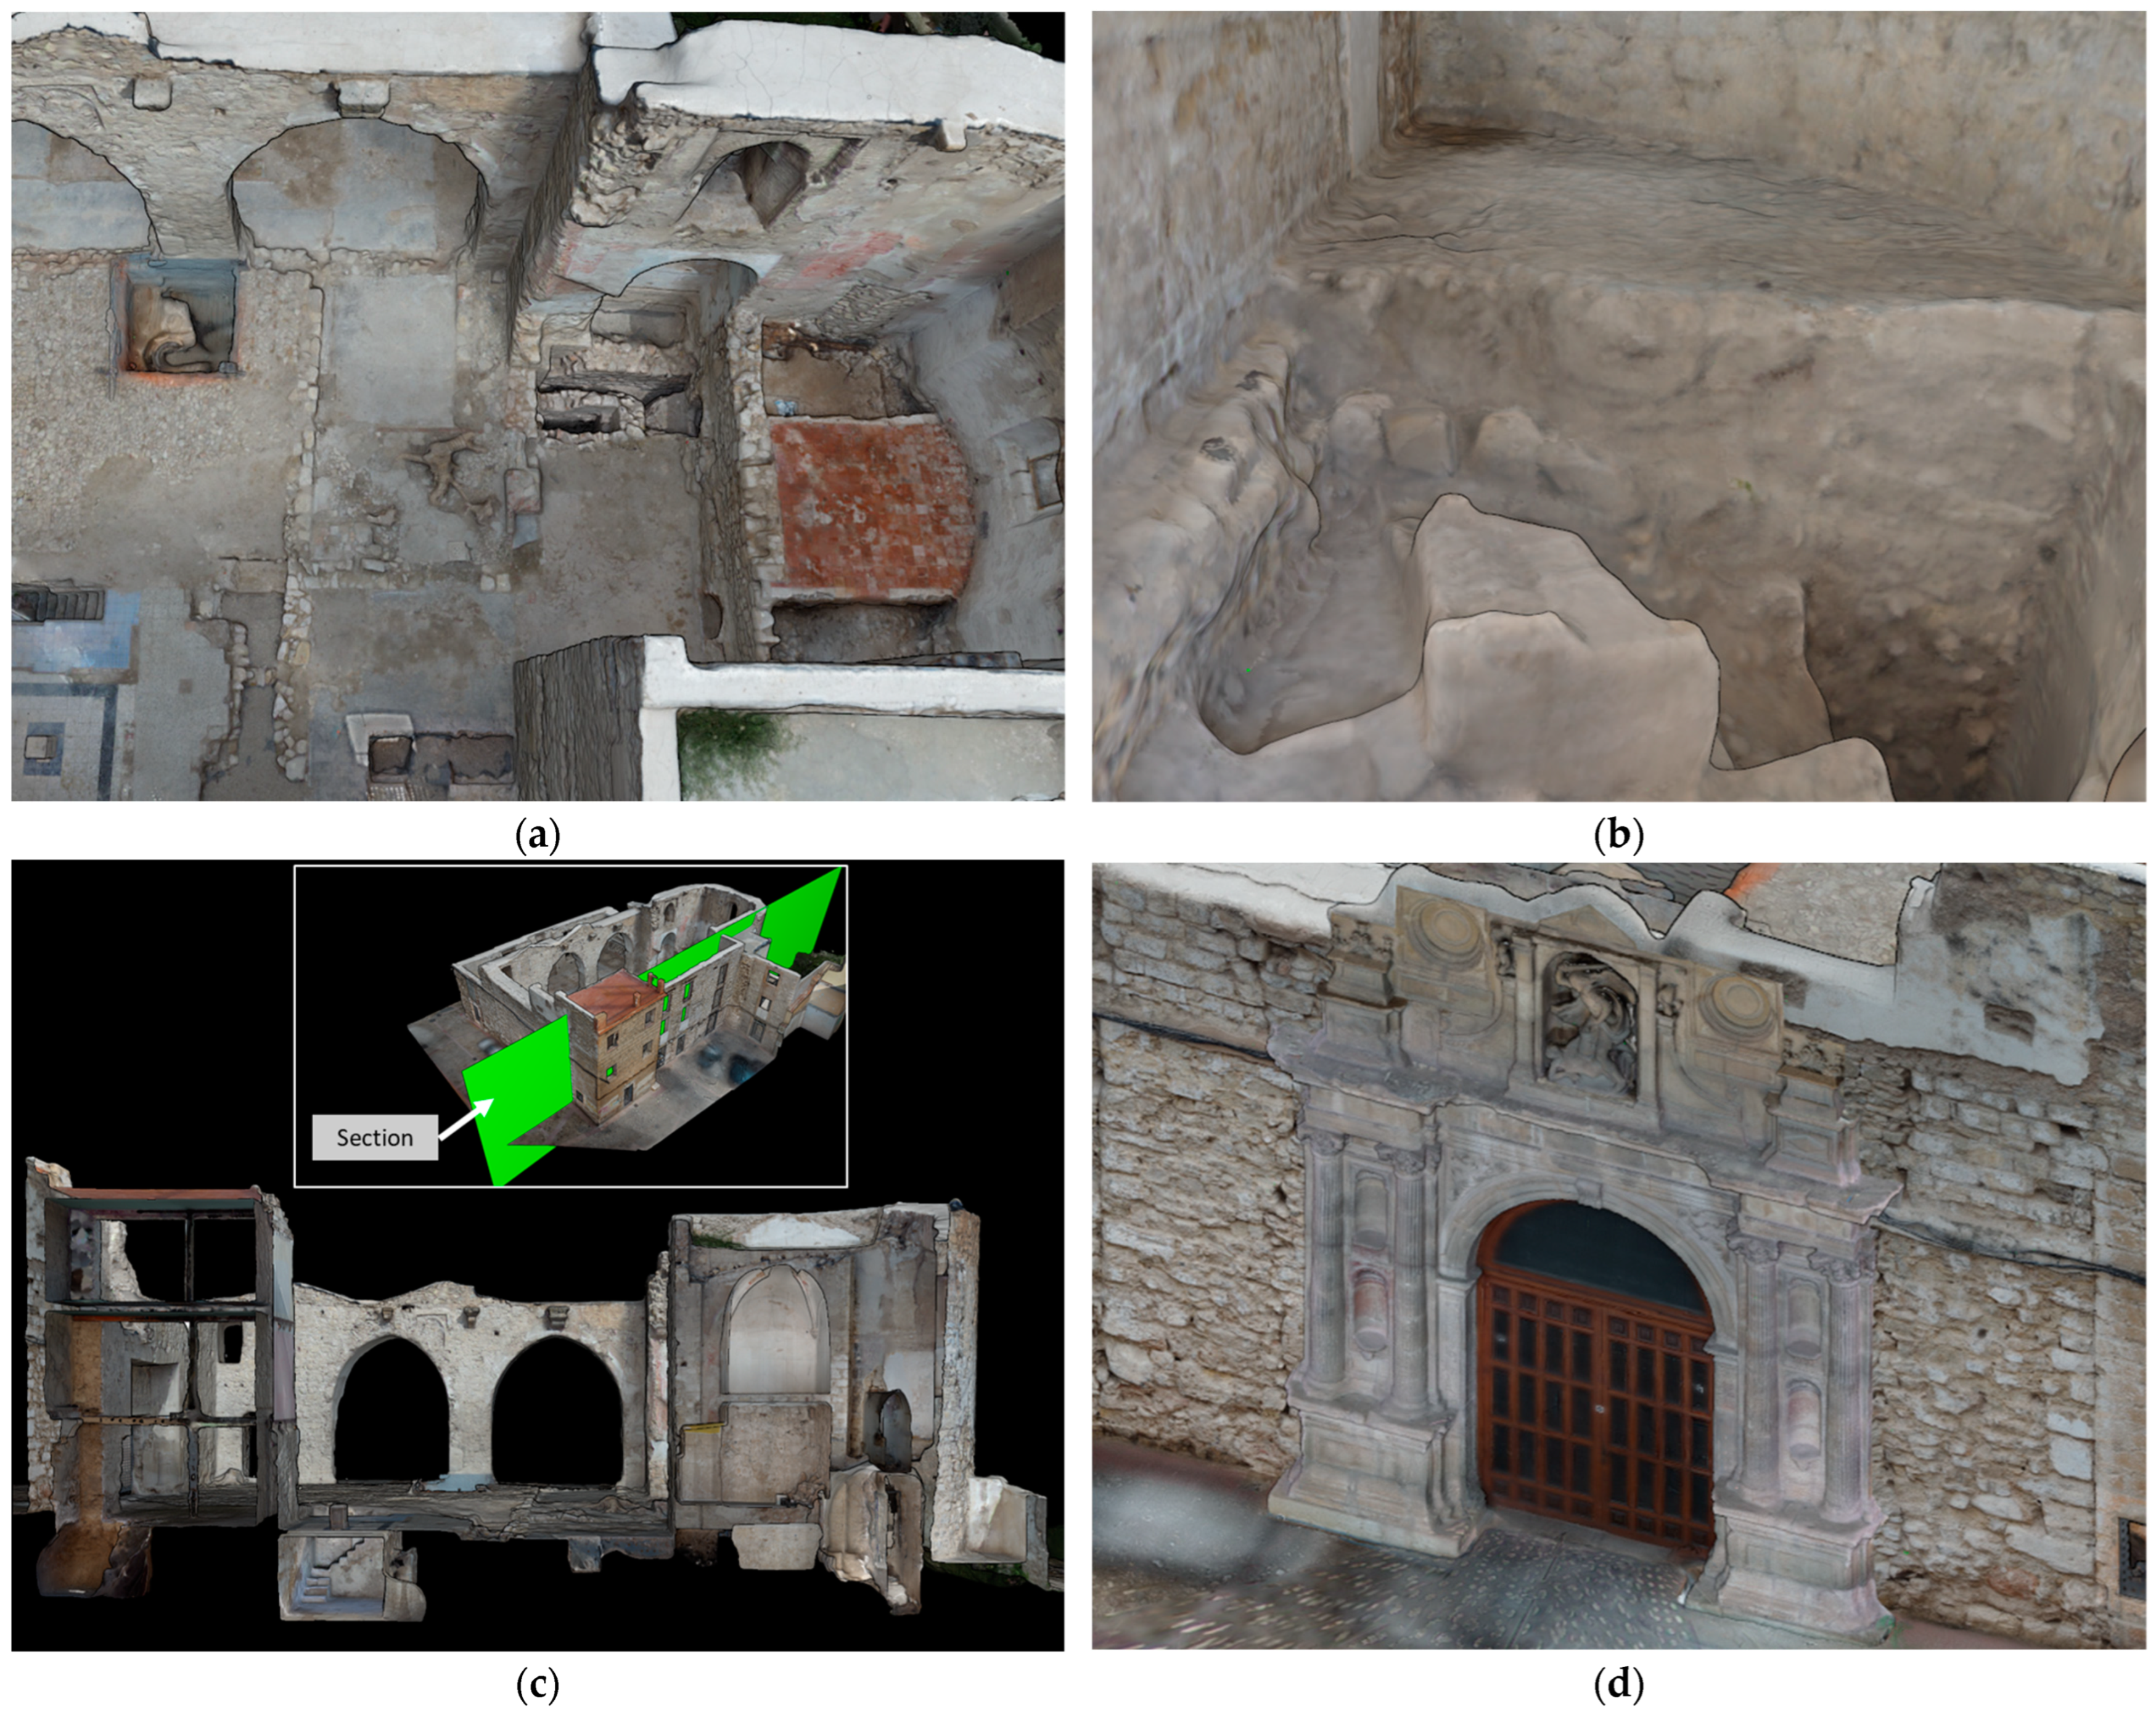
The main result of this study has been obtaining a complete 3D model (Figure 8a) of the status of the church after the recovery works. This model includes all the structures, including the archaeological prospections created next to the altar and in the main nave and other annexed areas, such as those located in the two crypts (Figure 8b), where the complexity of the scene complicated the application of geomatic techniques. Figure 8c shows a view of a section of the 3D model where some of these complex areas are visible. The 3D model includes a photorealistic texture obtained from the photogrammetric surveys. Therefore, the main objective of the study was achieved completely with this product. In addition, the original façade, located in the Museum of Jaén, has also been documented, obtaining a complete 3D model of this element. This 3D model has been repositioned in its original location in the church. Therefore, we obtained an additional 3D model of the church containing the original façade (Figure 8d). A video of these 3D models has been shared on Youtube (https://youtu.be/UBAn-JVJ_fE) (accessed on 29 May 2024).
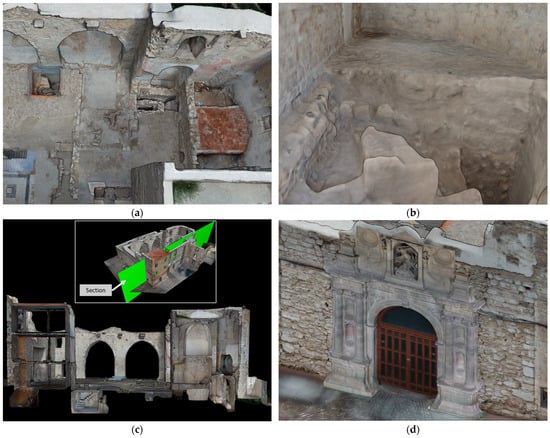
Figure 8.
3D model of the church: (a) a view of the main nave and the altar; (b) a view of the crypt located under the altar; (c) a view of a longitudinal section of the 3D model; (d) and a view of the repositioned façade.
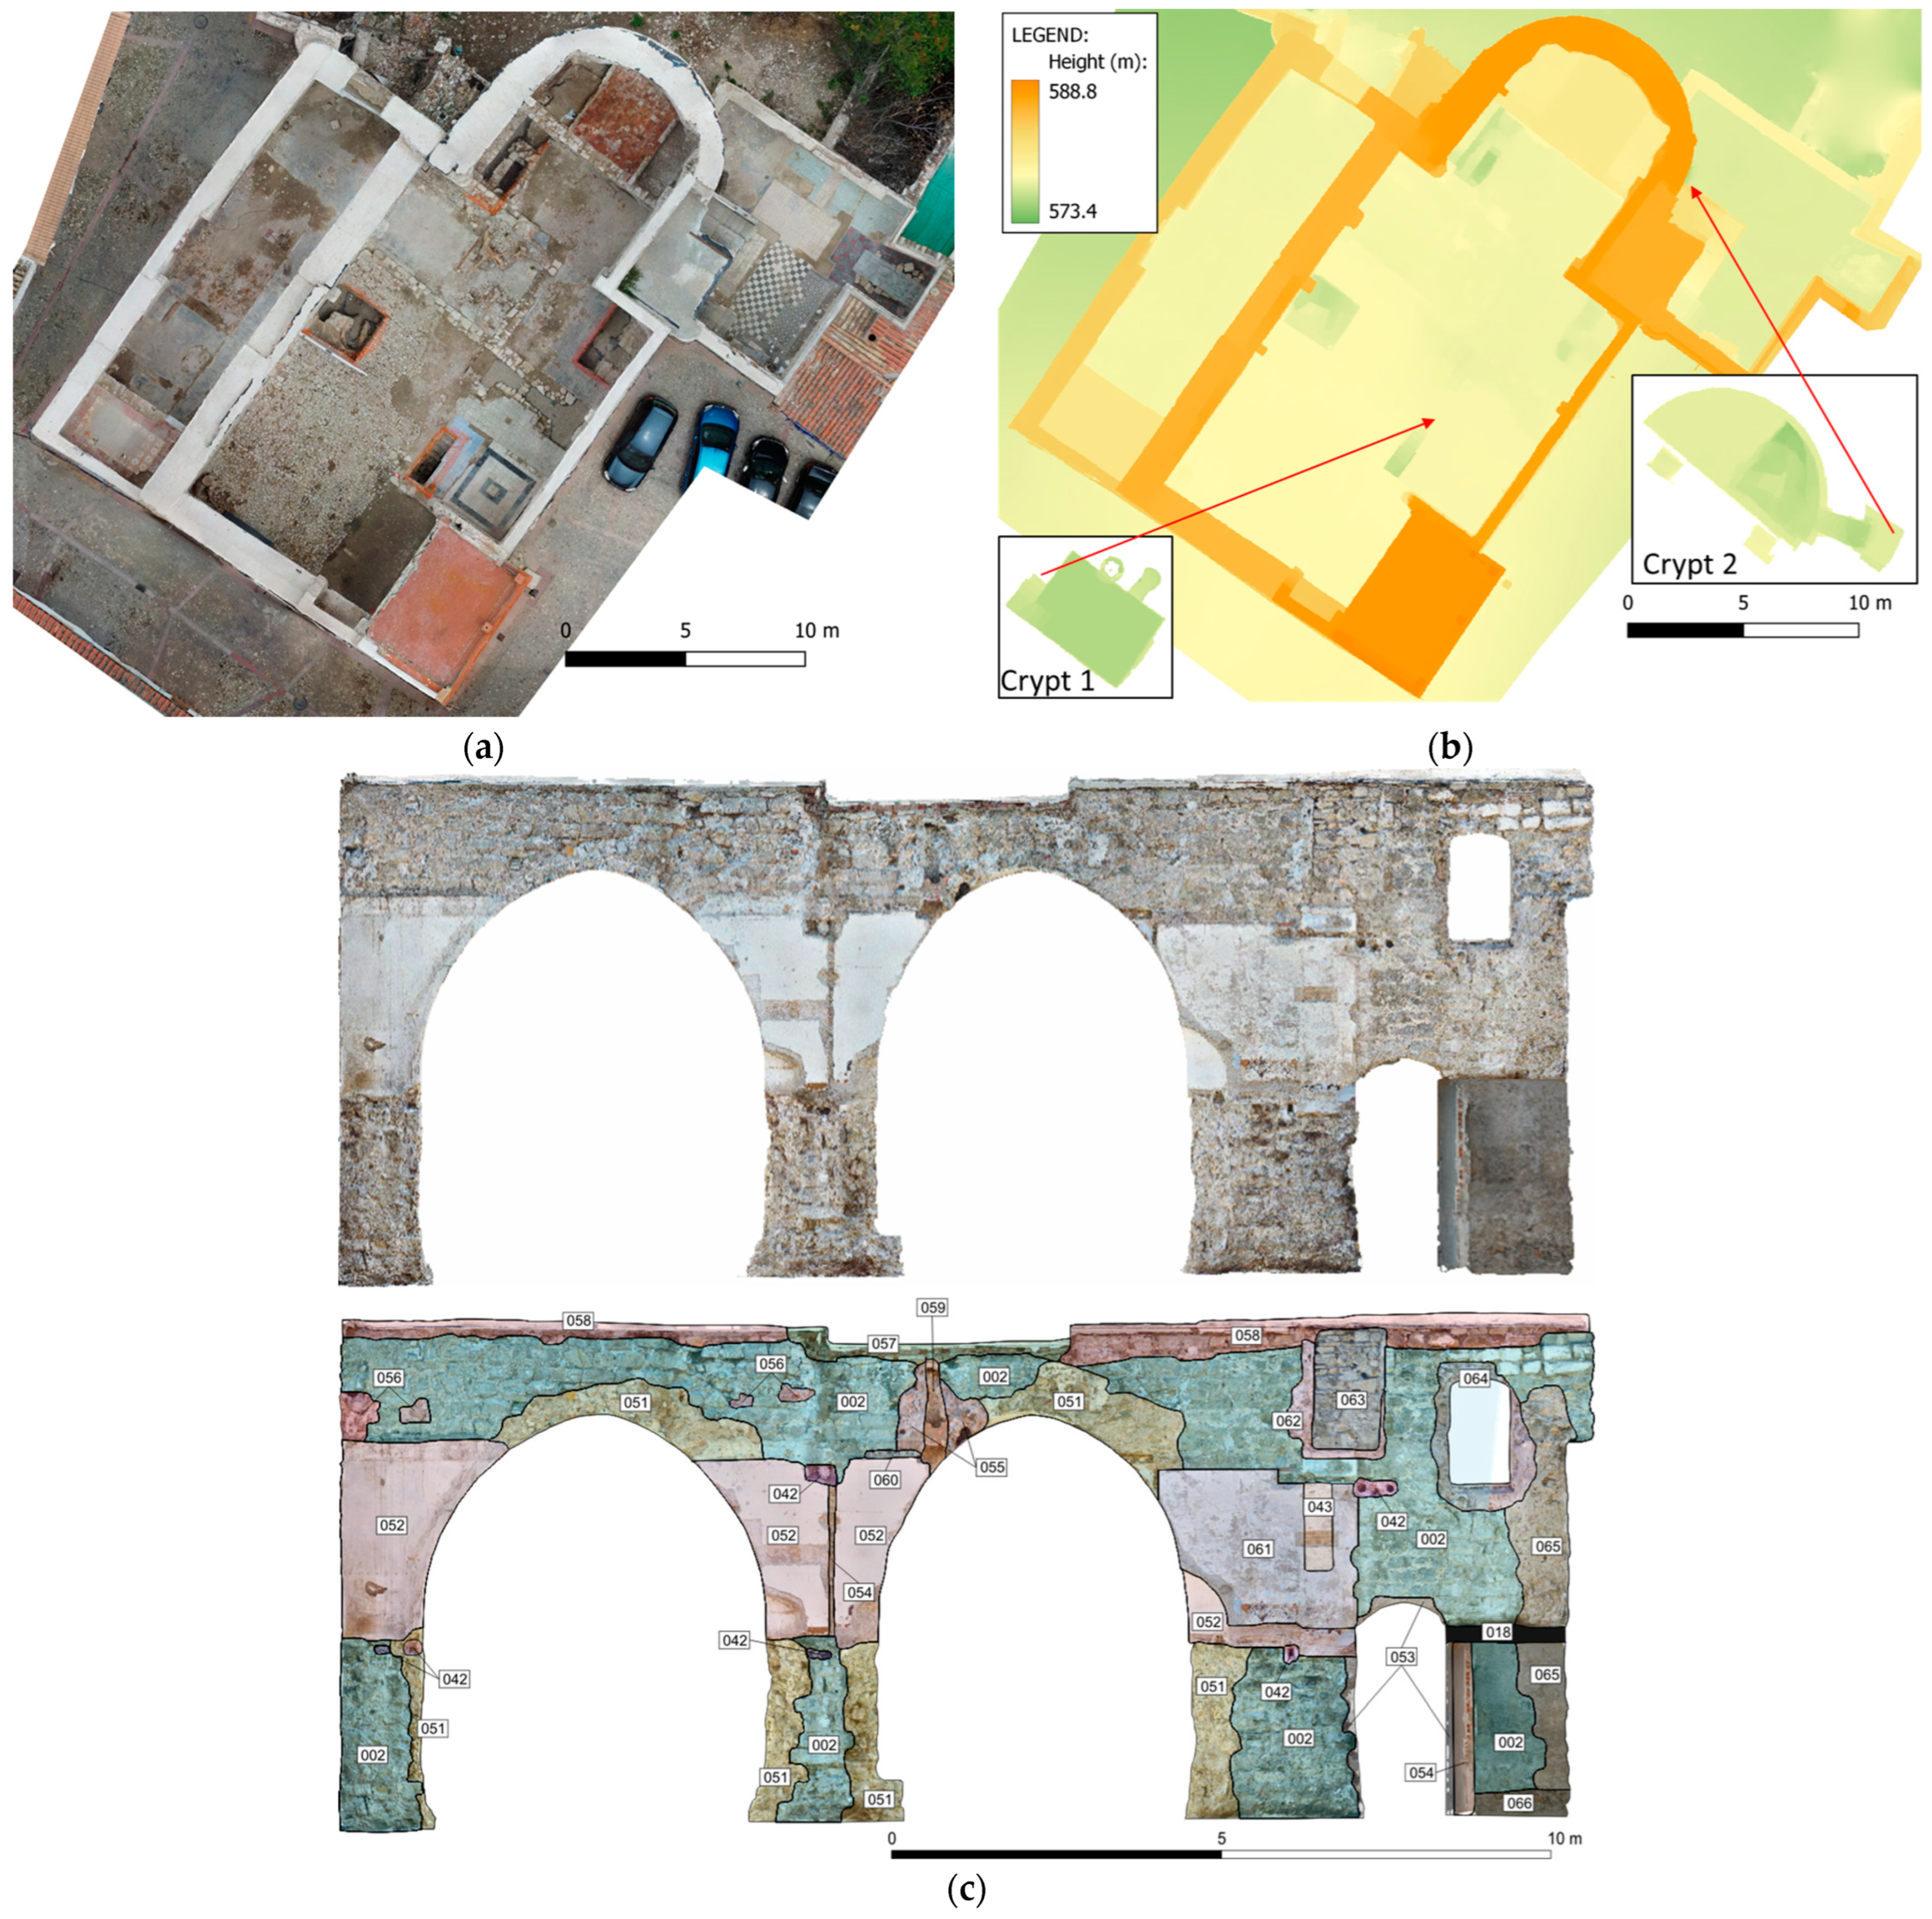
In addition to this main product, other results were developed to facilitate other archaeological and architectural studies. In this regard, the photogrammetric surveys provided a large number of orthoimages of the main structures of interest. As an example, we obtained a general orthoimage with a resolution of 1 cm (Figure 9a). In addition, we also obtained a complete DEM of the church and of the two crypts (Figure 9b). These products facilitated the analysis of elevations of the different spaces, allowing researchers to analyze those constructive processes carried out during the construction of the church. In addition, these products were used to obtain a topographic map of the church. This study also included the analysis of the main walls in order to analyze their stratigraphy and their constructive processes. In this sense, we obtained several orthoimages of these walls (Figure 9c) with a resolution of 1 mm, where the archaeologists implemented a stratigraphic study (Figure 9c).
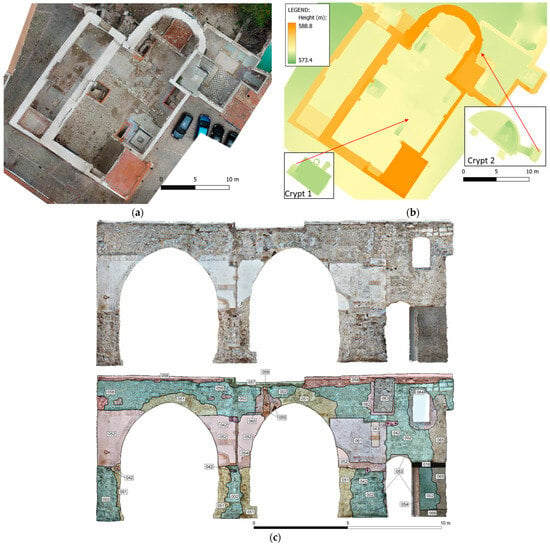
Figure 9.
Orthoimages; (a) general orthoimage; (b) DEMs; and (c) orthoimage of the wall that divided the main and the west naves (top) and stratigraphic study (below).
In this study, we used the products described previously to develop a BIM project for the church. Figure 10 shows some views of this result, such as general views (Figure 10a), the chapel modelled using the point cloud (Figure 10b), the inclusion of the stratigraphic study (Figure 10c), and the simulation of the integration of the façade into the church (Figure 10d).
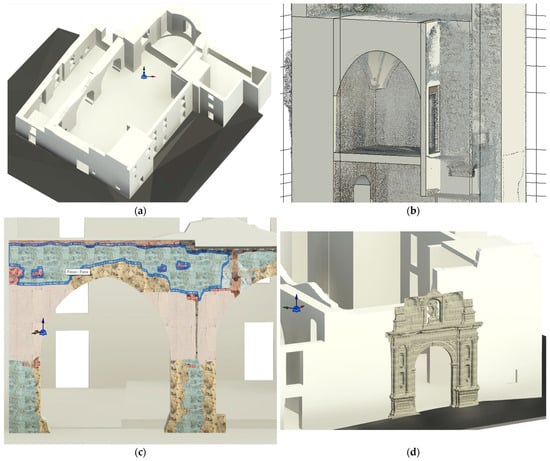
Figure 10.
Views of the BIM project developed in this study: (a) general view; (b) chapel modelled using the point cloud; (c) wall including the stratigraphic study; (d) and integration of the façade.
4. Discussion
This study has covered the application of several geomatic techniques for obtaining a set of products developed to achieve certain purposes. Therefore, the discussion of its results should consider an analysis of both aspects, the application of geomatic techniques and the products.
4.1. Application of Geomatic Techniques
The combined use of various techniques (TLS and photogrammetry) and sensors (TLS, UAV, CRP, and SP) has shown great efficiency by exploiting their individual advantages, considering the project requirements and the complexity of the scene. This has meant obtaining a great improvement in efficiency and quality with respect to the separate use of each one. The use of TLS to define most of the geometry, regardless of texture, has shown a great improvement due to two causes; first, the reduction in acquisition time (without image acquisition), and second, avoiding the need to use classical surveying techniques (e.g., total station) to define GCPs. Both aspects have allowed for a great improvement in efficiency, both in the field and in the office. In this sense, the use of MMSs has shown promise in terms of data acquisition. However, we have detected that the capture technique (closed rings trajectory) is fundamental to achieving satisfactory results. This needs to be used by trained operators who know how to acquire the scene, facilitating the orientation of the system, especially in scenes with narrow access. Lighting conditions are another important aspect in cases of using visual-SLAM systems. Despite its great efficiency in data acquisition, in this study, the use of MMS data has been reduced due to the presence of noise in point clouds, which was incompatible to the project requirements, in contrast to the geometric quality given by TLS. However, its use may be interesting in cases where the existence of this noise is acceptable for obtaining models that require less accuracy, as may be the case of preliminary studies, BIMs, etc.
The use of photogrammetry has been fundamental to support the point cloud data obtained by TLS. In this sense, the TLS point cloud has been completed with points obtained from photogrammetry in locations uncovered by TLS. Our experience has shown that the use of UAV and CRP allows us to obtain these points with sufficient accuracy to be added to the TLS point cloud in this type of study. The possibility of using platforms such as UAVs and masts allows images to be obtained from elevated points of view, avoiding the presence of occlusions and facilitating the image orientation procedure between various spaces. The use of SP involves an important improvement in efficiency in both capture and processing. Acquiring 360-degree images facilitates the procedure of taking photographs that cover the entire scene with multiple stations. Considering photogrammetric processing, the inclusion of constrains in the form of scale bars (between all fisheyes of the 360-degree camera) facilitates the orientation procedure and minimizes the use of GCPs. However, in interior areas, we must consider the need for a reliable lightning system to obtain a certain radiometric quality, and even more so in cases of using this technique for texturing, as was the case in this study. To summarize, photogrammetric techniques have shown great performance for texturing and obtaining geometric products such as 3D models, orthoimages, DEMs, etc.
Considering georeferencing, the use of TLS to measure the coordinates of the GCPs, which are used for the photogrammetric orientation procedure (UAVs and CRP), allows for the distribution of a greater number of GCPs with respect to the case of using total stations because field work is removed. We recommend this procedure in these cases due to the great reduction in acquisition time despite a small loss in positional accuracy, which we consider acceptable in this type of study.
In summary, the fusion of several techniques and sensors in a study of this magnitude has been shown as essential to achieving the initially defined objectives. The quality of data (geometric and radiometric) has been guaranteed, despite the use of several techniques, with an important improvement in efficiency made by taking advantage of the possibilities of each technique. In this sense, this improvement is justified with the reduction in GCPs, avoiding their measurement using classical surveying techniques (e.g., total station), the reduction in TLS acquisition time (without capturing images), the use of UAVs and MMSs for surveys of complex and inaccessible areas, and the reduction in acquisition time by using a 360-degree camera, etc.
4.2. Products
The use of several techniques has allowed us to obtain a large number of products with which to document the church. The final 3D model obtained in this study has shown great quality (both geometric and radiometric) in accordance with the project requirements, despite the complexity of the scene. This product allows for defining a complete representation of the state of the church after the recovery works and prior to the restoration works. We highlight the completeness of this product thanks to the possibility of including GCPs, even in narrow spaces, by using TLS to measure target coordinates. The 3D model provides a 3D visualization of the church and allows users to request geometric values and measures (e.g., distances, areas, and volumes), allowing for a complete analysis of all structures. We also can obtain other products, such as sections, which can be used for subsequent restoration works. Other products, such as orthoimages, have focused on analyzing the constructive processes, serving as a basis for developing stratigraphic studies of all the walls. In this sense, the orthoimages have facilitated these tasks by reducing the field time and providing a metric product to add to the overall documentation. The textured 3D model should also be used for this purpose.
The virtual repositioning of the façade has made it possible to visualize its original position in the church in 3D. Apart from virtual visualization (e.g., augmented reality applications), this virtual repositioning should facilitate the possible reconstruction of the façade in its original position.
The BIM project allows us to manage the implemented elements of the building considering all the products (the 3D model, the stratigraphic analysis, and the façade) and adding different attributes of interest. This allows us to develop several analyses and perform simulations for future restorations.
5. Conclusions
This study has shown the methodology and the main results obtained after the application of different geomatic techniques to the recovered church of S. Miguel. The complexity of the scene justified the application of different techniques, using several sensors based on TLS, MMSs, and photogrammetry. The application of these techniques has demonstrated the benefits of data fusion using different sensors, taking advantage of their potential. In this sense, the use of TLS to define most of the geometry of the church, supported by UAVs and CRP in uncovered areas, has allowed us to obtain an accurate point cloud, even in the most complex scenes (e.g., crypts, chapels, etc.). Obtaining GCPs from the TLS point cloud improves the definition of these elements by increasing their number and distribution, avoiding the use of total stations and considerably reducing field work. Furthermore, the use of photogrammetry to texture the 3D model based on UAVs, CRP, and SP has allowed us to obtain a high-quality product, even in interior areas with poor illumination conditions. The use of SP reduces both acquisition and processing work, thanks to its great coverage (360 degrees) and the possibility of including constraints, minimizing the use of GCPs. UAVs and CRP have demonstrated their feasibility in determining orthoimages of great quality and resolution of the main walls.
The methodology proposed in this study has also developed a procedure for repositioning elements in their original locations. This method, based on the extraction of fitted geometries common to both 3D models, involves the repetition of part of the photogrammetric process, using masks to define the part of the images to be considered in each case. The application in this case has allowed us to perform a virtual repositioning of the original façade, located in a museum, in the 3D model of the church. Despite the different conditions of these scenes (church and museum), the reposition has achieved a great level of quality both geometrically and radiometrically, although we understand that the latter aspect could be improved. In this sense, a future study will consider an improvement of the radiometric aspect of the repositions, taking into account different environmental conditions.
The products obtained in this study have shown great importance in documenting the recovery carried out in this church. Therefore, the main objective of the study has been successfully achieved. The 3D model allows its use for documenting the state of the church, including complex areas, and for other uses, such as virtual representations, simulations, augmented reality, digital twins, etc. The other metric products obtained, such as orthoimages, have facilitated the obtaining of a stratigraphic study of the main walls of the church, allowing for the analysis of the constructive processes carried out throughout the history of the building. The use of orthoimages for this purpose has also reduced the amount field work. The development of a BIM based on the point cloud and the stratigraphic study has proved to be of great importance, both for documentation purposes and for the management of future restoration works.
Future work will focus on improvements in data integration between sensors and efficiency, with the use of real-time devices, such as MMSs, UAVs, etc.
Author Contributions
Conceptualization, all authors; methodology, A.T.M.-C., J.L.P.-G., J.M.G.-L. and D.V.-G.; software, A.T.M.-C., J.L.P.-G., J.M.G.-L. and D.V.-G.; validation, A.T.M.-C., J.L.P.-G., J.M.G.-L. and D.V.-G.; formal analysis, A.T.M.-C., J.L.P.-G., J.M.G.-L. and D.V.-G.; investigation, A.T.M.-C., J.L.P.-G., J.M.G.-L. and D.V.-G.; resources, A.T.M.-C., J.L.P.-G., J.M.G.-L. and D.V.-G.; data curation, A.T.M.-C., J.L.P.-G., J.M.G.-L. and D.V.-G.; writing—original draft preparation, A.T.M.-C.; writing—review and editing, all authors.; visualization, all authors; supervision, all authors; project administration, J.L.P.-G.; funding acquisition, all authors. All authors have read and agreed to the published version of the manuscript.
Funding
This research received no external funding.
Data Availability Statement
The data are contained within this article.
Acknowledgments
The authors would like to express their gratitude for the support of the Jaén City Council and the Provincial Museum of Jaén.
Conflicts of Interest
The authors declare no conflicts of interest.
References
- Kadobayashi, R.; Kochi, N.; Otani, H.; Furukawa, R. Comparison and evaluation of laser scanning and photogrammetry and their combined use for digital recording of cultural heritage. Int. Arch. Photogramm. Remote Sens. Spat. Inf. Sci. 2004, 35, 401–406. [Google Scholar]
- Guarnieri, A.; Remondino, F.; Vettore, A. Digital photogrammetry and TLS data fusion applied to Cultural Heritage 3D modeling. Int. Arch. Photogramm. Remote Sens. Spat. Inf. Sci. 2006, 36 Pt 5, 1–6. [Google Scholar]
- Grussenmeyer, P.; Landes, T.; Voegtle, T.; Ringle, K. Comparison methods of terrestrial laser scanning, photogrammetry and tacheometry data for recording of cultural heritage buildings. Int. Arch. Photogramm. Remote Sens. Spat. Inf. Sci. 2008, XXXVII/B5, 213–218. [Google Scholar]
- Alshawabkeh, Y.; Baik, A.; Miky, Y. Integration of Laser Scanner and Photogrammetry for Heritage BIM Enhancement. ISPRS Int. J. Geo-Inf. 2021, 10, 316. [Google Scholar] [CrossRef]
- Mozas-Calvache, A.T.; Gómez-López, J.M.; Pérez-García, J.L. Multitemporal and Multiscale Applications of Geomatic Techniques to Medium-Sized Archaeological Sites—Case Study of Marroquíes Bajos (Jaén, Spain). Remote Sens. 2023, 15, 1416. [Google Scholar] [CrossRef]
- Pérez-García, J.L.; Mozas-Calvache, A.T.; Gómez-López, J.M.; Vico-García, D. Multiscale 3D Documentation of the Medieval Wall of Jaén (Spain) Based on Multi-Sensor Data Fusion. Heritage 2023, 6, 5952–5966. [Google Scholar] [CrossRef]
- Pérez-García, J.L.; Gómez-López, J.M.; Mozas-Calvache, A.T.; Delgado-García, J. Analysis of the Photogrammetric Use of 360-Degree Cameras in Complex Heritage-Related Scenes: Case of the Necropolis of Qubbet el-Hawa (Aswan Egypt). Sensors 2024, 24, 2268. [Google Scholar] [CrossRef]
- Perfetti, L.; Polari, C.; Fassi, F. Fisheye Photogrammetry: Tests and Methodologies for the Survey of Narrow Spaces. Int. Arch. Photogramm. Remote Sens. Spat. Inf. Sci. 2017, XLII-2/W3, 573–580. [Google Scholar] [CrossRef]
- Bruno, N.; Perfetti, L.; Fassi, F.; Roncella, R. Photogrammetric survey of narrow spaces in cultural heritage: Comparison of two multi-camera approaches. Int. Arch. Photogramm. Remote Sens. Spat. Inf. Sci. 2012, XLVIII-2/W4-2024, 87–94. [Google Scholar] [CrossRef]
- Mozas-Calvache, A.T.; Pérez-García, J.L.; Cardernal-Escarcena, F.J.; Delgado, J.; Mata de Castro, E. Comparison of Low Altitude Photogrammetric Methods for Obtaining Dems and Orthoimages of Archaeological Sites. Int. Arch. Photogramm. Remote Sens. Spat. Inf. Sci. 2012, XXXIX-B5, 577–581. [Google Scholar] [CrossRef]
- Martínez, S.; Ortiz, J.; Gil, M.L.; Rego, M.T. Recording complex structures using close range photogrammetry: The cathedral of Santiago de Compostela. Photogramm. Rec. 2013, 28, 375–395. [Google Scholar] [CrossRef]
- Fiorillo, F.; Limongiello, M.; Fernández-Palacios, B.J. Testing GoPro for 3D model reconstruction in narrow spaces. Acta IMEKO 2016, 5, 64–70. [Google Scholar] [CrossRef]
- Mozas-Calvache, A.T.; Pérez-García, J.L.; Gómez-López, J.M.; Martínez de Dios, J.L.; Jiménez-Serrano, A. 3D models of the QH31, QH32 and QH33 tombs in Qubbet el Hawa (Aswan, Egypt). Int. Arch. Photogramm. Remote Sens. Spat. Inf. Sci. 2020, XLIII-B2-2020, 1427–1434. [Google Scholar] [CrossRef]
- Lichti, D.D.; Tredoux, W.; Maalek, R.; Helmholz, P.; Radovanovic, R. Modelling extreme wide-angle lens cameras. Photogramm. Rec. 2021, 36, 360–380. [Google Scholar] [CrossRef]
- Boulianne, M.; Nolette, C.; Agnard, J.P.; Brindamour, M. Hemispherical photographs used for mapping confined spaces. Photogramm. Eng. Remote Sens. 1997, 63, 1103–1108. [Google Scholar]
- Kedzierski, M.; Waczykowski, P. Fisheye lens camera system application to cultural heritage data acquisition. In Proceedings of the XXI International Cipa Symposium, Athens, Greece, 1–6 October 2007. [Google Scholar]
- Kedzierski, M.; Fryskowska, A. Application of digital camera with fisheye lens in close range photogrammetry. In Proceedings of the ASPRS 2009 Annual Conference, Baltimore, MD, USA, 9–13 March 2009. [Google Scholar]
- Georgantas, A.; Brédif, M.; Pierrot-Desseilligny, M. An accuracy assessment of automated photogrammetric techniques for 3D modelling of complex interiors. Int. Arch. Photogramm. Remote Sens. Spat. Inf. Sci. 2012, XXXIX-B3, 23–28. [Google Scholar] [CrossRef]
- Covas, J.; Ferreira, V.; Mateus, L. 3D reconstruction with fisheye images strategies to survey complex heritage buildings. In Proceedings of the Digital Heritage 2015, Granada, Spain, 28 September–2 October 2015. [Google Scholar]
- Mandelli, A.; Fassi, F.; Perfetti, L.; Polari, C. Testing different survey techniques to model architectonic narrow spaces. Int. Arch. Photogramm. Remote Sens. Spat. Inf. Sci. 2017, XLII-2/W5, 505–511. [Google Scholar] [CrossRef]
- Perfetti, L.; Polari, C.; Fassi, F. Fisheye Multi-Camera System Calibration for Surveying Narrow and Complex Architectures. Int. Arch. Photogramm. Remote Sens. Spat. Inf. Sci. 2018, XLII-2, 877–883. [Google Scholar] [CrossRef]
- Alessandri, L.; Baiocchi, V.; Del Pizzo, S.; Rolfo, M.F.; Troisi, S. Photogrammetric survey with fisheye lens for the characterization of the la Sassa cave. Int. Arch. Photogramm. Remote Sens. Spat. Inf. Sci. 2019, XLII-2/W9, 25–32. [Google Scholar] [CrossRef]
- León-Vega, H.A.; Rodríguez-Laitón, M.I. Fisheye Lens Image Capture Analysis for Indoor 3d Reconstruction and Evaluation. Int. Arch. Photogramm. Remote Sens. Spat. Inf. Sci. 2019, XLII-2/W17, 179–186. [Google Scholar] [CrossRef]
- Perfetti, L.; Fassi, F.; Rossi, C. Fisheye Photogrammetry to Generate Low–Cost DTMs. Int. Arch. Photogramm. Remote Sens. Spat. Inf. Sci. 2019, XLII-2/W17, 257–263. [Google Scholar] [CrossRef]
- Pérez Ramos, A.; Robleda Prieto, G. Only image based for the 3D metric survey of gothic structures by using frame cameras and panoramic cameras. Int. Arch. Photogramm. Remote Sens. Spat. Inf. Sci. 2016, XLI-B5, 363–370. [Google Scholar] [CrossRef]
- Kossieris, S.; Kourounioti, O.; Agrafiotis, P.; Georgopoulos, A. Developing a low-cost system for 3D data acquisition. Int. Arch. Photogramm. Remote Sens. Spat. Inf. Sci. 2017, XLII-2/W8, 119–126. [Google Scholar] [CrossRef]
- Barazzetti, L.; Previtali, M.; Roncoroni, F. 3D Modelling with the Samsung Gear 360. Int. Arch. Photogramm. Remote Sens. Spat. Inf. Sci. 2017, XLII-2-W3, 85–90. [Google Scholar] [CrossRef]
- Barazzetti, L.; Previtali, M.; Roncoroni, F. Can we use low-cost 360 degree cameras to create accurate 3D models? Int. Arch. Photogramm. Remote Sens. Spat. Inf. Sci. 2018, XLII-2, 69–75. [Google Scholar] [CrossRef]
- Fangi, G.; Pierdicca, R.; Sturari, M.; Malinverni, E.S. Improving spherical photogrammetry using 360° omni-cameras: Use cases and new applications. Int. Arch. Photogramm. Remote Sens. Spat. Inf. Sci. 2018, XLII-2, 331–337. [Google Scholar] [CrossRef]
- Barazzetti, L.; Previtali, M.; Roncoroni, F.; Valente, R. Connecting inside and outside through 360° imagery for close-range photogrammetry. Int. Arch. Photogramm. Remote Sens. Spat. Inf. Sci. 2019, XLII-2/W9, 87–92. [Google Scholar] [CrossRef]
- Cantatore, E.; Lasorella, M.; Fatiguso, F. Virtual reality to support technical knowledge in cultural heritage. The case study of cryptoporticus in the archaeological site of Egnatia (Italy). Int. Arch. Photogramm. Remote Sens. Spat. Inf. Sci. 2020, XLIV-M-1-2020, 465–472. [Google Scholar] [CrossRef]
- Bertellini, B.; Gottardi, C.; Vernier, P. 3D survey techniques for the conservation and the enhancement of a Venetian historical architecture. Appl. Geomat. 2019, 12, 53–68. [Google Scholar] [CrossRef]
- Fangi, G. The multi-image spherical panoramas as a tool for architectural survey. In Proceedings of the 21st CIPA Symposi-um, Athens, Greece, 1–6 October 2007. [Google Scholar]
- Rodríguez-Gonzálvez, P.; Jiménez Fernández-Palacios, B.; Muñoz-Nieto, Á.L.; Arias-Sanchez, P.; Gonzalez-Aguilera, D. Mobile LiDAR System: New Possibilities for the Documentation and Dissemination of Large Cultural Heritage Sites. Remote Sens. 2017, 9, 189. [Google Scholar] [CrossRef]
- Sammartano, G.; Spanò, A. Point clouds by SLAM-based mobile mapping systems: Accuracy and geometric content validation in multisensor survey and stand-alone acquisition. Appl. Geomat. 2018, 10, 317–339. [Google Scholar] [CrossRef]
- Di Stefano, F.; Chiappini, S.; Gorreja, A.; Balestra, M.; Pierdicca, R. Mobile 3D scan LiDAR: A literature review. Geomat. Nat. Hazards Risk 2021, 12, 2387–2429. [Google Scholar] [CrossRef]
- Di Stefano, F.; Torresani, A.; Farella, E.M.; Pierdicca, R.; Menna, F.; Remondino, F. 3D Surveying of Underground Built Heritage: Opportunities and Challenges of Mobile Technologies. Sustainability 2021, 13, 13289. [Google Scholar] [CrossRef]
- Elhashash, M.; Albanwan, H.; Qin, R. A Review of Mobile Mapping Systems: From Sensors to Applications. Sensors 2022, 22, 4262. [Google Scholar] [CrossRef] [PubMed]
- Campi, M.; Falcone, M.; Sabbatini, S. Towards continuous monitoring of architecture. Terrestrial laser scanning and mobile mapping system for the diagnostic phases of the cultural heritage. Int. Arch. Photogramm. Remote Sens. Spat. Inf. Sci. 2022, XLVI-2/W1-2022, 121–127. [Google Scholar] [CrossRef]
- Tanduo, B.; Teppati Losè, L.; Chiabrando, F. Documentation of complex environments in cultural heritage sites. A SLAM-based survey in the Castello del Valentino basement. Int. Arch. Photogramm. Remote Sens. Spat. Inf. Sci. 2023, XLVIII-1/W, 489–496. [Google Scholar] [CrossRef]
- Torresani, A.; Menna, F.; Battisti, R.; Remondino, F. A V-SLAM Guided and Portable System for Photogrammetric Applications. Remote Sens. 2021, 13, 2351. [Google Scholar] [CrossRef]
- Bonfanti, C.; Patrucco, G.; Perri, S.; Sammartano, G.; Spanò, A. A New Indoor LiDAR-Based MMS Challenging Complex Architectural Environments. Int. Arch. Photogramm. Remote Sens. Spat. Inf. Sci. 2021, XLVI-M-1–2, 79–86. [Google Scholar]
- Ortiz, J.; Gil, M.L.; Martínez, S.; Rego, T.; Meijide, G. Three-dimensional Modelling of Archaeological Sites Using Close-range Automatic Correlation Photogrammetry and Low-altitude Imagery. Archaeol. Prospect. 2013, 20, 205–217. [Google Scholar] [CrossRef]
- Blockley, P.; Morandi, S. The recording of two late Roman towers, Archaeological Museum, Milan 3D documentation and study using image-based modelling. In Proceedings of the Digital Heritage 2015, Granada, Spain, 28 September 2015. [Google Scholar]
- Pérez-García, J.L.; Mozas-Calvache, A.T.; Gómez-López, J.M.; Jiménez-Serrano, A. Three-dimensional modelling of large archaeological sites using images obtained from masts. Application to Qubbet el-Hawa site (Aswan, Egypt). Archaeol. Prospect. 2018, 26, 121–135. [Google Scholar] [CrossRef]
- Pérez-García, J.L.; Mozas-Calvache, A.T.; Barba-Colmenero, V.; Jiménez-Serrano, A. Photogrammetric studies of inaccessible sites in archaeology: Case study of burial chambers in Qubbet el-Hawa (Aswan, Egypt). J. Archaeol. Sci. 2019, 102, 1–10. [Google Scholar]
- Colomina, I.; Molina, P. Unmanned aerial systems for photogrammetry and remote sensing: A review. ISPRS J. Photogramm. Remote Sens. 2014, 92, 79–97. [Google Scholar] [CrossRef]
- Nex, F.; Remondino, F. UAV for 3D mapping applications: A review. Appl. Geomat. 2014, 6, 1–15. [Google Scholar] [CrossRef]
- Campana, S. Drones in Archaeology. State-of-the-art and Future Perspectives. Archaeol. Prospect. 2017, 24, 275–296. [Google Scholar] [CrossRef]
- Pepe, M.; Alfio, V.S.; Costantino, D. UAV Platforms and the SfM-MVS Approach in the 3D Surveys and Modelling: A Review in the Cultural Heritage Field. Appl. Sci. 2022, 12, 12886. [Google Scholar] [CrossRef]
- Ullman, S. The interpretation of structure from motion. Proc. Royal Soc. B 1979, 203, 405–426. [Google Scholar]
- Koenderink, J.J.; Van Doorn, A.J. Affine structure from motion. J. Opt. Soc. Am. A 1991, 8, 377–385. [Google Scholar] [CrossRef]
- Lowe, D.G. Distinctive image features from scale-invariant keypoints. Int. J. Comput. Vis. 2004, 60, 91–110. [Google Scholar] [CrossRef]
- Szeliski, R. Computer Vision: Algorithms and Applications; Springer: London, UK, 2011. [Google Scholar]
- Scharstein, D.; Szeliski, R. A taxonomy and evaluation of dense two-frame stereo correspondence algorithms. Int. J. Comput. Vis. 2002, 47, 7–42. [Google Scholar] [CrossRef]
- Seitz, S.M.; Curless, B.; Diebel, J.; Scharstein, D.; Szeliski, R. A comparison and evaluation of multi-view stereo reconstruction algorithms. In Proceedings of the IEEE Computer Society Conference on Computer Vision and Pattern Recognition, New York, NY, USA, 17 June 2006. [Google Scholar]
- Furukawa, Y.; Hernández, C. Multi-view stereo: A tutorial. Found. Trends Comput. Graph. Vis. 2015, 9, 1–148. [Google Scholar] [CrossRef]
- Pietroni, E.; Ferdani, D. Virtual Restoration and Virtual Reconstruction in Cultural Heritage: Terminology, Methodologies, Visual Representation Techniques and Cognitive Models. Information 2021, 12, 167. [Google Scholar] [CrossRef]
- Ergin, İ.D.A. Digital Approach in Conservation of Heritage: 3D Virtual Reconstruction Applications in Ancient Cities. J. Archit. Sci. Appl. 2023, 8, 969–987. [Google Scholar]
- Liu, J.; Azhar, S.; Willkens, D.; Li, B. Static Terrestrial Laser Scanning (TLS) for Heritage Building Information Modeling (HBIM): A Systematic Review. Virtual Worlds 2023, 2, 90–114. [Google Scholar] [CrossRef]
- Talon, A.; Cauvin, C.; Chateauneuf, A. State of the Art of HBIM to Develop the HBIM of the Heritage Care Project. Int. J. 3-D Inf. Model. 2017, 6, 33–43. [Google Scholar]
- Scianna, A.; Gaglio, G.F.; Grima, R.; La Guardia, M. The virtualization of CH for historical reconstruction: The AR fruition of the fountain of St. George square in Valletta (Malta). Int. Arch. Photogramm. Remote Sens. Spat. Inf. Sci. 2020, XLIV-4/W1-2020, 143–149. [Google Scholar] [CrossRef]
- Agnello, F.; Cannella, M. Ruined Archeological Heritage. Survey, 3D Modeling, Virtual Anastylosis. Int. J. Herit. Digit. Era 2013, 2, 419–432. [Google Scholar] [CrossRef]
- Abualdenien, J.; Borrmann, A. Levels of detail, development, definition, and information need: A critical literature review. J. Inf. Technol. Constr. 2022, 27, 363–392. [Google Scholar] [CrossRef]
- Mozas-Calvache, A.T.; Pérez-García, J.L.; Gómez-López, J.M. Geometrical study of Middle Kingdom funerary complexes in Qubbet el-Hawa (Aswan, Egypt) based on 3D models. Virtual Archaeol. Rev. 2022, 14, 1–18. [Google Scholar] [CrossRef]


Disclaimer/Publisher’s Note: The statements, opinions and data contained in all publications are solely those of the individual author(s) and contributor(s) and not of MDPI and/or the editor(s). MDPI and/or the editor(s) disclaim responsibility for any injury to people or property resulting from any ideas, methods, instructions or products referred to in the content. |
© 2024 by the authors. Licensee MDPI, Basel, Switzerland. This article is an open access article distributed under the terms and conditions of the Creative Commons Attribution (CC BY) license (https://creativecommons.org/licenses/by/4.0/).