Article

UAV, GNSS, Total Station, and Data Management Applied to an Ancient Clay Structure as a Historic Building Information Modeling Proposal: A Case Study of Huaca Arco Iris (Trujillo, Peru)

by
Carlos Antonio Espinoza Brugman
,
Frank Kevin Neri Caipo
and
Alexandre Almeida Del Savio
*
Carrera de Ingeniería Civil, Facultad de Ingeniería, Universidad de Lima, Av. Javier Prado Este 4600, Santiago de Surco 15023, Peru
*
Author to whom correspondence should be addressed.
Heritage 2024, 7(9), 4962-4979; https://doi.org/10.3390/heritage7090234
Submission received: 17 July 2024 / Revised: 5 September 2024 / Accepted: 5 September 2024 / Published: 9 September 2024

Abstract

:
In light of current risks and environmental impacts, HBIM (historic building information modeling) offers a highly efficient and interactive method for managing historical data and representing the current states of ancient clay structures. In this study, traditional geodetic techniques were employed to digitally locate a structure without compromising its topographic information to create an accurate model. Tools such as total stations, GNSS receivers, and UAVs were utilized to generate detailed topography of the study site and its surroundings. An ontology-based data management structure was also developed to store historical data and site intervention projects, adhering to the ISO 12006-2 standard. This was achieved through automated scripts in Dynamo softwarev.2.18.1. A comparison between the point cloud (279 images) and total station data (600 points) revealed a georeferencing accuracy difference of +/−0.003 m. Consequently, the developed methods can effectively represent similar structures digitally. The proposed ontological structure facilitates automated storage of internal and external information.

1. Introduction

Human cultural heritage has been studied over time to identify and comprehend its intrinsic value for humanity [1]. It has two fundamental well-marked parts: tangible and intangible cultural heritage; one represents materials, sites, and invaluable art forms, and the other is the living culture that spreads among people [2,3]. Safeguarding tangible and intangible cultural heritage allows the preservation and protection of invaluable cultural heritage for the benefit of all of humanity [4].
According to Poulios [5], conservation aims to preserve heritage, which is seen as belonging to the past, from harmful present human practices and transmit it to future generations. Heritage structures and architecture are constantly more exposed than in previous years. They can be exposed to two different types of risk: human and non-human risks. Human activities like stealing from cultural sites; direct interaction with human fluids such as sweat; car smog; contamination from cities and urban areas; constant unidentified entrances to heritage sites; and even man-made disasters put these buildings at risk. Wars and neglect often cause irreparable damage to architecture [6].
In line with this, the disorderly unplanned increase in the population, geometrical constraints, high temperatures, wind tunnel effects, and poorly designed high-rise buildings lead to population growth where people are not allowed to build and live due to historical sites that must be preserved [7]. Other non-human risks can include the salinization of structures and abrasion from water and airflow. Moreover, climate change is an additional potential threat, as it exacerbates expected decay rates and contributes to the appearance of new decay phenomena [8,9]. These continuous environmental effects accumulate; thus, preserving cultural heritage is becoming harder. Diverse organizations from each country try their best to delay the effects of the natural laws of deterioration on tangible items to guarantee the transmission of their significant heritage messages and values to future generations [5].
Revitalizing monuments and architectural entities by finding new ways to use them is legitimate and recommended if external or internal methods do not lead to disorder in the structure or character of the whole entity [10]. Specifically, for tangible heritage like monuments and sites, scientists develop new technologies and techniques to prevent damage and preserve sites and structures, in addition to restoration processes to bring decayed items as close as possible to their former conditions [11].
Thus, HBIM (historic building information modeling) has the challenge of representing the complex forms of historic architecture within a standardized parametric environment [12,13]. According to Quattrini et al. [14], historical building modeling characterization involves various degrees of geometric advancement, corresponding to different deviation levels between an actual object and its three-dimensional portrayal. Three-dimensional models generated based on the BIM methodology can be created at different levels of detail (LOD) and information (LOI). The LOI requires the appropriate development of an ontological structure guided by the heritage it intends to preserve and manage, combined with a 3D model that enables collaboration between disciplines and tools [15].
The present study proposes the utilization of spatial photogrammetry facilitated by the operation of unmanned aerial vehicles (UAVs) alongside the deployment of total stations and GNSS geodetic receivers (these sophisticated instruments are employed to georeference the structure under investigation), thereby enabling the creation of a digital representation encompassing the structure itself, the surface it occupies, and its surrounding urban environment. The primary objective of this model is to offer an innovative approach compared to previously utilized data collection methods while also serving as an integral tool for managing a structure, including past and future interactions and interventions and planning the development of its surroundings and modifications necessary for better preservation.
Considering the effects of the current risks and the environment as well as the proposed benefits of HBIM (explained in Section 2 through a review of different case studies related to HBIM) and the inherent benefits of the conservation of heritage, HBIM would be excellent for the development of an efficient and interactive way to manage the Huaca Arco Iris. As explained by Colosi et al. [16], Chan Chan’s Huaca is protected by UNESCO. The authors presented the importance of this Huaca and how HBIM is a functional tool and methodology for the preservation of heritage. They presented the different methods used in a 2016 survey. At the same time, they discussed the limits of its ontology and the difficulties presented by data collection when there are limited sources for integration. Proposing a 3D GIS would also add a new level of complexity and value to the HBIM model, with the aim of connecting all the city’s historic sites.
Hence, this paper proposes that for the Huaca Arco Iris, the methods presented as topographic surveys and cloud points can be completely viable for examining an HBIM model and that an accurate case ontology can be developed to create and manage data about the Huaca. Section 3 presents the surveying and data collection methods used for the 3D model and explains the “in-site” work and post-processing. For the ontology, it presents aspects and characteristics of the Huaca as a heritage structure. At the same time, it presents a workflow for unifying both presentation steps. Section 4 presents the results of a UAV/GNSS and total station survey of the structure and its ontology. Section 5 discusses the benefits and limitations of the survey methods and said ontology for the data collected in the HBIM context. Section 6 proceeds with the evaluation’s conclusions and recommendations.

2. Background Research and Study Site

The application of photogrammetry techniques in the context of historic building information modeling (HBIM) is detailed to review HBIM’s different uses as a conservation, research, management, and resource tool based on the building information modeling (BIM) methodology. These studies delve into the intricacies of achieving varying levels of detail in a model structured within the HBIM framework, shedding light on the complexities and nuances involved. Furthermore, comprehensive insights into a particular case study are expanded upon, offering a detailed examination of the conservation efforts undertaken for an architectural structure under scrutiny.

2.1. BIM and HBIM

Building information modeling (BIM) has been widely utilized in engineering and construction, with a primary focus on enhancing project efficiency and collaboration [17]. However, there has been a notable shift in perspective towards exploring new applications of BIM in various other domains. As shown by Diara and Rinaudo [18], BIM facilitates accessibility of data, documentation, BIM platforms for interaction (common data environments), and 3D visualization, as also mentioned by Bustamante et al. Generating a BIM model reduces the difficulty in managing its construction and the variability of operational risks [19]. Historic building information modeling (HBIM) is specifically used to preserve and manage cultural and historical structures. HBIM provides valuable insights into the maintenance of heritage sites and offers innovative solutions for their long-term enhancement [20]. The versatility of HBIM is presented via 3D visualization of objects and structures. It can be used for smaller objects such as vases and paintings, recreating and integrating data in a more detailed state [21]. It can also be used for massive structures such as walls, houses, chapels, and cathedrals, with less dense point cloud data. A 3D HBIM object section primarily consists of mapping BIM objects in a dense point cloud and configuring a model as a digital data archive [21,22,23]. Data integration is a vital part of HBIM, and by using the BIM framework, HBIM includes a digital archive concept of a larger magnitude. It is a more systematic and comprehensive system for parametric objects that ensures integrative and interactive experiences for users and researchers [20].

2.2. LOD and LOI in HBIM

HBIM encompasses the aspects of detail and information that BIM provides. The graphic attributes specify the level of detail (LOD), and the level of information (LOI) is determined based on the use and study.
In the case of punctual structures, it can be determined with the tools used to gather information [21]. Otherwise, small objects for reconstruction can be obtained from the reliability of a model’s surface in specific areas. Derivation from surfaces in models is carried out via point clouds [24]. Other classifications include an HBIM introduced to a larger area, considered a CityGML. The scale can determine the LOD and reliability of real objects represented in an environment, such as houses and parks, and how they are represented. At the same time, the data introduced to a model contribute to the LOI, referring to all data that do not have a visual parameter, such as older studies, soil data, and material data. This level is updated, realistic, complete, and organized as an ontology, leading to coherence between the necessary data and the model [21].

2.3. Ontology and Data Organization

As mentioned in Section 2.1, a 3D HBIM model can present an accurate visual and virtual representation of a heritage structure [25]. However, the model, as a management tool, requires information, and according to Chamochumbi et al. [26], managing all the information produced becomes very important for every project’s life cycle and the stakeholders since it allows the parties to manage the resources and achieve the client’s requirements effectively. This is seen in the LOI aspect of the model. The ontology oversees the order of the data inserted into the model and how they operate with one another.
In [27], the authors explained that the term ontology and its proposed structure can be the factors that give HBIM an actual use. It can present classifications, definitions, characteristics, developments, etc. Analyzing concepts and incorporating definitions allow an HBIM model to transcend the modeling phase and manage stored information. As explained, the ontology represents the order and presentation of the data introduced to an HBIM model, leading to comprehensive development with all relevant data needed for any interaction with a historic structure [25].

2.4. HBIM in Conservation and Management of Historic Sites

This specialized version of BIM, HBIM, considers the unique construction techniques of the past while incorporating the current structural conditions of the case study it presents [28,29].
Moreover, HBIM is a multifaceted tool that caters to historic sites’ conservation, management, and information dissemination needs. It facilitates the integration of traditional conservation practices with modern technology, thereby ensuring sustainable development of these invaluable assets. HBIM gives a model the data and accessibility to be appropriately managed as a historical structure [30,31].

2.5. Limitations and Strengths of HBIM

Despite the numerous advantages of HBIM, it is essential to acknowledge the limitations associated with its implementation. These limitations may include challenges related to data accuracy, interoperability issues, and the need for specialized training and complex tailor-made databases and software [32]. On the other hand, the advantages of utilizing HBIM are vast, ranging from improved decision-making processes to enhanced stakeholder engagement.
As research continues to explore novel technologies and methodologies, such as sensing technologies, the potential for further advancements in HBIM remains promising. By addressing its current limitations and capitalizing on its strengths, HBIM can revolutionize how historic structures are preserved, managed, and utilized for future generations [33]. It represents a crucial step towards sustainable conservation of our cultural heritage, paving the way for a more informed and responsible approach to heritage management [34].
HBIM is a conservation tool, a management tool, and an information resource, and ongoing studies are investigating new technologies and methods, such as sensing [35].

2.6. Data Collection with HBIM

HBIM, as its name suggests, is based on a 3D model that requires previous data collection for development, as it is based on BIM, which requires the use of parametric objects [36]. These data can come from spherical photogrammetry, a terrestrial laser scanner, a drone flight, a total station, etc. [37,38], and they should be chosen depending on the level of detail the model requires. At the same time, satellite images can be used to create a georeferenced point cloud. Using GIS programs like ArcGIS or QGIS, this cloud can be transformed into a shape file, while adding a DTM (digital terrain model) and low-polygon parametric objects such as city structures can turn it into a CityGML [39,40]. In agreement with HBIM, this CityGML can ultimately be introduced to the HBIM platform for better comprehension of its state [41].
At the same time, HBIM requires the use of a structure. As in BIM, it is based on the use of family types, shapes, parameters, etc. The objective of HBIM is to maintain the history and culture of a structure while creating a structure for integrating data related to the structure, including reports, intrinsic structural data (material, resistance, soil type, etc.), old interventions, photographs, old documents, etc. This structure should be centralized in an easy and accessible way.

2.7. Study Site

Chan Chan has been considered a culturally important place for many years, so the state authorities and the Ministry of Culture designated an area for the main site within this archaeological complex and buffer zone.
For this study site, the Huaca “Arco Iris” was selected as the structure of interest because it is near urban development and the city of Trujillo. It features numerous carvings on its exposed walls and a ramp that can be seen directly from the entrance and reaches a height of around 10 m. It has been affected by various factors, such as coastal winds, salinization, and erosion from rain.
This Huaca is found within this complex. The Huaca is located 3.5 km from the Pan-American Highway in the Moche Valley, close to the northern coast of Peru. Its coordinates are 8°04′35.30 S and 79°02′56.00 W. Internally, it covers an area of 3245 m2, with a perimeter length of approximately 228 m. An aerial photo is presented in Figure 1; it shows the location of the Huaca in an urban context.
The first platform is compact and forms the core of the building, with a floor area of 777 m2 and a height of 4.50 m. The second platform, built on top of the first, is also compact. It has an area of 366 m2 and a height of 3 m. It includes fourteen aligned rooms or inaccessible cubicles, measuring 3 by 2 m, surrounding the first platform: five to the southwest, four to the southeast, and five to the northeast [42]. Access to the top of the first platform is via a central ramp interrupted by a landing, while the second platform is reached by ascending the first section of the ramp, which then splits into a peripheral path.
It is important to note that as part of the city of Chan Chan, it is protected as part of the “Chan Chan Cultural Heritage of Humanity” by UNESCO and the “Ministerio de Cultura del Perú” due to its cultural importance locally and around the world [43].
Developing a CityGML and HBIM for the future of Chan Chan and all Huacas in Peru is the next step in ensuring the safety of the data stored at these cultural and historical sites [36]. Satellite images and data collected via topography methods like GNSS can be useful in obtaining a realistic representation of a structure and its surroundings [44].
At the same time, an updated CityGML with continuous new satellite images can be used to observe and react accordingly to the growing rate of urbanization and its impacts [45,46].
Moreover, a model in a CityGML of the study site, like any CityGML model, can be used for future planning and control of the city of Trujillo and the surrounding area, linking new projects in the IFC format to the CityGML after being transformed to accommodate a common coordinate reference system. As Chan Chan is a coastal city, the model can simulate and foresee possible damage to nearby structures and populations during natural disasters such as floods or tsunamis [47].

3. Materials and Methods

As an applicative and qualitative study, this research is considered a digital model of a past study [15]. It was carried out to improve modern survey methods and to determine how a different approach can improve the final state of the model and its surroundings. This article proposes that it is possible to obtain the data needed for a 3D model using survey methods to generate an HBIM model and preserve a structure.
This research followed the workflow presented in Figure 2. This section explains this workflow in detail, starting with the bibliography selection process, elaborating key points of interest for this research, and a review of past studies. Then, the workflow for the 3D model is explained, considering data management with the ontology, data processing as a point cloud, and digitalization into a 3D model. In this way, the HBIM model was finalized.

3.1. Study Collection

A search was conducted on academic research platforms such as Scopus and Google Scholar to determine which method is more accurate and reliable for structure representation using GIS methods. The following keywords were used: HBIM, GIS, photogrammetry, CityGML, satellites, and images. On the other hand, the following keywords were used for the data structure: ontology, Dynamo, and Omniclass. At the same time, the publication dates could not be older than 2010 to ensure that updated information and methods were obtained (the exact search terms for each search are presented in Figure 2). The results had to be related to specific parameters allowed in the software that would be used. Then, a second, deeper filter was applied to focus the research on the case study. This was intended to analyze research methods that had previously been applied to improve the results with modern technologies using a combination of data collection methods. The parameters used for the deeper filter in indexed articles that referred to HBIM and point cloud information were as follows: articles/conference papers were selected to limit the types of documents, and engineering/computer science was selected in the sub-journal area. A similar process was applied for documents related to Huaca Arco Iris: the search included Ministerio de Cultura del Perú (MINCUL), Dirección Desconcentrada de Cultura de La Libertad (DDCLL), Proyecto Especial Complejo Arqueológico Chan Chan (PECACH), and the website Plan Maestro de Chan Chan: HUACA “PECACH”.

3.2. Selection of Data Related to HBIM Investigations

3.2.1. Selection of Data Related to HBIM Investigations

After reviewing the literature, it was found that using high-resolution imagery and conducting intensive field surveys were crucial for achieving accurate results when creating HBIM models. For this reason, first, the use that would be given to the HBIM model was determined, as were the information collection methods and tools that would be used to process the digitalization of the geometry of the structure and its integration with the historical information. The selection of modern technologies and non-invasive methods and the need for georeferenced accuracy led to the choice of aerial photogrammetry using a UAV, the compound geometric leveling of a closed traverse method, and their respective tools due to in situ drawbacks such as cover above the internal structure, not being allowed to damage the structure, a perimeter surrounded by vegetation, the urban location, and the variability of the weather conditions during summer.

3.2.2. Aim of Use

According to Colosi et al. [16], digitalization of bas-reliefs and entry into a digital geometric structure model were presented. However, due to disorganized urban expansion, historical local climate conditions that damaged the structure, and the need to preserve the status of the study site and its historical data, the objective of the HBIM was to preserve the monument through georeferenced digitization of the monument, its surroundings, and information on projects that have been carried out to slow down the progressive deterioration of the monument.

3.2.3. Survey Methods for HBIM

GNSS, total station, and non-invasive control points before UAV photogrammetry
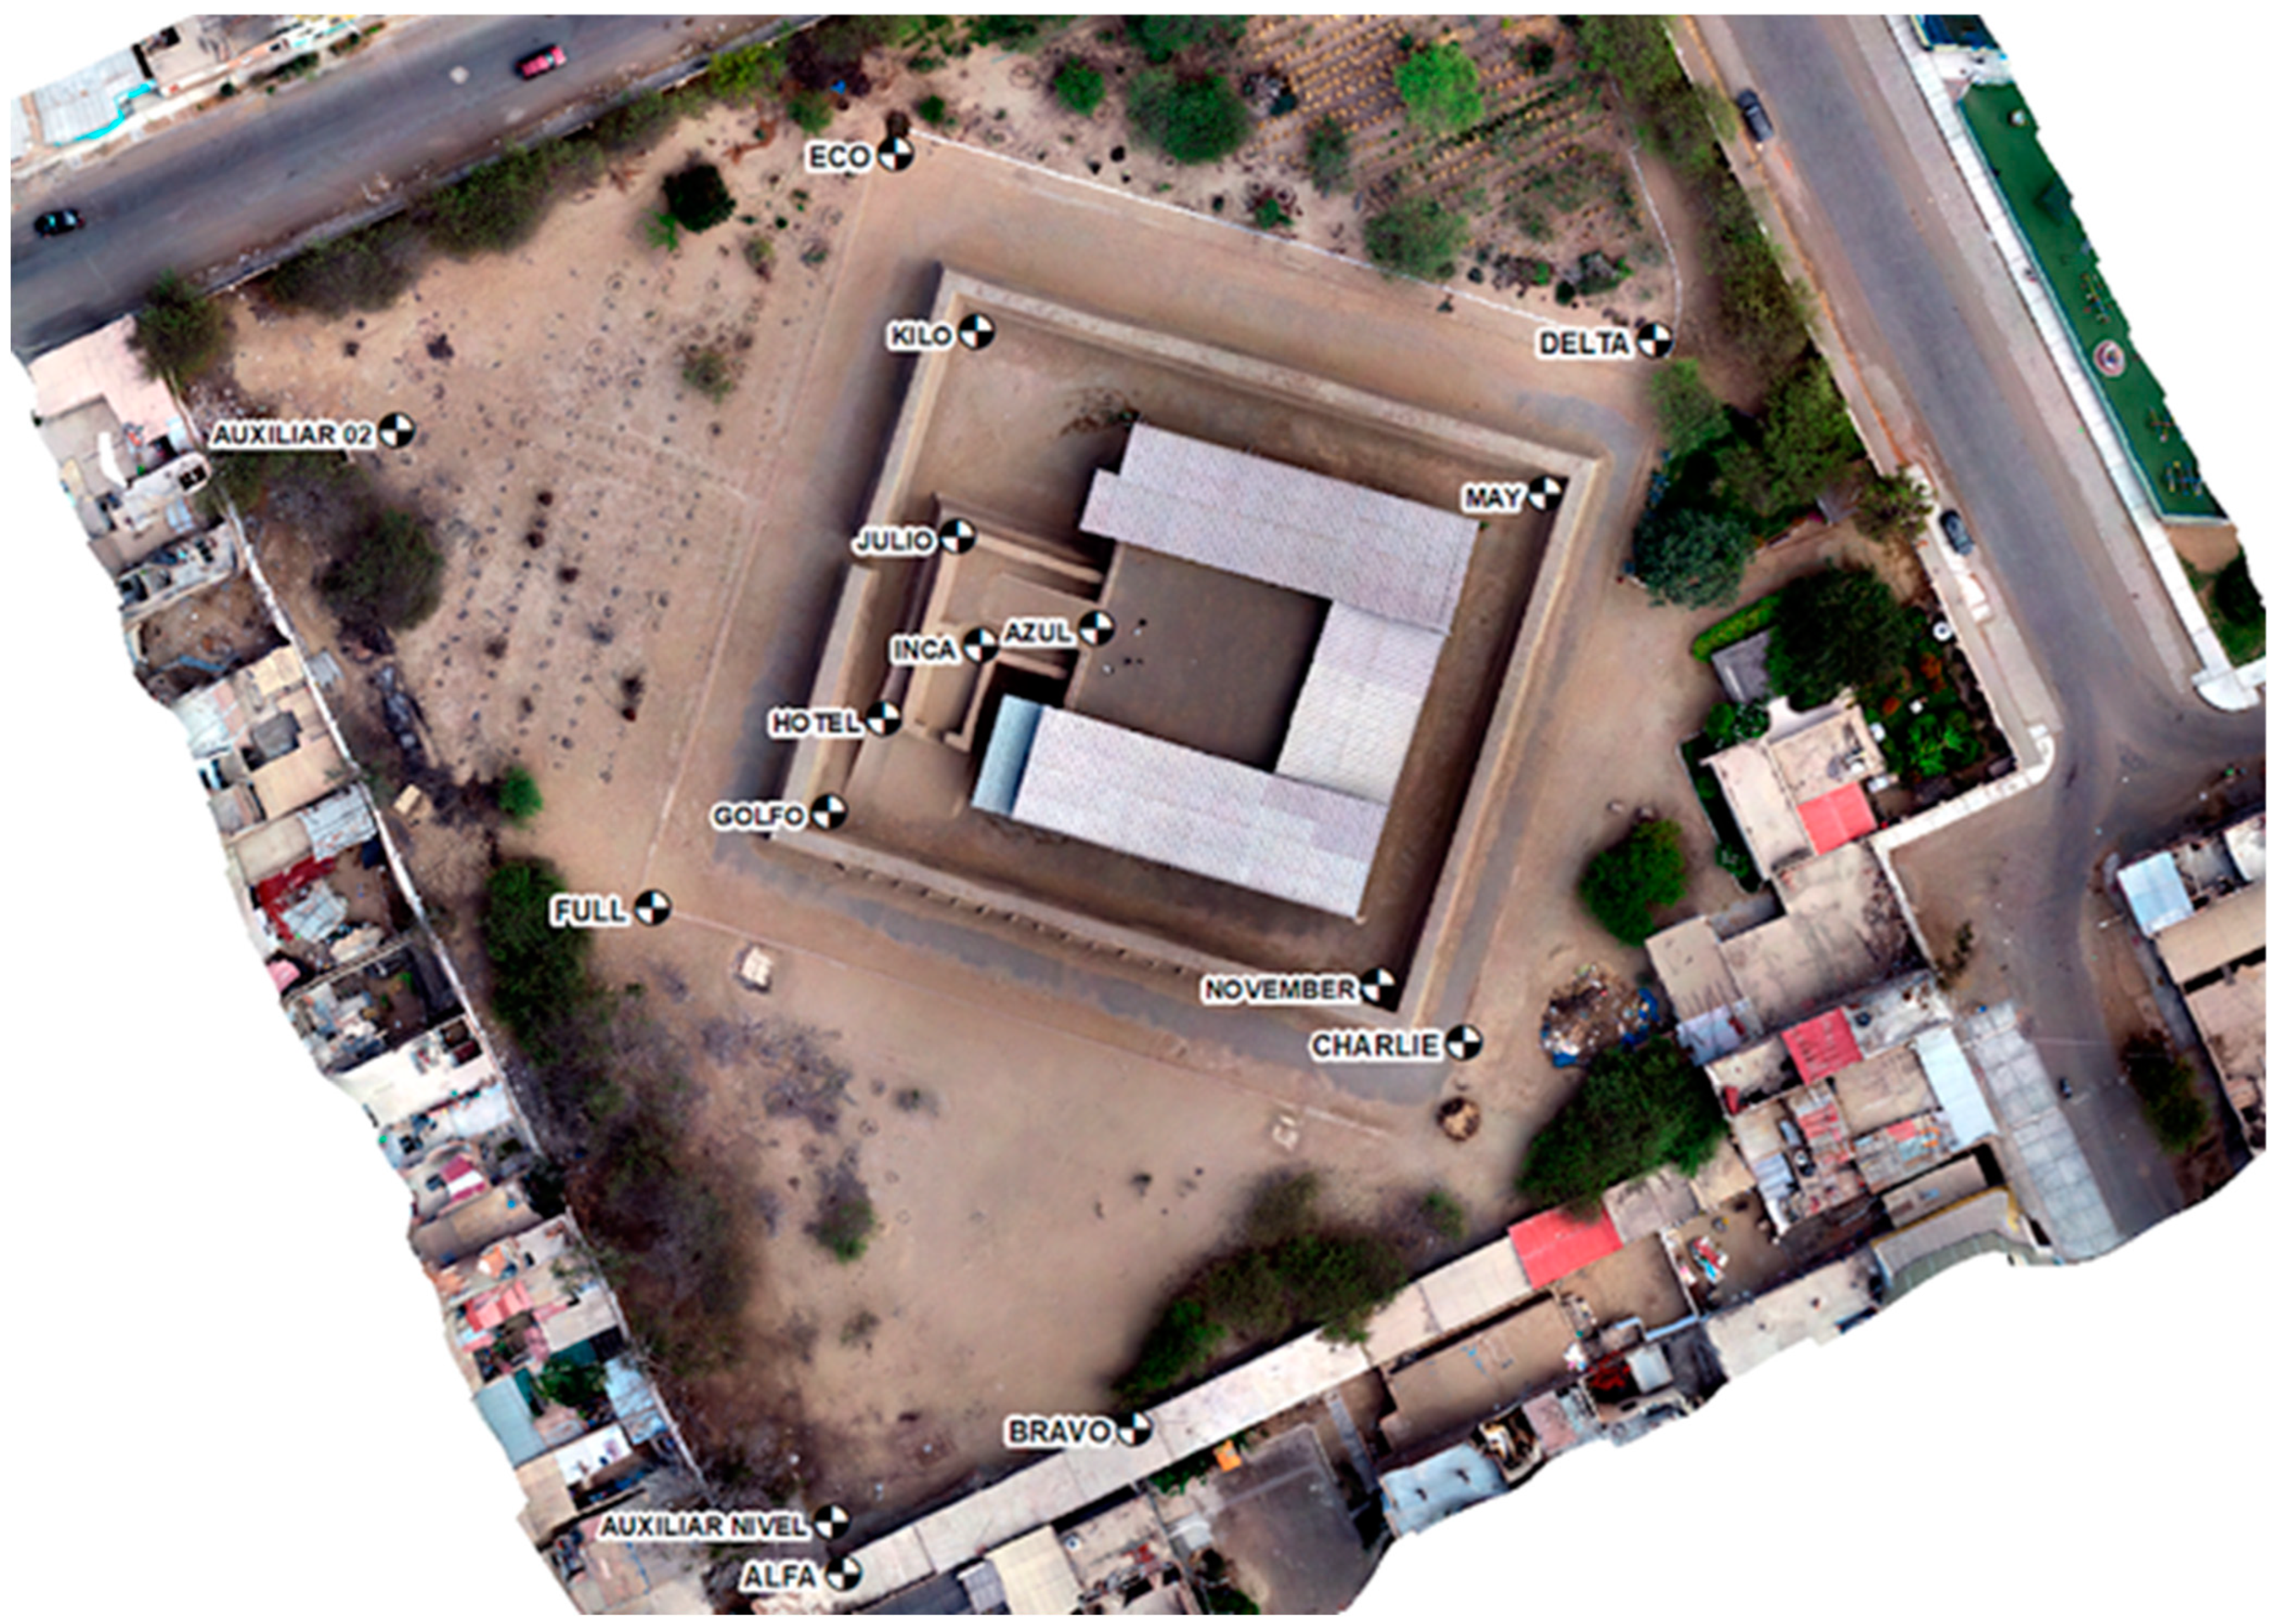
This section describes the method and tools used to obtain raw data to georeference the structure and its urban surroundings. The first step was to set up ground control points using square paintings and metal plates, which could be identified easily in the aerial photographs. It is important to remember that invasive methods that could damage the structure and its surroundings were not permitted. Six points were marked and distributed in such a way as to allow the majority of the structure to be captured. Two control points were marked on the warehouse roof, named Alfa and Bravo, and the next four points, named Charlie, Delta, Eco, and Full, were marked on the surface around the structure.
In Figure 3, an aerial photograph shows the placement of all control points. In total, four mutually visible geodetic points were established. The reading time for each point was at least two hours. Readings were recorded every second and post-processed with information from the National Geodetic Network, specifically information from the Permanent Tracking Station ERP La Libertad (National Code: LL02).
Point “ALFA” was 81.0379 m above sea level. Based on this elevation, the elevations at all other points were established. The method used to establish these elevations was compound geometric leveling of a closed traverse. The maximum allowable error for this work was +/−0.003 m (three millimeters). This margin of error was chosen because sandy ground generates a high level of error in geometric leveling works.
UAV Imaging
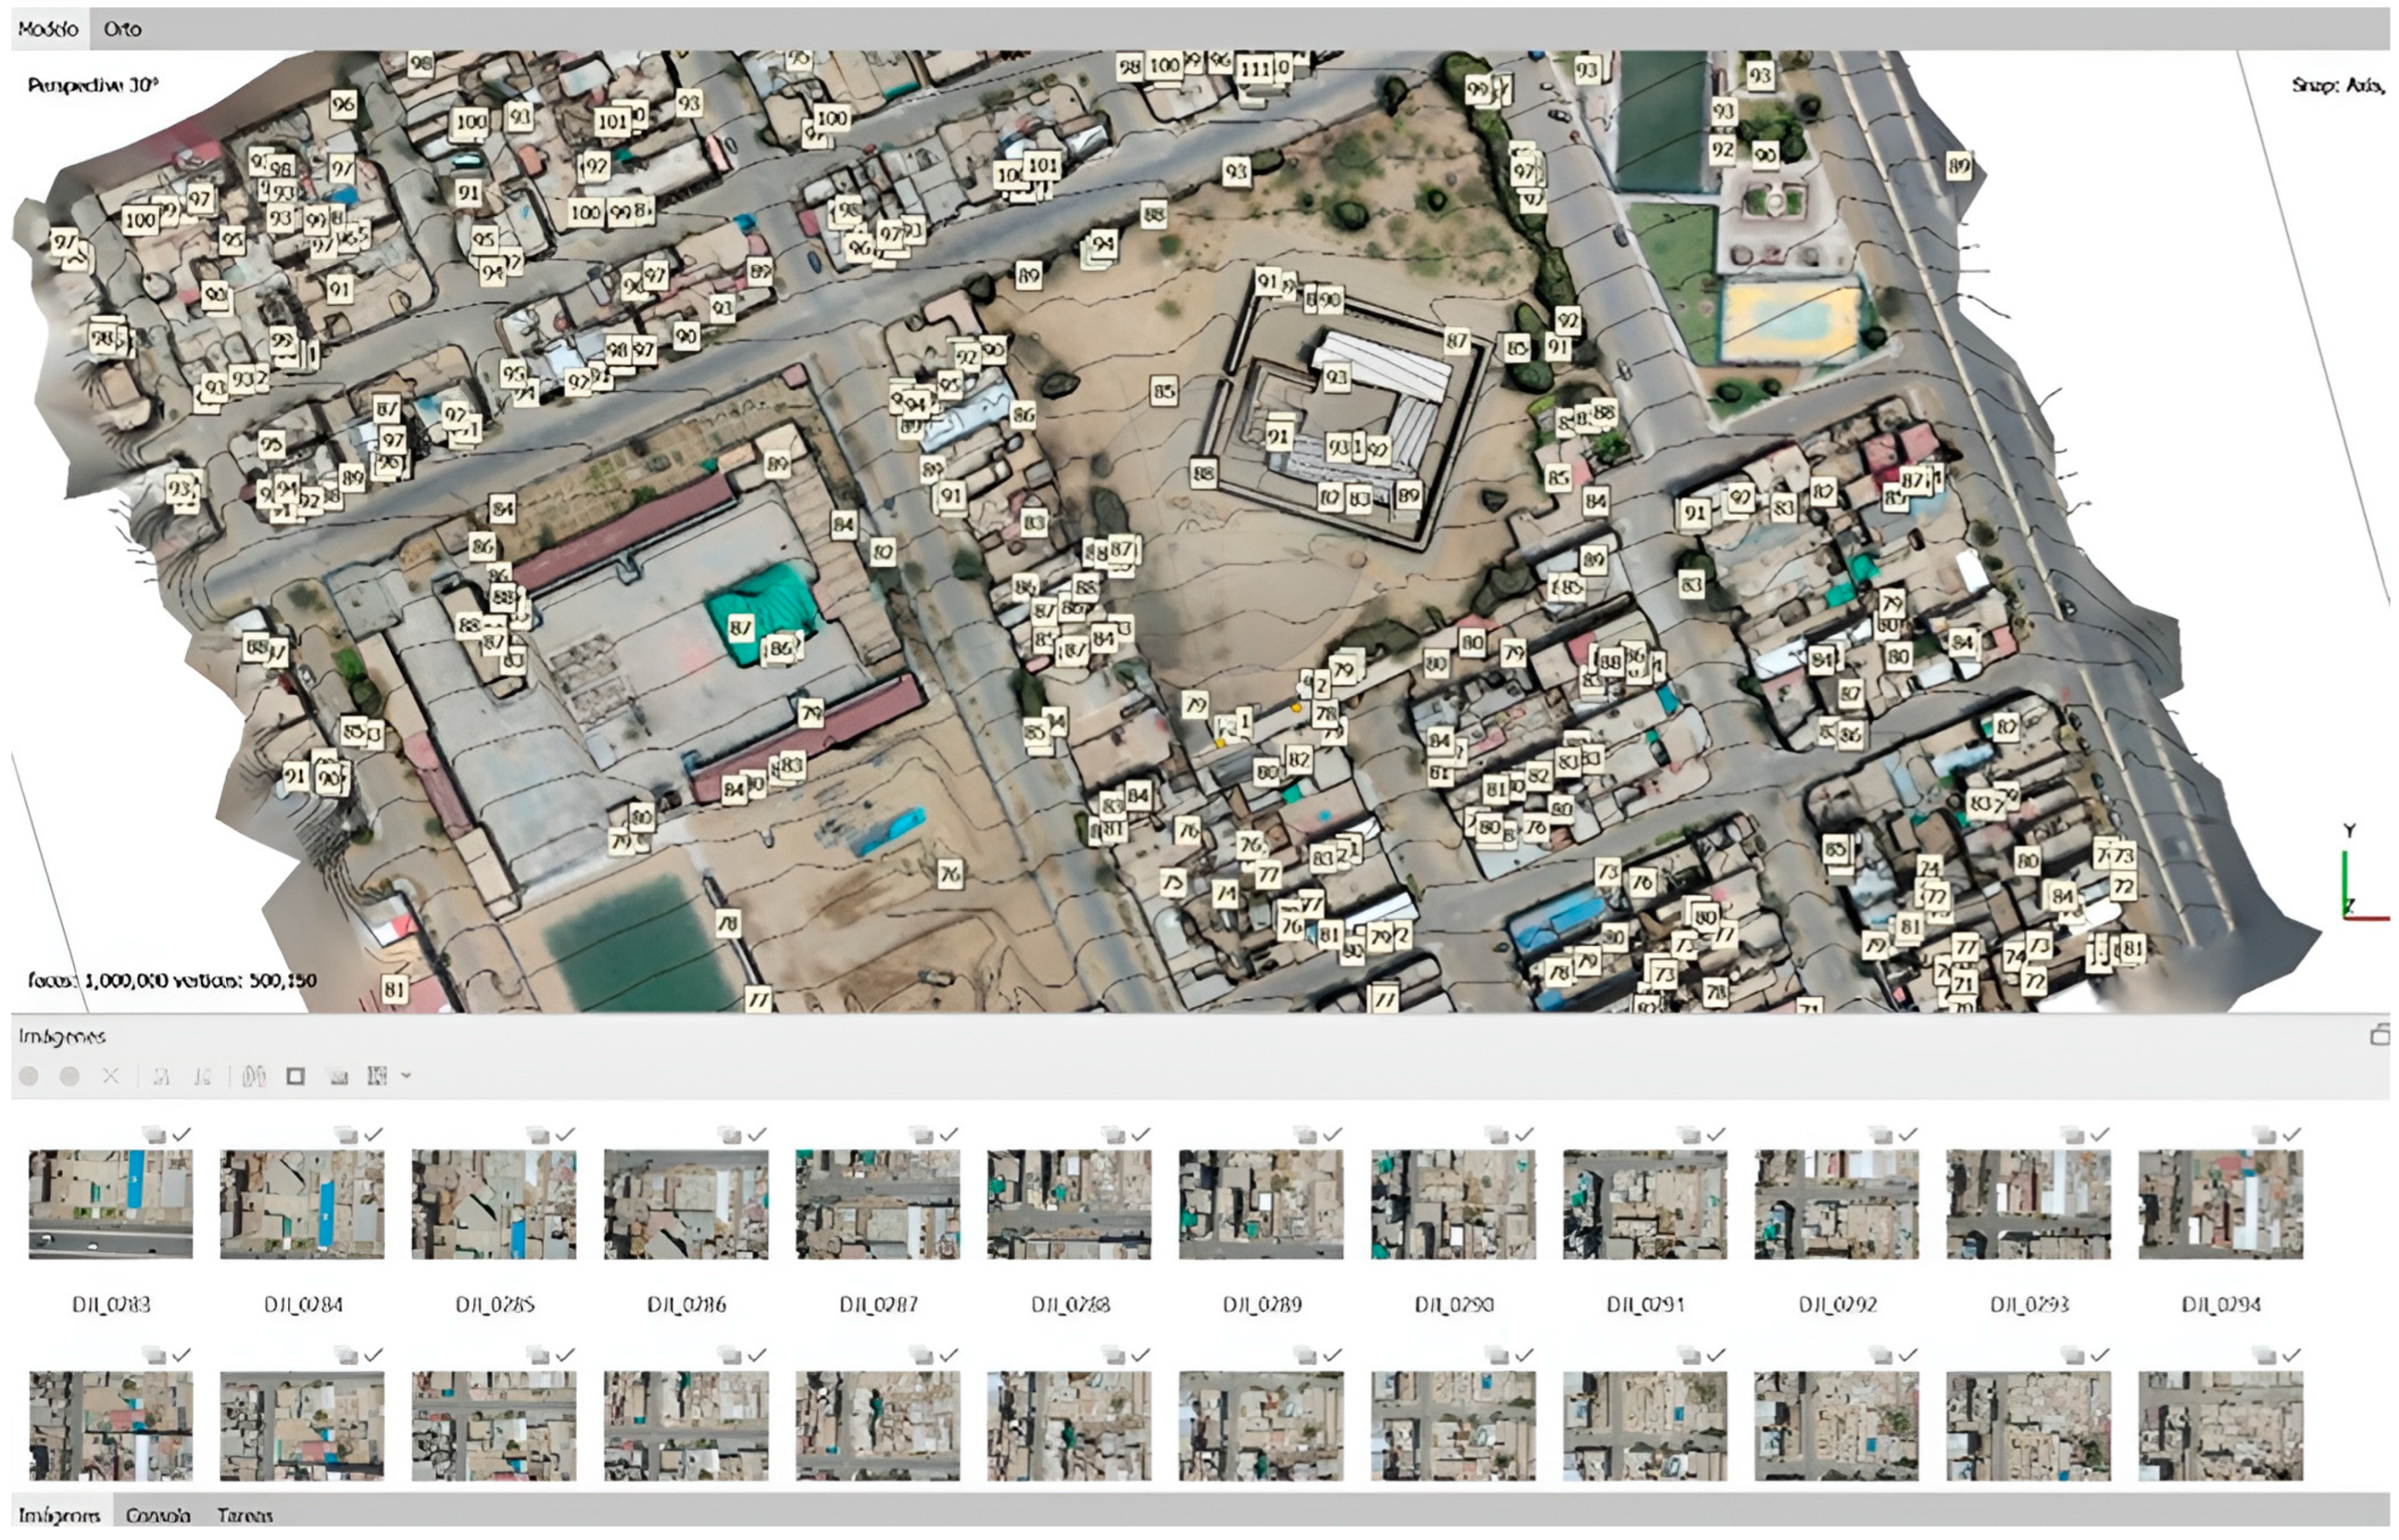
A DJI Phantom UAV with a Hasselblad camera (model L1D-20c) was used. During the flight, the camera settings were as follows: sensor, ISO-100; focal distance, 10 mm; maximum aperture, 2.971; compensation for exposure, 0; time of exposure, 1/320 s; point f/5; no flash; and no compensation for the signal-to-noise ratio (SNR). The autonomous flight lasted approximately 30 min. A portable GPS and control points georeferenced with Permanent Tracking Station ERP La Libertad obtained in the previous work were used during imaging. The UAV could measure points using a GNSS such as GPS or GLONASS. However, because the climate parameters precipitation, temperature, wind speed, and humidity were changing constantly due to the summer season, it could not produce a point cloud with significant precision. Therefore, according to the meteorological forecast from “Servicio Nacional de Meteorología e Hidrología del Perú–(SENAMHI)”, the planned flights were scheduled on the weekend. This plan is presented as part of building the HBIM model. A flight to take a photo of the Huaca Arco Iris structure and its surroundings (Figure 4) was planned for an early weekend morning. The lens was set up with an FOV of 85°.
The flight plan consisted of parallel flights with a northeast orientation. The first flight had a height of 80 m; this allowed us to obtain a detailed point cloud and a digital terrain elevation with less than 2 m of equidistance. Lesser equidistance in a DTM can provide a precise surface of contour lines. In the second flight plan, the UAV was set up to fly at a height of 20 m. According to the first plan, in this plan, the FOV of the camera remained at 85°. The flight plan also included capturing images of the surrounding urban context and the monument itself, providing a comprehensive overview of the area. Similar to the images presented previously, they could distinguish the surroundings.

3.2.4. Digitalization and Modeling with Data Integration

Processing images from two UAV flights
In this process, all images from the two flights were processed with the software Agisoft Metashape 2.1.2, a professional tool for photogrammetry. This software identified the photos and their parameters and corrected the distortion due to the distance between the drone and the surface where the image was taken. Further, this software could identify the georeferenced control points obtained by the GNSS, so it was possible to obtain digital elevation and digital terrain models. Both sets of images had less than 5 mm of error. As presented in Figure 5, there were some areas in different parts of the terrain and the structure itself that the drone could not capture; this problem was due to the trees surrounding the Huaca. There was a huge gap inside the perimeter walls of the primary enclosure because a bamboo structure covered and protected the internal storage. Therefore, detailed imaging of this storage could not be generated via drone photogrammetry because there was no terrestrial laser scanning (TLS). Still, generating an approximate georeferenced model with a total station was possible.
Creation of data structure for ontology
Next, the data structure for the ontology was created. This process was based on pre-defined and standardized Revit table content named Uniclass (The Unified Classification for the Construction Industry), also known as BS ISO 12006-2.
At the time of this research, the authors did not find a standard classification for information in HBIM models of clay structures in Peru. Therefore, we followed the structure classification set by Uniclass and presented by Del Savio et al. [41] and adapted it to the case study. Hence, there were three main structures at the study site: the external perimeter walls, the internal storage and main platform, and the two ramps.
The authors also propose specific parameters named shared parameters, which follow similar features between walls, ramps, and platforms. These features are also classified based on the following fields: material, structural state, superficial state, and projects involved. Figure 6 identifies the general parameters that were added to the Revit model.

4. Results

The 3D modeling was a product of two different surveys of the structure, both using GNSS-based points. The total station primarily focused on a back-to-front view and measurements, and the UAV collected the cloud point data. The surface created for the DTM and DSM and the proposed ontology structure were inserted as parameters in the 3D model, creating an HBIM model.

4.1. Three-Dimensional Modeling and Survey Results

4.1.1. GNSS Control Points

Below are the obtained control points and their locations on the ground presented in Table 1 and in Figure 7.

4.1.2. Data Survey via Total Station

The process continued with these control points as mentioned and presented in Figure 7, the base of this study, after selecting strategic points for the survey. The measurements of the walls on the outside of the structure each used eight points. The 600 points collected with the TS are presented in Figure 8 as a 3D model in .dwg format. The UTM coordinates of these points had a margin of error of +/−0.003 m. After processing, these points were divided based on the wall they were a part of for better order and understanding. From M.1 to M.5, these data were exported into Revit to integrate the ontology.

4.1.3. UAV Survey

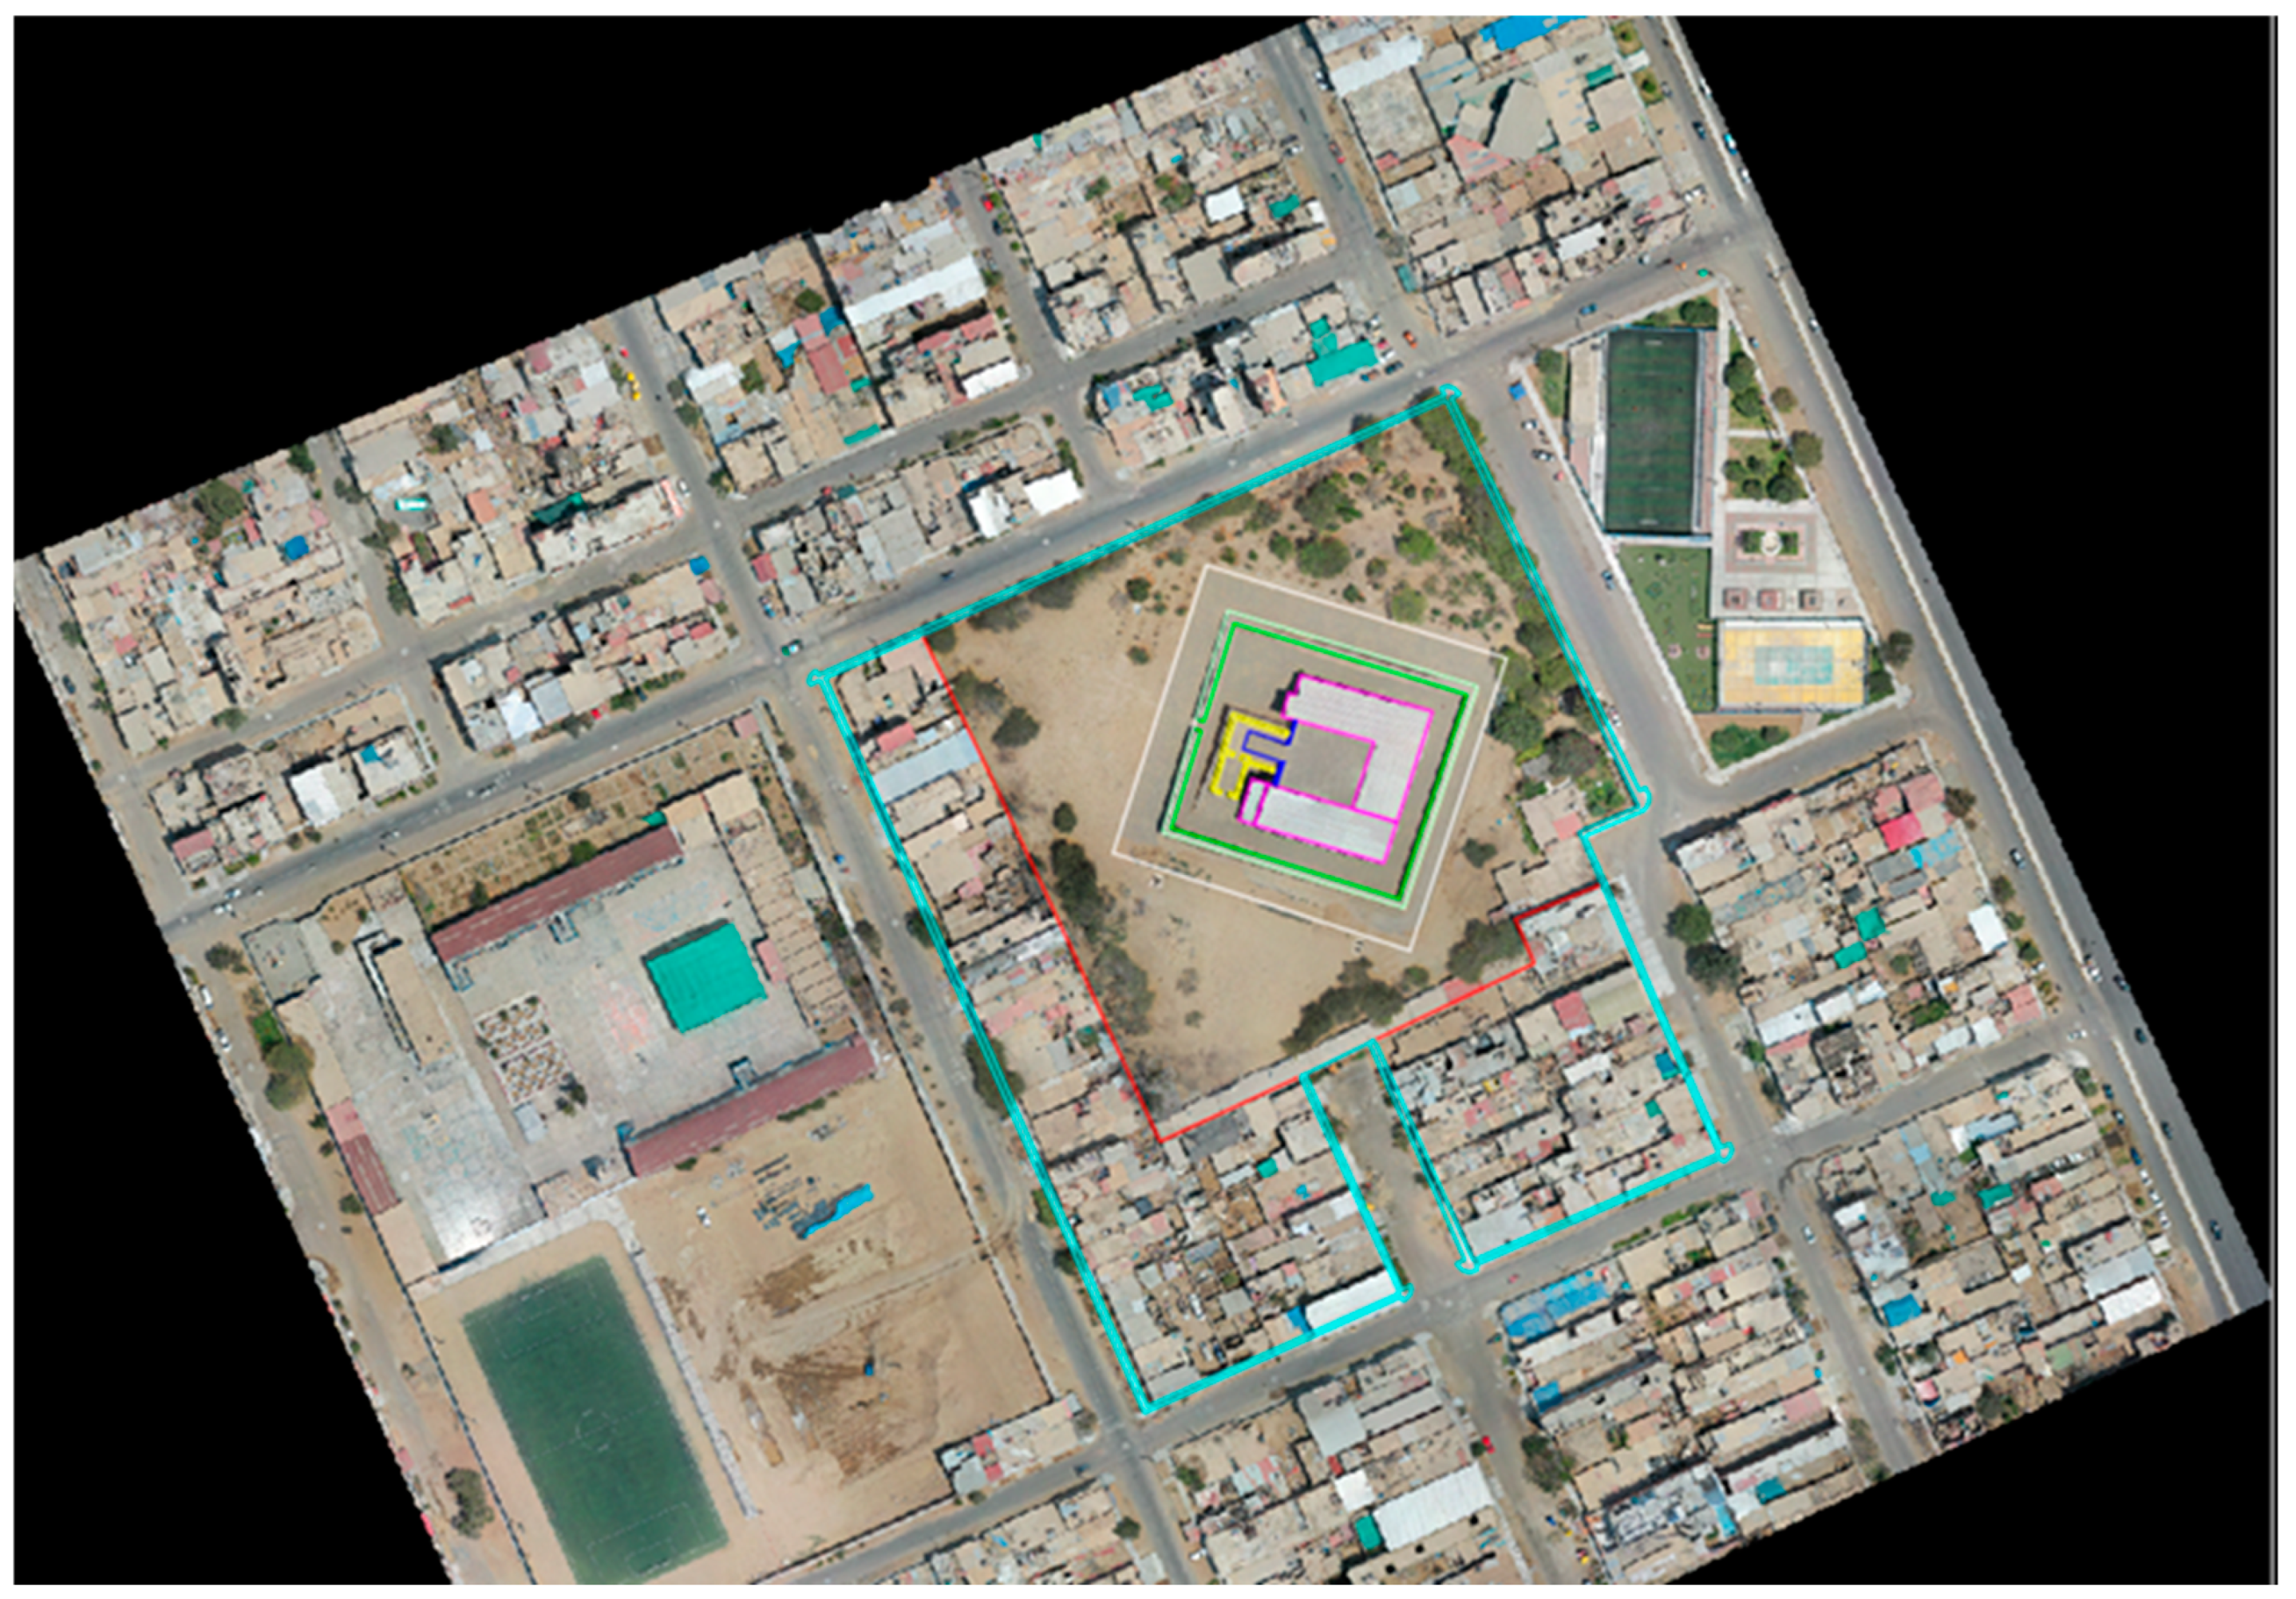
The second survey was carried out via a drone flight, the path of which is shown below (Figure 9). As presented in Section 3.2.2, the integrated camera in the UAV was capable of collecting the necessary data with the detail required for the cloud points.
While considering the base control points elaborated in the first survey via GNSS, the drone’s flight path went over the entire structure. The drone obtained an accurate representation of the exterior walls, taking two flights that generated 279 and 278 images, respectively. Accounting for the up-to-date weather forecast from “Servicio Nacional de Meteorología e Hidrología del Perú–(SENAMHI)”, the first flight was taken at a height of 80 m at an early hour for better clarity with an FOV of 85°. The second flight, while taken on the same date at the same hour with the same FOV, was taken at an altitude of 20 m. The terrain elevation gathered from this survey created contour lines with less than 2 m of equidistance.

4.2. Ontology and HBIM

4.2.1. Ontology Structure and Integration of Data in a 3D Model

The ontology structure elaborated for the shared and specific parameters classified the data as follows: material, structural state, superficial state, past interventions for shared parameters and bas-relief, dimensions, and orientations for specific wall parameters.
The data collected via the web and direct communication with the MINCUL were integrated into the HBIM model. These were primarily data that the researchers could not collect, such as intrusive or specialized samples and processing and previous activities.

4.2.2. Data Structure, Collection, and HBIM

The details of the ontology elaborated in Section 3.2.3 were obtained and inserted into the 3D Revit model via Dynamo, as shown in Figure 10.
The resulting ontology that was inserted into the model was created using a new set of object parameters. As observed within the methodology, the inserted parameters were classified as “text”, “number”, or “alphanumeric” and were selected based on their usage.
For the specific “External walls family”, the orientation, dimensions, and bas-relief were inserted. The “shared parameters” used in this model were “material”, “structural condition”, “superficial state”, and “additional projects and interventions”.
Starting with the orientation, for the external walls in this case study, following the traditional cardinal directions, four general directions were selected (east, west, northeast, and southwest), and they were inserted as text values.
On the other hand, the dimension parameters considered the average lengths of the four pertinent edges of each dimension as numeric values in meters, resulting in three numeric parameters per object.
The location parameter defined the average X (horizontal) and Y (vertical) position of the bas-relief on the wall surface with the reference point of the lower left axis as (0,0). It was considered a numeric value and was entered for each instance of bas-relief on the wall’s surface. In the case of the photographs, hyperlinks were created via alphanumeric entry. Finally, the state of conservation included a text-based entry for a superficial review of the status of the bas-relief and a hyperlink to an earlier study, intervention, or restoration effort.
For the shared parameters inserted into the model, the material was an adobe material extracted from the PECACH database, as the investigators could not directly extract a sample from the heritage building. For the grades of the parameter “Structural condition”, we observed the 3D data collection and the images. Based on the PECACH studies and data, we selected from three levels of impact (“Low”, “Medium”, and “High”), depending on the fractures and fissures that were visibly present.
Next, the superficial condition, which was primarily intended for low risk and, in some cases, damage caused by salinization or abrasion, was determined depending on its characterization and severity. The grades for this parameter were “Superficial”, “Moderate”, and “Immediate”.
Finally, for additional interventions, we curated and selected data collected from the Master Plan of Chan Chan and defined and inserted the codes of said work.

5. Discussion

5.1. Total Station, UAV, and GNSS during Survey

When the data exported from the TS, which are presented in Section 4.1.2, were integrated into the HBIM model, it was upgraded by the precision provided by the TS survey method. The integrated points indicate that a TS would be recommended near a bas-relief, as it would provide more accurate locations. While a TS is not suited for a massive survey with a large database of points, its ability to provide readjustments, georeferencing precision, and preferable data for cleaning up a point cloud provided by a UAV should be considered. At the same time, it is important to evaluate the more intensive time and resource expenses that come with the accuracy of this method.
As presented in Section 4.1.3, the second drone flight also provided additional information, a view of the structure’s surroundings, and point data of the surrounding structures. From these data, a DTM was formed, which included the nearby urban context, providing a more complete and comprehensive view of the structure’s status and position. It is important to note that with less equidistance, a DTM can obtain a precise surface of contour lines.

5.2. Ontology Development and Integration in a Cultural Heritage Setting

Referring directly to the elaborated ontology, as stated in Section 3.2.3, its objective was to be a data structure for the HBIM model. As such, the integration of parameters into the model via Revit was set as the tool provided. During the integration of the parameters, we integrated the specific parameters elaborated for this case study, such as the orientation of the wall, superficial state (which included the state of the whole wall and the states of specific bas-reliefs of cultural importance), materials, past interventions, and direct links to their archived data. The selected parameters supported the conservation efforts by specifying old interventions and directly presenting data of interest and direct hyperlinks to photographic records.

6. Conclusions

The conclusions break down the ideas of HBIM into two sections. The first section is primarily about surveying using a UAV and a total station, including the considerations and facilities each method can bring to an HBIM model. The second section emphasizes the ontology’s importance and the features given by the tools used when surveying a Huaca.

6.1. UAV and Total Station Surveys—LiDAR and Terrestrial Lasers as Considerations

Both survey methods prove useful for creating a model, but they have different limitations on their capabilities. Given the importance of a survey to a 3D model, alternatives might be of interest, like a UAV-LiDAR system.
Starting with the UAV survey, the structure type and state must be considered. The surface area limits what a UAV survey can realistically capture and process. Any structure blocking its line of sight needs to be worked around, or the model of the structure will not be completed. At the same time, other considerations for UAVs are the weather forecast and different environmental factors, such as wind, rain, extreme sun, or dim light. As explained by Pepe et al. [38], while a perfect time is not required, the quality of the point cloud can be affected. While UAVs can provide a greater level of detail, if continuous weather/shadow–sunlight interventions occur, quality will suffer. As commented by Del Savio et al. [48], LiDAR could be an alternative in cases of greater plant density or abrupt variations in light and shadow in a small area.
Additionally, UAV surveys benefit from ease of use, data collection, and detailed images. A UAV survey can provide hundreds of points in 30 min if the resources are available and the conditions are right. This provides far more data to process and refine. Another advantage of UAV surveys is their ability to efficiently collect data from the surrounding area and surface with minimal effort [49].
A TS survey gathers fewer points and requires more time investment for each view. For studying a surface, in comparison to a TS, a drone is much faster and more precise. In this study, it took approximately half a day to comprehend the area needed. Movement difficulties are an important factor during method selection.
Considering previous work and planning for points of view, control points, etc., is much more time-consuming. It also requires elaborating a GNSS control point to develop the topological survey, which can be integrated into the TS to facilitate the process. At the same time, terrestrial laser scanning via digital cameras is another method to corroborate and gather more points in areas that are difficult for a UAV, indicating that TS studies might be of less use.
A TS is inherently more precise for each point of a structure; depending on a model’s needs, this can be useful. To generate a wire-like structure and a preview of a model, a TS can facilitate precision for volume estimation. A TS can be preferentially used to evaluate a point cloud created using a UAV, to compare measurements, and to readjust and revise a UAV’s point cloud and final object/surface using the TS’s precision. The UAV, TS, and UAV-LiDAR methods must be georeferenced using a control point that accommodates the UAV for realistic precision.

6.2. Ontology and HBIM Model

Data management defines HBIM models and separates them from basic 3D models of any structure. The inserted data can help give an HBIM model meaning and use.
As explained in Section 4.2, only the shared and wall parameters were inserted. The segregation of the sections of the cultural structure facilitated the development of the model, the classification of information, and, most importantly, the order in which the data were integrated [36].
In this study, ontology-based modeling of cultural structures and the division of spatial complexes, such as the sections of the Huaca, created a more exploitable HBIM without reducing the complexity of architectural heritage. Similarly, Dynamo was a flexible and visual way to program and integrate the parameters into the 3D model.
In conclusion, UAVs and TSs each have unique capabilities that require careful planning to achieve optimal precision. While UAVs are more situational and less viable in enclosed spaces or adverse weather conditions, they excel in collecting large volumes of data for model generation. Both UAVs and TSs can be advantageous depending on the specific requirements of HBIM. Their combined use enhances a structure’s accuracy, as UAVs offer detailed data collection and TSs provide point cloud corrections, resulting in a more refined and accurate surface model.

Author Contributions

C.A.E.B.: conceptualization, methodology, software, validation, investigation, data curation, writing—original draft, and visualization. F.K.N.C.: conceptualization, methodology, software, validation, investigation, data curation, writing—original draft, and visualization. A.A.D.S.: conceptualization, methodology, writing—review and editing, supervision, project administration, and validation. All authors have read and agreed to the published version of the manuscript.

Funding

This research received no external funding.

Data Availability Statement

The data supporting the findings of this study are available within the article.

Acknowledgments

The authors would like to gratefully acknowledge Universidad de Lima for the facilities provided for the investigation.

Conflicts of Interest

The authors declare no conflicts of interest.

References

  1. Pérez-Guilarte, Y.; Gusman, I.; Lois González, R.C. Understanding the Significance of Cultural Heritage in Society from Preschool: An Educational Practice with Student Teachers. Heritage 2023, 6, 6172–6188. [Google Scholar] [CrossRef]
  2. Bouchenaki, M. Editorial. Mus. Int. 2004, 56, 6–11. [Google Scholar] [CrossRef]
  3. Bertolin, C. Preservation of Cultural Heritage and Resources Threatened by Climate Change. Geosciences 2019, 9, 250. [Google Scholar] [CrossRef]
  4. UNESCO. Globalization and the Convention for the Safeguarding of the Intangible Cultural Heritage; UNESCO: Tokyo, Japan, 2004. [Google Scholar]
  5. Poulios, I. Discussing Strategy in Heritage Conservation: Living Heritage Approach as an Example of Strategic Innovation. J. Cult. Herit. Manag. Sustain. Dev. 2014, 4, 16–34. [Google Scholar] [CrossRef]
  6. Ferrante, A.; Mihalakakou, G. The Influence of Water, Green and Selected Passive Techniques on the Rehabilitation of Historical Industrial Buildings in Urban Areas. Sol. Energy 2001, 70, 245–253. [Google Scholar] [CrossRef]
  7. Brusaporci, S.; Maiezza, P.; Marra, A.; Tata, A.; Vespasiano, L. Scan-to-HBIM Reliability. Drones 2023, 7, 426. [Google Scholar] [CrossRef]
  8. Penića, M.; Svetlana, G.; Murgul, V. Revitalization of Historic Buildings as an Approach to Preserve Cultural and Historical Heritage. Procedia Eng. 2015, 117, 883–890. [Google Scholar] [CrossRef]
  9. Ravankhah, M.; De Wit, R.; Argyriou, A.V.; Chliaoutakis, A.; Revez, M.J.; Birkmann, J.; Žuvela-Aloise, M.; Sarris, A.; Tzigounaki, A.; Giapitsoglou, K. Integrated Assessment of Natural Hazards, Including Climate Change’s Influences, for Cultural Heritage Sites: The Case of the Historic Centre of Rethymno in Greece. Int. J. Disaster Risk Sci. 2019, 10, 343–361. [Google Scholar] [CrossRef]
  10. Osello, A.; Lucibello, G.; Morgagni, F. HBIM and Virtual Tools: A New Chance to Preserve Architectural Heritage. Buildings 2018, 8, 12. [Google Scholar] [CrossRef]
  11. Otero, J. Heritage Conservation Future: Where We Stand, Challenges Ahead, and a Paradigm Shift. Glob. Chall. 2022, 6, 2100084. [Google Scholar] [CrossRef]
  12. Prizeman, O.; Pezzica, C.; Taher, A.; Boughanmi, M. Networking Historic Environmental Standards to Address Modern Challenges for Sustainable Conservation in HBIM. Appl. Sci. 2020, 10, 1283. [Google Scholar] [CrossRef]
  13. Brusaporci, S.; Maiezza, P.; Tata, A. A framework for architectural heritage HBIM semantization and development. Int. Arch. Photogramm. Remote Sens. Spat. Inf. Sci. 2018, 42, 179–184. [Google Scholar] [CrossRef]
  14. Quattrini, R.; Clini, P.; Nespeca, R.; Ruggeri, L. Measurement and Historical Information Building: Challenges and Opportunities in the Representation of Semantically Structured 3D Content. Disegnarecon 2016, 9, 14–1. [Google Scholar]
  15. Pocobelli, D.P.; Boehm, J.; Bryan, P.; Still, J.; Grau-Bové, J. BIM for Heritage Science: A Review. Herit. Sci. 2018, 6, 30. [Google Scholar] [CrossRef]
  16. Colosi, F.; Malinverni, E.S.; Leon Trujillo, F.J.; Pierdicca, R.; Orazi, R.; Di Stefano, F. Exploiting HBIM for Historical Mud Architecture: The Huaca Arco Iris in Chan Chan (Peru). Heritage 2022, 5, 2062–2082. [Google Scholar] [CrossRef]
  17. Del Savio, A.A.; Vidal Quincot, J.F.; Bazán Montalto, A.D.; Rischmoller Delgado, L.A.; Fischer, M. Virtual Design and Construction (VDC) Framework: A Current Review, Update and Discussion. Appl. Sci. 2022, 12, 12178. [Google Scholar] [CrossRef]
  18. Diara, F.; Rinaudo, F. ARK-BIM: Open-Source Cloud-Based HBIM Platform for Archaeology. Appl. Sci. 2021, 11, 8770. [Google Scholar] [CrossRef]
  19. Bustamante, V.; Cedrón, J.P.; Del Savio, A.A. VDC Framework Proposal for Curtain Wall Construction Process Optimization. In ECPPM 2022—eWork and eBusiness in Architecture, Engineering and Construction 2022; CRC Press: London, UK, 2023; pp. 165–172. ISBN 978-1-00-335422-2. [Google Scholar]
  20. Del Savio, A.A.; Galantini Velarde, K.; Luna Torres, A.F.; Salinas Saavedra, J.R.; Vergara Olivera, M.A. Embedding Building Information Modelling in the Construction Area: A Case within an Undergraduate Civil Engineering Program. Int. J. Eng. Pedagog. 2024, 14, 109–138. [Google Scholar] [CrossRef]
  21. Pocobelli, D.; Boehm, J.; Bryan, P.; Still, J.; Grau-Bové, J. Building Information Models for Monitoring and Simulation Data in Heritage Buildings. Int. Arch. Photogramm. Remote Sens. Spatial Inf. Sci, 2.
  22. Alkadri, M.F.; Alam, S.; Santosa, H.; Yudono, A.; Beselly, S.M. Investigating Surface Fractures and Materials Behavior of Cultural Heritage Buildings Based on the Attribute Information of Point Clouds Stored in the TLS Dataset. Remote Sens. 2022, 14, 410. [Google Scholar] [CrossRef]
  23. Liritzis, I.; Volonakis, P.; Vosinakis, S. 3D Reconstruction of Cultural Heritage Sites as an Educational Approach. The Sanctuary of Delphi. Appl. Sci. 2021, 11, 3635. [Google Scholar] [CrossRef]
  24. Maiezza, P. As-built reliability in architectural HBIM modeling. Int. Arch. Photogramm. Remote Sens. Spat. Inf. Sci. 2019, 42, 461–466. [Google Scholar] [CrossRef]
  25. Zalamea, O.; García, G. Validation of the BCH-Ontology. Int. Arch. Photogramm. Remote Sens. Spat. Inf. Sci. 2020, 44, 497–504. [Google Scholar] [CrossRef]
  26. Chamochumbi Chvedine, R.A.; Dulanto Cam, G.R.; Salinas Saavedra, J.R.; Del Savio, A.A. Challenges of ISO 19650 Application on Public Health Projects. Adv. Sci. Technol. 2023, 130, 189–194. [Google Scholar]
  27. Colucci, E.; Xing, X.; Kokla, M.; Mostafavi, M.A.; Noardo, F.; Spanò, A. Ontology-Based Semantic Conceptualisation of Historical Built Heritage to Generate Parametric Structured Models from Point Clouds. Appl. Sci. 2021, 11, 2813. [Google Scholar] [CrossRef]
  28. Croce, P.; Landi, F.; Puccini, B.; Martino, M.; Maneo, A. Parametric HBIM Procedure for the Structural Evaluation of Heritage Masonry Buildings. Buildings 2022, 12, 194. [Google Scholar] [CrossRef]
  29. Moyano, J.; Gil-Arizón, I.; Nieto-Julián, J.E.; Marín-García, D. Analysis and Management of Structural Deformations through Parametric Models and HBIM Workflow in Architectural Heritage. J. Build. Eng. 2022, 45, 103274. [Google Scholar] [CrossRef]
  30. Yang, X.; Grussenmeyer, P.; Koehl, M.; Macher, H.; Murtiyoso, A.; Landes, T. Review of Built Heritage Modelling: Integration of HBIM and Other Information Techniques. J. Cult. Herit. 2020, 46, 350–360. [Google Scholar] [CrossRef]
  31. Oreni, D.; Brumana, R.; Georgopoulos, A.; Cuca, B. HBIM for conservation and management of built heritage: Towards a library of vaults and wooden bean floors. ISPRS Ann. Photogramm. Remote Sens. Spat. Inf. Sci. 2013, 2, 215–221. [Google Scholar] [CrossRef]
  32. Guzzetti, F.; Anyabolu, K.L.N.; Biolo, F.; D’Ambrosio, L. BIM for Existing Construction: A Different Logic Scheme and an Alternative Semantic to Enhance the Interoperabilty. Appl. Sci. 2021, 11, 1855. [Google Scholar] [CrossRef]
  33. Megarry, W.; Hadick, K. Lessons from the Edge: Assessing the Impact and Efficacy of Digital Technologies to Stress Urgency about Climate Change and Cultural Heritage Globally. Hist. Environ. Policy Pract. 2021, 12, 336–355. [Google Scholar] [CrossRef]
  34. Bosco, A.; Carpentiero, L.; D’Andrea, A.; Minucci, E.; Valentini, R. A Parametric Model to Manage Archaeological Data; IMEKO: Trento, Italy, 2020; pp. 220–225. [Google Scholar]
  35. Nagy, G.; Ashraf, F. HBIM Platform & Smart Sensing as a Tool for Monitoring and Visualizing Energy Performance of Heritage Buildings. Dev. Built Environ. 2021, 8, 100056. [Google Scholar] [CrossRef]
  36. Sampaio, A.Z.; Gomes, A.M.; Sánchez-Lite, A.; Zulueta, P.; González-Gaya, C. Analysis of BIM Methodology Applied to Practical Cases in the Preservation of Heritage Buildings. Sustainability 2021, 13, 3129. [Google Scholar] [CrossRef]
  37. Pierdicca, R.; Frontoni, E.; Malinverni, E.S.; Colosi, F.; Orazi, R. Virtual Reconstruction of Archaeological Heritage Using a Combination of Photogrammetric Techniques: Huaca Arco Iris, Chan Chan, Peru. Digit. Appl. Archaeol. Cult. Herit. 2016, 3, 80–90. [Google Scholar] [CrossRef]
  38. Pepe, M.; Costantino, D. UAV Photogrammetry and 3D Modelling of Complex Architecture for Maintenance Purposes: The Case Study of the Masonry Bridge on the Sele River, Italy. Period. Polytech. Civ. Eng. 2020, 65, 191–203. [Google Scholar] [CrossRef]
  39. Deininger, M.E.; Von Der Grün, M.; Piepereit, R.; Schneider, S.; Santhanavanich, T.; Coors, V.; Voß, U. A Continuous, Semi-Automated Workflow: From 3D City Models with Geometric Optimization and CFD Simulations to Visualization of Wind in an Urban Environment. ISPRS Int. J. Geo Inf. 2020, 9, 657. [Google Scholar] [CrossRef]
  40. Pepe, M.; Costantino, D.; Alfio, V.S.; Angelini, M.G.; Restuccia Garofalo, A. A CityGML Multiscale Approach for the Conservation and Management of Cultural Heritage: The Case Study of the Old Town of Taranto (Italy). ISPRS Int. J. Geo Inf. 2020, 9, 449. [Google Scholar] [CrossRef]
  41. Kolbe, T.H.; Donaubauer, A. Semantic 3D City Modeling and BIM. In Urban Informatics; The Urban Book Series; Shi, W., Goodchild, M.F., Batty, M., Kwan, M.-P., Zhang, A., Eds.; Springer: Singapore, 2021; pp. 609–636. ISBN 9789811589829. [Google Scholar]
  42. Ministerio de Cultura Peru. Plan Maestro para la Conservación y Manejo del Complejo Arqueológico de Chan Chan 2021–2031; Ministerio de Cultura Peru: Trujillo, Peru, 2021. [Google Scholar]
  43. UNESCO World Heritage Centre—World Heritage List. Available online: https://whc.unesco.org/en/list/ (accessed on 13 March 2024).
  44. Lines, T.; Basiri, A. 3D Map Creation Using Crowdsourced GNSS Data. Comput. Environ. Urban Syst. 2021, 89, 101671. [Google Scholar] [CrossRef]
  45. El Yamani, S.; Hajji, R.; Nys, G.-A.; Ettarid, M.; Billen, R. 3D Variables Requirements for Property Valuation Modeling Based on the Integration of BIM and CIM. Sustainability 2021, 13, 2814. [Google Scholar] [CrossRef]
  46. Bian, L.; Melesse, A.M.; Leon, A.S.; Verma, V.; Yin, Z. A Deterministic Topographic Wetland Index Based on LiDAR-Derived DEM for Delineating Open-Water Wetlands. Water 2021, 13, 2487. [Google Scholar] [CrossRef]
  47. Hong, J.-H.; Tsai, C.-Y. Using 3D webgis to support the disaster simulation, management and analysis—Examples of tsunami and flood. Int. Arch. Photogramm. Remote Sens. Spat. Inf. Sci. 2020, 44, 43–50. [Google Scholar] [CrossRef]
  48. Del Savio, A.A.; Luna Torres, A.; Chicchón Apaza, M.A.; Vergara Olivera, M.A.; Llimpe Rojas, S.R.; Urday Ibarra, G.T.; Reyes Ñique, J.L.; Macedo Arevalo, R.I. Integrating a LiDAR Sensor in a UAV Platform to Obtain a Georeferenced Point Cloud. Appl. Sci. 2022, 12, 12838. [Google Scholar] [CrossRef]
  49. Del Savio, A.A.; Luna Torres, A.; Vergara Olivera, M.A.; Llimpe Rojas, S.R.; Urday Ibarra, G.T.; Neckel, A. Using UAVs and Photogrammetry in Bathymetric Surveys in Shallow Waters. Appl. Sci. 2023, 13, 3420. [Google Scholar] [CrossRef]
Figure 1. Aerial photo of Huaca Arco Iris’s structure and urban context. Distance: 6.50 km from the coast.
Heritage 07 00234 g001
Figure 2. Workflow of entire work followed by researching, in situ work, and results.
Heritage 07 00234 g002
Figure 3. Establishment control points and vertical control point location for compound geometric leveling of closed traverse.
Heritage 07 00234 g003
Figure 4. Images taken in the second flight. The number indicates the elevation in post-processing to obtain a digital elevation model (DEM) and digital terrain model (DTM).
Heritage 07 00234 g004
Figure 5. Images processed and 3D point cloud created with elevation range indicator.
Heritage 07 00234 g005
Figure 6. Ontology proposal to historical data management for typical wall information.
Heritage 07 00234 g006
Figure 7. Control points shown in situ.
Heritage 07 00234 g007
Figure 8. Perimetral wall points taken by Total Station. Walls sectioned and named to apply ontology parameters.
Heritage 07 00234 g008
Figure 9. Orthophoto and DEM.
Heritage 07 00234 g009
Figure 10. Ontology proposal created for wall parameters for historical data management in Dynamo.
Heritage 07 00234 g010
Table 1. Control points georeferenced and LL02.
IDEast (m)North (m)Elevation (m)
ALPA714,975.04229,106,652.396481.0379
BRAYO714,993.43649,106,661.154981.4043
CHARLIE715,029.93089,106,702.450379.3935
FULL714,961.01599,106,709.931778.8950
LL02716,050.19299,104,316.889441.2224
Disclaimer/Publisher’s Note: The statements, opinions and data contained in all publications are solely those of the individual author(s) and contributor(s) and not of MDPI and/or the editor(s). MDPI and/or the editor(s) disclaim responsibility for any injury to people or property resulting from any ideas, methods, instructions or products referred to in the content.