Article

Delay and Energy Efficient Offloading Strategies for an IoT Integrated Water Distribution System in Smart Cities

by
Nibi Kulangara Velayudhan
,
Aiswarya S
*,
Aryadevi Remanidevi Devidas
and
Maneesha Vinodini Ramesh
Center for Wireless Networks & Applications (WNA), Amrita Vishwa Vidyapeetham, Amritapuri 690525, India
*
Author to whom correspondence should be addressed.
Smart Cities 2024, 7(1), 179-207; https://doi.org/10.3390/smartcities7010008
Submission received: 15 November 2023 / Revised: 8 December 2023 / Accepted: 27 December 2023 / Published: 16 January 2024

Abstract

:
In the fast-moving world of information and communications technologies, one significant issue in metropolitan cities is water scarcity and the need for an intelligent water distribution system for sustainable water management. An IoT-based monitoring system can improve water distribution system management and mitigate challenges in the distribution network networks such as leakage, breakage, theft, overflow, dry running of pumps and so on. However, the increase in the number of communication and sensing devices within smart cities has evoked challenges to existing communication networks due to the increase in delay and energy consumption within the network. The work presents different strategies for efficient delay and energy offloading in IoT-integrated water distribution systems in smart cities. Different IoT-enabled communication network topology diagrams are proposed, considering the different water network design parameters, land cover patterns and wireless channels for communication. From these topologies and by considering all the relevant communication parameters, the optimum communication network architecture to continuously monitor a water distribution network in a metropolitan city in India is identified. As a case study, an IoT design and analysis model is studied for a secondary metropolitan city in India. The selected study area is in Kochi, India. Based on the site-specific model and land use and land cover pattern, delay and energy modeling of the IoT-based water distribution system is discussed. Algorithms for node categorisation and edge-to-fog allocation are discussed, and numerical analyses of delay and energy models are included. An approximation of the delay and energy of the network is calculated using these models. On the basis of these study results, and state transition diagrams, the optimum placement of fog nodes linked with edge nodes and a cloud server could be carried out. Also, by considering different scenarios, up to a 40% improvement in energy efficiency can be achieved by incorporating a greater number of states in the state transition diagram. These strategies could be utilized in implementing delay and energy-efficient IoT-enabled communication networks for site-specific applications.

1. Introduction

Sufficient water for daily activities is vital for cities and societies. Water requirements can be fulfilled only by the accurate delivery of adequate water at different locations within an area from the central water distribution point [1]. This accurate delivery of water in cities can be assured by the close surge monitoring of different parameters, such as water flow, water pressure, water level and water quality at various locations [2].
A Water Distribution System (WDS) is a spatially organized networks that ensures safe water access to the people/community, and consists of water resources, conveyance systems, treatment plants, distribution networks, and consumers. Water intake to the source and water withdrawal from the source are followed by the transmission systems, which convey raw water from the collection unit to the treatment unit. Water treatment is carried out at water treatment plants (WTP). The next process consists of distributing the treated water to consumers through pipe networks. These networks consist of pipes, valves, appurtenances, pumps, storage structures and other supporting infrastructure. Wastewater from consumers can be treated and recycled. The IoT-enabled smart management of water distribution systems can ensure the delivery of water in equal quantities at all targeted destinations, thus fulfilling the needs of all consumers within a location [3,4]. IoT-based communication systems for cities can provide wireless connectivity to all the devices within the network [5,6,7].
Even though IoT-based systems have the above capabilities, they also have significant challenges, some of which are as follows. IoT systems deal with enormous amounts of data in M2M and device-to-device communications [8]. The timely management of both edge, fog, and cloud nodes without delay in communications can be challenging as network resources are subject to various constraints [9,10,11]. Ensuring the interoperability of APIs and web services, including the mini, micro, and macro communication management of edge, fog, and cloud nodes, respectively, is a challenging task. Security concerns, such as confidentiality/privacy, integrity, authenticity, non-repudiation, and authorization [12,13] have to be achieved in the network for secure communications. Network reliability is one of the critical requirements for IoT deployment with moderate-to-high-priority data. Hence, heterogeneity in terms of data, design, and operation has to be ensured [14]. Low latency and high accuracy are requirements in IoT-based water distribution systems for smart cities [15,16].
IoT-enabled water distribution systems aim to provide smart communications between different IoT modules deployed within water distribution networks in smart cities [17,18]. The sources of water networks in most cities in India are freshwater reservoirs, such as lakes, ponds, and backwaters. Water is collected from reservoirs and distributed to the lower levels, i.e., consumer points such as households, industries, and offices. Water scarcity at specific locations is a significant concern in these networks due to the lack of efficient water management [19]. IoT-enabled smart water systems can improve water distribution management. However, to deploy an efficient system, a wireless propagation model suitable for the location depending upon the terrain has to be found using the land cover pattern [20]. In this work, the significant constraints that lead to inefficiency in water management are addressed, and a solution is proposed by deploying different sensor modules depending on the constraints. The deployed sensors are either active or passive and are either directly or indirectly connected with water distribution entities, such as pipes, pumps, and valves. Currently, all mobile communication networks within India are 4G/5G, and this work utilizes these protocols for communication between the different modules within the network. The IoT network in this work consists of three types of nodes: edge, fog, and cloud. The sensors integrated with the communication module form the edge devices. The unit responsible for intermediate data collection, processing, and re-transmission are the fog devices, and the final data reception, processing, and control take place within the cloud devices.
The IoT devices in water distribution systems are often constrained by limited power resources, which must be addressed by energy-efficient offloading strategies that minimize energy consumption for the deployed devices. Offloading data to cloud or edge servers introduces network latency within the network, which can be addressed by developing techniques to minimize delay in the network while maintaining reliable communication depending upon the study area. A multi-layer heterogeneous IoT architecture for delay and energy-efficient offloading strategies in an integrated water distribution system is to be designed considering the above challenges [21]. The architecture should be designed to optimize the use of resources while minimizing delay and energy use, thus improving the overall efficiency of the water distribution system. Integrating IoT technologies into water distribution systems in smart cities introduces challenges related to delay and energy efficiency, demanding the design of a robust multi-layer heterogeneous IoT architecture.
From the above research challenges, it is evident that the current state of water distribution systems lacks an optimized framework capable of efficiently managing heterogeneous IoT devices, minimizing end-to-end delays, and ensuring energy-efficient offloading strategies. Hence, the objective of this work is to design an IoT-based delay and energy-efficient offloading framework for the current water distribution system by considering the research mentioned above challenges.
To our knowledge, the design and analysis framework for any site-specific IoT-based communication network for the optimized delay-efficient and energy-efficient offloading strategies is not available in the literature. This modeling framework can be universally applicable for designing any site-specific communication network, which is novel in our work.
  • Identified the different challenges of a WDN in a secondary metropolitan city and designed communication network entities and topologies.
  • Development of wireless propagation model for a specific study area depending upon the land use land cover pattern, network reliability, channel, and communication parameters and assumed that external climatic factors do not affect the communication network.
  • Integrated delay and energy analysis for the designed wireless channel model for an IoT-based communication architecture for WDN in secondary metropolitan cities.
  • Node categorization and node allocation algorithm with integrated delay and energy-efficient offloading for IoT-based communication architecture for WDN in secondary metropolitan cities.
  • Numerical analysis for the proposed algorithm incorporating the delay and energy-efficient offloading scenarios are included.
This paper aims to frame IoT-integrated water distribution networks for smart cities. The problems discussed in the paper focus on the strategies to overcome the delay and energy problems in the communication network, thereby ensuring increased lifetime to the different IoT nodes. The work discusses the data communication between different edge devices to the cloud server. Section 2 discusses the current water distribution system and the different design constraints in the water distribution network. Section 3 presents the IoT-enabled distribution system. Section 4 presents the case study of IoT-Based Water Distribution Network in the study area. Section 5 discusses the algorithms performed in the communication architecture. Section 6 discusses the numerical analysis and discussions about the delay and energy in the network. Finally, Section 8 concludes the work.

2. Design Considerations for an IoT-Enabled WDN

In India, even though there are adequate water resources for sustainable water distribution, some places lack water, even for their primary necessities. Water from water sources will be collected in large reservoirs, from where it is supplied through the distribution network to consumer connections. Figure 1 shows the high-level water supply system. WDN consists of 5 layers: consumers, consumer supply point, sub-reservoir, treatment plant, and main water reservoir.
The water supply shortage is the lack of a proper reservoir distribution system. This includes the aging of infrastructure, leakages, and poor water management of the network. To mitigate these challenges, a smart IoT-based water distribution system for sustainable water management is proposed. The IoT-based water distribution network can monitor, control, and automate the WDN, enhancing water management for the community and the water supply. The distribution system can be represented as a multi-layer heterogeneous IoT architecture with multiple entities for this solution. Table 1 shows the different entities considered in designing the network.
Different design constraints must be considered for the efficient formulation of the architecture. The different design constraints considered in deriving the multi-layer heterogeneous IoT architecture are as follows.

2.1. Water Supply-Consumption Imbalance

The water from the reservoirs is collected at the sub-reservoirs after treatment. Water is distributed from the sub-reservoirs through the junctions to the consumer points. Even though there is a proper hierarchical plan for efficient distribution, some areas need more water for basic needs due to water leakage, illegal connections, water theft, etc. The supply-consumption imbalance can be identified by placing flow sensors at each level. The flow sensors are to be placed at level 1 and level 5 of the water distribution network. The placement of flow monitoring sensors at each level with a controller is shown in Figure 2a.

2.2. Sub-Optimal Faults from the Operator Side

The operators currently do the water tank filling and operations like switching on and off the pumps and valves. So, by mistake or for unavoidable reasons, sub-optimal faults occur in the operation of tanks. Introducing a water level sensing system in the network can avoid or control these faults. The sensor could detect the tank’s water level and automatically turn the pump on and off upon filling the tank. The system could save water and electricity, thus ensuring optimized energy consumption. The level sensors have to be deployed in levels 1, 3, and 4 of the water distribution network. The placement of level monitoring sensors at each level with a controller is shown in Figure 2b.

2.3. Water Quality Analysis

After treatment, the water from the reservoirs is stored in the tank and further distributed to the lower levels. Water quality is the primary concern to be considered, as it could contribute to many health issues. As water is supplied from the primary source to a community, the health effects of water intake with chemical contents can lead to long-lasting problems for the community. So, water quality has to be analyzed before storing it in the tanks using water quality sensors. The quality monitoring sensors must be deployed in levels 1 and 5 of the water distribution network. The placement of quality monitoring sensors at each level with a controller is shown in Figure 2c.

2.4. Pipe Line Water Theft Detection

Even though all the line connections and the water usage are manually monitored, water theft is due to illegal connections. These illegal connections and water thefts can affect the whole network. Due to this issue, some locations will need more water for their amenities. This water theft can be detected by deploying pressure sensors at the junctions, and the increased pressure in supply for the allotted connections will indicate water theft. The pressure monitoring sensors must be deployed at all levels of the water distribution network. The placement of pressure monitoring sensors at each level with a controller is shown in Figure 2d.

2.5. Automatic Fault Pipe Detection

One of the main reasons for the water supply-consumption imbalance is the fault in the pipes. This fault can be detected by using crack detection sensors. Thus, maintaining cracks in the pipes can resolve the water leakage within the pipes.

2.6. Automatic Billing System

Using the cumulative data from the flow sensor from each consumer point, the bill details of the consumers can be calculated and updated for the users.

2.7. Optimised Water Distribution

The enhancement of all these sensors in the water distribution network will resolve the presently sustaining issues and contribute to sustainable water distribution within the network.

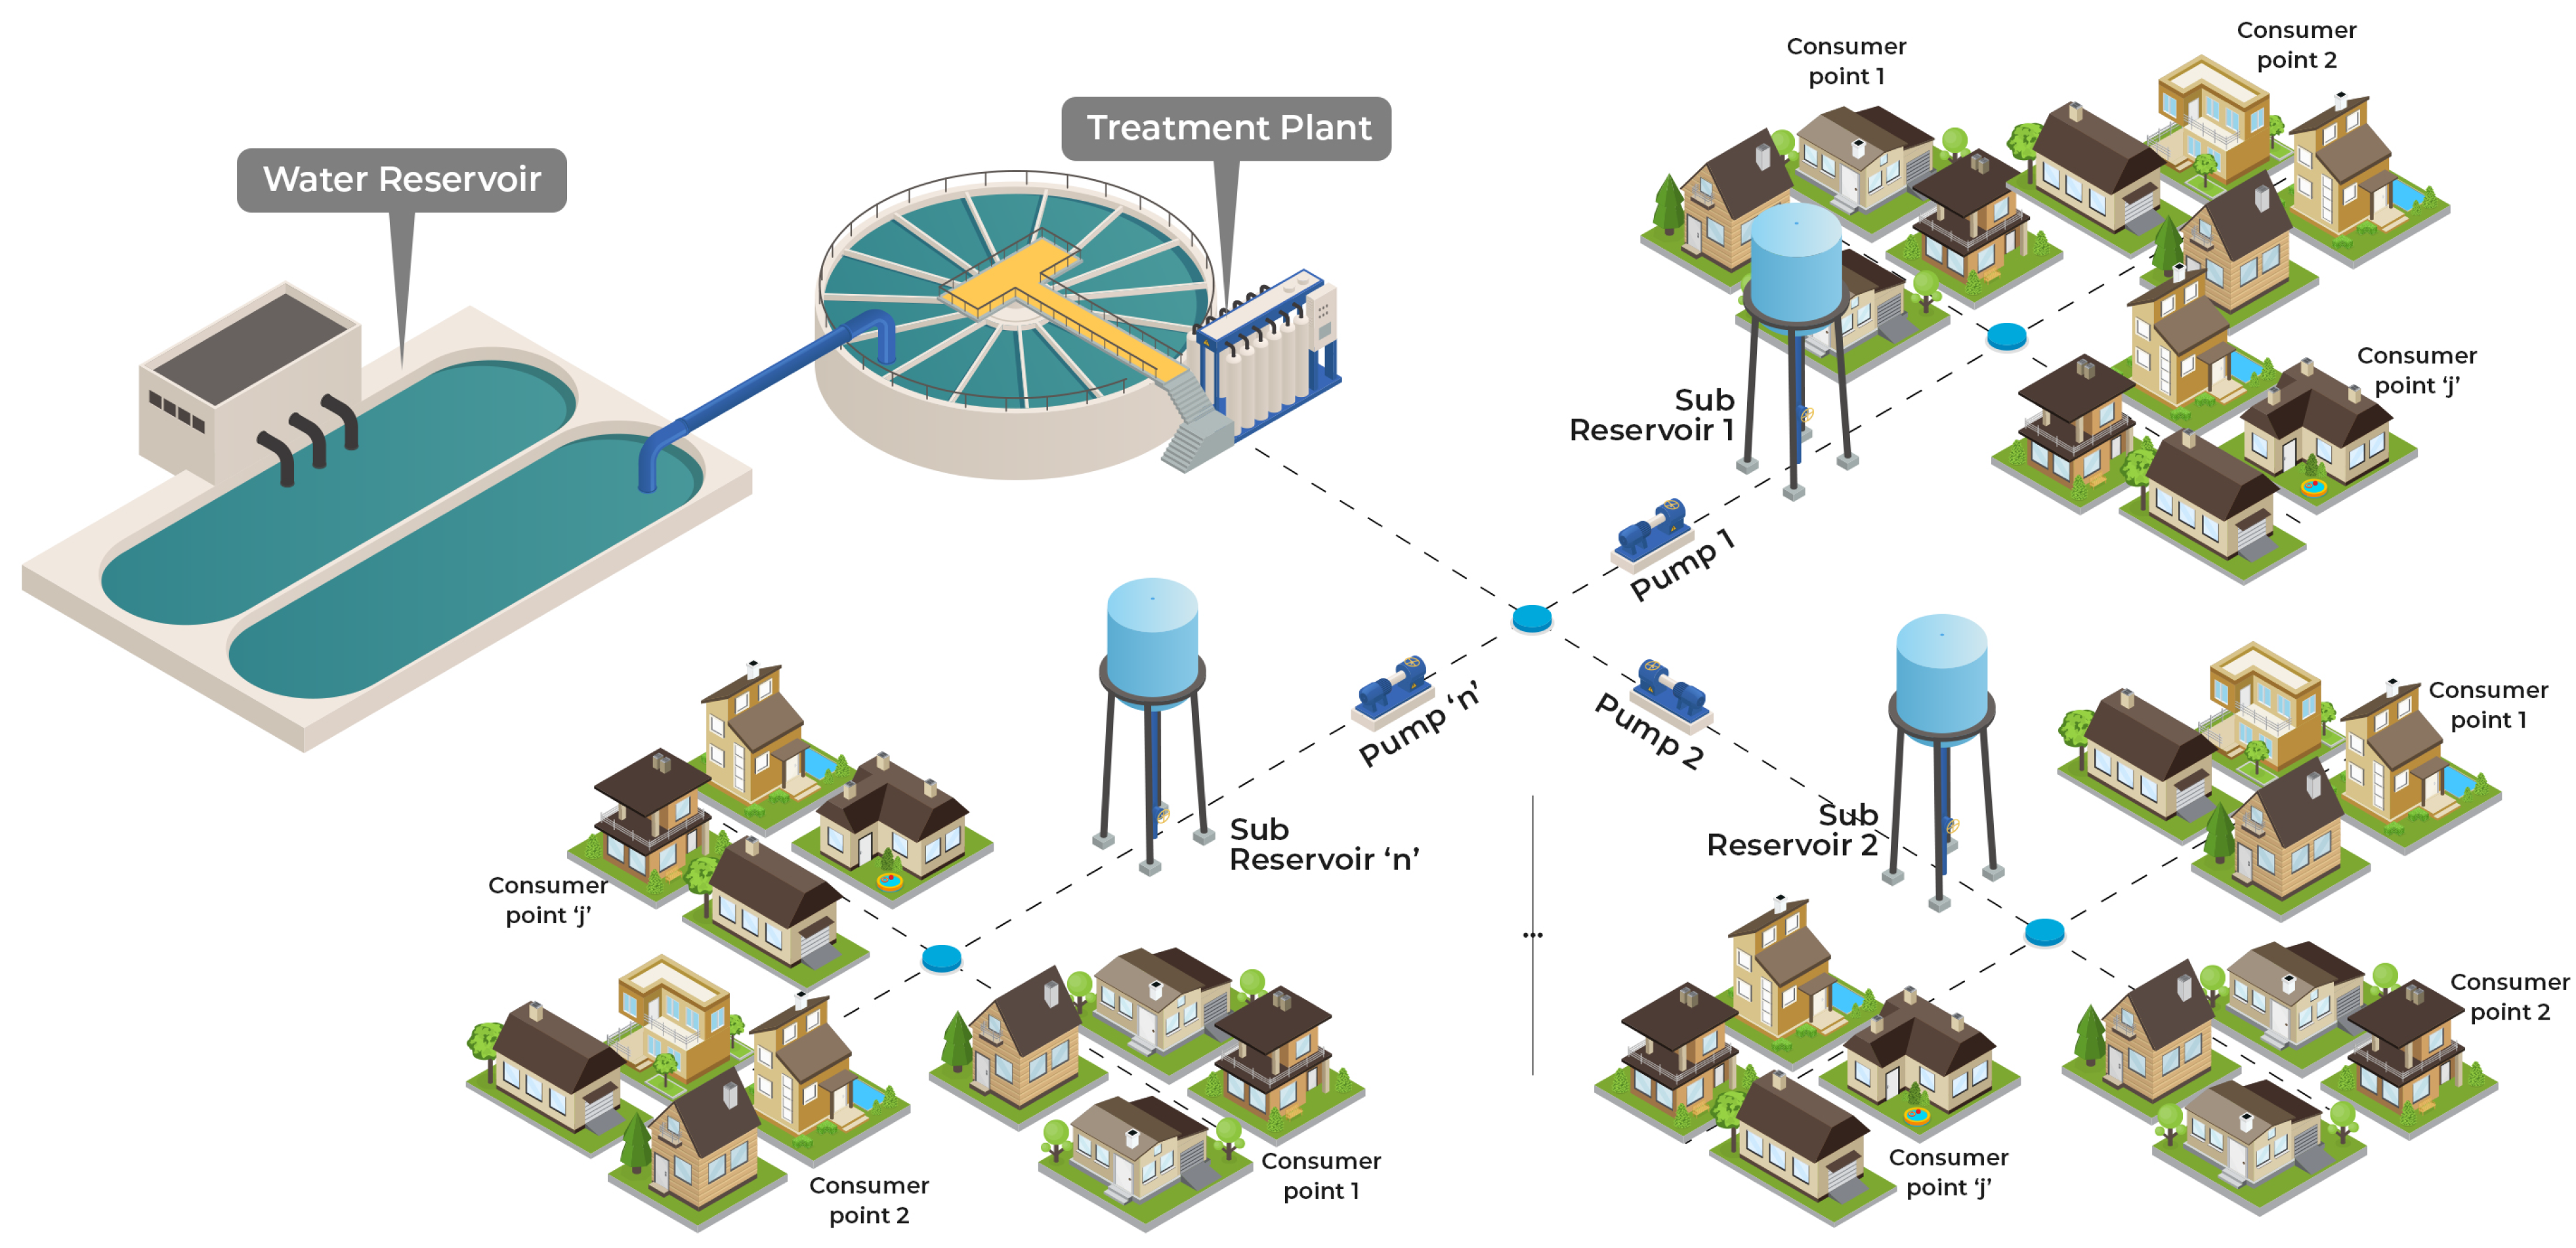
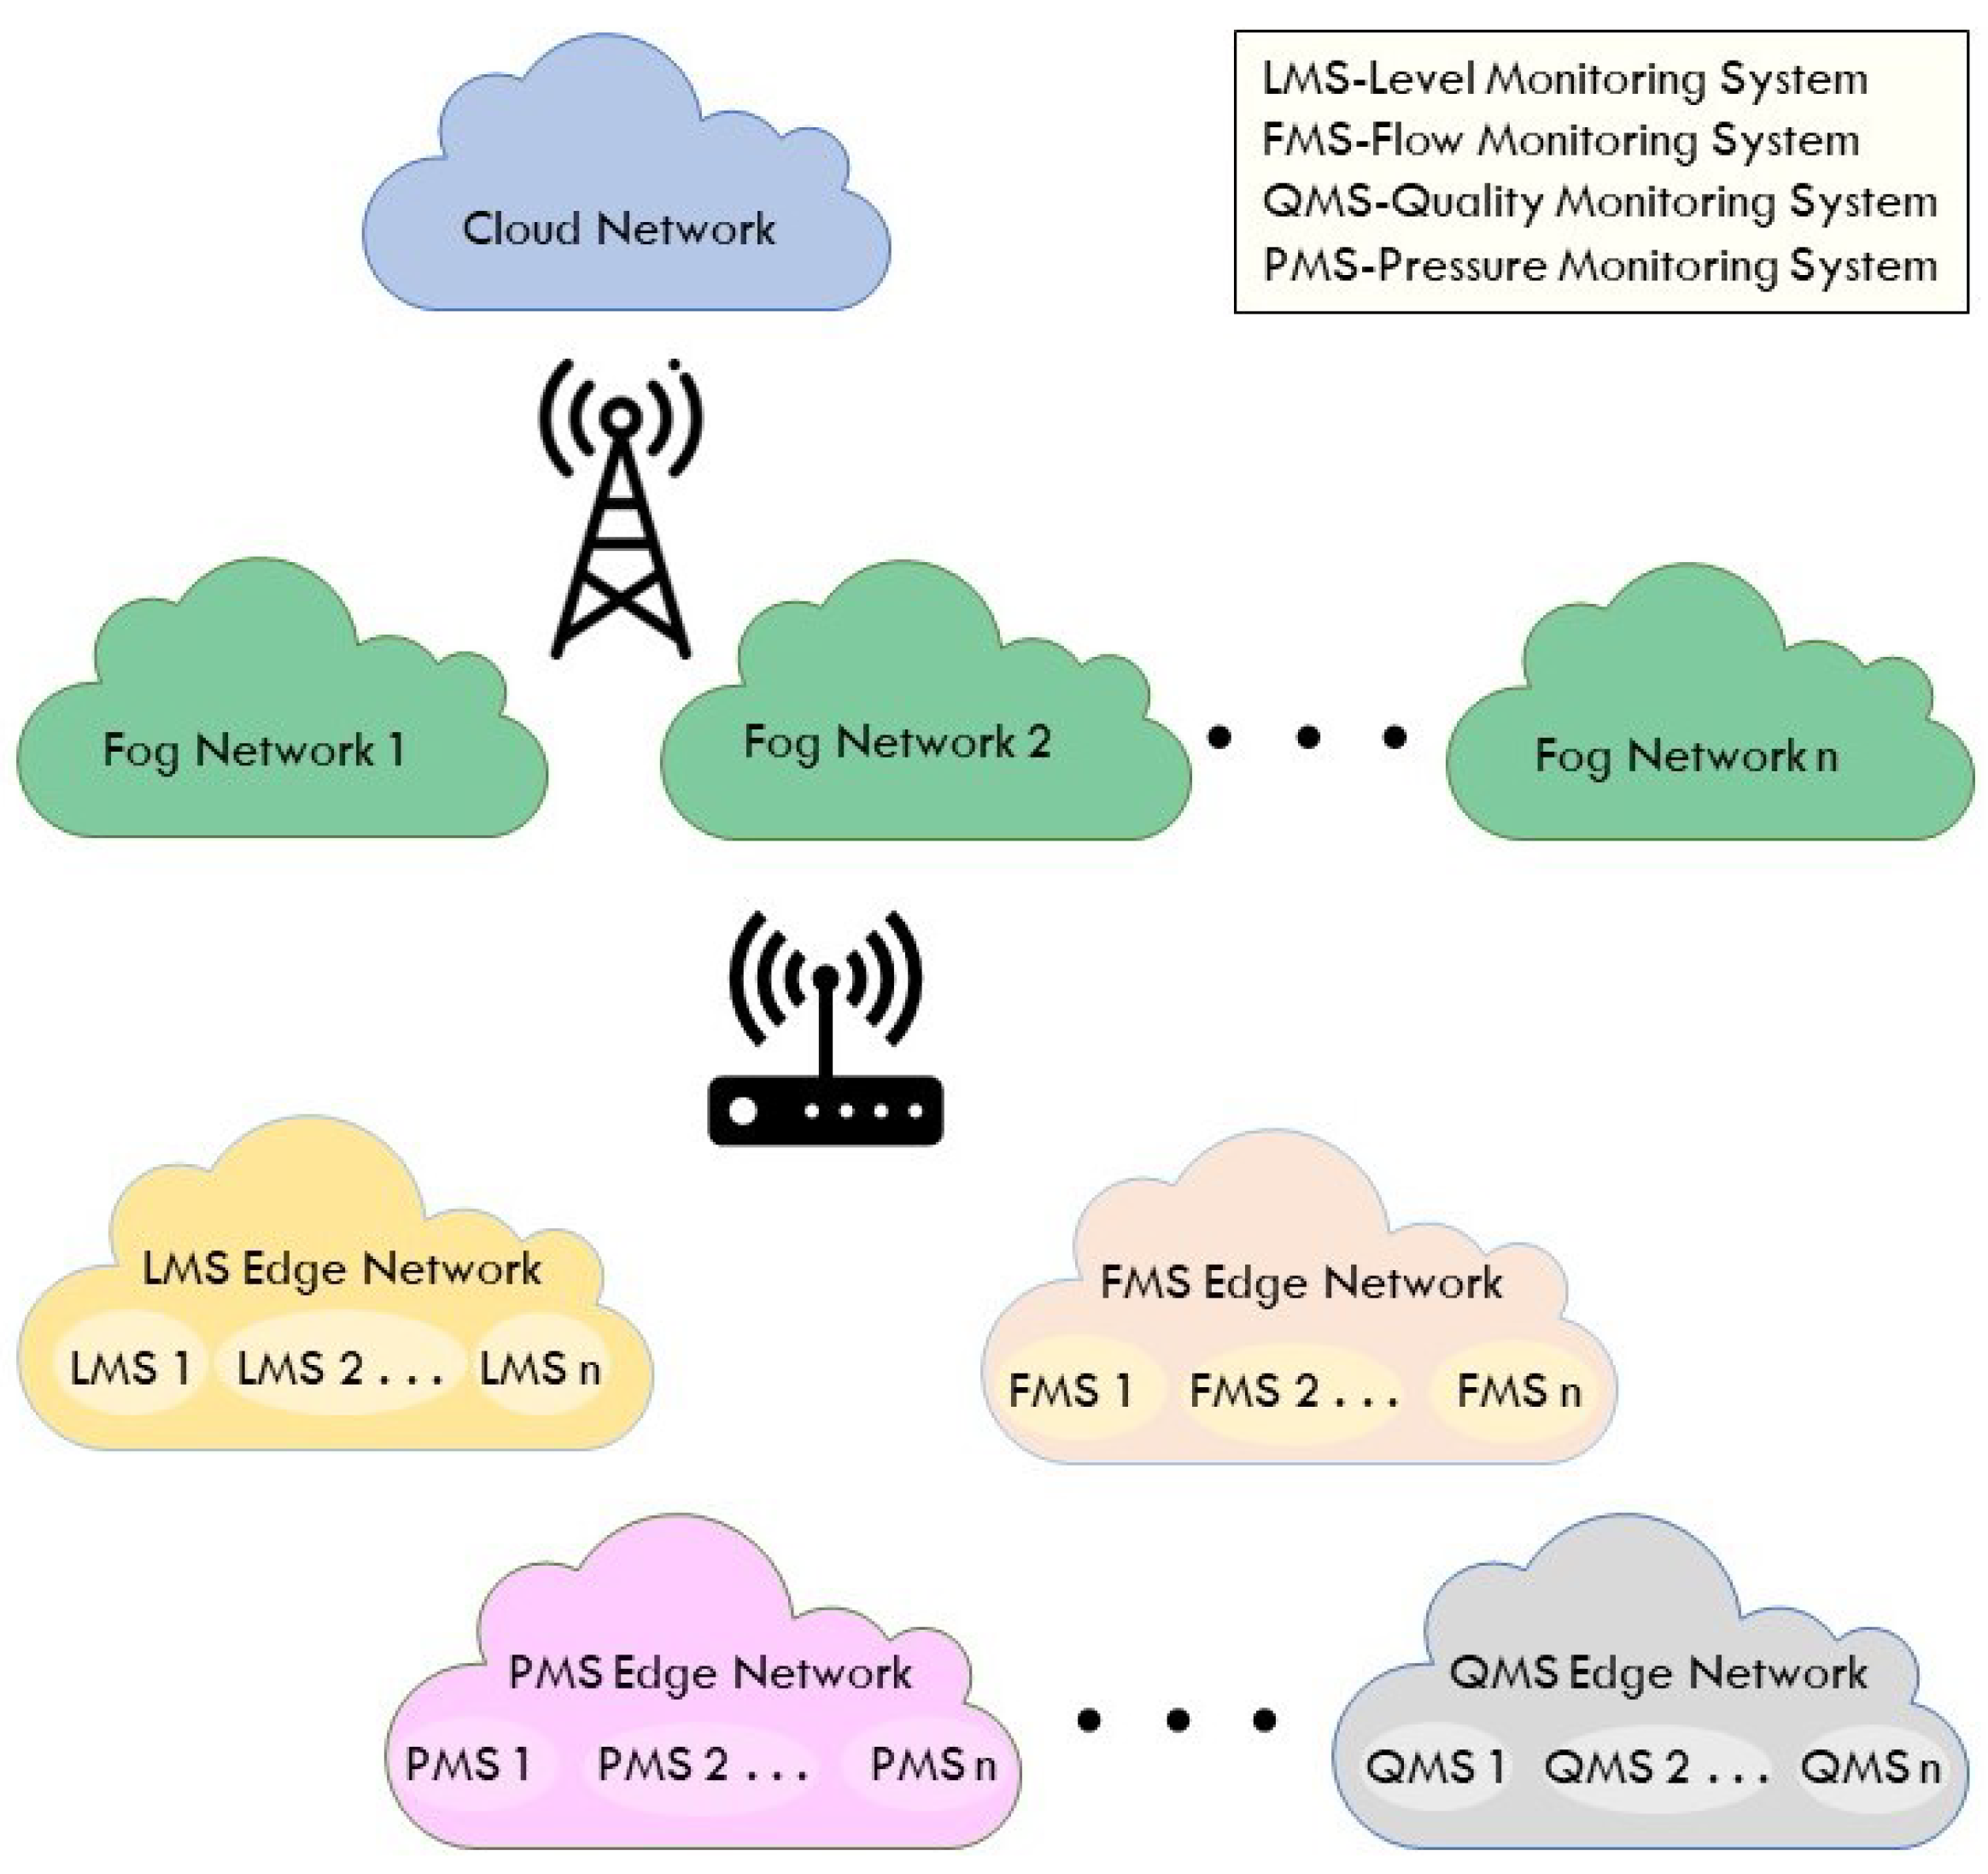
3. IoT-Enabled Water Distribution Network

In order to address the design constraints in the water distribution system, the different sensors have to be deployed in respective locations where sensing is mandatory, and the Smart IoT connects all these sensors-enabled networks. The network comprises sensors, IoT gateway, cloud, analytics, and user interface. The sensors, like pressure, level, and flow sensors, will provide analog or digital data and are connected to the IoT gateway module, which transmits the collected data to the cloud via 4G connectivity. The data is further analyzed and is available to the user interface.
The requirement is to transmit the pressure, flow, and level data collected by the sensor units to the cloud. Assume there are ‘N’ random underground pipeline points deployed by the flow and pressure sensors. The cloud or the monitoring point is located at a different location, too far away from the sensors. These sensors will send the data to the monitoring point with the gateway module. For the reliable and efficient transmission of the collected data, a study of the different ways of transmission of the data from the sensor unit to the control unit has been done. These details are described in detail in the below sections.
The lower level of the network consists of different sensor nodes like pressure monitoring sensor (PMS), level monitoring sensor (LMS), flow monitoring sensor (FMS) and different quality monitoring sensors (QMS). The explanation about the various sensor nodes is explained in detail below:
  • PMS: The pressure sensors are deployed underground beneath the pipe to continuously monitor water pressure.
  • FMS: The flow sensors are also deployed underground beneath the pipe to continuously monitor water pressure.
  • LMS: The level sensors are deployed in the water tanks in the main water collection point to know the quantity of water available in the tank.
  • QMS: QMS consists of sensors for water quality monitoring. Various water quality parameters such as pH, iron, fluoride, and calcium content in water can be monitored by deploying the corresponding sensors in the locations or water outlets.
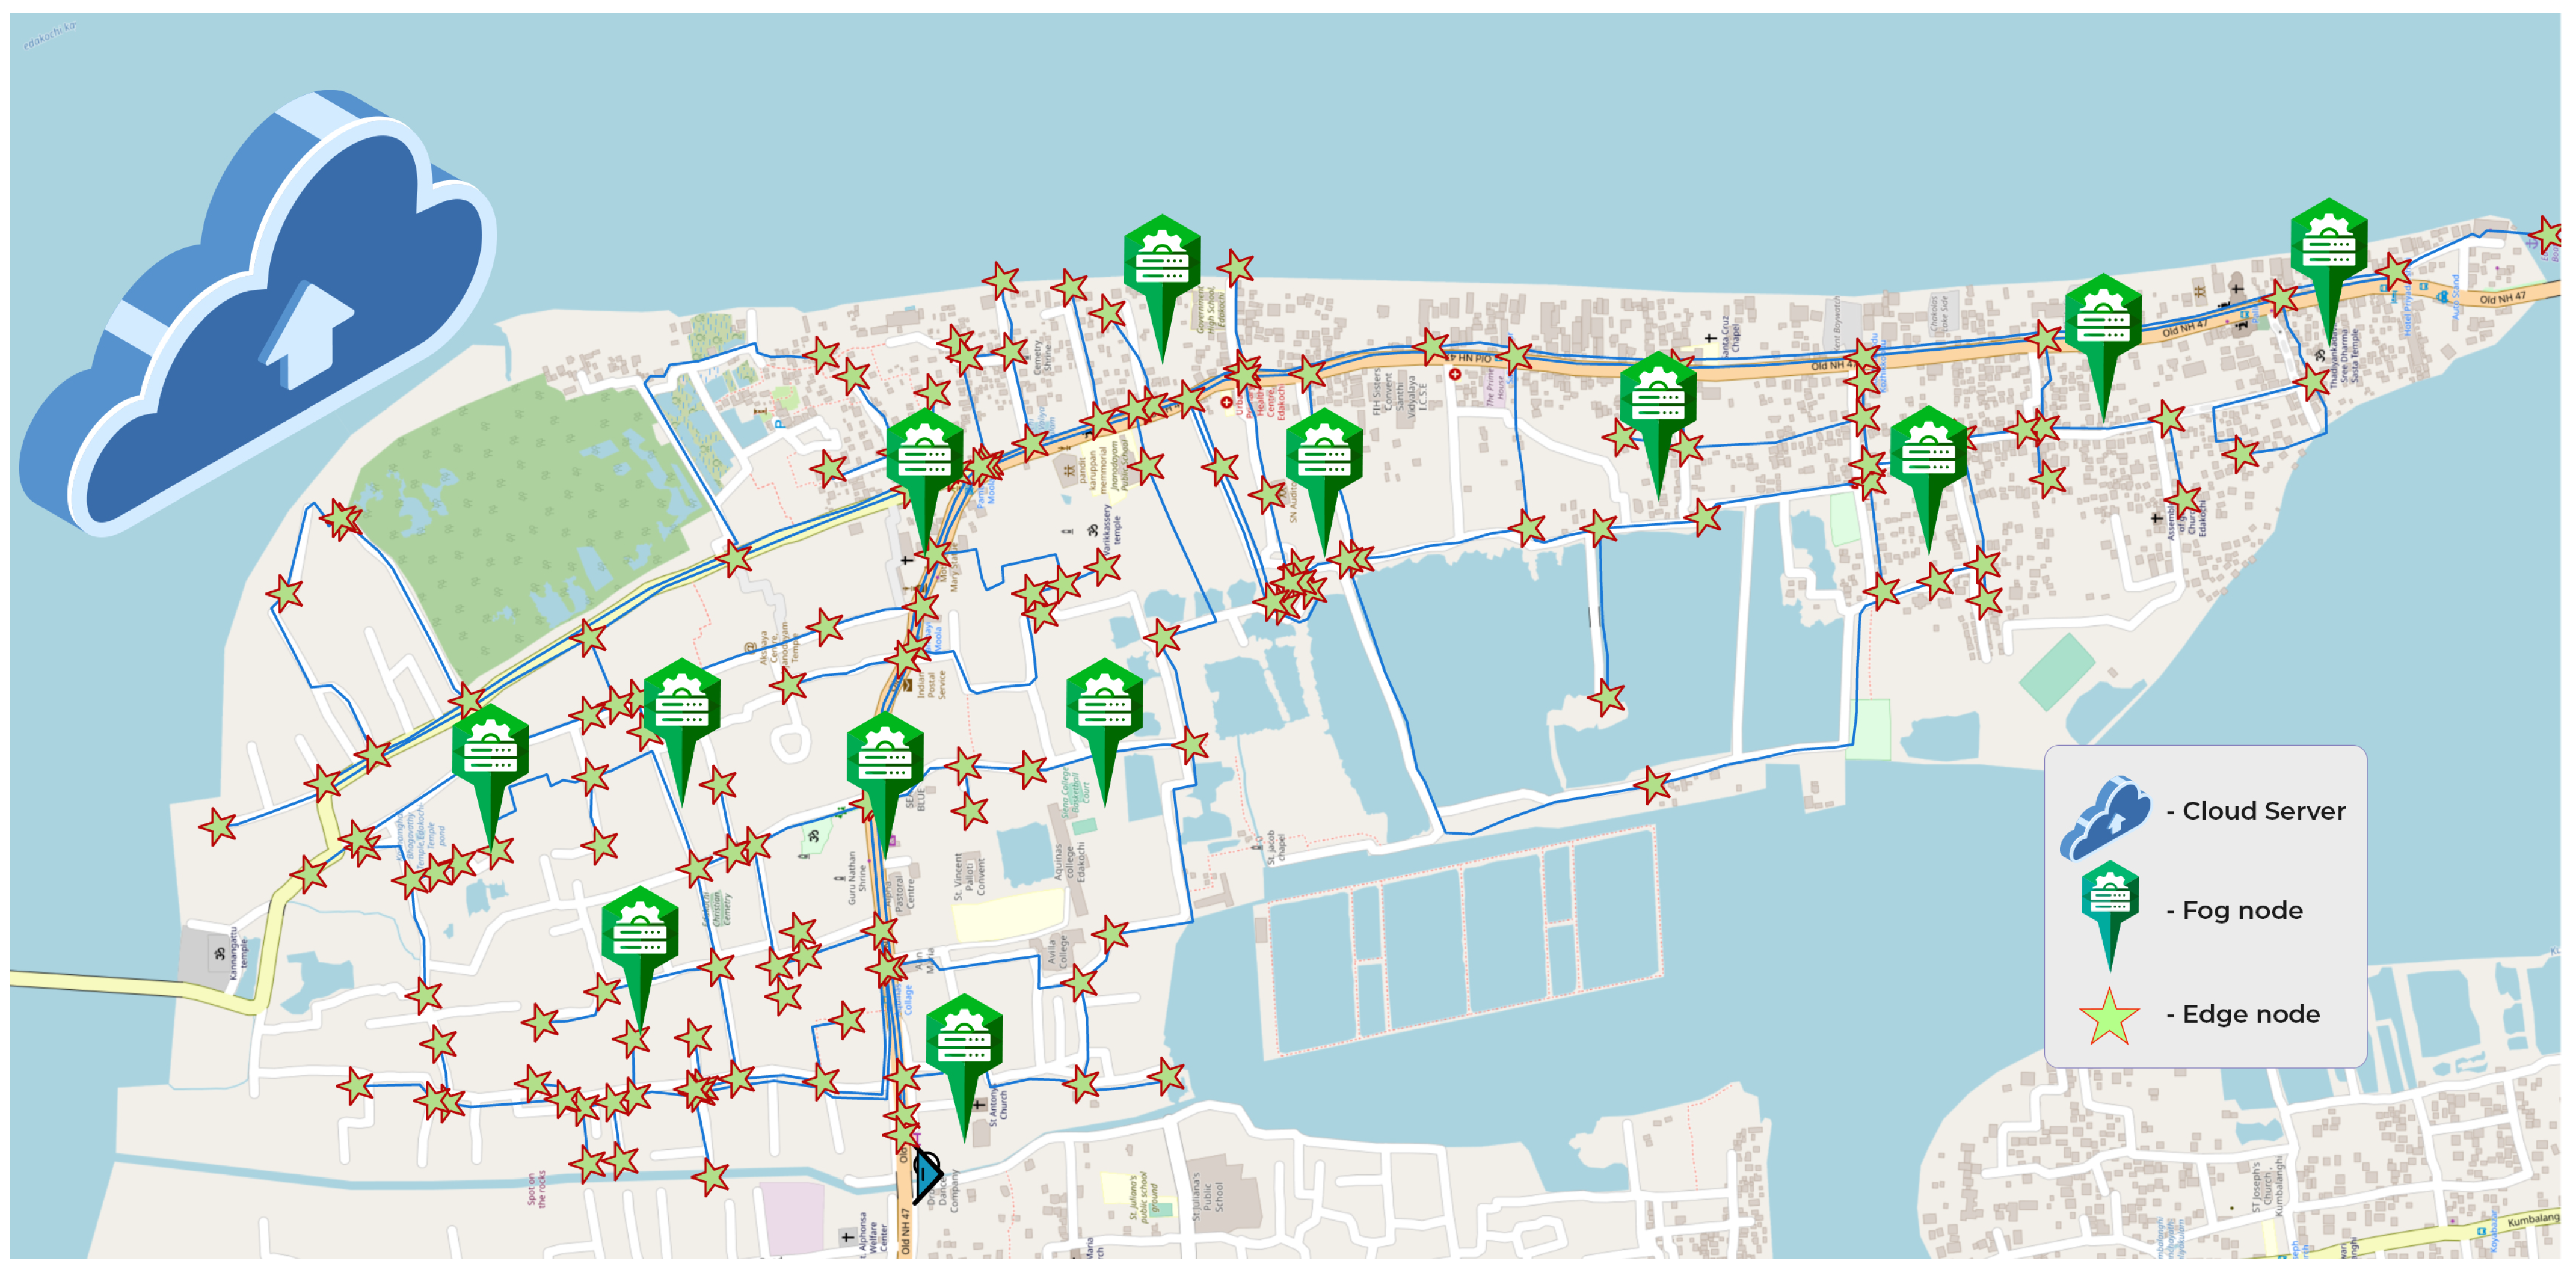
All these sensors are integrated with the microcontrollers, which transmit the data to the gateway using 4G connectivity. The real-time monitoring and automation system of the WDN mainly requires three types of nodes: edge node, fog node, and cloud. The edge node performs the data acquisition and edge computing and forwards to the fog node, which acts as the remote control station for this communication network. The fog node acts as the repeater and network controller in the network. The fog node need not be in the communication range of all the edge nodes. Hence, fog nodes have to forward the data to the cloud. The fog nodes must be aligned on multiple levels for redundant communication.
The high-level IoT architecture consists of different levels termed edge node, fog node, and cloud server. The edge node comprises different sensor units integrated with the microcontroller and communication module. The data aggregated from the sensor units is transmitted to the higher levels called fog nodes. The application part of the hierarchy is the cloud server. A detailed explanation of the different nodes is described in detail in the sections below.

3.1. Edge Node

The data collected from the different sensors are computed and abstracted and are transmitted to the next higher level - the fog node.

3.2. Fog Node

The data sent from the edge nodes after data abstraction are received by the multiple fog nodes location-wise. The received data is abstracted and aggregated using multiple computations and sent to the cloud server.

3.3. Cloud Server

The top layer of the IoT communication network is the cloud server. The cloud nodes receive the data transmitted by the multiple fog nodes after fog computation. The cloud server consists of a high-level visualization platform enabled to predict, analyze, and fault detect the water network in the location. The cloud is enabled with behavioral modeling and demand forecasting with the help of a machine learning framework.
This is the generic overview of the water distribution network. In order to attain an IoT network for WDN, a proper communication channel with efficient data transmission has to be made available between the transmitter and receiver. For that, within the study area, the wireless propagation models have to be identified, and the strategies for reducing the delay and energy of the network have to be identified. The practical aspects of designing an ideal IoT-enabled communication network with minimized delay and energy considering the location properties, including the wireless propagation model and challenges, are discussed in the next section.

4. Case Study: Designing of IoT-Enabled Water Distribution Network in the Study Area
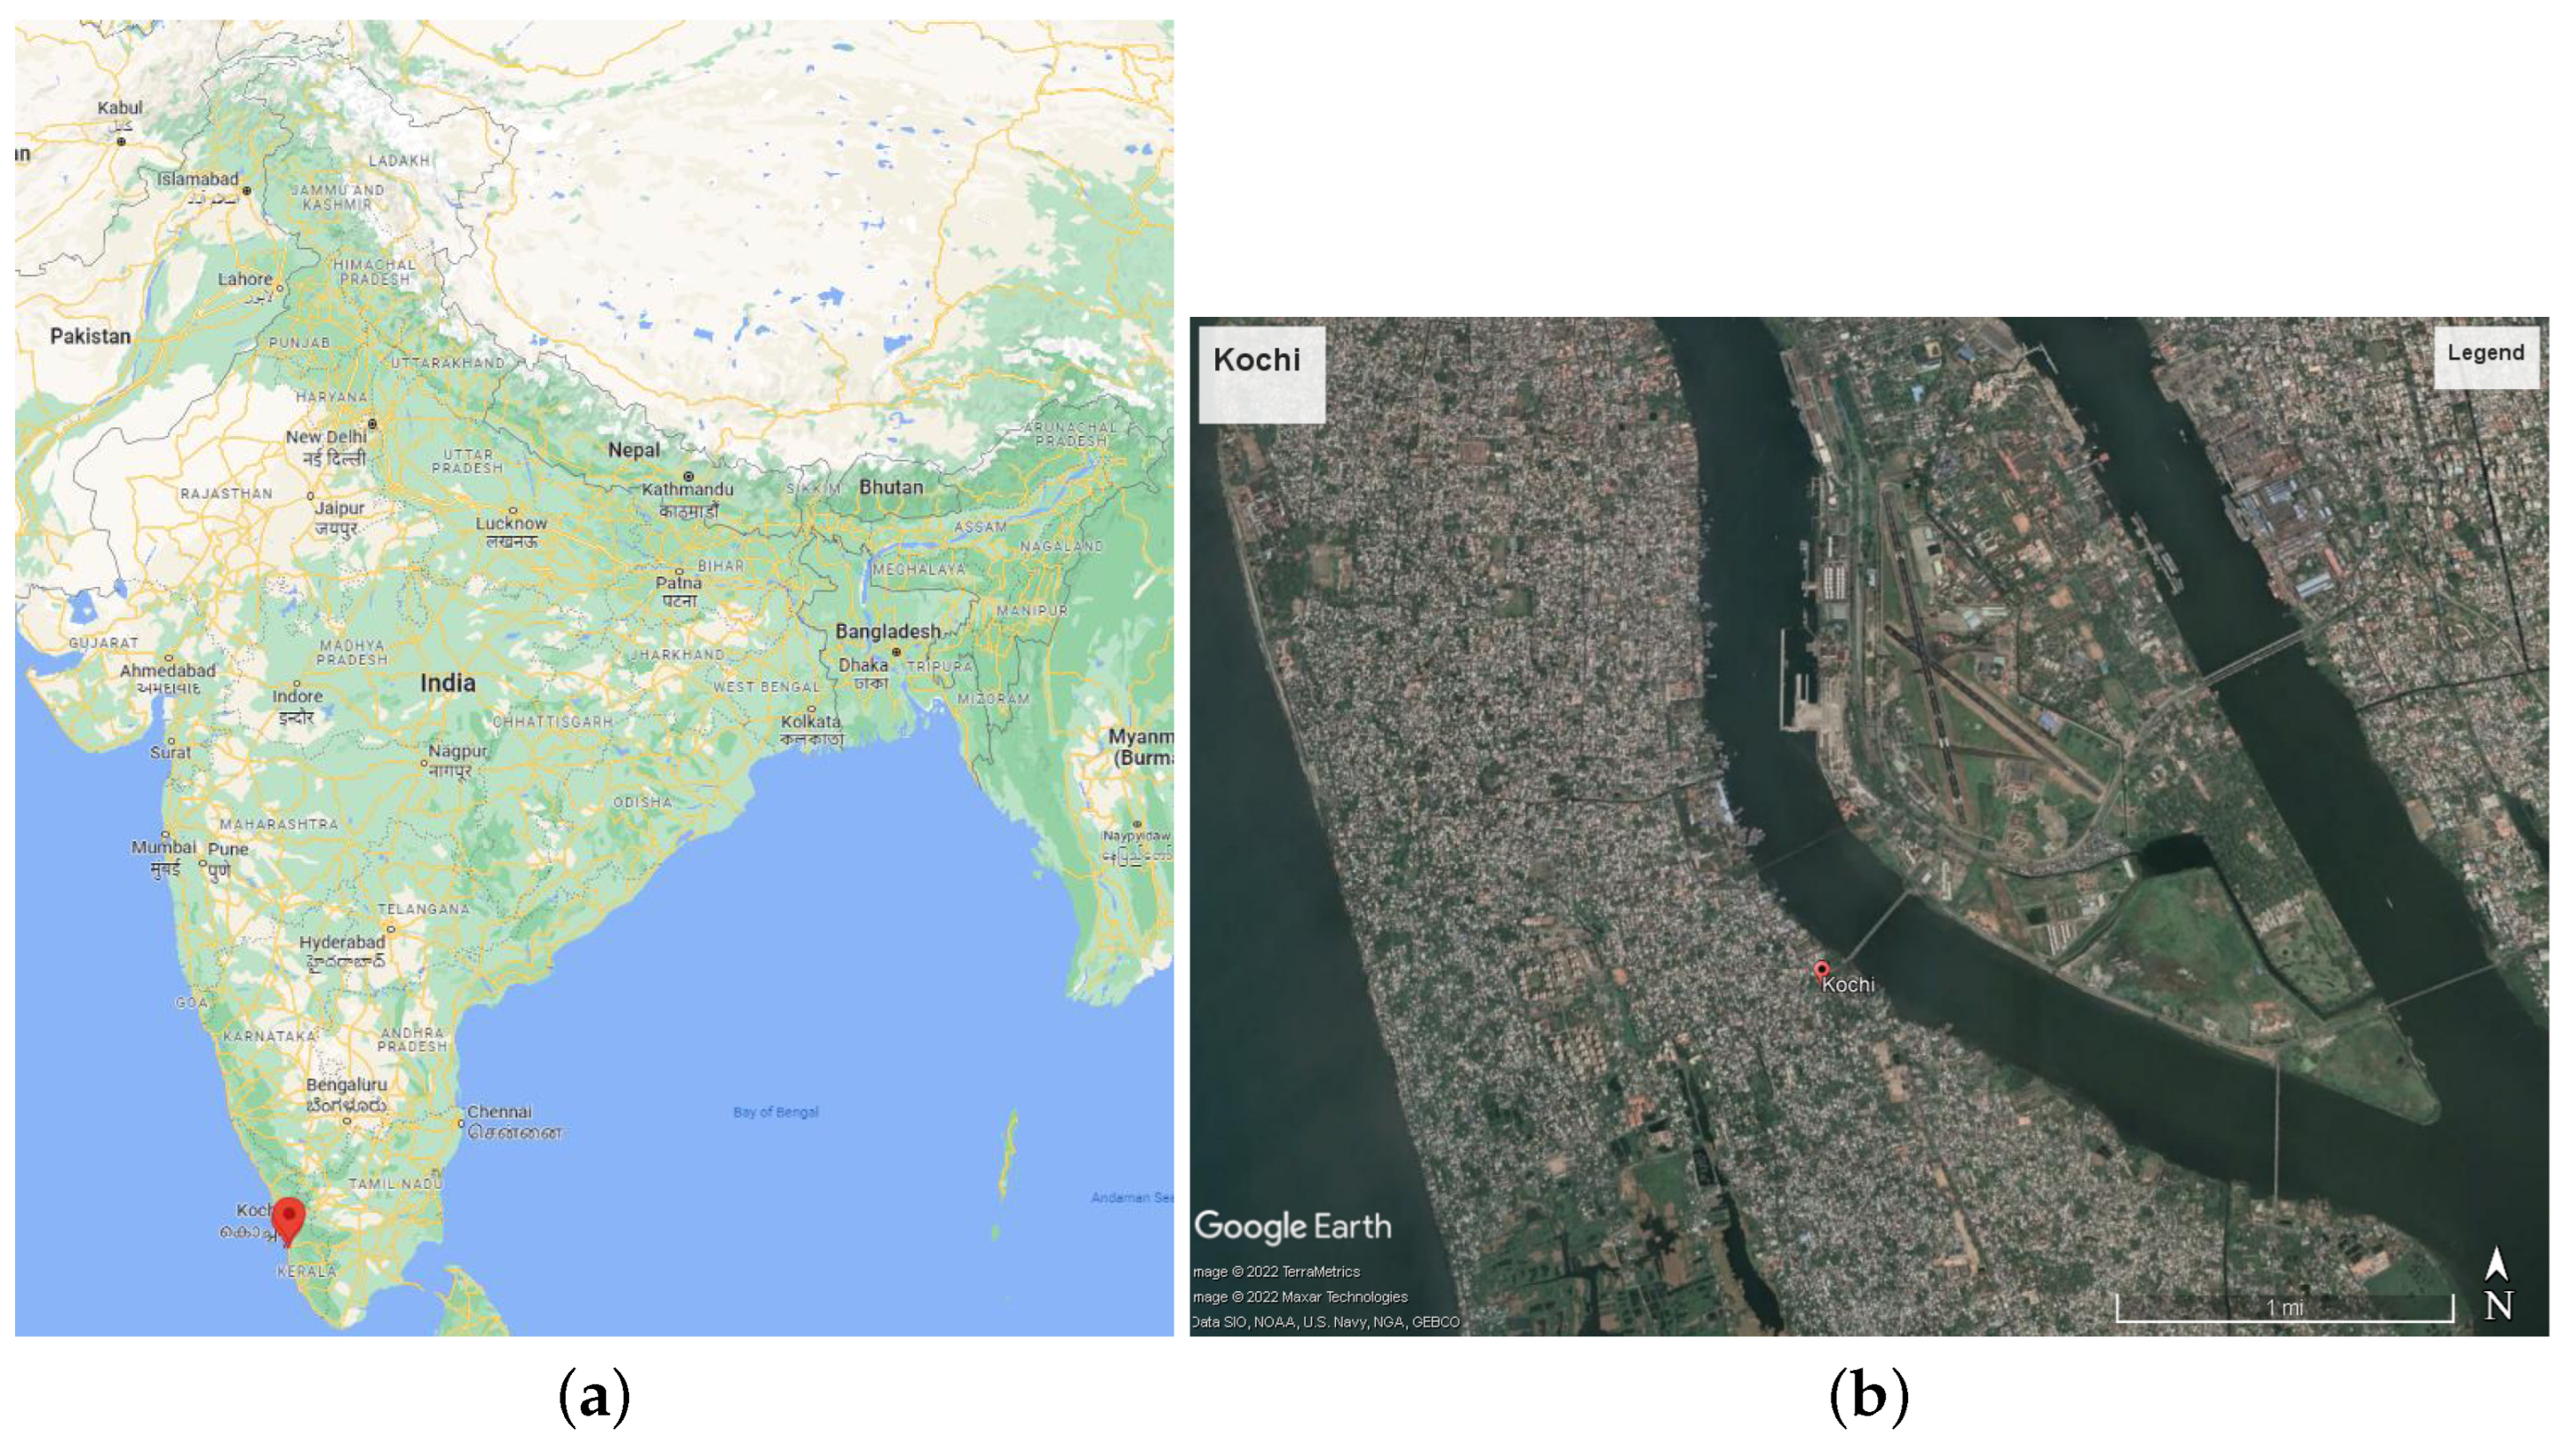
The design of an IoT-enabled WDN with minimized delay and energy has to be initiated with a geographical understanding of the study area. Based on the geographical model, the wireless communication model for the study area could be predicted, which is highly necessary in designing the IoT network. The results of channel modeling can be used to minimize the delay and energy of the network. A detailed explanation is given in the below subsections.

4.1. Study Area

As per the 2011 census, Kochi Municipal Corporation caters to the needs of 677,381  citizens, an area of 94.88 sq. km, and 74 wards. Over the years, the population growth rate has tremendously increased due to the significant rate of urbanization [22]. Within the domains of sustainability, a creative city is made of several defined characteristics, one of which is the environment. This includes clean air, water, sanitation, green spaces, and recreational areas. It is vital to upgrade and modernize the water supply system, promote rainwater harvesting, minimize water use, reuse water as far as possible, and ensure that water leakages are detected and repaired immediately. Kochi has already prepared a water policy. It is the first initiative by a local self-government body in India [23]. The study area Kochi is depicted in Figure 3 and Figure 4.
The water supply distribution system in Kochi faces several challenges, such as non-availability of 24/7 water supply, uneven and intermittent supply, lack of sewage treatment plants, depleting groundwater quantity and quality, population growth, water pollution, changing land use patterns, low multi-hazard resilience for water management, and non-availability of climate based forecast models for water quantity and quality management [24]. Even though these are the generic WDN supply challenges, the predominant problem with the Edakochi water distribution network is the age of the infrastructure. Since the supply mains had been laid more than 40 years ago, and new constructions and buildings upon the mains, the information on the larger pipes is mostly unknown. The lack of pipe mains accessibility and data availability is due to urbanization, dense population, and built-up areas.
A communication architecture for the IoT-enabled WDN will address all these challenges. Since in Kochi, most of the population depends on the pipeline water supply, infrastructure is a high priority. Hence, any information on the supply network at any point is critical. Therefore, the communication network has to be delay-tolerant. The WDN branches were laid based on urbanization rather than optimized and expertise design and planning. Hence, there are more interconnections and junctions in the Kochi WDN. Hence, the number of edge nodes is also high. Therefore, an optimized energy communication network is required for the area. A delay and energy-efficient IoT-enabled water distribution network controlling and monitoring system can rectify most of the challenges.

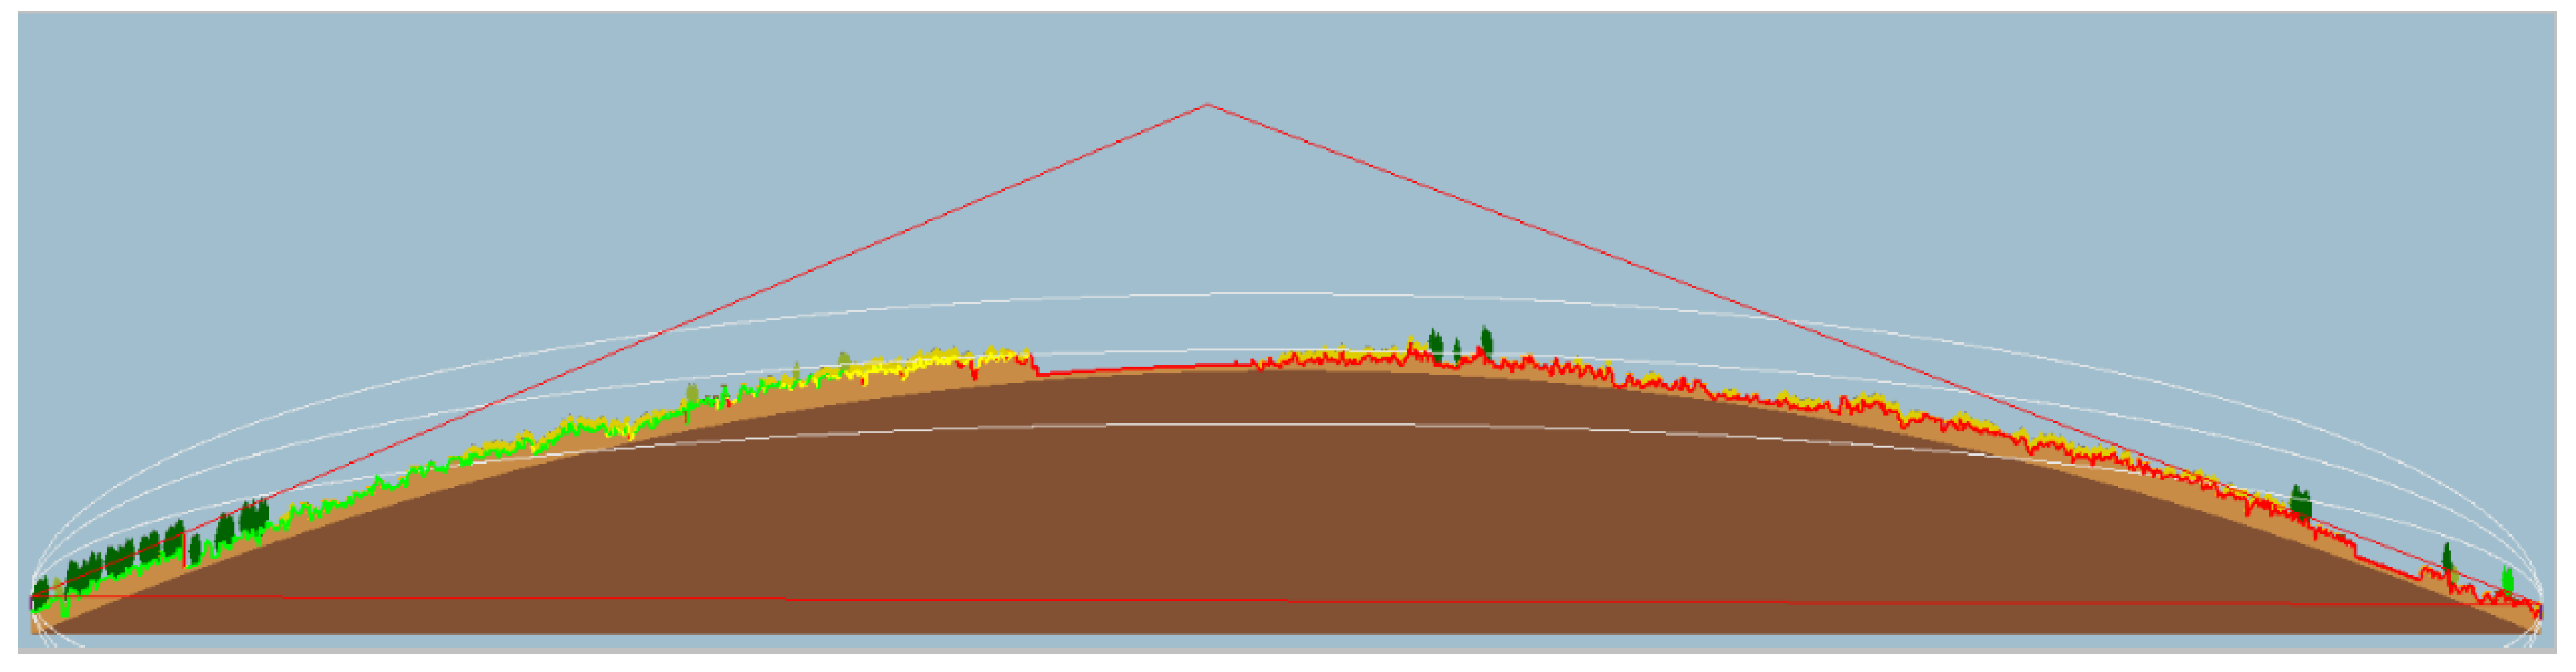
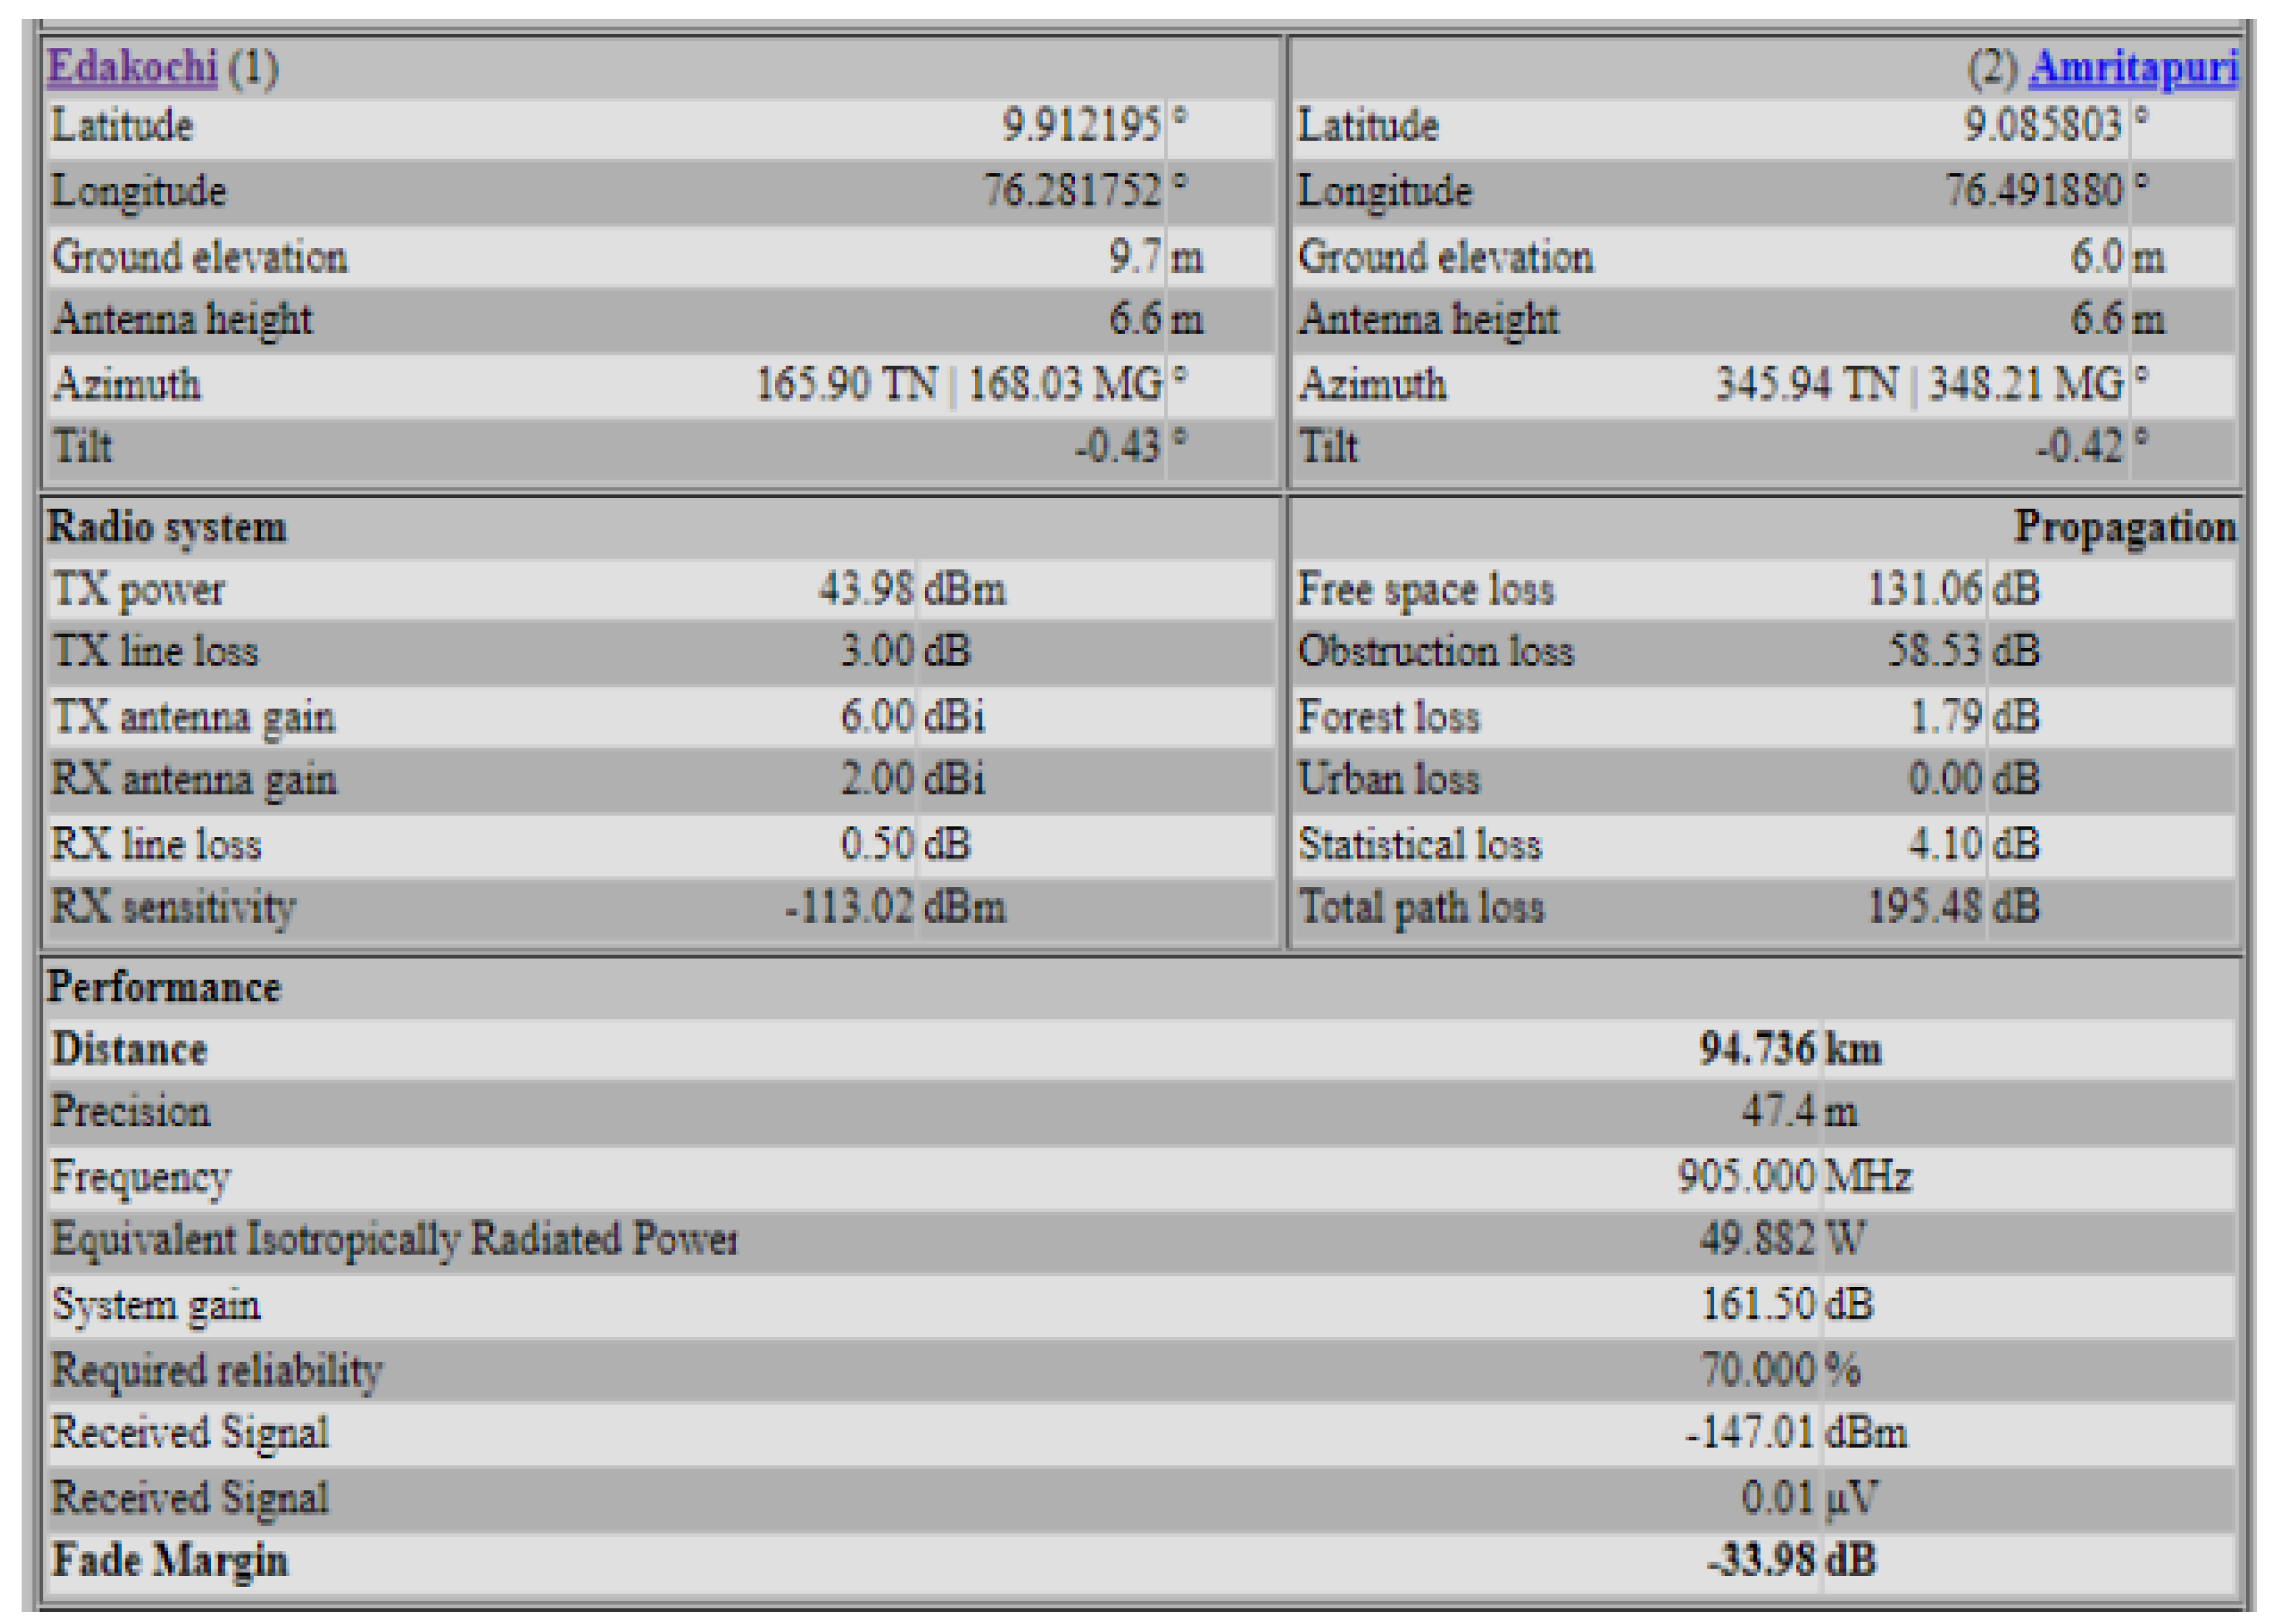
4.2. Site Specific Propagation Model Selection Criteria

In this section, we identify the communication model for the IoT-enabled water distribution system for Kochi. Kochi is the suburban city of Kerala, which contains variable land use patterns. The pattern contains vegetation and built-ups such as small and tall buildings, metro rails, and roads. The success rate of the IoT communication system for the WDN depends on the path loss model chosen for the area. Free-space loss, refraction, diffraction, reflection, aperture medium coupling loss, and absorption are some causes of path loss. Terrain contours, environment, propagation medium, the distance between the transmitter and the receiver, and the height and location of antennas also influence path loss.
The land cover of the study area was identified and analyzed in QGIS with the open-source plugin Semi-Automatic Classification (SCP) [25]. It enables supervised land cover classification of remote sensing images by downloading free image files from satellites such as LANDSAT and Sentinel and performing prepossessing and post-processing functionalities. Multi-spectral images are processed to produce the land cover classification. SCP was performed on the images downloaded from LANDSAT for January 2021. Tonal and textural variations due to altitude-dependent vegetation and contour information are used for classification. The image was processed to classify the different features on the ground, such as built-up, vegetation, and water. For supervised classification using the maximum likelihood supervised classification (MLC) algorithm, training sets were selected in the LANDSAT imagery with seven bands based on the collected sample points for respective LULC classes. Training sites for LULC classification were selected based on knowledge developed through extensive ground surveys and detailed field studies of the area. Figure 4 shows the LULC classification of the study area.
The built-up areas are a unique urban land use pattern covering the entire Kochi. It consists of three different urban classes outlining different settlement geometries, densities, and special urban zones such as trade fairs or industrial areas [26]. From the land cover model, it is evident that the area consists of both vegetation, water, and built-up. As Ernakulam comprises cities and villages, the propagation model should satisfy the criteria for urban, suburban, and rural area propagation effects [27]. The types of propagation models and their characteristics are shown in Table 2. The development of graphical information systems, which index data of terrain, clutter, and land usage in an easily accessible and manipulated form, giving better frequency and management [28]. The propagation model characterizes how radio propagation affects the environment of the receiver. The Fris transmission equation governs radio propagation between a transmitting antenna and a receiving antenna [29],
P r = P t G t G r λ 2 ( 4 π ) 2 d 2 L
where, P t is transmitting power, G t is the gain of transmitting antenna, G r is the gain of the receiving antenna, λ is the operating wavelength, d is the distance between transmitting and receiving antennas and L is the transmission loss.
Free-space transmission loss (FSTL) [30,31],
F S T L = ( 4 π d ) 2 λ 2
rearranging terms and putting FSTL in decibels (dB),
F S T L = 32.4 + 20 log 10 f M H z + 20 log 10 d k m
The FSTL is the primary line of sight propagation model, which depends only on the distance. It is considered the best-case propagation model. It does not account for multipath or ground clutter loss from foliage, buildings, clutter, and so on. Therefore, FSTL will not be suitable for the study area as per the land cover classification (see Figure 4). The next is the Hata-Okumura model, which has additional loss factors for different built-up densities. It has three different equations for urban, suburban, and rural environments—the model constraints on distance and frequency.
For Sub-urban environments [32]
L U = 69.55 + 26 log 10 f M H z 13.82 log 10 h b C H + ( 44.9 6.55 log 10 h b ) log 10 ( d )
where L U = Path loss in Urban areas (dB)
h b = Height of base station antenna (m)
h m = Height of mobile antenna (m)
f = Frequency of transmission (MHz)
C H = Antenna height correction factor (dB)
d = Distance between the base and mobile stations (km).
For small and medium-sized urban cities, the following equation can be used [33].
C H = ( 1.1 log 10 f M H z 0.7 ) h m ( 1.56 log 10 ( f ) 0.8 )
The study area belongs to this category. Hence, the Hata-Okumura model suits for this application.The selected propagation path-loss model for the area is simulated in the web application Radio Mobile Freeware by VE2DBE [34] for the Edakochi study area. The simulator provided a propagation model for the area considering the transmission, channel, and communication parameters, including losses and the land cover model for the area. Figure 5 shows the link between the transmitter and receiver.
The simulation parameter and results for the source (transmitter) and destination (receiver) are shown in Figure 6. Moreover, the coverage prediction cellular expert has several types of advanced coverage prediction algorithms for modeling microwave point-to-point, point-to-multipoint, fixed, and mobile radio systems based on ITU-R, ETSI, COST 231, and IEEE standards and recommendations. The models can be calibrated using drive test data and customized for specific terrain and land use types. The propagation models cover a distance range from several meters up to 150 km and frequencies from 20 kHz up to 100 GHz. Cellular expert supports Line of Sight, Hata, COST 231 [35], Walfish-Ikegami [36], SUI type models [37], and the ability to implement additional prediction models. Cellular expert has the unique ability to use combined prediction models according to environmental conditions.

4.3. Delay-Efficient Offloading in IoT-Enabled WDN

The IoT-enabled WDN has to be designed considering the propagation model within the study area. Delay-efficient offloading within the network involves transferring the data processing and computational tasks from the sensors to remote clouds to reduce processing delays. These techniques could increase the efficiency of the network. Several aspects must be considered while designing the network, such as task identification, offloading decision, task offloading, computational offloading, and energy considerations to achieve efficient service quality.
A successful transmission happens when the received SIR (Signal-to-interference ratio) at the receiver node is larger than some specific SIR threshold θ . Otherwise, retransmission will be conducted. Let η be the spectral efficiency of the wireless link of the edge device e i and the fog device f i . Transmission power required from the edge node e i to fog node f i through the link j is P t i i and the received power at the fog node i is P r j . The spectral efficiency of the system η [38] is
η = log 2 1 + P t i i δ P i + B × P n 0
where P i is the interference power spectral density, P n 0 is the noise power spectral density, and δ is the product of losses such as the Channel loss rate and the shadowing effect of the wireless channel.
D τ = D p r o p + D t + D p r o c + D q
where D τ is the total delay, D p r o p is the propagation delay, D t is the transmission delay, D p r o c is the processing delay, and D q is the queuing delay.
  • D p r o p Equation (4) path-loss of the channel leads to the propagation delay. The path loss between antennas increases as the path length increases [39].
  • D t the time taken to push the data bits/packets to the receiver. It depends on the transmission channel C j i i to the e i to the f i , channel bandwidth B, b i size of the data. The delay depends on the transmission rate T R , the message length M, and the channel access delay d θ [40]
  • D p r o c is the processing delay depending on the characteristics parameters of the f i such as f m i fog memory, f c f i clock frequency altogether termed as fog processing capacity f p c i
  • D q is negligible as the data in this water network is not higher. This will be our enhanced future work.
D τ = L U × α + c t i i B b i T R M + f p c i
where α is the constant delay parameter for the propagation delay.
From Equation (8), it is evident that the delay of the WDN communication network depends on the propagation model, path loss, and various network and communication parameters as described. A noisy propagation or path loss model can reduce the spectral efficiency of the system, which in turn causes a delayed communication network. The IoT-enabled WDN has to be designed considering the design constraints and propagation models within the study area. For that, the delay has to be reduced within the network for efficient communication. The delay minimization techniques are discussed in the following subsection.

4.3.1. Delay Modelling

Consider a multilevel network as shown in Figure 1. After computation, the data from the different edge nodes have to be transmitted to the cloud server. So, the data from the various edge devices like FMS, LMS, QMS, and PMS has to be transmitted to the server after the necessary computations. All the transmissions are continuous or event-triggered at discrete intervals to optimize the system’s delay. Each sensor subsystem introduces a delay in sensing, processing, and transmission. The sensor systems have to sense parameters like pressure, water level, flow, etc., by using different types of sensors, and all of these contribute to the sensing delay. The sensed data has to be converted to equivalent electrical parameters after the computations, contributing to the processing delay. Transmission delay involves the delay while transmitting the data. The delay in the network is given by
d c o m p = d s e n s + d p r o c + d t r a n s
where, d c o m p is the total delay in the communication network, d s e n s is the sensing delay, d p r o c is the processing delay and d t r a n s is the transmission delay of a single node.
Even after the data is transmitted, there is a delay contributed by the channel due to the channel bandwidth and propagation effects. Thus, the delay in the channel will vary as a function, α of bandwidth and propagation effects.
d c h a n = α ( d b a n d , d p r o p )
where, d c h a n is the channel delay, d b a n d is the delay due to bandwidth issues, and d p r o p is the delay due to propagation effects.
One of the reasons for the delay in the network is the presence of the number of edge devices in the network. After processing the data, the edge devices directly send the data to the cloud server. Let the total number of edge devices be N e . The data transmitted from the edge has to reach the cloud server. As the edge device transmits data after individual processing, these come N e times data processing and transmission. Then, the total capacity of the cloud server can be given by the below equation:
C c l o u d = N e ( d c o m p + d c h a n )
C c l o u d = N e ( d s e n s + d p r o c + d t r a n s + α ( d b a n d , d p r o p ) )
Consider the transmission parameters of each edge node and channel parameters as in Table 3.
The cloud server is also limited to a certain number of connections to ensure better communication between the lower-level devices. The properties of the cloud server are also described in Table 3. As the number of devices connected to the cloud servers increases, congestion in the channel and buffer leads to data loss and network issues. When all the edge nodes are directly sending the data after processing, as per Equation (12), there occurs the chance of either link breakage or cloud server overload due to the reception of an enormous amount of data. On introducing an intermediate node between the edge and cloud, say fog node, there comes a level between the edge devices and cloud server for data processing and transmission. The fog node could prevent link breakage and reduce the delay in the network. So, introducing a fog node by including intermediate computations can resolve these issues. The number of fog nodes required depends on the requirements of edge nodes and cloud servers to achieve a congestion-free, non-lossy network. In the considered scenario, the necessary parameters for the fog node are shown in Table 3.
Let the total number of fog devices be N f . Then, the total capacity of the cloud server can be expressed in terms of fog node parameters using the Equations (13) and (14). So, the intermediate fog node could reduce the computation time and ease the processing and transmission delay, hence optimizing the complete communication network.
C c l o u d = N f ( d c o m p + d c h a n )
C c l o u d = N f ( d p r o c + d t r a n s + α ( d b a n d , d p r o p ) )
In order to optimize the network, a fixed number of edge nodes are connected to a single fog node, which, after the computations, will transmit to the cloud server. Let the number of edge nodes connected to a single fog node be N e f . Then, the capacity of the single fog node is given by Equations (15) and (16).
C f o g = N e f ( d c o m p + d c h a n )
C f o g = N e f ( d s e n s + d p r o c + d t r a n s + α ( d b a n d , d p r o p ) )
Considering the channel is ideal when edge nodes are sending data directly to the cloud server, having capacity C c is dependent on the number of edge nodes N e and the data rate of each edge node D e . Then the link will break if,
N e D e > C c
This is the limiting case when the edge nodes send data directly to the cloud server. The link breakage can be prevented by introducing additional intermediate nodes between the edge and cloud devices, the fog node. So, the number of fog nodes required depends on the number of lower-level edge nodes and the data rate of the edge devices for a fixed cloud server. The limiting case when multiple fog nodes are present can be expressed as
N f 1 D f 1 + N f 2 D f 2 + N f 3 D f 3 + . . . . . . + N f n D f n > C c
where, N f 1 , N f 2 , ... N f n are the intermediate fog nodes, D f 1 , D f 2 ,... D f n are the data rates of the intermediate nodes and C c is the capacity of cloud server. Considering the delay within the network, the proposed IoT-based wireless communication network and data packet flow are discussed in the following subsection.

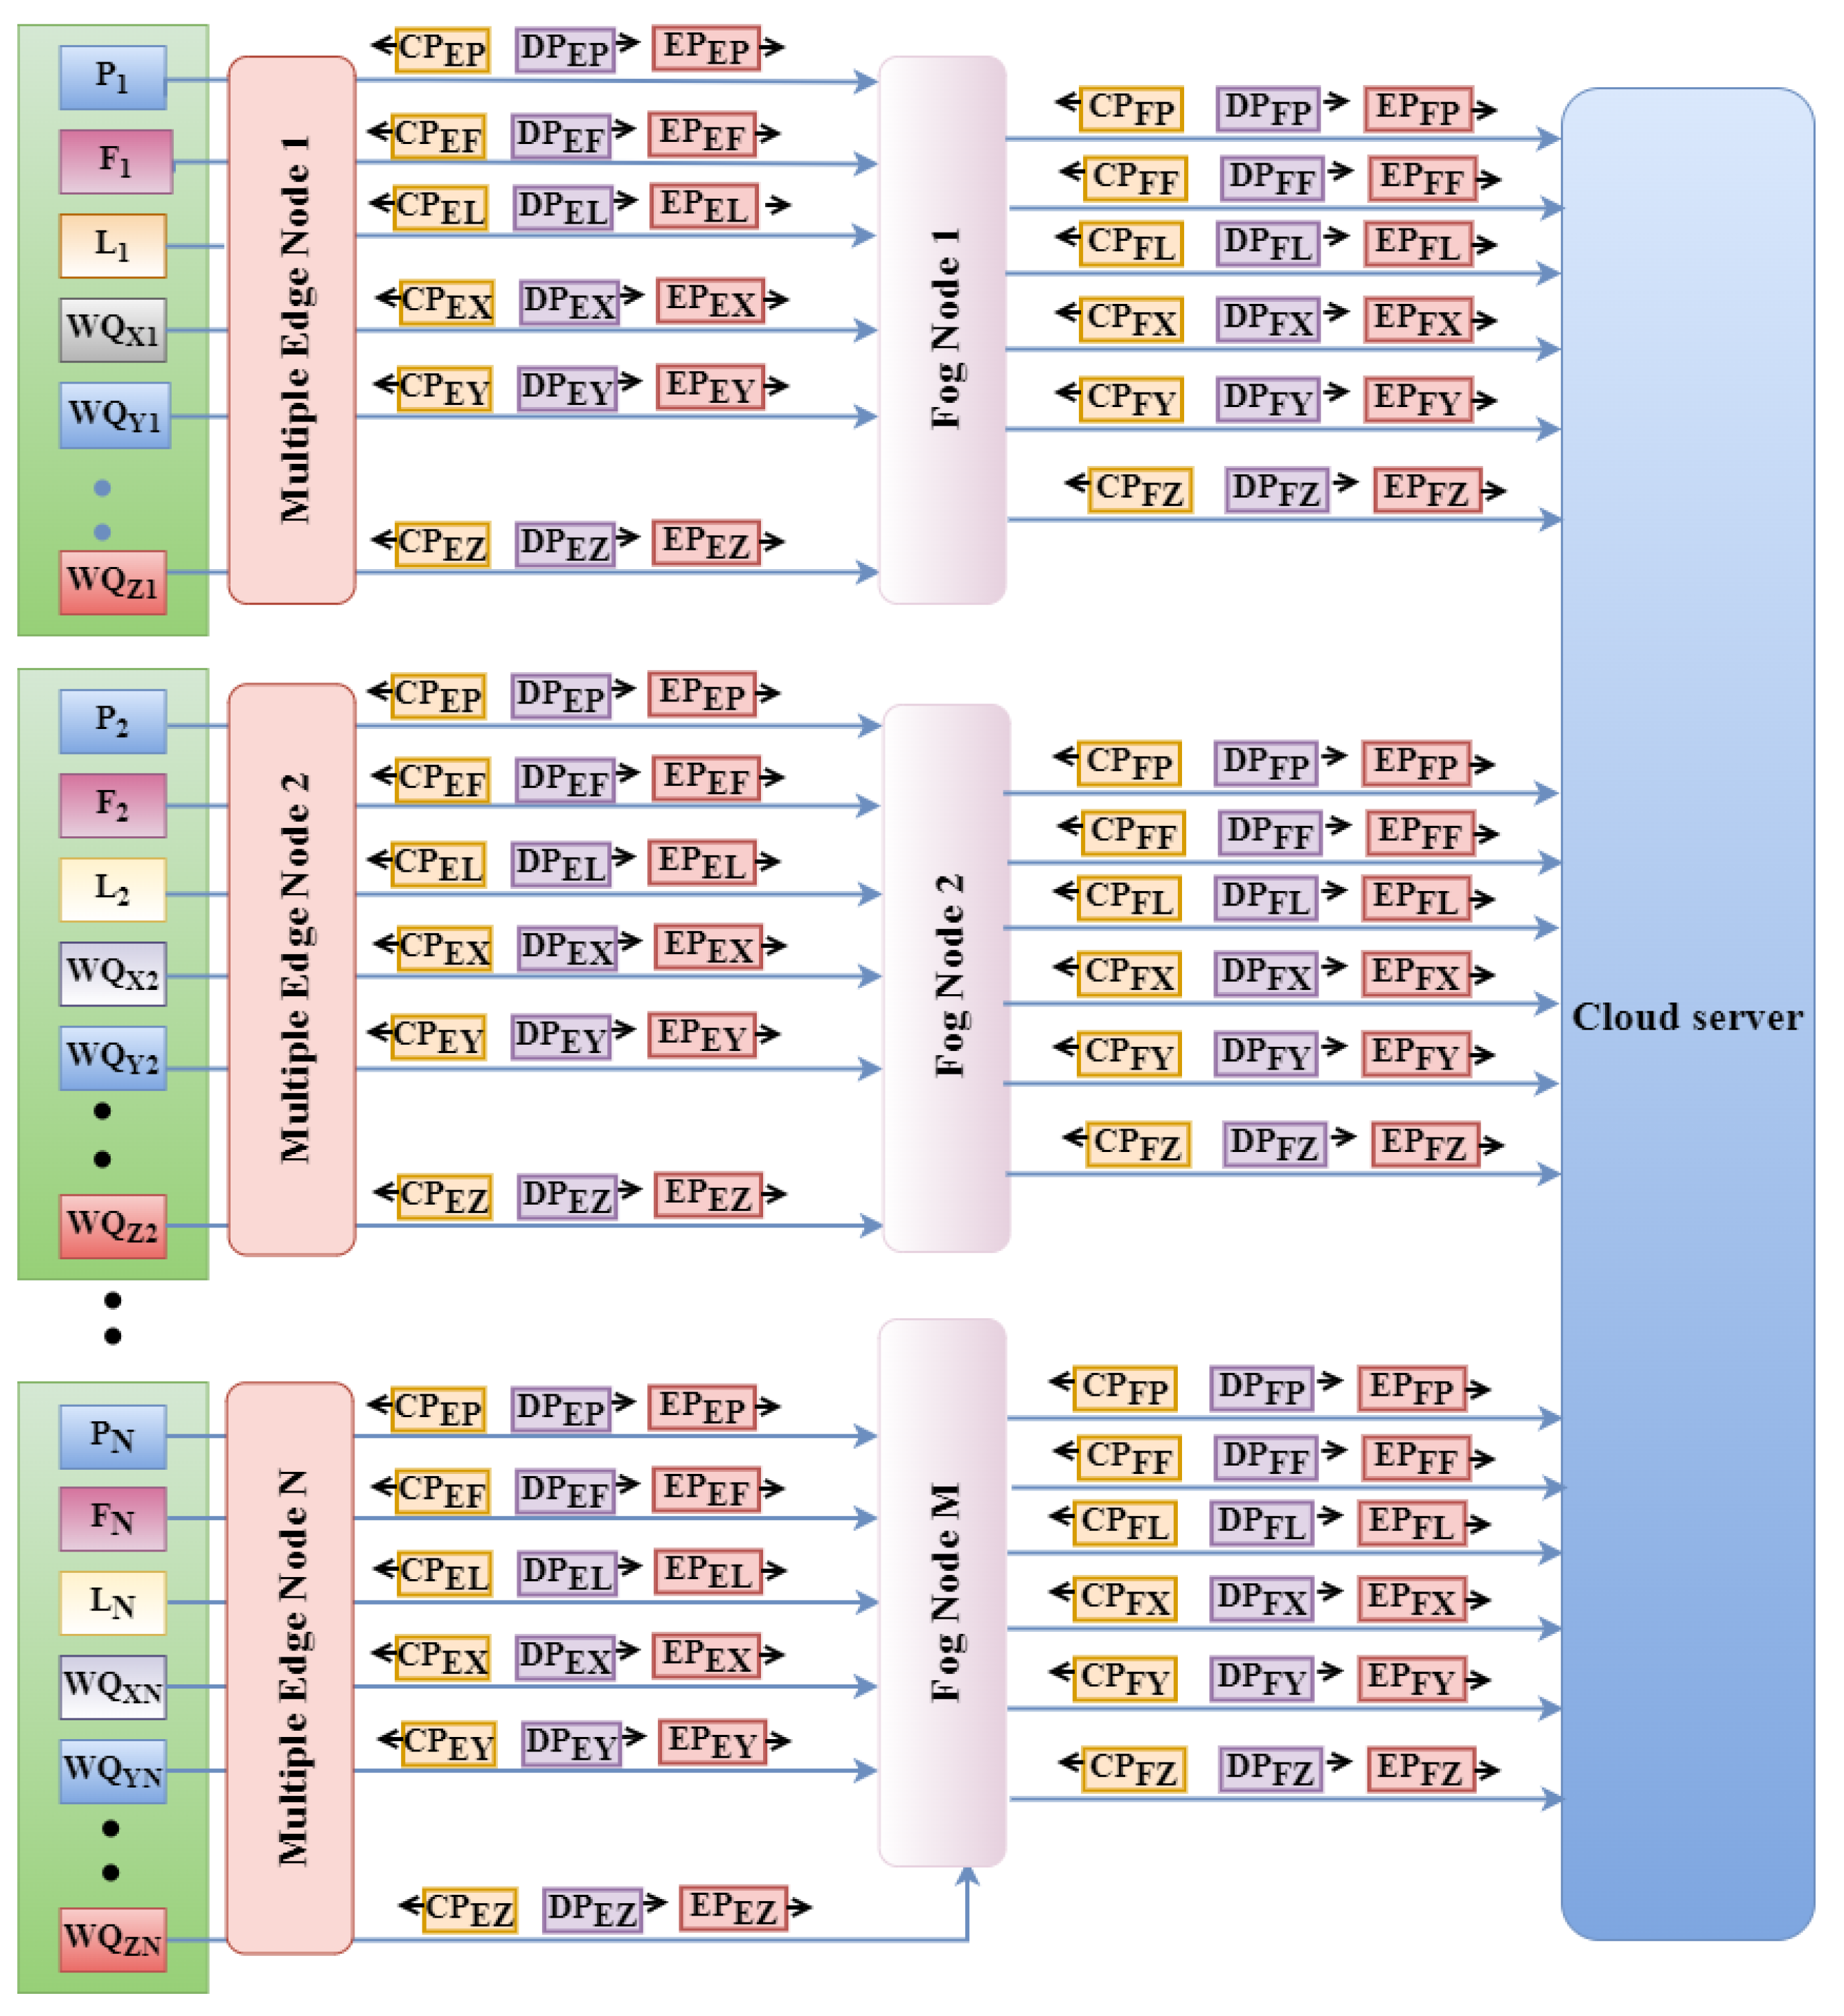
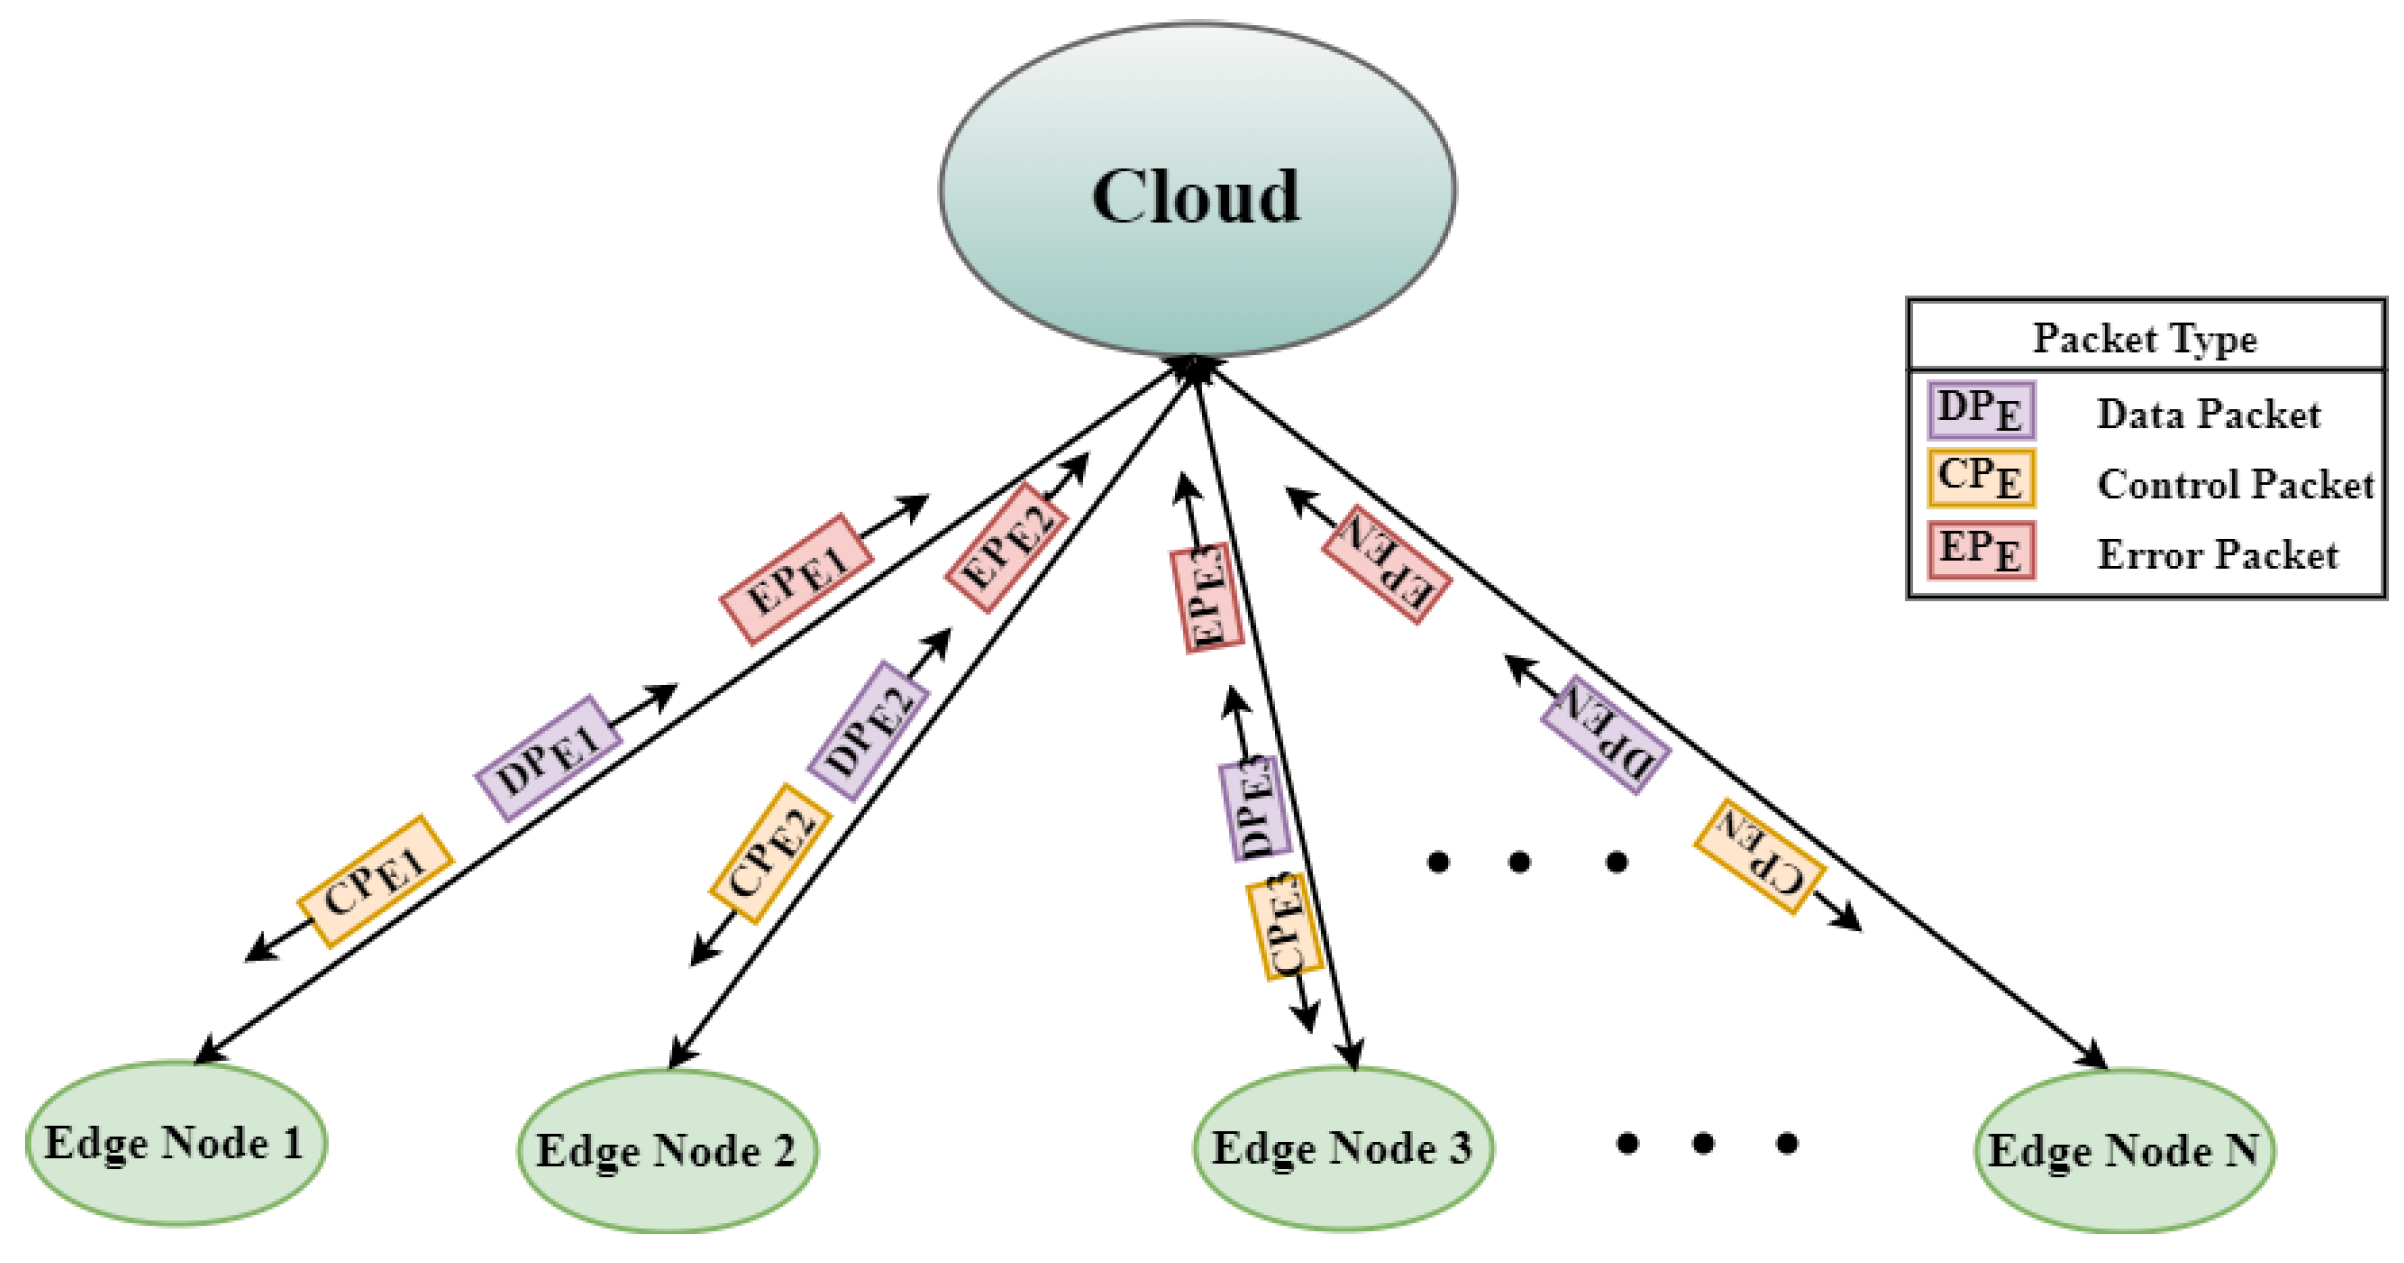
4.3.2. Packet Flow and Delay-Efficient Offloaded WDN Architecture

The IoT-enabled communication topology can be explained with the topology diagrams shown in Figure 7. The topology consists of three units—edge node, fog node, and cloud server. The edge node consists of a sensor unit and a communication unit. It is to be deployed at the data collection points near pipelines. There are multiple edge nodes. The data sent by the edge nodes after edge computation is sent to the fog nodes. The fog nodes, after fog computation, are sent to the cloud server. The cloud server is the monitoring station or the user interface, which is located far away from the communication unit.
The architecture is integrated with all the edge systems, fog nodes, and the cloud server in the Edakochi area. The major communication packets involved in the IoT-based communication network are the data packets, control packets, and error packets. The data flow diagram between the edge nodes and the cloud server is shown in Figure 8. The data packet serves the data from the different edge units, which contribute the data from PMS, FMS, LMS, and QMS. These sensors provide the digital signals corresponding to the analog measured values, which are then transmitted to the fog nodes. The control packet is for monitoring the efficiency of the packet transmission. The emergency alert messages are sent as packets from the edge devices to the fog or cloud server as control packets. The error packets are sent from the cloud/fog devices to the edge nodes, informing the functional disabilities. These packets are event-triggered. Similarly, the packet flow diagram between the edge and the cloud server by introducing an intermediate fog node is shown in Figure 9.
The Packet Flow Diagram of the IoT-enabled communication network topology with multiple fog nodes is shown in Figure 10. The main packets involved in the 3-layer hierarchy network consisting of edge network, fog network, and cloud network are the data packet, control packet, and error packet. The tabulation of the details of the different packets as per Figure 10 is shown in Table 4.

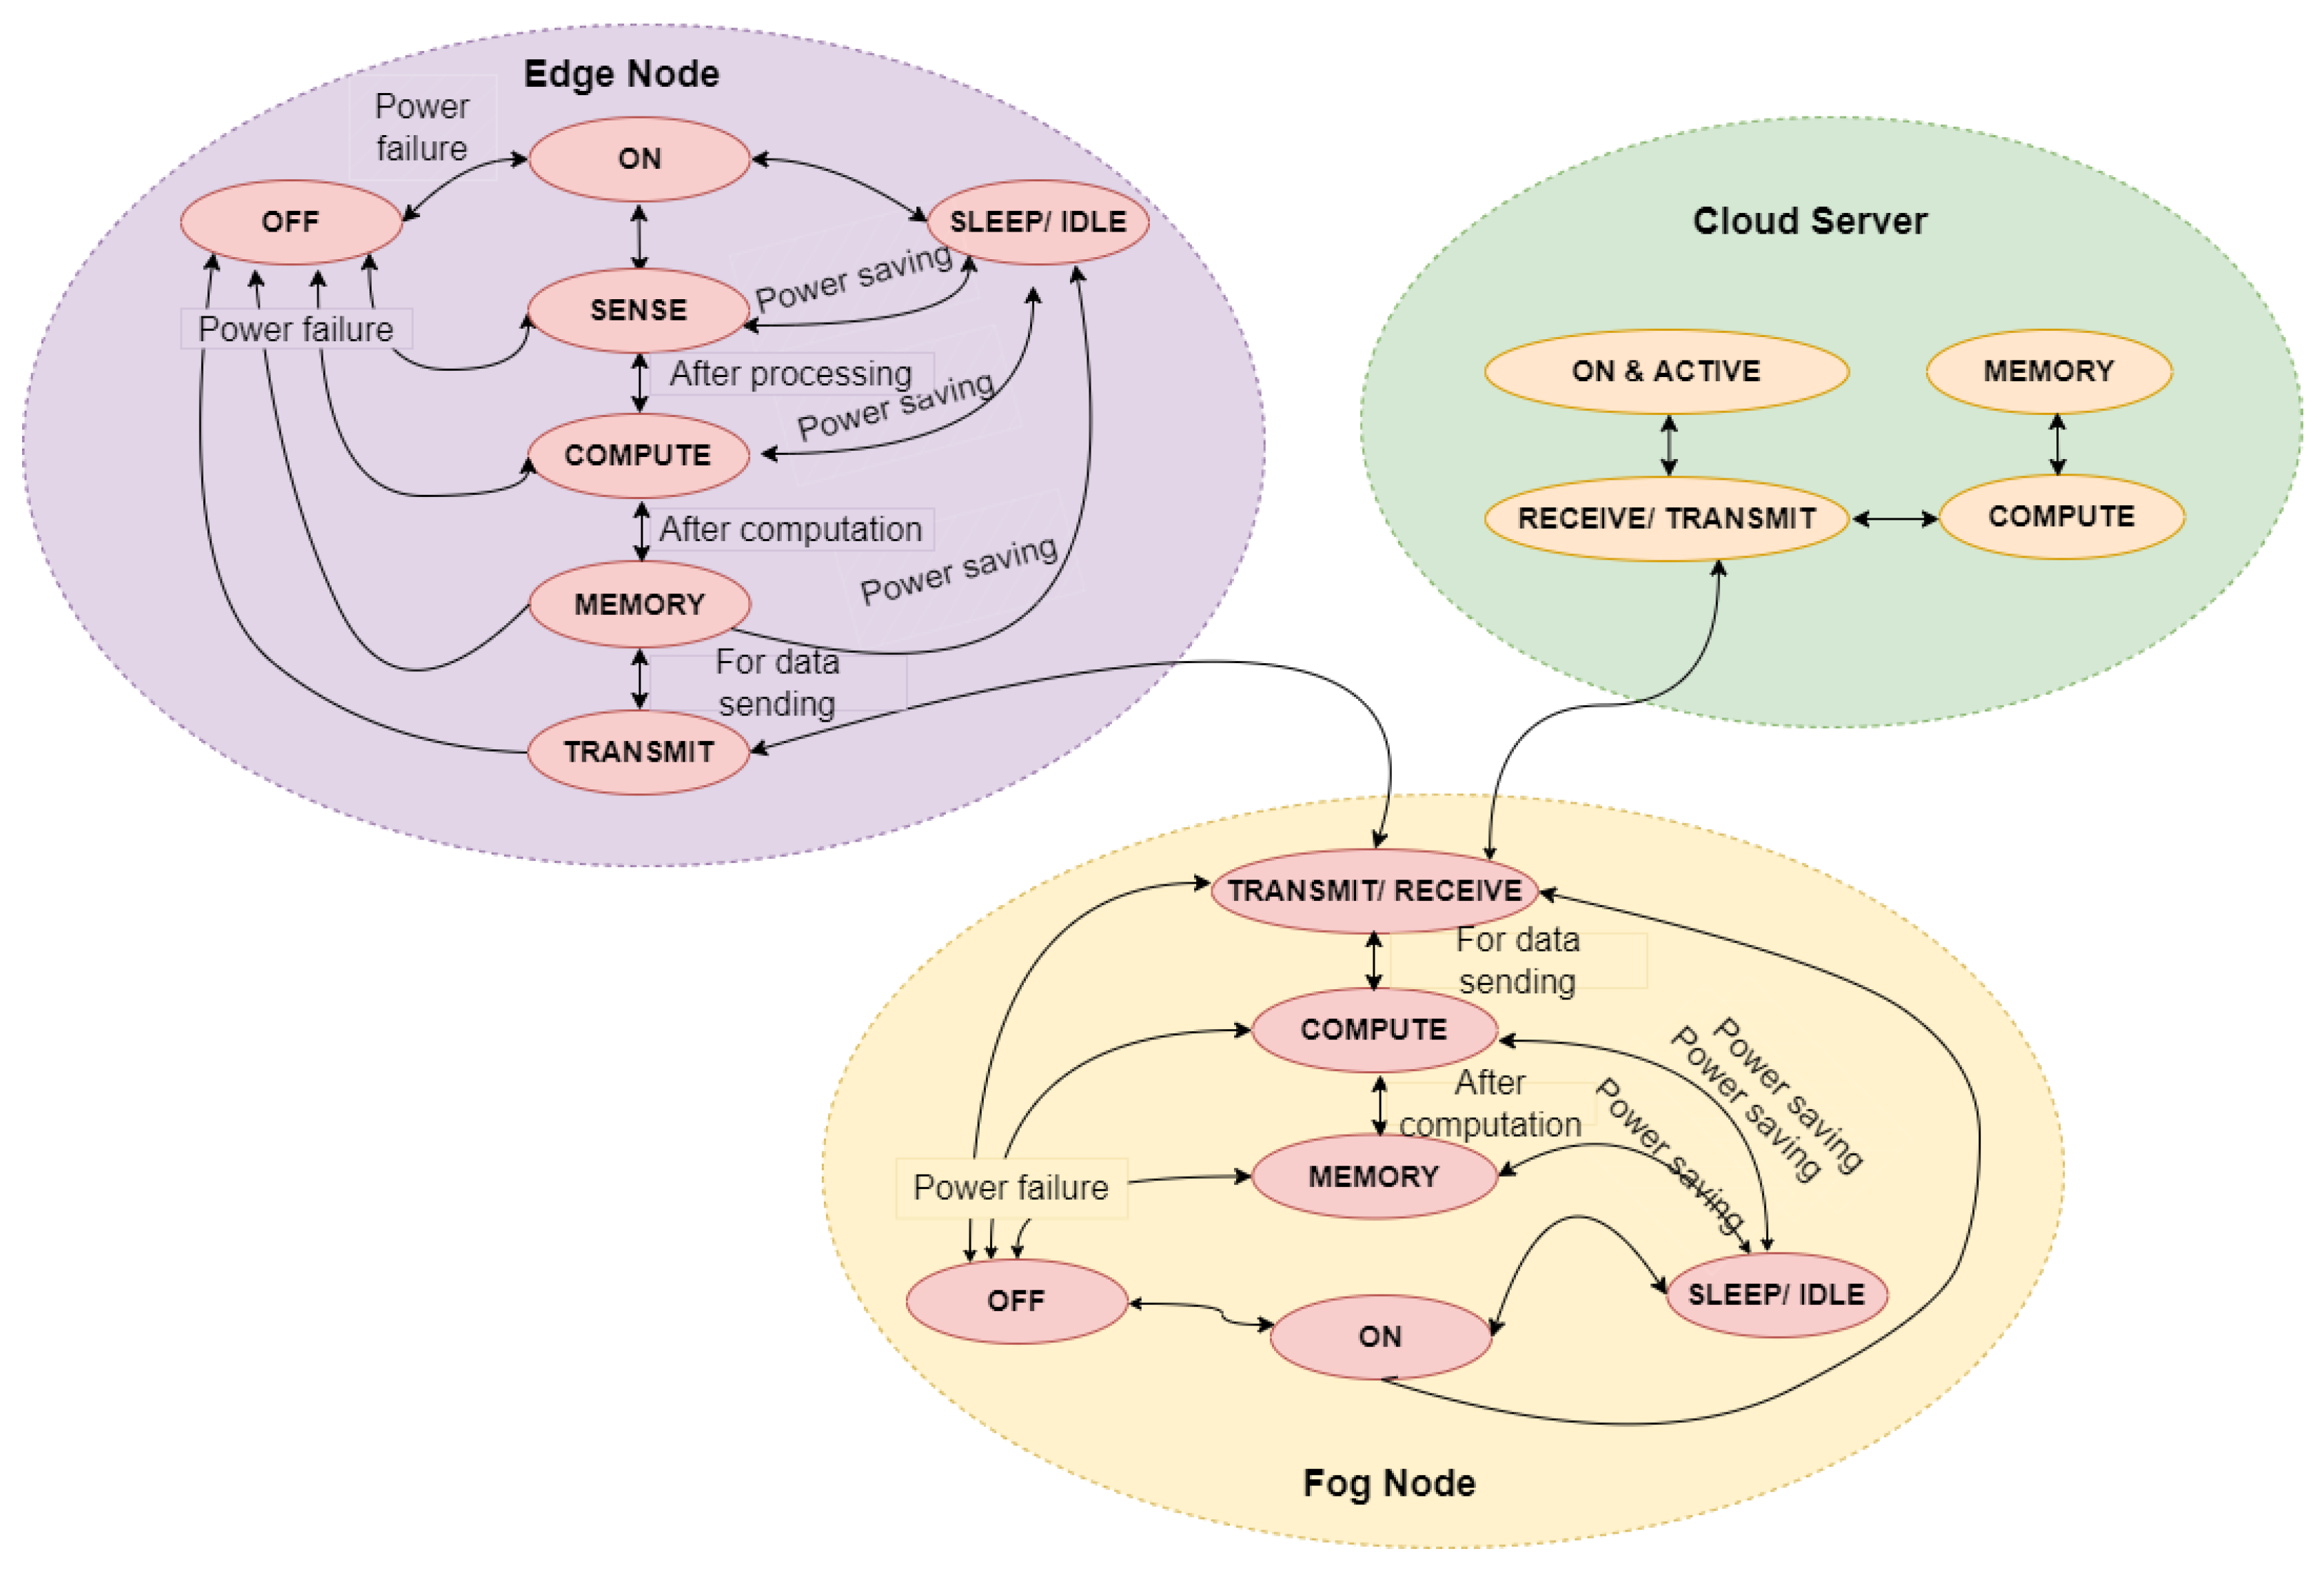
4.4. Energy Offloading for IoT-Enabled WDN

The path loss will increase the delay, and the delay in the network will, in turn, increase the node operating time and increase the number of re-transmissions. The problems created in the channels in the network will increase the packet loss, which leads to multiple re-transmissions. In sub-urban areas, due to channel dynamics and an increase in the number of obstructions, the transmitting power has to be increased in order to reduce delay, which in turn increases the energy of the network. But the objective is to Offload the energy of the network. These multiple re-transmissions will, in turn, increase the delay and energy. From Equations (7) and (8), the delay in the network could be calculated. As energy is a function of delay and time, from the equations of delay and by calculating the time, the energy required for the network could be calculated.
The energy of the communication network can be defined as the power utilization as a factor of time. When all the edge, fog, and cloud devices are powered, data transmission happens at equal time intervals, depending on the power availability. Such operation of the nodes will lead to a fast drain of the battery, so the energy usage has to be optimized. The energy usage can only be optimized by reducing the operating time without compromising the required transmissions. Energy optimization can be achieved by optimizing the energy consumption in the operation of the edge and fog devices by intelligently keeping the various devices in different operational states. The edge and the fog node are set to different states between the O N and O F F states like S L E E P / I D L E , A C T I V E , M O N I T O R , C O M P U T E , T R A N S M I T , etc., to reduce the energy consumption of the nodes. The state transition diagram of the complete nodes inter-connecting the edge, fog, and cloud is shown in Figure 11. The operation of each state is defined below:
  • O N : Operation state in which the IoT node is powered. It is the state with minimum power consumption.
  • O F F : Operation state in which the IoT node is not powered.
  • S L E E P / I D L E : Operation state in which the IoT node is in a temporary O F F state, even if the node is powered O N . The power consumption is the least in this state.
  • S E N S E : Operation state in which the IoT sensors are working - collecting the data from different sensors.
  • C O M P U T E : Operation state in which the IoT computations and processing are taking place after the sensor data collection.
  • M E M O R Y : Operation state in which the IoT sensor collected data are processed and stored in the memory unit.
  • T R A N S M I T : Operation state in which transmission is taking place. The radio is ON, and the antennas are active.
  • R E C E I V E : Operation state in which reception is taking place. The radio is ON, and the antennas are active.
The Offloading of the energy consumption of the different devices and thereby improving the device lifetime by considering different use case scenarios for energy offloading is discussed in the below sections.

4.4.1. Operational Strategy 1

Consider the case when all the edge and fog devices are in O N state; the transmission and reception are taking place every second. Then, let the power consumption at the state be P O N and the energy consumption be E O N .
E O N = P O N × t S E N S E
E S E N S E = P S E N S E × t S E N S E
E C O M P U T E = P C O M P U T E × t C O M P U T E
E T R A N S M I T / R E C E I V E = P T R A N S M I T / R E C E I V E × t T R A N S M I T / R E C E I V E
Then, the total energy consumption of the edge and fog nodes when both are active with the transmitting and receiving antennas always powered can be expressed as:
E T o t a l E d g e = E O N + E S E N S E + E C O M P U T E + E T R A N S M I T / R E C E I V E
E T o t a l F o g = E O N + E C O M P U T E + E T R A N S M I T / R E C E I V E

4.4.2. Operational Strategy 2

In this case, two more states are introduced: S L E E P / I D L E and M E M O R Y state. Here, the data collected by the sensors are processed and stored in the memory unit.
E S L E E P = P S L E E P × t S L E E P
E M E M O R Y = P M E M O R Y × t M E M O R Y
E T o t a l E d g e = E O N + E S L E E P + E S E N S E + E C O M P U T E + E M E M O R Y + E T R A N S M I T / R E C E I V E
E T o t a l F o g = E O N + E S L E E P + E C O M P U T E + E M E M O R Y + E T R A N S M I T / R E C E I V E

5. Algorithms Performed in the Communication Architecture

This section explains the algorithms for the random node introduced into the communication network. Here considering two instances:
  • To categorize the random node to edge, fog or miscellaneous category
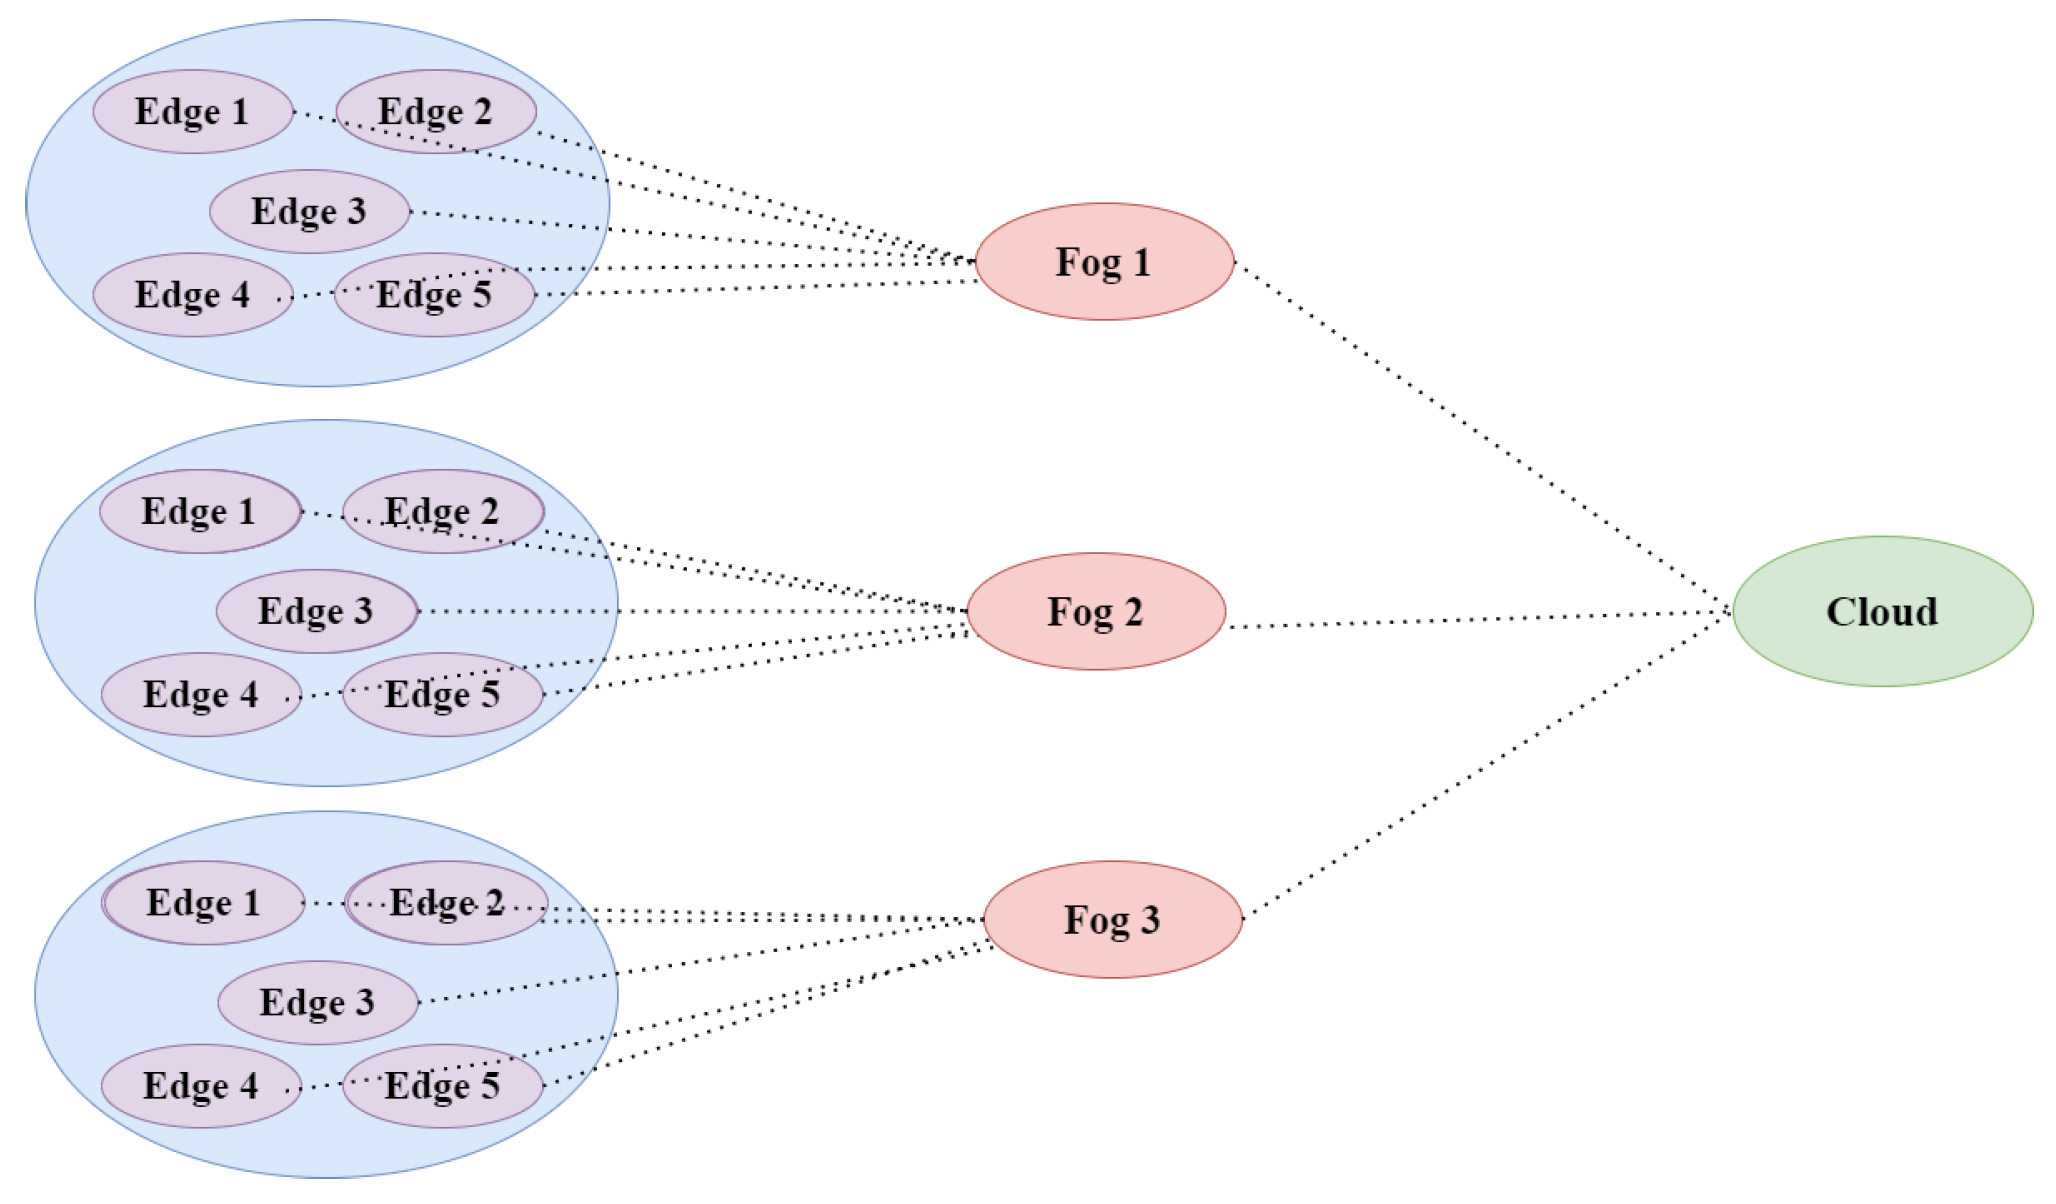
  • To allocate an edge node to a fog node for hierarchical communication

5.1. Node Categorizing Algorithm

The categorization of a random node to an edge node, fog node, or miscellaneous node can depend on several factors, such as the workload and requirements, the computing resources and capabilities available, and the network connectivity and latency of the random node. The Node categorizing algorithm based on offloading is presented in Algorithm 1.
Each of the candidate nodes has a unique identifier, and it has the capability to share self-capabilities and workload. At the initialization process, the node performs the self-discovery and computes its own properties such as processing power N c p u , memory N m e m , and storage capacity N s c . The node also calculates its offloading requirement by task assessment and proximity calculation. Furthermore, it compares the resources, node capabilities, and offloading requirements with the baseline properties and identifies the category.

5.2. Node Allocation Algorithm

The allocation of an edge node to a fog node would depend on several factors, such as the workload and requirements of the edge node, the computing resources and capabilities of the available fog nodes, and the network connectivity and latency between the edge node and the candidate fog nodes. The Node categorizing algorithm based on offloading is presented in Algorithm 2.
Algorithm 1 Node categorizing algorithm based on offloading
Input: CandidateNode C N - Random Node
Output: Categorize the random node into EdgeNode, FogNode or MiscellaneousNode E n , F n , o r M n
1:
Initialization: Discovery process of capabilities and the tasks it intends to offload
2:
Node capabilities N c a p : Processing power N c p u , Memory N m e m , storage capacity N s c
3:
Network Communications N c o m : Bandwidth N b w , Data rate N d r , Latency N l a t
4:
Energy efficiency N e e : Power source N p s , Battery life N b a t , Energy consumption N s c
5:
Location N l o c : Location of the node N l o c
6:
Task Assessment N t a : Task complexity N t a c o m p , N c o m
7:
Proximity N p r o x y : Signal Strength N s s , Network topology N n t
8:
for  C N in A l l _ N o d e : do
9:
      WHILE: E l a t F l a t
10:
    Compute: N c a p , N c o m , N e e N l o c , N t a and N p r o x y
11:
         IF  N c a p E c a p && N c o m E c o m && N e e E e e && N l o c E l o c && N t a E t a && N p r o x y E p r o x y
12:
    Then  C N E n
13:
         ELSE IF  N c a p F c a p && N c o m F c o m && N e e F e e && N l o c F l o c && N t a F t a && N p r o x y F p r o x y
14:
         ELSE IF  C N M n
15:
end for
16:
return Result  E n or F n or M n
Algorithm 2 Edge Node to Fog allocation algorithm
Input: EdgeNode E i
Output: FogNode F j
1:
Initialize the network with ‘N’ edge nodes E 1 , E 2 . . , E N , and ‘M’ fog nodes F 1 , F 2 . . , F M number of levels P L .
2:
Input: CandidateEdgeNode C E N with Task ( T o f f )
3:
Task Evaluation C E N - Resource requirement and latency sensitivity for the task.
4:
Proximity Calculation: Calculate C E N s s , C E N n t
5:
Task-Fog Node Compatibility Assessment:
6:
for  C E N in FogNodes: do
7:
     T o f f && C E N n t && C E N n t
8:
    Then: BestFogNode = F j
9:
    return  F j
10:
end for

6. Numerical Analysis and Discussions

The numeric analysis for the communication network with delay and energy Offloading is discussed in the below subsections.

6.1. Delay-Efficient Offloading

The numerical validation of the delay Offloading model is as follows: Let the capacity of the cloud server be 1 Gbps. Consider that ten edge nodes are connected to the cloud server, each having a data rate of 100 Mbps/s. So, as per Equation (18),
N e D e = 10 × 100 MBps / s = 1000 MBps = 1 GBps
So, the cloud server cannot accommodate further edge nodes as it has reached the capacity of the server. In this case, we introduce fog nodes for further computations, which reduces the transmitting data content, saving the cloud capacity. Similarly, the capacity of the cloud server using intermediate fog nodes for computations as per Equation (29) can be validated as follows. Consider there are 15 edge nodes and three fog nodes. Five edge nodes will send the data to each corresponding fog node, and after fog, computations are sent to the cloud server as shown in Figure 12.
Let the data rate of the cloud server be 1.5 GBps, and there are three edge nodes having data rate 500 MBps.
N f 1 D f 1 = 3 × 500 MBps / s = 1500 MBps = 1.5 GBps
So if the limiting data rate or number of devices connected is crossed above the limit, link breakage will occur. Hence, there arises the need to increase the capacity or optimize the fog or edge devices in order to prevent link breakage.
Consider the example scenario shown in Figure 12. Assume that the delay gets doubled with an increase in the number of nodes in the network. Let the delay be 260 μ s, 100 μ s, and 30 μ s when the edge nodes are directly connected to the cloud server, edge nodes are connected to the cloud server through a single fog node, and edge nodes are connected to the cloud server through two fog nodes respectively. The delay within the network is shown in Figure 13.

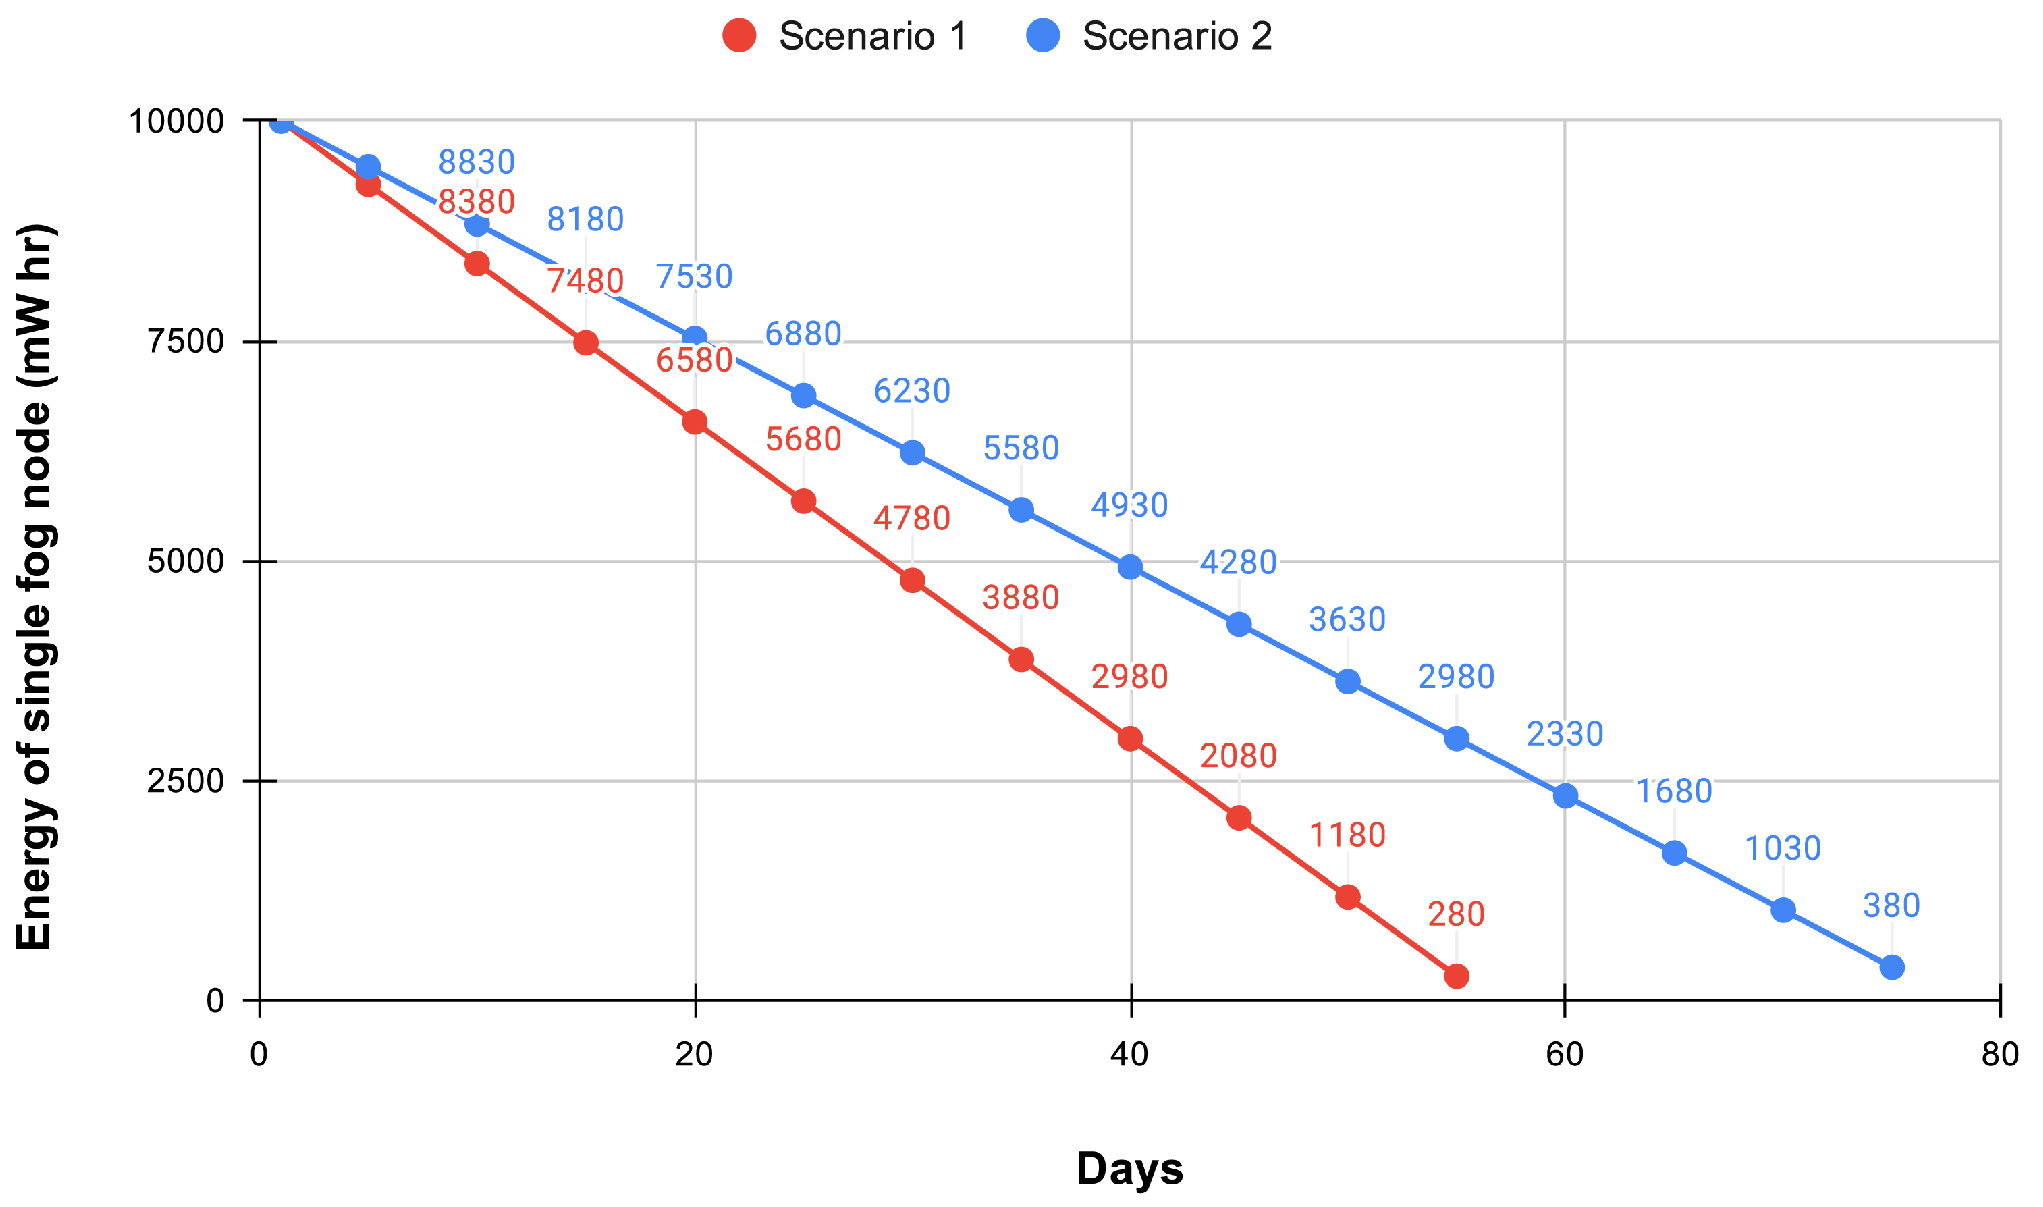
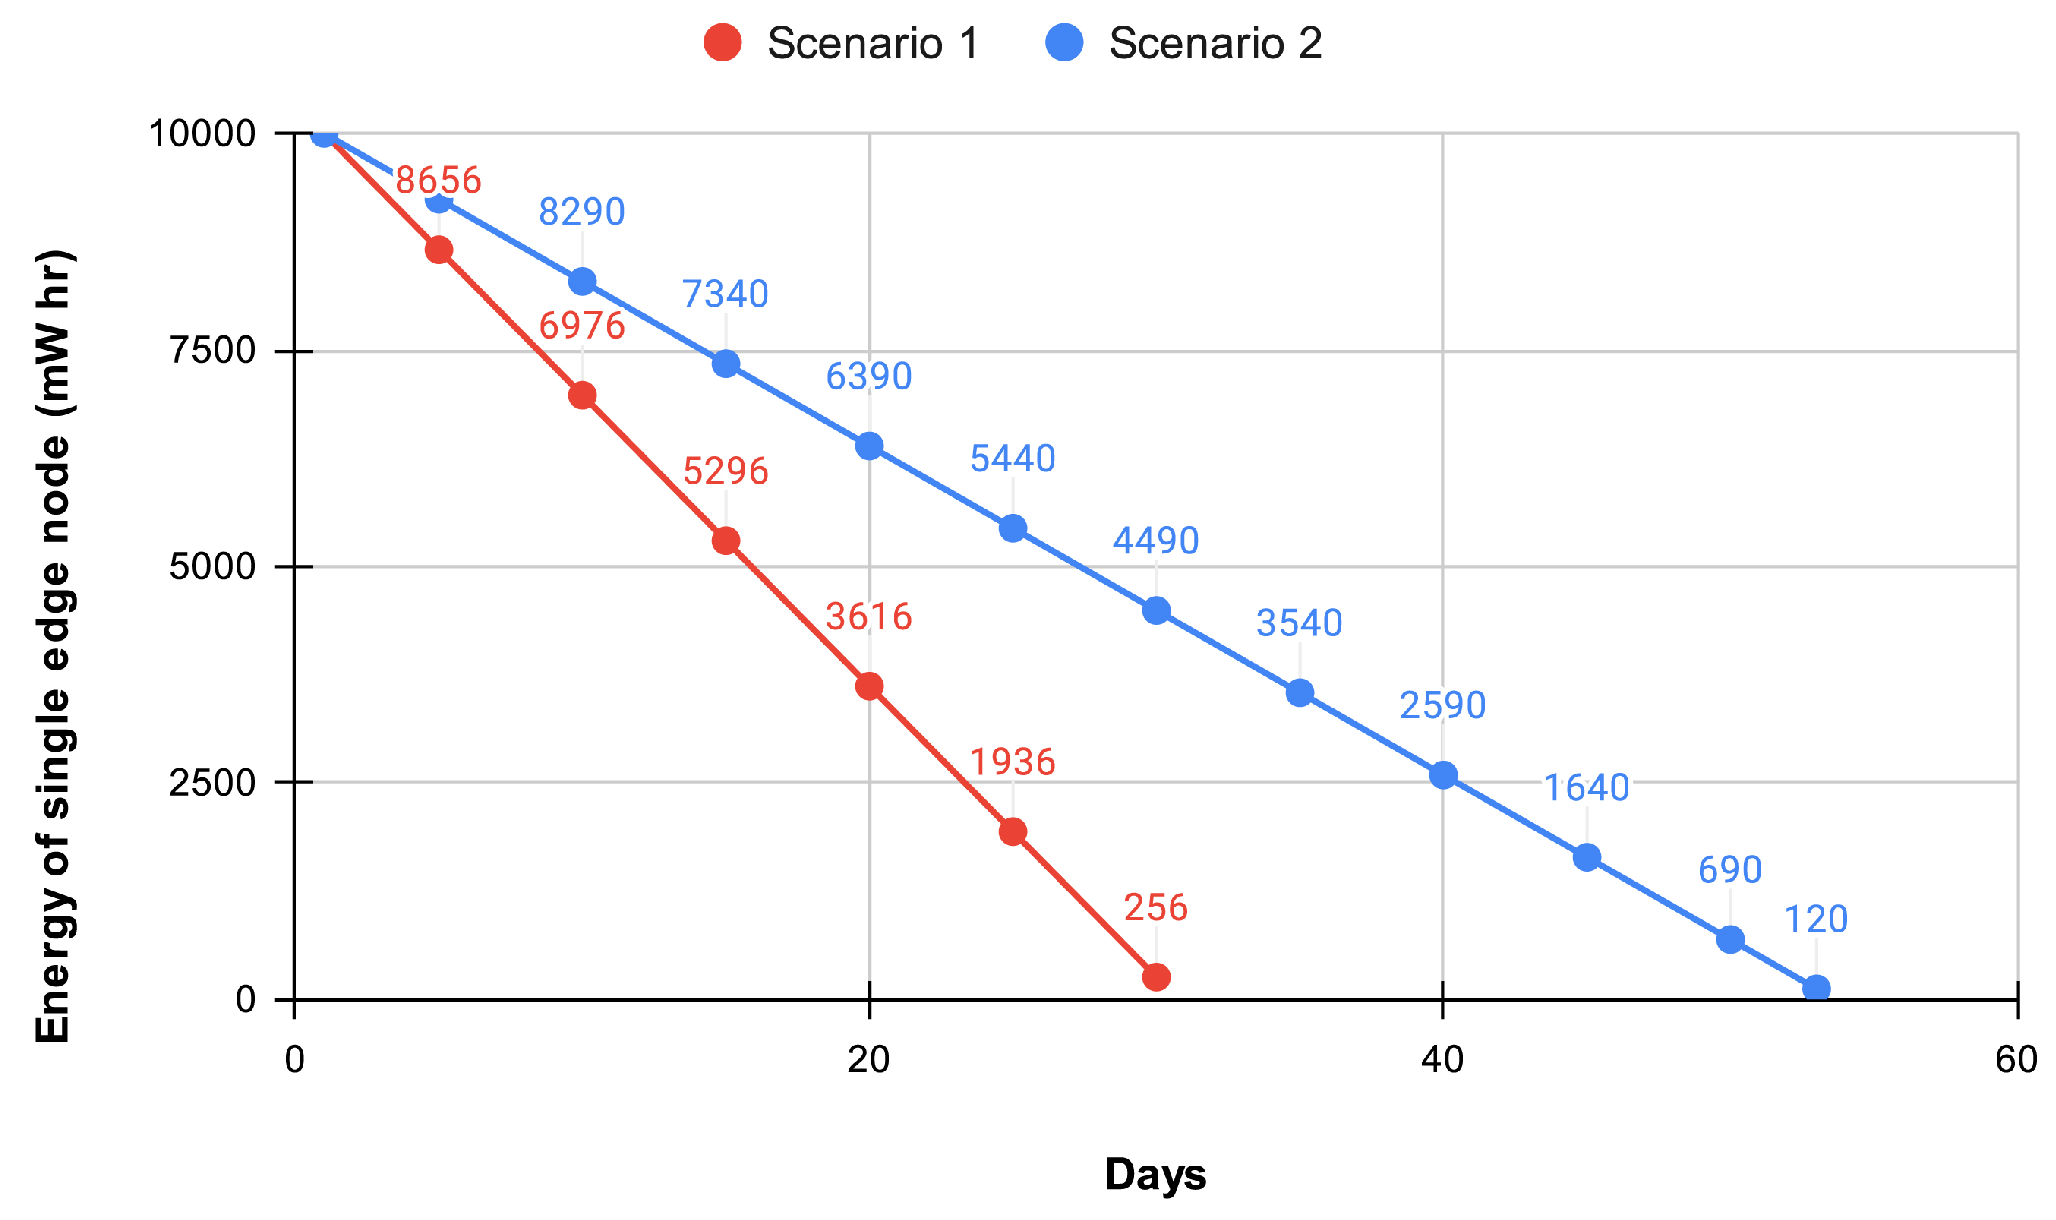
6.2. Energy-Efficient Offloading

Assume the total energy available is 10,000 mWh. Using the data of power consumption and operating time for a day in different operational modes from Table 5, the energy and lifetime of the different sensor units are calculated.

6.2.1. Strategy 1

A per Equation (24), E T o t a l of Edge Node for S c e n a r i o 1 = 0.5 × 24 + 4 × 18 + 2 × 18 + 12 × 18 = 336 mWh. No. of days the edge node will work in battery power s per Scenario 1 = 10,000 /336 = 29.7 days. E T o t a l of Fog Node for S c e n a r i o 1 = 0.5 × 24 + 2 × 12 + 12 × 12 = 180 mWh. No. of days the fog node will work in battery power as per Scenario 1 = 10,000 /180 = 55.5 days.

6.2.2. Strategy 2

A per Equation (28), E T o t a l of Edge Node for S c e n a r i o 2 = 0.5 × 24 + 4 × 12 + 2 × 10 + 12 × 4 + 0.5 × 12 + 1 × 8 + 12 × 4 = 190 mWh. No. of days the edge node will work in battery power as per Scenario 2 = 10,000/190 = 52.6 days. E T o t a l of Fog Node for S c e n a r i o 2 = 0.5 × 24 + 2 × 10 + 12 × 4 + 0.5 × 12 + 1 × 8 + 12 × 3 = 130 mWh. No. of days the fog node will work in battery power as per Scenario 2 = 10,000 /130 = 76.9 days.
The energy will gradually decrease linearly with an increase in the number of days for edge and fog nodes. The decrease for both edge and fog nodes is shown in Figure 14 and Figure 15. From this, it can be easily understood that the introduction of more operational states could reduce power consumption and save more energy and lifetime.
Consider the network where there are 15 edge devices connected to the cloud server via three fog nodes.
The total energy of the network is given by the Equation (31)
E T o t a l = E e d g e × N u m b e r   o f   e d g e   d e v i c e s + E f o g × N u m b e r   o f   f o g   d e v i c e s
Calculating the total energy of the network as per scenario 1 will be 5580 mWh, and scenario 2 will be 3240 mWh. Assuming that the network contains 18 nodes, each having a battery capacity of 10,000 mWh. The depleting energy of the network for both scenarios is shown in Figure 16. From the graph, we could clearly analyze the depletion in energy. The battery capacity, as per scenario 1 could support only 33 days, whereas scenario 2, having more states, could provide battery backup up to 55 days. Thus the network implemented as per scenario 2 could provide 40% more energy efficiency compared to scenario 1.

7. Results and Discussions

The IoT-integrated water distribution system with optimization of delay and energy based on the propagation model is discussed in the work. The work is initiated by identifying the different research challenges within an existing WDN and has included different sensor systems at different levels of the WDN. IoT communication entities such as edge, fog and cloud nodes were introduced to each level to monitor the WDN. The following procedures were introduced to implement a real-world communication model for this site-specific IoT-integrated WDN system, which could be applicable to any site-specific IoT-integrated communication model. The study area chosen is Kochi in India. The land cover classification for the study area is developed using the MLC-supervised algorithm. Three major categories have been derived from the supervised classification: water, vegetation, and built-up areas. Since our study area is a secondary metropolitan city, upon analyzing the land cover classification and the propagation models, the propagation model that fits the application is the Hata-Okumura model. The derived Hata-Okumura path loss model for small and medium-sized urban areas as per Equation (4) is applied. This path loss model depends upon the height of the transmitting and receiving antennas, gain of the antennas, frequency of transmission, antenna correction factor and the distance between the transmitting and receiving devices. The same scenario is modeled using the simulation software ‘Radio Mobile Freeware by VE2DBE’. The simulation results show successful communication with 70% of reliability and 161.50 dB system gain enabling enough network coverage and connectivity required for the specific application.
The delay-efficient for the IoT-enabled WDN is derived considering the wireless propagation model based on the study area. The delay in the communication network depends on the propagation model, path loss and other network parameters. We derived the equation for the optimized number of edge, fog, and cloud nodes using operating frequencies, transmitting power, antenna gain, antenna height, number of available channels, data rate, signal strength and bandwidth. Furthermore, the IoT-enabled communication topology as in Figure 7, proposes concerning the delay-efficient offloading for the study area. The communication network serves the WDN for various challenges. Three types of communication packets are designed to address these challenges: data packets, control packets, and error packets. The communication packet flow between different IoT entities in the area are also defined in Figure 8, Figure 9 and Figure 10. Various communication packets such as data packets, control packets and error packets are defined based on the characteristics and communication entities of the network.
In order to achieve efficient transmission, optimization of the delay and energy within the propagation model has to be achieved. Energy-efficient offloading has been brought in by considering the different operation states and comparing different scenarios to find the best-suited scenario for the specific study area. Energy optimization involves the transmission of signals starting from lower power and increasing the power untill it is received at the cloud server. However, upon increasing the number of retransmissions, the delay in receiving the data increases. So, optimization has to be bought in between the ‘delay and path loss’ and ‘delay and energy’ for the efficient working of the complete IoT-based system.
Considering all the parameters of the specific study area, path loss models, delay-efficient and energy-efficient offloading, algorithms for node categorisation, and edge-to-fog node allocation have been developed. The developed algorithms are analyzed and numerically validated. The comparison results from the numeric models show that the best operating scenario can be implemented. Based on these approximations, the optimum placement of the fog nodes linked with the edge nodes and cloud server could be achieved. The delay and energy-optimized high-level IoT-enabled communication network architecture is shown in Figure 17. The same process discussed in this work can be utilized in building the IoT-enabled communication network for any site.

8. Conclusions

The paper discusses the requirement for an IoT-based water distribution system and presents the delay and energy-efficient offloading strategies for the network in Smart Cities. Considering the design constraints in designing the IoT-enabled WDN, the IoT-enabled WDN is designed. As a case study of IoT-enabled WDN, the network in Kochi, Kerala, India is considered. Within the selected study area, the land use, land cover, and wireless propagation model within the area are analyzed. Based on the analysis results, the delay and energy within the WDN are efficiently offloaded, considering multiple operational scenarios. The different algorithms involved in the communication architecture, like the node categorizing algorithm and node allocation algorithm, are explained in detail. The numerical analysis of delay-efficient and energy-efficient offloading considering different operational scenarios are also presented in detail. Finally, considering all the parameters, the IoT-enabled communication network architecture for the WDN is designed.

Author Contributions

Conceptualization, N.K.V., A.S., A.R.D. and M.V.R.; methodology, N.K.V. and A.S.; software, N.K.V. and A.S.; validation, A.S., A.R.D. and M.V.R.; formal analysis, N.K.V., A.S. and A.R.D.; investigation, N.K.V., A.S., A.R.D. and M.V.R.; resources, A.R.D. and M.V.R.; data curation, N.K.V. and A.S.; writing—original draft preparation, N.K.V. and A.S.; writing—review and editing, N.K.V., A.S., A.R.D. and M.V.R.; visualization, N.K.V. and A.S.; supervision, A.R.D. and M.V.R.; project administration, N.K.V. and A.S.; funding acquisition, N.K.V. All authors have read and agreed to the published version of the manuscript.

Funding

This research was funded by the Department of Science & Technology (DST), Water Technology Initiative-National Consortia on Urban Water System (UWS) with project number: DST/TM/EWO/WTI/2K19/UWS-03(G2).

Institutional Review Board Statement

Not applicable.

Informed Consent Statement

Not applicable.

Data Availability Statement

Data are contained within the article.

Acknowledgments

We are grateful to Sri Mata Amritanandamayi Devi (Amma), for guidance and providing us the inspiration and motivation to carry out this work. This research is done under the Project “Fast forward to SDG6: Acceptable and affordable water in secondary Indian cities (4WARD)”, supported by the Department of Science & Technology (DST), Water Technology Initiative-National Consortia on Urban Water System (UWS) with project number: DST/TM/EWO/WTI/2K19/UWS-03(G2). We thank every member of the 4WARD Project Team for their support. We also thank the Kerala Water Authority (KWA) team for their support and guidance.

Conflicts of Interest

The authors declare no conflict of interest.

Abbreviations

The following abbreviations and symbols are used in this manuscript:
IoTInternet of Things
ICTInformation and Communications Technology
M2MMachine-to-Machine
WDSWater Distribution System
WTPWater Treatment Pant
PMSpressure monitoring sensor
PMSPressure monitoring Sensor
LMSFlow monitoring sensor
FMSFlow Monitoring Sensor
QMSQuality Monitoring Sensors
QGISQuantum Geographic Information System
SCPSemi-Automatic Classification
MLCMaximum Likelihood Supervised Classification
LULCand Use Land Cover
FSTLFree-Space Transmission Loss
P r Received power
P t Transmitted power
G t Gain of transmitting antenna
G r Gain of receiving antenna
λ wavelength
dDistance between transmitting and receiving antennas
LTransmission loss
d k m Distance on Kilometer
L U Path loss in Urban areas
h b Height of base station antenna (m)
h m Height of mobile antenna (m)
fFrequency of transmission (MHz)
C H Antenna height correction factor (dB)
η Spectral efficiency of the wireless link of the edge device
δ Product of losses in the wireless channel
e i Edge node
i Fog node
P r j Received power at the fog node
P n 0 Noise power spectral density
P t i i Transmission power required from the edge node e i to fog node f i through the link j
P r j Received power at the fog node i
θ SIR threshold
D τ Total delay
D p r o p Propagation delay
D t Transmission delay
D p r o c Processing delay
D q Queuing delay
BChannel bandwidth
C j i i Transmission channel C j i i to the e i to the f i
b i Size of the data
T R Transmission rate
MMessage length
d θ The channel access delay
f m i Fog memory
f c f i Clock frequency
f p c i Fog processing capacity
α The constant delay parameter for the propagation delay
d c o m p The total delay in the communication network of a single node
d s e n s The sensing delay of a single node
d p r o c The processing delay of a single node
d t r a n s The transmission delay of a single node
d c h a n The channel delay
d b a n d the delay due to bandwidth issues
d p r o p the delay due to propagation effects
N e the total number of edge devices
C c l o u d The total capacity of the cloud server
N f The total number of fog devices
C c cloud server capacity
D e Data rate of each edge node
N f 1 , N f 2 , ... N f n The intermediate fog nodes
D f 1 , D f 2 ,... D f n The data rates of the intermediate nodes
O N The edge and fog devices are in ON state and the transmission and reception are taking place every second
P O N The power consumption state
E O N The energy consumption state
t S E N S E Sensing time
E S E N S E Sensing energy
P S E N S E Sensing power
E C O M P U T E Computation energy
P C O M P U T E computation power
t C O M P U T E Computation time
E T R A N S M I T / R E C E I V E Transmit/Receive energy
P T R A N S M I T / R E C E I V E Transmit/Receive power
t T R A N S M I T / R E C E I V E Transmit/Receive time
E T o t a l E d g e The total energy consumption of the edge
E T o t a l F o g The total energy consumption of the fog
E S L E E P Sleep energy
P S L E E P Sleep power
t S L E E P Sleep time
E M E M O R Y Storage energy
P M E M O R Y Storage power
t M E M O R Y Storage time

References

  1. Loucks, D.P.; Beek, E.v. Water resources planning and management: An overview. In Water Resource Systems Planning and Management; Springer: Cham, Switzerland, 2017; pp. 1–49. [Google Scholar]
  2. Brentan, B.; Meirelles, G.; Luvizotto, E., Jr.; Izquierdo, J. Hybrid SOM+ k-Means clustering to improve planning, operation and management in water distribution systems. Environ. Model. Softw. 2018, 106, 77–88. [Google Scholar] [CrossRef]
  3. Rathore, M.M.; Ahmad, A.; Paul, A.; Rho, S. Urban planning and building smart cities based on the internet of things using big data analytics. Comput. Netw. 2016, 101, 63–80. [Google Scholar] [CrossRef]
  4. Cosgrove, W.J.; Loucks, D.P. Water management: Current and future challenges and research directions. Water Resour. Res. 2015, 51, 4823–4839. [Google Scholar] [CrossRef]
  5. Chettri, L.; Bera, R. A comprehensive survey on Internet of Things (IoT) toward 5G wireless systems. IEEE Internet Things J. 2019, 7, 16–32. [Google Scholar] [CrossRef]
  6. Mehmood, Y.; Ahmad, F.; Yaqoob, I.; Adnane, A.; Imran, M.; Guizani, S. Internet-of-things-based smart cities: Recent advances and challenges. IEEE Commun. Mag. 2017, 55, 16–24. [Google Scholar] [CrossRef]
  7. Velayudhan, N.K.; Pradeep, P.; Rao, S.N.; Devidas, A.R.; Ramesh, M.V. IoT-enabled water distribution systems—A comparative technological review. IEEE Access 2022, 10, 101042–101070. [Google Scholar] [CrossRef]
  8. Laya, A.; Wang, K.; Widaa, A.A.; Alonso-Zarate, J.; Markendahl, J.; Alonso, L. Device-to-device communications and small cells: Enabling spectrum reuse for dense networks. IEEE Wirel. Commun. 2014, 21, 98–105. [Google Scholar] [CrossRef]
  9. Sharma, S.K.; Wang, X. Live data analytics with collaborative edge and cloud processing in wireless IoT networks. IEEE Access 2017, 5, 4621–4635. [Google Scholar] [CrossRef]
  10. Firouzi, F.; Farahani, B.; Marinšek, A. The convergence and interplay of edge, fog, and cloud in the AI-driven Internet of Things (IoT). Inf. Syst. 2022, 107, 101840. [Google Scholar] [CrossRef]
  11. Venkatesan, V.K.; Izonin, I.; Periyasamy, J.; Indirajithu, A.; Batyuk, A.; Ramakrishna, M.T. Incorporation of Energy Efficient Computational Strategies for Clustering and Routing in Heterogeneous Networks of Smart City. Energies 2022, 15, 7524. [Google Scholar] [CrossRef]
  12. Mavromoustakis, C.X.; Mukherjee, M.; Mastorakis, G.; Song, H.; Gorlatova, M.; Aazam, M. Guest Editorial Special Issue on Emerging Trends and Challenges in Fog Computing for IoT. IEEE Internet Things J. 2020, 7, 4155–4159. [Google Scholar] [CrossRef]
  13. Minoli, D.; Sohraby, K.; Occhiogrosso, B. IoT considerations, requirements, and architectures for smart buildings—Energy optimization and next-generation building management systems. IEEE Internet Things J. 2017, 4, 269–283. [Google Scholar] [CrossRef]
  14. Soundararajan, R.; Stanislaus, P.M.; Ramasamy, S.G.; Dhabliya, D.; Deshpande, V.; Sehar, S.; Bavirisetti, D.P. Multi-channel assessment policies for energy-efficient data transmission in wireless underground sensor networks. Energies 2023, 16, 2285. [Google Scholar] [CrossRef]
  15. Bagchi, S.; Abdelzaher, T.F.; Govindan, R.; Shenoy, P.; Atrey, A.; Ghosh, P.; Xu, R. New frontiers in IoT: Networking, systems, reliability, and security challenges. IEEE Internet Things J. 2020, 7, 11330–11346. [Google Scholar] [CrossRef]
  16. Naseer, S.; Liu, W.; Sarkar, N.I. Energy-efficient massive data dissemination through vehicle mobility in smart cities. Sensors 2019, 19, 4735. [Google Scholar] [CrossRef]
  17. Vinayakumar, R.; Alazab, M.; Srinivasan, S.; Pham, Q.V.; Padannayil, S.K.; Simran, K. A visualized botnet detection system based deep learning for the internet of things networks of smart cities. IEEE Trans. Ind. Appl. 2020, 56, 4436–4456. [Google Scholar] [CrossRef]
  18. Adedeji, K.B.; Ponnle, A.A.; Abu-Mahfouz, A.M.; Kurien, A.M. Towards digitalization of water supply systems for sustainable smart city development—Water 4.0. Appl. Sci. 2022, 12, 9174. [Google Scholar] [CrossRef]
  19. Rojek, I.; Studzinski, J. Detection and localization of water leaks in water nets supported by an ICT system with artificial intelligence methods as a way forward for smart cities. Sustainability 2019, 11, 518. [Google Scholar] [CrossRef]
  20. Kumari, M.S.; Kumar, N. Channel model for simultaneous backhaul and access for mmWave 5G outdoor street canyon channel. Wirel. Netw. 2020, 26, 5997–6013. [Google Scholar] [CrossRef]
  21. Anagnostopoulos, C.; Aladwani, T.; Alghamdi, I.; Kolomvatsos, K. Data-driven analytics task management reasoning mechanism in edge computing. Smart Cities 2022, 5, 562–582. [Google Scholar] [CrossRef]
  22. Ann, J.D.; Sujith, K. Addressing walkability of Kochi corporation area with a focus on inland water transportation. In Proceedings of the IOP Conference Series: Materials Science and Engineering, Kerala, India, 17–19 December 2020; IOP Publishing: Bristol, UK, 2021; Volume 1114, p. 012036. [Google Scholar]
  23. Kuriakose, P.N.; Philip, S. City profile: Kochi, city region-Planning measures to make Kochi smart and creative. Cities 2021, 118, 103307. [Google Scholar] [CrossRef]
  24. Adithya, K.; Ajith, V.; Nibi, K.; Ramesh, M.V. Design of IoT and ML enabled Framework for Water Quality Monitoring. In Proceedings of the 2022 3rd International Conference on Electronics and Sustainable Communication Systems (ICESC), Coimbatore, India, 17–19 August 2022; IEEE: Piscataway, NJ, USA, 2022; pp. 452–460. [Google Scholar]
  25. Nibi, K.; Kumar, M.N.; Devidas, A.R.; Ramesh, M.V.; Thadathil, S.P. GIS based Urban Water Distribution Network Analysis: A Case Study in Kochi, India. In Proceedings of the 2022 International Conference on Computing, Communication, and Intelligent Systems (ICCCIS), Greater Noida, India, 4–5 November 2022; IEEE: Piscataway, NJ, USA, 2022; pp. 956–963. [Google Scholar]
  26. Richter, R.; Weingart, U.; Wever, T.; Kahny, U. Urban land use data for the telecommunications industry. Photogramm. Fernerkund. Geoinf. 2006, 2006, 297. [Google Scholar]
  27. Ali, S.; George, A. Redressing urban isolation: A multi-city case study in India. J. Urban Manag. 2022, 11, 338–352. [Google Scholar] [CrossRef]
  28. Armoogum, V.; Soyjaudah, K.; Mohamudally, N.; Fogarty, T. Propagation Models and Their Applications in Digital Television Broadcast Network Design and Implementation; IntechOpen: London, UK, 2010. [Google Scholar]
  29. Friis, H.T. A note on a simple transmission formula. Proc. IRE 1946, 34, 254–256. [Google Scholar] [CrossRef]
  30. Supanakoon, P.; Aroonpraparat, S.; Promwong, S.; Ichi, J. Free Space Path Loss of UWB Communications; Tokyo Institute of Technology: Tokyo, Japan, 2011; pp. 1–6. [Google Scholar]
  31. Singh, D.; Jain, A.; Yadav, R.P. Development of circular loop frequency selective surface using 3-d printing technique. Prog. Electromagn. Res. M 2020, 90, 195–203. [Google Scholar] [CrossRef]
  32. Mourad, F. Investigation on LTE for Advanced Real Time Two Way Communication for Railway Operational Excellence: Case of Addis Ababa–Djibouti Line. Ph.D. Thesis, Addis Ababa University, Addis Ababa, Ethiopia, 2016. [Google Scholar]
  33. Hata, M. Empirical formula for propagation loss in land mobile radio services. IEEE Trans. Veh. Technol. 1980, 29, 317–325. [Google Scholar] [CrossRef]
  34. VE2DBE. VE2DBE-Radio Mobile Web Site. 2018. Available online: https://www.ve2dbe.com/rmonline_s.asp (accessed on 1 July 2023).
  35. Singh, Y. Comparison of okumura, hata and cost-231 models on the basis of path loss and signal strength. Int. J. Comput. Appl. 2012, 59, 37–41. [Google Scholar] [CrossRef]
  36. Cheng, X.; Guan, J.; Chao, K. A WCDMA propagation model based on COST-231-Walfish-Ikegami pattern for typical residential area. In Proceedings of the 2012 8th International Conference on Wireless Communications, Networking and Mobile Computing, Shanghai, China, 21–23 September 2012; IEEE: Piscataway, NJ, USA, 2012; pp. 1–3. [Google Scholar]
  37. Milanovic, J.; Rimac-Drlje, S.; Bejuk, K. Comparison of propagation models accuracy for WiMAX on 3.5 GHz. In Proceedings of the 2007 14th IEEE International Conference on Electronics, Circuits and Systems, Marrakech, Morocco, 11–14 December 2007; IEEE: Piscataway, NJ, USA, 2007; pp. 111–114. [Google Scholar]
  38. Abbasi, M.; Mohammadi-Pasand, E.; Khosravi, M.R. Intelligent workload allocation in IoT–Fog–cloud architecture towards mobile edge computing. Comput. Commun. 2021, 169, 71–80. [Google Scholar] [CrossRef]
  39. Berger, U. Microwave Communications. In Encyclopedia of Physical Science and Technology, 3rd ed.; Meyers, R.A., Ed.; Academic Press: New York, NY, USA, 2003; pp. 777–798. [Google Scholar] [CrossRef]
  40. Cabrera, G.J.A.; Fitzek, F.H.; Hanisch, S.; Itting, S.A.; Zhang, J.; Zimmermann, S.; Strufe, T.; Simsek, M.; Fetzer, C.W. Chapter 6—Intelligent networks. In Tactile Internet; Fitzek, F.H., Li, S.C., Speidel, S., Strufe, T., Simsek, M., Reisslein, M., Eds.; Academic Press: Cambridge, MA, USA, 2021; pp. 131–149. [Google Scholar] [CrossRef]
Figure 1. The Generic Water Distribution Network.
Smartcities 07 00008 g001
Figure 2. Sensors in Water Distribution Network for monitoring (a) Flow (b) Level (c) Quality (d) Pressure.
Smartcities 07 00008 g002
Figure 3. Study area (a) India (b) Kochi.
Smartcities 07 00008 g003
Figure 4. Land cover classification of the study area.
Smartcities 07 00008 g004
Figure 5. Propagation model.
Smartcities 07 00008 g005
Figure 6. Propagation model results.
Smartcities 07 00008 g006
Figure 7. IoT-enabled Communication Network Topology.
Smartcities 07 00008 g007
Figure 8. IoT Communication Network Packet Flow Diagram between edge nodes and cloud server.
Smartcities 07 00008 g008
Figure 9. IoT Communication Network Packet Flow Diagram between edge node and cloud server using fog node.
Smartcities 07 00008 g009
Figure 10. IoT Communication Network Packet Flow Diagram.
Smartcities 07 00008 g010
Figure 11. State Transition Diagram.
Smartcities 07 00008 g011
Figure 12. Diagram depicting Delay-efficient Offloading.
Smartcities 07 00008 g012
Figure 13. Delay Offloading within the Network demonstrated using an example scenario.
Smartcities 07 00008 g013
Figure 14. Depleting energy of single edge node.
Smartcities 07 00008 g014
Figure 15. Depleting energy of single fog node.
Smartcities 07 00008 g015
Figure 16. Depleting energy of network.
Smartcities 07 00008 g016
Figure 17. IoT-enabled Communication Network Architecture.
Smartcities 07 00008 g017
Table 1. Water distribution entities.
Sl. No.EntityParameterFunctionalityIssues Faced
1PipeFlow, velocity, redness coefficient, frictionTotal water consumptionLeakage/ breakage
2Pressure, frictionPressure, frictionIndication of minimum required pressureLeakage/ breakage, theft
3ValveControlWater controlControl issues
4PumpPressure ControlPumping pressureDry run or overflow
5Water tower or storage structureLevelWater storageOverflow or leakage
Table 2. Propagation models and their parameters.
Model NameFrequencyApplication
HATA2500 MHzThe urban land, shrub, open land
COMSITEUp to 2000 MHzFor vegetation cover
OKUMURA150–1920 MHzAn irregular terrain and environmental clutter
LEE1–100 MHzForest area
ICEPACK1.5–30 MHzThrough ionosphere
ASAPS1–45 MHzThrough ionosphere
Table 3. Parameters for data transmission.
ParameterEdge Node ValuesChannel ValuesFog NodeCloud Sever Values
Operating Frequencies2–8 GHzNA2–8 GHz2–8 GHz
Transmitting Power2 mWNA2 mW2 mW
Antenna gain2 dBNA2 dB10 dB
Height of the antenna10 mNA10 m10 m
Number of available channels11131313
Data rate20 Mbps20 Mbps20 Mbps50 Mbps
Signal Strength−27 dBNA−20 dB−15 dB
Bandwidth5–20 MHz5–20 MHz5–20 MHz100 MHz
Table 4. Details of the different packets.
Sl. No.Packet NameDescriptionFields Inside PacketPathFrequencyFunctionality Achieved
1DPELData Packet from LMS of edge nodeWater level value, TimeLMS Edge node to ->Fog1 min (after the threshold)To know the real time water level of the tank. To prevent the overflow
2CPELControl Packet from fog to LMS of edge nodeControl messages for sensor nodes (Updates, on/off/sleep)Fog Server-> Level Monitoring systemEvent triggeredTo ensure the proper working of sensor nodes Remote management. Time synchronization.
3EPELError packet from LMS of edge nodeFunctional disabilities of sensor nodesLMS Edge node to ->FogEvent triggeredTo detect the sensing disability of sensors
4DPEPData Packet from PMS of edge nodePressure value, TimePMS Edge node to ->Fog1 min (after the threshold)To know the real time water pressure in the pipeline.
5CPEPControl Packet from fog to PMS of edge nodeControl messages for sensor nodes (Updates, on/off/sleep)Fog-> PMSEvent triggeredTo ensure the proper working of sensor nodes Remote management. Time synchronization.
6EPEPError packet from PMS of edge nodeFunctional disabilities of sensor nodesPMS Edge node to ->FogEvent triggeredTo detect the sensing disability of sensors
7DPEFData Packet from FMS of edge nodeFlow rate value, TimeFMS Edge node to ->Fog1minutes (after the threshold)To know the real time water flow rate in the pipeline.
8CPEFControl Packet from fog to FMS of edge nodeControl messages for sensor nodes (Updates, on/off/sleep)Fog Server-> FMSEvent triggeredTo ensure the proper working of sensor nodes Remote management. Time synchronization.
9EPEFError packet from FMS of edge nodeFunctional disabilities of sensor nodesFMS Edge node to ->FogEvent triggeredTo detect the sensing disability of sensors
10DPEQData Packet from QMS of edge nodeWater Quality values, TimeQMS Edge node to ->Fog1minutes (after the threshold)To know the real time water quality parameter values in the pipeline.
11CPEQControl Packet from fog to QMS of edge nodeControl messages for sensor nodes (Updates, on/off/sleep)Fog-> QMSEvent triggeredTo ensure the proper working of sensor nodes Remote management. Time synchronization.
12EPEQError packet from QMS of edge nodeFunctional disabilities of sensor nodesQMS Edge node to ->FogEvent triggeredTo detect the sensing disability of sensors
13DPFFData Packets from Fog nodeWater flow values, TimeFMS Fog node -> Cloud1minutes (after the threshold)To know the real time water level values in the pipeline.
14DPFPData Packets from Fog nodeWater pressure values, TimePMS Fog node to ->Cloud1minutes (after the threshold)To know the real time water level values in the pipeline.
15DPFLData Packet from Level Monitoring system (LMS)Water level values, TimeLMS Fog node to ->Cloud1minutes (after the threshold)To know the real time water level values in the pipeline.
16DPFQData Packet from Quality Monitoring system (QMS)Water Quality values, TimeQMS Fog node to ->Cloud1minutes (after the threshold)To know the real time water quality parameter values in the pipeline.
17EPFPError packet from FogFunctional disabilities of sensor nodesFog to ->CloudEvent triggeredTo detect the sensing disability of sensors
18EPFFError packet from FogFunctional disabilities of sensor nodesFog to ->CloudEvent triggeredTo detect the sensing disability of sensors
19EPFLError packet from FogFunctional disabilities of sensor nodesFog to ->CloudEvent triggeredTo detect the sensing disability of sensors
20EPFQError packet from FogFunctional disabilities of sensor nodesFog to ->CloudEvent triggeredTo detect the sensing disability of sensors
21CPFPControl Packet from CloudControl messages for sensor nodes (Updates, on/off/sleep)Cloud-> FogEvent triggeredTo ensure the proper working of sensor nodes Remote management. Time synchronization.
22CPFFControl Packet from CloudControl messages for sensor nodes (Updates, on/off/sleep)Cloud-> FogEvent triggeredTo ensure the proper working of sensor nodes Remote management. Time synchronization.
23CPFLControl Packet from CloudControl messages for sensor nodes (Updates, on/off/sleep)Cloud-> FogEvent triggeredTo ensure the proper working of sensor nodes Remote management. Time synchronization.
24CPFQControl Packet from CloudControl messages for sensor nodes (Updates, on/off/sleep)Cloud-> FogEvent triggeredTo ensure the proper working of sensor nodes Remote management. Time synchronization.
Table 5. Power consumption and operating time for a day in different operational modes.
Operational StateScenario 1 Power Consumption (mW)Edge Operating Time Scenario 1 (h)Fog Operating Time Scenario 1 (h)Scenario 2 Power Consumption (mW)Edge Operating Time Scenario 2 (h)Fog Operating Time Scenario 2 (h)
O N 0.524240.52424
S E N S E 418-412-
C O M P U T E 218122108
T R A N S M I T 1218121243
S L E E P ---0.51212
M E M O R Y ---188
R E C E I V E 1218121243
Disclaimer/Publisher’s Note: The statements, opinions and data contained in all publications are solely those of the individual author(s) and contributor(s) and not of MDPI and/or the editor(s). MDPI and/or the editor(s) disclaim responsibility for any injury to people or property resulting from any ideas, methods, instructions or products referred to in the content.

