1. Introduction
Roundabouts have become a popular intersection design alternative in the United States since the 2000s [
1]. One of the main reasons for wide implementation is their safety benefits. Significant reductions in injury crashes and their severity have been observed, mainly because roundabout configurations eliminate left-turn, head-on, and right-angle crashes [
2,
3].
As more roundabouts are constructed, it becomes increasingly important to develop a thorough understanding of driver behavior at these intersections. Such knowledge can help improve designs [
4], fine-tune simulation and emission models [
5,
6], and better inform policy makers [
7]. Travel speeds are particularly relevant information [
8,
9]. Current maximum entry design speed recommendations vary from 15 to 30 miles per hour (mph), which is approximately 25 to 50 km per hour (kph) [
2,
4].
1.1. Literature Review
Various analytical methods have been developed to estimate vehicle speeds near roundabouts. The American Association of State Highway and Transportation Officials (AASHTO) has documented the relationship between travel speed and horizontal curvature [
10]. Krammes et al. developed techniques to estimate the operating speed of two-lane and four-lane rural roads as a function of degree curvature [
11]. The Federal Highway Administration (FHWA) provides in its
Roundabouts: An Informational Guide report theoretical speed profiles for different approach speeds [
4]. Additionally, the National Cooperative Highway Research Program (NCHRP) presents equations in a report to calculate roundabout entry and exit speeds that consider accelerations [
2].
Other studies have used different techniques to measure vehicle speeds at roundabouts. Kim and Choi performed vehicle speed surveys at 14 sites in South Korea to evaluate safety [
12]. Pilko et al. retrieved speed data from a passenger vehicle equipped with a Global Positioning System (GPS) device to verify design speeds at four roundabouts in the City of Zagreb [
13]. Gallelli et al. derived vehicle travel speed at two roundabouts by means of video recordings and simulation [
14]. Khan et al. generated speed S curves of seven different vehicle categories traversing a roundabout in India by observing travel times and calculating travel distances with Google Maps [
15].
1.2. Motivation
Current methods to estimate vehicle speeds at roundabouts include analytical techniques, simulations, field visits, and the use of detectors. Analytical techniques and simulations rely on assumptions to perform their estimations. Field visits are time-consuming and highly dependent on the practitioner’s ability to collect data. Additionally, field visits and the use of detectors are costly and difficult to scale.
Recently, anonymized crowd-sourced high-fidelity connected vehicle (CV) trajectory data has become commercially available. Each month, this data set provides over 500 billion records of vehicles’ location, speed, and heading while traversing transportation networks in the United States. These attributes provide unique opportunities to systematically evaluate and manage transportation infrastructure at scale [
16].
CV trajectory data has already been utilized to calculate operational performance [
17,
18,
19,
20], estimate control parameters [
21,
22], and manage [
23,
24] signalized intersections. This data has also been used to estimate delays at roundabouts [
25], but there are no published reports on speed characteristics in and adjacent to roundabouts using this emerging data set.
CV data provides a large sample of vehicle speeds as they traverse road networks. This data set allows for a scaled and objective evaluation of vehicle speeds at roundabouts without the need for assumptions and with minimum manual labor required.
Objective and Contribution
The objective of this paper is to perform an analysis of sampled CV trajectory speeds across 56 roundabouts in Carmel, Indiana, United States, to contribute with the following:
provide current aggregated sampled speed profiles for left-, through-, and right-turning vehicles by time-of-day (TOD) periods,
compare recently sampled speed profiles with the literature to determine if state-of-the-practice models should be updated, and
generate updated information about the distribution of speeds on the different sections of a roundabout to determine the speeds at which different proportions of motorists travel.
The presented technique can be used by local and state transportation agencies to periodically update travel speed knowledge for their roundabouts where CV data or detection technology to derive traveling speed is available. This is important, especially when vehicle speeds change as motorists become more familiar with newly implemented roundabouts.
2. Materials and Methods
This section first provides information on the data set used in the study; then, the methods applied to generate the results are explained.
2.1. Connected Vehicle Trajectory Data
Weekday CV trajectory data from February 2023 to May 2023, with an estimated market penetration rate (MPR) of 4.8% [
26], is used in this study. The data consists of a set of waypoints for entire vehicle trips (i.e., from on to off) and is obtained from passenger vehicles that were factory-equipped with the required technology for sampling and transmission. There is a 3 s reporting interval between samples, each with a 3.0 m. (~10 ft.) spatial accuracy. Every waypoint has the following information: latitude, longitude, speed, heading, and an anonymous vehicle trajectory identifier.
By linking individual waypoints with the same trajectory identifier and sorting them by timestamp, a complete chronological vehicle journey can be obtained. Thus, a trajectory (
) is defined as its set of waypoints (
) [
17]:
where
i = 1 is the first sample collected after the vehicle is turned on, and
n is the last sample collected before the vehicle is turned off. The range of heading values is [0°, 360°), where 0° is the true north, and it increases clockwise.
It is important to note that the CV data set does not include any infrastructure information. However, all roundabouts evaluated in this study are single-lane, multi-lane 2 × 2, or multi-lane 2 × 1 and have speed limits that range from 25 to 45 mph (~40 to ~72 kph). Further details on the CV data set, including a discussion of acquisition, storage, data access, best practices, and costs, are provided in [
17].
2.2. Roundabout Speed Analysis
The speeds used in the study are those directly obtained from the CV data set (Equations (1) and (2)), and no additional estimation or averaging is performed. The approach to evaluate speeds at roundabouts is as follows:
Select relevant speed values from the CV trajectory data.
Categorize each sampled speed as belonging to a vehicle that turned right, through, or left.
Categorize each sampled speed as being located on the approach, circulation, or departure sections of the roundabout.
Generate high-level graphics for analysis.
It is important to only evaluate vehicle speeds that are mainly affected by roundabout operations. Further, the segmentation of vehicle speeds by turn type and roundabout section is critical to allow for an analysis that can evaluate each of these categories separately since vehicle speeds are expected to vary significantly between them.
These steps are summarized in
Figure 1 and discussed in the subsections below.
2.2.1. Step 1: Data Selection
Only the sampled speeds from the subset
of trajectory waypoints found within 400 ft. (~122 m.) from a roundabout center
r are considered for analysis. That is
where
W is the set of all sampled waypoints
and
is a function that calculates the geodesic distance (ft.) [
27] between its arguments.
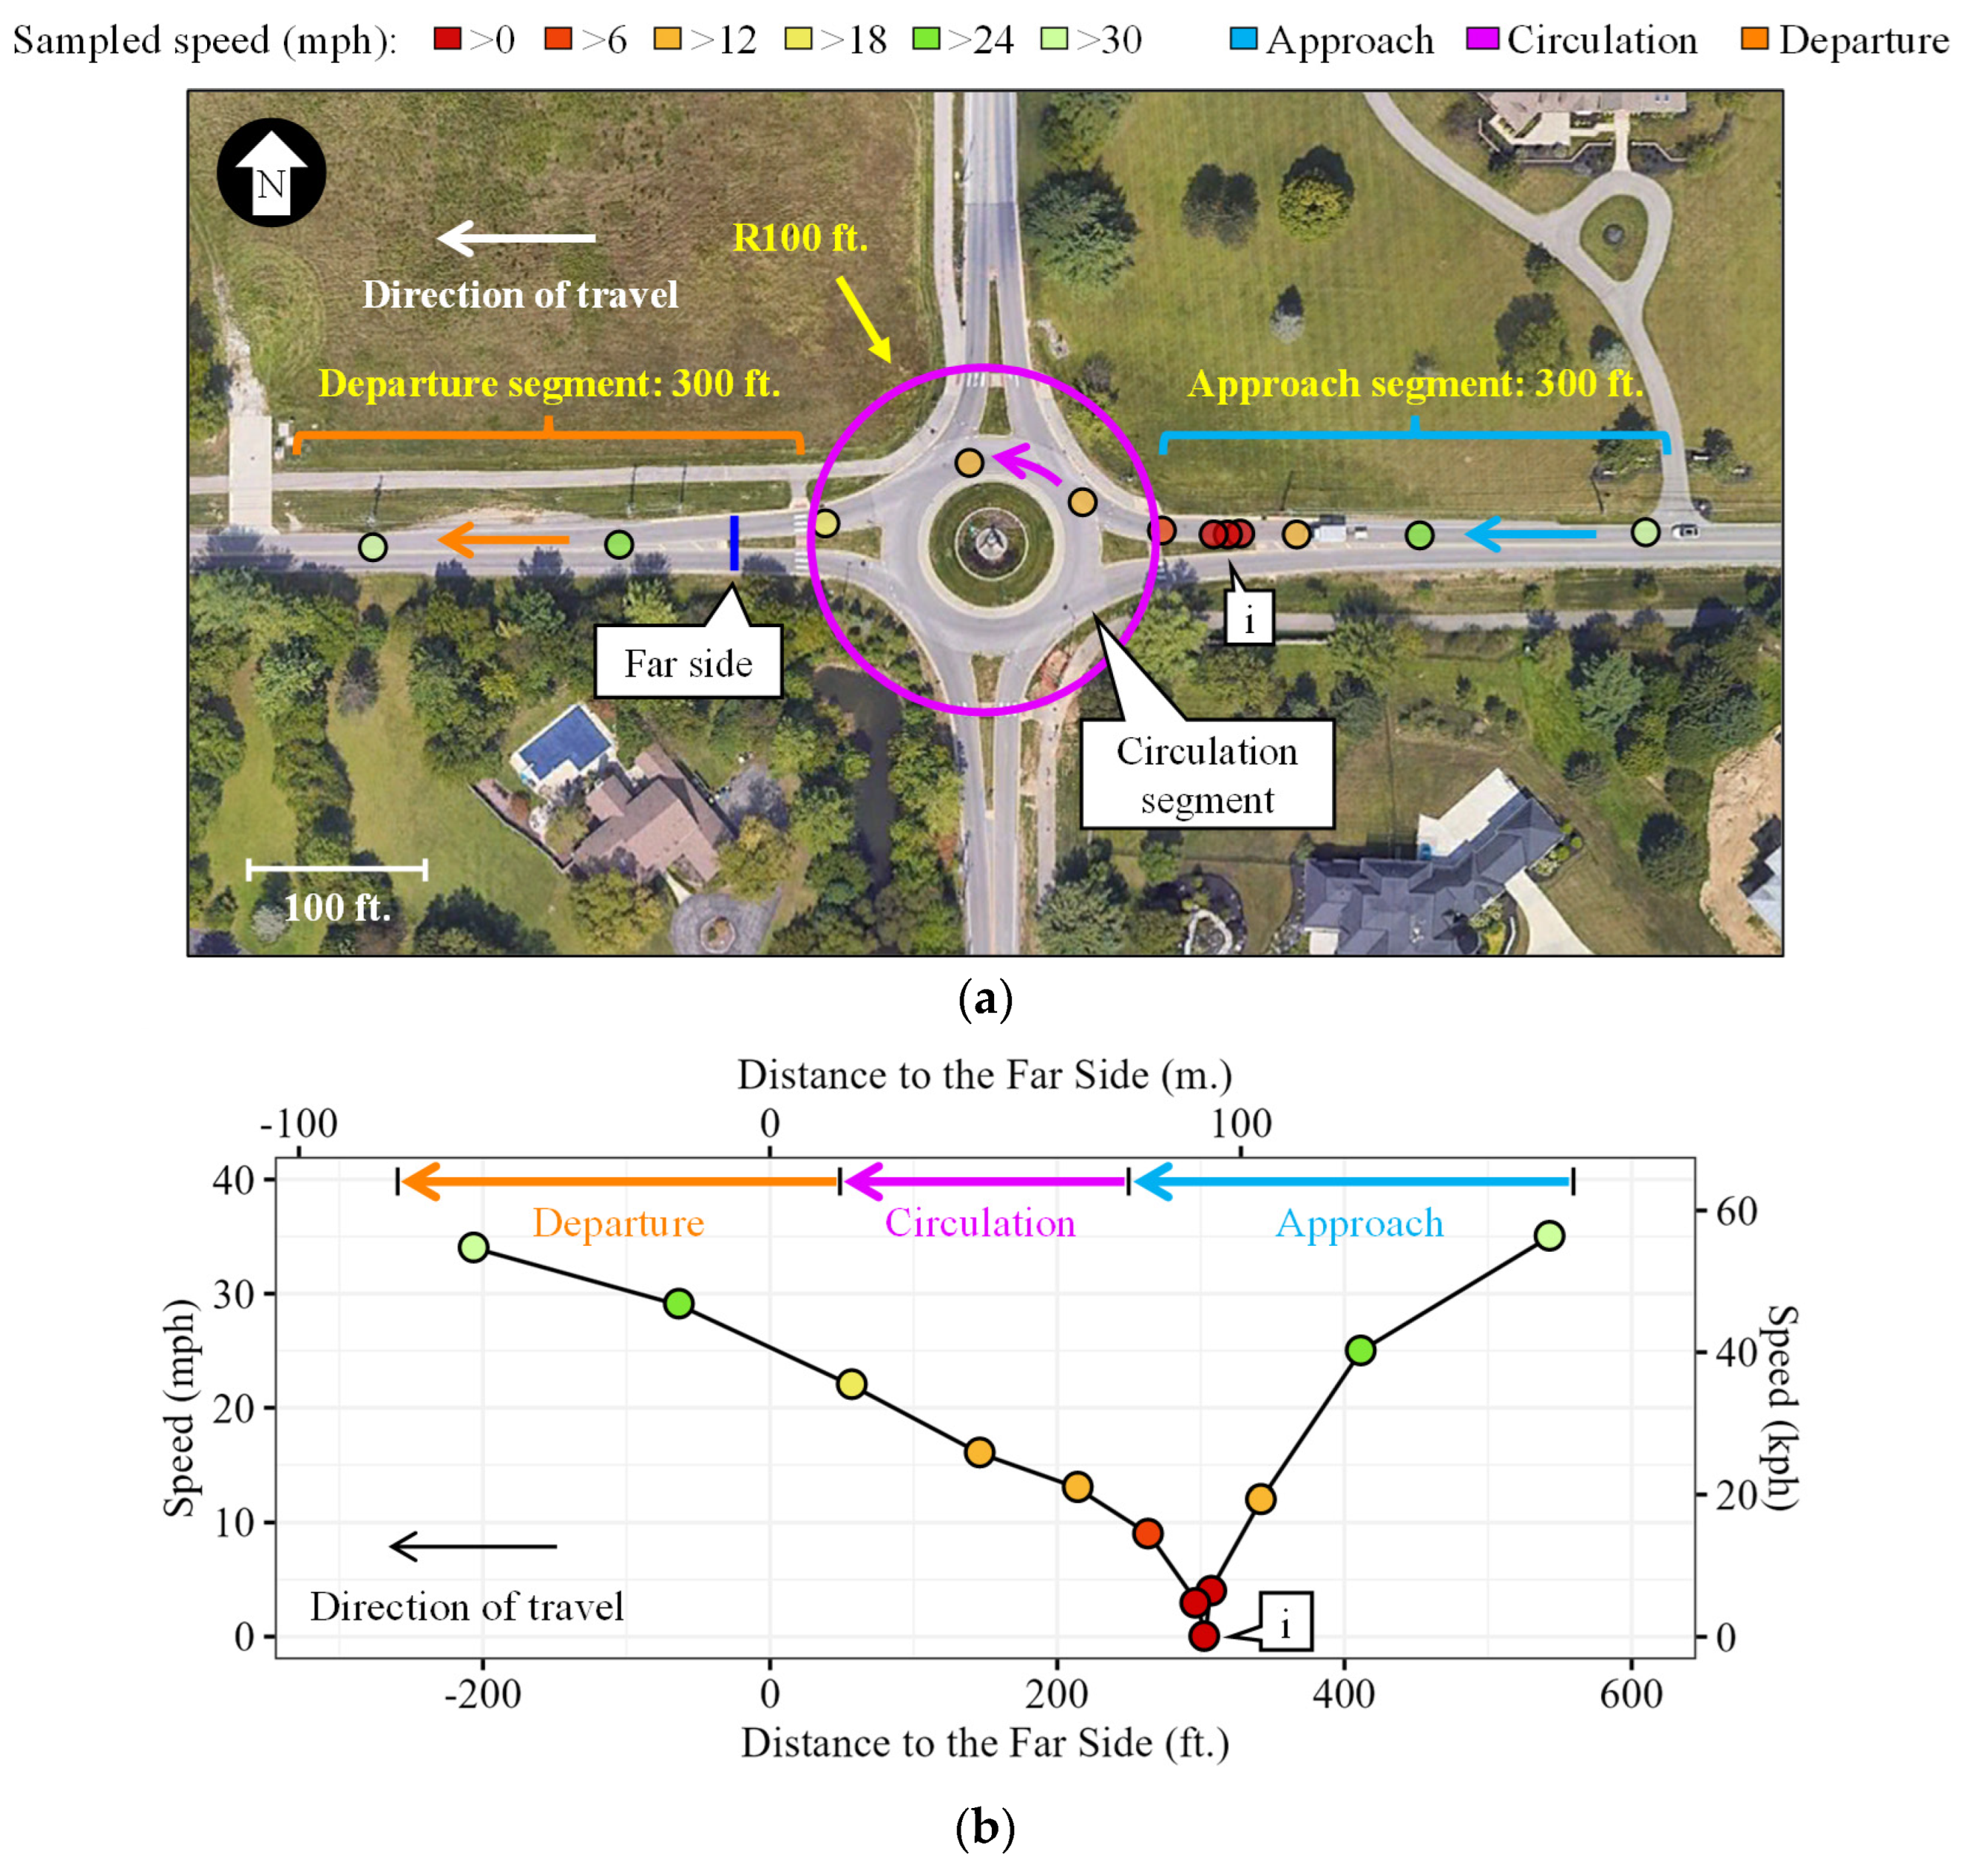
Figure 1a shows the waypoints of a vehicle trajectory that traveled through the analyzed roundabout selected for further analysis.
2.2.2. Step 2: Turn Type Identification
A detailed explanation of how to determine vehicle movements at intersections from CV data is provided in Chapter 4 of the open-access
Next generation traffic signal performance measures: Leveraging connected vehicle data report [
17]. In summary, vehicle headings are compared as they approach and depart from an intersection to determine directions of travel and turn types.
First, the selected
waypoints are categorized as approaching or departing a roundabout to generate approach versus departure clusters of their headings. A waypoint is said to approach a roundabout if its
value is less than 20°; otherwise, it is categorized as departing [
17].
is defined as
where
is the direction of a vector drawn from
to
. A small
indicates that
approaches the center of the roundabout, and a large
indicates that
departs.
After approach and departure heading clusters are obtained, their centroids are identified using
k-means [
28].
K-means calculates the set
K of
k clusters and the set of centroids
that minimize the error sum of squares
ESS, defined as:
where
is the number of observations in the
j-th cluster and
is the
i-th observation in the
j-th cluster.
Once the centroid of each cluster is estimated, relative heading boundaries are defined to determine whether a vehicle turns right, through, or left at each roundabout. The sampled trajectory shown in
Figure 1a is assessed as traveling westbound-through (WBT).
2.2.3. Step 3: Roundabout Section Identification
Each waypoint is assigned to one of the following roundabout sections based on its heading and proximity to the center of the roundabout:
Figure 1a indicates where the approach, circulation, and departure sections are located for the plotted trajectory waypoints. The approach and departure areas can shift depending on the origin-destination (OD) pairs of the traversing vehicles.
2.2.4. Step 4: Speeds Visualization
Even though the geospatial representation of color-coded waypoints shown in
Figure 1a presents some insights into the vehicle’s change in speed as it progresses through the roundabout, important nuances are lost. For this reason, the vehicle’s speed profile as it traverses the roundabout, pivoting on the far side of the intersection, is provided in
Figure 1b. This graphic shows how the vehicle quickly decelerates while approaching until it comes to a stop (callout i) and then continuously accelerates as it circulates through and departs. As expected, the vehicle’s speeds are higher farther away from the center and are lower right before and within the roundabout.
The graphics presented in
Figure 1, in addition to cumulative frequency distribution (CFD) diagrams, are expanded in the Results section to provide speed information from more than one vehicle and OD pair.
3. Results
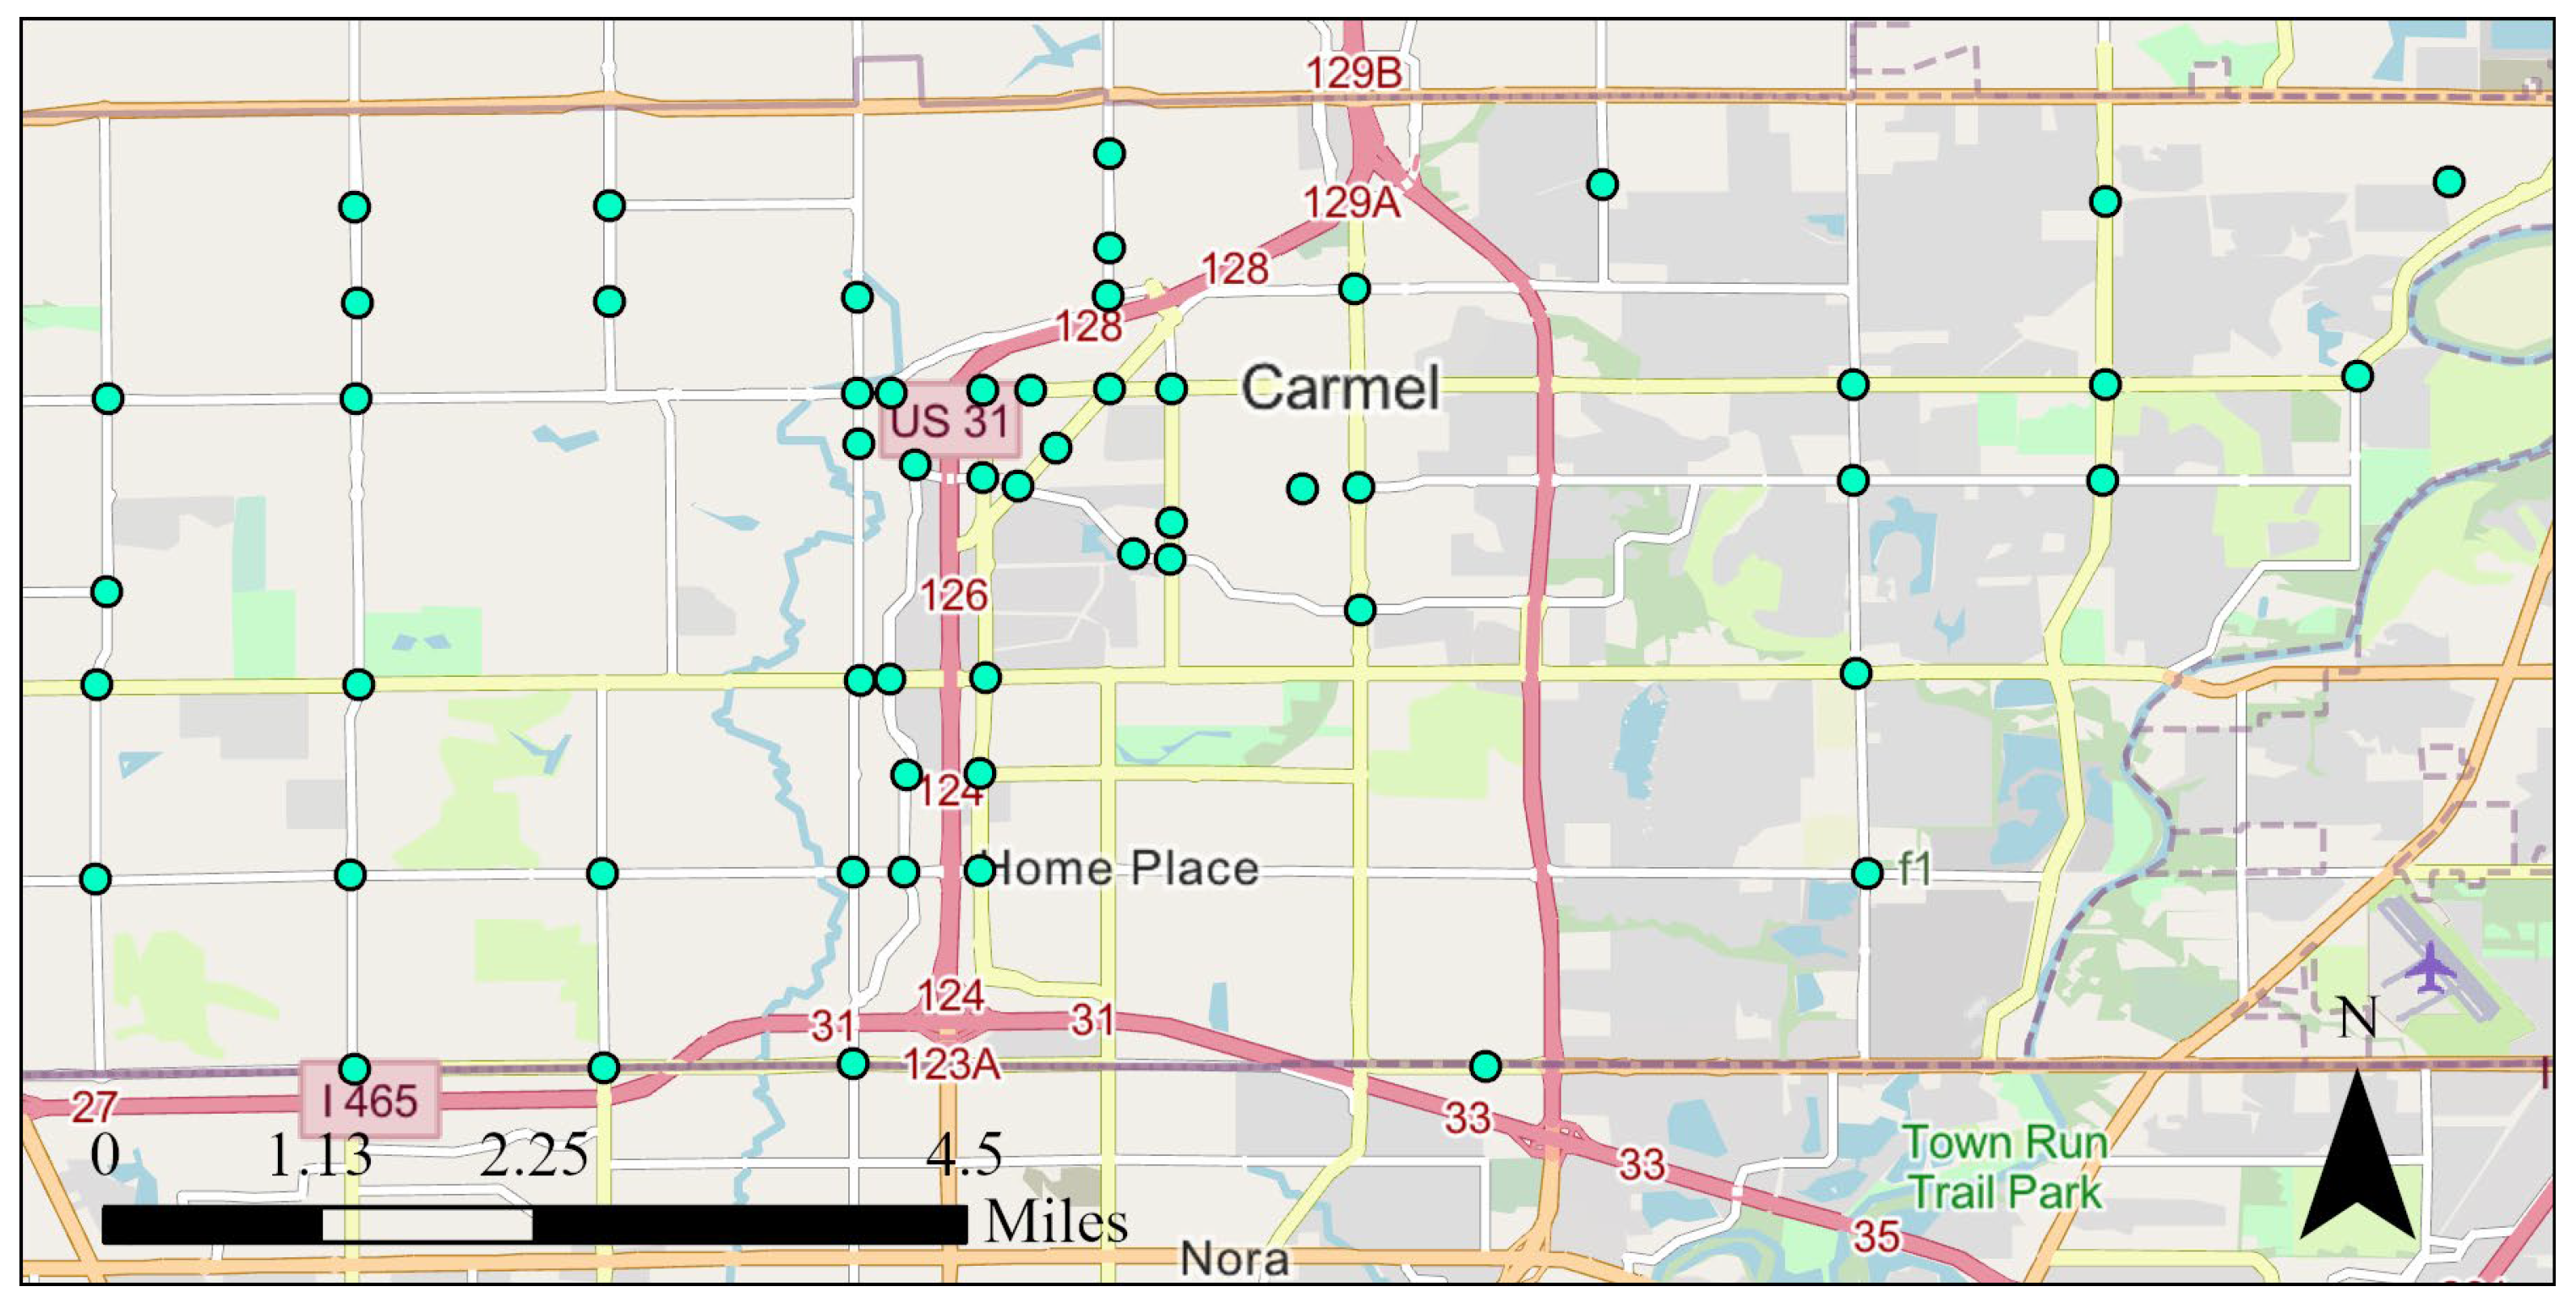
This study analyzes weekday vehicle speeds from February to May 2023 at 56 roundabouts located in Carmel, Indiana (
Figure 2). Carmel is a suburban area auto-denominated as the “
Roundabout Capital of the U.S.”. The city has actively replaced traffic signals with roundabouts since the late 1990s; therefore, most of the residents and those who work in Carmel are now familiar with roundabout operations [
29].
The evaluated roundabouts are single-lane, multi-lane 2 × 2, or multi-lane 2 × 1 with inscribed circle diameters that go from 100 ft. (~30 m.) to 160 ft. (~49 m.). Each roundabout has four legs and displays advisory speeds of 15 mph (~24 kph) within the circulation section. All approaches have speed limits that range from 25 to 45 mph (~40 to ~72 kph).
The rest of this section first presents speed profiles of passenger vehicles at the studied roundabouts and compares them to current models. Then, an analysis of speed distribution by roundabout section is provided. The following TOD periods are considered:
AM Peak (AM): 07:00:00–09:00:00 h.
Midday (MID): 09:00:00–16:00:00 h.
PM Peak (PM): 16:00:00–18:00:00 h.
Other: 00:00:00–07:00:00 h and 18:00:00–23:59:59 h.
3.1. Speed Profiles
Two different types of speed profiles are provided. One displays results by TOD period and by the type of turn vehicles take at the roundabouts. The other displays results based on approach speeds and performs a comparison with a current theorical model.
3.1.1. By Turn-Type and Time-of-Day Period
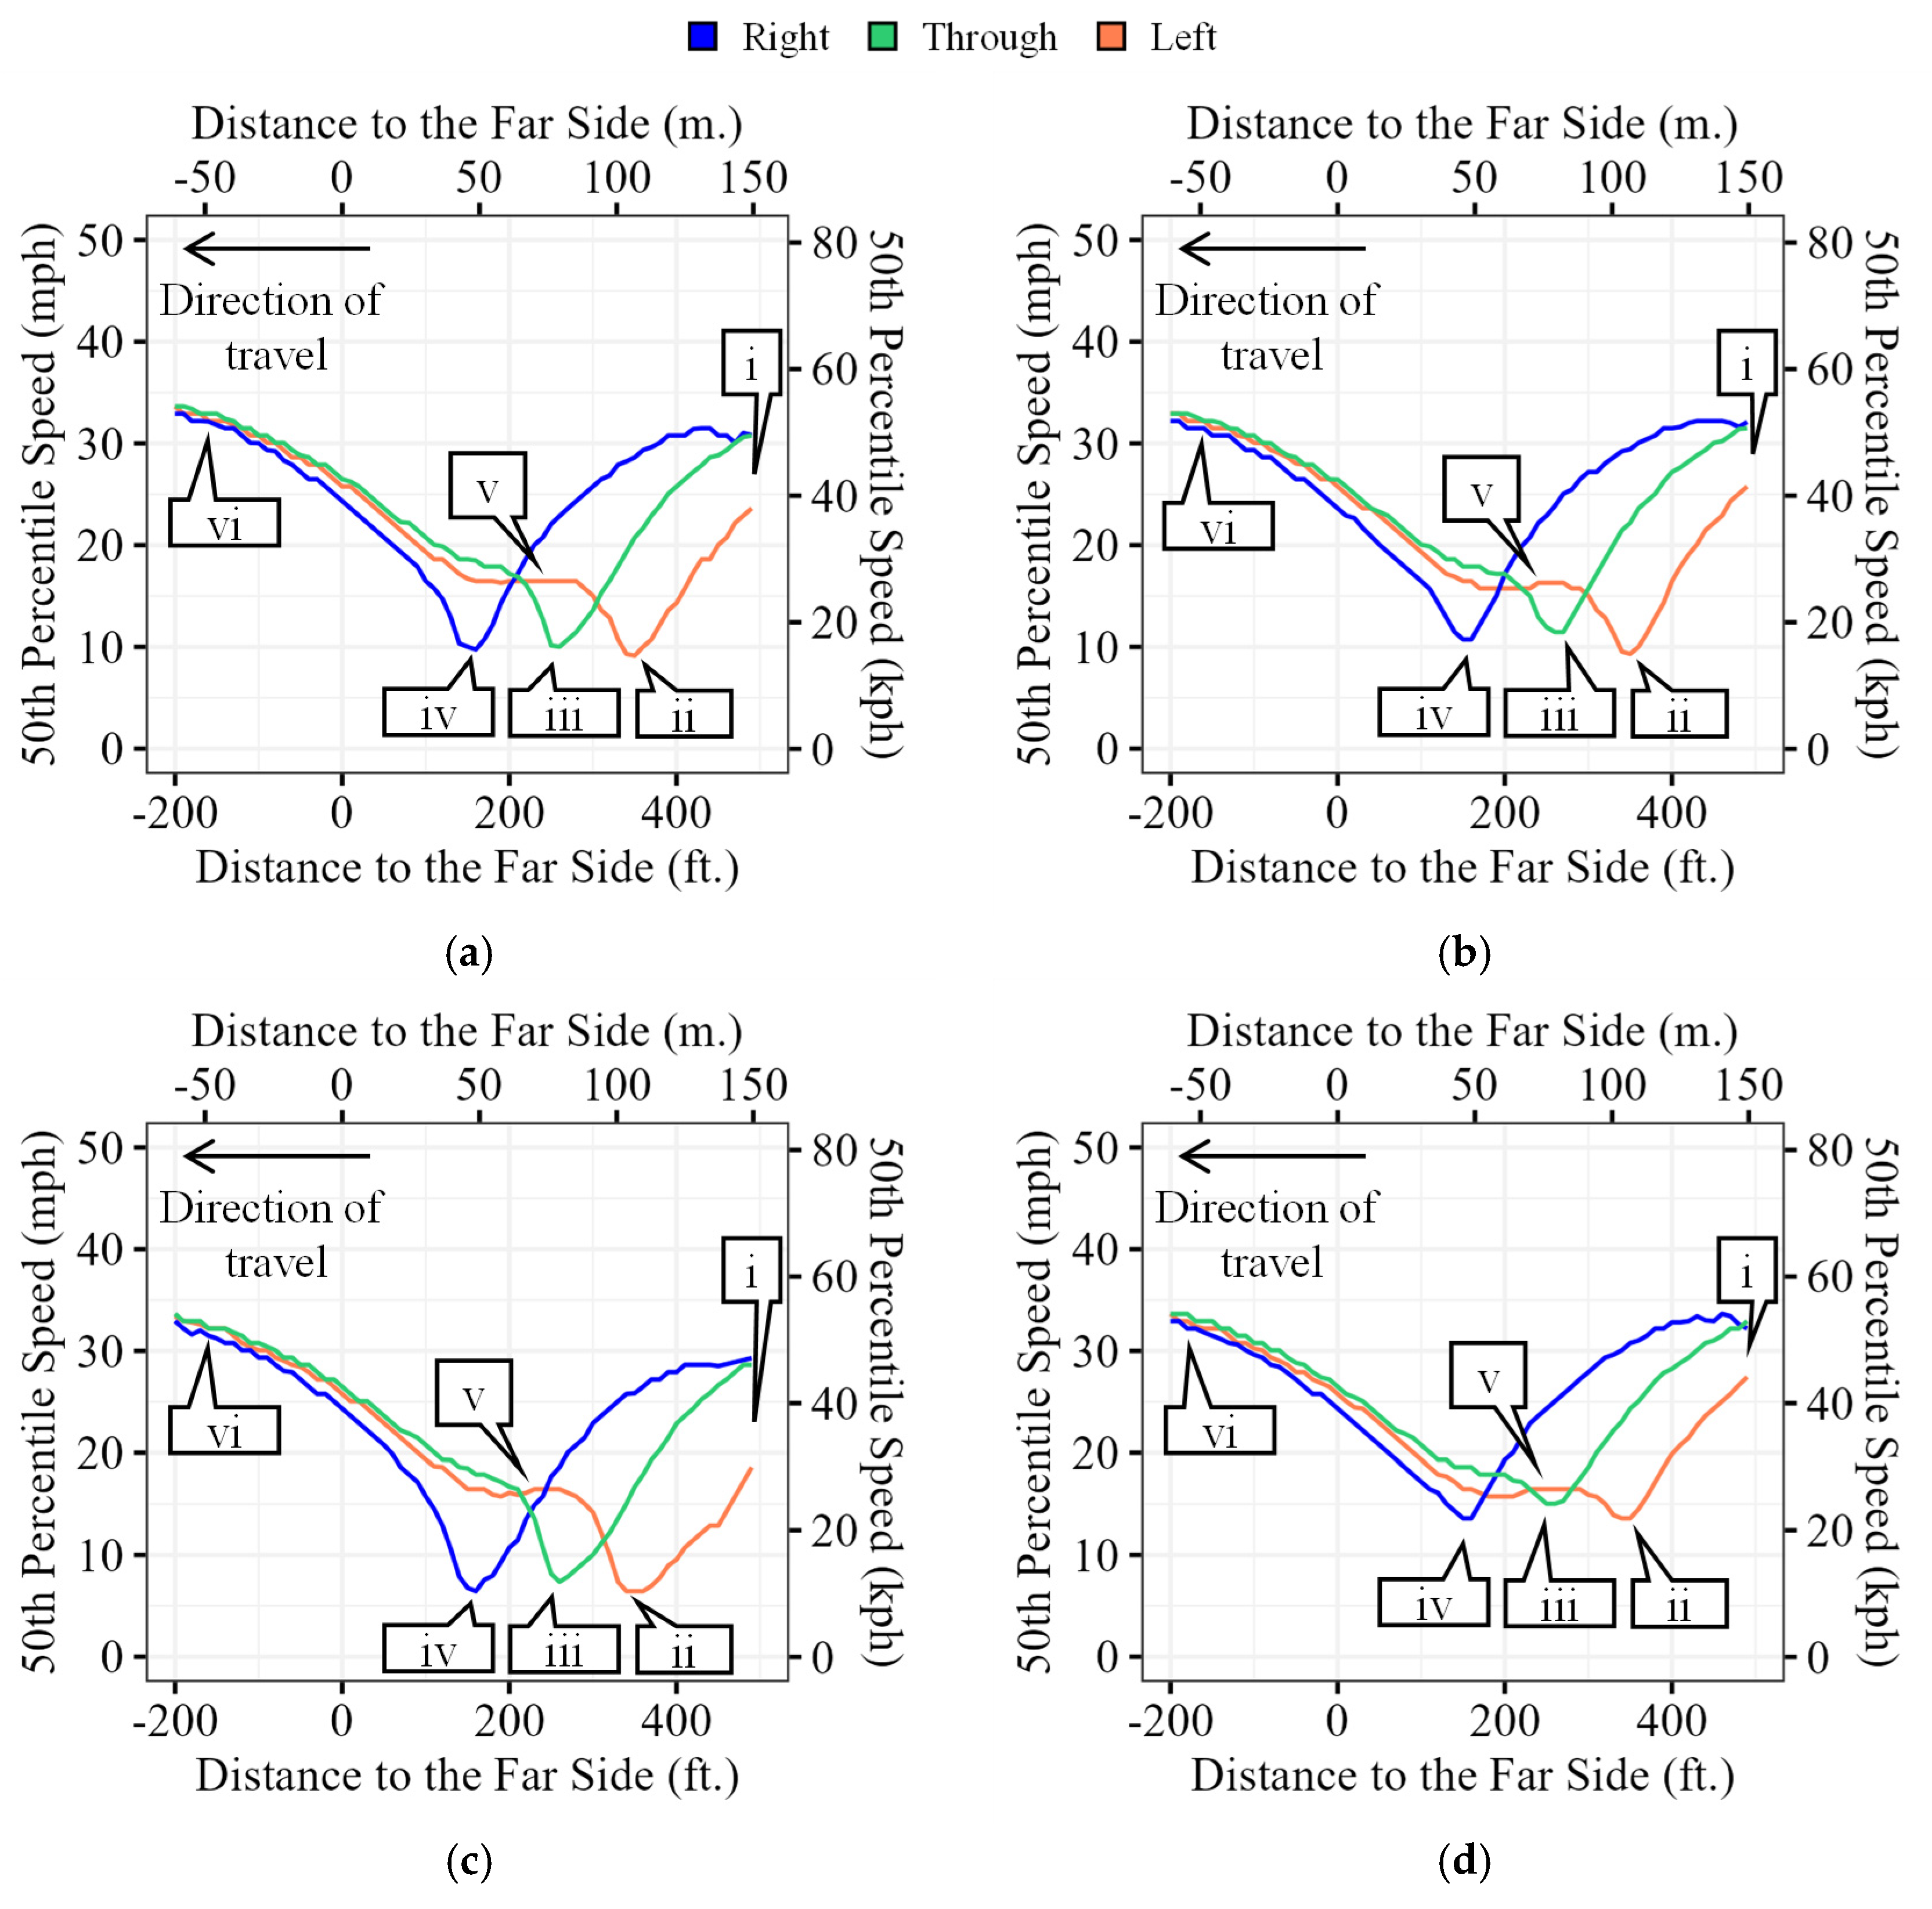
Figure 3 shows 50th percentile speed profiles derived from over 15,000,000 waypoints belonging to all sampled vehicle trajectories that traversed a roundabout in
Figure 2. The speed profiles are grouped by turn type and segregated by TOD periods.
Significant speed differences are shown between turn types as vehicles approach the roundabouts (callout i). This is an artifact of the speed profiles pivoting on the far side of the roundabout since each turn type has a different distance to travel between its entry and exit from the circulatory roadway. In
Figure 3, vehicle speeds come to a minimum just before entering the roundabout. Hence, it is shown how left-turning trajectories travel the largest distances between their entry (callout ii) and the far side, followed by vehicles traveling straight through (entering at callout iii). Trajectories turning right traverse the shortest distance between their entry (callout iv) and the far side.
Another significant difference between turn types is their speed inside the roundabouts (i.e., from their minimum speeds to the far side). Left-turning vehicles display fairly constant speeds below 20 mph (~32 kph) (callout v) before accelerating to leave the intersection. Constant speeds are briefly held for trajectories traveling straight through, and right-turning vehicles promptly accelerate after entering. Regardless of the speed differences while approaching and circulating the roundabouts, all speeds are similar when vehicles depart (callout vi) with values near 35 mph (~56 kph).
As expected, speeds during the PM TOD period are the slowest due to the more congested traffic conditions during that time. No speeds faster than 35 mph (~56 kph) were observed.
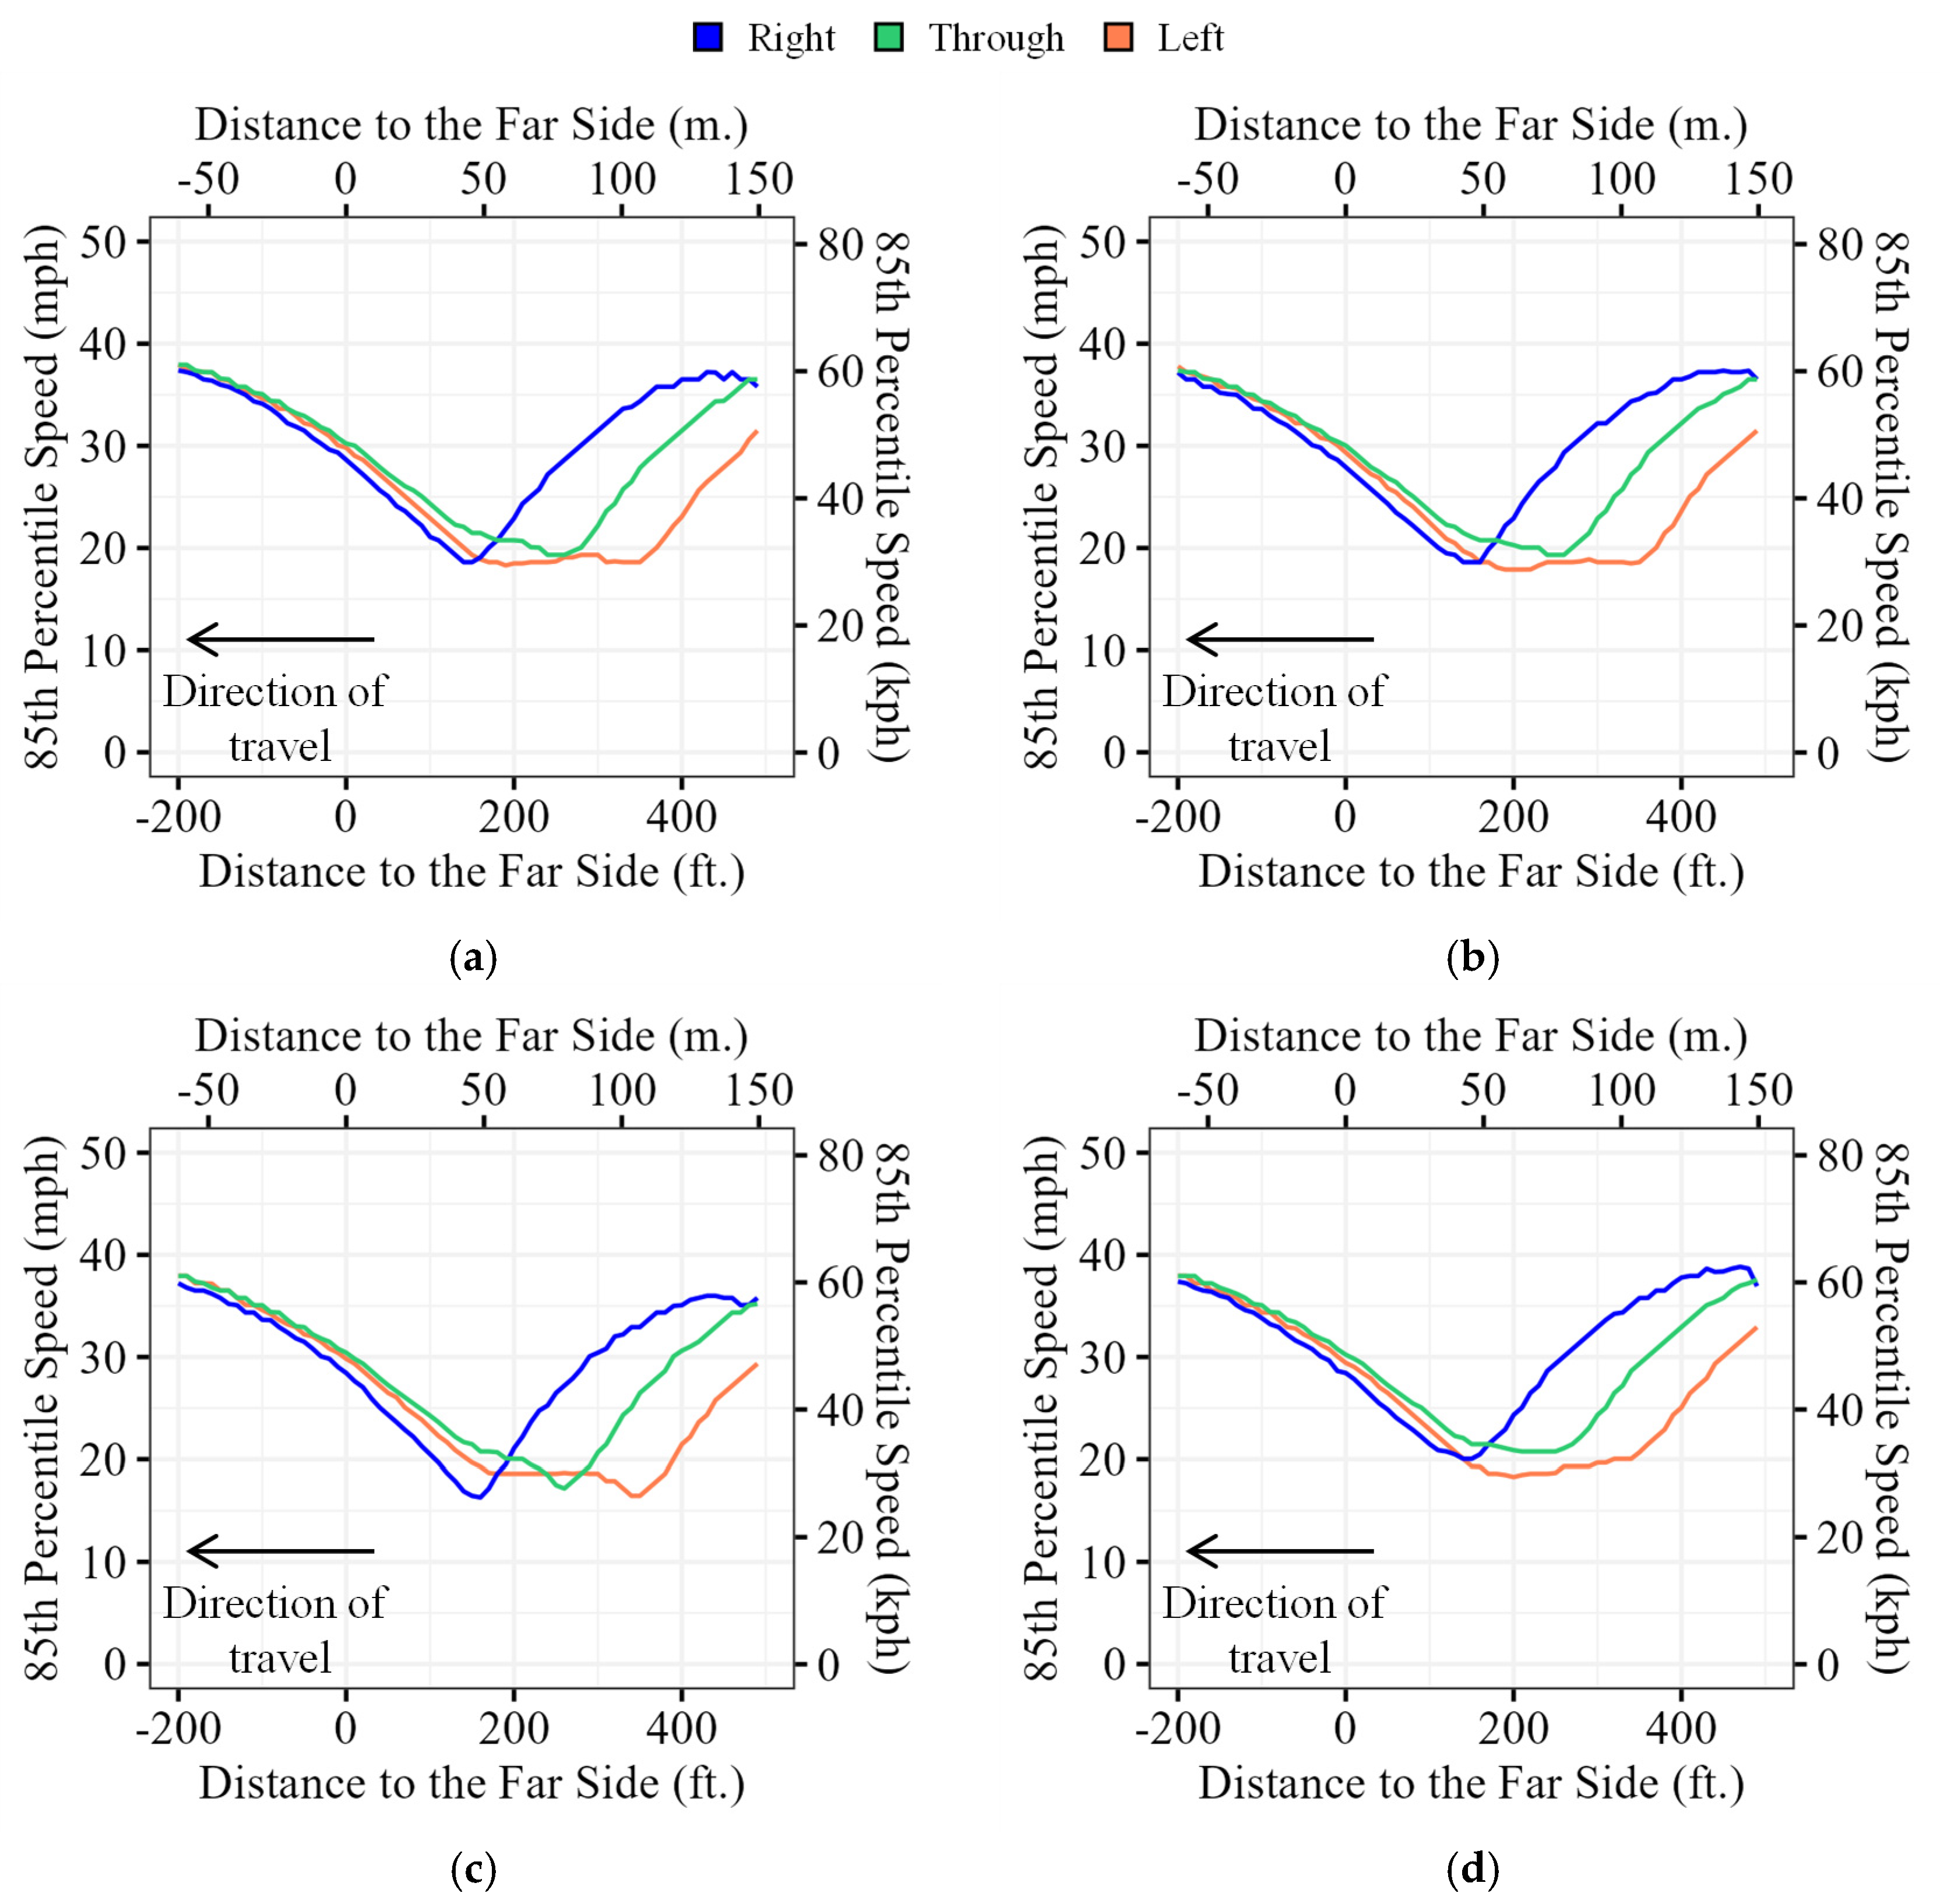
Figure 4 shows 85th percentile speed profiles derived from the same sampled data used to generate
Figure 3. Both visualizations present similar patterns, the main difference being that the 85th percentile speed profiles (
Figure 4) display less pronounced minimum speeds before entering the roundabout. No speeds faster than 40 mph (~64 kph) were observed.
3.1.2. By Approach Speeds: Comparison with a Theoretical Model
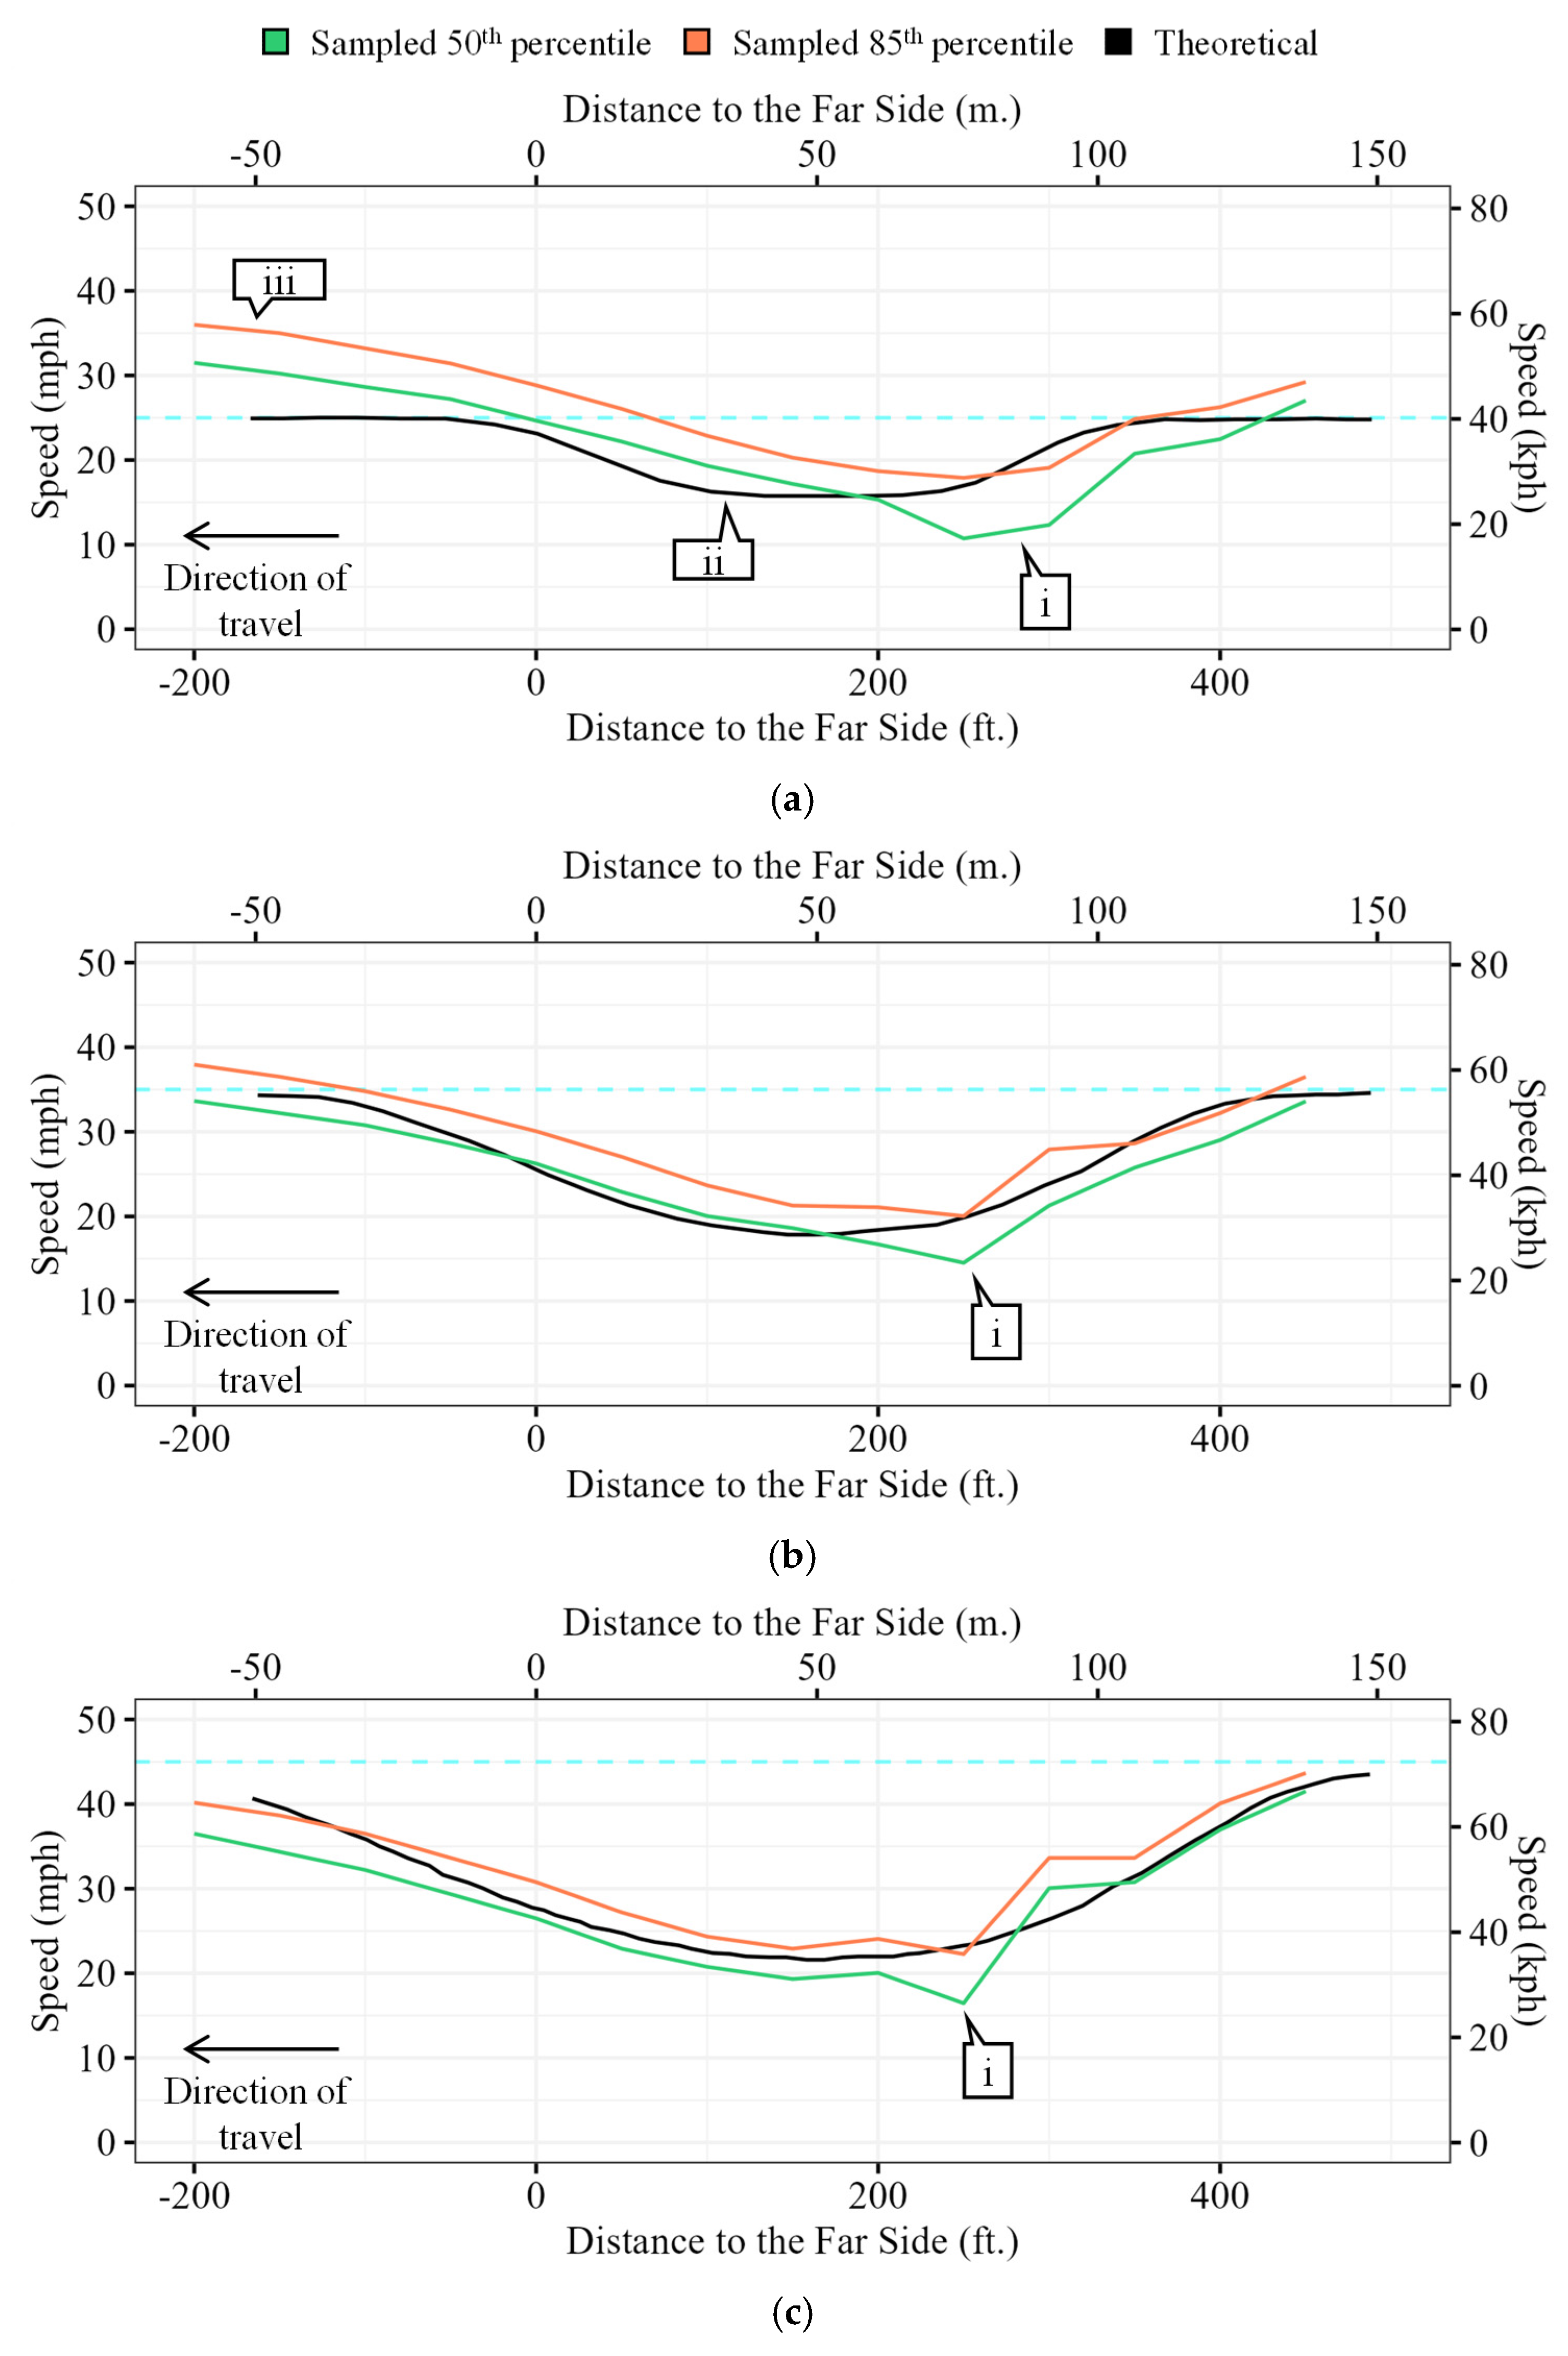
Figure 5 depicts the 50th (green) and 85th (orange) percentile sampled speed profiles of vehicles approaching about 325 ft. (~99 m.) from the center of a roundabout at speeds near 25, 35, and 45 mph (~40, ~56, and ~72 kph). The sampled speed profiles shown in
Figure 5 can be compared with FHWA’s theoretical speed profiles generated for the same conditions in
Exhibit 6-3 of their
Roundabouts: an Informational Guide report [
4]. Numerical data of the theoretical profiles are extracted [
30] and are plotted as black lines.
In general, similar acceleration and deceleration values are shown from both the sampled and the theoretical profiles. The main difference is that the theoretical speed profiles do not account for reduced speeds before vehicles enter the circulatory roadway (callout i). Additionally, for vehicles that approach with speeds near 25 mph (
Figure 5a), the theoretical profile displays reduced speeds within the roundabout (callout ii), while the sampled profiles indicate that vehicles accelerate soon after entering (callout i) until they depart the intersection (callout iii).
3.2. Speed Distribution
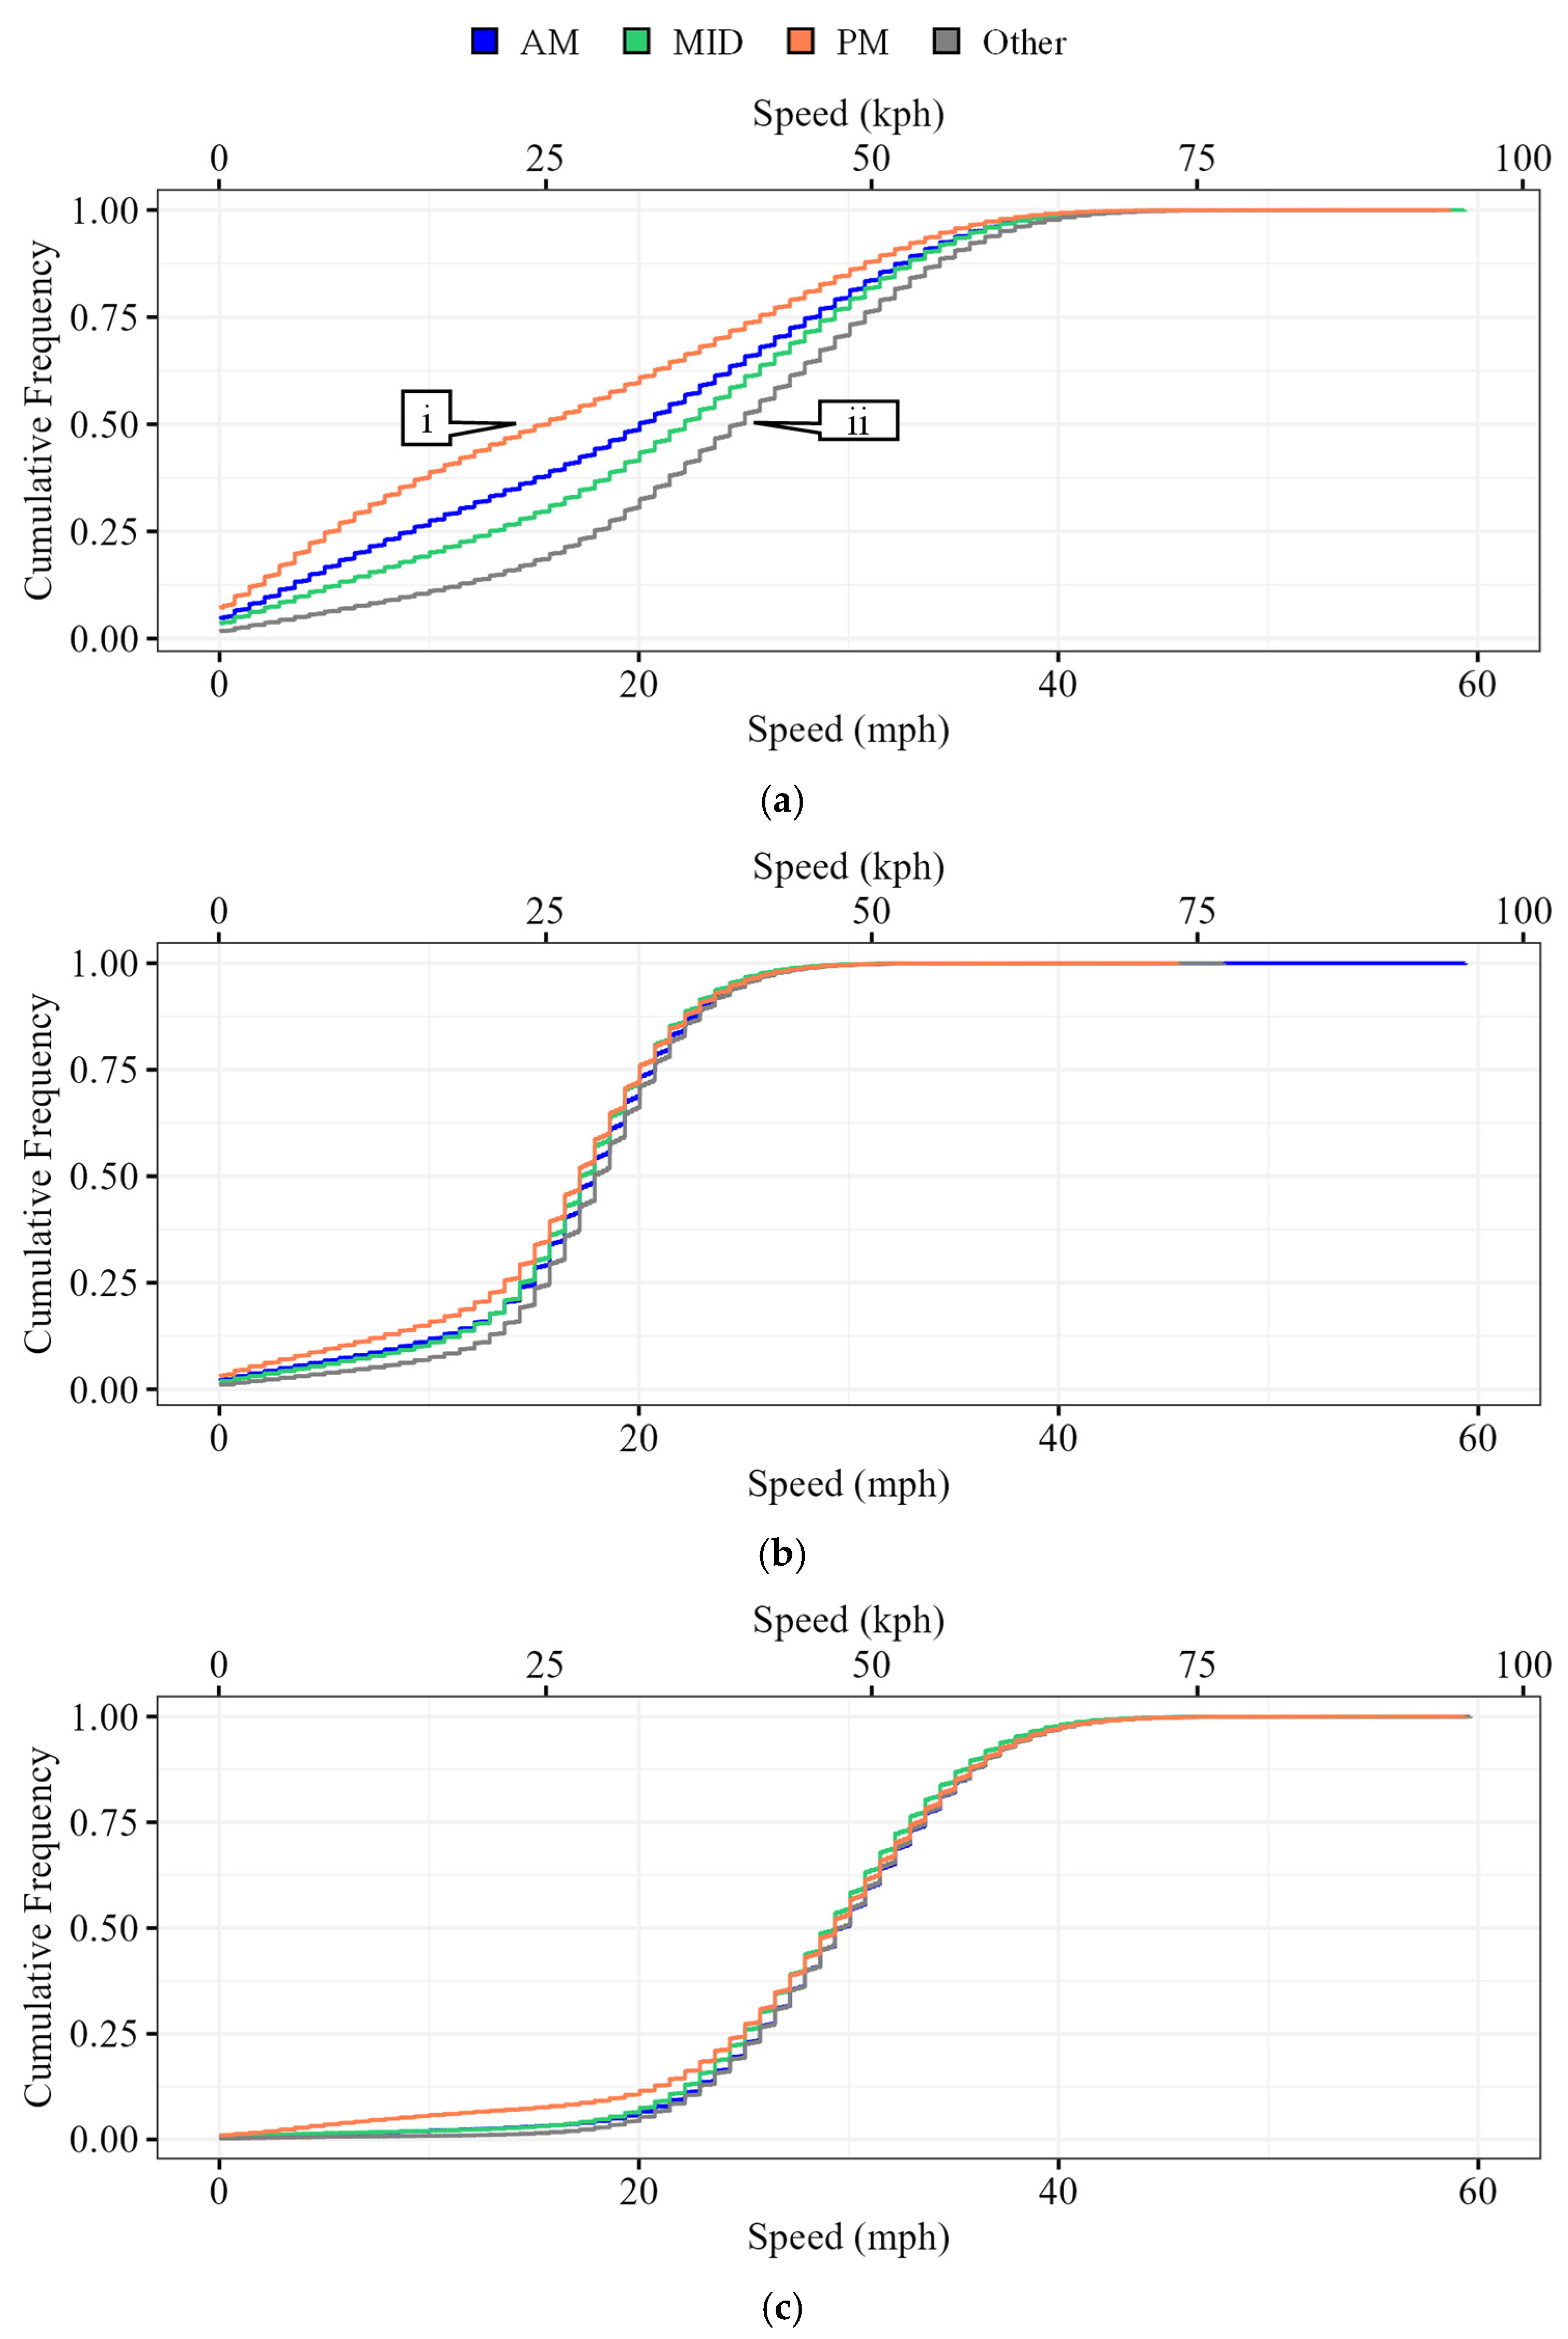
Providing speed distribution information by roundabout section and by TOD period is particularly useful for stakeholders to assess the speeds at which different proportions of users are traveling.
Figure 6 shows speed CFD diagrams grouped by roundabout section and by TOD periods. These graphics communicate at-a-glance how speeds vary as vehicles travel through the roundabout.
The approach section (
Figure 6a) shows a wider range of values and larger differences between TOD periods. Vehicles travel slowest during PM (callout i) and fastest during Other (callout ii). This is because traffic conditions are less congested during the Other TOD period, making it a good candidate to become the baseline reference.
In contrast, the circulation (
Figure 6b) and departure (
Figure 6c) sections present distributions with less variance by TOD period. This behavior can be attributed to the fact that congestion predominantly affects the approach section at roundabouts as vehicles must yield into the circulatory roadway. Once within the circulatory roadway, vehicles usually travel under free-flow conditions unless pedestrians traverse at the roundabout or if there is obstruction generated by downstream blockage.
Table 1,
Table 2 and
Table 3 present the 25th, 50th, 75th, 85th, 90th, 100th, and interquartile range (IQR) speed values at the approach, circulation, and departure segments, respectively. These tables allow for a thorough assessment of driver behavior by TOD and roundabout section. It is shown that
50% of vehicles travel under 25, 18, and 30 mph (~40, ~29, and ~48 kph) on the approach, circulation, and departure sections, respectively.
85% of vehicles travel under 34, 22, and 35 mph (~55, ~35, and ~56 kph) on the approach, circulation, and departure sections, respectively.
4. Discussion
The analysis of passenger vehicle speeds at the roundabouts in
Figure 2 allows for a comparison with theoretical models as presented in
Figure 5. From this assessment, it is concluded that some parts of state-of-the-practice models should be updated with the information presented herein. For example, lower vehicle speeds before entering roundabouts should be accounted for in future theoretical models (
Figure 5, callout i). Furthermore, higher speeds in the circulation and departure sections for vehicles that are slowly approaching should be considered (
Figure 5, callout ii). Nonetheless, it should be emphasized that the deceleration and acceleration values generated by both the theoretical approach and the sampled speeds are very similar. This indicates that the rate of speed change generated by theoretical models may not need to be updated.
It is important to note that the analyses presented in this document are solely based on roundabouts located in Carmel, Indiana, United States, where most local drivers have become familiar with roundabout operations. Future research should focus on the expansion of this analysis to other cities and states in the United States, and, ideally, to other countries.
Furthermore, to provide a generalized view of vehicle speeds at roundabouts, results are mostly aggregated for the entire system, making no distinctions between single-lane, multi-lane 2 × 2, or multi-lane 2 × 1 roundabouts. To enhance the granularity of the study, future research should provide a segregated analysis by geometric roundabout classes. Regardless of these limitations, this study provides valuable insights derived from real sampled speed data.
5. Conclusions
This study provided an analysis of sampled CV trajectory speeds at 56 roundabouts in Carmel, Indiana, from February to May 2023. Over 15 million speed samples were extracted from the CV data set and categorized by their turn type (i.e., right, through, or left) and by which roundabout section they belong (i.e., approach, circulation, or departure) to derive the following key results:
Left-turning vehicles consistently maintain speeds below 20 mph (~32 kph) when navigating inside roundabouts (
Figure 3).
Vehicles traveling straight through briefly maintain constant speeds inside the roundabout before accelerating prior to exiting (
Figure 3).
Right-turning vehicles constantly accelerate soon after entering the roundabout and do not decelerate until after departure (
Figure 3).
A speed distribution analysis showed that 85% of vehicles travel under 34, 22, and 35 mph (~55, ~35, and ~56 kph) on the approach, circulation, and departure sections, respectively (
Table 1,
Table 2 and
Table 3 and
Figure 6).
A comparison between sampled and theoretical speed profiles showed similar accelerations and decelerations; however, the theoretical model does not account for significant speed reductions that occur before entering the roundabouts and underestimates speeds of slow-approaching vehicles (
Figure 5). A careful comparison between existing assumption-based roundabout vehicle speed models and the results presented herein is suggested. The presented information needs to be considered in the roundabout design process, simulation model development, and policy implementation.
Author Contributions
Conceptualization, E.D.S.-C., M.W.O. and D.M.B.; Data curation, E.D.S.-C. and M.W.O.; Formal analysis, E.D.S.-C.; Funding acquisition, D.M.B.; Investigation, E.D.S.-C. and M.W.O.; Methodology, E.D.S.-C. and D.M.B.; Project administration, D.M.B.; Resources, D.M.B.; Software, E.D.S.-C. and M.W.O.; Supervision, D.M.B.; Validation, E.D.S.-C.; Visualization, E.D.S.-C.; Writing—original draft, E.D.S.-C.; Writing—review and editing, M.W.O. and D.M.B. All authors have read and agreed to the published version of the manuscript.
Funding
This work was funded through Agreement A249-18-ON180087 and STIND 75458 between Purdue University and the Indiana Department of Transportation.
Data Availability Statement
The aggregated datasets generated and/or analyzed during the current study are available from the corresponding author on reasonable request.
Acknowledgments
The connected vehicle data from February to May 2023 used in this study was provided by Wejo Data Services, Inc. Techniques used aggregated anonymized trajectories that were truncated within 400 ft. of the roundabouts and are consistent with best practices for connected vehicle data analytics. The contents of this paper reflect the views of the authors, who are responsible for the facts and the accuracy of the data presented herein. These contents do not constitute a standard, specification, or regulation.
Conflicts of Interest
The authors declare no conflicts of interest.
References
- Kittelson & Associates. Roundabouts Database. Available online: https://roundabouts.kittelson.com/ (accessed on 22 January 2024).
- NCHRP. Roundabouts: An Informational Guide; The National Academy Press: Washington, DC, USA, 2010. [Google Scholar] [CrossRef]
- Mandavilli, S.; McCartt, A.T.; Retting, R.A. Crash Patterns and Potential Engineering Countermeasures at Maryland Roundabouts. Traffic Inj. Prev. 2009, 10, 44–50. [Google Scholar] [CrossRef] [PubMed]
- FHWA. Roundabouts: An Informational Guide. 2000. Available online: https://www.fhwa.dot.gov/publications/research/safety/00067/00067.pdf (accessed on 29 February 2024).
- Mecheva, T.; Furnadzhiev, R.; Kakanakov, N. Modeling Driver Behavior in Road Traffic Simulation. Sensors 2022, 22, 9801. [Google Scholar] [CrossRef] [PubMed]
- Acuto, F.; Coelho, M.C.; Fernandes, P.; Giuffrè, T.; Macioszek, E.; Granà, A. Assessing the Environmental Performances of Urban Roundabouts Using the VSP Methodology and AIMSUN. Energies 2022, 15, 1371. [Google Scholar] [CrossRef]
- Cramton, R.C. Driver Behavior and Legal Sanctions: A Study of Deterrence. Mich. Law Rev. 1969, 67, 421–454. [Google Scholar] [CrossRef]
- NCHRP. Roundabouts in the United States; The National Academy Press: Washington, DC, USA, 2007. [Google Scholar] [CrossRef]
- Tian, Z.Z.; Xu, F.; Rodegerdts, L.A.; Scarbrough, W.E.; Ray, B.L.; Bishop, W.E.; Ferrara, T.C.; Mam, S. Roundabout Geometric Design Guidance. Sacramento, June 2007. Available online: https://nacto.org/docs/usdg/nchrprpt672.pdf (accessed on 23 January 2024).
- American Association of State Highway and Transportation Officials. A Policy on Geometric Design of Highways and Streets, 7th ed.; AASHTO: Washington, DC, USA, 2018. [Google Scholar]
- Krammes, R.A.; Brackett, R.Q.; Shafer, M.A.; Ottesen, J.L.; Anderson, I.B.; Fink, K.L.; Collins, K.M.; Pendleton, O.J.; Messer, C.J. Horizontal Alignment Design Consistency for Rural Two-Lane Highways; Federal Highway Administration: Washington, DC, USA, 1995.
- Kim, S.; Choi, J. Safety analysis of roundabout designs based on geometric and speed characteristics. KSCE J. Civ. Eng. 2013, 17, 1446–1454. [Google Scholar] [CrossRef]
- Pilko, H.; Brčić, D.; Šubić, N. Study of vehicle speed in the design of roundabouts. J. Croat. Assoc. Civ. Eng. 2014, 66, 407–416. [Google Scholar] [CrossRef]
- Gallelli, V.; Vaiana, R.; Iuele, T. Comparison between Simulated and Experimental Crossing Speed Profiles on Roundabout with Different Geometric Features. Procedia Soc. Behav. Sci. 2014, 111, 117–126. [Google Scholar] [CrossRef]
- Khan, A.; Dhamaniya, A.; Arkatkar, S. Effect of two-wheeler proportion on passenger car units at roundabout in Indian urban scenario. Transp. Lett. 2022, 14, 1057–1068. [Google Scholar] [CrossRef]
- FHWA. Every Day Counts: Innovation for a Nation on the Move; Federal Highway Administration: Washington, DC, USA, 2021.
- Saldivar-Carranza, E.D.; Li, H.; Mathew, J.K.; Desai, J.; Platte, T.; Gayen, S.; Sturdevant, J.; Taylor, M.; Fisher, C.; Bullock, D.M. Next Generation Traffic Signal Performance Measures: Leveraging Connected Vehicle Data; Purdue University: West Lafayette, IN, USA, 2023. [Google Scholar] [CrossRef]
- Waddell, J.M.; Remias, S.M.; Kirsch, J.N. Characterizing Traffic-Signal Performance and Corridor Reliability Using Crowd-Sourced Probe Vehicle Trajectories. J. Transp. Eng. A Syst. 2020, 146, 04020053. [Google Scholar] [CrossRef]
- Zhao, Y.; Zheng, J.; Wong, W.; Wang, X.; Meng, Y.; Liu, H.X. Estimation of Queue Lengths, Probe Vehicle Penetration Rates, and Traffic Volumes at Signalized Intersections using Probe Vehicle Trajectories. Transp. Res. Rec. J. Transp. Res. Board 2019, 2673, 660–670. [Google Scholar] [CrossRef]
- Khadka, S.; Li, P.T.; Wang, Q. Developing Novel Performance Measures for Traffic Congestion Management and Operational Planning Based on Connected Vehicle Data. J. Urban. Plan. Dev. 2022, 148, 04022016. [Google Scholar] [CrossRef]
- Islam, Z.; Abdel-Aty, M.; Ugan, J. Signal Phasing and Timing Prediction Using Connected Vehicle Data. Transp. Res. Rec. J. Transp. Res. Board 2024, 2678, 662–673. [Google Scholar] [CrossRef]
- Du, Z.; Yan, X.; Zhu, J.; Sun, W. Signal Timing Parameters Estimation for Intersections using Floating Car Data. Transp. Res. Rec. J. Transp. Res. Board 2019, 2673, 189–201. [Google Scholar] [CrossRef]
- Ma, W.; Wan, L.; Yu, C.; Zou, L.; Zheng, J. Multi-objective optimization of traffic signals based on vehicle trajectory data at isolated intersections. Transp. Res. Part C Emerg. Technol. 2020, 120, 102821. [Google Scholar] [CrossRef]
- Astarita, V.; Giofrè, V.P.; Guido, G.; Vitale, A. A review of traffic signal control methods and experiments based on Floating Car Data (FCD). Procedia Comput. Sci. 2020, 175, 745–751. [Google Scholar] [CrossRef]
- Saldivar-Carranza, E.; Mathew, J.K.; Li, H.; Bullock, D.M. Roundabout Performance Analysis Using Connected Vehicle Data. J. Transp. Technol. 2022, 12, 42–58. [Google Scholar] [CrossRef]
- Sakhare, R.S.; Hunter, M.; Mukai, J.; Li, H.; Bullock, D.M. Truck and Passenger Car Connected Vehicle Penetration on Indiana Roadways. J. Transp. Technol. 2022, 12, 578–599. [Google Scholar] [CrossRef]
- Crane, K.; Livesu, M.; Puppo, E.; Qin, Y. A Survey of Algorithms for Geodesic Paths and Distances. arXiv 2020, arXiv:2007.10430. [Google Scholar] [CrossRef]
- Bajorski, P. Statistics for Imaging, Optics, and Photonics; John Wiley & Sons, Inc.: Hoboken, NJ, USA, 2012. [Google Scholar]
- City of Carmel. Roundabouts. Available online: https://www.carmel.in.gov/government/departments-services/engineering/roundabouts#:~:text=Carmel%20is%20internationally%20known%20for,city%20in%20the%20United%20States (accessed on 12 February 2024).
- Rohatgi, A. WebPlotDigitizer. Dublin, California. Available online: https://automeris.io/WebPlotDigitizer (accessed on 29 February 2024).
| Disclaimer/Publisher’s Note: The statements, opinions and data contained in all publications are solely those of the individual author(s) and contributor(s) and not of MDPI and/or the editor(s). MDPI and/or the editor(s) disclaim responsibility for any injury to people or property resulting from any ideas, methods, instructions or products referred to in the content. |
© 2024 by the authors. Licensee MDPI, Basel, Switzerland. This article is an open access article distributed under the terms and conditions of the Creative Commons Attribution (CC BY) license (https://creativecommons.org/licenses/by/4.0/).


