Project Report

Inclusive MicroMob: Enhancing Urban Mobility Through Micromobility Solutions

1
Institute of Earth Sciences, Department of Environment Constructions and Design, University of Applies Sciences and Arts of Southern Switzerland, CH-6850 Mendrisio, Switzerland
2
Institute of Information Systems and Networking, Department of Innovative Technologies, University of Applies Sciences and Arts of Southern Switzerland, CH-6962 Lugano-Viganello, Switzerland
3
Labour, Urbanscape and Citizenship Research Area, Competence Centre for Labour, Welfare and Social Research, Department of Business Economics, Health and Social Care, University of Applies Sciences and Arts of Southern Switzerland, CH-6928 Manno, Switzerland
4
Institute of Applied Sustainability to the Built Environment, Department of Environment Constructions and Design, University of Applies Sciences and Arts of Southern Switzerland, CH-6850 Mendrisio, Switzerland
*
Author to whom correspondence should be addressed.
These authors contributed equally to this work.
Smart Cities 2025, 8(2), 69; https://doi.org/10.3390/smartcities8020069
Submission received: 20 February 2025 / Revised: 21 March 2025 / Accepted: 7 April 2025 / Published: 15 April 2025
(This article belongs to the Special Issue Inclusive Smart Cities)

Abstract

:

Highlights

This project explored the micromobility role in four Swiss urban contexts, focusing on Lugano as a key testing ground.
  • What are the main findings?
    • Interdisciplinary approach: this project combined urban analysis, experiments in the urban context, and participatory processes to evaluate the impact of micromobility.
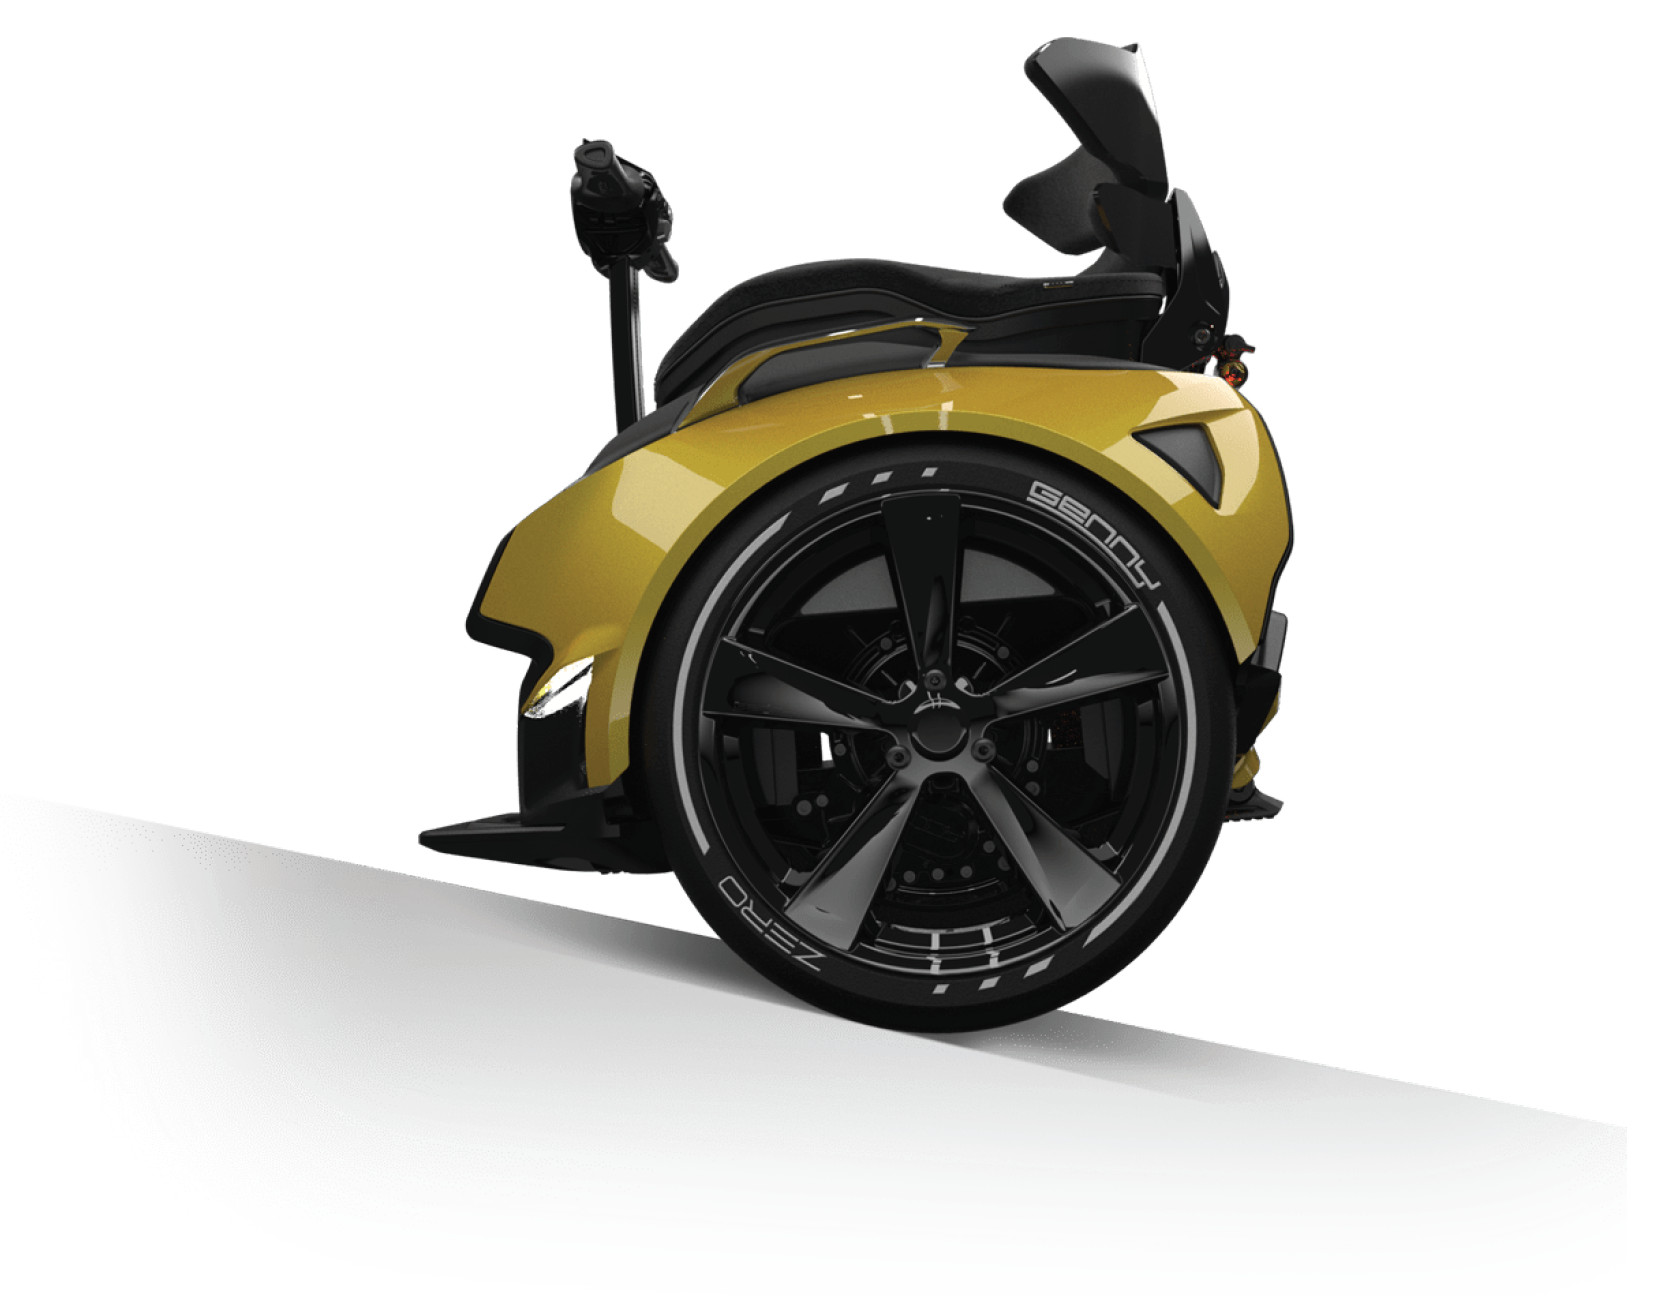
    • Integration of an innovative micromobility device: this study introduced Genny Zero, a self-balancing micromobility vehicle, to assess its feasibility in real urban environments.
  • What is the implication of the main finding?
    • Identification of conflicts and synergies: this research investigated potential conflicts with pedestrians and vehicles, while also demonstrating synergies with existing cycling infrastructure and public transport.
    • Policy and infrastructure recommendations: this study underscores the need for adaptive regulations, multimodal integration to ensure safe and efficient micromobility adoption, and guidelines for participatory processes.

Abstract

This manuscript investigates the integration of micromobility solutions in four Swiss contexts, with a primary focus on Lugano as the testing area. Through urban analysis, urban experiment, and social testing, the Inclusive MicroMob project introduced Genny Zero, an innovative micromobility device, to assess its impact on urban mobility. The findings highlight key factors for successful micromobility integration, including the need for an interdisciplinary approach that includes a holistic urban overview, an improved road safety analysis, and clear regulatory frameworks. This study also emphasizes the importance of participatory urban governance in addressing community needs and ensuring accessibility. Policy recommendations are provided to support the development of inclusive and sustainable micromobility systems in medium-sized cities.

1. Introduction

The rapid growth of urban populations and the effects of climate change have deep implications for how people use public spaces in contemporary cities. These intertwined challenges underscore the need for holistic approaches to urban planning and mobility systems that prioritize the sustainability, inclusion, and well-being of individuals [1,2]. Addressing such complex issues requires not only technical innovations, but also collaborative solutions that involve diverse stakeholders and aim to create cities that are resilient and fair for all.
An inclusive city ensures that all inhabitants -regardless of age, gender, ability, or socioeconomic status- have equitable access to public spaces, resources, and opportunities. Key criteria for inclusive cities include the promotion of social integration, accessibility to infrastructure and services, participatory urban governance, and the ability to foster a sense of belonging among diverse populations [3,4]. The concept of inclusivity in cities extends beyond physical accessibility, emphasizing equity in housing, education, healthcare, employment, and public spaces [5]. Inclusive urban planning aims to reduce social disparities by fostering participatory decision-making processes and creating environments that promote diversity, social cohesion, and resilience [6].
In this context, inclusion is intrinsically linked to sustainability, as cities that accommodate diverse needs and perspectives are better positioned to thrive in the face of environmental, economic, and social challenges [7].
In response to these challenges, the Inclusive MicroMob project has explored the role and impact of emerging mobility solutions within urban centers. Specifically, the project examined the introduction of a new micromobility device in a real context like Lugano, Switzerland. Micromobility—which includes modes of transport such as e-scooters, bicycles, and other small lightweight vehicles—has gained significant attention in recent years for its potential to address challenges of urban mobility, reduce environmental impacts, and improve accessibility [8,9]. In addition, the role of micromobility in urban transportation appears to have a significant impact on the implementation of the Sustainable Development Goals (SDGs) of the United Nations and supports the management of the transition from energy to decarbonization [10]. This is particularly relevant within the framework of sustainable urban development outlined in SDG 11, where micromobility serves not only as a tool to promote accessible and low-emission transport, but also as a catalyst for participatory governance, fostering inclusive decision-making processes that improve urban resilience and livability. Therefore, the integration of these new technologies into existing urban systems presents unique challenges and opportunities that require careful analysis.
This study began by referencing existing research on micromobility, with particular attention to the integration of these solutions into urban planning and potential conflicts with other transport modes. In particular, studies examining the role of micromobility in improving connectivity between neighborhoods were analyzed, such as that of Vizmpa et al. [11], which highlights the importance of safe urban pathways to ensure equitable access to services and reduce car dependency. At the same time, the need for data-driven solutions to optimize the use of micromobility in complex urban contexts was considered, as demonstrated by Tamagusko et al. [12], whose approach leverages computer vision techniques to identify risk factors in cycling infrastructure. While data are crucial, so is citizens’ perception, which can emerge through participatory processes.
The combination of these two factors -quantitative and qualitative- constitutes the method adopted by this research to investigate the opportunities and needs of micromobility in a real urban context. This approach aligns with recent studies highlighting the importance of integrating objective data with a participatory perspective to better understand urban mobility dynamics [8,13]. In particular, the quantitative dimension allows for the analysis of data on the demand and supply of micromobility services, infrastructure usage, and impacts on traffic and emissions [14]. However, several studies emphasize that quantitative data alone can be limiting, as they do not always capture user perceptions, adoption barriers, and preferences. For this reason, integrating a qualitative perspective -based on interviews, observations, and participatory processes- is essential for identifying social, cultural, and economic factors influencing the adoption of micromobility. Building on these references, this study aims to bridge a gap in existing research by providing a more comprehensive framework on the opportunities and challenges of micromobility integration in urban spaces. The objective is to combine data analysis with an inclusive and participatory perspective, contributing to a better understanding of the dynamics of accessibility, sustainability, and social acceptance of micromobility solutions in contemporary urban contexts.
The central hypothesis of the Inclusive MicroMob project is that the introduction of new micromobility devices can address both emerging and unmet mobility needs within urban settings. By allowing more flexible and adaptive forms of transportation, these devices have the potential to bridge accessibility gaps, reduce dependency on private vehicles, and foster greater inclusivity in how people move through and interact with public spaces [15].
This study seeks to address the following key questions: How can new forms of micromobility be effectively integrated into the current urban mobility scenario? What types of conflict arise from their implementation and how can these conflicts be mitigated? Furthermore, what lessons can be learned from the Lugano case study to inform the broader development of inclusive and sustainable urban mobility systems?
Through an interdisciplinary approach, this paper aims to contribute to the ongoing discussion on urban mobility and inclusivity, offering insights and strategies for the implementation of micromobility solutions that align with the evolving needs of cities and their inhabitants.

State of the Art: Micromobility

Mobility represents a crucial aspect of modern life. Although the movement of populations across the Earth’s surface is one of humanity’s oldest characteristics, urban environments have become the primary context where mobility systems have developed and manifested in all their physical and cultural complexity [16].
Following the recent pandemic, new lifestyles and technological advancements have led urban mobility to undergo increasingly profound changes, shaping movement and behavior within cities. The rise of micromobility offers a flexible transportation option aimed at reducing the individual use of vehicles while enabling intermodal approaches [17]. This shift holds the potential to decrease congestion, the space required for parking, and both atmospheric and noise pollution.
According to the definition provided by the Italian Encyclopedia Institute [18], micromobility refers to mobility over short distances, primarily within cities, characterized by the use of lighter, less cumbersome, and potentially less polluting transportation modes compared to traditional ones. Although there is no universally recognized definition of micromobility, the International Transport Forum (ITF) uses several parameters to classify lightweight vehicles: speed (a maximum of 45 km/h), weight (up to 350 kg), and power output (a maximum of 2000 W). Subsequently, individual countries define national parameters that may differ but cannot exceed the international limits [19].
Micromobility devices can be categorized into human-powered and electric-assisted vehicles. Human-powered options include traditional bicycles, kick scooters, roller skates, and similar devices, while electric-powered options encompass electric scooters, e-bikes (including foldable ones), and self-balancing devices such as segways, monowheels, and hoverboards, as well as electric skateboards [20].
Another key distinction lies in the mode of use: private or shared. Shared vehicles are made available to the public through mobile applications, enabling users to locate, activate, and deactivate them as needed. There are two main types of trips: docked and dockless. The former involves starting and ending trips at predefined docking stations specifically designed for micromobility vehicles, while the latter allows for free-floating trips, where vehicles can be picked up and dropped off (activated and deactivated) anywhere.
According to Oeschger et al. [19], it is essential to consider the development of micromobility devices as complementary to existing public transport networks. The preferred use case for these services is the “first and last mile” of a journey, with the primary goal of reducing motorized transportation modes. While these services allow users to organize their movements flexibly according to their needs, Rossato [20] highlights a potential challenge: micromobility devices may be used as an alternative to walking, which could have significant implications for urban space planning, management, and allocation.
Switzerland has seen a rapid expansion of micromobility services, particularly in the main cities (Zurich, Geneva, and Basel), where shared e-scooters and bicycles complement public transportation [21]. The country’s strong commitment to sustainability and well-developed cycling infrastructure support this growth. However, challenges persist, including regulations, safety, and public space management [14].
After a rapid rise in the use of private and shared micromobility devices, some cities (e.g., Paris) have experienced growing dissatisfaction and criticism. One major concern relates to parking behavior and the inappropriate use of public spaces, often leading to sidewalk clutter and accessibility issues for pedestrians, especially those with reduced mobility. Additionally, road safety remains a significant issue, with reports of accidents involving e-scooters and bicycles raising questions about infrastructure adequacy and the enforcement of traffic regulations [22]. The competition for limited space in urban areas further makes tensions between different categories of road users, including pedestrians, cyclists, micromobility users, and drivers. In recent times, adjustments and experimentation have been implemented in regulatory frameworks to address these challenges. To develop inclusive solutions, it is essential to broaden the discussion to include the design and management of public spaces, as well as the perceptions and needs of inhabitants. Effective regulation and thoughtful design of public spaces are crucial to mitigating conflicts and improving user experience. Furthermore, understanding the perceptions and expectations of inhabitants can support the development of policies that enhance the social acceptance and long-term viability of micromobility solutions.

2. Method and Materials

2.1. The Interdisciplinary Approach

The Inclusive MicroMob project was based on an interdisciplinary approach, integrating urban analysis, urban experimentation, and social testing. This study reflects on micromobility in Switzerland, with particular attention to the city of Lugano, which served as a privileged observatory for real-world testing. These tests were made possible through the collaboration of the Lugano Living Lab and Genny Factory, the company behind a new micromobility device, Genny Zero. This approach enabled a comprehensive evaluation of the integration of the device in the urban context, considering both technical performance and social acceptance, ensuring that the findings could inform inclusive and sustainable urban mobility strategies.
Building on a dual methodology, namely merging data collection focused on urban micromobility with a qualitative social analysis of urban spaces, this article helps bridge a knowledge gap by focusing on three specific conceptual areas.
The first conceptual area concerns urban analysis and regulatory adaptation. This study examines the regulatory challenges, conditions, and policy adjustments required to integrate new forms of micromobility into existing urban transport networks. By comparing Swiss and Ticino regulations, it identifies gaps in planning and policies that must be addressed to ensure safety, multimodal integration, and efficient infrastructure planning. It provides several policy recommendations, including adaptive regulations, improved cycling infrastructure, and the importance of participatory initiatives to accommodate emerging transport modes.
The second conceptual area focuses on urban analysis and inclusivity. The method highlights how micromobility devices can enhance accessibility for all citizens, extending beyond those with reduced mobility, and ensuring that urban transport systems are more inclusive. It explores the role of micromobility in urban spaces and its interaction with pedestrians and other transport modes (e-bikes, electric scooters, etc.). Moreover, this study examines the contribution of micromobility to fostering a more participatory and equitable urban environment, where all individuals -regardless of physical ability or economic status- can engage in city life and access public spaces. The research aligns with the concept of urban citizenship by emphasizing how mobility rights and a participatory approach in policy-making are crucial components of social inclusion and belonging in urban settings.
The third conceptual area addresses public participation. This research underscores the need for participatory urban governance, in which residents actively engage in shaping micromobility policies and infrastructure. Through initiatives like the Ensemble-IMM Citizenship Laboratory, this project demonstrates how combining digital platforms with in-person actions can foster community involvement in decision-making. This study innovatively highlights generational and social differences in attitudes toward micromobility, reinforcing the importance of inclusive and transparent dialogue between urban policymakers and residents.
Figure 1 illustrates the strategy and the key elements developed throughout the project. It provides a comprehensive overview of the process, highlighting how each component contributes to the overall methodology and analysis.

2.2. Comparison of Swiss and Ticino Regulations on Micromobility

The regulation of micromobility is a pressing challenge that stems from its growth in recent years. The primary objectives are to improve road safety, adapt urban development and infrastructure, manage device placement and rental agreements, and reduce the environmental impact [23].
At the federal level in Switzerland, micromobility devices are classified as motorized vehicles. Specifically, fast e-bikes are considered single-track vehicles, while slow e-bikes, electric scooters, and similar devices fall under the category of light motorized bicycles. A third category includes motorized wheelchairs, while self-balancing devices are classified as self-balancing scooters. Roller skates, skateboards, and similar devices are considered “vehicle-like means of transport”.
This project focuses on self-balancing devices. These vehicles are subject to specific limitations, such as a maximum speed of 20 km/h, a weight limit of 200 kg, and a power output of up to 2000 W [24]. Like other single-track vehicles, self-balancing devices must have a control plate. For driving licenses, the requirements are the same as those for light motorized bicycles: individuals aged 14 to 16 years must have a license of the M class, while no license is required for users aged 16 and older, as specified in the Ordinance on Admission to Road Traffic [25]. Helmets are not mandatory but are strongly recommended.
The traffic rules for motorized bicycles align with those for conventional bicycles. This means that users should use bike lanes or bike paths where available, as outlined in the Ordinance on Traffic Rules [26]. The use of micromobility devices in pedestrian areas is allowed only for individuals with reduced mobility; otherwise, it is strictly prohibited (ONC, 1962). Devices like unicycles and hoverboards are excluded from the listed categories because they do not have all the technical requirements. Consequently, they are not authorized for use on public roads as they lack official approval [27].
In Ticino, the regulation [28] on micromobility vehicles subjects them to the following conditions:
  • They must adhere to the traffic regulations for bicycles;
  • They are required to use bike lanes when available;
  • They are prohibited from operating in pedestrian areas;
  • Their use is permitted from the age of 14 with an M-class (or G-class) license and without a license from the age of 16, except for fast e-bikes;
  • Helmet use is recommended and mandatory for fast e-bikes;
  • Segways, fast e-bikes, and motorized wheelchairs (except those with speeds under 10 km/h) must have a control plate.
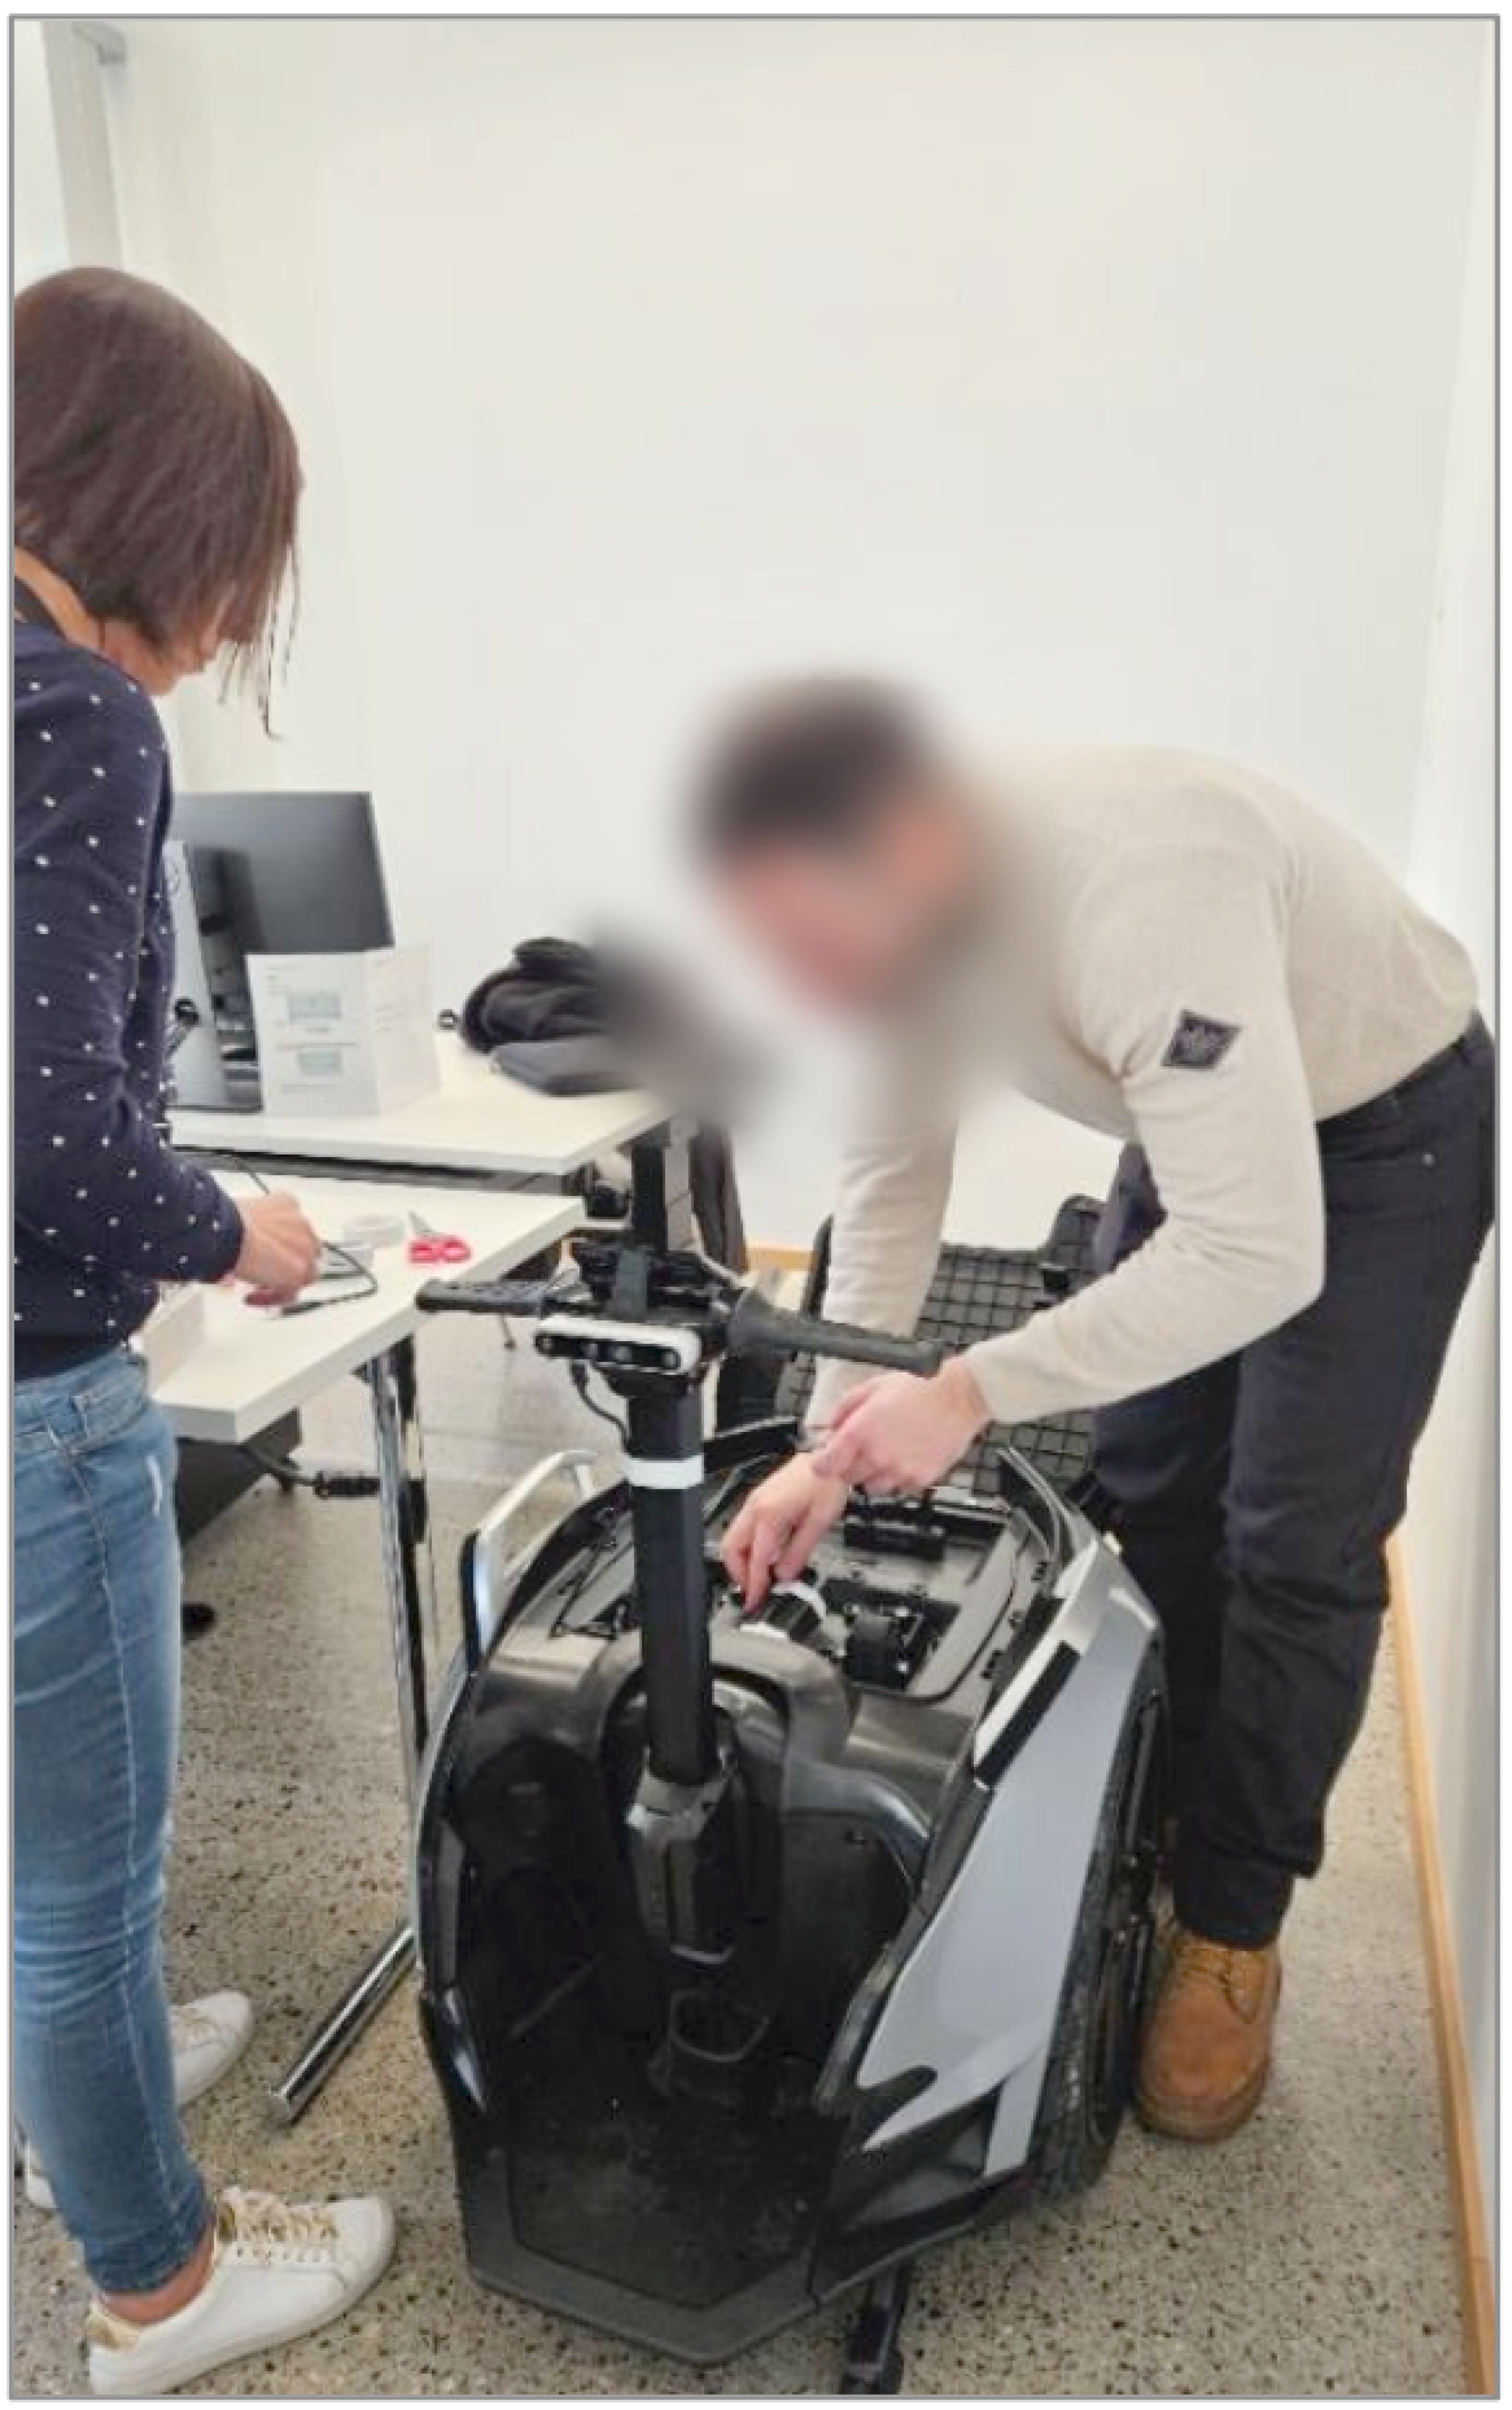
Unlike the federal regulations, the cantonal provisions in Ticino allow micromobility devices to be operated by individuals with a G-class license (for agricultural vehicles) in addition to an M-class license. This difference reflects a unique adaptation of federal guidelines to local needs, highlighting a degree of regulatory flexibility at the cantonal level.
In general, while both Swiss and Ticino regulations emphasize safety, accessibility, and integration into existing traffic rules, the specific distinctions in licensing and access to certain devices underscore the importance of tailoring regulations to regional contexts and priorities.

2.3. Genny Zero

The micromobility device at the center of the Inclusive MicroMob project is called Genny Zero (Figure 2). This is the evolution of Genny 1.0, a medical tool for people with reduced mobility that is now also offered as a micomobility tool, which in Switzerland may be used with a license plate or without, depending on legislative development. Its technical specifications are as follows:
  • Minimum weight: 50 kg, maximum weight: 110 kg
  • Maximum power: 2000 W
  • Maximum speed: 15 km/h
  • Maximum incline: 20%
Considering the characteristics of micromobility vehicles, it can be stated that this device is classified as a segway. This means it must have a control plate, and an M-class license is required for operation between the ages of 14 and 16.

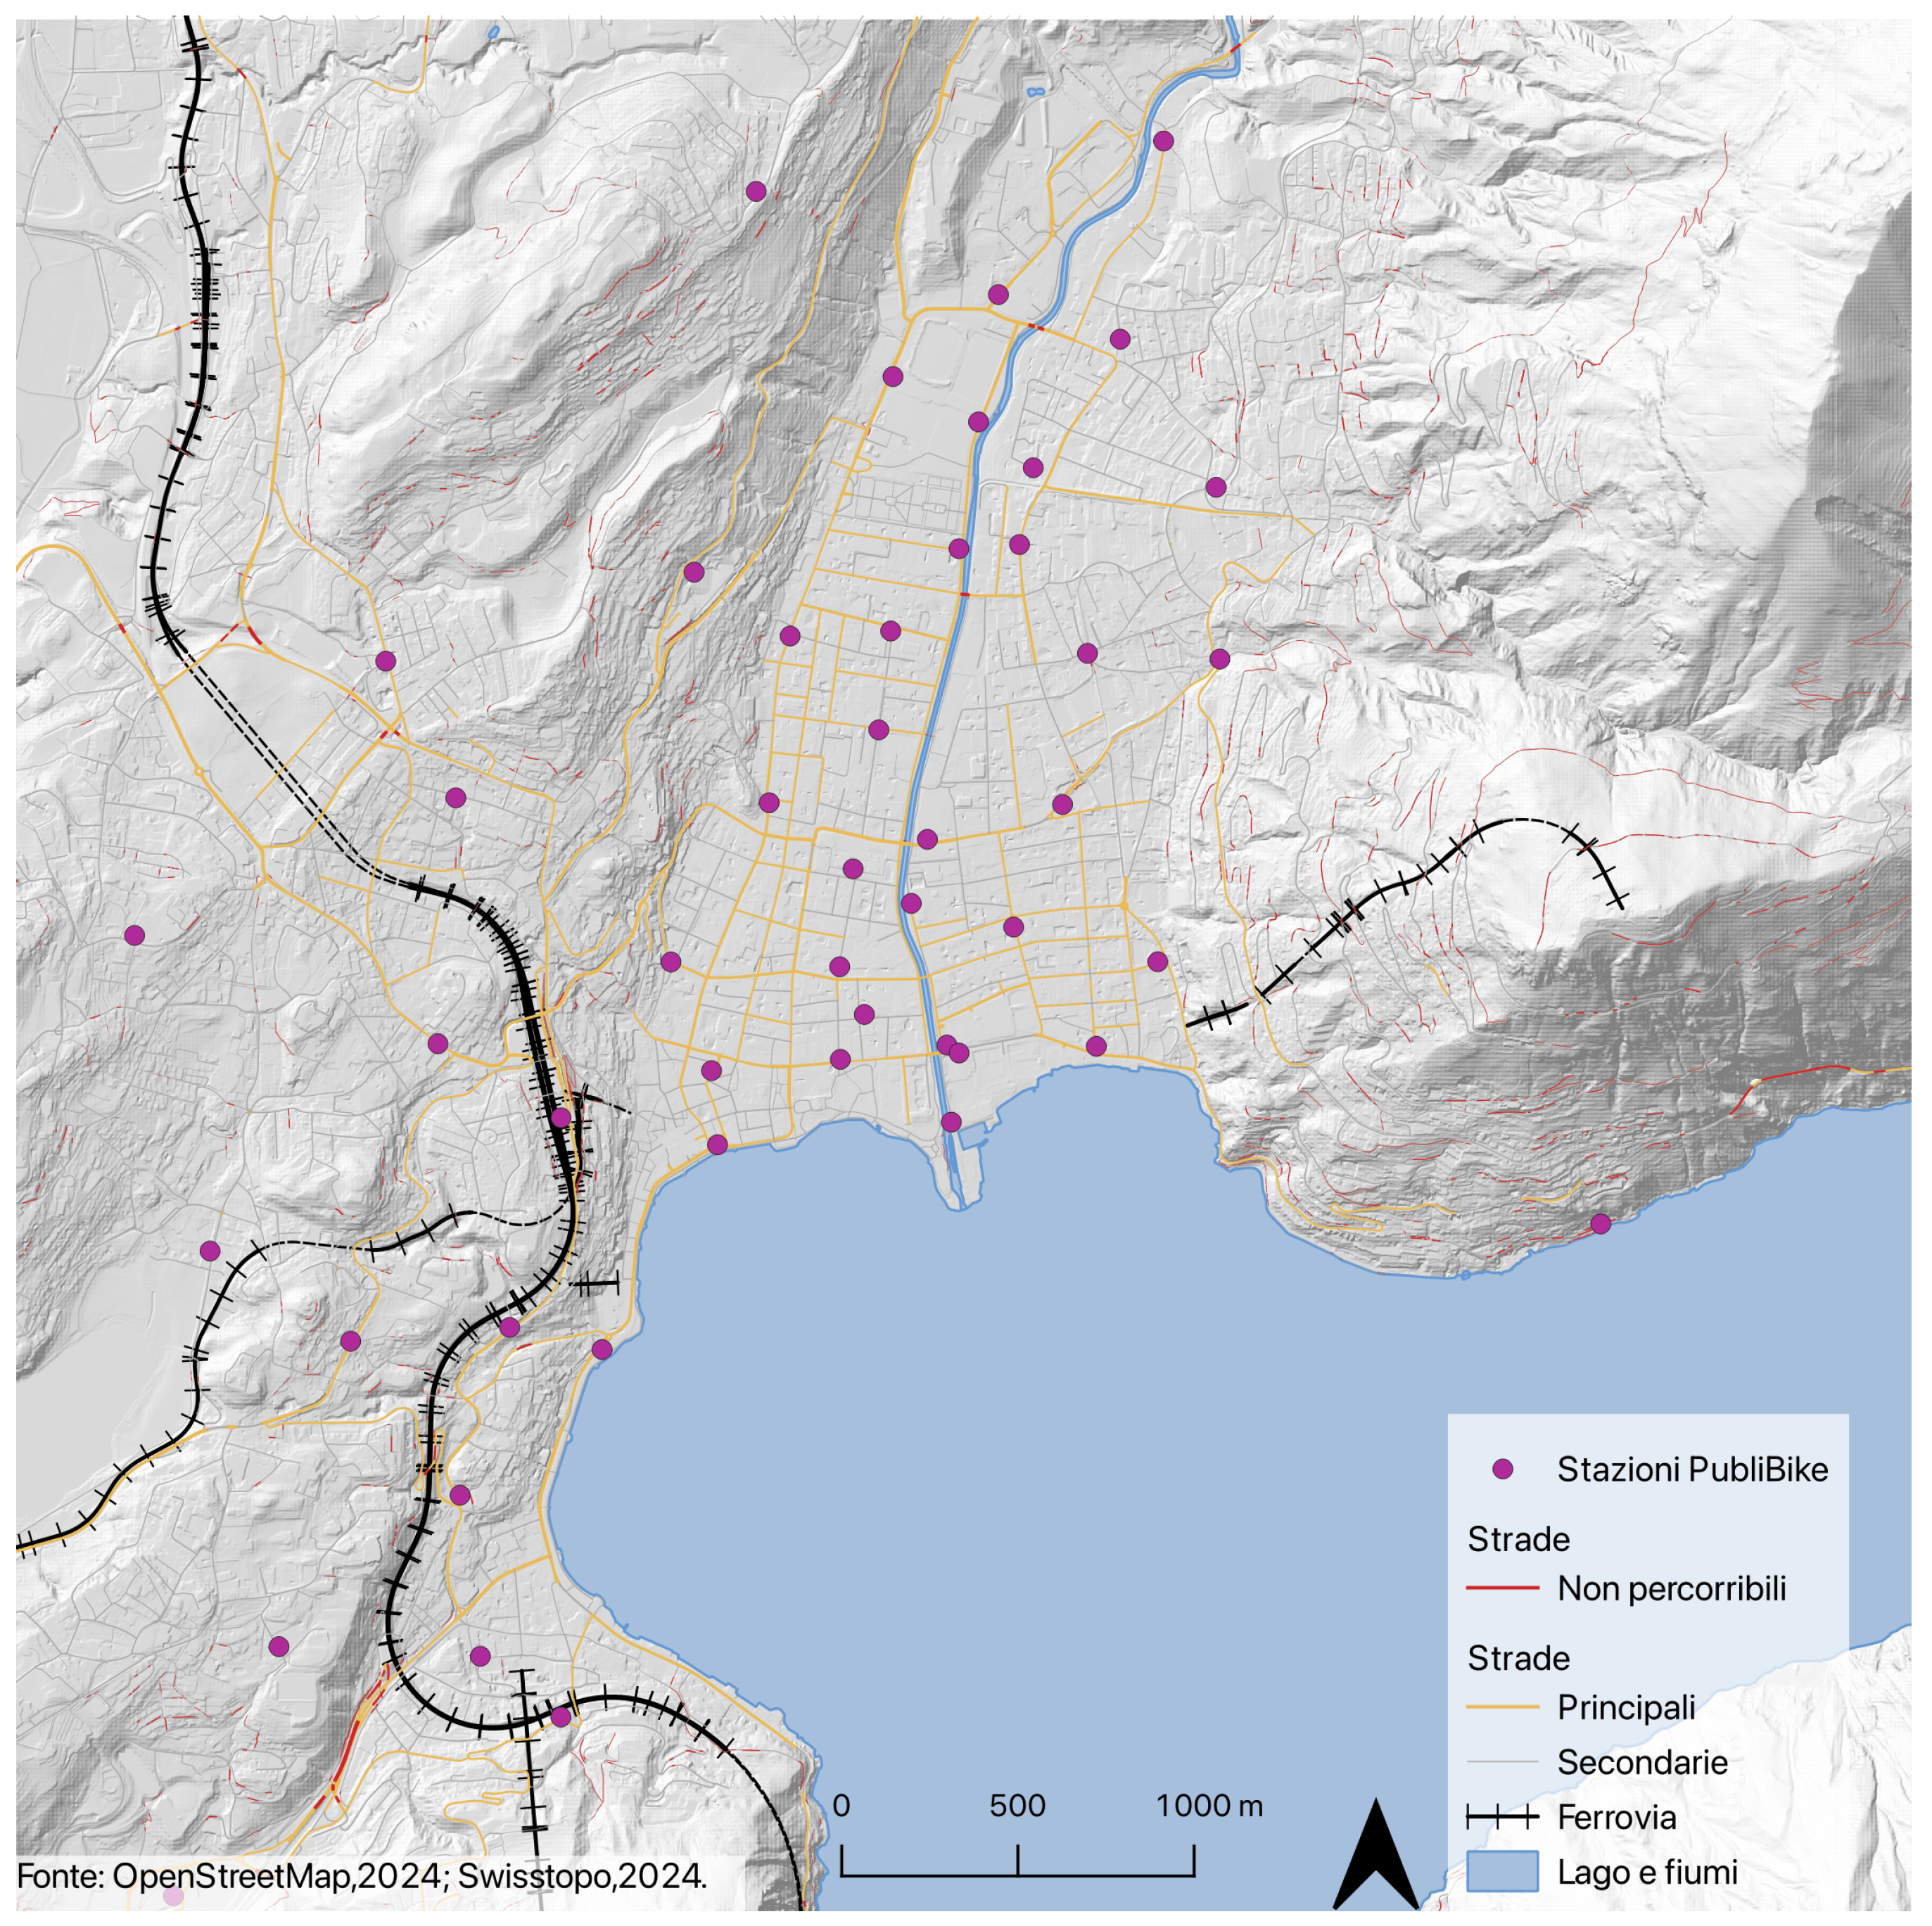
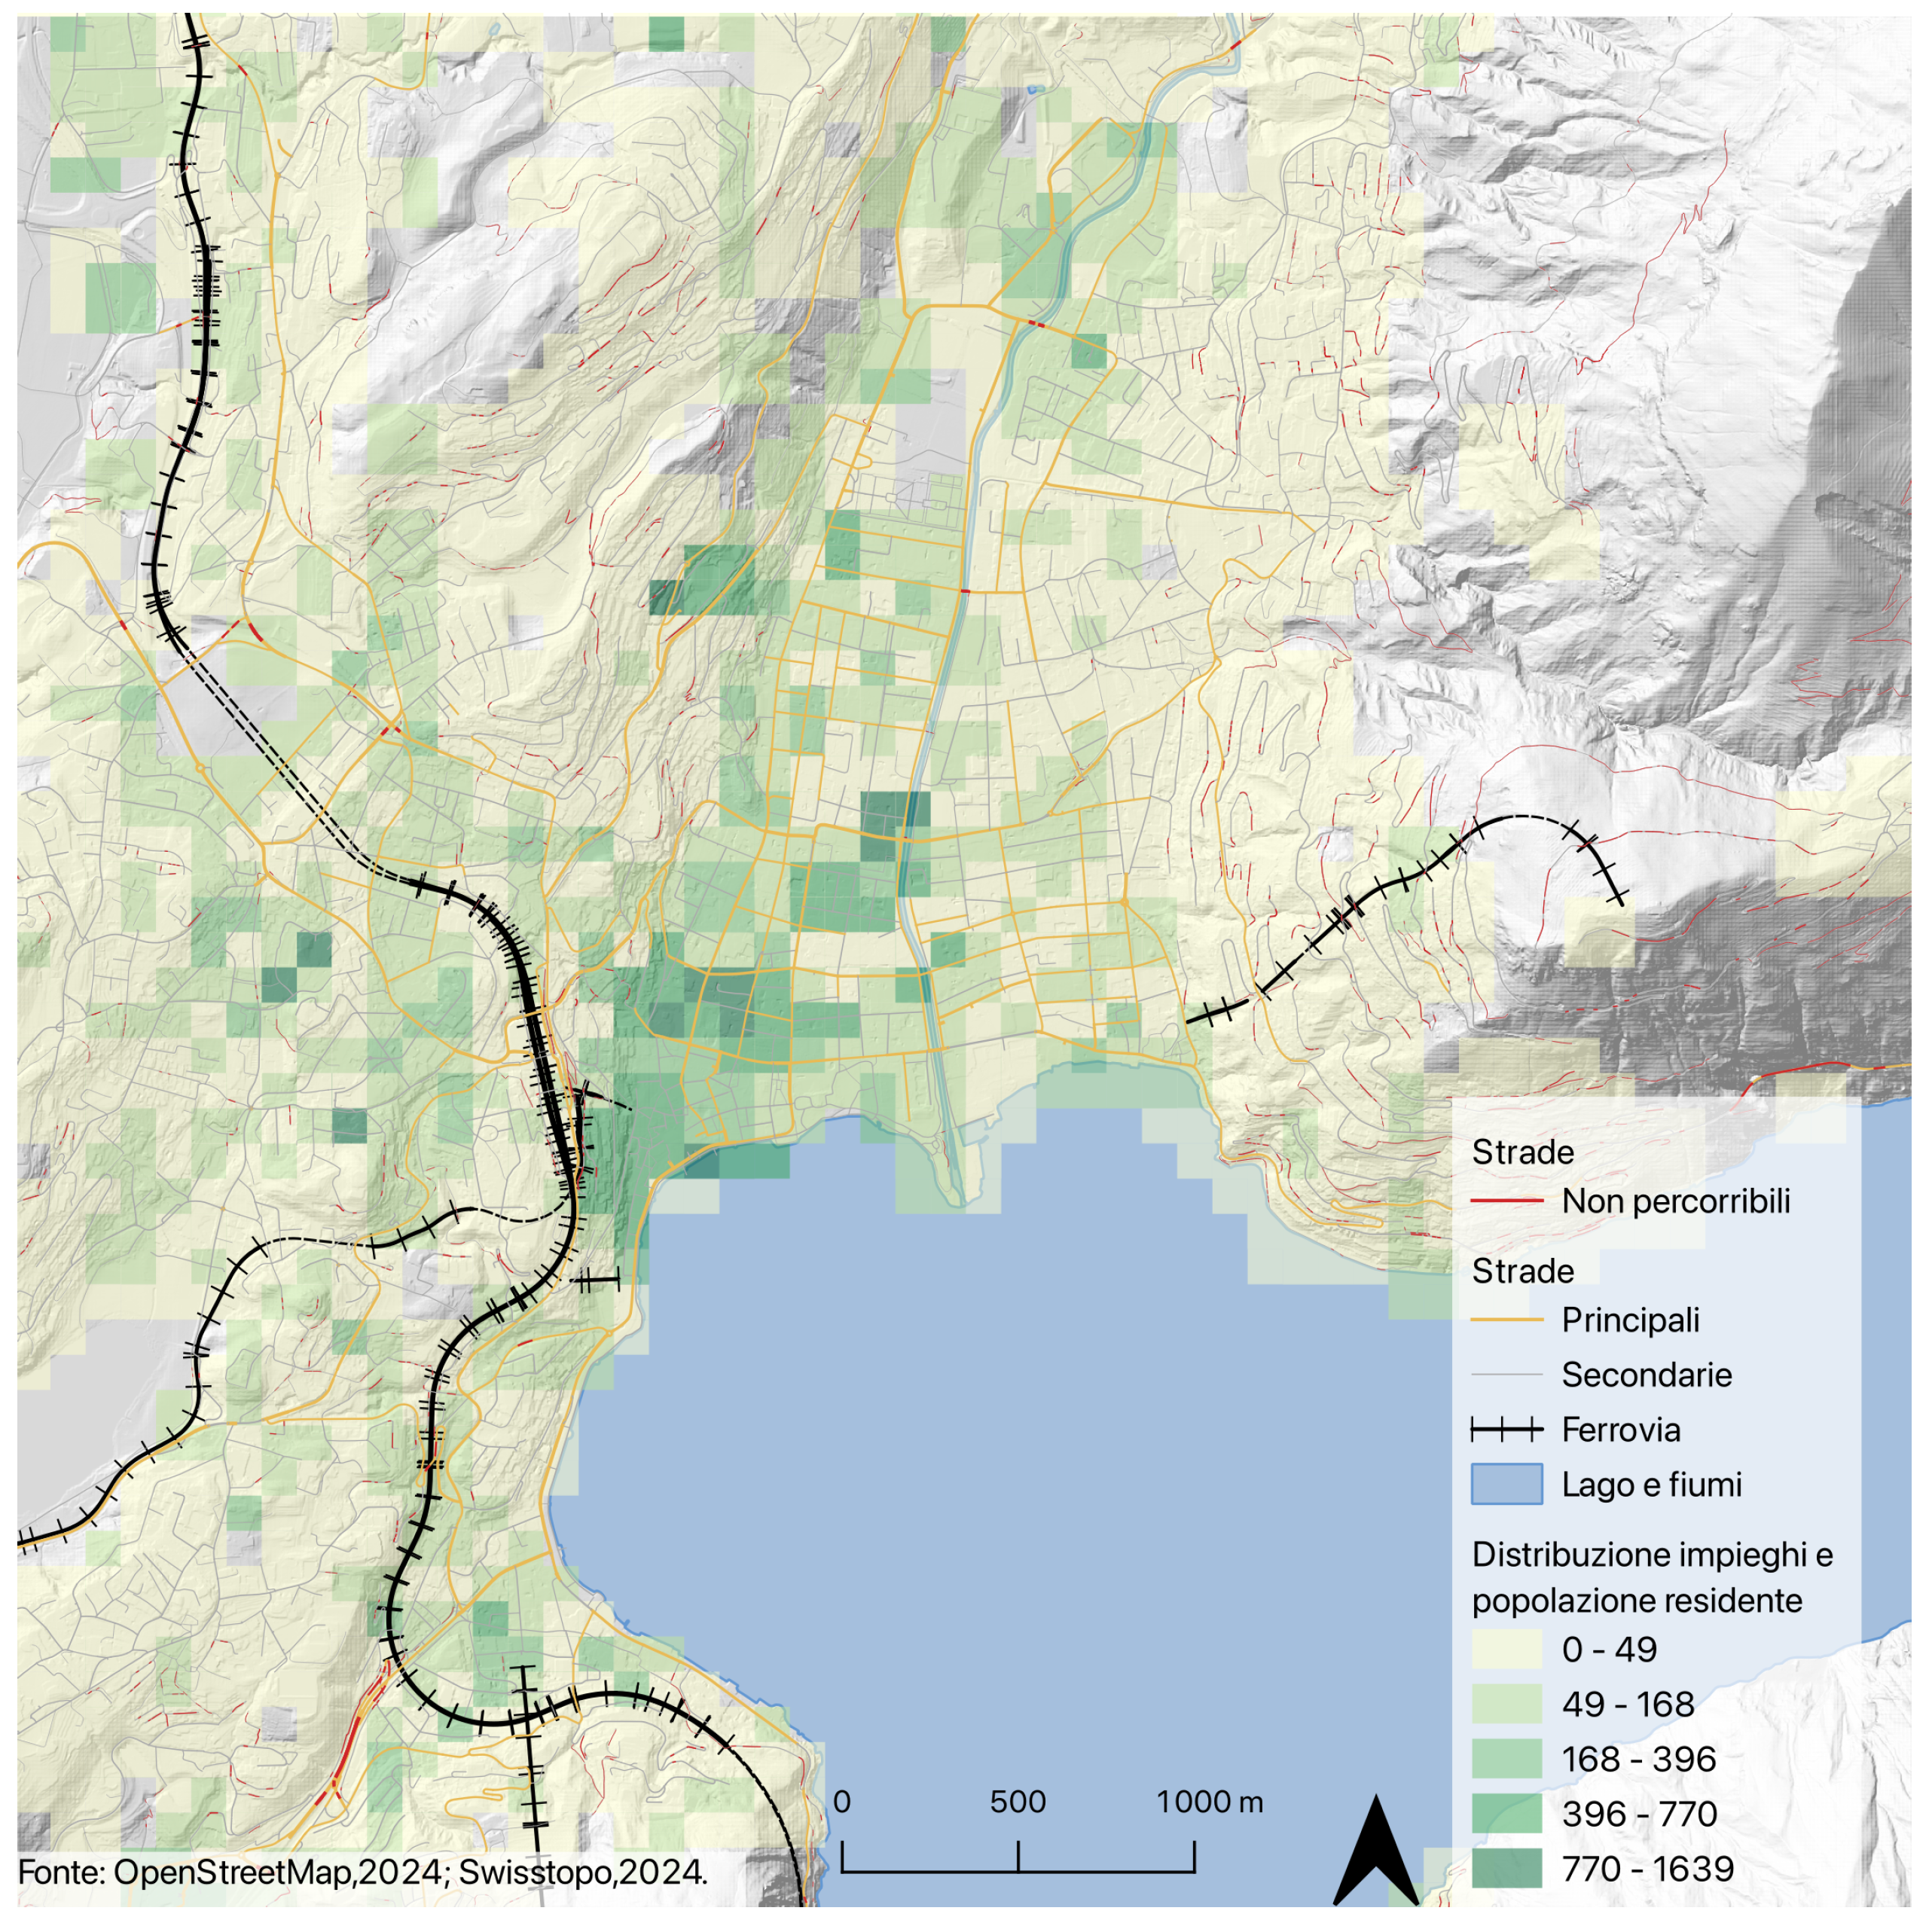
2.4. Data Collection: Urban Analysis

The urban analysis was based on several key datasets.
  • Existing supply and demand: evaluated through an analysis of the resident population and total job opportunities.
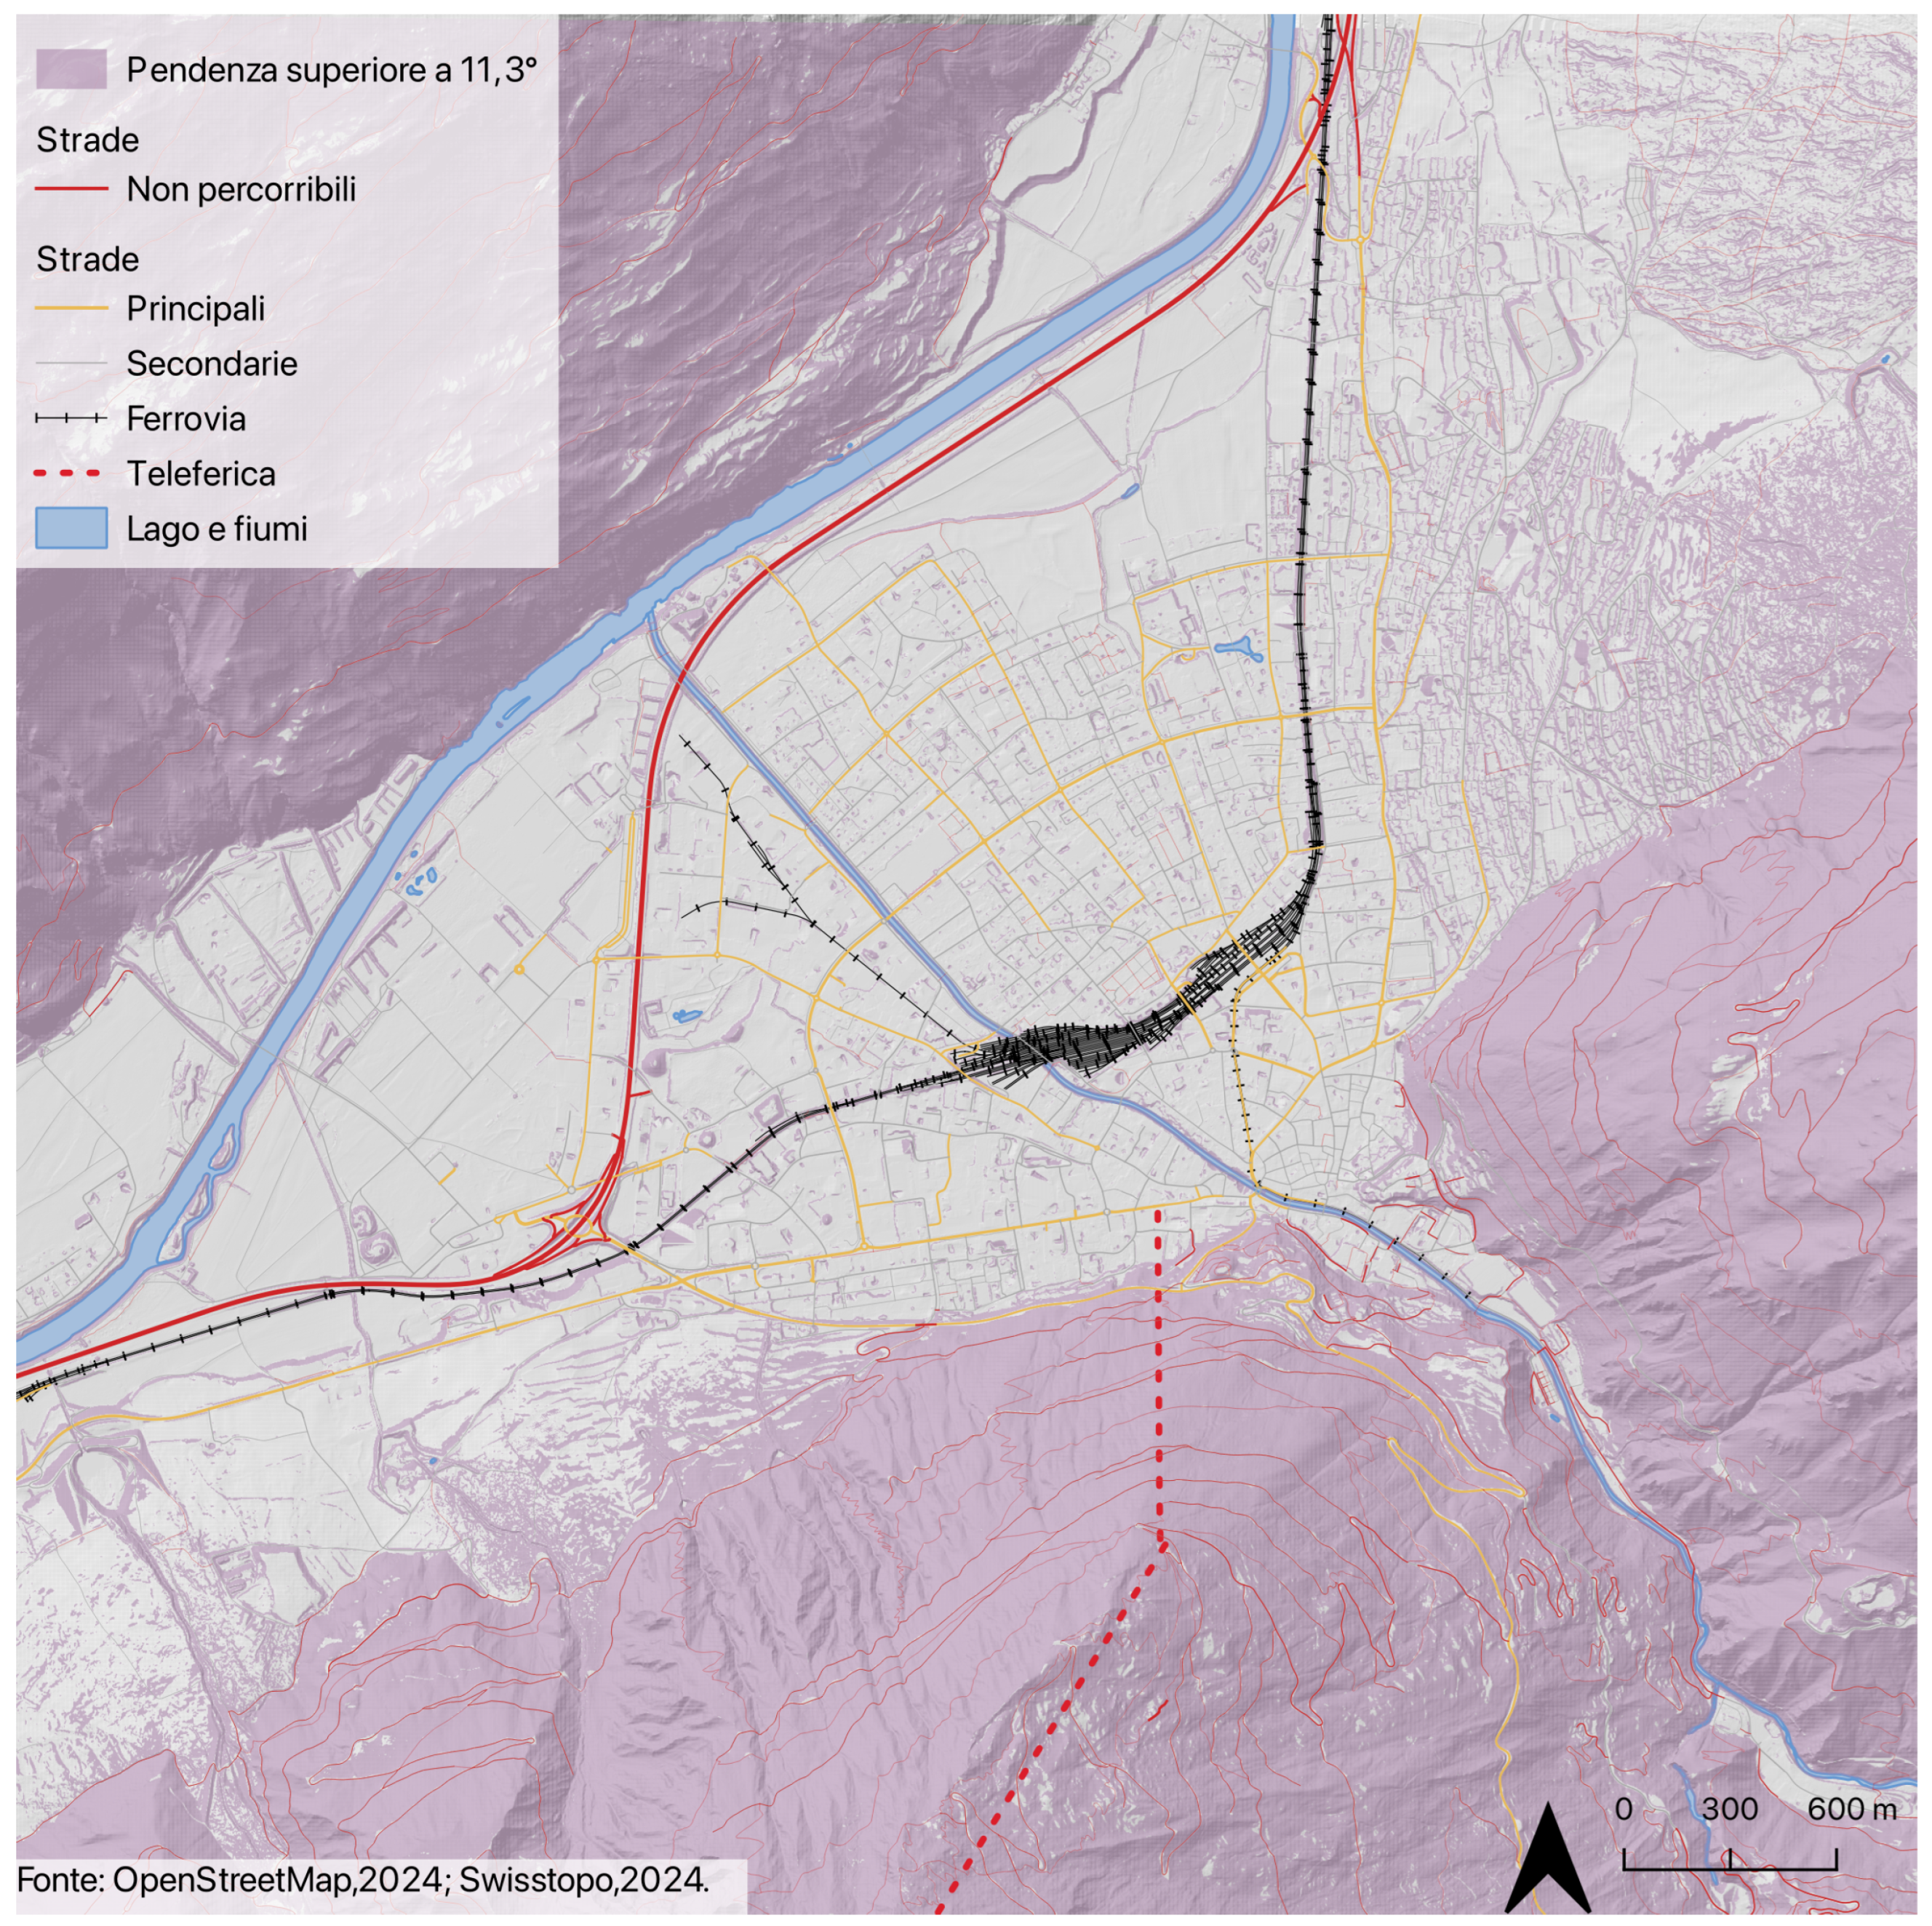
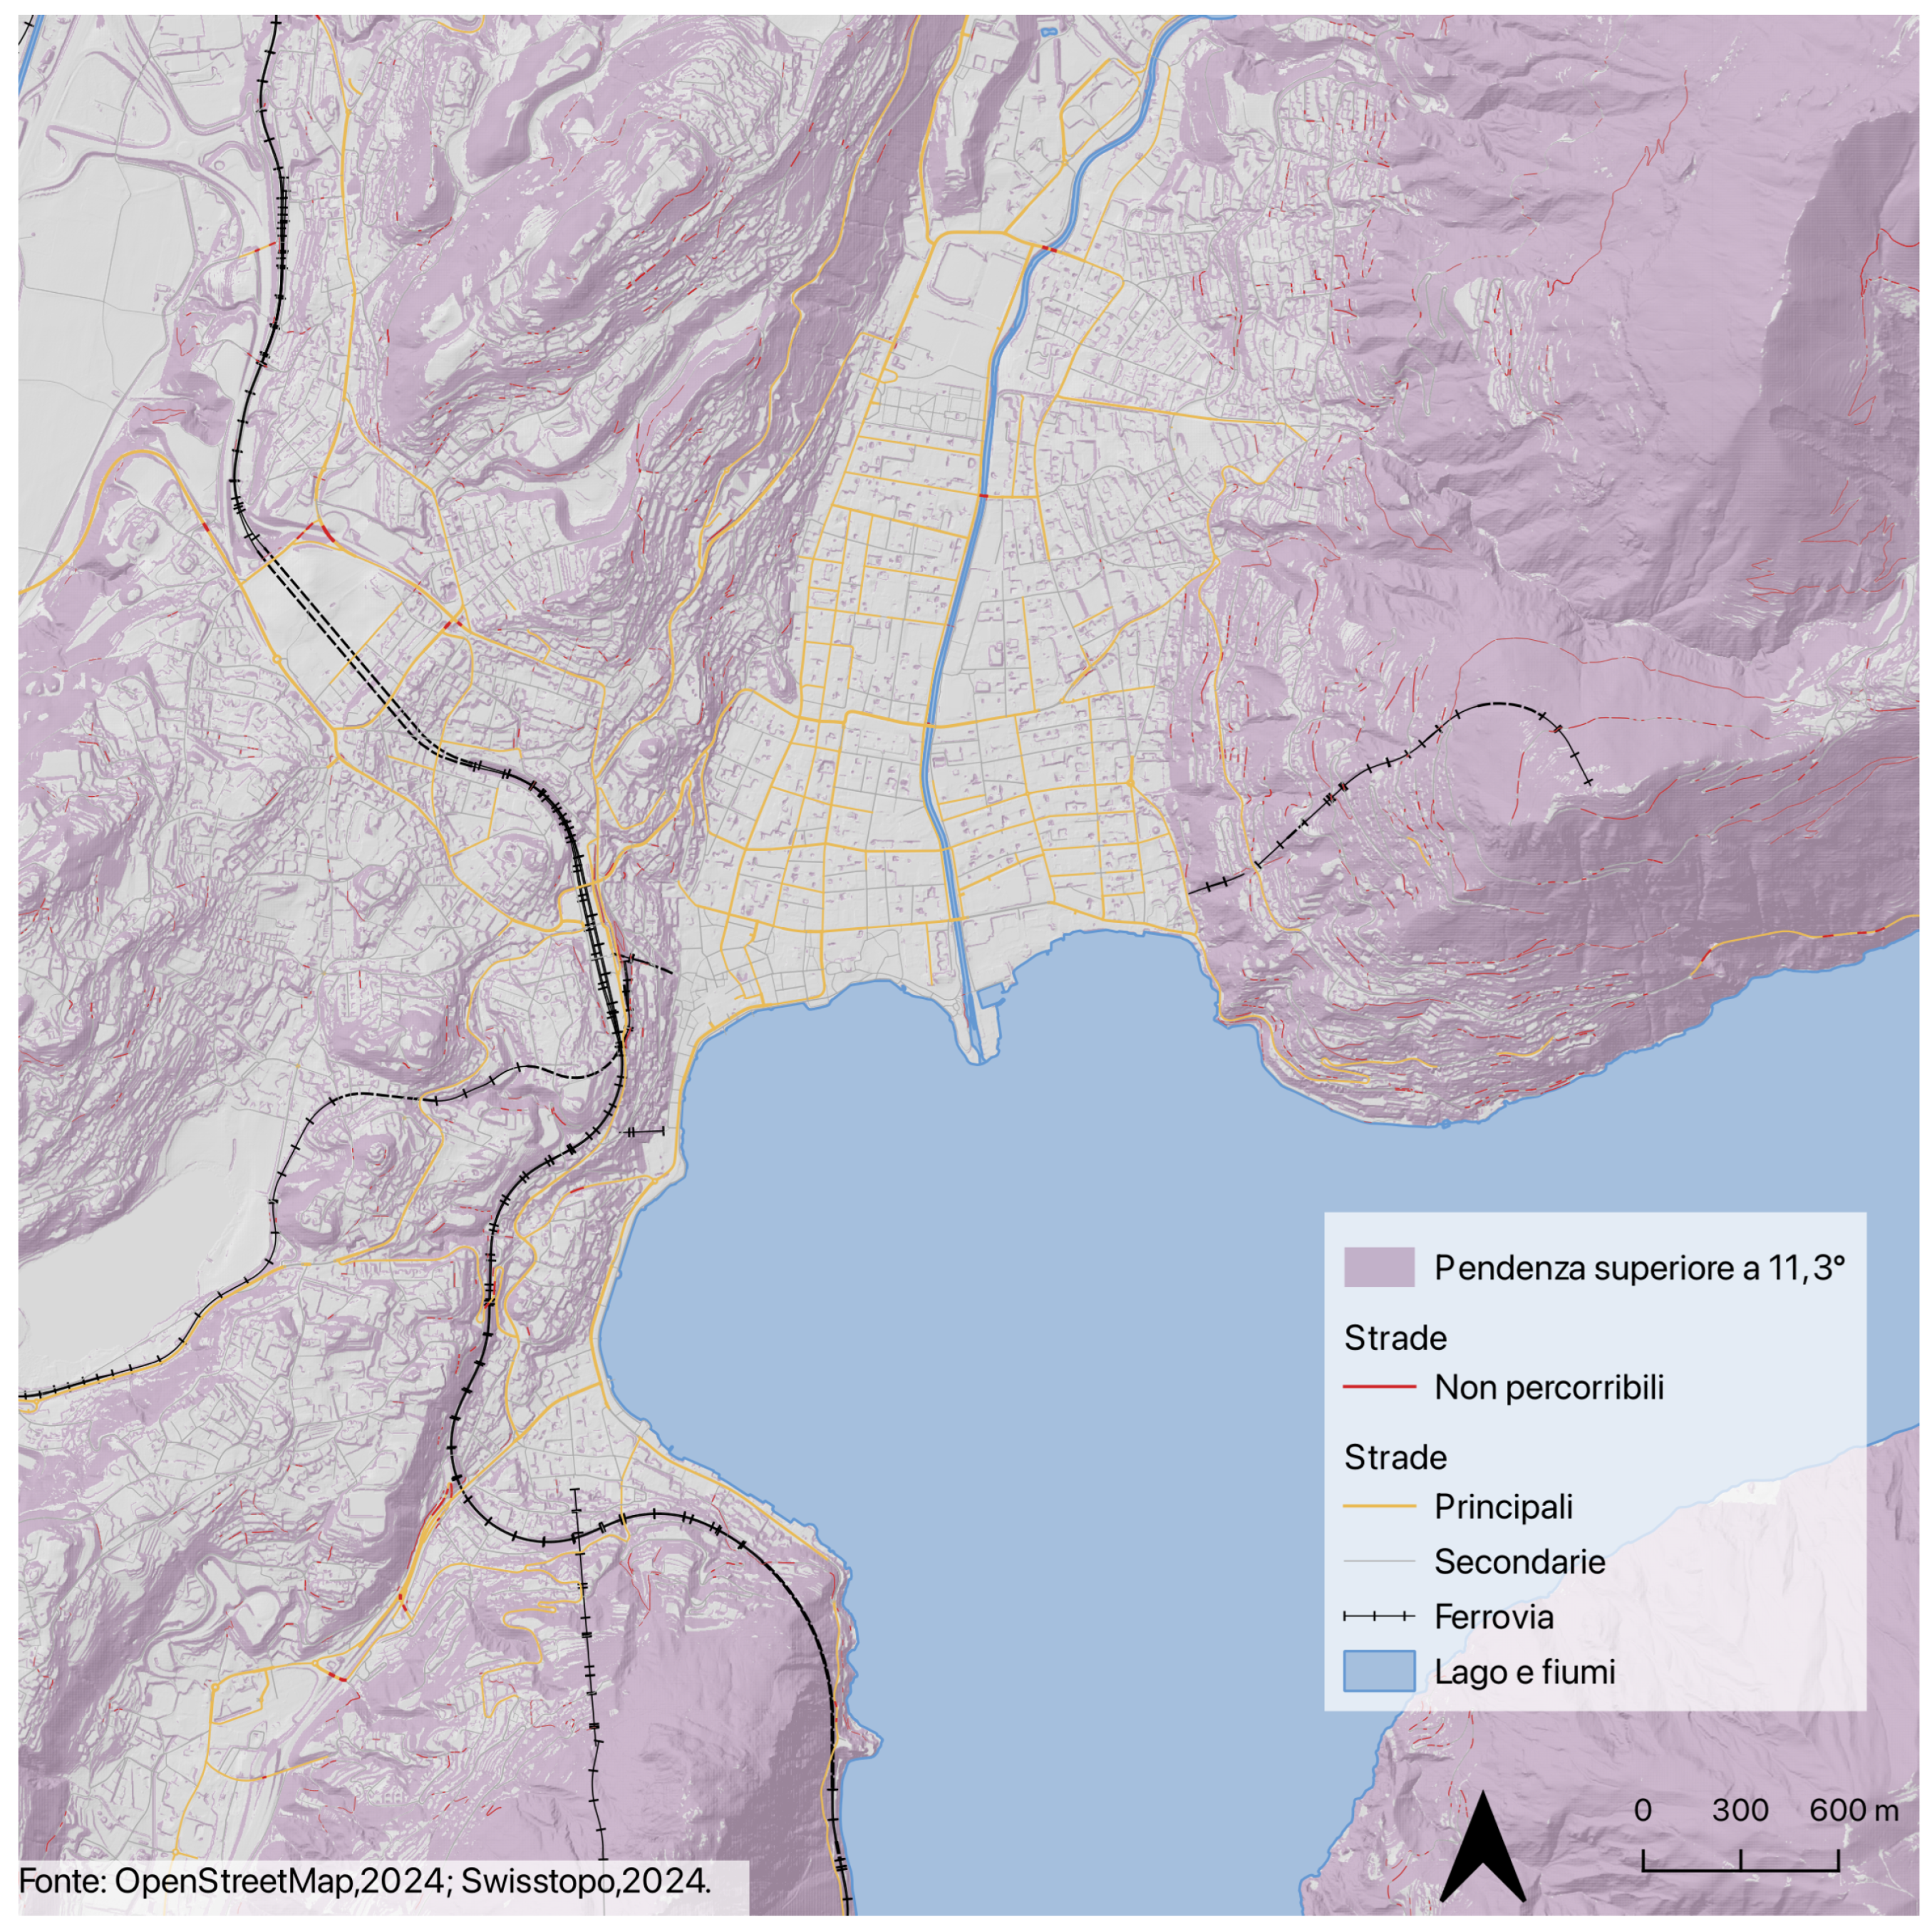
  • Street gradients: the Genny Zero device is suitable for slopes with a maximum gradient of 20%, equivalent to approximately 11.3 degrees. Roads were categorized as either accessible (gradient below 11.3°) or requiring exchange points or alternative solutions (gradient above 11.3°).
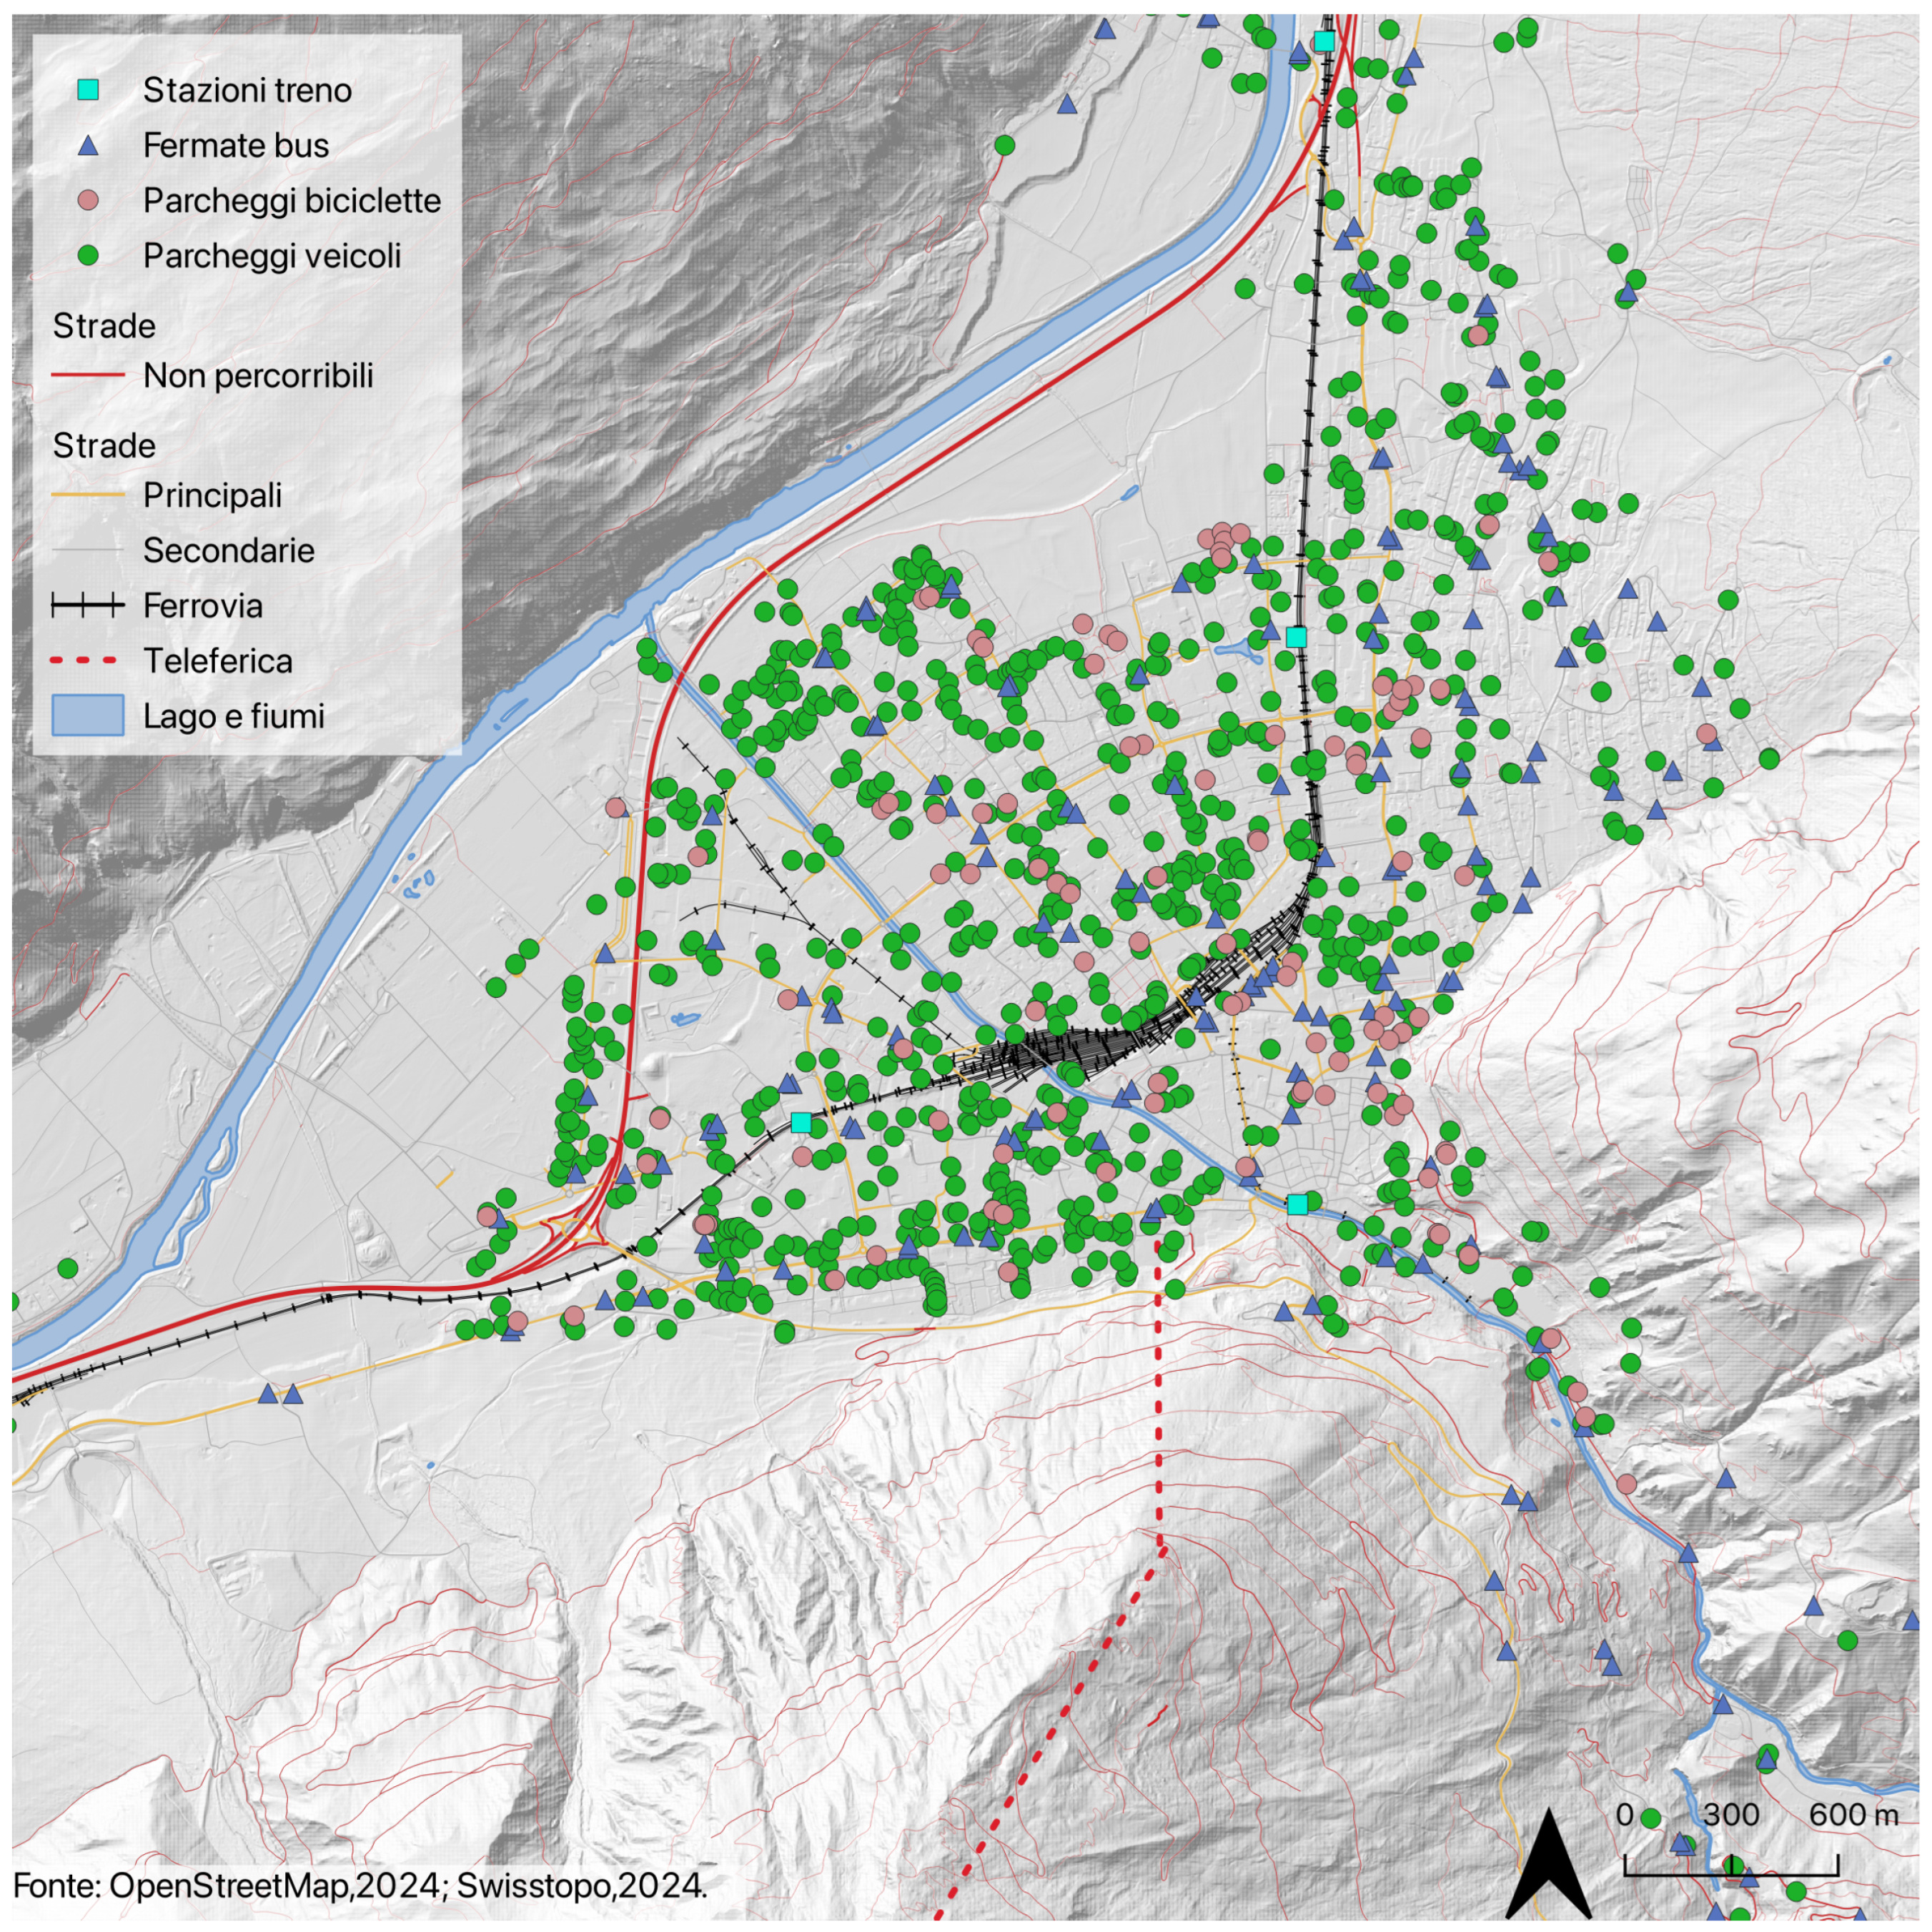
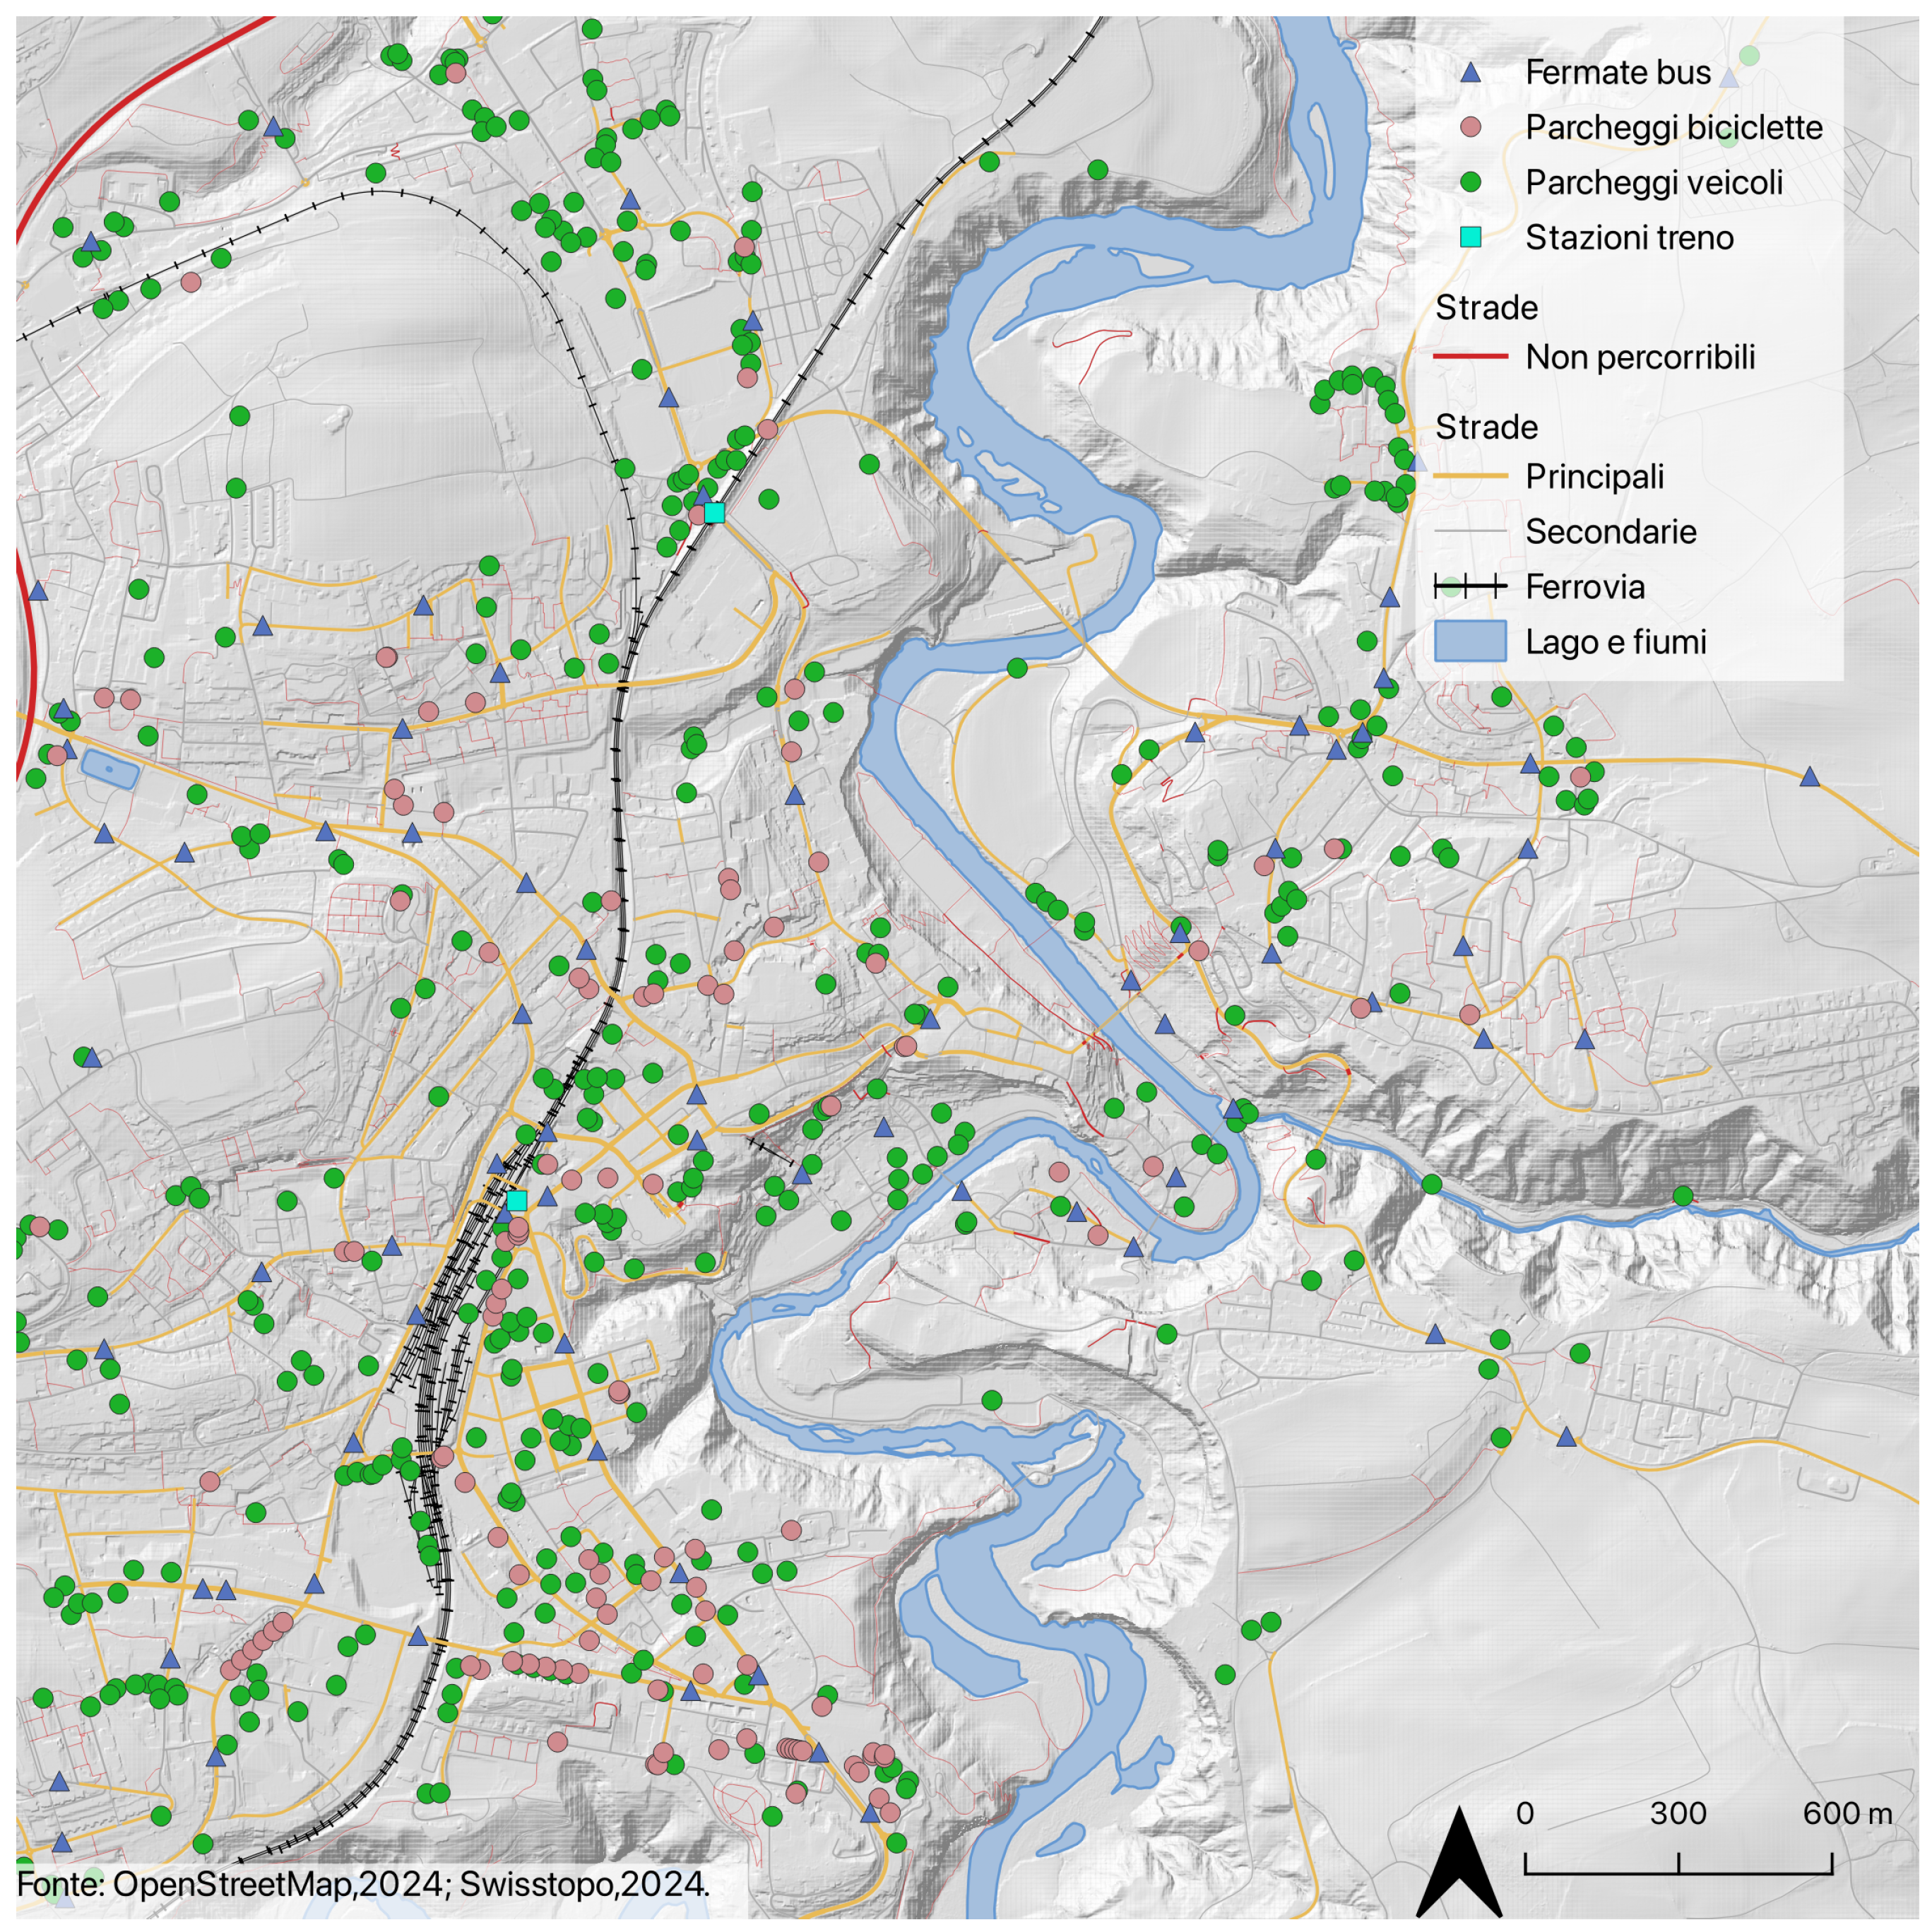
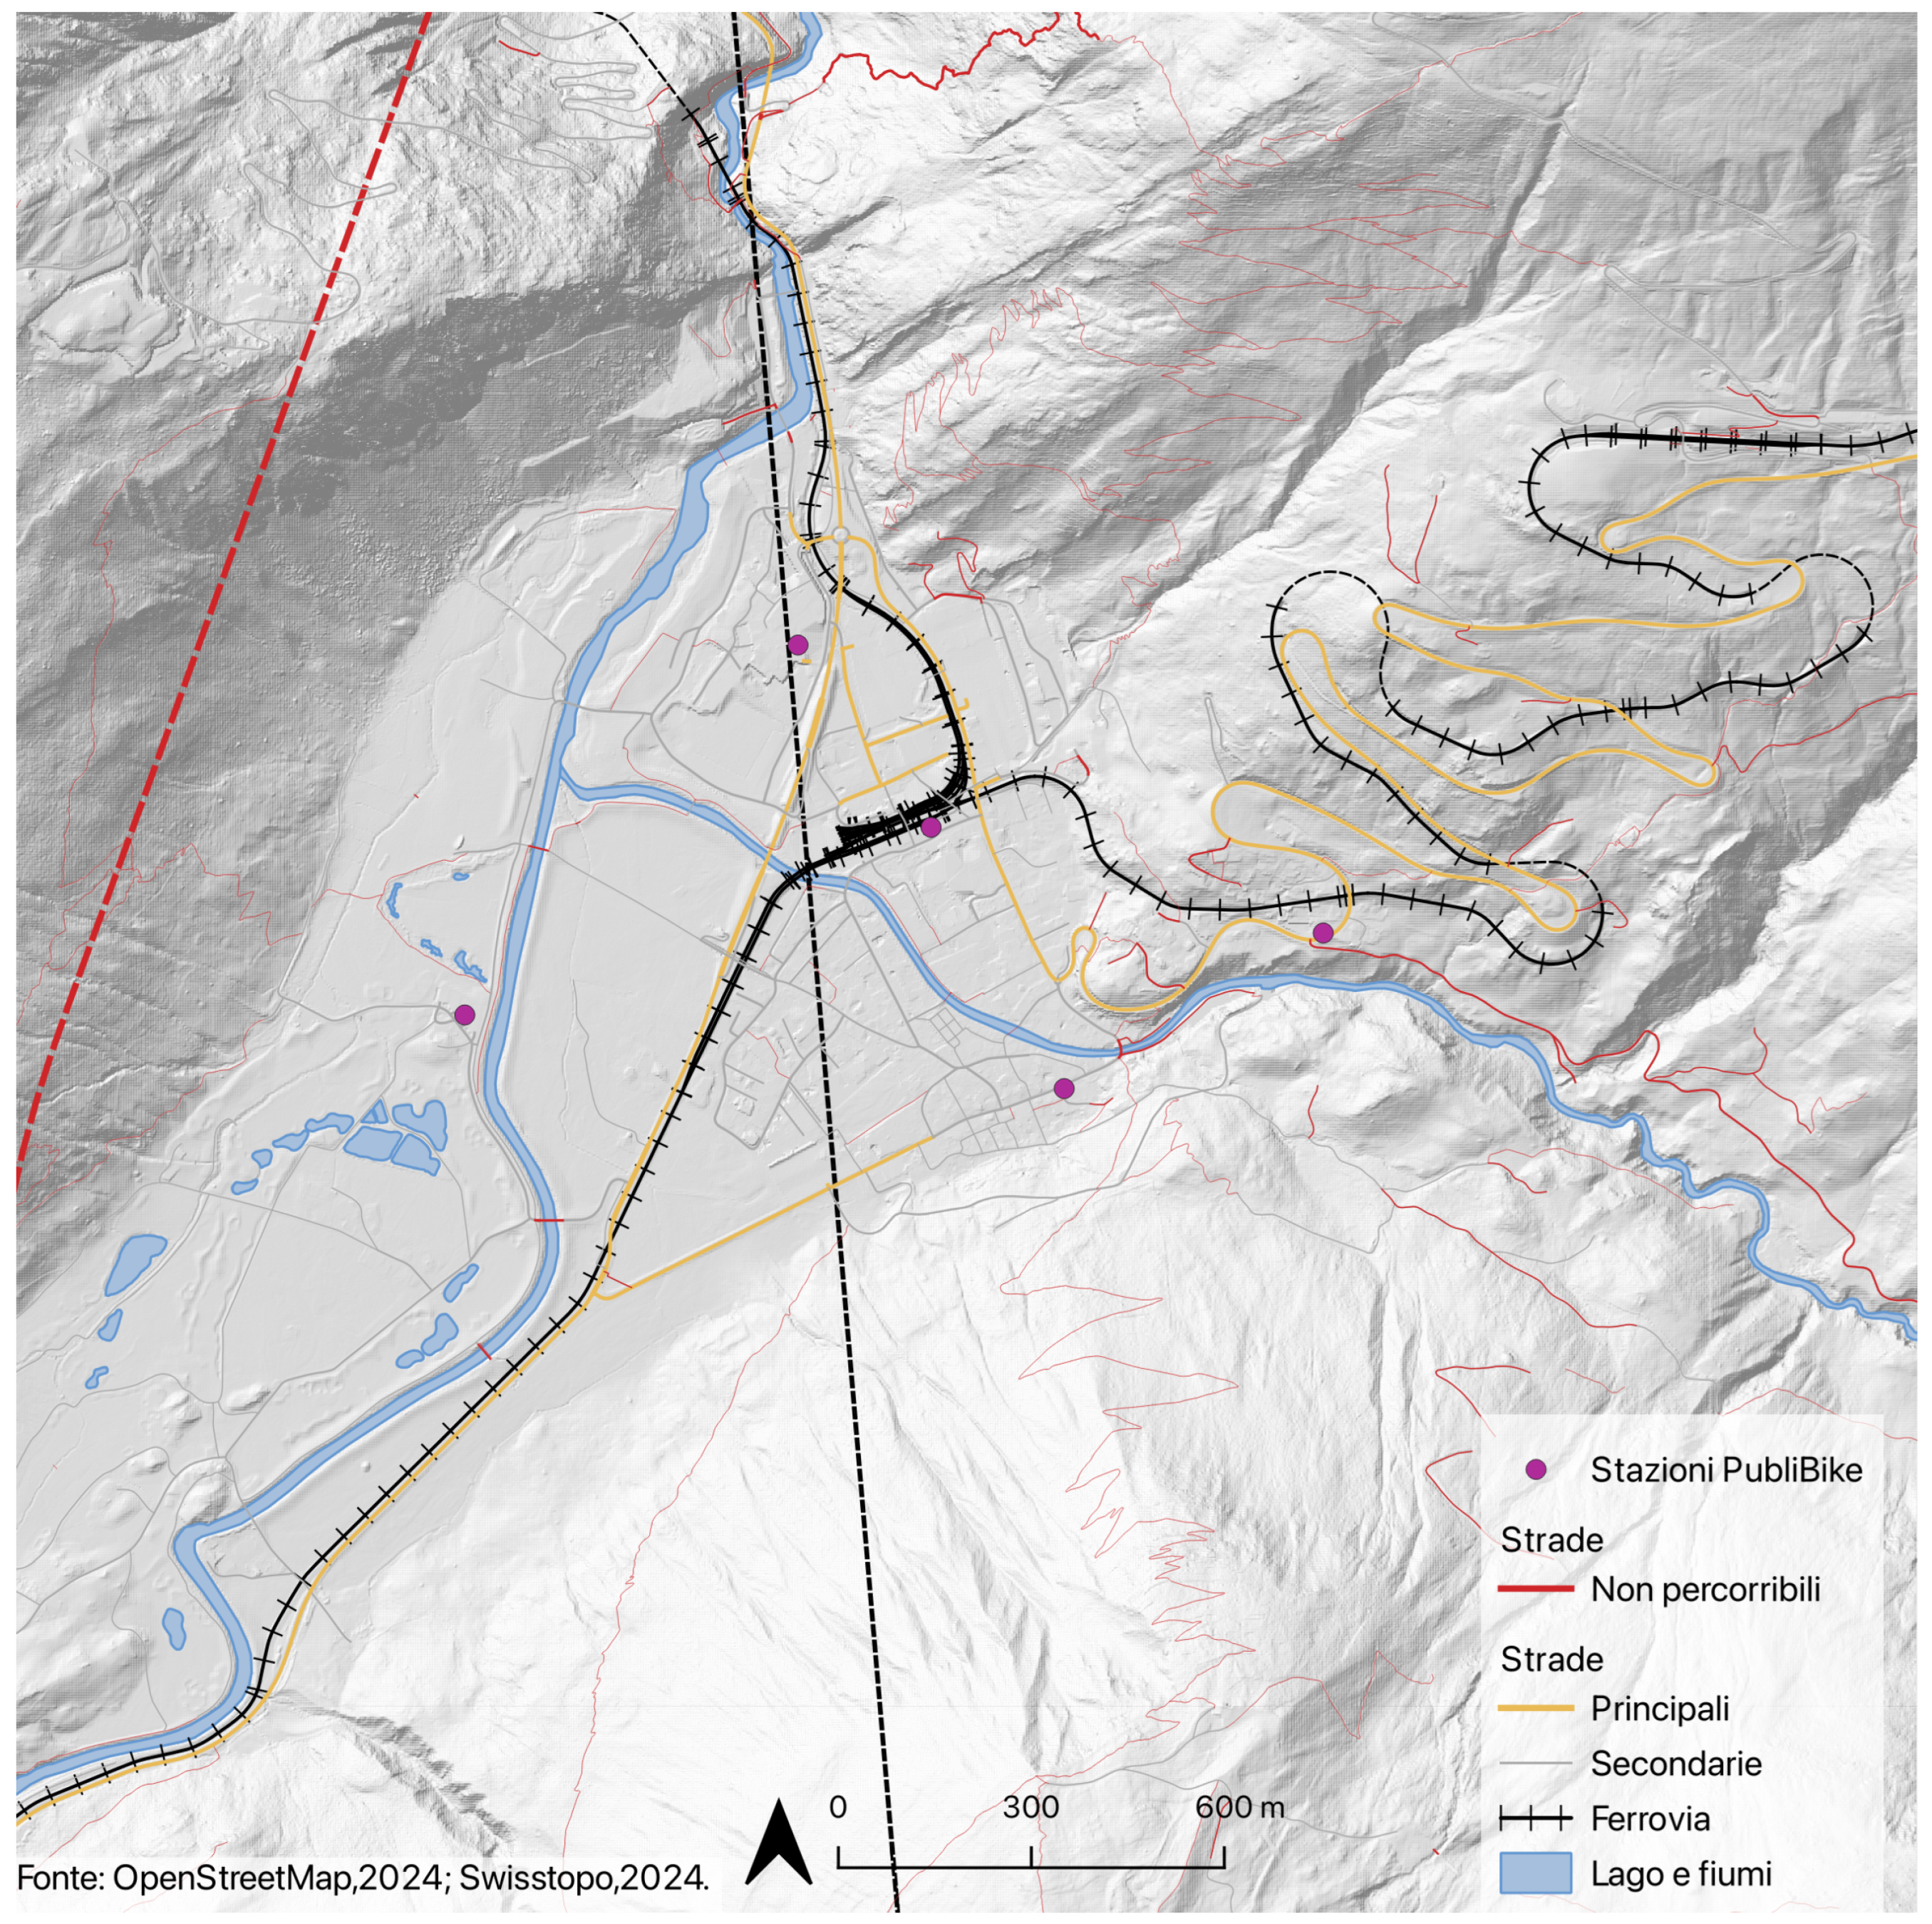
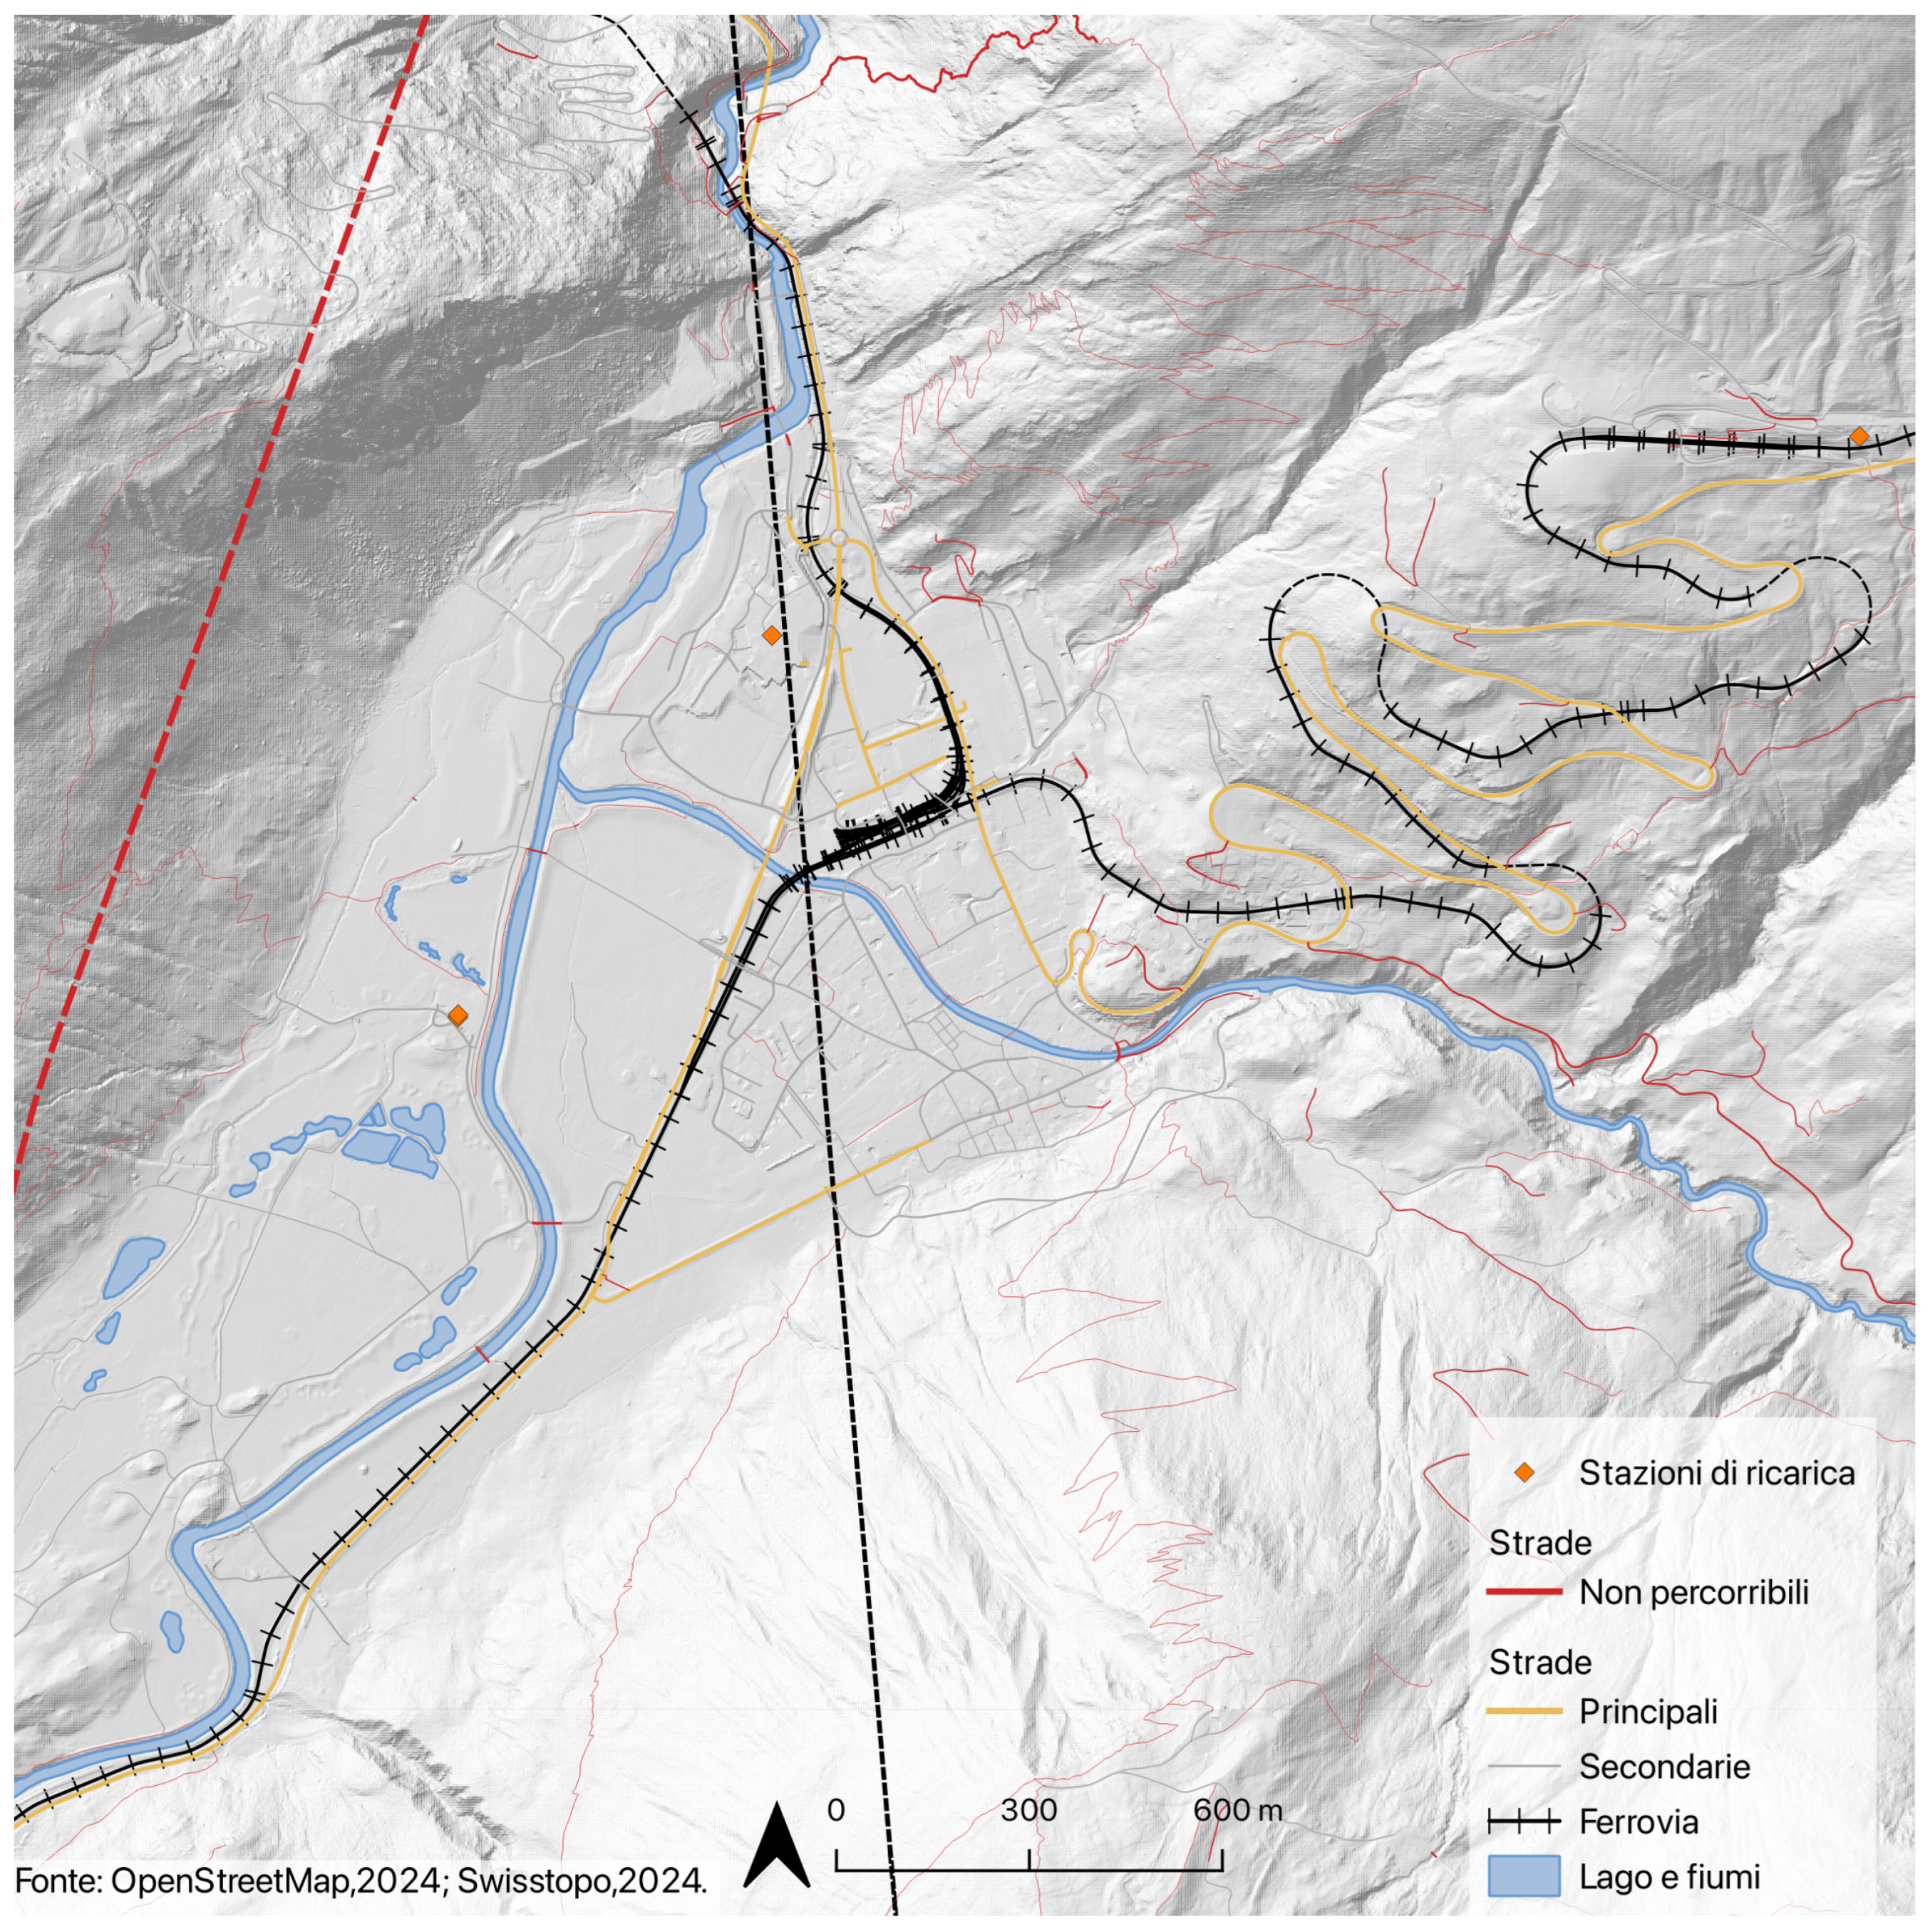
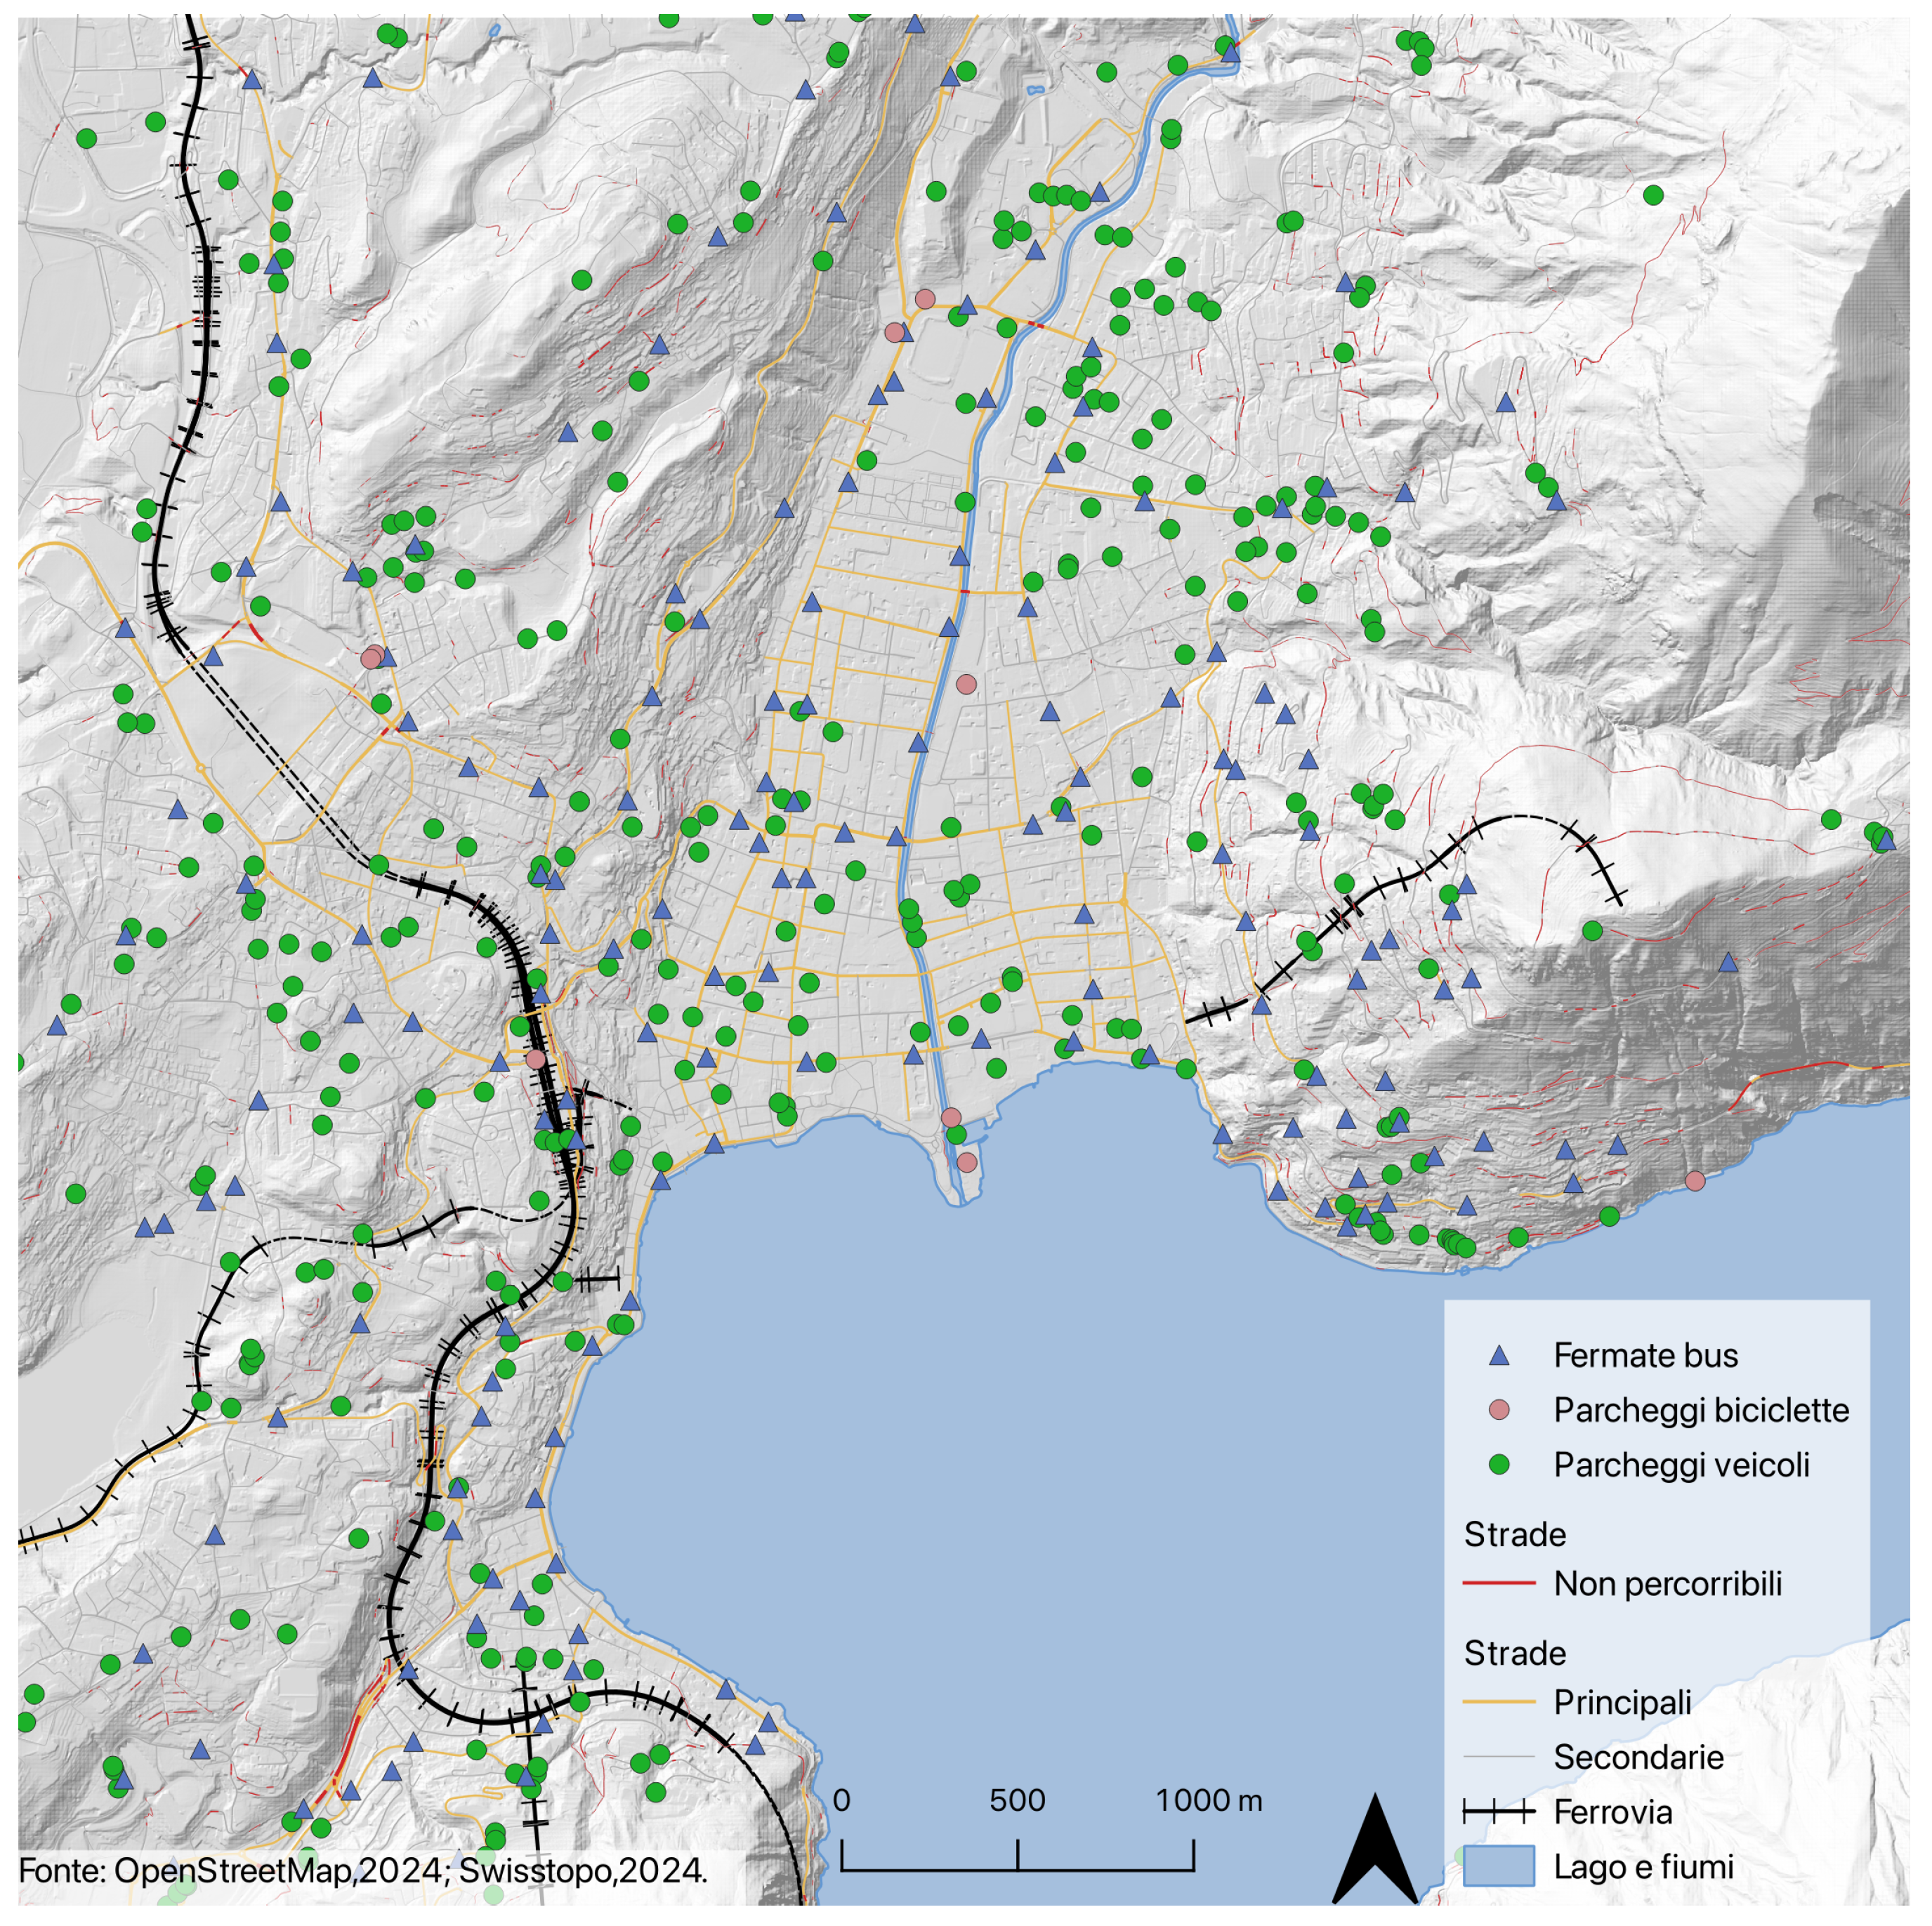
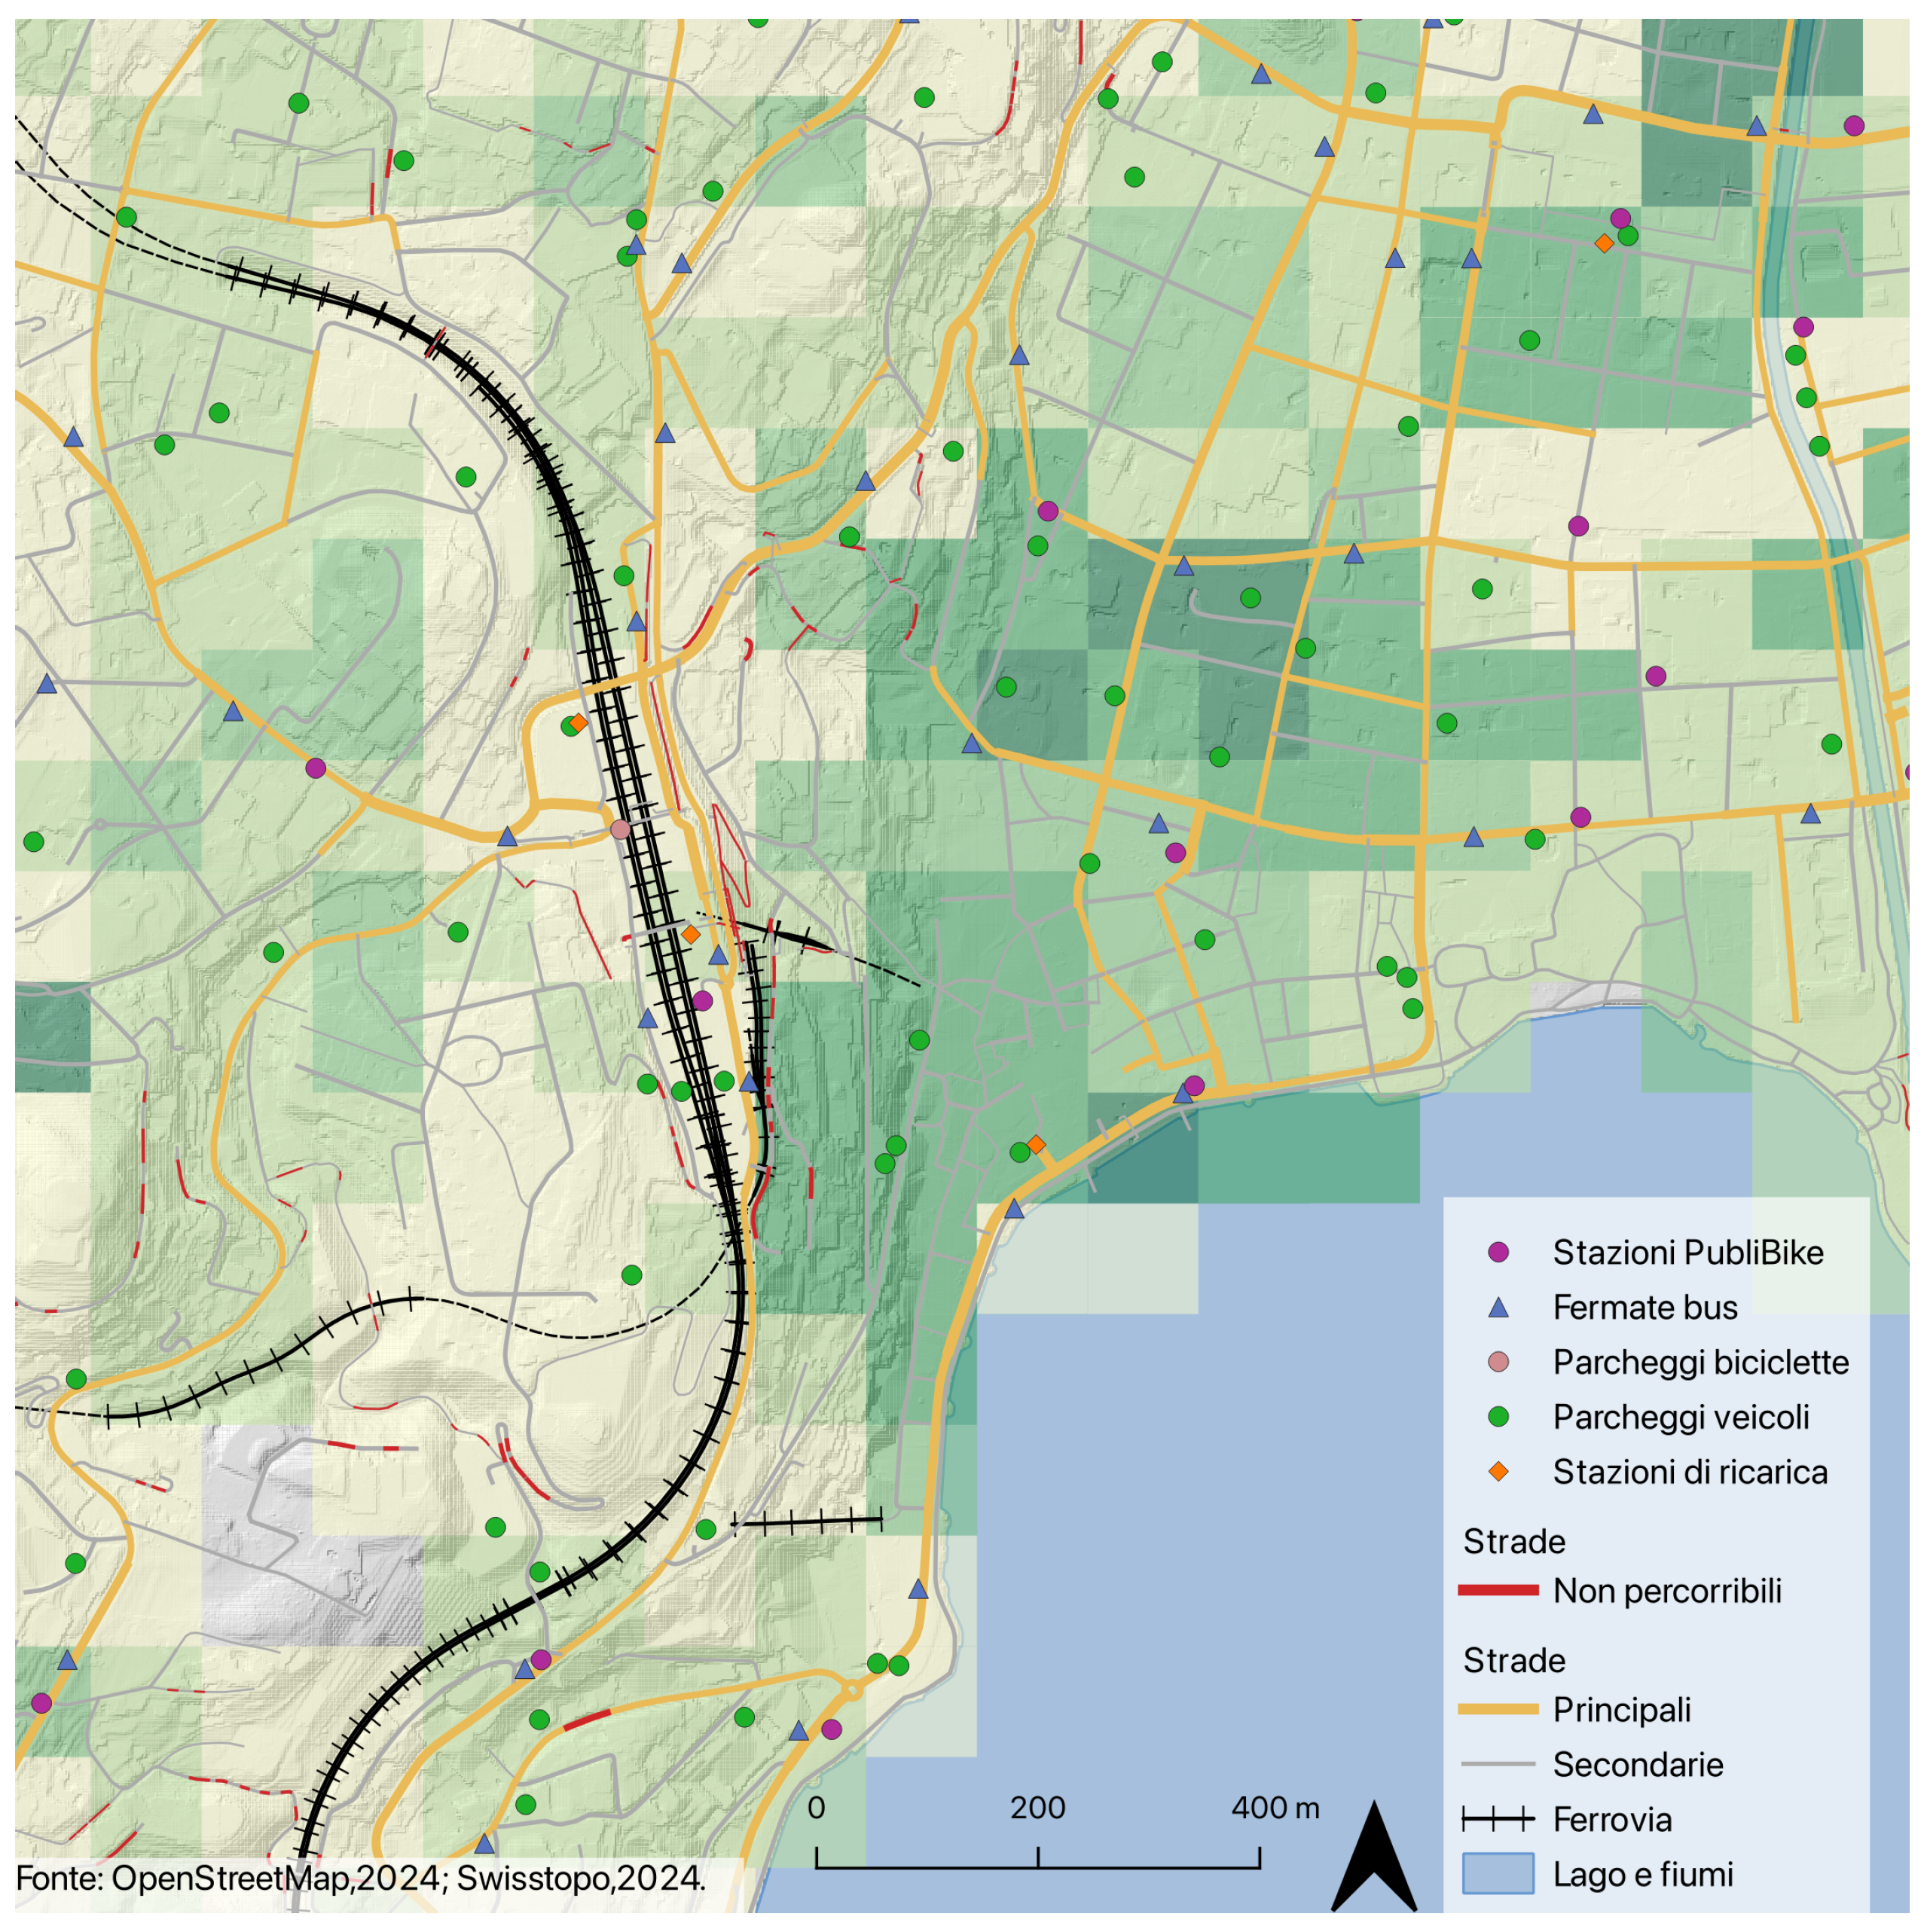
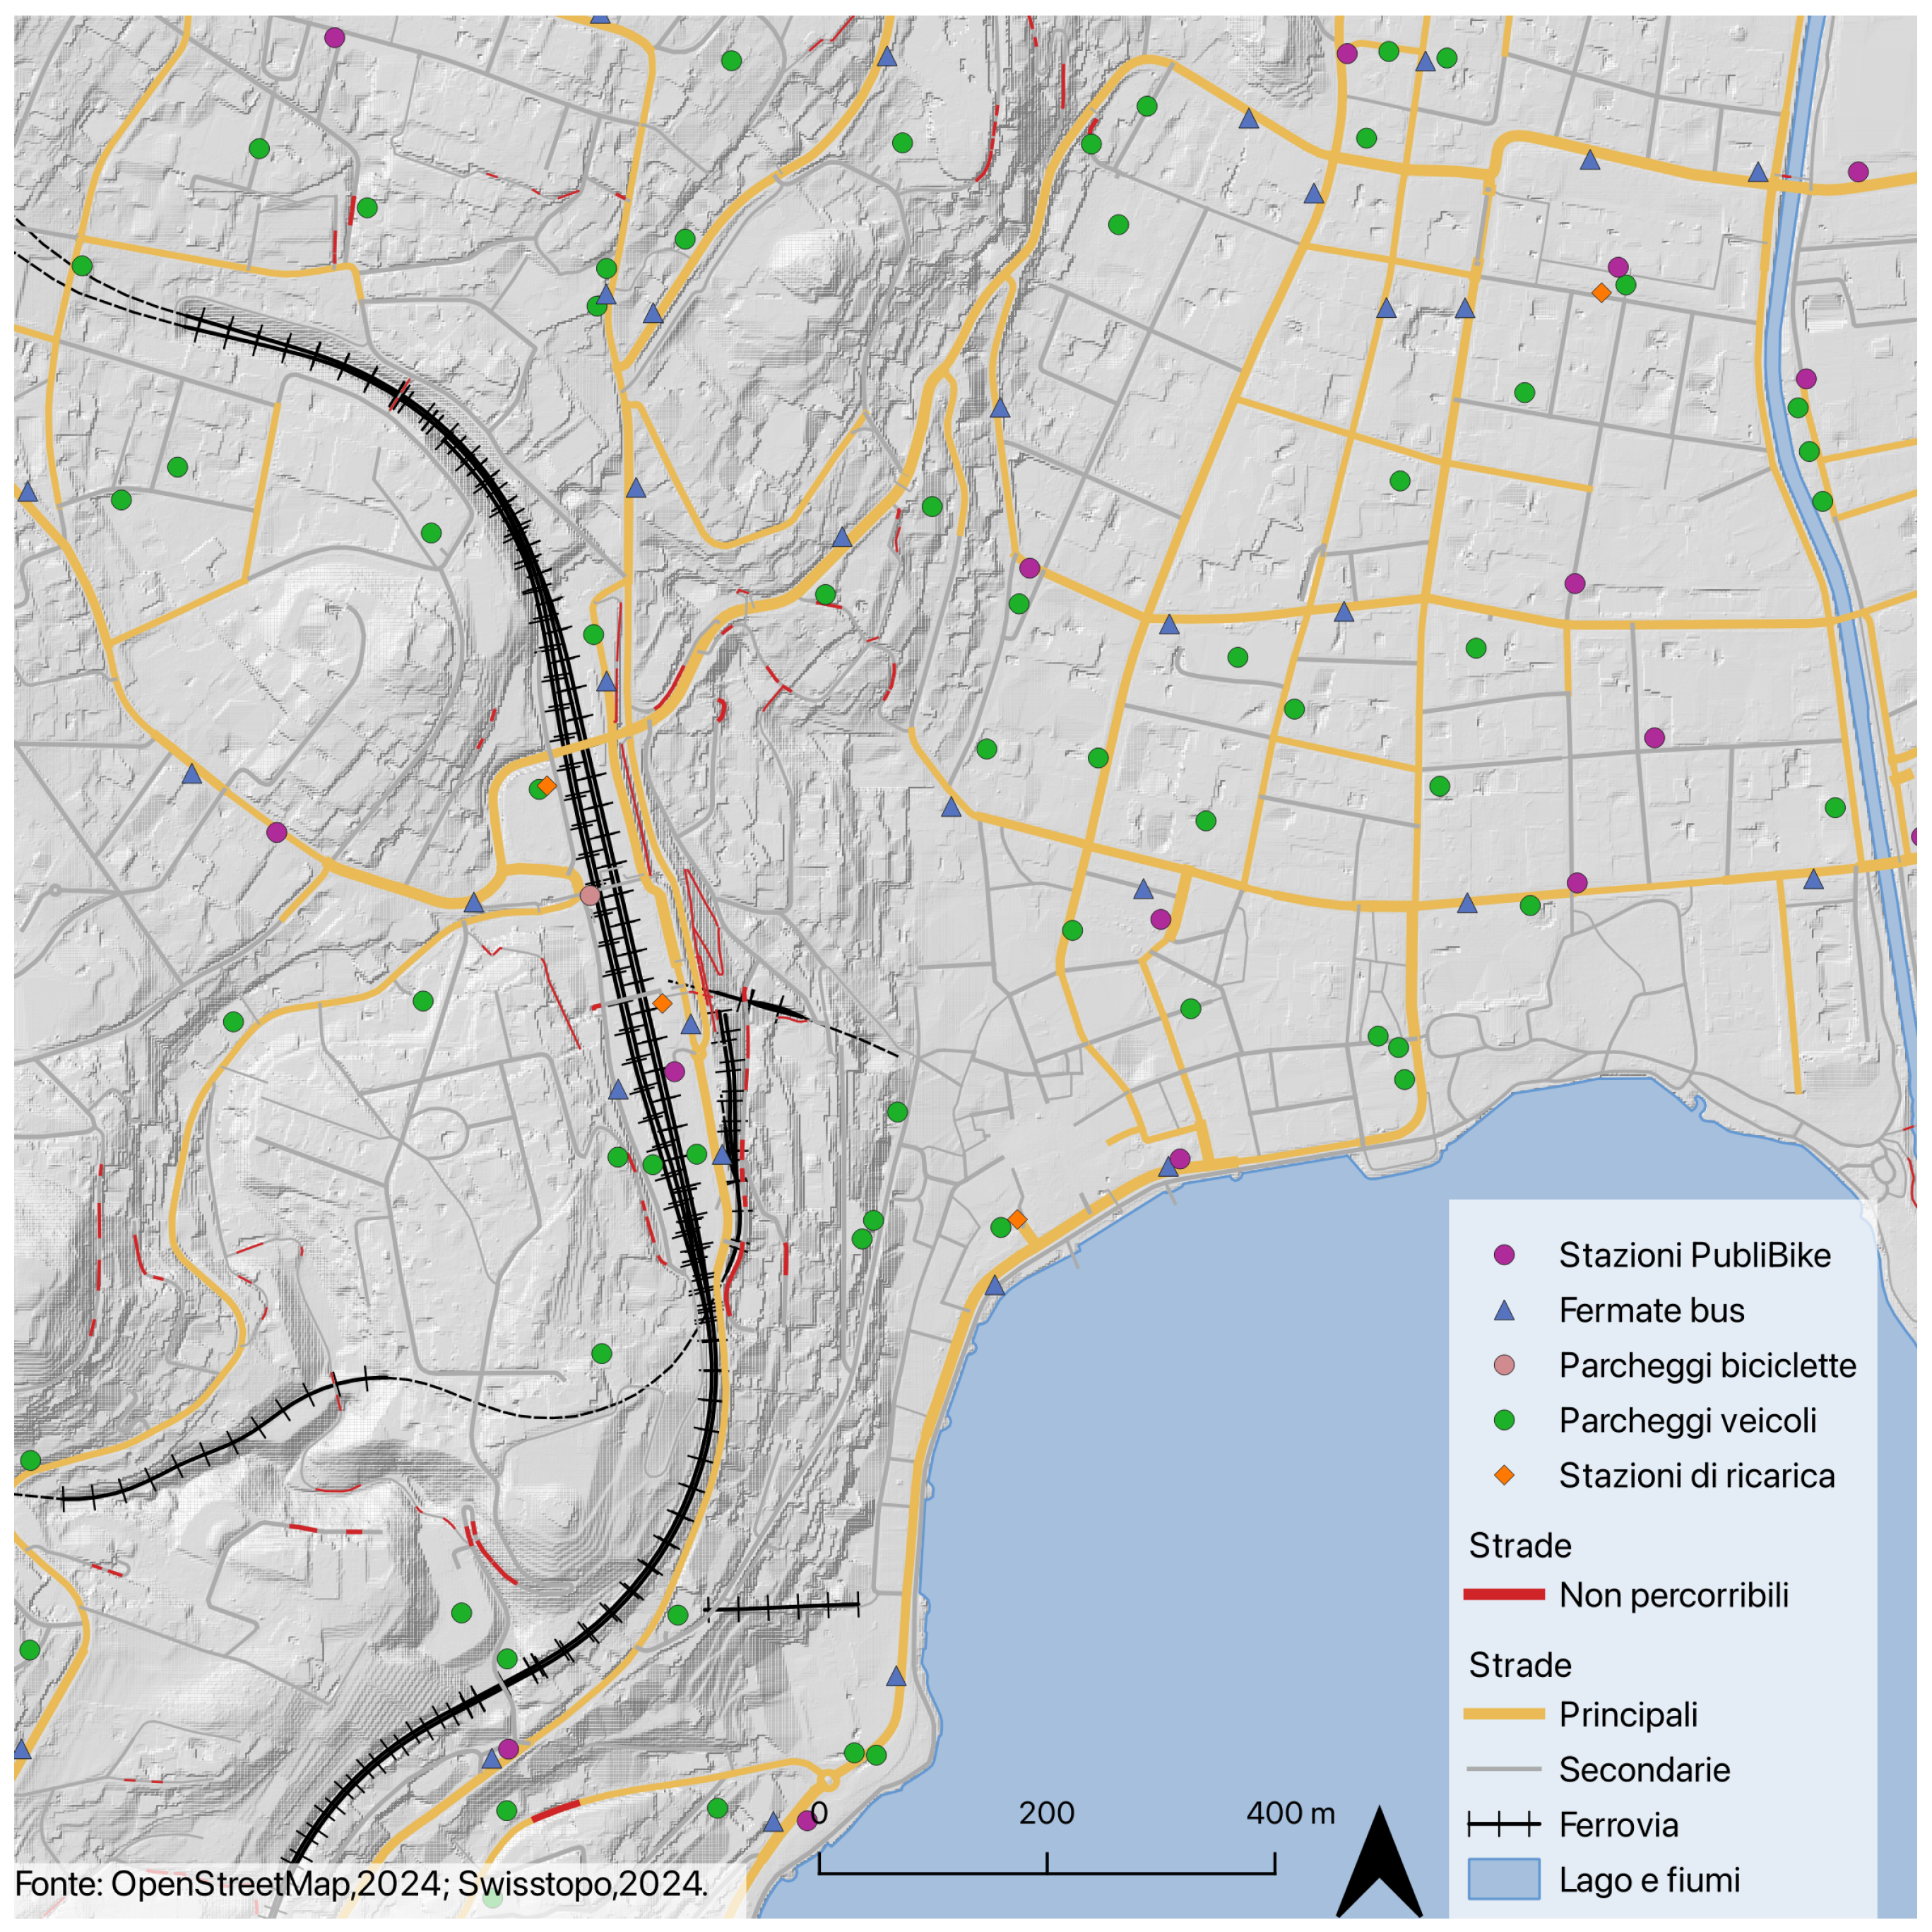
  • Public facilities: local public transport systems, parking areas, railway stations, bike-sharing systems, and charging stations were mapped to evaluate potential integration with micromobility devices like Genny Zero.
The urban analysis was conducted on two distinct levels. First, four Swiss cities were selected as case studies to represent diverse geographic contexts: Chur, a valley-floor city; Fribourg, a flat city intersected by a meandering river; Andermatt, a rapidly growing mountain resort; and Lugano, a lakeside city. Subsequently, Lugano was analyzed in depth, supported by specific tests (see Section 2.5).

2.5. Data Collection: Urban Experiment

In addition to the urban analysis, tests were conducted in a real urban context. The urban experiments took place on Friday, 8 March 2024, after obtaining authorization from the Traffic Section of the Canton of Ticino. The test started from the East Campus of USI-SUPSI in Viganello and traversed the city of Lugano and the municipality of Paradiso before returning to the starting point. Specifically, the route included reaching the Cassarate river mouth, passing through Ciani Park, and continuing to the bus shelter on Via Pretorio. From there, the Genny Zero vehicles boarded a bus to the Lugano FFS train station and then took a train to Paradiso FFS station. The return journey followed the lakeside promenade. One Genny Zero vehicle was equipped with Realsense D455 cameras for data collection.
The goal of this test was to obtain real-world data on Genny Zero’s behavior in an urban environment, verifying its qualities, its multimodal integration potential, and possible conflicts with other road users (pedestrians, cyclists, cars, etc.). To ensure a dense mobility environment, the test was conducted around midday to coincide with peak lunch-hour traffic.

Methods and Mathematical Reference Models

The analysis methodology and models used to collect, process, and analyze the data measured from the Genny device are detailed below, and related results are reported in Section 3.
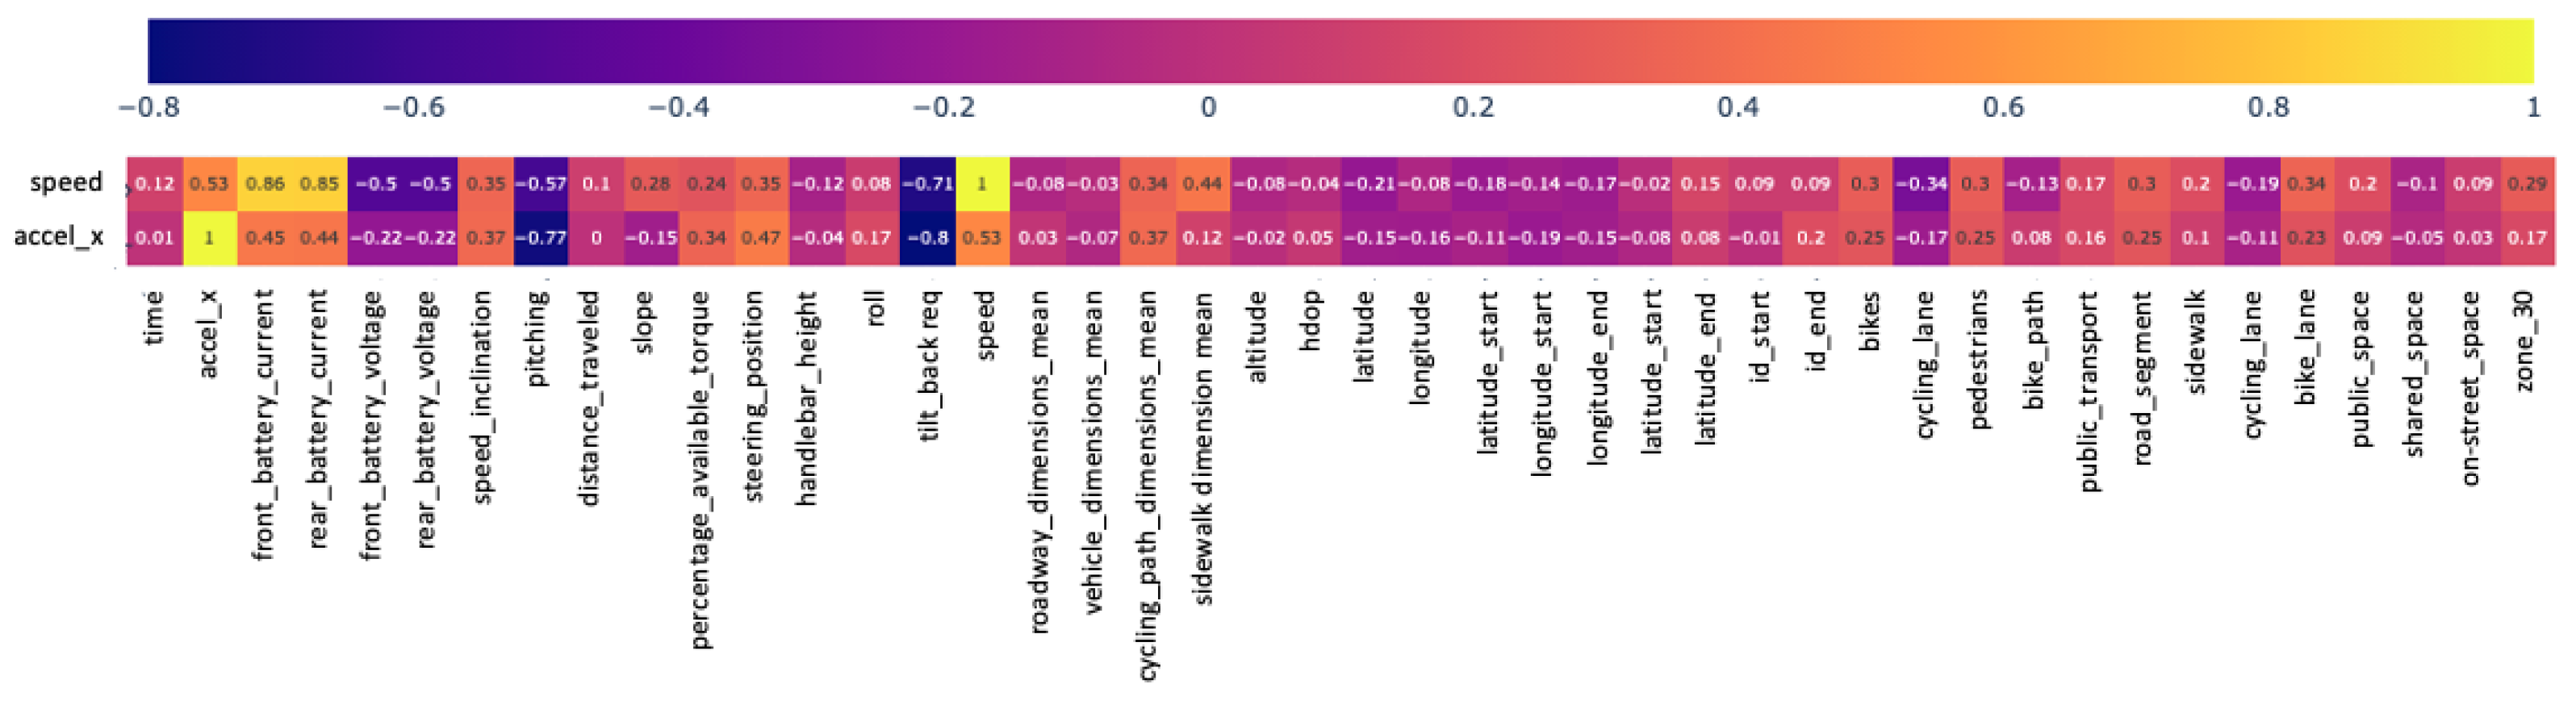
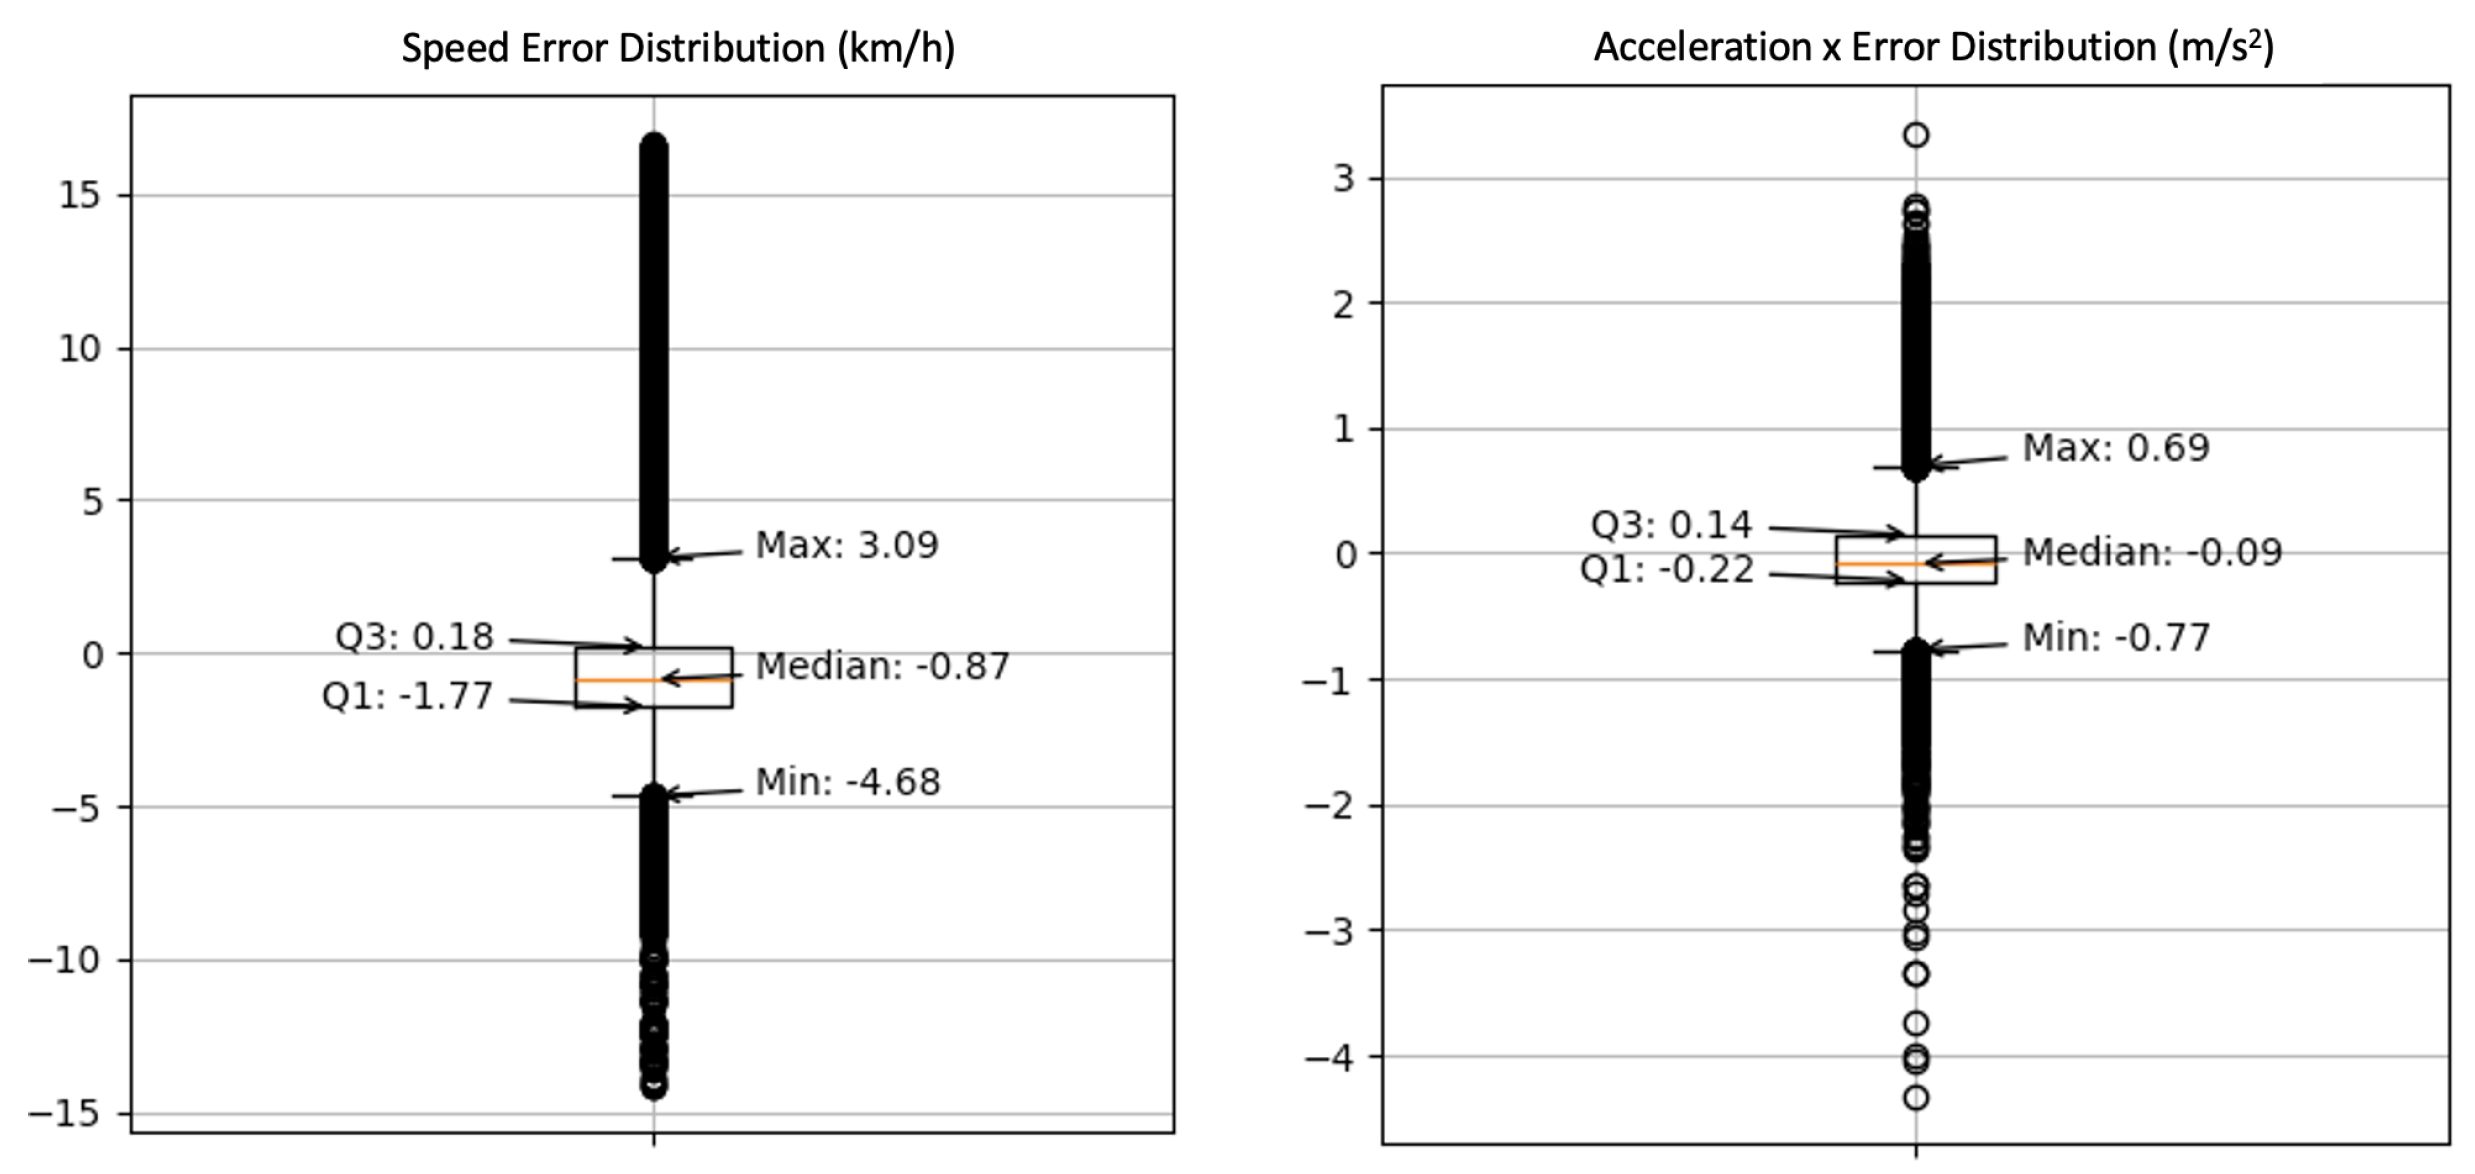
  • Analysis of most impactful road characteristics
    An analytical study on machine collected data was performed to identify the road characteristics which have the highest impact on the vehicle’s speed and acceleration, based on the result of a supervised machine learning model prediction.As a first step, a preliminary statistical and correlation analysis was performed over the collected machine data (univariate correlation). In particular, we used the following statistical metrics as relevant for the present study:
    -
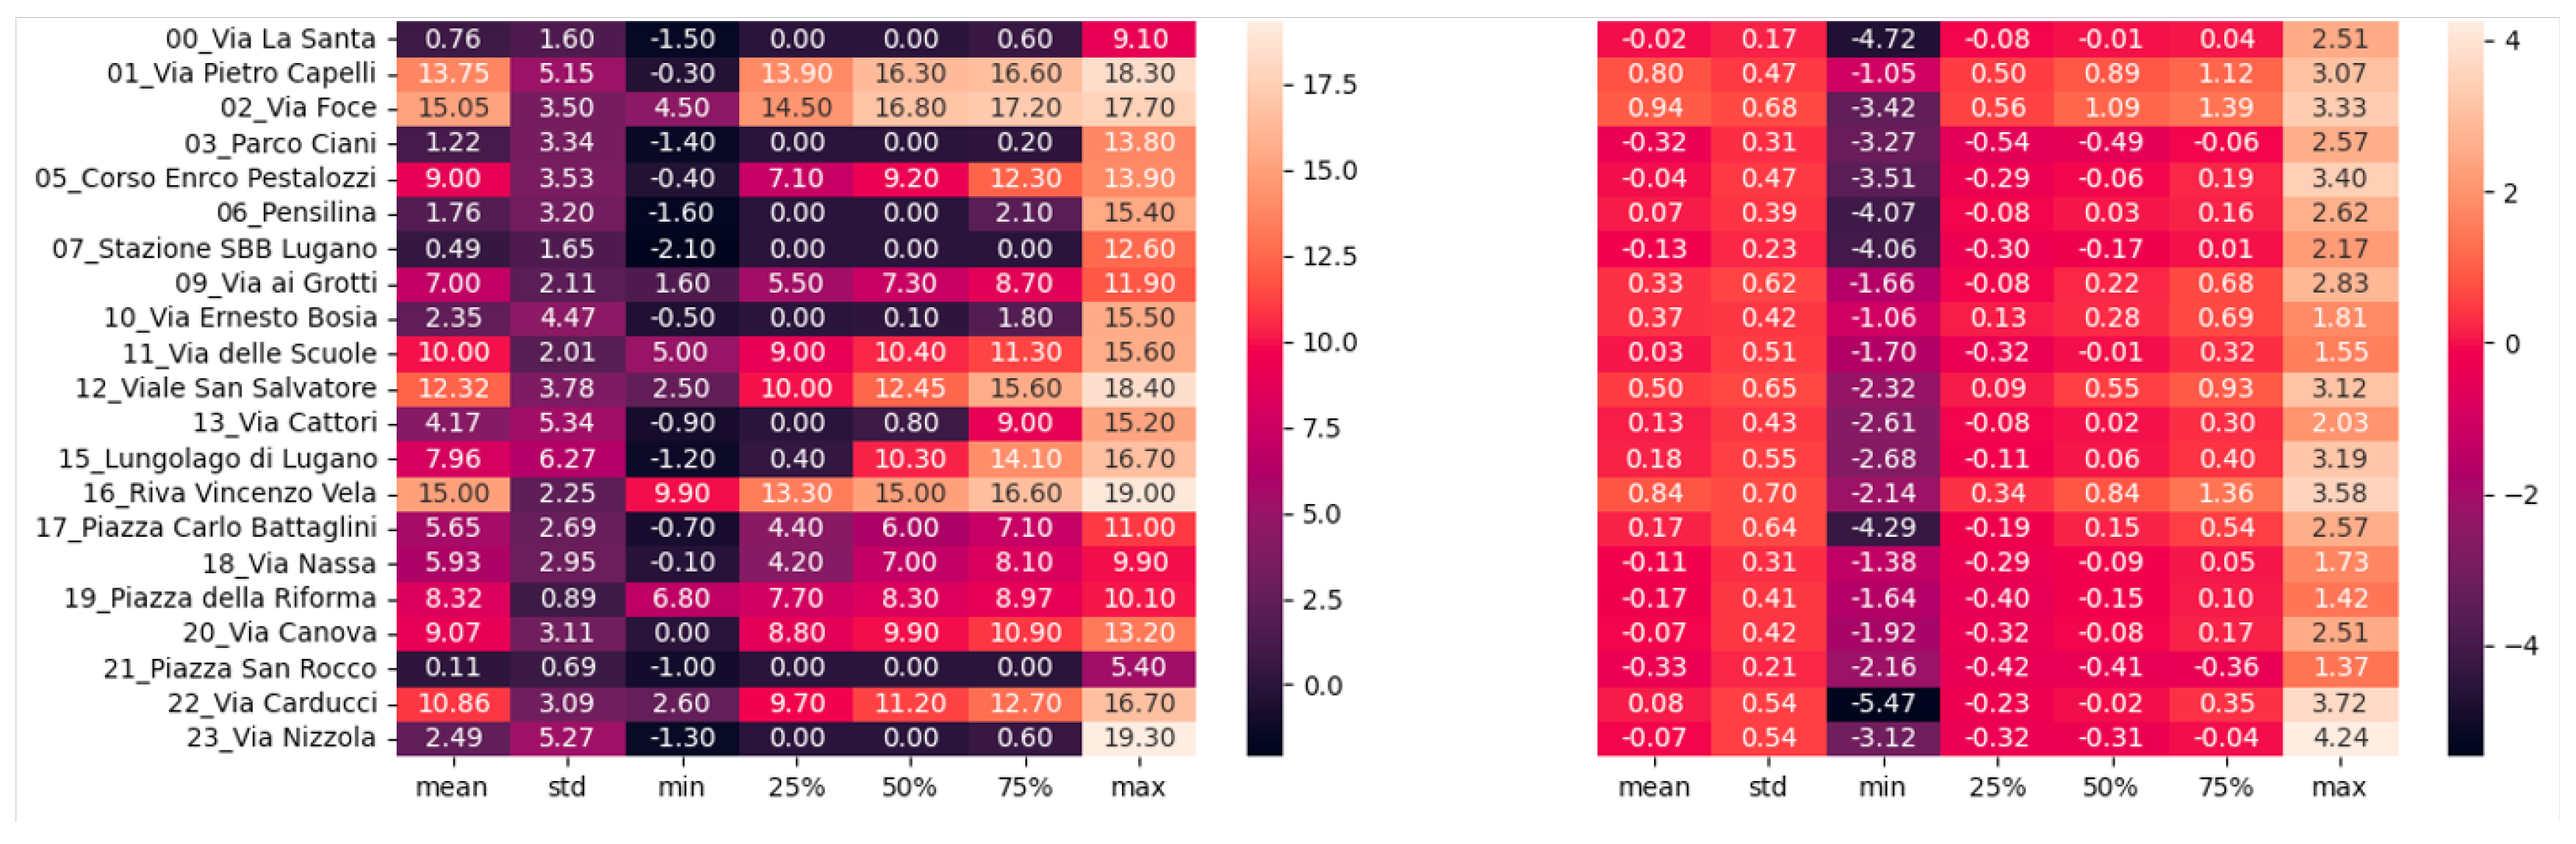
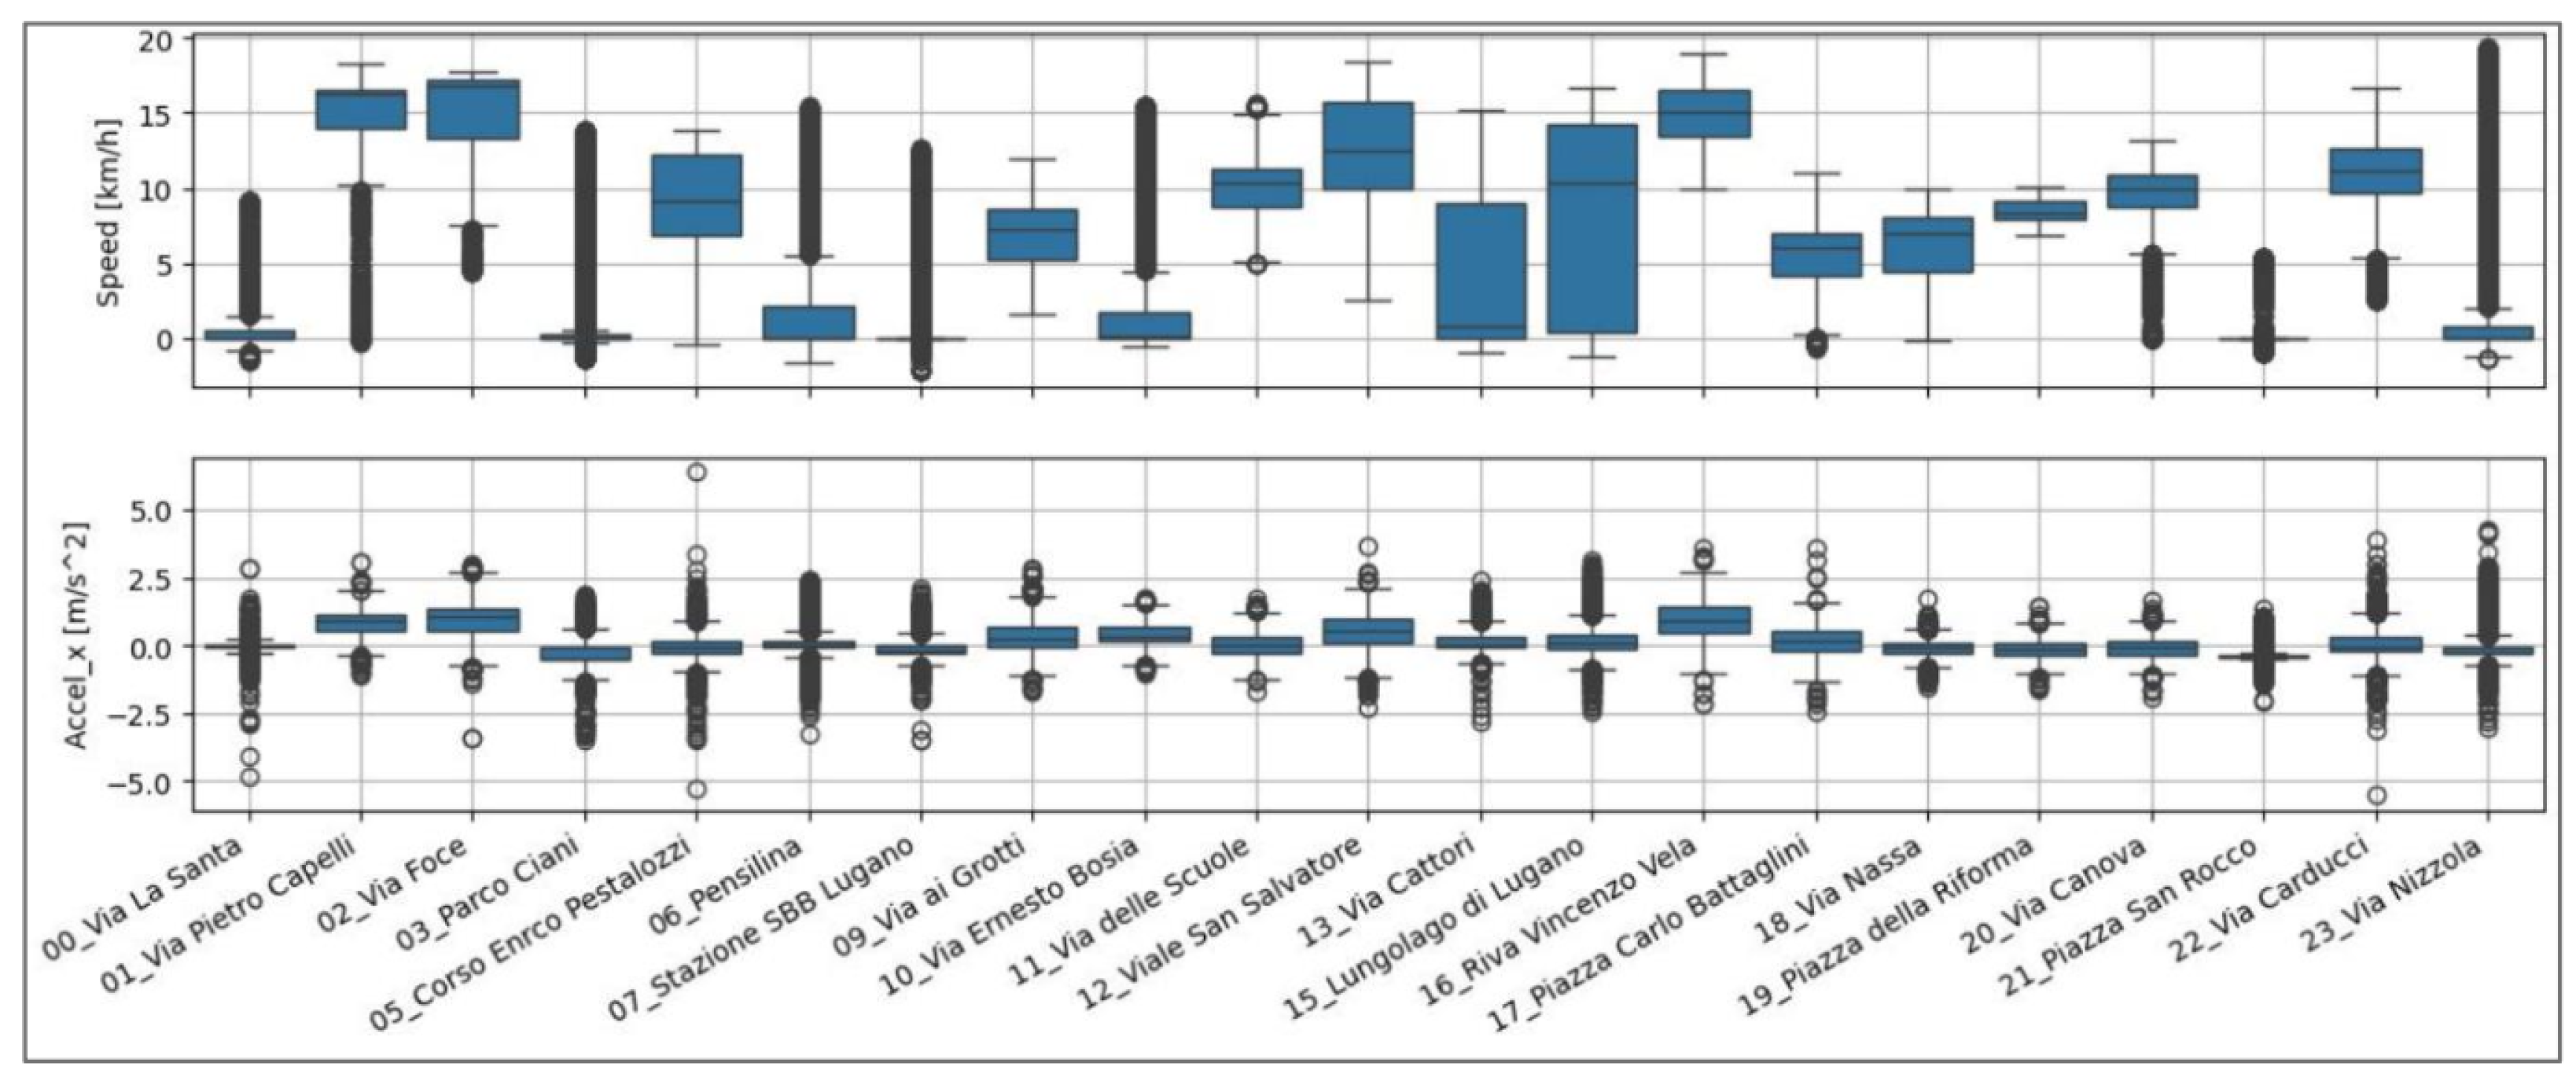
    Mean, standard deviation, minimum, maximum, and the 25th, 50th and 75th percentiles for the speed and forward acceleration distributions (Figure 3);
    -
    Pearson coefficients for linear correlation [29] computed for all the merged datasets, whose result is shown in Figure 4 for the most relevant features, which were also used to focus on some use-cases, such as for the speed and forward acceleration and the tilt back and forward acceleration).
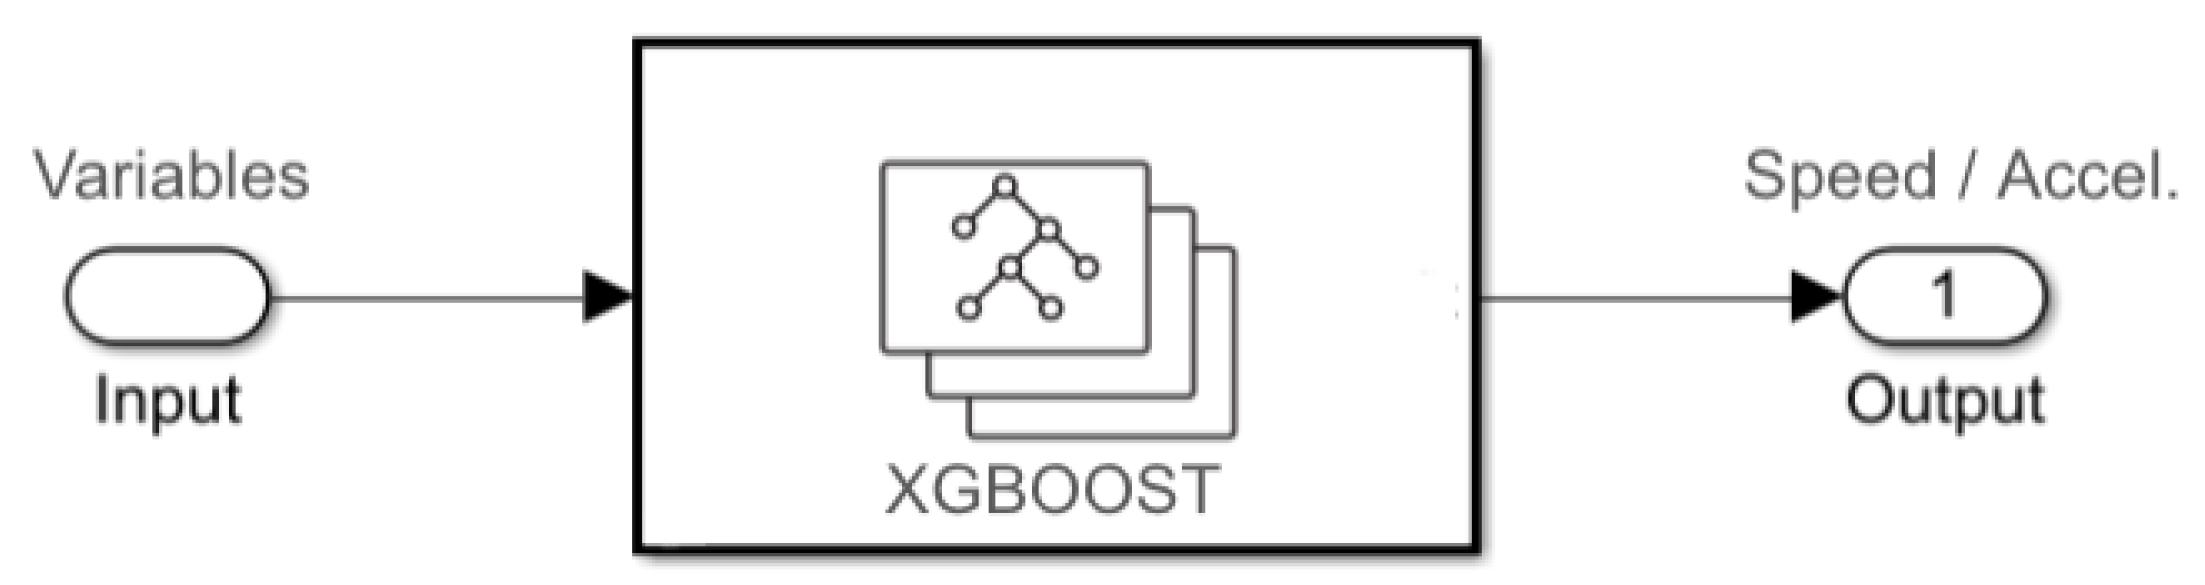
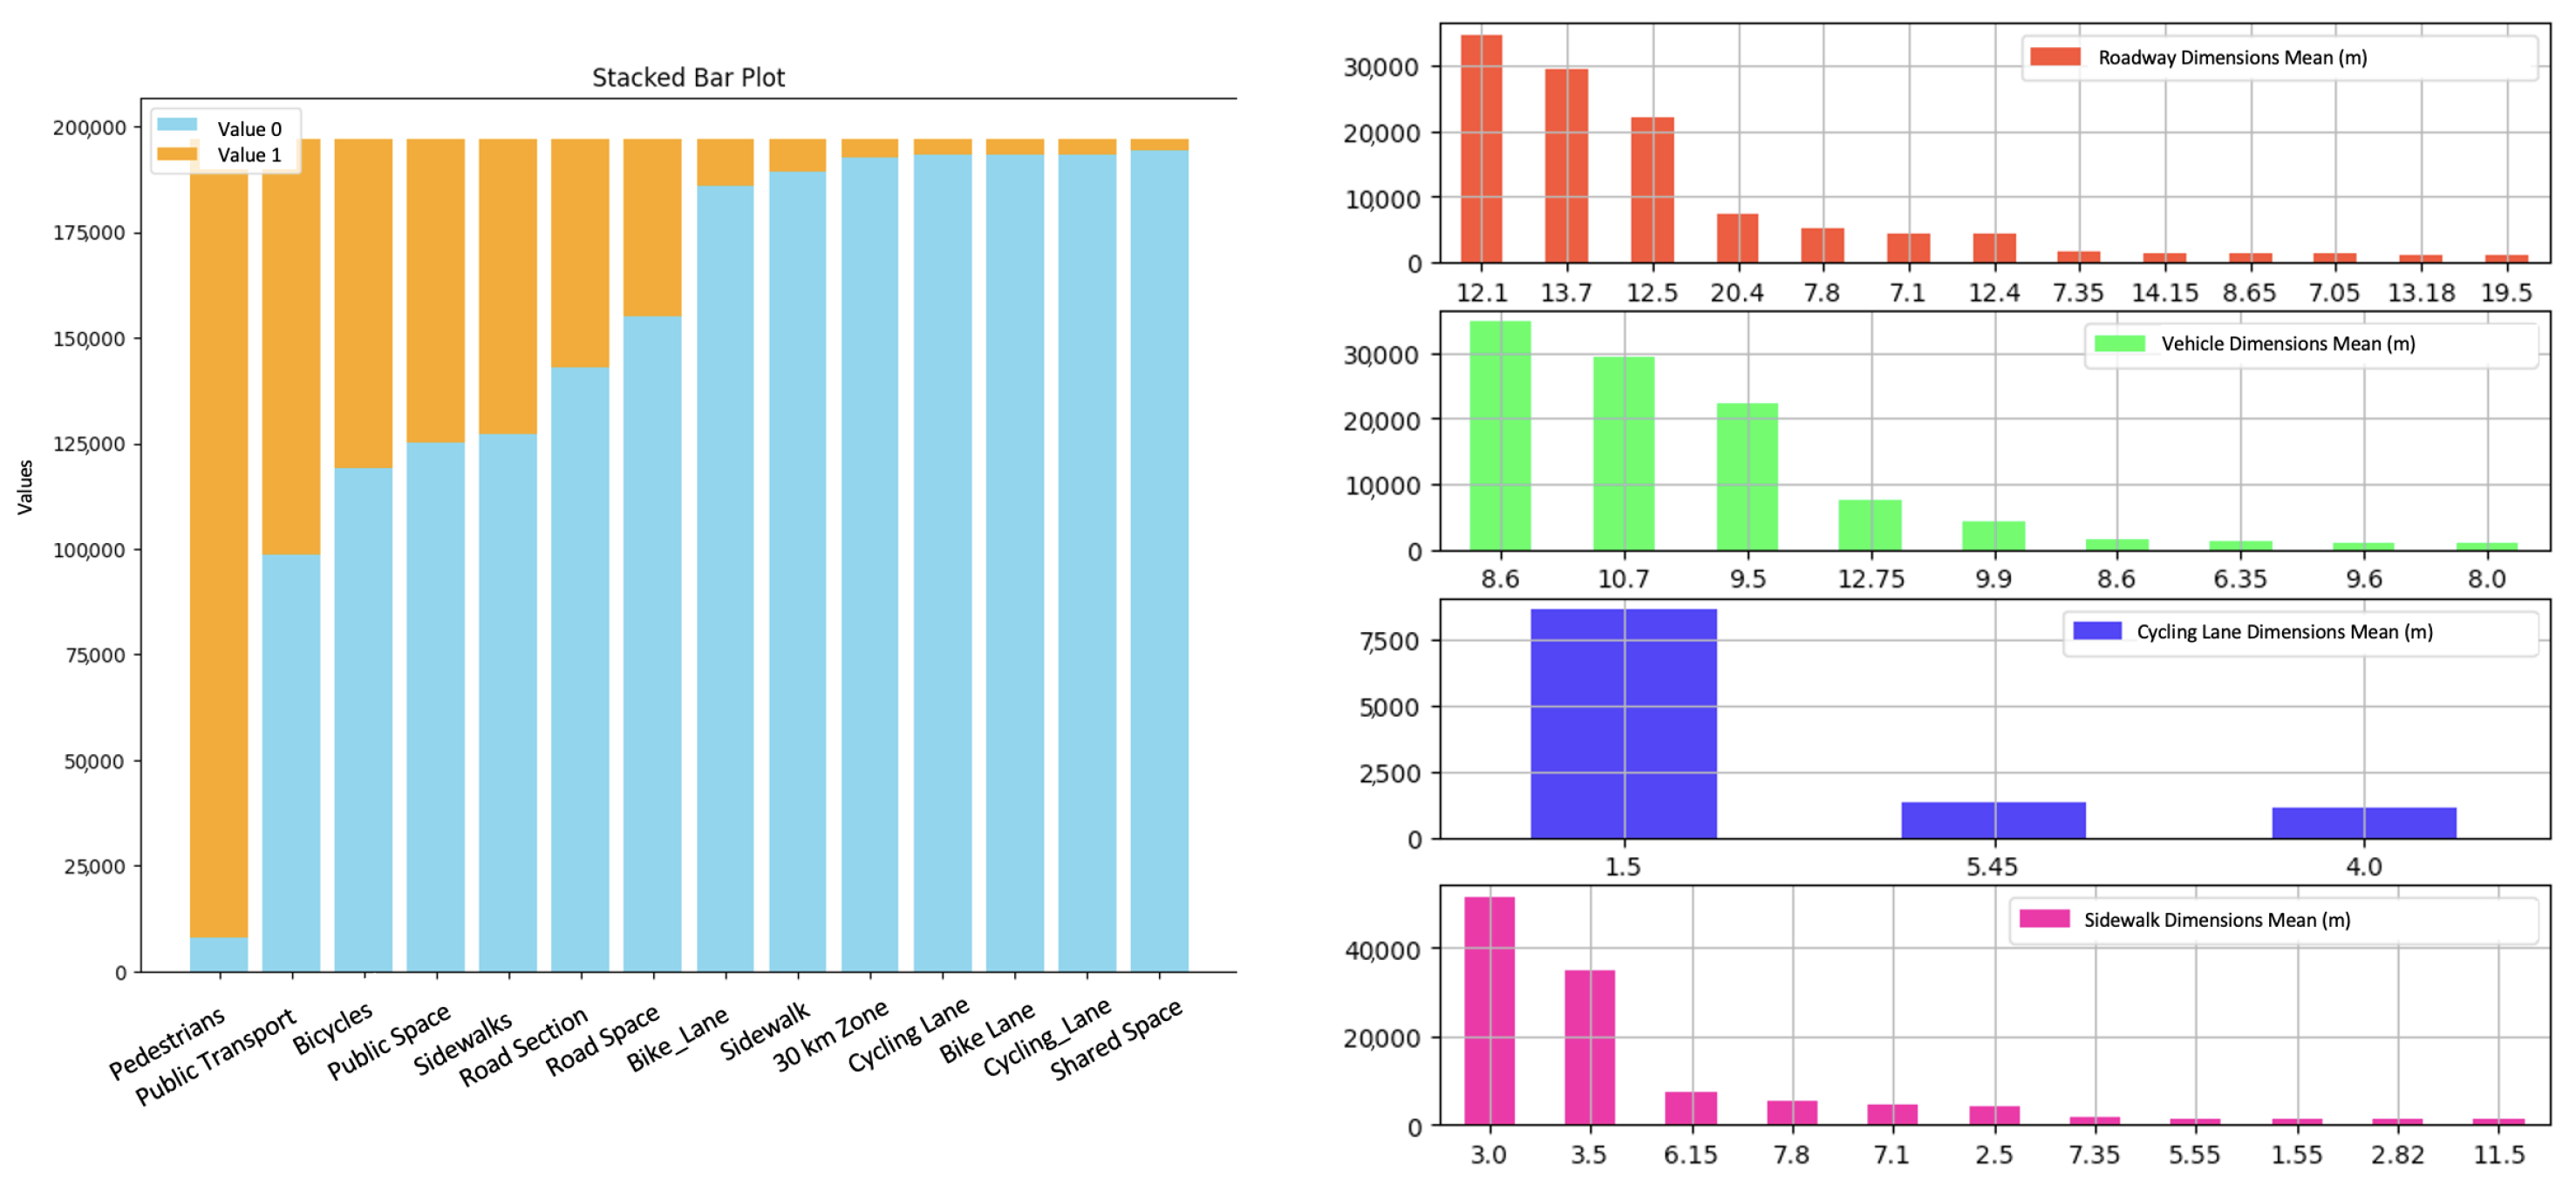
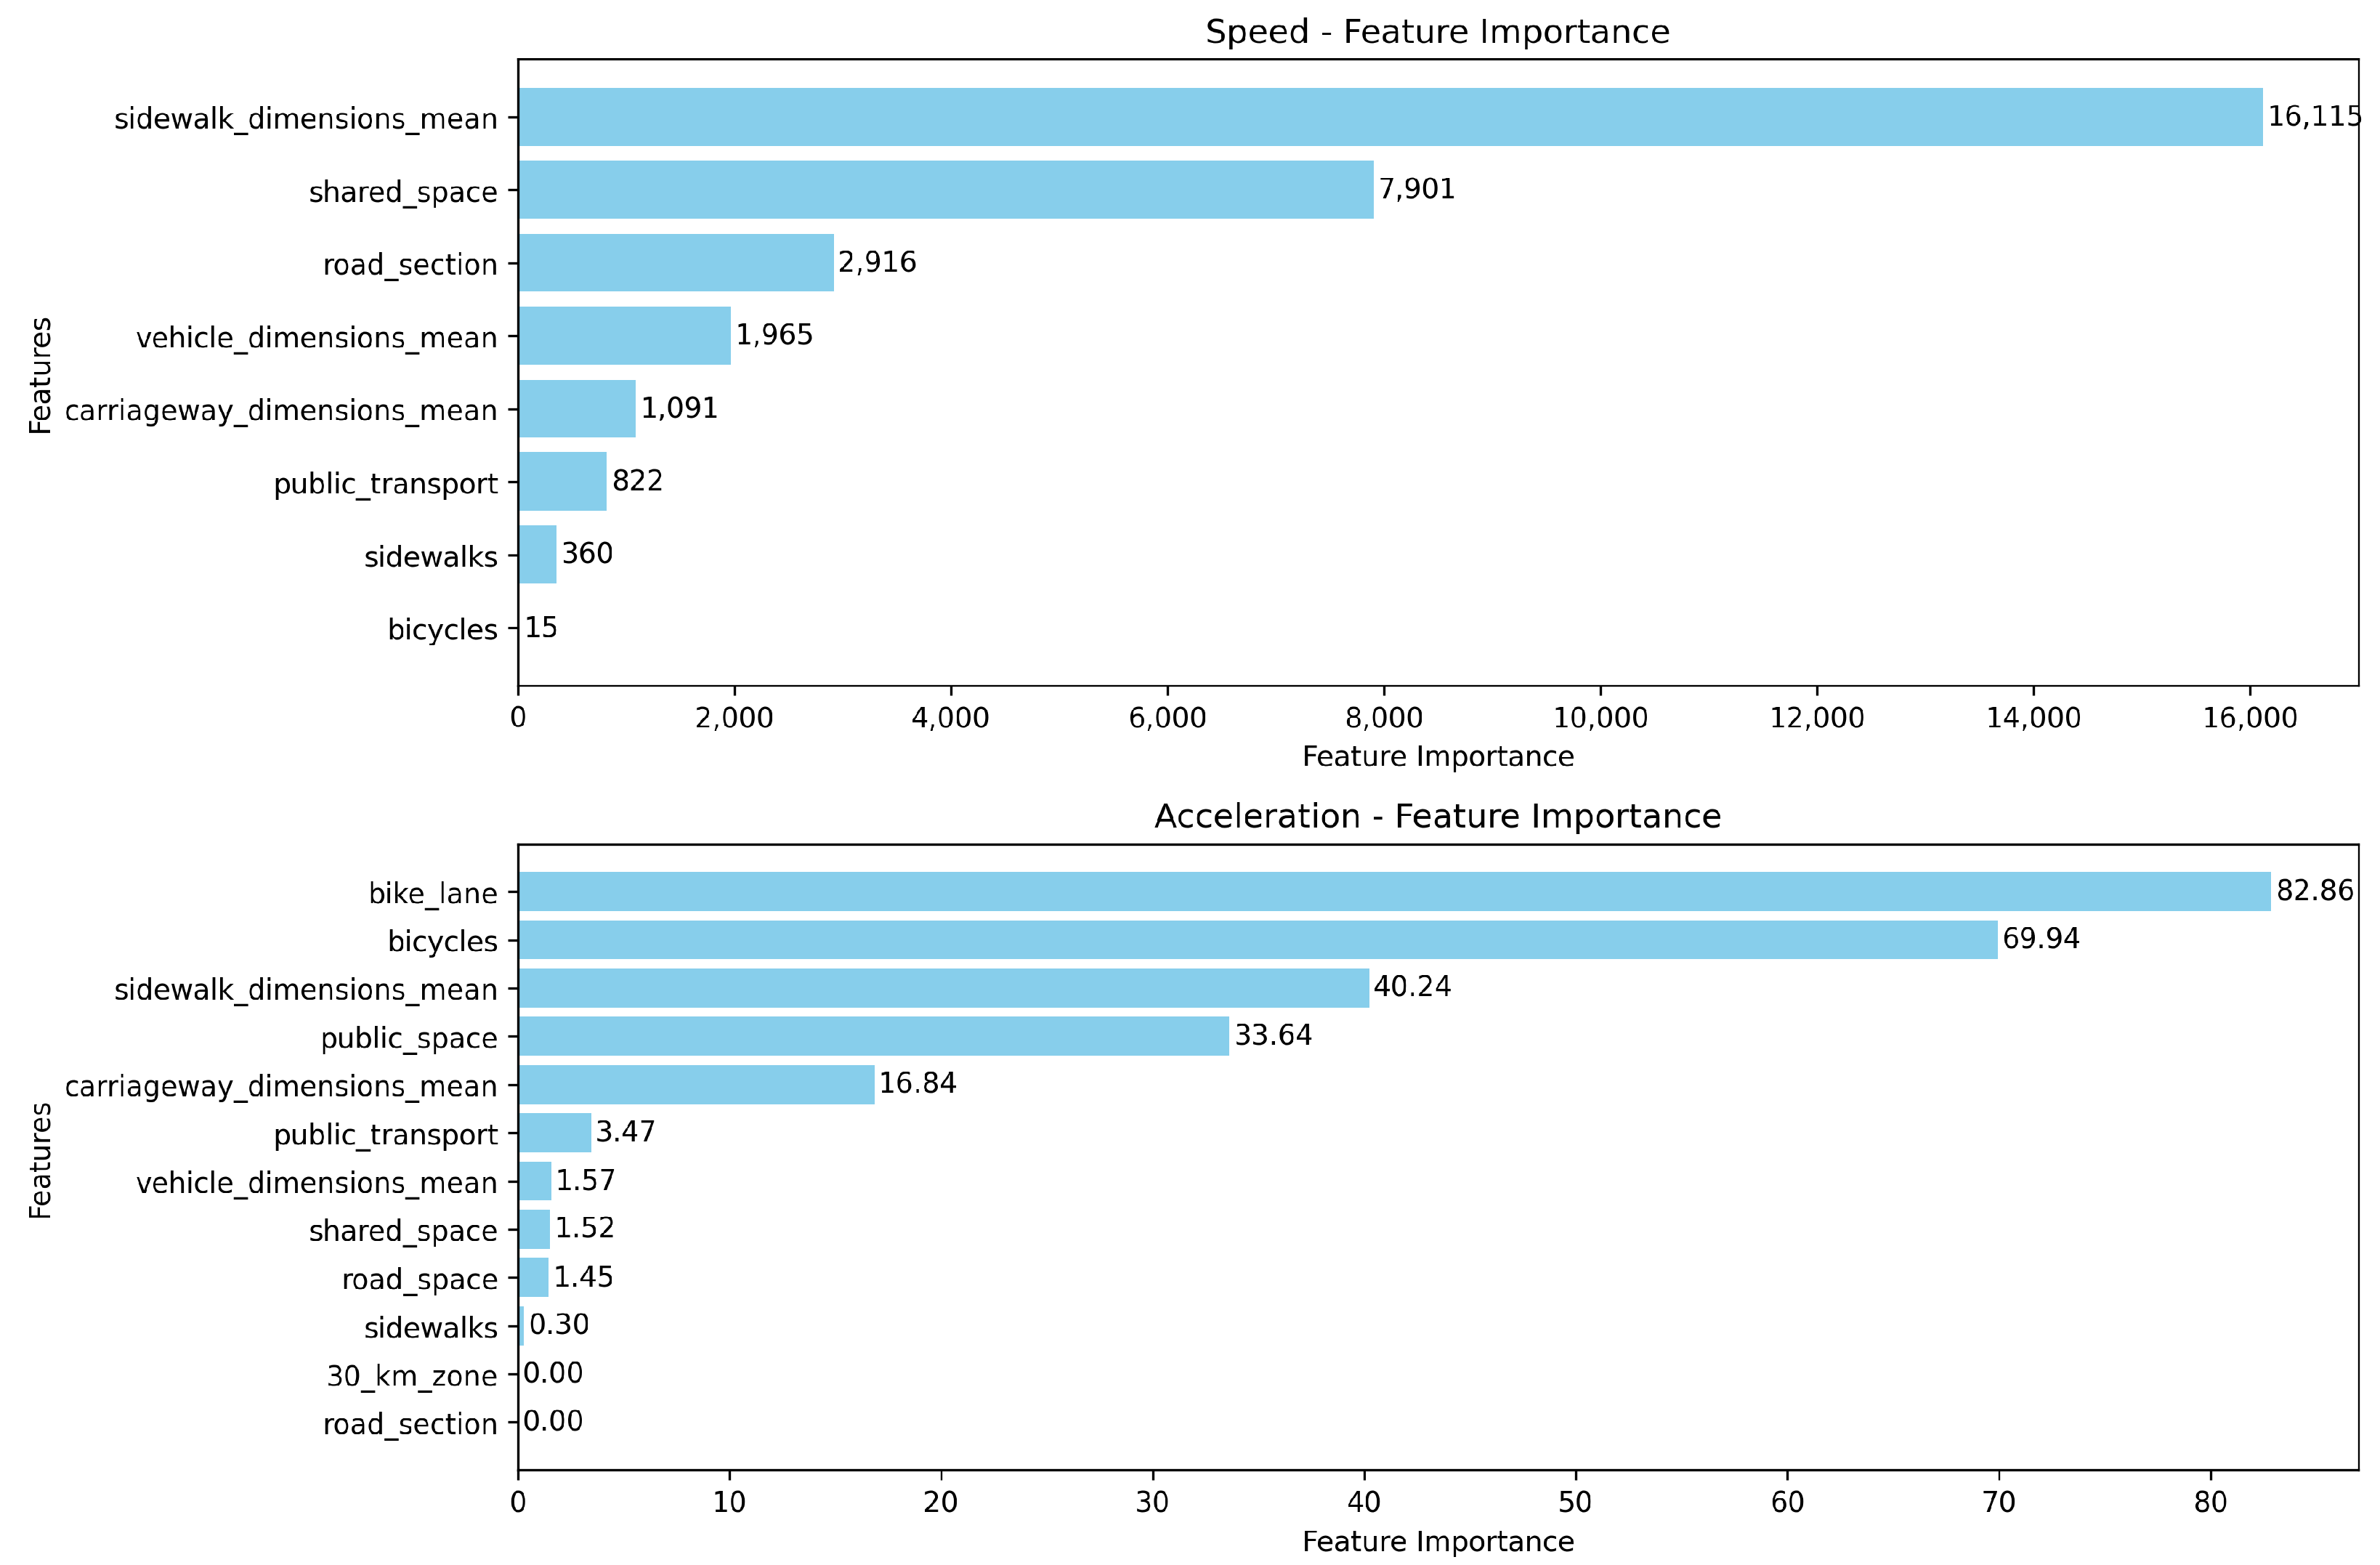
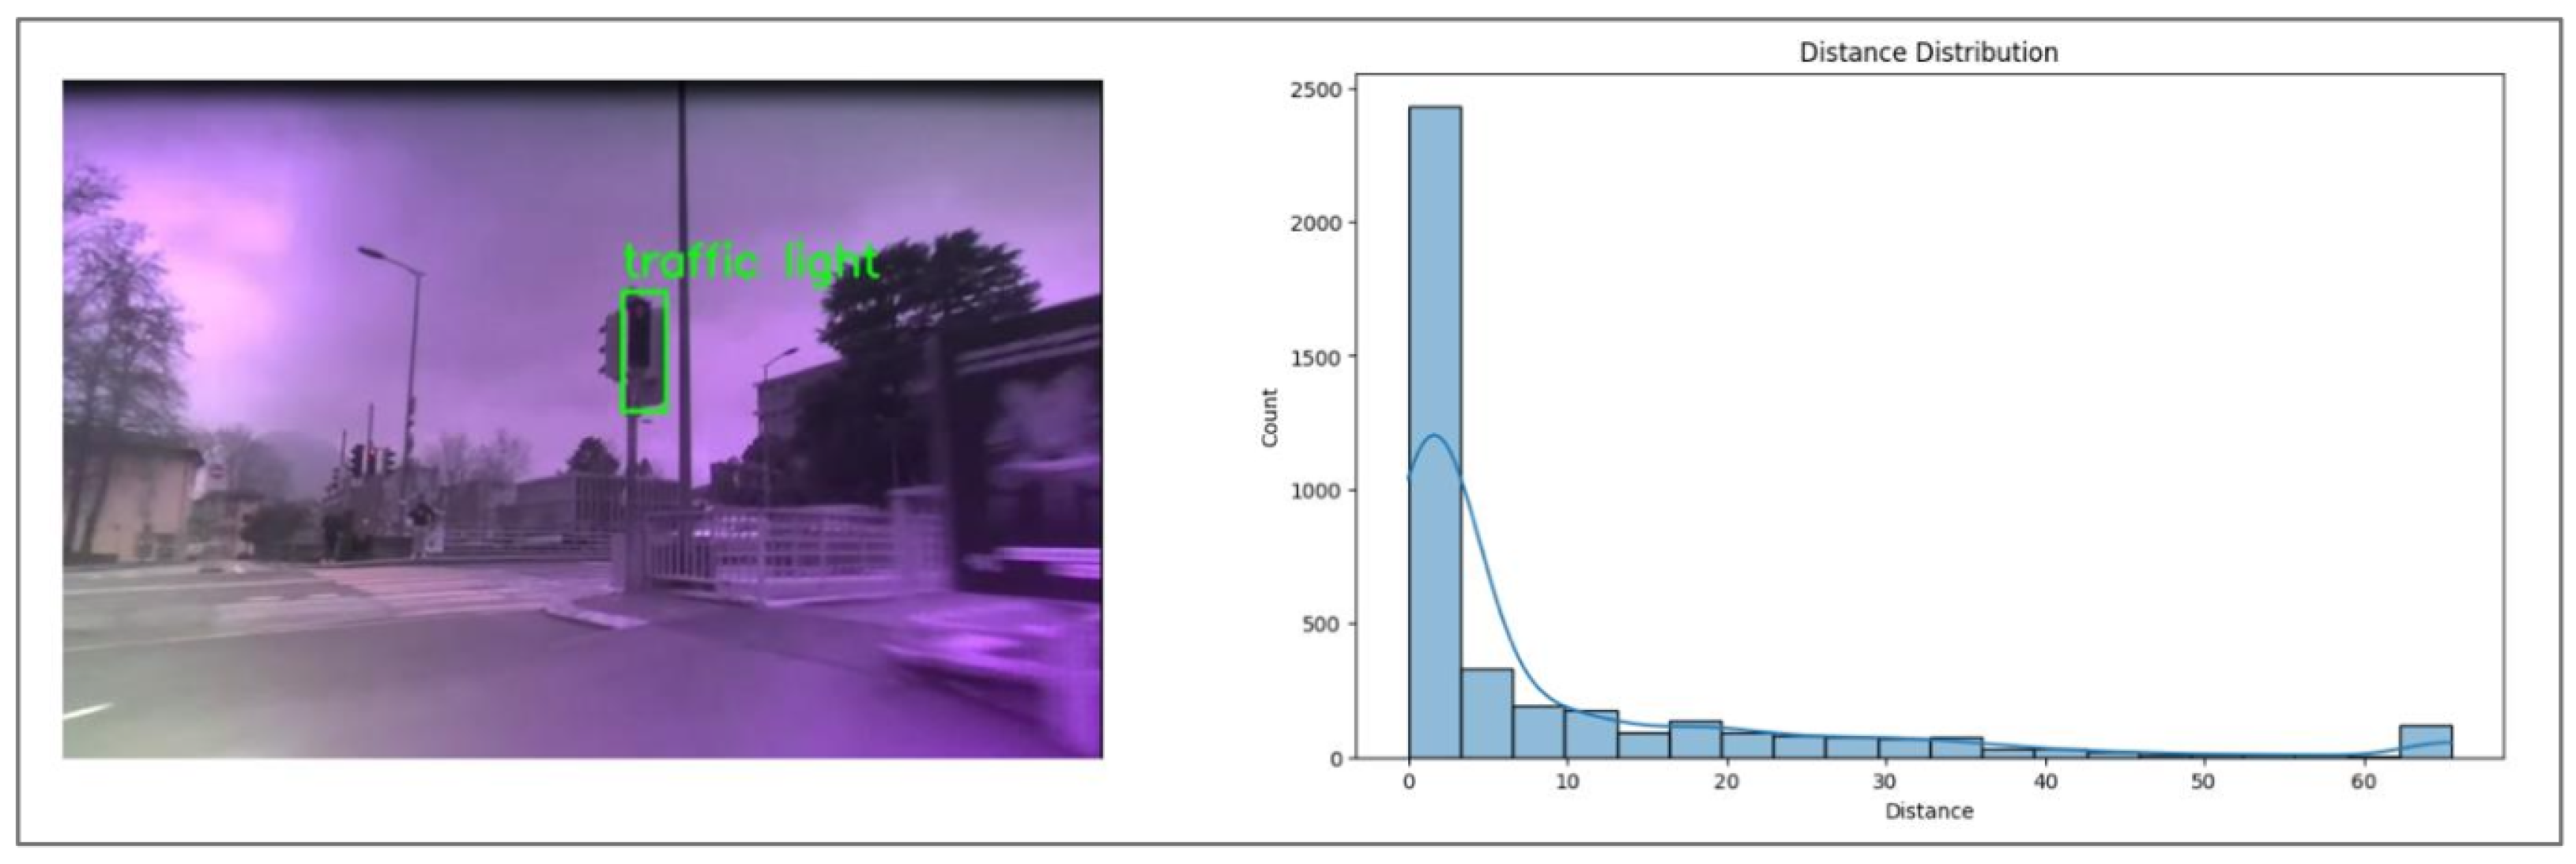
    After that, a model-based analysis on machine data was performed to identify the most impactful road characteristics on vehicle speed and acceleration, as a result of a supervised machine learning model prediction (Figure 5). More specifically, to build such a model, input data, distributed as shown in Figure 6, were considered. These road characteristics were fed into an eXtreme Gradient Boosting (https://xgboost.readthedocs.io/en/stable/, accesed on 1 April 2024) model [30], selected to reliably assign feature importance scores to the input data. One of the advantages behind the choice of such an ensemble method is that, unlike simple correlation-based methods, XGBoost captures non-linear relationships and feature interactions, making it more effective for selecting informative features. To optimize the performance of the model, we performed hyperparameter tuning, which led to the selection of the following values: 1000 estimators, ensuring a sufficient number of boosting rounds to capture complex patterns in the data; a learning rate of 0.01, which balances convergence speed and performance to prevent overfitting; and a maximum depth of 100.
  • Analysis of RealSense camera data for the inference of encounters and conflicts
    The RealSense D455 cameras are RGB-D cameras, meaning they capture both color (RGB) and depth (D) information to generate a three-dimensional representation of the surrounding environment. Depth measurement was achieved using stereoscopic vision, employing two grayscale sensors and an infrared projector. Additionally, an RGB sensor was used to capture a standard color image. Although the cameras were equipped with an active projector operating at 850 nm, they were used in passive mode for this study. This choice was made because the active light source would be significantly weaker compared to sunlight, reducing its effectiveness in outdoor environments. Using the cameras in passive mode also minimized power consumption, thereby extending battery life. The depth image, captured with the stereoscopic depth sensor, was inherently misaligned with the RGB image due to the spatial separation of the sensors. However, a factory calibration process enabled a post-processed alignment between the Field of View (FoV) of the depth map and the RGB image. This alignment ensured that any model applied to the RGB image could be accurately transferred at a pixel level to the corresponding depth map, facilitating precise spatial analysis and scene understanding. An example of aligned depth-image pictures is shown in Figure 7. To perform object detection and tracking, we employed the latest version of the You Only Look Once (YOLO) framework, specifically https://docs.ultralytics.com/it/models/yolov8/, accessed on 1 April 2024. Renowned for its speed and accuracy, YOLO is particularly well suited for real-time applications such as video-based road data analysis. In this study, it was applied to the RGB images and then transferred to the aligned depth images, allowing the estimation of the distance between the detected person and the camera. This estimation was performed using the median of the depth values within the bounding box, mitigating the influence of any background pixels that might be present within the detection area. Among the pre-trained classes available in YOLO, we selected those relevant to urban mobility, including pedestrians, cars, bicycles, and motorcycles, to ensure effective detection and tracking in road environments. Based on the objects tracked by this analysis, a heuristic was applied to differentiate between encounter and conflict events. These events were correlated to the characteristics of the roads visited.

2.6. Data Collection: Social Testing

Regarding the social and policy analysis of urban micromobility, an event was held on 14 October 2023, at Ciani Park in Lugano. The event aimed to conduct an in-depth analysis of the usability of the Genny Zero device, the social perception of its use, and a qualitative understanding of the subjective reception of micromobility in the urban context. During the project, there was an additional research opportunity through the synergy with the Ensemble project. Ensemble, an internal interdepartmental SUPSI initiative, seeks to identify and test a methodology that fosters a citizenship participatory approach through a digital platform (Decidim-Ensemble). This platform encourages involvement, discussion, and collaborative decision-making. Ensemble is designed for both the university community and the broader public, supporting social activation, community aggregation, political engagement, and social innovation. The project includes the establishment of the ENSEMBLE4IMM Citizenship Laboratory, which integrates three in-person meetings with online activities on the Decidim-Ensemble platform. Through this hybrid approach, guidelines for improving urban mobility and urban policy-making can be defined. The fruitful synergy between the projects emerged because the October 2023 IMM test of the Genny Zero device at Ciani Park had potential applicability within the Ensemble-IMM Citizenship Laboratory as a case study. On 15 April 2024, at the SUPSI East Campus, a second additional test of the Genny Zero device was conducted as part of one of the three in-person Citizenship Laboratory events. This test aimed to evaluate both the usability of the device and the soft mobility approach it promotes while also reflecting on the layout of urban spaces in relation to the broader spectrum of micromobility solutions.

3. Results

The data collected during the urban, experimental, and social tests aimed to explore the state of the art in mobility within specific Swiss contexts, with a particular focus on Lugano. As a privileged research hub, Lugano was central to the investigation thanks to the collaboration with the city of Lugano and the Lugano Living Lab. The analysis below illustrated (set out in urban, experimental, and social layers) is project report-oriented. Therefore, this section exposes key findings and the description of their achievement. In addition, this section does not provide comparison with other micromobility means, since its goal is to assess the feasibility of introducing new micromobility devices, identify potential conflicts with other transportation modes, and evaluate user perceptions, farming urban micromibility policies linked with urban spaces, and limitations.

3.1. Data Analysis: Urban

As previously mentioned, the urban analysis was carried out on two distinct levels. First, four Swiss cities were chosen as case studies to represent diverse geographic contexts: Chur, a city located on a valley floor; Fribourg, a flat city with a meandering river; Andermatt, a rapidly developing mountain resort; and Lugano, a lakeside city. Following this, a more detailed analysis was conducted specifically on Lugano. The data analysis, as outlined in Section 2.4, was performed using QGIS software, https://qgis.org/ accessed on 1 April 2024. To facilitate the understanding of the analyses presented below, please refer to the legend in Figure 8.
The city of Chur is located in a valley at the confluence of two rivers: the Plessur and the Rhine. The analysis did not identify any gradient-related issues within the urban center. Restrictions on the use of the Genny Zero device are primarily associated with the surrounding slopes (Figure 9).
Chur is well equipped with parking facilities (mapped in green) and local public transport stops (mapped in blue) (Figure 10). However, the number of bicycle parking spaces (105) is significantly lower compared to car parking spaces (867).
The city recently introduced a bike-sharing service. Following the success of a pilot project launched in September 2023—managed by Pro Velo Graubünden and the Canton of Graubünden—with 10 initial stations, the service was expanded to 20 stations, each including five e-cargo bikes. Lastly, several charging stations are available, primarily concentrated in the city center.
The city of Fribourg is characterized by a multi-level topography (Figure 11). The Sarine River has eroded the molasse of the plateau, creating distinct levels: a lower level along the riverbanks, a higher level to the west above the erosion, and an even higher level to the east (the Schoenberg district). These elevation differences are easily navigable thanks to the city’s intermodal transport network.
Fribourg boasts an extensive public transport system (mapped in blue), including a funicular, numerous parking facilities (green), bicycle parking areas (pink), and two railway stations (light blue) (Figure 12). The upper levels of the city are connected by bridges, ensuring accessibility without significant elevation changes.
In terms of sharing services, Fribourg has a well-developed offering through the Publibike service.
Finally, several charging stations are available, though they are primarily concentrated in the western and northern parts of the city. These stations support the use of electric vehicles and micromobility devices in the region, although their distribution is limited to specific areas within Fribourg.
For the mountain case study, the municipality of Andermatt was selected, a rapidly developing alpine destination with a growing ski resort.
The main roads in Andermatt are accessible for devices like Genny Zero, as they do not exceed a gradient of 11.3°. Inaccessible routes in this context include primarily mountain roads, hiking trails, and via ferrata. A unique feature of this municipality is the presence of a car shuttle train that connects Andermatt to Sedrun.
Recently, Andermatt launched the first bike-sharing service in the Alps, featuring seven stations across the valley, five of which are located in the center (Figure 13). This initiative aims to introduce shared sustainable mobility to alpine tourist regions (Andermatt Swiss Alps, 2024; PubliBike Velospot, 2024). However, gradient-related challenges become significant outside the urban center and valley. As a result, the use of the Genny Zero device is not feasible across the entire territory and requires integration with other modes of transportation, such as buses or trains, particularly for the northeastern slopes.
Vehicle charging stations are scarce in the area (Figure 14).
Lugano is located on the shores of the lake that shares its name. Today, it is the main economic center of the Canton of Ticino. Over the past 50 years, Lugano has undergone significant transformation. In the 1970s, it was a town with 27,000 residents covering an area of 11.6 km2. Between 1972 and 2013, it grew into a city with more than 67,000 inhabitants, a territorial reach of 75 km2, around 146,000 residents in the region, and over 100,000 jobs. Within the area analyzed, 16.2% of the roads are classified as non-navigable due to gradients exceeding 11.3° (Figure 15). To address this limitation, the analysis of local public transport, parking areas (both for bicycles and cars), and intermodal hubs identified key locations where the Genny Zero device could not be used due to steep gradients (Figure 16).
An area with a significant number of roads that exceed the 11.3° gradient threshold is the route connecting the city center to Lugano’s railway station. Fortunately, this issue is mitigated by the presence of a funicular, which provides an alternative means of transport. Charging stations and PubliBike stations (Figure 17 and Figure 18) were also mapped to explore potential integrated solutions that could include micromobility devices in the future.
Lugano served as the primary case study for in-depth analysis. One aspect focused on assessing potential demand, represented by the combined population of residents and total jobs, identifying inhabitants who might be interested in using the device. The map highlights these areas with a gradient scale of green, helping to pinpoint zones of greater interest for device deployment (Figure 19).
By overlaying all elements analyzed, specific areas can be identified as optimal locations to deploy devices. The area around Lugano’s railway station (Figure 20) emerges as a highly suitable site for planning device deployment. This sector features high demand, numerous PubliBike stations, and parking facilities for bicycles and motor vehicles, as well as two electric charging stations that could support device recharging (Figure 21). In addition, the availability of public transport options helps overcome the gradient-related challenges of reaching the historic center.
The analysis of the four Swiss cities as case studies highlighted five key aspects common to all of them:
  • Presence of slopes limiting the use of the Genny Zero device. In all the cities analyzed, gradients exceeding 11.3° present a barrier to the use of micromobility devices such as Genny Zero.
  • Integration with public transport networks. Each urban area is equipped with well-developed public transportation systems (including buses, trains, and funiculars), facilitating intermodal mobility and helping to overcome challenges related to steep gradients.
  • Active or expanding bike-sharing services. All four cities have implemented or are expanding bike-sharing services, including e-bikes and, in some cases, e-cargo bikes.
  • Availability of charging stations for electric vehicles. Charging infrastructure is present in all cases, supporting the use of electric vehicles and micromobility devices, although coverage may vary between city centers and peripheral areas.
  • Analysis and provision of parking facilities. Each city offers parking areas for both cars and bicycles, although the number of bicycle parking spaces is generally lower compared to car parking spaces.
The analyses were useful in providing a comprehensive overview of the state of the art in mobility across the four reference cities and the potential integrations with micromobility devices. In the case of Lugano, the analyses enabled the selection of the characteristics for the experiments described in Section 3.2.

3.2. Data Analysis: Experiment

During the execution of the experiment, the Genny Zero device collected machine data (directly through the device), as well as inertial and GPS data (via sensors installed on the device) (Figure 22). Specifically, below is the detailed dataset collected during the urban test, whose traveled route is represented in Figure 23.
  • Inertial sensor data, sampling frequency 50 Hz (3D acceleration, 3D gyroscope, front and rear battery voltage, tilt speed, and front and rear battery current).
  • Vehicle inertial data, sampling frequency 10 Hz (pitch, distance traveled, slope, torque percentage, steering position, roll, and handlebar height speed).
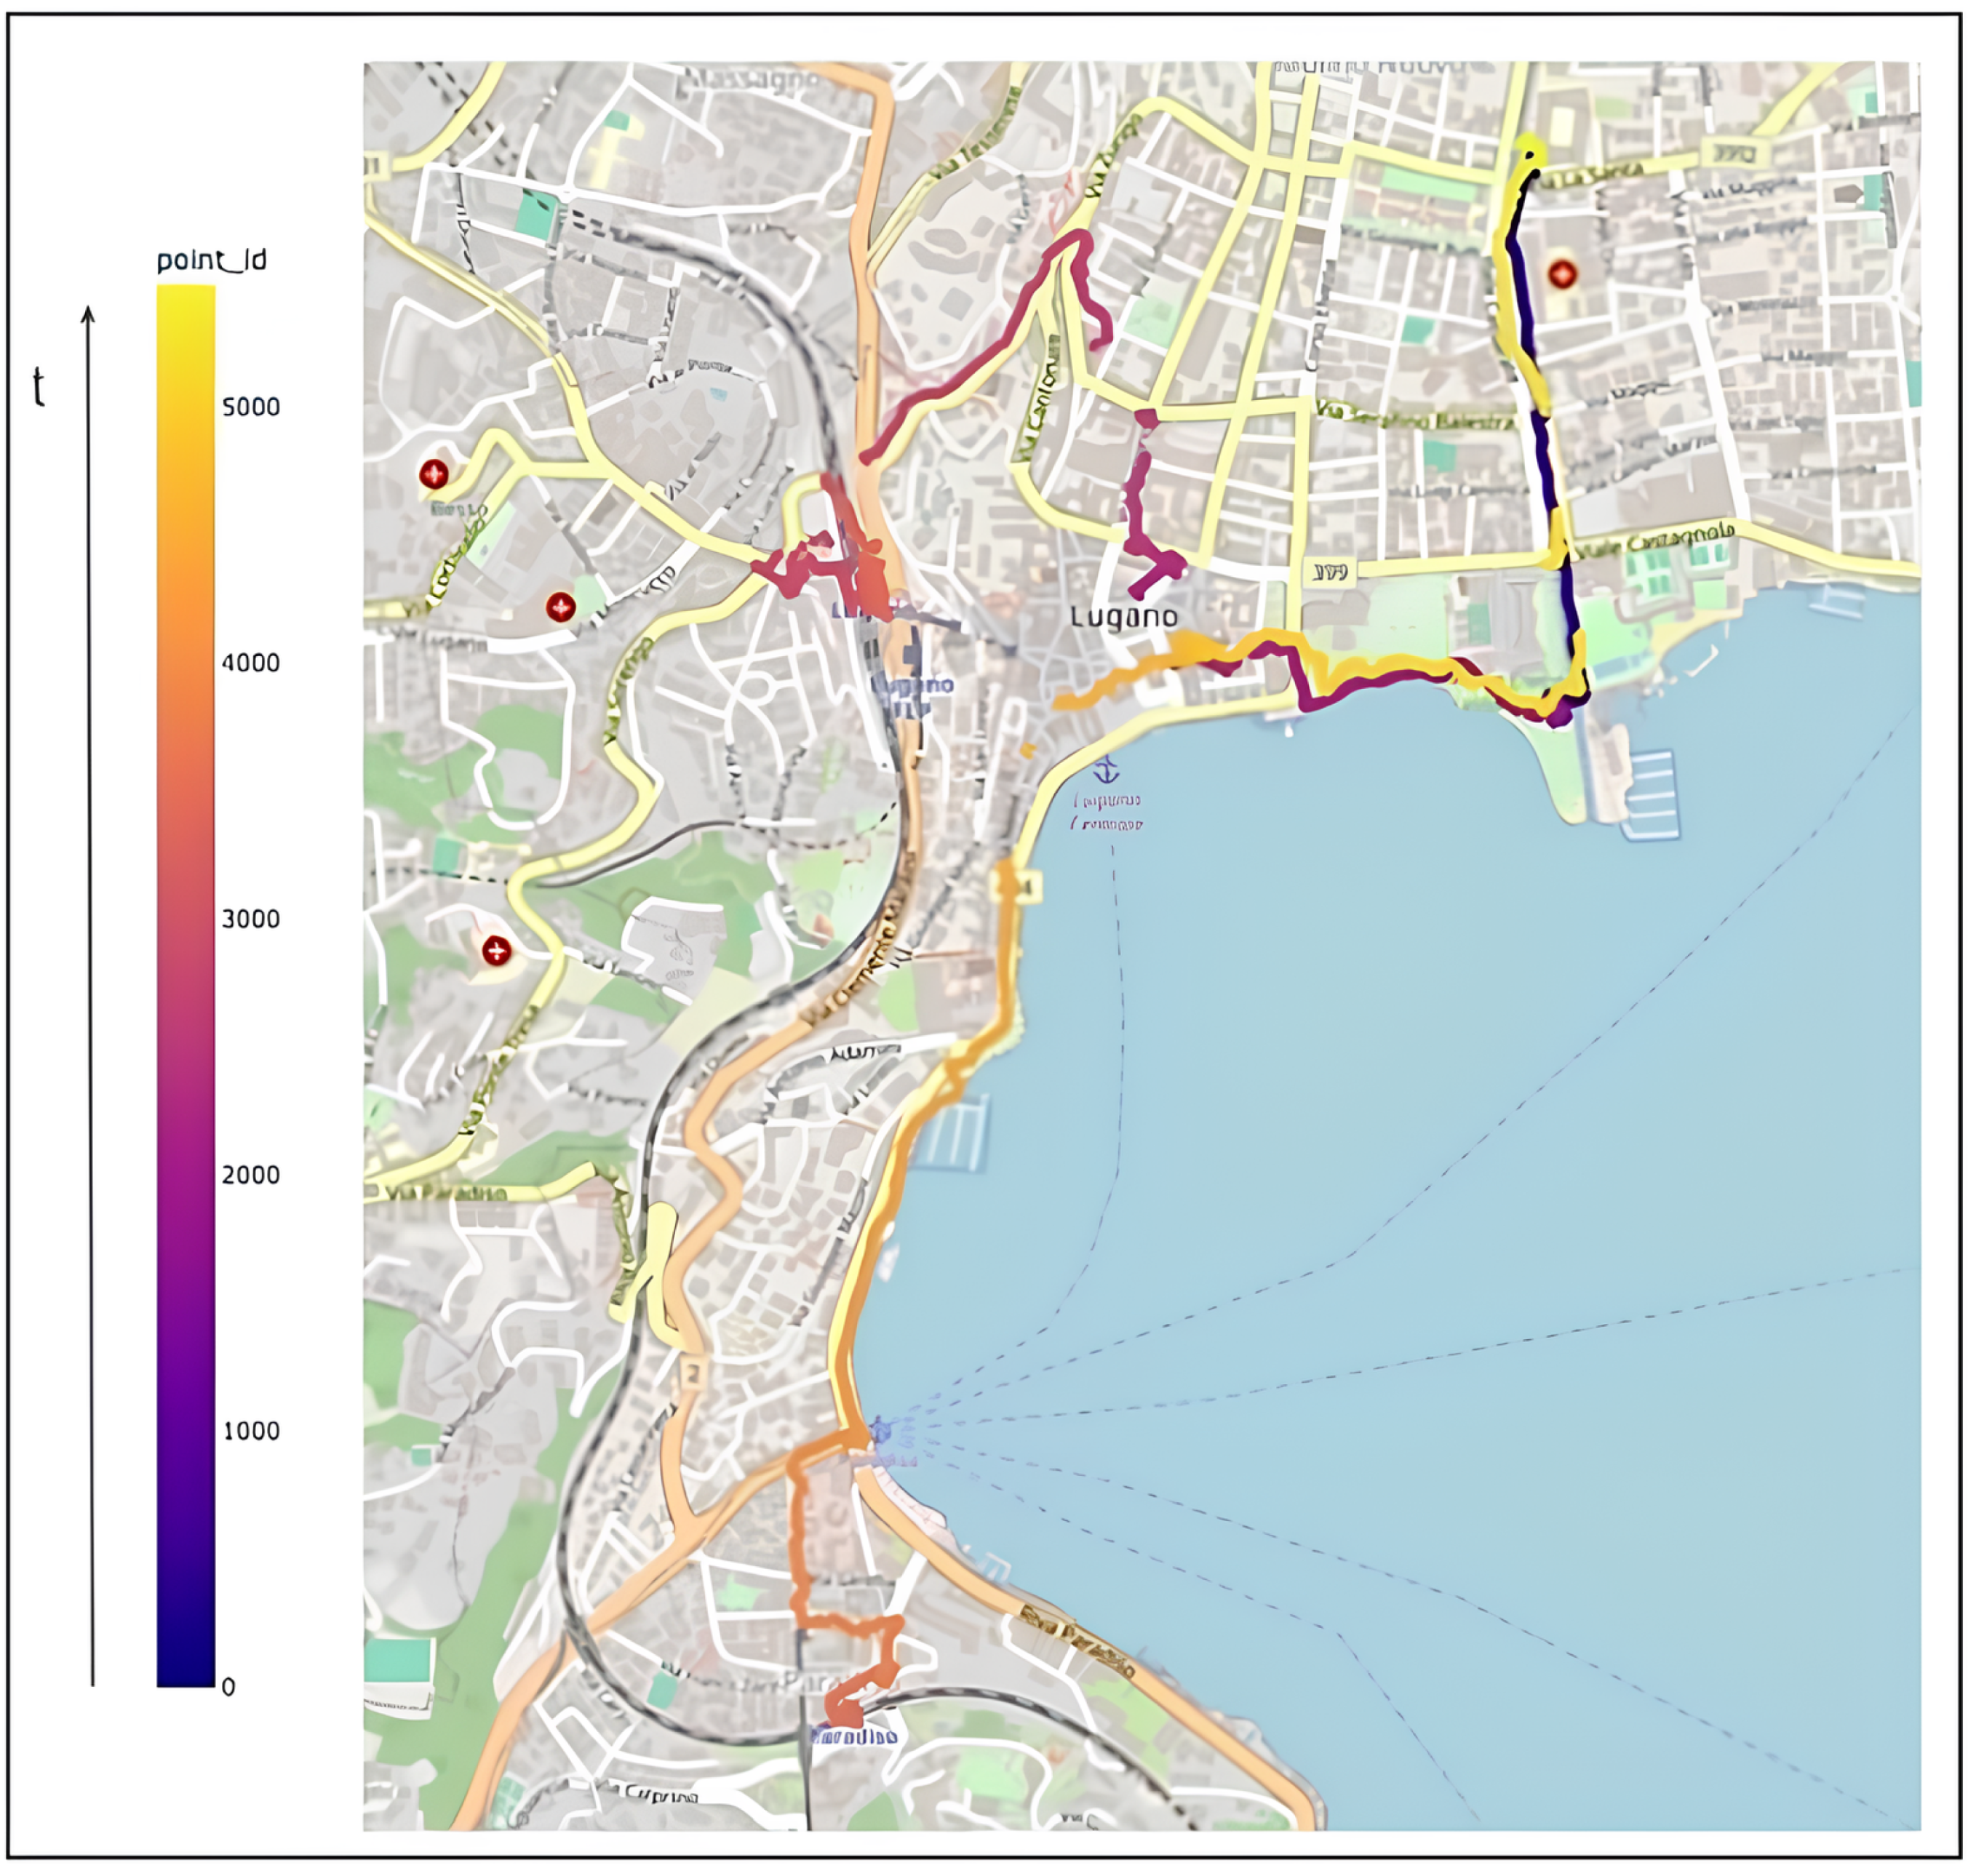
  • GPS data, sampling frequency 1 Hz (latitude, longitude, and altitude).
The data were processed, where a merging operation of the various sources generated a unified dataset, using a timestamp as the synchronization key for the join operation. Specifically, a function was implemented to associate the closest sampled data points (nearest neighbors) in time (in both directions).
During the pre-processing phase of the collected data, operations were performed for data normalization, removal of anomalous values (outliers), feature selection, and evaluation of the correlation between the collected machine data. In particular, the analysis of data quality led to the exclusion of certain sources (e.g., gyroscope). Figure 24 shows the distribution of the data collected by the Genny Zero device.
A preliminary analytical study was conducted on the collected data to derive insights and real evidence from the dataset. Figure 25 represents the distribution of speed for each traveled segment during the experiments (a unit of measurement specifically defined by the device but useful for comparative analysis). From the figure, it can be observed that the route included six low-speed segments, four medium-speed segments, and six high-speed segments: the lowest-speed segment corresponds to the SUPSI Campus, while the highest-speed segment corresponds to the route connecting LAC to Piazza Carlo Battaglini.
Figure 26 underlines the details of speed (top graph) and acceleration (bottom graph) for each street traveled during the route. The speed graph presents higher variance, allowing segmentation of the streets based on speed spread: streets where the device traveled at a quasi-constant speed (boxes with smaller areas) and streets where the driving pattern was more inconsistent (boxes with larger areas). This variability in movement is mainly due to the presence of pedestrians and crossing points along the route.
The key observations which emerge from our analysis are the following:
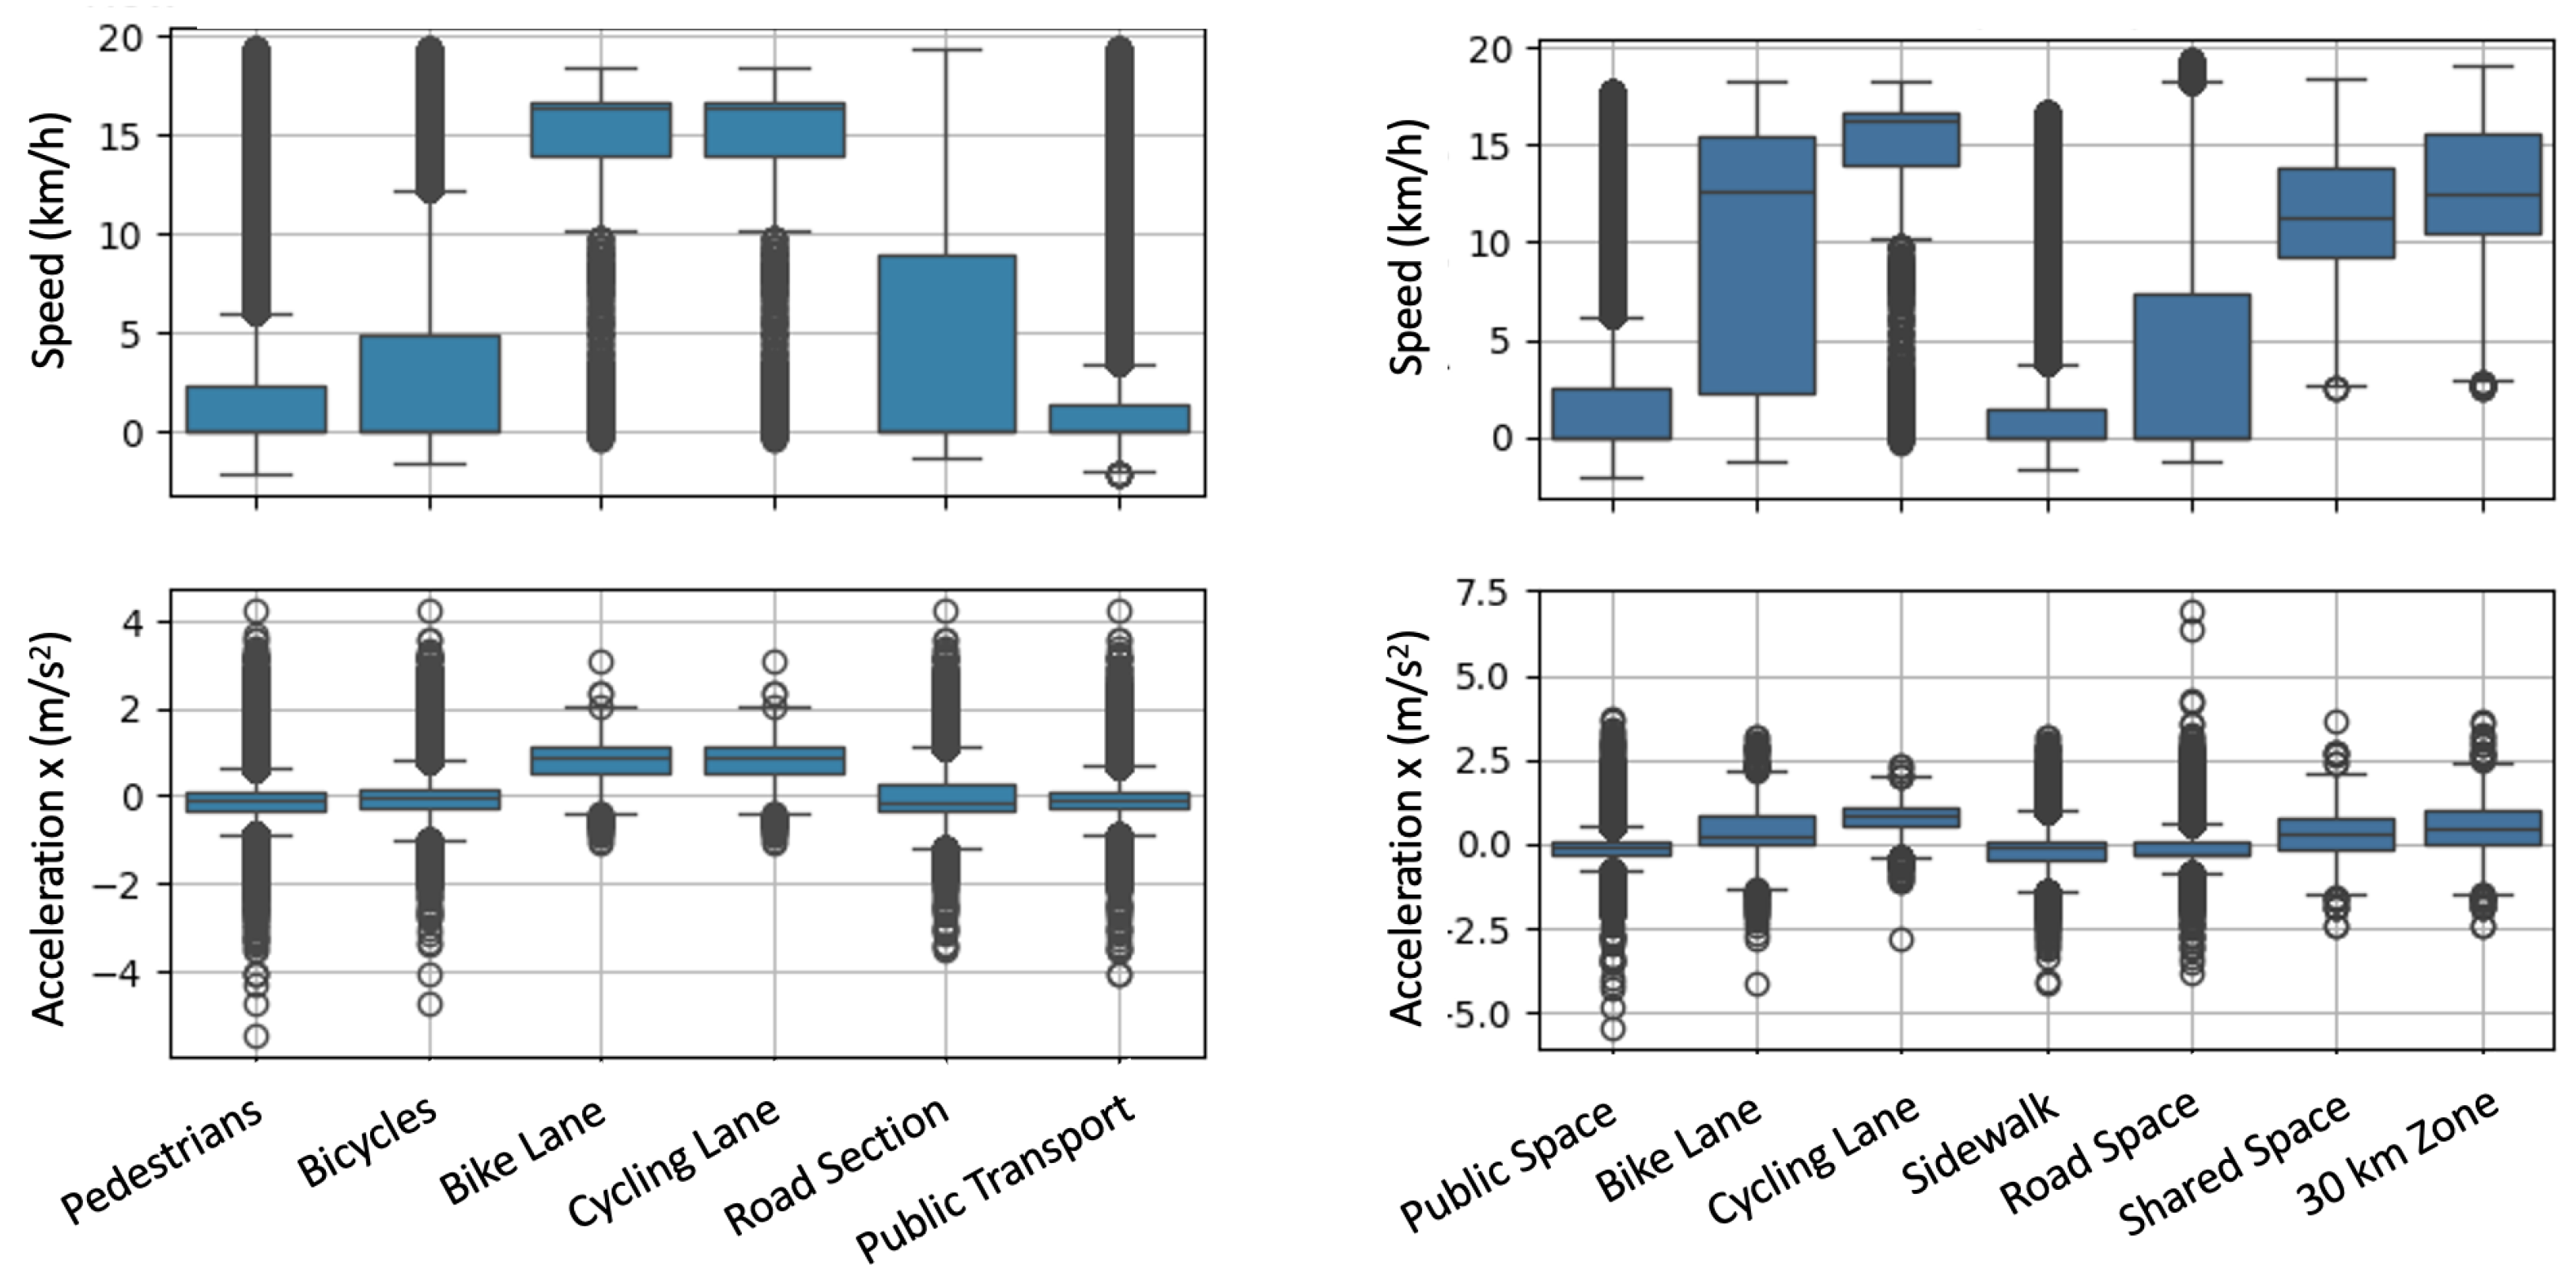
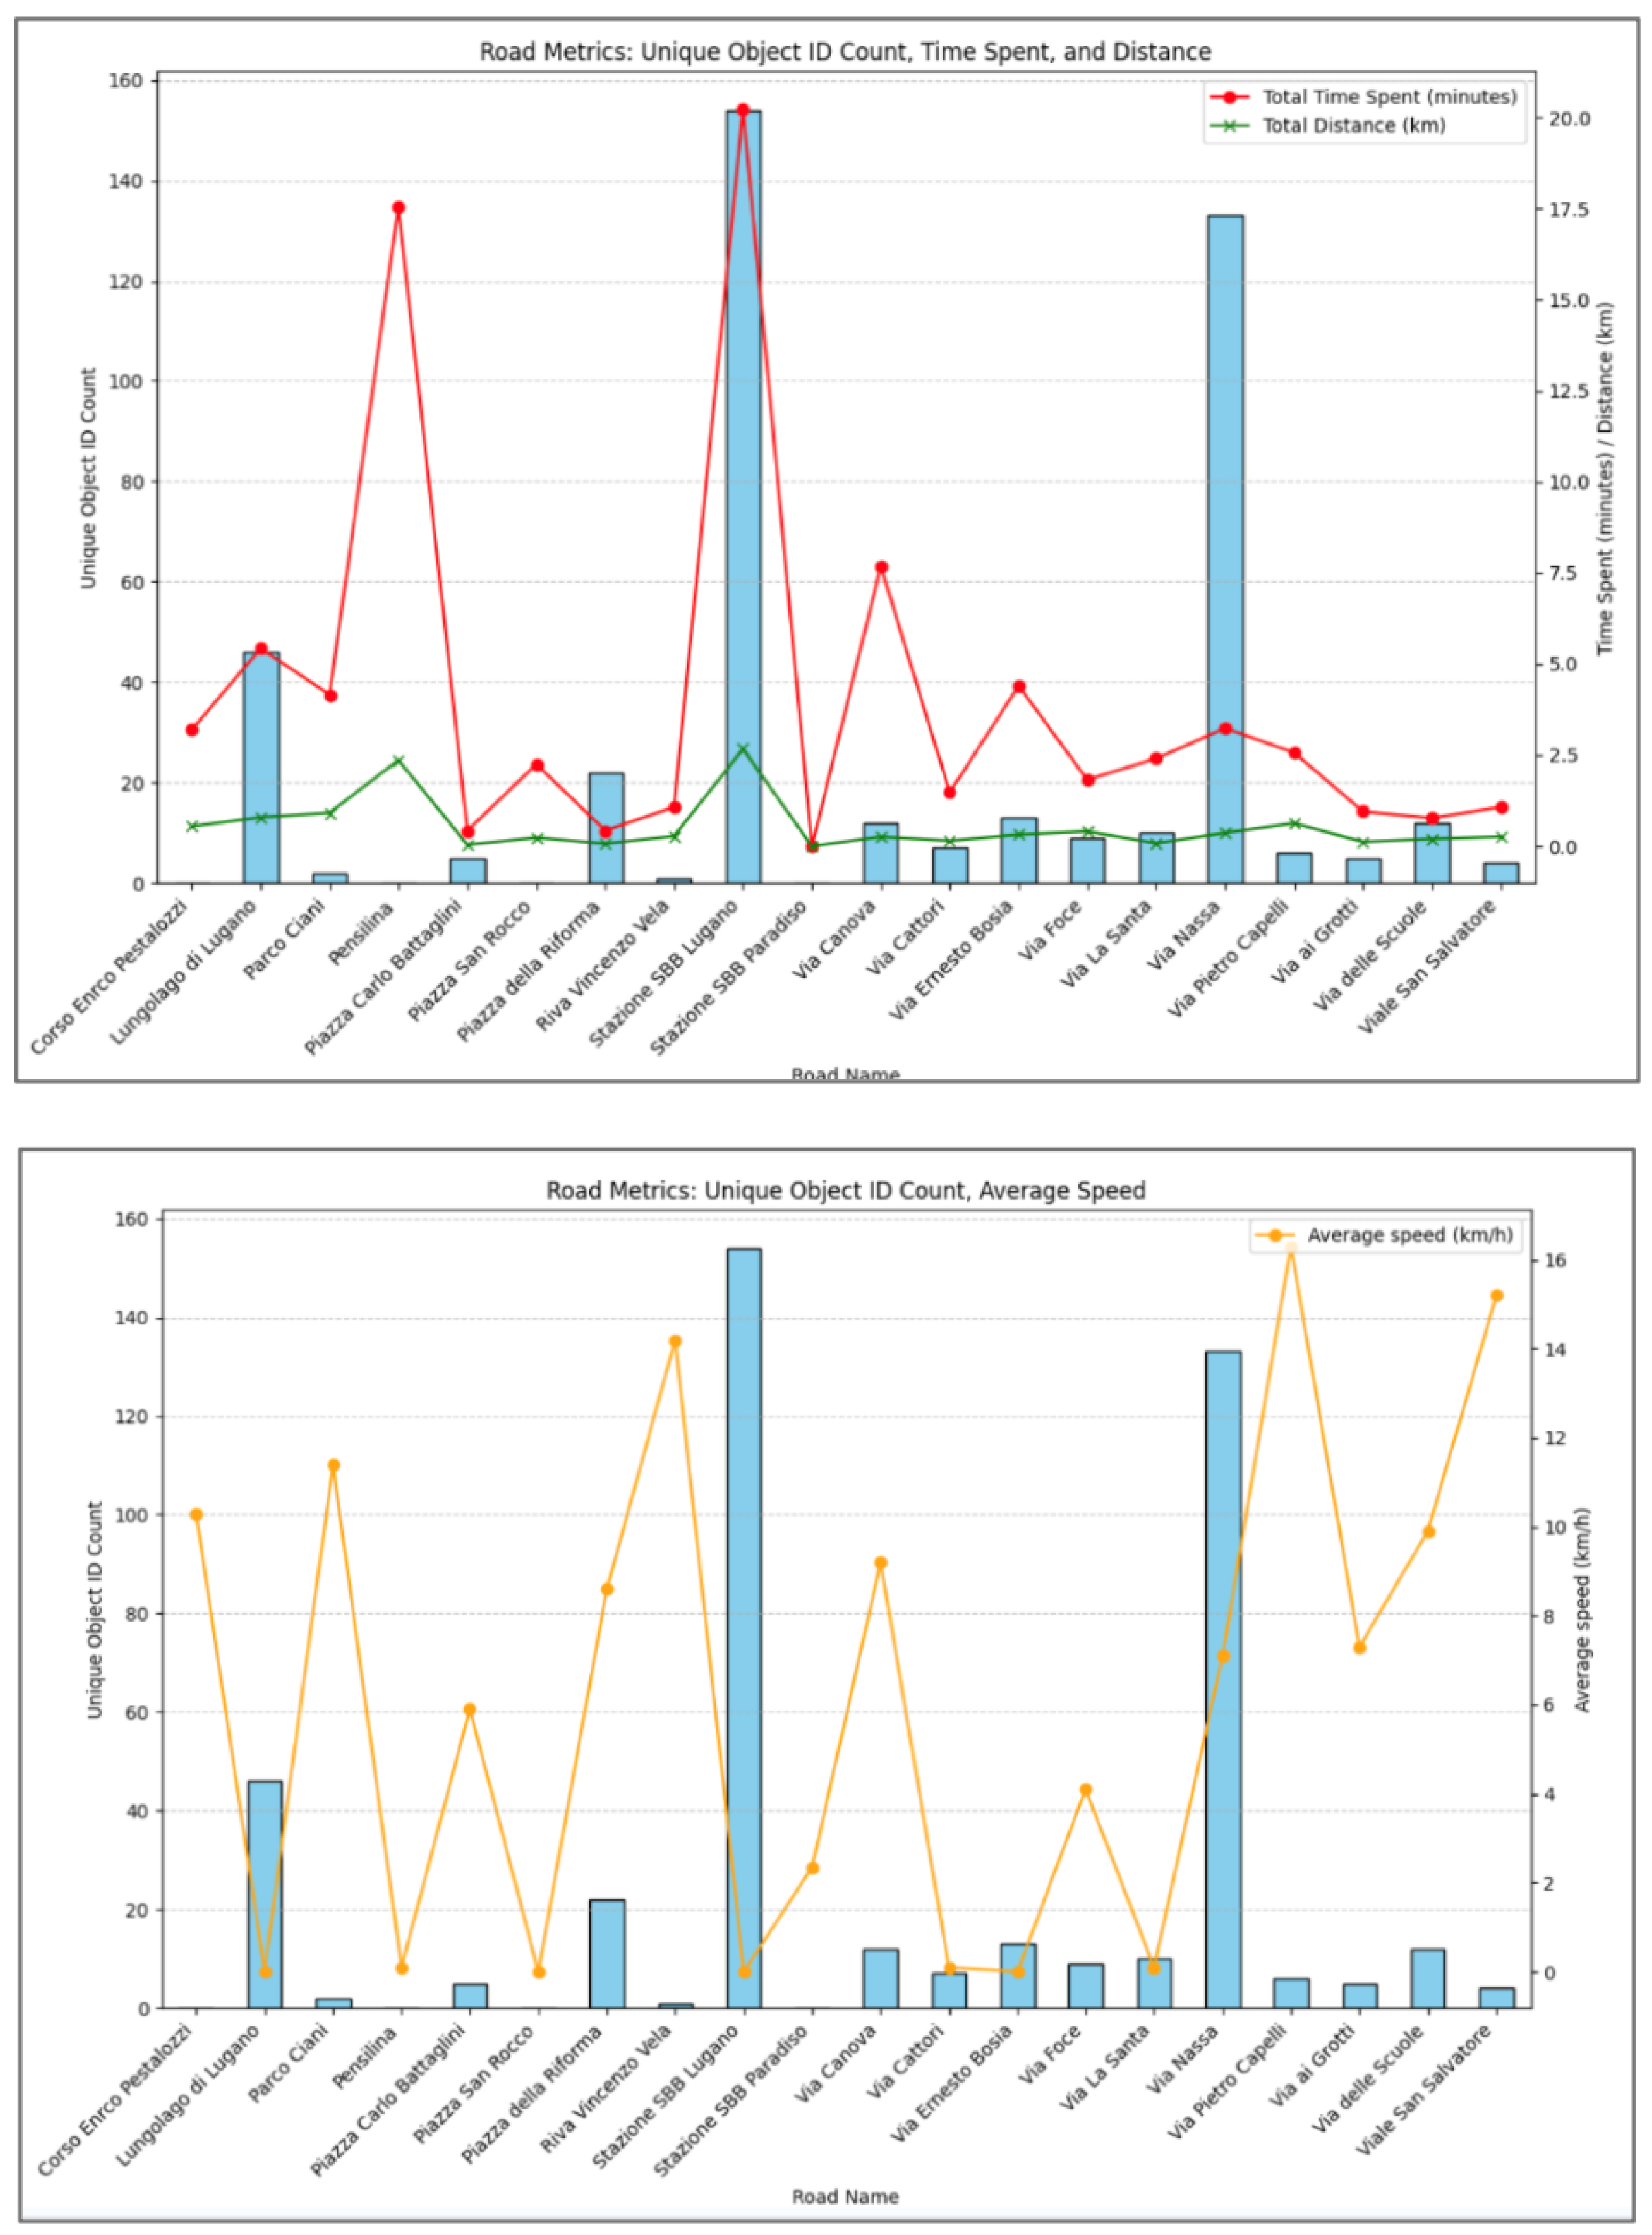
  • The Genny device demonstrated sustained and quasi-constant speed on the ‘Bike Path’ and ‘Bike Lane’ segments. This suggests that cycling infrastructure does not pose a potential conflict for Genny Zero (Figure 26);
  • In areas where vehicular traffic is restricted and in 30 km/h zones, Genny Zero moves at high speeds without encountering obstacles, allowing free and unobstructed movement (Figure 26).
The project also analyzed the collected data to identify which road characteristics and urban environmental factors significantly impact vehicle speed and acceleration. To achieve this, we leveraged the XGBoost algorithm ([30], a supervised machine learning model), exploiting its ability to model complex relationships between the target output (speed and acceleration) and characteristics of the traveled road, which were used as input features: potential conflict with bicycles, pedestrians, and public transport; the presence of public space; bike lane and sidewalk availability; road width. The importance of each input feature was determined based on its contribution to reducing the model’s predictive error. The distribution of the target outputs values measured is represented in Figure 27, where we visualize the distribution of speed and acceleration values segmented per location category. In particular, it is evident from this picture that the Genny vehicle was able to travel at higher speeds when moving through shared-use zones (shared pedestrian and bicycles) or cycle paths, while it adapted by decreasing its speed in pedestrian areas (e.g., TPL bus stops).
The objective function in this analysis was designed to optimize the XGBoost model’s predictive performance for vehicle speed and acceleration based on input features related to the urban environment and road characteristics. Specifically, the function aims to minimize the prediction error by evaluating how well the model captures the relationship between these inputs and the target variables. Since the targets of our analysis were both continuous, a regression loss function was used (Mean Squared Error) during the training procedure. The objective function employed incorporated feature importance scoring (gain-based importance) to quantify how much each input variable contributes to the prediction of speed and acceleration. We optimized the hyperparameters of the model in order to prevent overfitting, and to ensure that only the most impactful features significantly influence predictions.
As shown in Figure 28, the model is capable of predicting the target variables with a very low average error, ensuring the reliability of the insights derived from our analysis. Specifically, our trained model predicts the vehicle speed with a median error of −0.87 km/h and the acceleration with a median error of −0.09 m/s2. In order to ensure the XGBoost model was reliable, minimized overfitting, and achieved strong generalization performance on unseen data, a grid search of the best model hyperparameters with a cross-validation strategy was implemented.
Figure 28 shows the distribution of the prediction residuals calculated over the best-performing cross-validation iteration. As visible from the figure, the median of this error is near zero for both cases (−0.87 km/h for the speed and −0.09 m/s2 for the acceleration), and the distribution of the error values is restricted to a limited range of size 7.6 km/h for the speed and 1.47 m/s2 for acceleration. This small calculated error confirmed the reliability of our analysis, hence confirming that the selected input features significantly influenced vehicle speed and acceleration in a meaningful and interpretable manner.
To predict the most impactful road characteristics, through the model-based approach described in Section 2, we considered as input data a set of road characteristics whose distribution is shown in Figure 6 and obtained the results reported in Figure 29.
More specifically, Figure 29 illustrates the analysis of the importance of input features for the two different model outputs, speed (top graph) and acceleration (bottom graph). The importance values indicate how much each feature contributes to the predictions of the model. For speed, this kind of assessment showed the following:
(i)
The most influential feature is sidewalk width, which has a significantly higher importance score than any other feature.
(ii)
The second-most important feature, also with a significant impact, is the presence of shared space.
(iii)
All other features, such as, for instance, the vehicle’s dimensions, have a much smaller impact on the target variable.
(iv)
In this case, the presence of a bicycle has minimal impact.
In contrast, for vehicle acceleration, we observed the following:
(i)
The most relevant feature for acceleration is the type of route, e.g., including the presence of a bike lane, followed by the presence of a bicycle on the route.
(ii)
Sidewalk width, the presence of public space, and roadway width also play a role but with lower importance.
(iii)
Many other features, including vehicle dimensions and shared space, have much smaller contributions.
In summary, the width of the sidewalk appears to be an important factor in predicting both speed and acceleration, suggesting that the dimensions of the sidewalk influence the dynamics of movement. Some other features, such as roadway width, significantly affect both predictions and, in addition, the presence of bike lanes significantly affects acceleration, possibly due to changes in road-sharing conditions (bike lanes generally create smoother transitions for cyclists and vehicles, and also, indirect effects, such as traffic-calming measures in bike-friendly areas, may be considered). Finally, some features have minimal contributions, indicating that they may not be strong predictors in the model.
During the experiments, data were collected from cameras mounted on Genny Zero to enable an automated analysis of potential conflicts with other users in urban spaces. Intel RealSense depth cameras were selected to achieve conflict detection parameters, including the following: the identification and counting of people and vehicles, and the measurement of their distance from the device. A total of four cameras were mounted on Genny Zero, one on each side, providing a 360-degree field of view around the device. The cameras, synchronized during sampling, recorded at a frequency of 5 FPS and a resolution of 480 × 640 pixels.
Figure 30 illustrates the pipeline implemented for processing the sampled video data. The video processing consisted of the following steps:
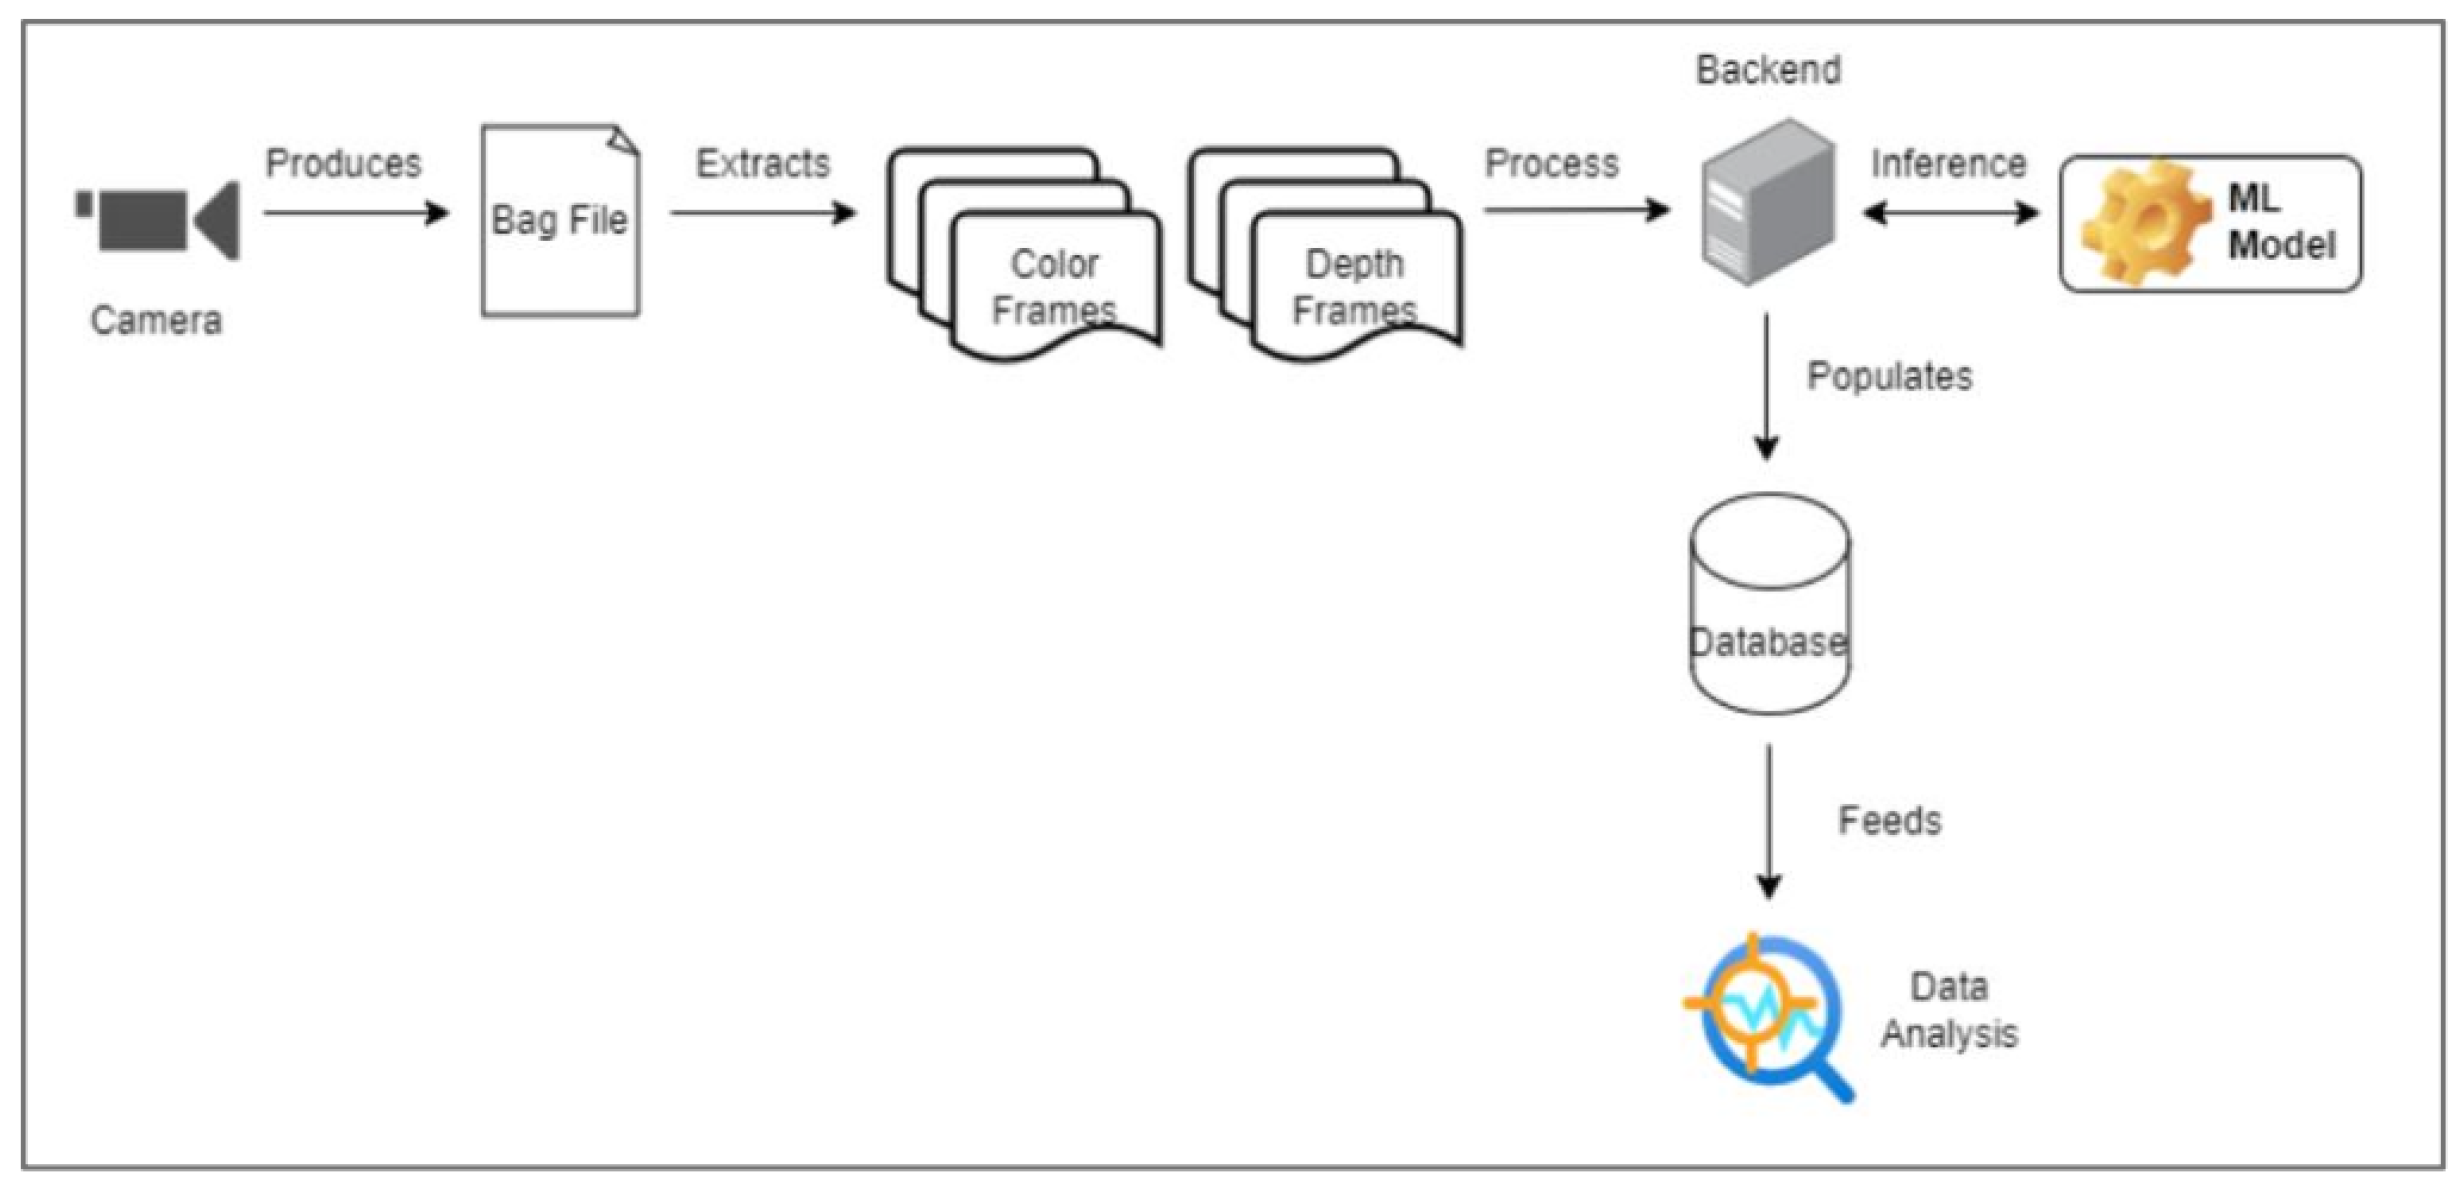
  • Frames were processed and rotated if necessary.
  • Frames were processed on a backend server, where analyses such as object (human) detection, tracking, and distance estimation were performed.
  • Raw and processed data were stored in a database infrastructure for further analysis.
  • Data were exported in Parquet format to facilitate high-volume structured data analysis.
The processing of video data enabled various types of analysis. In particular, during this process, objects of different types were identified, and their distances were calculated as the median distance of points within the bounding box defining the object in the image (Figure 31).
The tracking of moving obstacles allowed us to generate time series from the video data, representing the distance between the Genny Zero device and the tracked object. This type of analysis enabled us to identify atypical behaviors of pedestrians or slow mobility devices in situations of potential conflict with Genny Zero, distinguishing between two fundamental concepts.
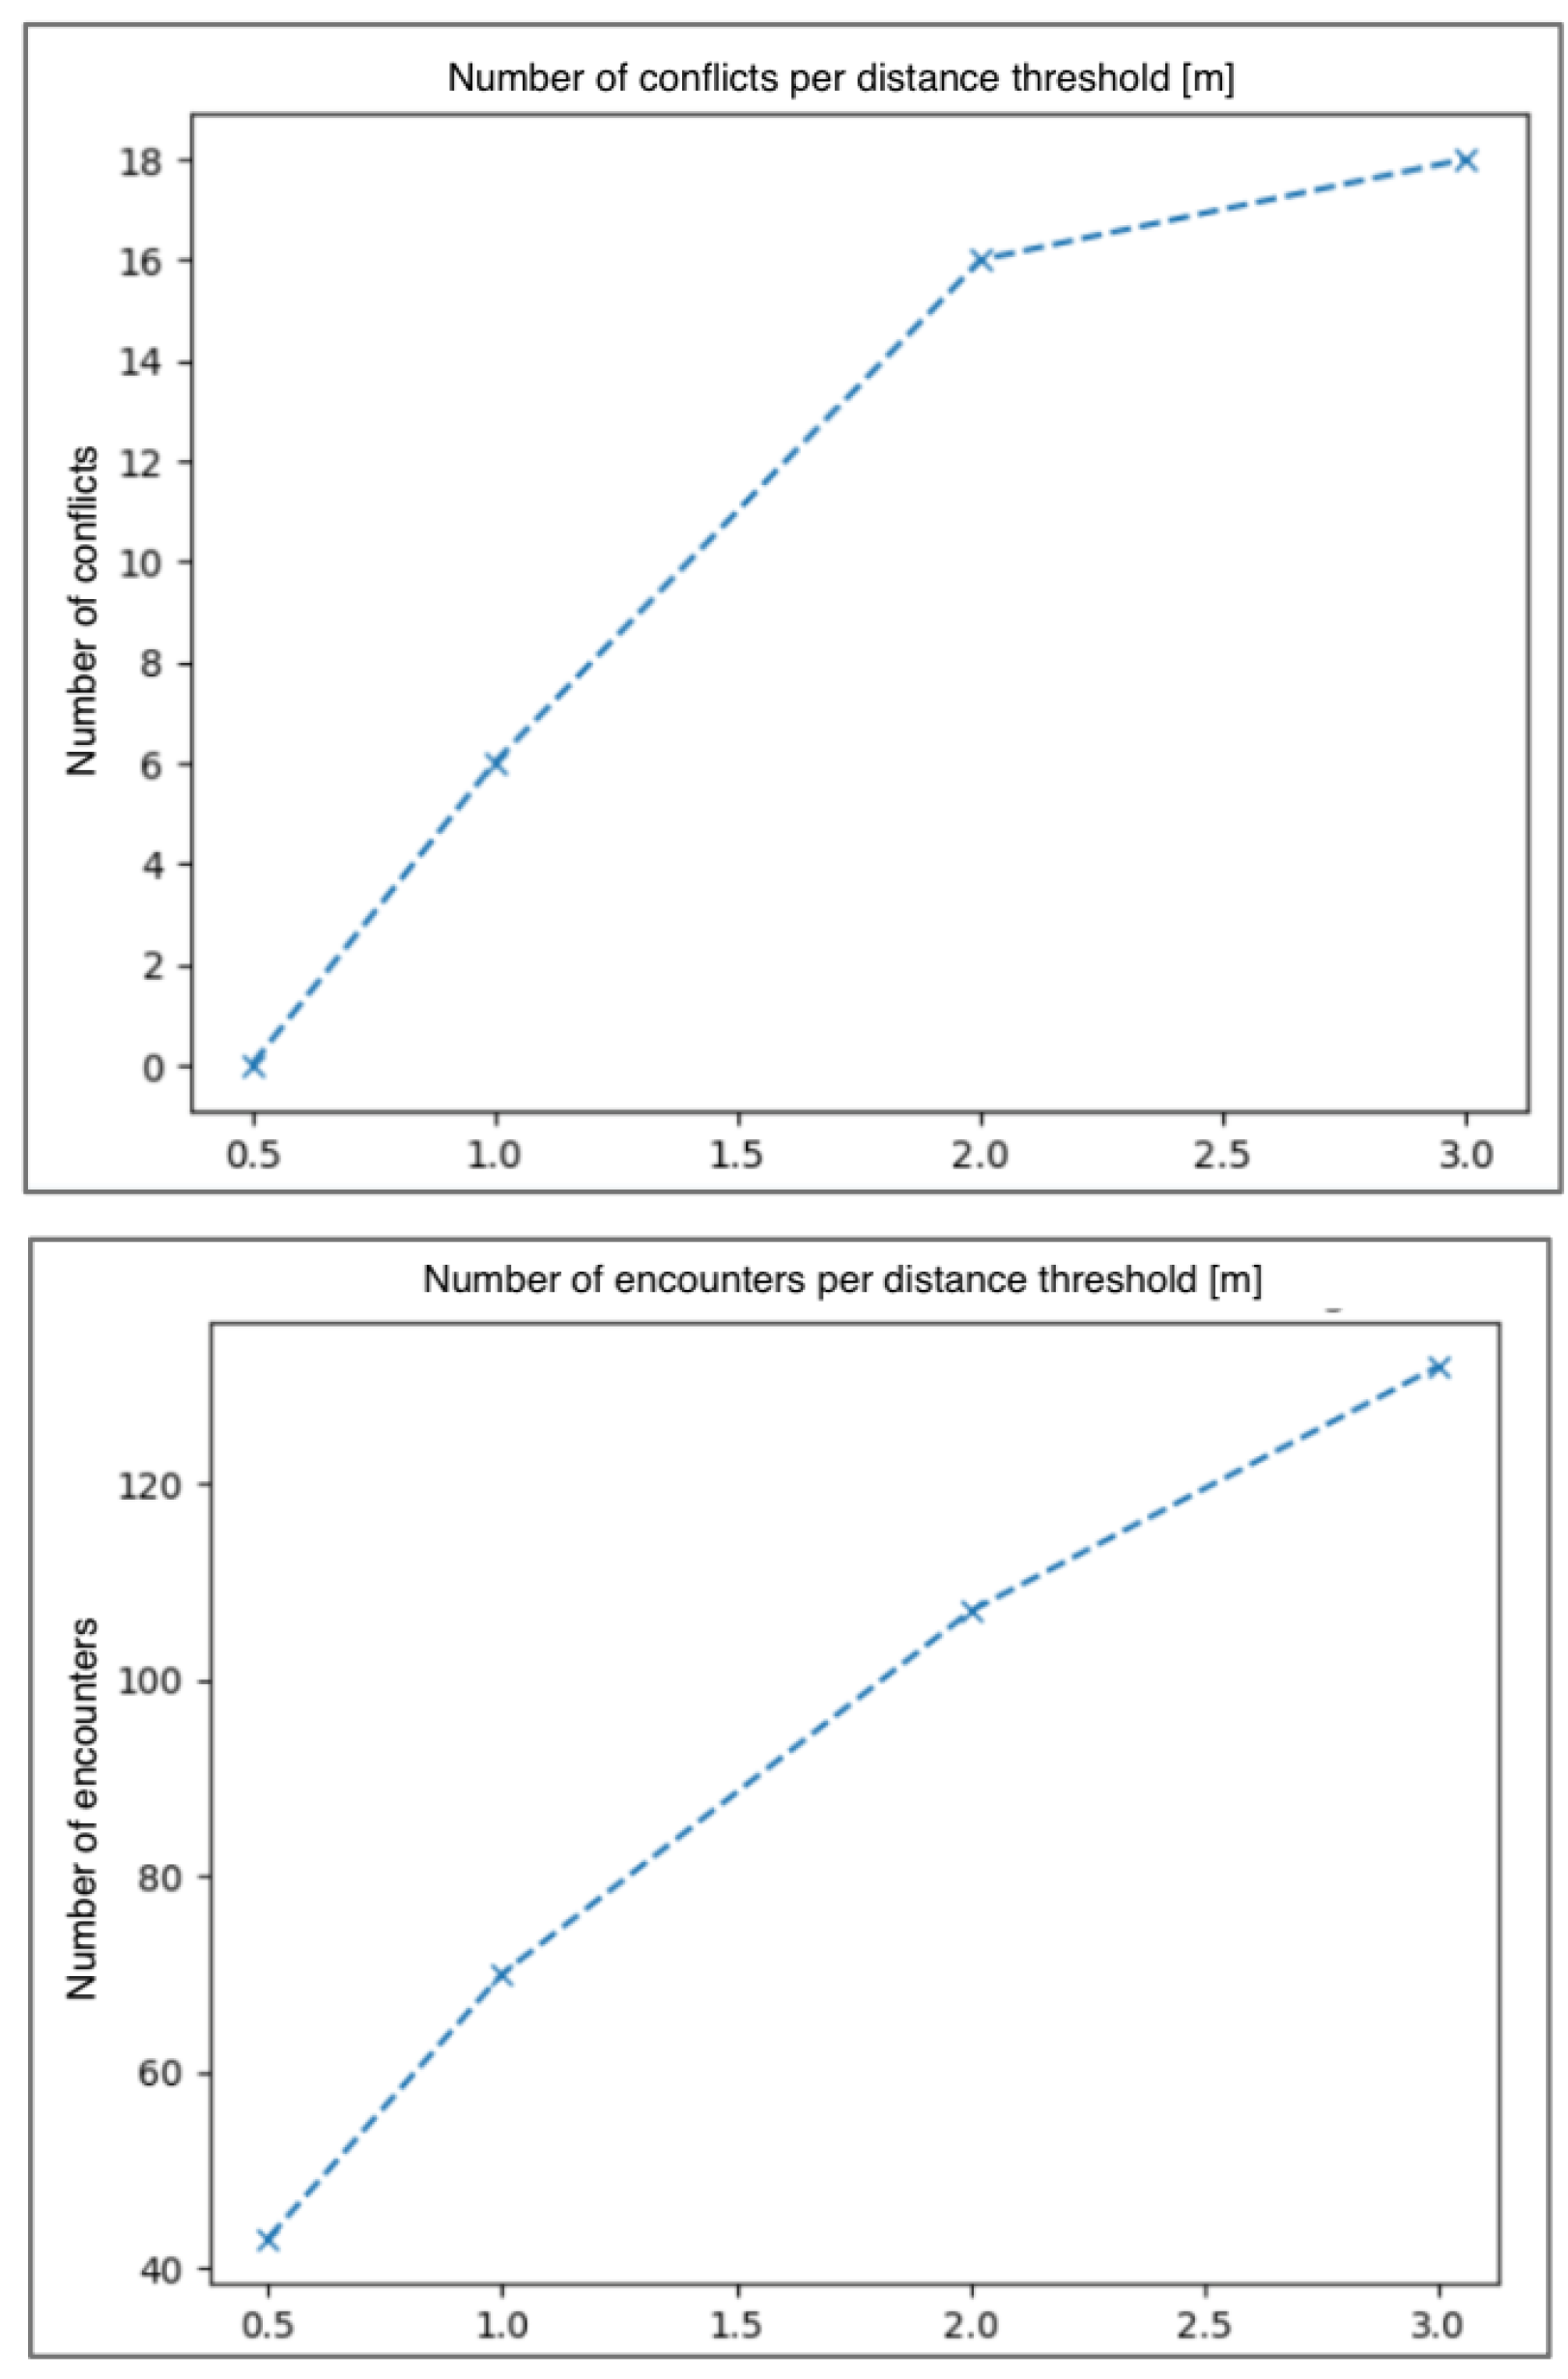
  • Conflict: when the vehicle approaches an obstacle (distance below a certain threshold) and brakes. This condition was tested with distance thresholds of 0.5, 1.0, 2.0, and 3.0 m.
  • Encounter: when the vehicle approaches an obstacle (distance below a certain threshold) but does not brake. This condition was also tested with distance thresholds of 0.5, 1.0, 2.0, and 3.0 m.
Before analyzing episodes of conflict or encounter, the project focused on an exploratory analysis of the sampled data throughout the experiments. Figure 32 represents the number of encounters (count per unique individual/vehicle using tracking analysis), segmented by street and type of road. As shown in the graphs, the highest number of encounters occurred with pedestrians, and the most crowded areas were Lugano Train Station and Via Nassa. It is observed that in areas where the vehicle encounters fewer obstacles, the movement speed is higher, and the time spent traveling in those areas is reduced. However, the measured correlation between the number of people encountered and the average speed is very low and negative (correlation = 0.21). This numerical result is influenced by situations where the device had to stop due to the presence of a red pedestrian traffic light.
A similar analysis was conducted by segmenting by street, as shown in Figure 33. The figure accurately represents the measured city environment. For example, as illustrated in the graphs, the highest number of encounters occurred with pedestrians, with the most crowded areas being Lugano Train Station (Stazione SBB Lugano) and Via Nassa. At the Lugano Train Station, the device remained in the area for an extended period while covering only a short distance at a very low average speed. This was due to its movement on the crowded train platform, where it had to navigate within a confined space while waiting for the train’s arrival. In contrast, at Via Nassa, a pedestrian street in the city center, the device encountered a high number of pedestrians but was able to cover a greater distance in a shorter time compared to the train station. While still requiring a reduced speed due to pedestrian presence, the street was less congested than the train platform, allowing for more fluid movement. In this case, the linear correlation between the number of people encountered in a specific area (street) and the time spent is positive and significant (correlation = 0.61 ). Meanwhile, the correlation between the number of people encountered and the average speed is again negative but not significant (correlation = −0.21).
The analysis conducted and presented above allows us to classify the traveled areas as shown in Figure 34.
In Figure 35, the blue paths represent routes traveled in non-crowded areas (with an average speed of 4.13 km/h), while the red paths indicate crowded areas (with an average speed of 1.47 km/h). The dashed line represents the section traveled by train.
The analyses presented above refer to the concept of encounter, as defined in the introductory section of this paragraph. However, the analysis was further extended by also focusing on the concept of conflict. The number of conflicts that occurred during the execution of the urban test was calculated. Figure 36 represents the occurrences of conflicts and encounters, varying according to the predefined distance threshold. In general, the vehicle never approached any obstacle within 1 m in situations that required a change in driving mode (braking). Even when moving through crowded areas, the device came very close to obstacles (even below 0.5 m) without generating hazardous situations or discomfort in the traveled area. The number of detected conflict events is limited and does not allow a clustering procedure or a causal analysis.
Most of the conflicts occur in public spaces such as parks, stations, and university entrances. On the other hand, encounters mainly take place along roads and pedestrian crossings. The map shown in Figure 37 visualizes the locations of these conflicts and encounters, with specific markers indicating where they are concentrated. Conflicts are represented with red circles, and each number represents how many conflicts there were in that area, while encounters are marked with blue circles.

3.3. Data Analysis: Social

The sample size of participants (N = 21) is small, which limits the generalizability of the findings. Despite the quantitative shortage, this study’s qualitative validity remains strong due to the diverse range of participants and the in-depth, mixed-method approach combining surveys, focus groups, and real testing. The sample was recruited on a voluntary basis in two ways: (a) 5 interviews with participants in the Ensemble-IMM Citizenship Laboratory recruited among SUPSI students, post-docs, and researchers who also participated in one of the Genny Zero device tests; (b) 16 interviews collected from participants in the two device tests. The interviewed group is not representative of a specific population of the territory or city (Lugano) but rather qualitatively of various age groups, education levels, and origins. The questionnaires were administered in person, in two stages: pre- and a post-test questionnaires. The former questionnaire aimed to assess a general attitude towards mobility, micromobility, and awareness of devices. So the questionnaire contained questions such as the range and frequency of distances, the means used, justification for that device, awareness of micromobility and devices, etc. The latter questionnaire and focus group aimed to more broadly evaluate urban policy-making related to mobility plans, the usability of means and infrastructures, views on the use of means and micromobility, potential for inclusion and reducing pollution and traffic, the need for framing urban mobility policies, etc.
The results of two pre- and post-test surveys, aggregating responses from 21 participants across the social analysis, were encouraging. More than half of the respondents were in the 19–39 age group. The whole sample generally preferred walking for urban mobility (14/21), had a reasonable understanding of micromobility concepts (13/21), but made little use of micromobility solutions (only 5/21). Reasons for non-use were either unspecified (11/21) or attributed to a lack of available services (9/21). Before the test, despite having received information and seen the device, only 7 out of 21 respondents indicated a high or very high probability of using Genny Zero. However, post-test responses showed a significant shift, with 14 out of 21 respondents expressing a high or very high likelihood of using Genny Zero if available. Feedback, while not detailed here, was overwhelmingly positive, particularly regarding braking, comfort, and safety, often favorably compared to scooters. Subsequent online activities, restricted to participants who completed the full Laboratory cycle, revealed strong support for an innovative device like Genny Zero for short daily trips (e.g., last-mile commuting, errands). However, participants emphasized the importance of affordability, widespread availability across the city, safety, and the existence of well-regulated routes (e.g., obstacle-free cycle lanes). During the above-mentioned Ensemble-IMM Citizenship Laboratory and the device tests, the 21 sample pre- and post-test surveys did not include questions about gender, since the approach was mainly devoted to capturing opinions on policies and urban mobility strategies. One of the test participants had problems of reduced mobility, using a wheelchair for mobility. This person was strongly positive towards the adoption of modern devices such as Genny Zero.
The interviews and focus group discussions, corroborated by the Ensemble-IMM Citizenship Laboratory’s outputs, highlight the multifaceted nature of transportation choices. Various factors influence mobility decisions, ranging from family habits and spatial constraints (such as the necessity to travel long distances for work) to economic availability, family needs, convenience, safety, environmental impact, and individual or social identity. These diverse factors shape mobility choices, yet symbolic, social, political, and identity-driven elements often play a predominant role. For example, the choice of bicycles is based on rational factors or personal histories, but sometimes also reflects an identity decision, linked to environmental consciousness. Conversely, in two interviews, SUVs were identified as symbolic and identity-driven mobility devices, perceived as a contrast to bicycles.
These reflections set the stage for analyzing and envisioning the future of micromobility. While it is generally considered a viable alternative to current mobility systems, concerns about urban infrastructure and road safety persist. Participants expressed apprehension about navigating traffic: one person noted how being surrounded by cars creates unease, while another questioned where micromobility users should travel: on sidewalks, bike lanes, or the road? Safety concerns and the lack of appropriate infrastructure frequently emerged, alongside social considerations such as the need to accommodate family transport. Some respondents acknowledged that, for practical reasons, cars remain the most convenient option, particularly for transporting elderly relatives or children.
Despite these concerns, there is significant interest in expanding micromobility systems. Many participants associated micromobility with improved physical well-being and urban quality of life. Some emphasized that adopting less polluting transport methods and redefining public space is essential, particularly in light of climate change and evolving, modern participatory perceptions of urban life. However, generational differences emerged regarding the urgency of transformation. Younger participants, citing the drastic changes experienced during the COVID-19 lockdown, stressed the need for immediate measures to reduce ecological impact and redesign public spaces responding to future visions, rather than catering to current political lobbies or needs that in the next few years will not be relevant. Older generations, in contrast, expressed concerns about economic feasibility and compatibility with existing commercial activities and daily routines. Three participants advocated for gradual change that balances diverse interests, emphasizing the role of technology in accelerating the transition. Generational perspectives were thus distinct on this issue.
Despite these differences, consensus emerged on policies that could encourage micromobility. These include lowering speed limits, implementing public awareness campaigns, expanding restricted traffic zones, introducing financial incentives, and expanding participation and transparency in policy-making. Some interviewees stated that micromobility is indispensable for making cities more livable. One respondent emphasized their preference for public transportation and walking to minimize their individual carbon footprint. However, another participant pointed out that Lugano still has a long way to go in this regard, noting the scarcity of bike lanes, as well as green and public spaces, which are often reserved for luxury tourism or aesthetic considerations, limiting their broader usability.
Some participants critiqued local strategies, arguing that merely eliminating parking spaces without providing viable alternatives discourages car use inefficiently. Some respondents highlighted how public space allocation is dictated by lobbying interests, making it difficult to advocate for alternative approaches. Others emphasized the importance of infrastructure for micromobility, asserting that having designated spaces is crucial. The need for functional bike lanes, not just for leisure but for daily commuting, was stressed. The inadequacy of Lugano’s cycling infrastructure was a recurring concern. Participants pointed out that a lack of sufficient bike lanes impedes micromobility adoption. Some suggested that micromobility should be encouraged for last-mile transport solutions but noted that the necessary infrastructure, such as safe cycling routes, as well as green and semi-pedestrian areas, is still lacking. Specific proposals included creating a dedicated bike route connecting the train station to the city center. While there is recognition that long-term planning is required to improve infrastructure, many participants expressed skepticism about the political willingness to make these changes due to vested interests resistant to altering the status quo. One person cited recent urban projects as examples of this reluctance, pointing out the absence of public spaces, green areas, and bike lanes in new developments.
Many interviewees argued that Lugano should actively promote micromobility by increasing peripheral park-and-ride facilities and adopting a more ambitious transportation masterplan capable of challenging entrenched lobbying interests. Suggestions included permanently closing specific streets to car traffic and prioritizing pedestrian-friendly urban design. One participant noted that recent initiatives have primarily eliminated free public parking while expanding paid parking options, ultimately maintaining car dominance.
Interviewees expressed a widespread awareness of the urban implications of micromobility. Genny Zero was mentioned as a potential catalyst for public space innovation. A semi-pedestrianized city center, similar to those in Bern, Basel, or Zurich, was envisioned as a desirable goal. Some respondents suggested that micromobility solutions could be integrated into multimodal/exchange transport systems alongside bicycles and electric scooters. However, concerns arose regarding competition with public transportation and potential conflicts with pedestrian and cycling traffic. The discussion emphasized the need for comprehensive investment in infrastructure and accessibility measures to support diverse transport options.
A central theme was the necessity of public participation in urban policy-making. One interviewee underscored the need for inclusive decision-making processes concerning public spaces, criticizing their privatization and reduction. Some proposed mechanisms to ensure public spaces serve diverse needs rather than being subjected to commercial interests.
Sustainability was another focal point. Participants widely supported discouraging car use in cities and suggested various strategies, including economic incentives, rescheduling urban activities, and adapting micromobility options to individual needs. Public awareness campaigns and safety training programs were proposed to facilitate micromobility adoption. Some participants even suggested implementing a licensing system for micromobility users, though opinions diverged on whether stringent regulations might hinder widespread adoption.
There was consensus on the need for park-and-ride facilities where users could leave their cars out of city center and access multiple transport options, such as bicycles, scooters, or Genny Zero vehicles. Some suggested that certain areas should be entirely restricted to car access, while others proposed residential zones with strict speed limits. One participant noted that contemporary society, along with the consolidated vision of the city, is conditioned to view cars as essential, but widespread adoption of micromobility solutions could fundamentally alter future perceptions of urban transport and the entire conception of urban spaces.
Divergent views emerged on the pace of transition. While most agreed on reducing motorized traffic, some emphasized protecting economic activities, while others argued that the COVID-19 lockdown demonstrated society’s ability to adapt rapidly to new mobility patterns. Participants stressed the importance of long-term urban planning (5–10 years) to support behavioral shifts through infrastructure investments.
The survey captured nuanced perspectives on micromobility, reflecting generational, social, and practical considerations. This rich, contextual insight supports a deeper understanding of user perceptions and urban mobility challenges beyond statistical representation. Four key themes remain central to the debate: citizen participation in public policy and urban space management; sustainability; the relationship between business/industry and public administration; and the interplay between human and goods mobility.
Addressing these social and political issues will be crucial in shaping a turning point toward a vision of the city as more a inclusive, sustainable, and livable urban future. Rethinking urban spaces as multifunctional environments that foster social inclusion and exchange seems essential. Encouraging community engagement in the planning process can reinforce collective responsibility for urban development [31]. Digital platforms could be leveraged to facilitate participatory governance and real-time feedback from citizens. Education and public discourse on sustainable urbanism must be promoted to foster a shared vision of mobility and livability. Policies could be crafted to ensure economic and social equity in access to new transportation systems, with micromobility being a component. Finally, a long-term urban identity that embraces adaptability, resilience, and innovation should be cultivated to shape the future of modern urban citizenship [32].

4. Discussion

The findings of the Inclusive MicroMob project provide a multifaceted perspective on the integration of new micromobility solutions in urban environments. The Swiss case studies, particularly that of Lugano, highlight both the opportunities and challenges associated with the adoption of inclusive micromobility solutions such as the Genny Zero device. By analyzing current regulatory frameworks, the state of urban contexts, and user perceptions, this study contributes to a broader understanding of how these technologies can enhance urban accessibility and sustainability.
From an urban planning perspective, this study confirms that the integration of micromobility solutions within existing mobility networks requires careful consideration of spatial, functional, and regulatory aspects. Regarding public space, the introduction of new micromobility solutions has implications for urban planning, management, and maintenance. If the adoption of devices like Genny Zero aligns with recent rapid shifts in urban mobility trends, it will be necessary to reassess the allocation of public space dedicated to slowing mobility. This shift would also have significant consequences for the management and maintenance of urban centers. A well-developed cycling infrastructure, expanded pedestrian areas, and appropriate communication strategies could stimulate demand in urban centers such as Lugano, as analyzed in the project. Functionally, micromobility serves as an alternative to public transport or last-mile travel, particularly in areas with moderate topographical constraints. While steep road gradients may pose accessibility challenges, the compact size and technical characteristics of the Genny Zero device allow for its integration into the existing transport system. However, to facilitate effective integration, an expansion of charging infrastructure is necessary. The analysis of four Swiss case studies (Chur, Freiburg, Andermatt, and Lugano) revealed a limited and often sparse charging network. Additionally, if Genny Zero were to be implemented as a shared mobility service, the operating model (docked or dockless) must be defined. Assuming integration with the existing bike-sharing system, which primarily operates in a docked mode, appropriate space planning is required to ensure accessibility, inclusivity, and efficient management and maintenance of the service.
Another crucial consideration in micromobility integration is the sustainability of its use throughout the entire life cycle. The comparative life cycle assessment (LCA) of the Genny Zero electric vehicle indicates a low environmental impact, estimated at 45 gCO2eq per passenger-kilometer, assuming a lifespan of 40,000 km [33]. However, this impact is highly dependent on the electricity source, with the Swiss energy mix (predominantly hydro and nuclear) resulting in lower emissions. The sustainability of electric vehicles like Genny Zero also depends on the transport modes they replace; while substituting internal combustion vehicles is beneficial, replacing public transport or walking may lead to higher emissions. Additionally, vehicle longevity is a key factor, as longer lifespans contribute to a reduced overall environmental footprint. The widespread adoption of micromobility could significantly contribute to the reduction in CO2 emissions from road transport, supporting climate goals while alleviating urban congestion and pollution [34].
Nevertheless, the regulatory framework remains a critical determinant of feasibility and implementation. A comparison of Swiss and Ticino regulations suggests that while national policies provide general guidelines, regional adaptations play a decisive role in shaping the practical deployment of micromobility solutions.
From a technological perspective, urban tests provided valuable insights into the performance and adaptability of the Genny Zero device. Data collected through inertial sensors, GPS tracking, and RealSense cameras indicate that the device successfully navigates diverse urban scenarios while ensuring safety and maneuverability. A key concern in the current discourse on micromobility is safety and potential conflicts with other road users. The Inclusive MicroMob project analyzed speed distribution and acceleration patterns, revealing that designated cycling infrastructure enhances the operational efficiency of micromobility devices. Notably, interaction analysis indicated minimal conflicts with other road users, suggesting that with appropriate urban planning, these devices can be effectively integrated into shared mobility environments.
From a social perspective, user feedback underscores the importance of addressing public perceptions and fostering participatory urban governance. Results from the IMM event and the Ensemble-IMM Citizenship Laboratory reveal a combination of enthusiasm and skepticism regarding micromobility adoption. While participants acknowledge the potential benefits of these solutions for sustainable and inclusive urban transport, concerns persist regarding infrastructure readiness, safety, and the role of micromobility within existing mobility hierarchies. Furthermore, generational differences in attitudes suggest that younger users are more receptive to new mobility technologies, whereas older participants emphasize the need for gradual policy shifts that accommodate established commuting behaviors. The Lugano case study highlights the necessity of engaging the public in a collective learning process to explore emerging mobility needs in relation to future micromobility offerings. Participatory processes, such as the Citizenship Laboratory, serve as critical platforms for structuring discussions and investigating user preferences.
Despite these positive findings, several limitations must be acknowledged. First, the tests and the Citizenship Laboratory were conducted in a specific urban context, and while Lugano provides an informative case study, further research in different geographic and regulatory environments is necessary to generalize the results. Additionally, this study primarily focuses on short-term usability and user acceptance; long-term behavioral shifts and the economic feasibility of micromobility integration remain areas for further exploration. Finally, this study highlights the necessity of continued stakeholder engagement, particularly in policy formulation, to ensure that micromobility solutions align with broader urban sustainability objectives.

5. Conclusions

The findings of this study reinforce the notion that achieving inclusive urban mobility requires both technological innovation and an adaptive regulatory framework that considers infrastructural, social, and policy dimensions. The Inclusive MicroMob project demonstrates that micromobility solutions, such as the Genny Zero device, can enhance urban accessibility, particularly when integrated with existing public transport systems and supported by inclusive urban planning strategies.
A key insight from this research is that the successful implementation of innovative mobility solutions depends on collaborative learning processes involving multiple stakeholders. The findings suggest that even the most advanced mobility solutions must be introduced within a structured framework of public awareness, participatory governance, and regulatory support to prevent political and psychological barriers to adoption. Public perception remains a crucial determinant of success; therefore, future micromobility policies should prioritize community engagement and co-design methodologies.
Future research should explore the scalability of micromobility models in diverse urban contexts, assessing long-term behavioral impacts and economic sustainability. Additionally, further work could concentrate in the collection of data not only on different urban contexts but also from different users driving the Genny device: this would allow a deeper behavioral analysis related to Pedestrian Safety. Furthermore, comparative analyses between cities with varying infrastructural readiness and regulatory flexibility could provide additional information on the optimal conditions for the integration of micromobility. Investigating the intersection of micromobility and emerging digital governance tools, such as participatory platforms for urban decision-making, could further enhance the inclusivity of urban transport planning.
In conclusion, creating inclusive cities requires a holistic approach that extends beyond infrastructure and technology; it necessitates active citizen engagement, responsive regulatory frameworks, and a commitment to sustainable and equitable mobility solutions. Micromobility has the potential to redefine urban movement, but its full benefits will only be realized through a collective commitment to fostering adaptable, accessible, and people-centered urban spaces.

Author Contributions

Conceptualization, A.R., M.P., and F.G.; data curation: A.Q. and L.M.; formal analysis, A.R., M.P., F.B., A.Q., L.M., and M.C.; funding acquisition, A.B.; investigation: A.R., M.P., F.B., A.Q., and A.B.; methodology, A.R., M.P., F.B., F.G., and A.B.; project administration, A.B.; software, A.Q., L.M., and M.C.; supervision, A.R., M.P., and L.D.M.; validation, A.R., F.B., and A.B.; visualization, L.D.M., L.M., and M.C.; writing—original draft: A.R., M.P., F.B., and L.D.M.; writing—review and editing, A.R., M.P., F.B., L.D.M., and A.Q. All authors have read and agreed to the published version of the manuscript.

Funding

This research was funded by Federal Office for Spatial Development; the Federal Department of the Environment, Transport, Energy and Communications; and the Section for Mobility and International Affairs.

Informed Consent Statement

Informed consent was obtained from all subjects involved in the study.

Data Availability Statement

Dataset available on request from the authors.

Acknowledgments

We would like to express our heartfelt gratitude to Aurelio Vigani, at the Federal Office for Spatial Development, for his invaluable support and contributions; Elena Marchiori, at Lugano Living Lab, for her invaluable support and expertise; Giovanni Fulgoni, at Genny Factory SA, for his insightful contributions and guidance; Alex Bordini, at Genny Factory SA, for his technical expertise and valuable assistance; Niccolò Cuppini, at the University of Applied Sciences and Arts of Southern Switzerland (SUPSI), for his thoughtful perspectives and valuable input. Their collective efforts and encouragement have been instrumental in shaping the direction and outcomes of this research.

Conflicts of Interest

The authors declare no conflicts of interest. The funders had no role in the design of the study; in the collection, analyses, or interpretation of data; in the writing of the manuscript; or in the decision to publish the results.

References

  1. Gehl, J. Cities for People; Island Press: Washington, DC, USA, 2010. [Google Scholar]
  2. Newman, P.; Kenworthy, J. Sustainability and Cities: Overcoming Automobile Dependence; Island Press: Washington, DC, USA, 1999. [Google Scholar]
  3. United Nations. World Cities Report 2020: The Value of Sustainable Urbanization; World Cities Report; UN Habitat: Nairobi, Kenya, 2020. [Google Scholar]
  4. Lefebvre, H.; Kofman, E.; Lebas, E. Writings on Cities; Wiley: Hoboken, NJ, USA, 1996. [Google Scholar]
  5. Turok, I.; McGranahan, G. Urbanization and economic growth: The arguments and evidence for Africa and Asia. Environ. Urban. 2013, 25, 465–482. [Google Scholar] [CrossRef]
  6. Fainstein, S.S. The Just City; Cornell Paperbacks, Cornell University Press: Ithaca, NY, USA, 2010. [Google Scholar]
  7. Agyeman, J. Sustainable Communities and the Challenge of Environmental Justice; NYU Press: New York, NY, USA, 2005. [Google Scholar]
  8. Shaheen, S.; Cohen, A. Shared Micromobility Policy Toolkit: Docked and Dockless Bike and Scooter Sharing; Technical Report; Institute of Transportation Studies, UC Berkeley: Berkeley, CA, USA, 2019. [Google Scholar]
  9. Banister, D. The sustainable mobility paradigm. Transp. Policy 2008, 15, 73–80. [Google Scholar] [CrossRef]
  10. Olabi, A.; Wilberforce, T.; Obaideen, K.; Sayed, E.T.; Shehata, N.; Alami, A.H.; Abdelkareem, M.A. Micromobility: Progress, benefits, challenges, policy and regulations, energy sources and storage, and its role in achieving sustainable development goals. Int. J. Thermofluids 2023, 17, 100292. [Google Scholar] [CrossRef]
  11. Vizmpa, C.; Botzoris, G.; Lemonakis, P.; Galanis, A. Micromobility in Urban Trail Paths: Expanding and Strengthening the Planning of 15-min Cities. Land 2023, 12, 2181. [Google Scholar] [CrossRef]
  12. Tamagusko, T.; Gomes Correia, M.; Rita, L.; Bostan, T.C.; Peliteiro, M.; Martins, R.; Santos, L.; Ferreira, A. Data-Driven Approach for Urban Micromobility Enhancement through Safety Mapping and Intelligent Route Planning. Smart Cities 2023, 6, 2035–2056. [Google Scholar] [CrossRef]
  13. Nikolaeva, A.; Adey, P.; Cresswell, T.; Lee, J.Y.; Nóvoa, A.; Temenos, C. Commoning mobility: Towards a new politics of mobility transitions. Trans. Inst. Br. Geogr. 2020, 45, 1–18. [Google Scholar] [CrossRef]
  14. Gössling, S. Integrating e-scooters in urban transportation: Problems, policies, and the prospect of system change. Transp. Res. Part D Transp. Environ. 2020, 79, 102230. [Google Scholar] [CrossRef]
  15. Fishman, E. Bikeshare: A review of recent literature. Transp. Rev. 2015, 36, 132–147. [Google Scholar] [CrossRef]
  16. Nuvolati, G. Mobilità Urbana: Complessità Fisiche e Culturali; Firenze University Press: Florence, Italy, 2007. [Google Scholar]
  17. Di Fazio, C.; Paradiso, M. Mobilità urbane emergenti: Valutazione critica della micromobilità di bici e monopattini tra individualità, pubblico e privato. Doc. Geogr. 2023, 2, 515–532. [Google Scholar]
  18. Treccani Istituto della Enciclopedia Italiana. Definition of Micromobility; Treccani Istituto della Enciclopedia Italiana: Rome, Italy, 2020. [Google Scholar]
  19. Oeschger, G.; Caruso, G.; Gauvin, C. Parameters and Policies for Micromobility Devices; Forum Internazionale dei Trasporti: Rome, Italy, 2020. [Google Scholar]
  20. Rossato, S. Human-Powered and Electric-Assisted Micromobility: Challenges and Opportunities. Master’s Thesis, University of Padua, Padova, Italy, 2021. [Google Scholar]
  21. Becker, H.; Ciari, F.; Axhausen, K.W. Comparing car-sharing and ride-sourcing services: A case study in Switzerland. Transp. Res. Part A Policy Pract. 2020, 131, 54–70. [Google Scholar]
  22. Meng, S.; Brown, A.; Klein, N.; Thigpen, C.; Haydu, B.; Stout, N. Shared Scooter Parking: The Role of Parking Density and Land Use in Compliance and Demand; University of Oregon: Eugene, OR, USA, 2024. [Google Scholar]
  23. United Nations Development Programme. Urban Mobility and Regulatory Frameworks for Micromobility; United Nations Development Programme: New York, NY, USA, 2021. [Google Scholar]
  24. OETV. Ordinanza Concernente le Esigenze Tecniche per i Veicoli; Swiss Federal Council: Bern, Switzerland, 1995. [Google Scholar]
  25. OAC. Ordinanza Sull’ammissione Alla Circolazione di Persone e Veicoli; Swiss Federal Council: Bern, Switzerland, 1976. [Google Scholar]
  26. ONC. Ordinanza Sulle Norme Della Circolazione Stradale; Swiss Federal Council: Bern, Switzerland, 1962. [Google Scholar]
  27. Touring Club Switzerland. Technical and Regulatory Requirements for Micromobility Devices in Switzerland. Available online: https://www.tcs.ch/it/ (accessed on 20 March 2025).
  28. Ticino Cantonal Regulations. (n.d.) Normative Cantonali per la Regolamentazione Della Micromobilità. Canton of Ticino. Available online: https://www4.ti.ch/di/strade-sicure/mobilita-lenta/mobilita-pedonale (accessed on 20 March 2025).
  29. Pearson, K. Note on regression and inheritance in the case of two parents. Proc. R. Soc. Lond. 1895, 58, 240–242. [Google Scholar]
  30. Chen, T.; Guestrin, C. XGBoost: A scalable tree boosting system. In Proceedings of the 22nd ACM SIGKDD International Conference on Knowledge Discovery and Data Mining, KDD’16, New York, NY, USA, 13–17 August 2016; pp. 785–794. [Google Scholar]
  31. Lemanski, C. Citizenship and Infrastructure: Practices and Identities of Citizens and the State; Routledge Studies in Urbanism and the City; Routledge: Oxfordshire, UK, 2019. [Google Scholar]
  32. Bignami, F.; Hanakata, N. Platform urbanisation, infrastructures and techno-politics: The turn towards urban citizenship. J. Eur. Stud. 2024, 54, 42–58. [Google Scholar] [CrossRef]
  33. Reck, D.J.; Martin, H.; Axhausen, K.W. Mode choice, substitution patterns and environmental impacts of shared and personal micro-mobility. Transp. Res. Part D Transp. Environ. 2022, 102, 103134. [Google Scholar] [CrossRef]
  34. de Bortoli, A. Environmental performance of shared micromobility and personal alternatives using integrated modal LCA. Transp. Res. Part D Transp. Environ. 2021, 93, 102743. [Google Scholar] [CrossRef]
Figure 1. The strategy and the key elements developed throughout the project.
Smartcities 08 00069 g001
Figure 2. Genny Zero. © Genny Factory SA, Switzerland.
Smartcities 08 00069 g002
Figure 3. Speed (left) and forward acceleration (right) distribution per area: numerical report.
Smartcities 08 00069 g003
Figure 4. Feature correlation for the most relevant features.
Smartcities 08 00069 g004
Figure 5. Prediction of speed and acceleration modeled via non-linear regression.
Smartcities 08 00069 g005
Figure 6. Variable distribution bar plots.
Smartcities 08 00069 g006
Figure 7. On the (left), the RGB image with YOLO-detected bounding boxes; on the (right), the depth map where the same bounding boxes were applied, leveraging the alignment between the two modalities.
Smartcities 08 00069 g007
Figure 8. Legend of the symbols and layers used in the maps.
Smartcities 08 00069 g008
Figure 9. Slopes greater than 11.3° and roads not passable in the city of Chur.
Smartcities 08 00069 g009
Figure 10. Parkings, public transports, and train station in the city of Chur.
Smartcities 08 00069 g010
Figure 11. Slopes greater than 11.3° and roads not passable in the city of Freiburg.
Smartcities 08 00069 g011
Figure 12. Parkings, public transports, and train station in the city of Freiburg.
Smartcities 08 00069 g012
Figure 13. Bike-sharing service in the city of Andermatt.
Smartcities 08 00069 g013
Figure 14. Charging stations in the city of Andermatt.
Smartcities 08 00069 g014
Figure 15. Slopes greater than 11.3° and roads not passable in the city of Lugano.
Smartcities 08 00069 g015
Figure 16. Parkings, public transports, and train station in the city of Lugano.
Smartcities 08 00069 g016
Figure 17. Bike-sharing service in the city of Lugano.
Smartcities 08 00069 g017
Figure 18. Charging stations in the city of Lugano.
Smartcities 08 00069 g018
Figure 19. Potential demand in Lugano.
Smartcities 08 00069 g019
Figure 20. Potential demand, parkings, public transports, and bike sharing around Lugano’s railway station.
Smartcities 08 00069 g020
Figure 21. Parkings, public transports, and bike sharing around Lugano’s railway station.
Smartcities 08 00069 g021
Figure 22. Sensor installation on Genny Zero.
Smartcities 08 00069 g022
Figure 23. Experiment in Lugano: path overview.
Smartcities 08 00069 g023
Figure 24. Value distribution for machine, inertial, and GPS data.
Smartcities 08 00069 g024
Figure 25. Speed distribution per traveled segment.
Smartcities 08 00069 g025
Figure 26. Speed and acceleration of the device as a function of the traveled street.
Smartcities 08 00069 g026
Figure 27. Speed and acceleration distribution of measured values per location category.
Smartcities 08 00069 g027
Figure 28. Prediction error distribution for vehicle speed and acceleration.
Smartcities 08 00069 g028
Figure 29. Impact of features on speed and acceleration.
Smartcities 08 00069 g029
Figure 30. Processing pipeline of video data sampled by Intel RealSense cameras.
Smartcities 08 00069 g030
Figure 31. On the (left), an example of an Object Identification Bounding Box is shown, while on the (right), the distribution of object distances in meters is represented.
Smartcities 08 00069 g031
Figure 32. Number of encounters by road type. y-axis: number of people encounters (left, bars), time spent in the visited area, and distance traveled in km (right, lines).
Smartcities 08 00069 g032
Figure 33. Number of encounters by street and road type.
Smartcities 08 00069 g033
Figure 34. Classification of traveled areas based on proximity analysis.
Smartcities 08 00069 g034
Figure 35. Path in crowded area (red) and non-crowded area (blue).
Smartcities 08 00069 g035
Figure 36. Number of conflicts (top) and encounters (bottom) based on varying distance thresholds (measured in meters).
Smartcities 08 00069 g036
Figure 37. Map of conflicts where the distance of the object is less than one meter, requiring braking.
Smartcities 08 00069 g037
Disclaimer/Publisher’s Note: The statements, opinions and data contained in all publications are solely those of the individual author(s) and contributor(s) and not of MDPI and/or the editor(s). MDPI and/or the editor(s) disclaim responsibility for any injury to people or property resulting from any ideas, methods, instructions or products referred to in the content.

