Article

Prediction of Potassium in Peach Leaves Using Hyperspectral Imaging and Multivariate Analysis

1
Department of Agricultural Sciences, Clemson University, 240 McAdams Hall, Clemson, SC 29634, USA
2
Department of Plant and Environmental Sciences, Clemson University, 171 Poole Agricultural Center, Clemson, SC 29634, USA
*
Author to whom correspondence should be addressed.
AgriEngineering 2022, 4(2), 400-413; https://doi.org/10.3390/agriengineering4020027
Submission received: 15 March 2022 / Revised: 18 April 2022 / Accepted: 18 April 2022 / Published: 21 April 2022
(This article belongs to the Special Issue Hyperspectral Imaging Technique in Agriculture)

Abstract

:
Hyperspectral imaging (HSI) is an emerging technology being utilized in agriculture. This system could be used to monitor the overall health of plants or in pest/disease detection. As sensing technology advancement expands, measuring nutrient levels and disease detection also progresses. This study aimed to predict three different levels of potassium (K) concentration in peach leaves using principal component analysis (PCA) and develop models for predicting the K concentration of a peach leaf using a hyperspectral imaging technique. Hyperspectral images were acquired from a randomly selected fresh peach leaf from multiple trees over the spectral region between 500 and 900 nm. Leaves were collected from trees with varying potassium levels of high (2.7~3.2%), medium (2.0~2.6%), and low (1.3~1.9%). Four pretreatment methods (multiplicative scatter effect (MSC), Savitzky–Golay first derivative, Savitzky–Golay second derivative, and standard normal variate (SNV)) were applied to the raw data and partial least square (PLS) was used to develop a model for each of the pretreatments. The R2 values for each pretreatment method were 0.8099, 0.6723, 0.5586, and 0.8446, respectively. The SNV prediction model has the highest accuracy and was used to predict the K nutrient using the validation data. The result showed a slightly lower R2 = 0.8101 compared with the training. This study showed that HSI could measure K concentration in peach tree cultivars.

1. Introduction

Potassium (K) is an essential nutrient needed by plants in regulating photosynthesis [1,2]. K is often necessary to move water and other essential nutrients in plant tissue. It is an essential nutrient in crop development and yields [2,3,4]. Several studies have been conducted to determine the impact, or effect, of potassium in certain crops all over the world [3,4,5,6]. It is used as an important element in fertilizers. Common examples of potassium fertilizers used in agriculture are potassium chloride (KCl), potassium sulfate (K2SO4), and mono-potassium phosphate (KH2PO4). The application of fertilizers in fruit crops is to achieve the desired results of high yield and quality. Moreover, K as a primary nutrient also has an important effect on the yield and quality of the fruits [7].
Spectroscopy has been used as a tool for the rapid assessment of different nutrients in different crops. Zhai et al. [8] used visible and near-infrared reflectance to estimate N, P, and K concentrations in the leaves of other plants. They used both a support vector machine (SVM) and partial least square (PLS) regression to estimate the nutrients and found that the SVM produced better estimation. Rotbart et al. [9] used reflectance to estimate the nitrogen content of the various state of olive leaves (ground, fresh ground, and intact) with PLS. Their results showed that the ground, dried leaves improved the model performance with an R2 of 0.91. Other related spectroscopy studies [10,11,12,13,14] used leaves in predicting crop nutrients. Siedliska et al. [15] work in identifying plant leaf phosphorus (P) concentration on three crops: celery, sugar beet, and strawberry. Although the group applied controlled doses of phosphorous, they were able to detect P using hyperspectral imaging combined with artificial intelligence. Kamruzzaman et al. [16] used HSI in combination with multivariate analysis in predicting quality attributes of lamb meat. The hyperspectral images were acquired using a spectrograph with push-broom technology. They used color, pH, and drip loss of the meat as the quality attributes to be predicted and found a reasonable prediction performance with R2 = 0.91 for color, R2 = 0.77 for drip loss, and R2 = 0.65 for pH. Zhang et al. [17] used HSI in predicting three nutrients, N, P, and K, in oilseed rape leaves. PLS and least square support vector machines (LS-SVM) were used to correlate the nutrient concentration to the spectral data of the leaf samples. Their results showed that, using HSI with PLS and LS-SVM, reasonable accuracy for nutrient concentration prediction can be obtained with an R2 = 0.882 for N, R2 = 0.710 for P, and R2 = 0.746 for K.
Hyperspectral imaging (HSI) is a popular method used not only in precision agriculture but also in medical applications, by creating a diagnosis from disease detection and image-guided surgery [18], and military and security applications, by using sensing technology to address defense challenges in the 21st century [19]. Remote sensing is used in early disease detection in precision agriculture, where changes in the spectral reflectance indicate the physiological stress of crops [20,21]. This can reduce the impact that the disease has caused and provide adaptable and proper intervention. The HSI system contains hundreds of bands per pixel, depending on the camera configuration in a spectral domain. Most recently, applying the HSI system in different studies has been increasing. A similar objective of detecting and identifying targets can be found in military and civilian use. Moreover, detection of different interests using HSI can also be found in plants, soil, and food (meat) [22,23,24,25,26,27]. Over time, the approach to the HSI system has been more advanced and is improving, which allows for a fast, efficient, and effective way of gathering data in precision agriculture. The most recent advanced HSI system used a frame-based approach that minimized the time to acquire spectral images, and this is a huge advantage compared with push-broom technology.
Agriculture and food sectors play a huge role in the overall contribution to the economy, and crops such as peaches, the top commodity in the state of California, South Carolina, and Georgia, require technology that is non-invasive, accurate, efficient, effective, and allows for the rapid detection of nutrients or diseases. This will help farmers address issues timely, thereby, minimizing crop yield losses. Currently, farmers use plant tissue analysis to determine the nutrient of their crops. This analysis involves washing the samples, oven drying them at certain levels, and grinding them into a fine powder, which is time consuming and costly if done regularly.
This paper focuses on predicting the nutrient concentration of a peach leaf using a hyperspectral camera and multivariate analysis. In this study, two approaches were developed in predicting the K nutrient in peach leaves: principal component analysis and partial least square regression.

Hyperspectral Imaging vs. Digital Color Imaging

Hyperspectral images capture hundreds of bands, in a broad spectrum, from ultraviolet to long-wave infrared (LWIR). Hyperspectral images contain higher spectral information than digital color images, where only three bands/colors are present [28]. Hyperspectral cameras produce massive datasets, often referred to as a “hypercube”. It used to be a challenge to process and analyze the data due to its size, but with the recent advancement in computing and storage, it has now been used widely for quality inspection, etc.

2. Materials and Methods

2.1. Field Data Collection

The study was conducted at the Clemson University Musser Fruit Research Farm (Seneca, SC, USA, 34.61 N, 82.87 W) during the months of September to October of 2020~2021. Three rows with three trees each were selected for this study. Young, full-sized leaves with petioles attached were picked for the trees with high and medium K concentration (45 leaves) and 50 leaves were picked for the peach trees with low K concentration due to their size. The plots for high, medium, and low K concentration were designated by the center research staff working on the same plot. Figure 1 shows how the samples were collected during data collection. The leaves were collected from the midpoint, near the base of each tree. The collected leaves were bagged for the three potassium levels. Fifteen leaves, each, were placed in the sample bags for the high and medium K trees, and seventeen leaves, each, for the low K trees. The mature leaf samples were collected from the midportion or near the base of the trees’ current season’s terminal growth. The samples were then placed in one big paper bag and brought to the Clemson Agricultural Service Laboratory to run a plant tissue analysis on the nutrient concentration. The bag label and K nutrient concentration for each tree are shown in Table 1.

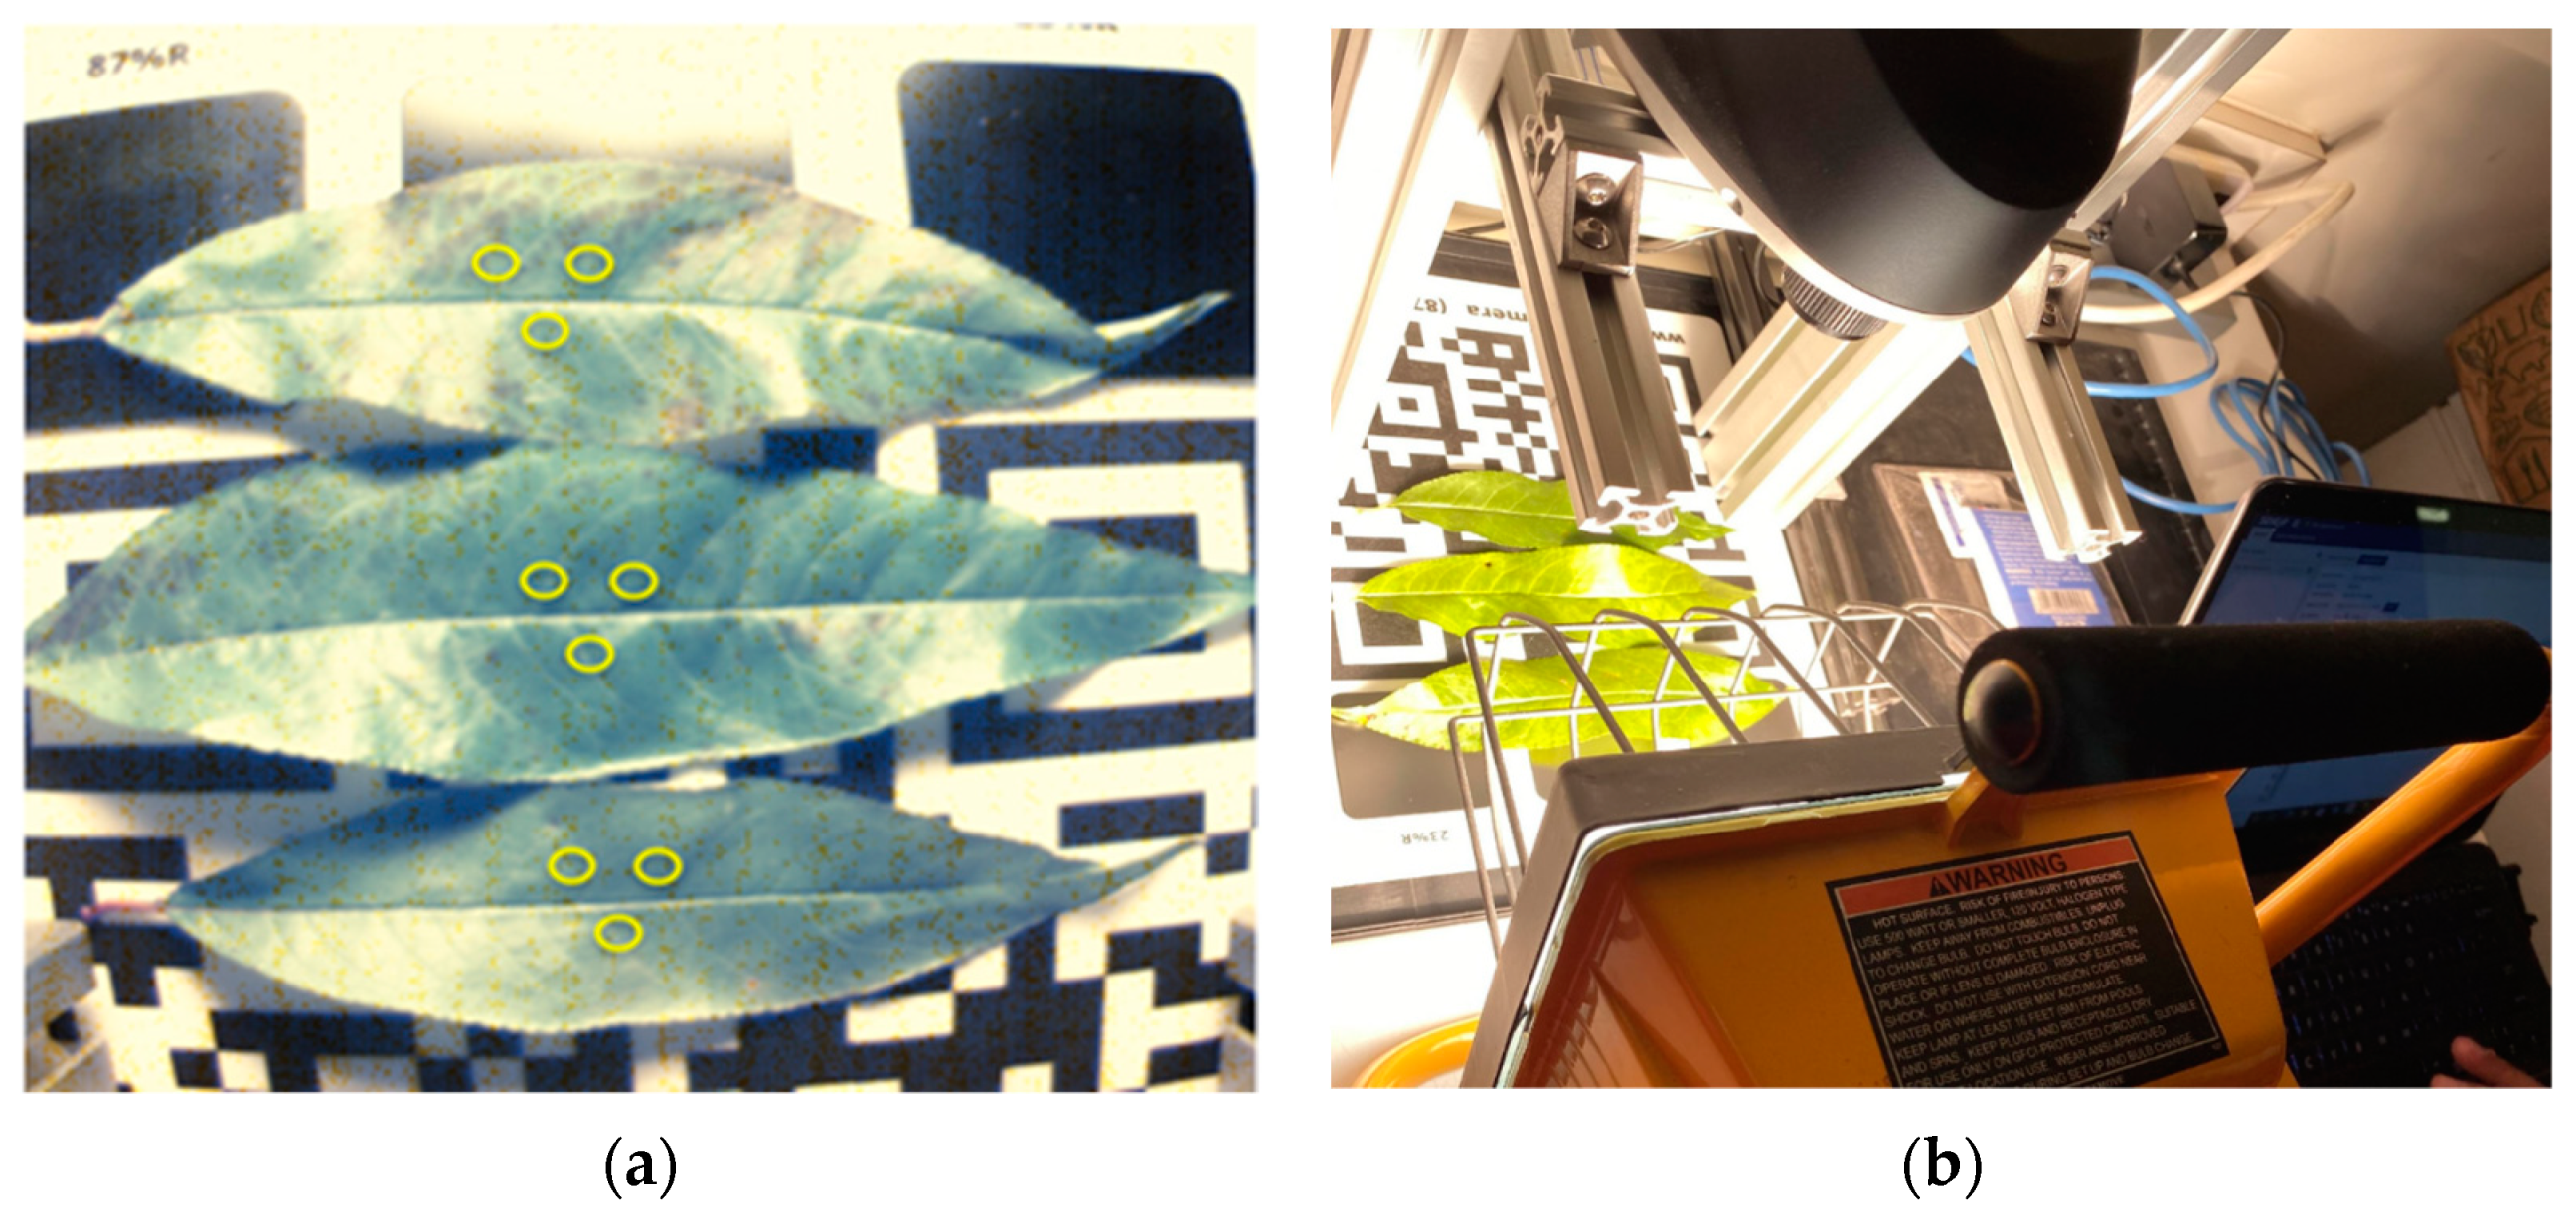
2.2. The Imaging System

A portable hyperspectral camera (HSC-2, Senop, Helsinki, FI) was used to measure the spectral reflectance of leaves from 500 to 900 nm (0.1 nm interval). The camera can be used as a stand-alone camera or connected to a personal computer for indoor use. The main advantages of the camera are its weight (lightweight), which can easily be mounted to a small unmanned aerial system (sUAS), high resolution, true image pixels (no interpolation), and multiple available connections for easy interface. The camera comes with its software, Senop HSC-2, where the user can visualize the data collected, create a script to capture data, and control the camera. Table 2 shows the detailed description of the hyperspectral imaging system used in this study.

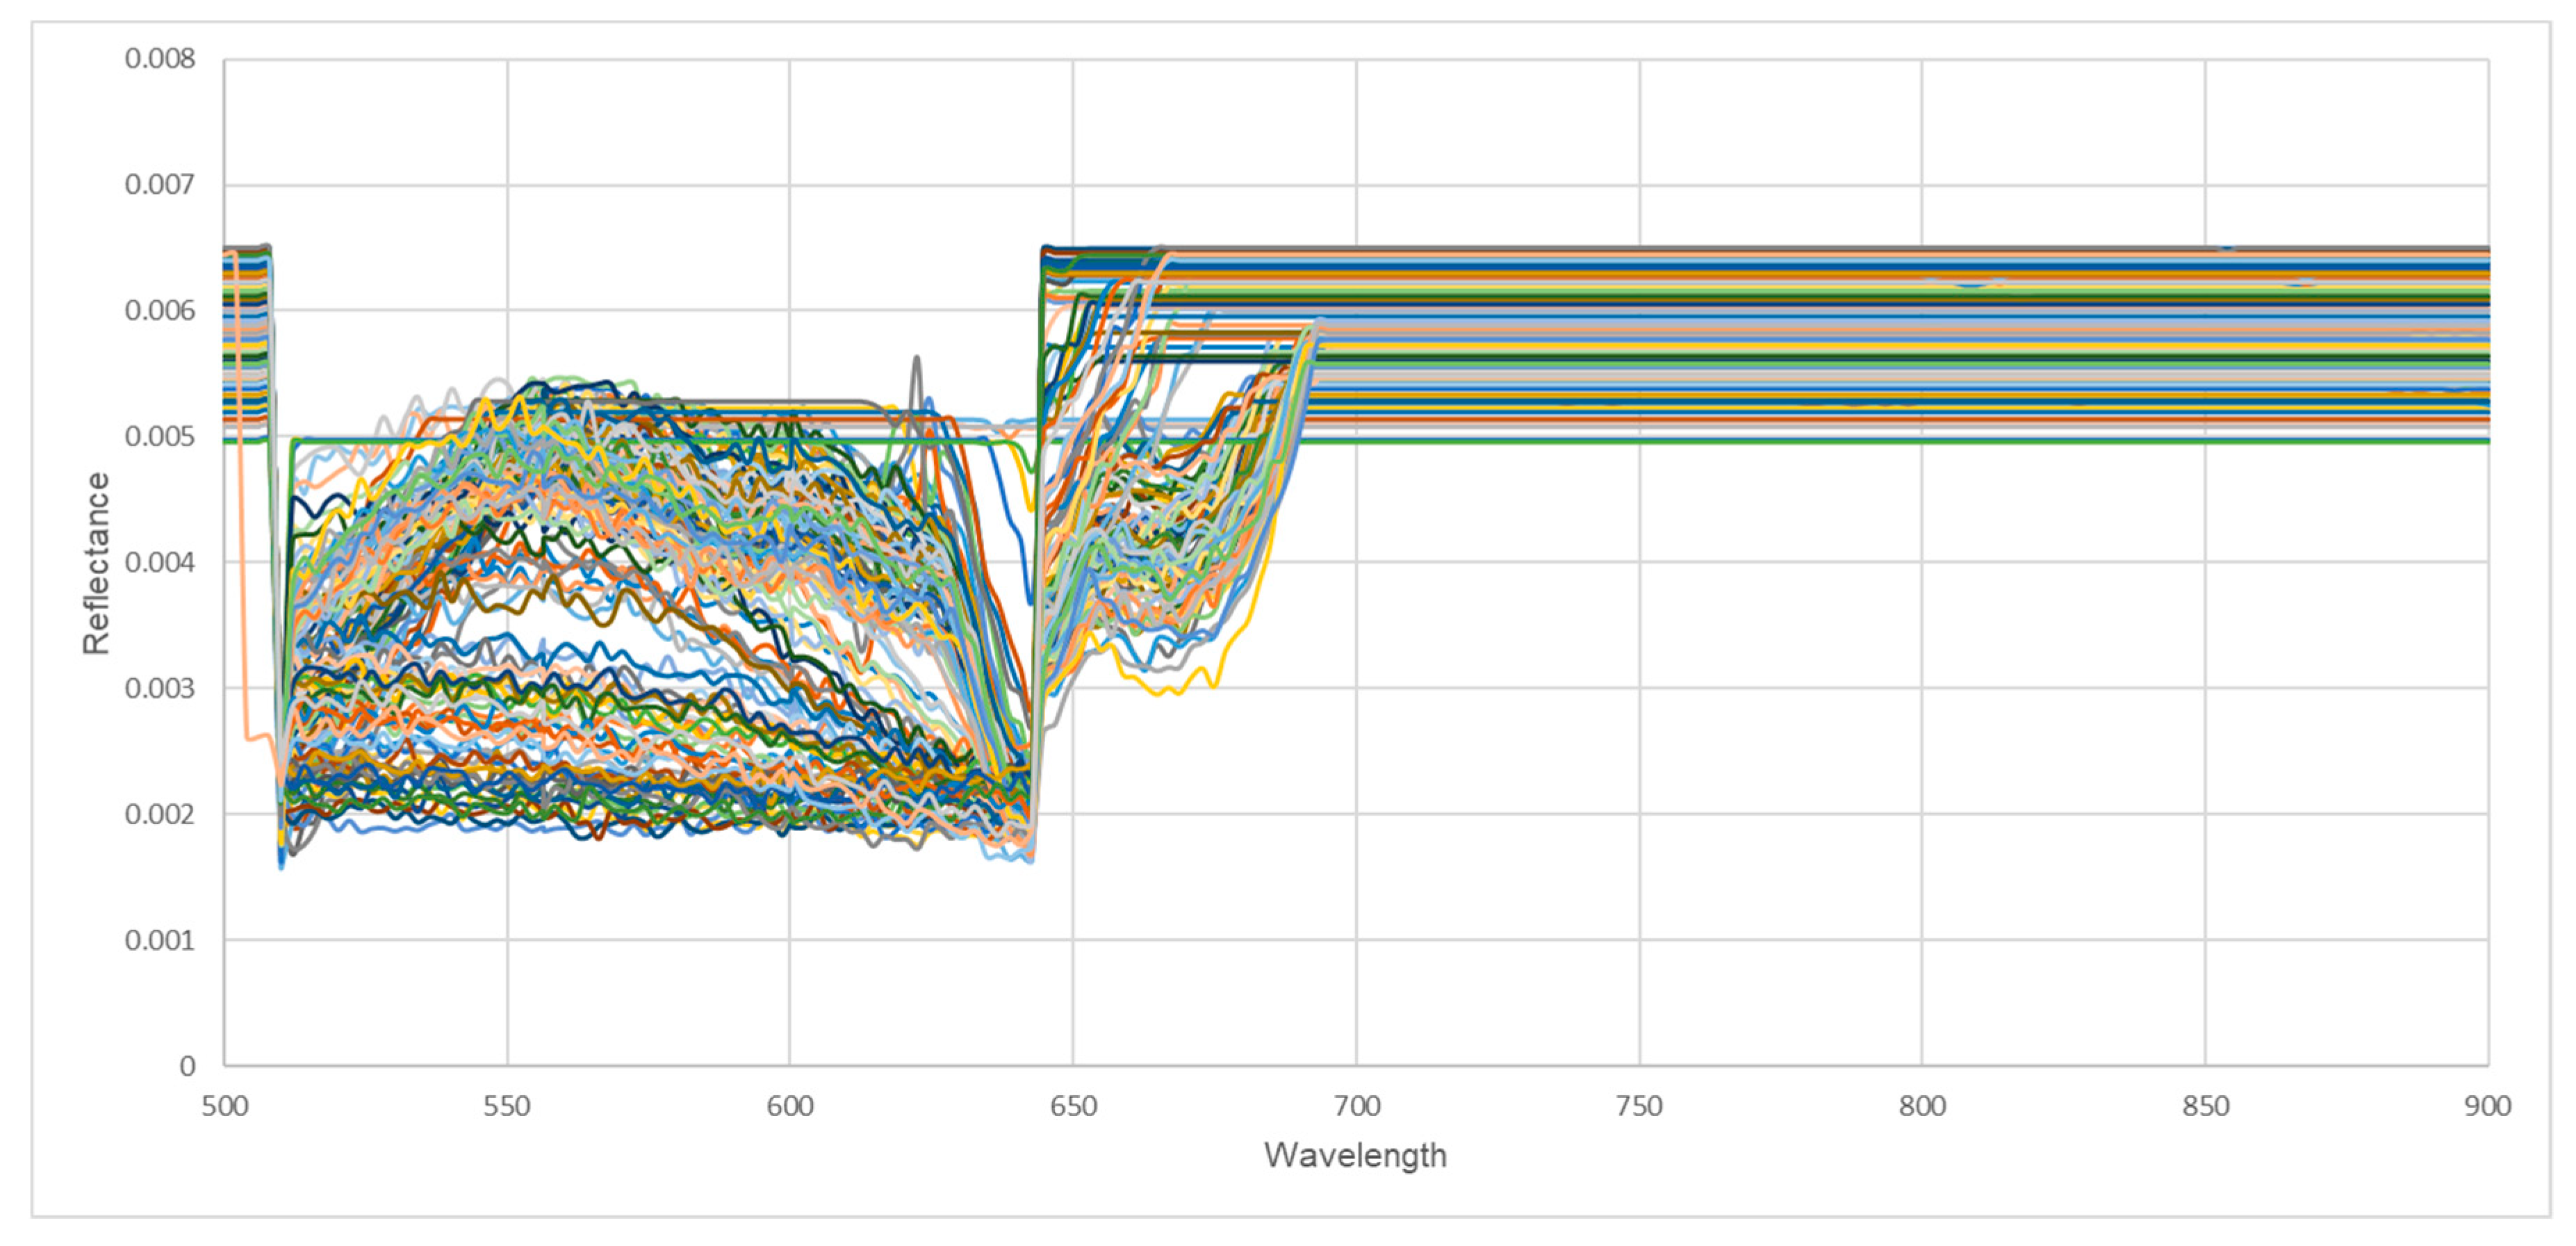
2.3. Hyperspectral Data Collection

A total of nine samples were selected at random from each tree, combining three leaves in one scan. The three samples will then serve as the training and testing data set to create a model. The collected samples were placed on a flat plate with three calibration panels (with reflectance values of 87%, 51%, and 23%). Leaves were immediately scanned after field collection. Figure 2a shows the multiple selected points on the leaf to determine the values for each wavelength and how the scanning for analysis was conducted. The first two leaves were used as the training data set, and the last leaf at the bottom was used for testing. The collection setup used a 5-watt halogen lamp which was placed in front of the sample subject to serve as illumination when capturing the images (Figure 2b). A makeshift stand, using an aluminum extrusion metal, was used to hold the hyperspectral camera and produce steady shots of the samples 30.5 cm from the calibration panel to the camera. A 10-bit image setting and 10 ms integration time was used for the camera.

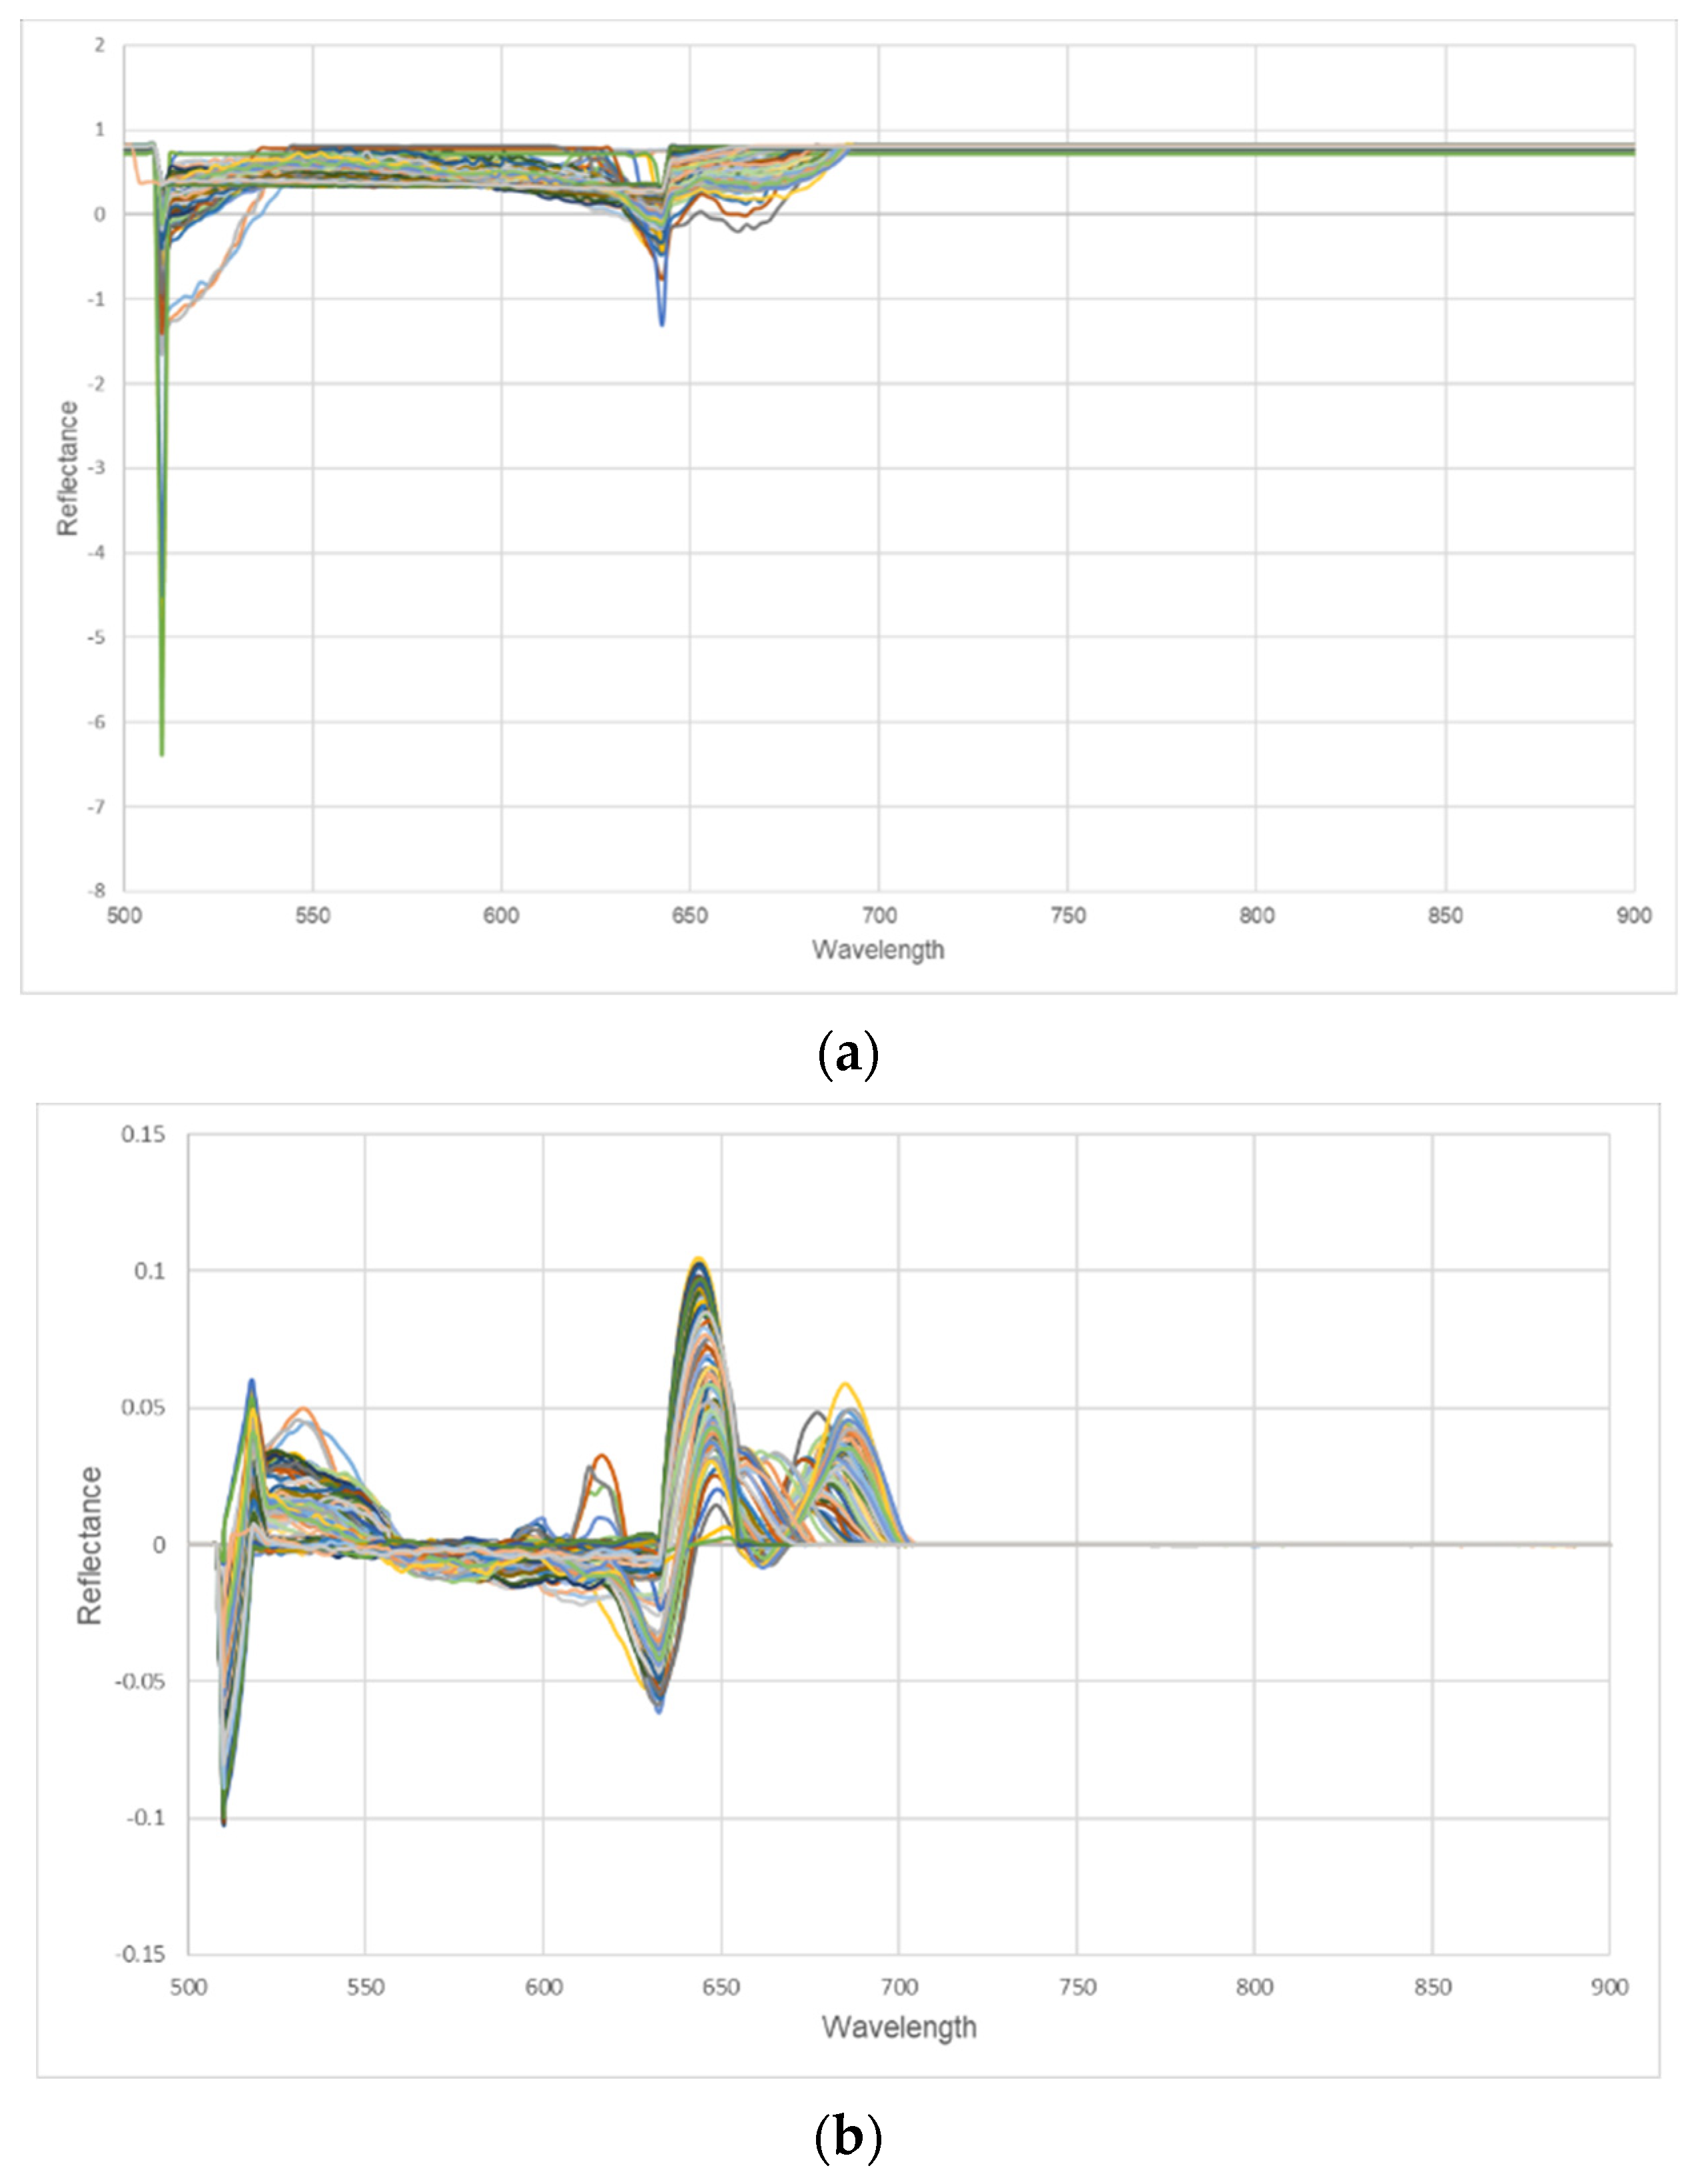
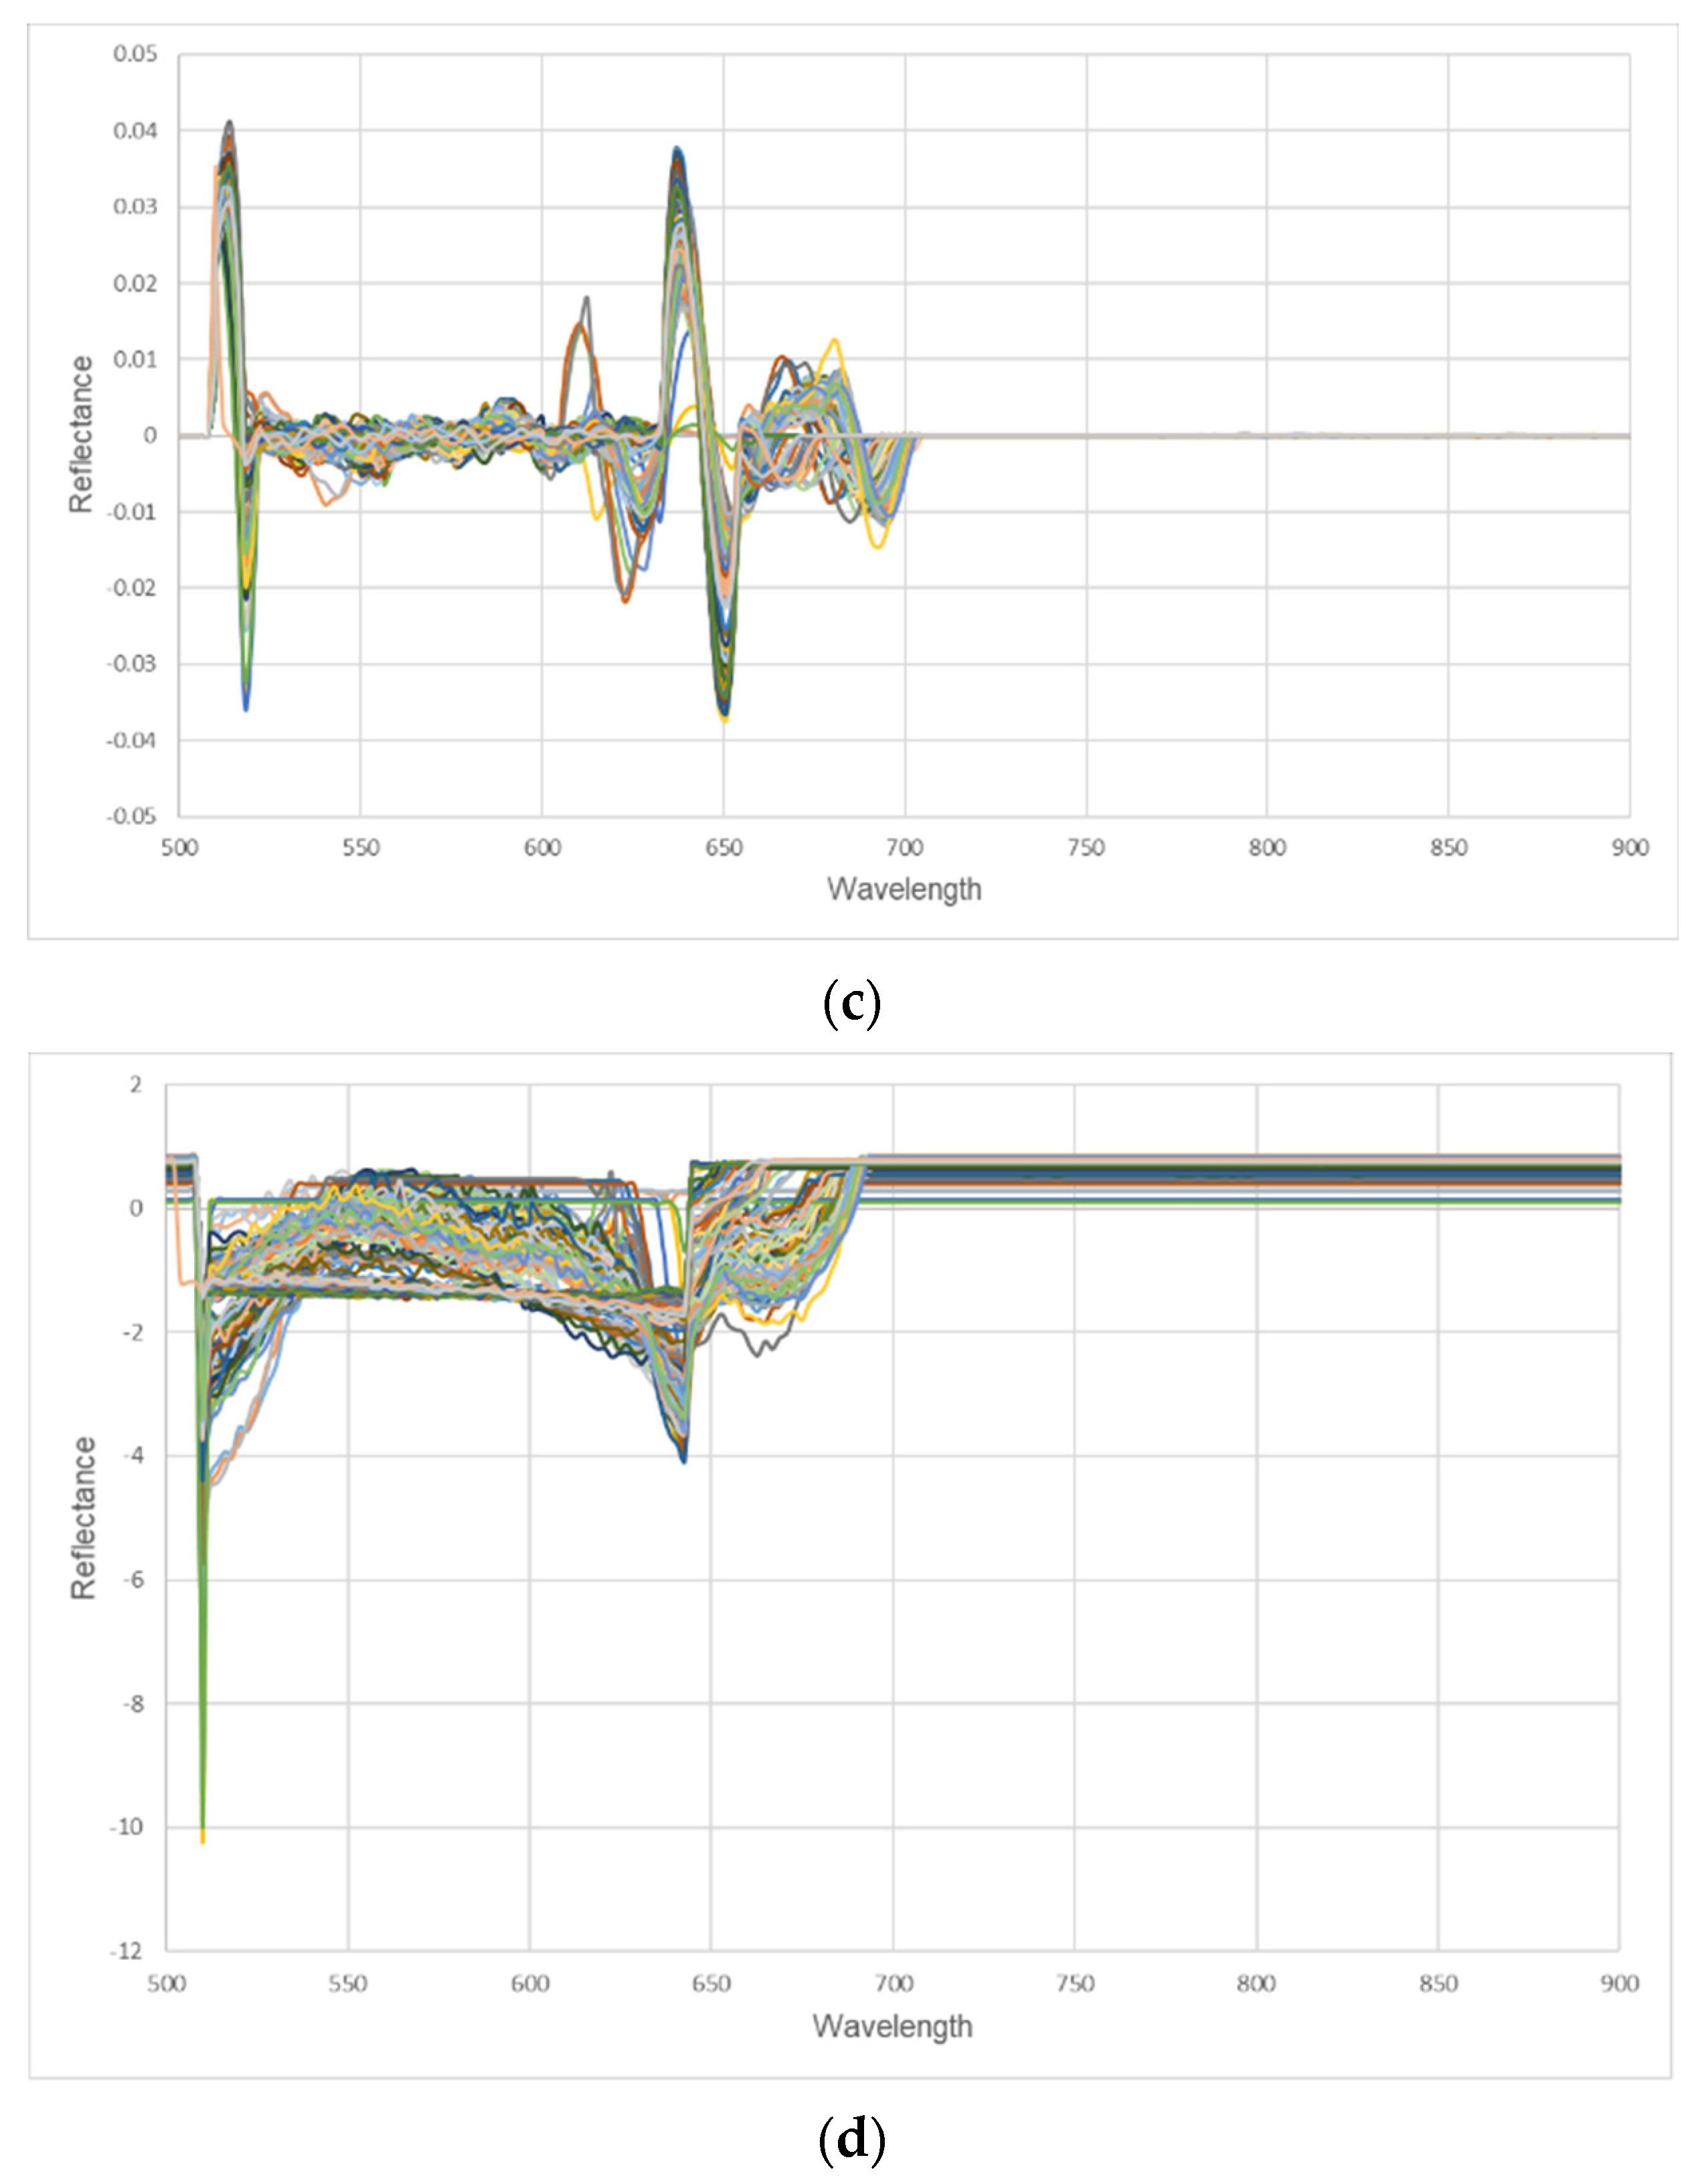
2.4. Data Processing and Modeling

MATLAB (2018b, Mathworks, MA, USA) was used for all data processing, and the results were validated using Unscrambler (12.1, AspenTech, MA, USA). The spectral data were preprocessed by using the calibration panels to produce calibrated data.
Principal component analysis (PCA) was used to assess the suitability of the hyperspectral data for predicting the three levels of K concentration (high (2.7~3.2%), medium (2.0~2.6%), and low (1.3~1.9%)). The analysis was used to verify if there was a separation in the score plot after the analysis. As the data were collected at different months for two years (2020~2021), there were differences in the slopes of the various samples of the scatter effects plot, indicating a baseline shift. Pretreatment of spectral data addressed the additive baseline shifts and multiplicative scatter effects. There were four spectral pretreatment methods used, including Savitzky–Golay [30], first (SGolay-1) and second derivative (SGolay-2); standard normal variate (SNV); and multiplicative scatter correction (MSC) [31]. SGolay filters are applied to data that are equally spaced and are based on fitting a polynomial of a given degree. It is similar to a moving average where the coefficients of the smoothing are constants, as shown in Equation (1) [32,33]:
y t = 1 h [ i = ( n p 1 2 ) n p 1 2 a i x t + i ]
where a is the coefficient, np is the number of datapoints to be used for the smoothing, h is the total number of data points, and x is the raw or original data.
MSC made use of a linear least squares method. It minimized the deviations by fitting a linear model using a reference spectra to another spectra in the raw or original data [34]. The SNV corrects each band i by subtracting the mean and dividing the standard deviation for each band, as shown in Equation (2):
x i k S N V = ( x i k m i ) s i
Both SNV and MSC were applied to the wavelengths using sample range calibration to address the shift.
Partial least square regression has been used in HSI by various researchers [35,36,37]. The PLSR model relates two matrices using a linear multivariate model to determine the plant nutrient of interest. This approach has been used to scan leaf spectra and used it to predict different crop parameters [38,39,40]. Partial least square (PLS) regression models were developed for the K concentration of the leaves. PLS is based on the linear algorithm where it produces good results when there is a linear relationship between the spectra and the nutrient being measured. The dependent variable, in this case, y, is the K concentration, while the independent variables, X, are the bands or wavelengths. The PLS method is widely used when the y variable is continuous, as in this work.
A PLSR algorithm was used with random cross-validation using 20 segments and 6 samples per segment for the training. The algorithm can determine a set of orthogonal projection axes weights (W) and scores (T) and develop the following:
X = T P T + E
y = T q T + f
T = X W *
W * = W ( P T W ) 1
All PLS models were created from a 500~900 nm full-wave range. The higher R2 and lowest root mean square error during the training was used for the PCA and PLSR prediction of the four pretreatment methods.

3. Results and Discussion

Figure 3 shows the original raw spectral data that exhibit baseline shifts. The different colors of the plot only show the different data collected at different times from 2020~2021. Four distinct pretreatment methods were used for the PC analysis and PLS models with random cross-validation for the K nutrient.

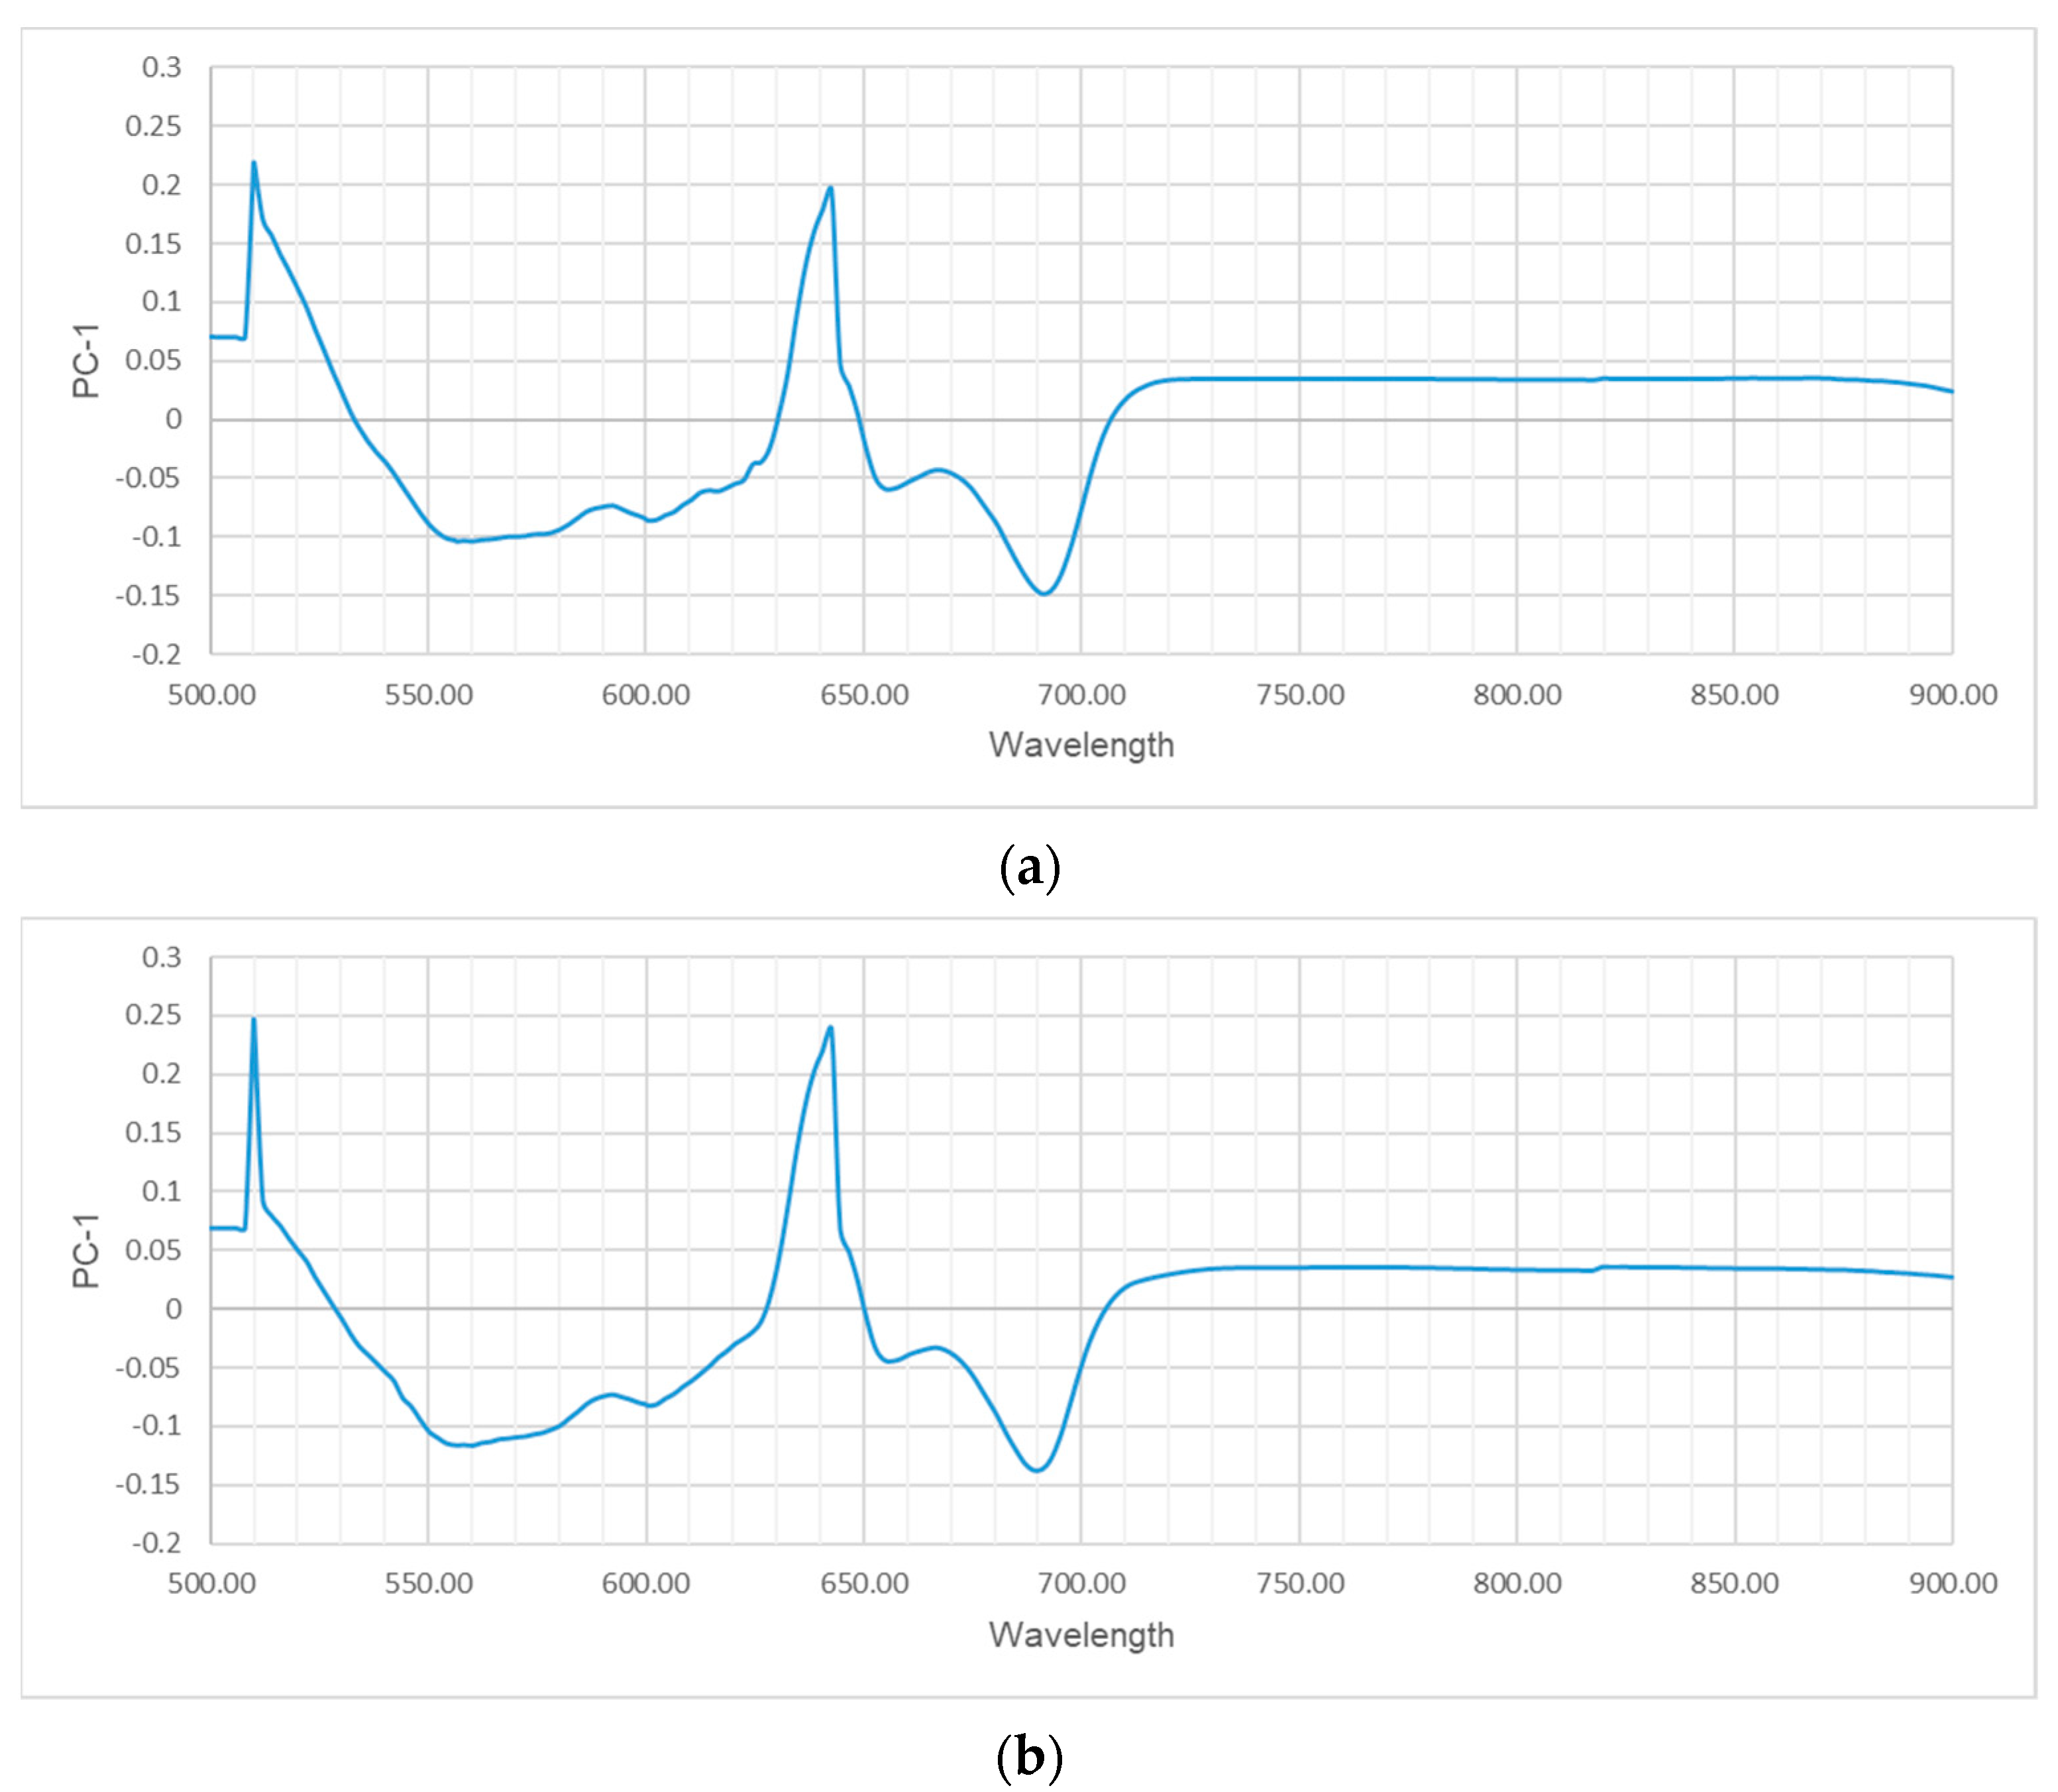
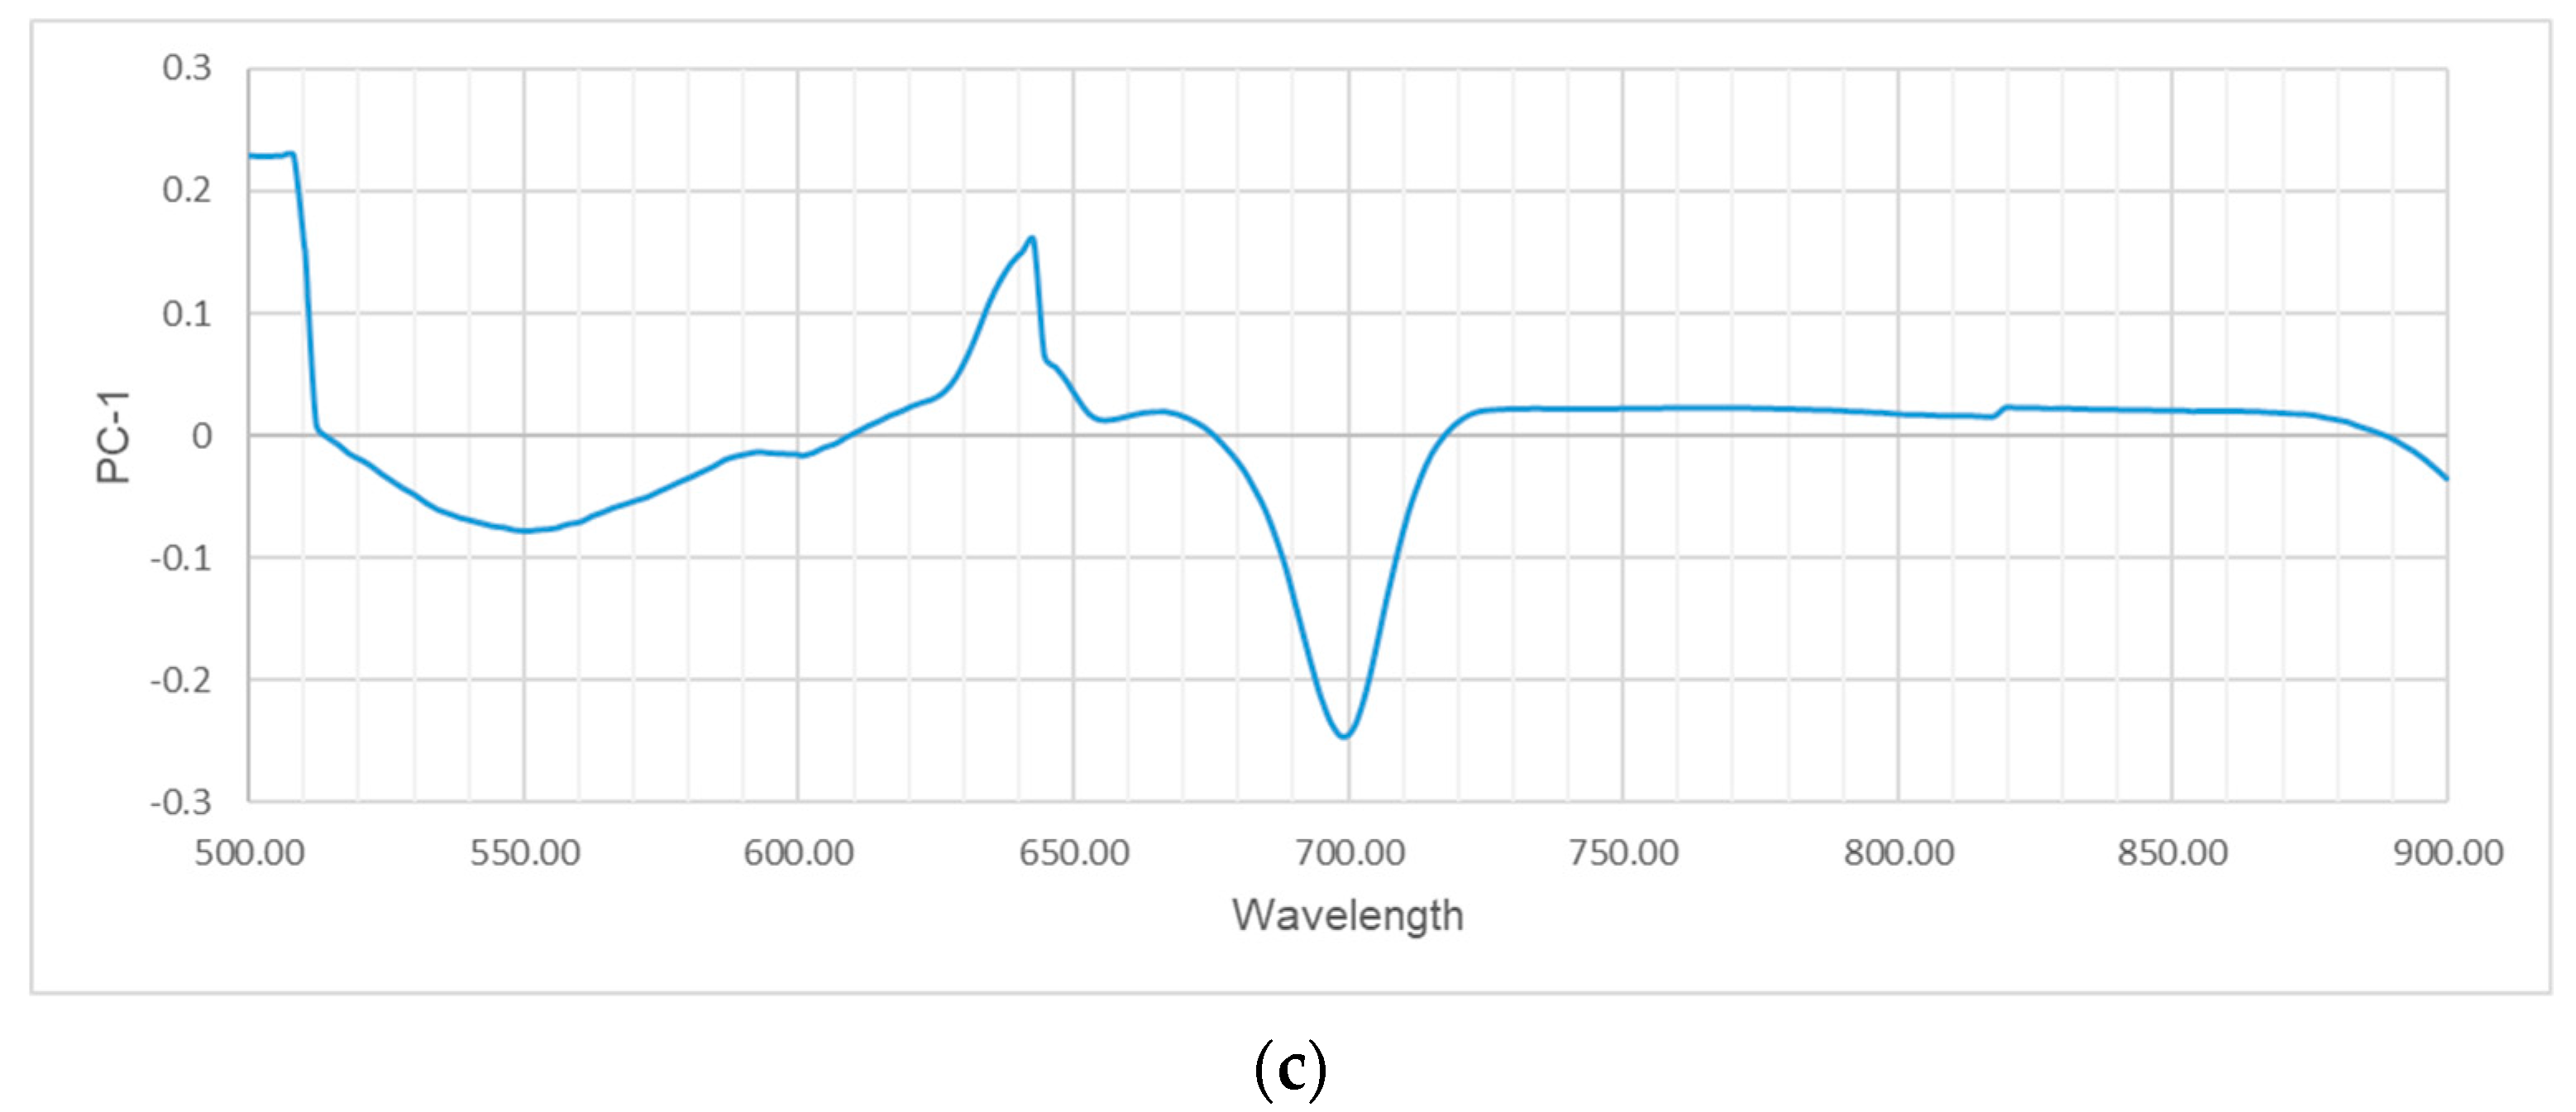
3.1. Principal Component Analysis

The score plot of the PC analysis is shown in Figure 4a, which shows the separation of the three K levels, and the explained variance plot in Figure 4b shows the plot of the number of principal components. The principal component measures the discrepancy between the model and the actual data. Based on the explained variance plot (Figure 4b), two components will yield 93% accuracy in the prediction for the three levels of K. Although using more than two principal components will increase the accuracy, the increase is not significant (<1.2% per component).
A consistent loading plot for all three levels of K nutrients is shown in Figure 5 for low, medium, and high K. This indicates that the loading plot is consistent in all three levels. The dominant bands relevant to this study are shown as peaks of the loading plots. As shown, the positive peaks are positively correlated, while the negative peaks are negatively correlated. Based on the results of the factor loading, four groups of dominant bands relevant in this study from the scanned leaves (Table 3) can be used to predict the three levels of the K nutrient. It also showed that the PCA reduced the dimensionality of the variables from the original 203 bands to 22 bands.

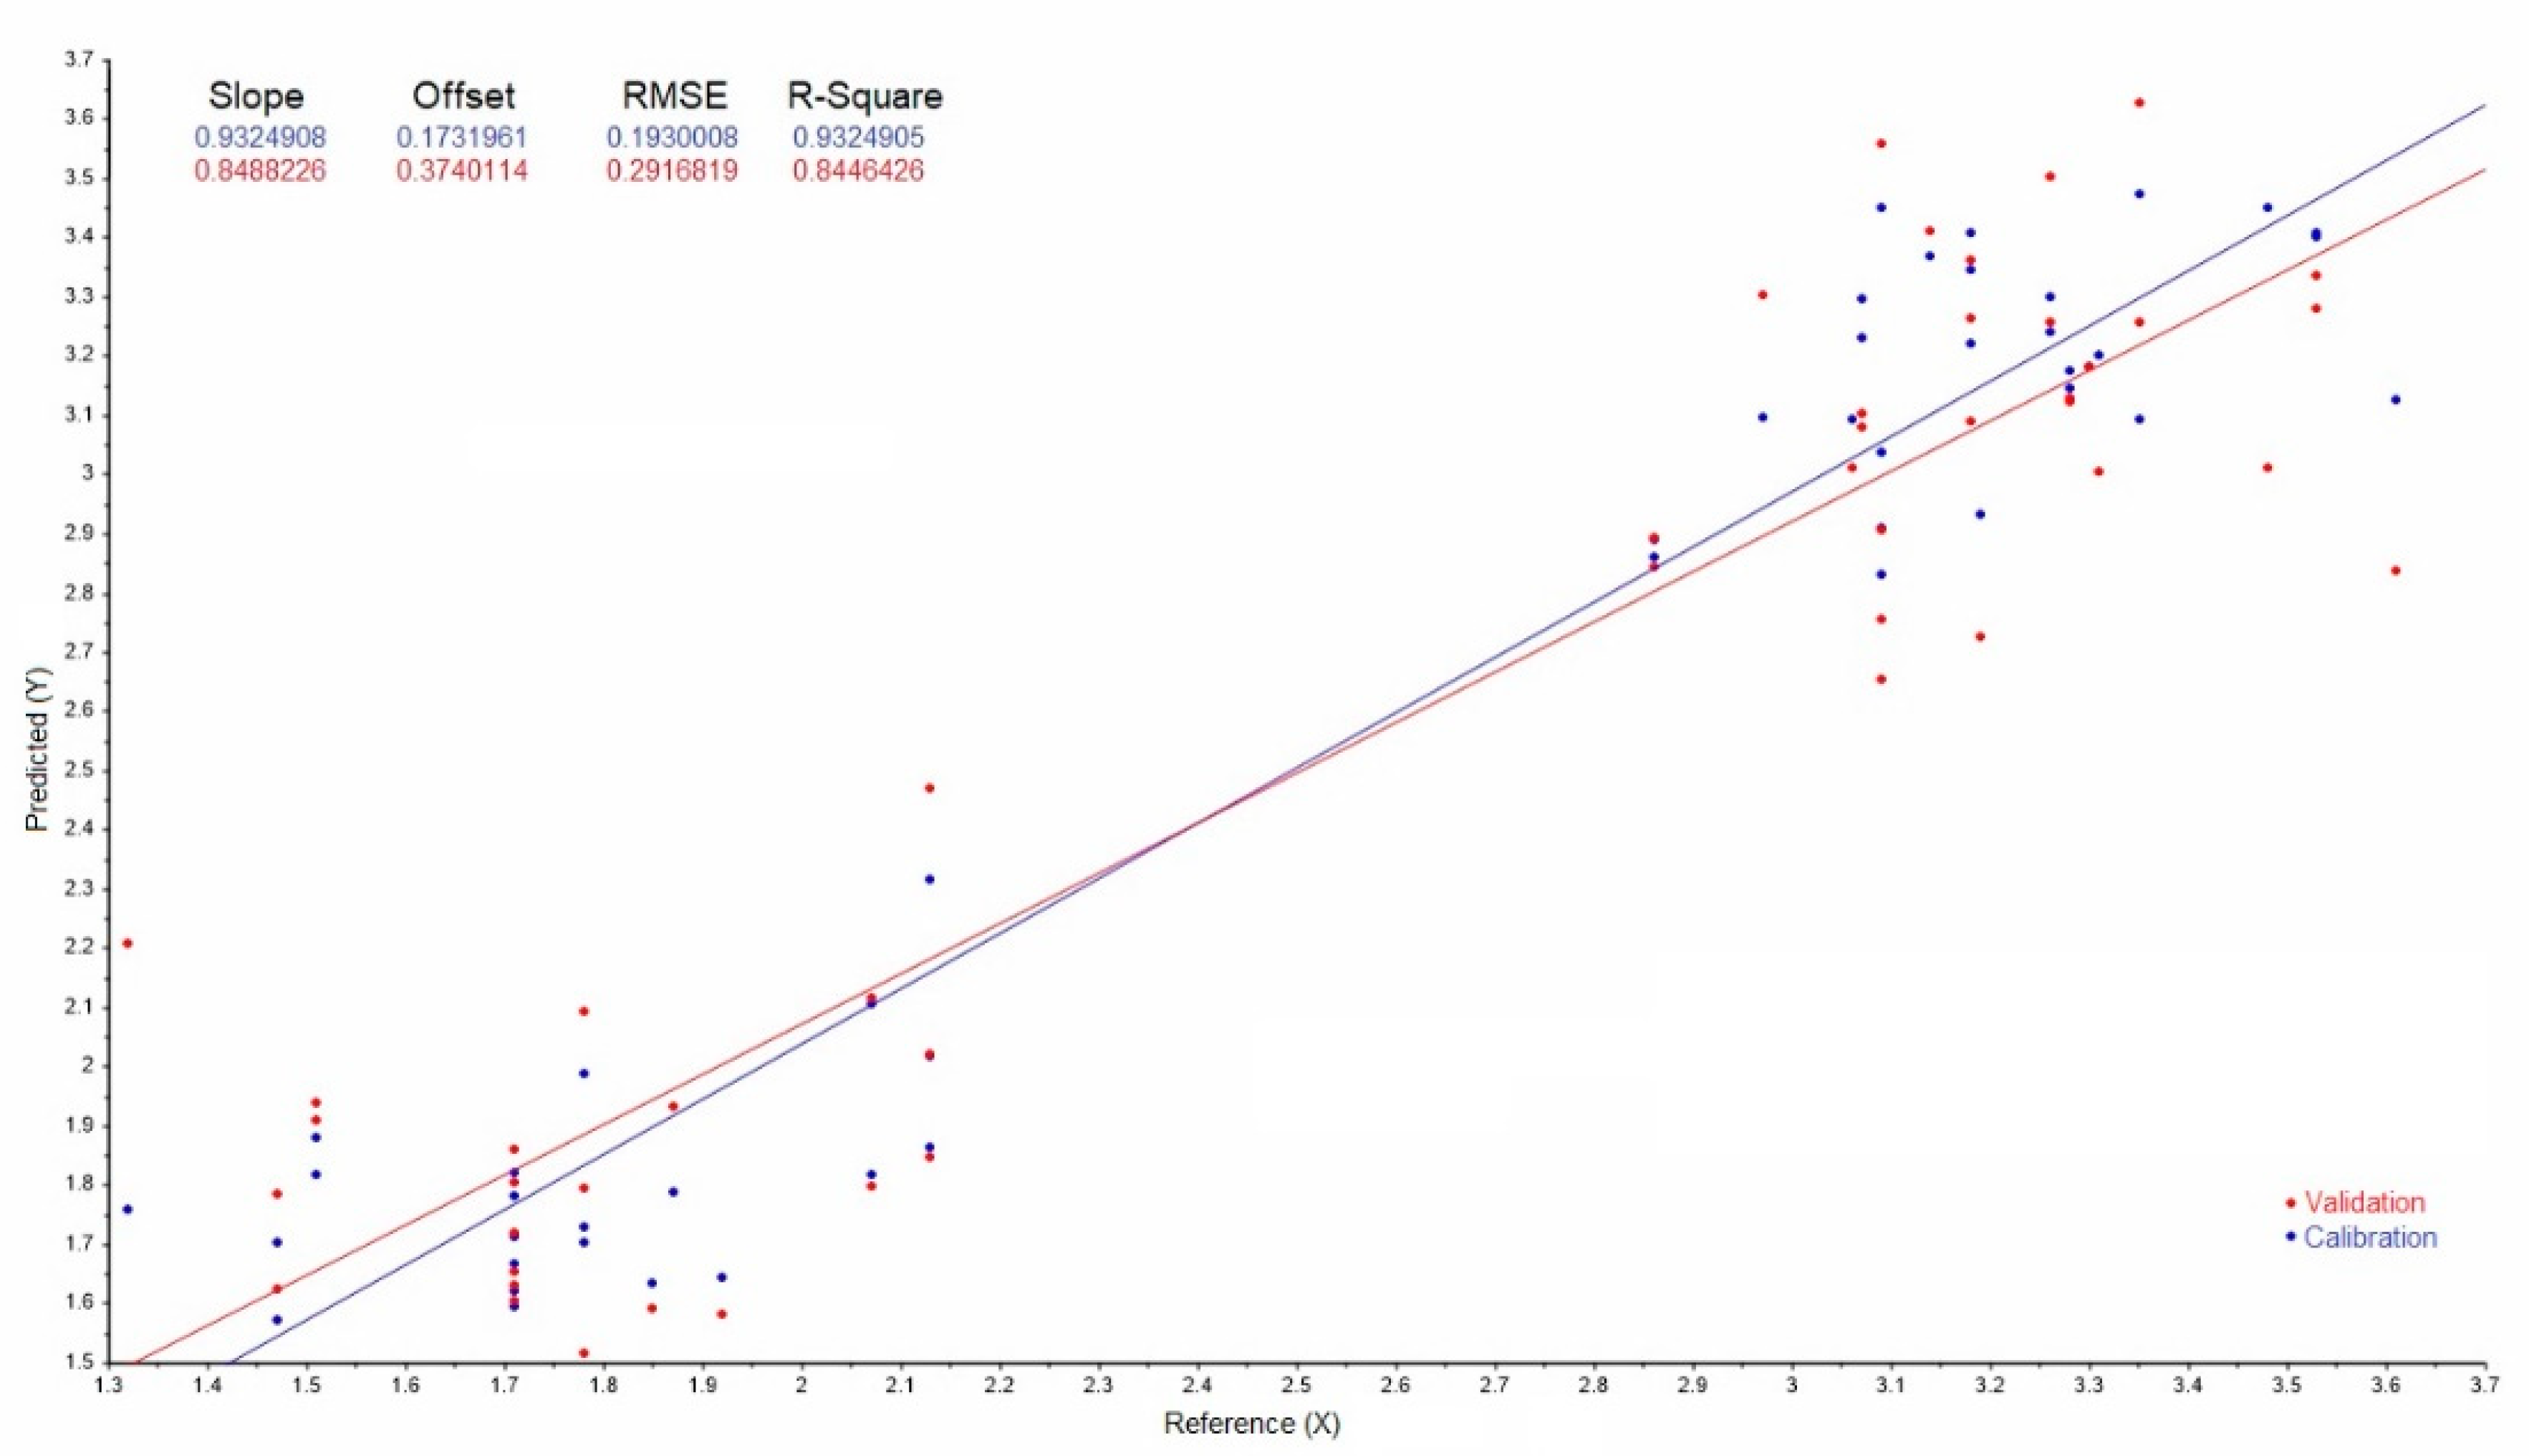
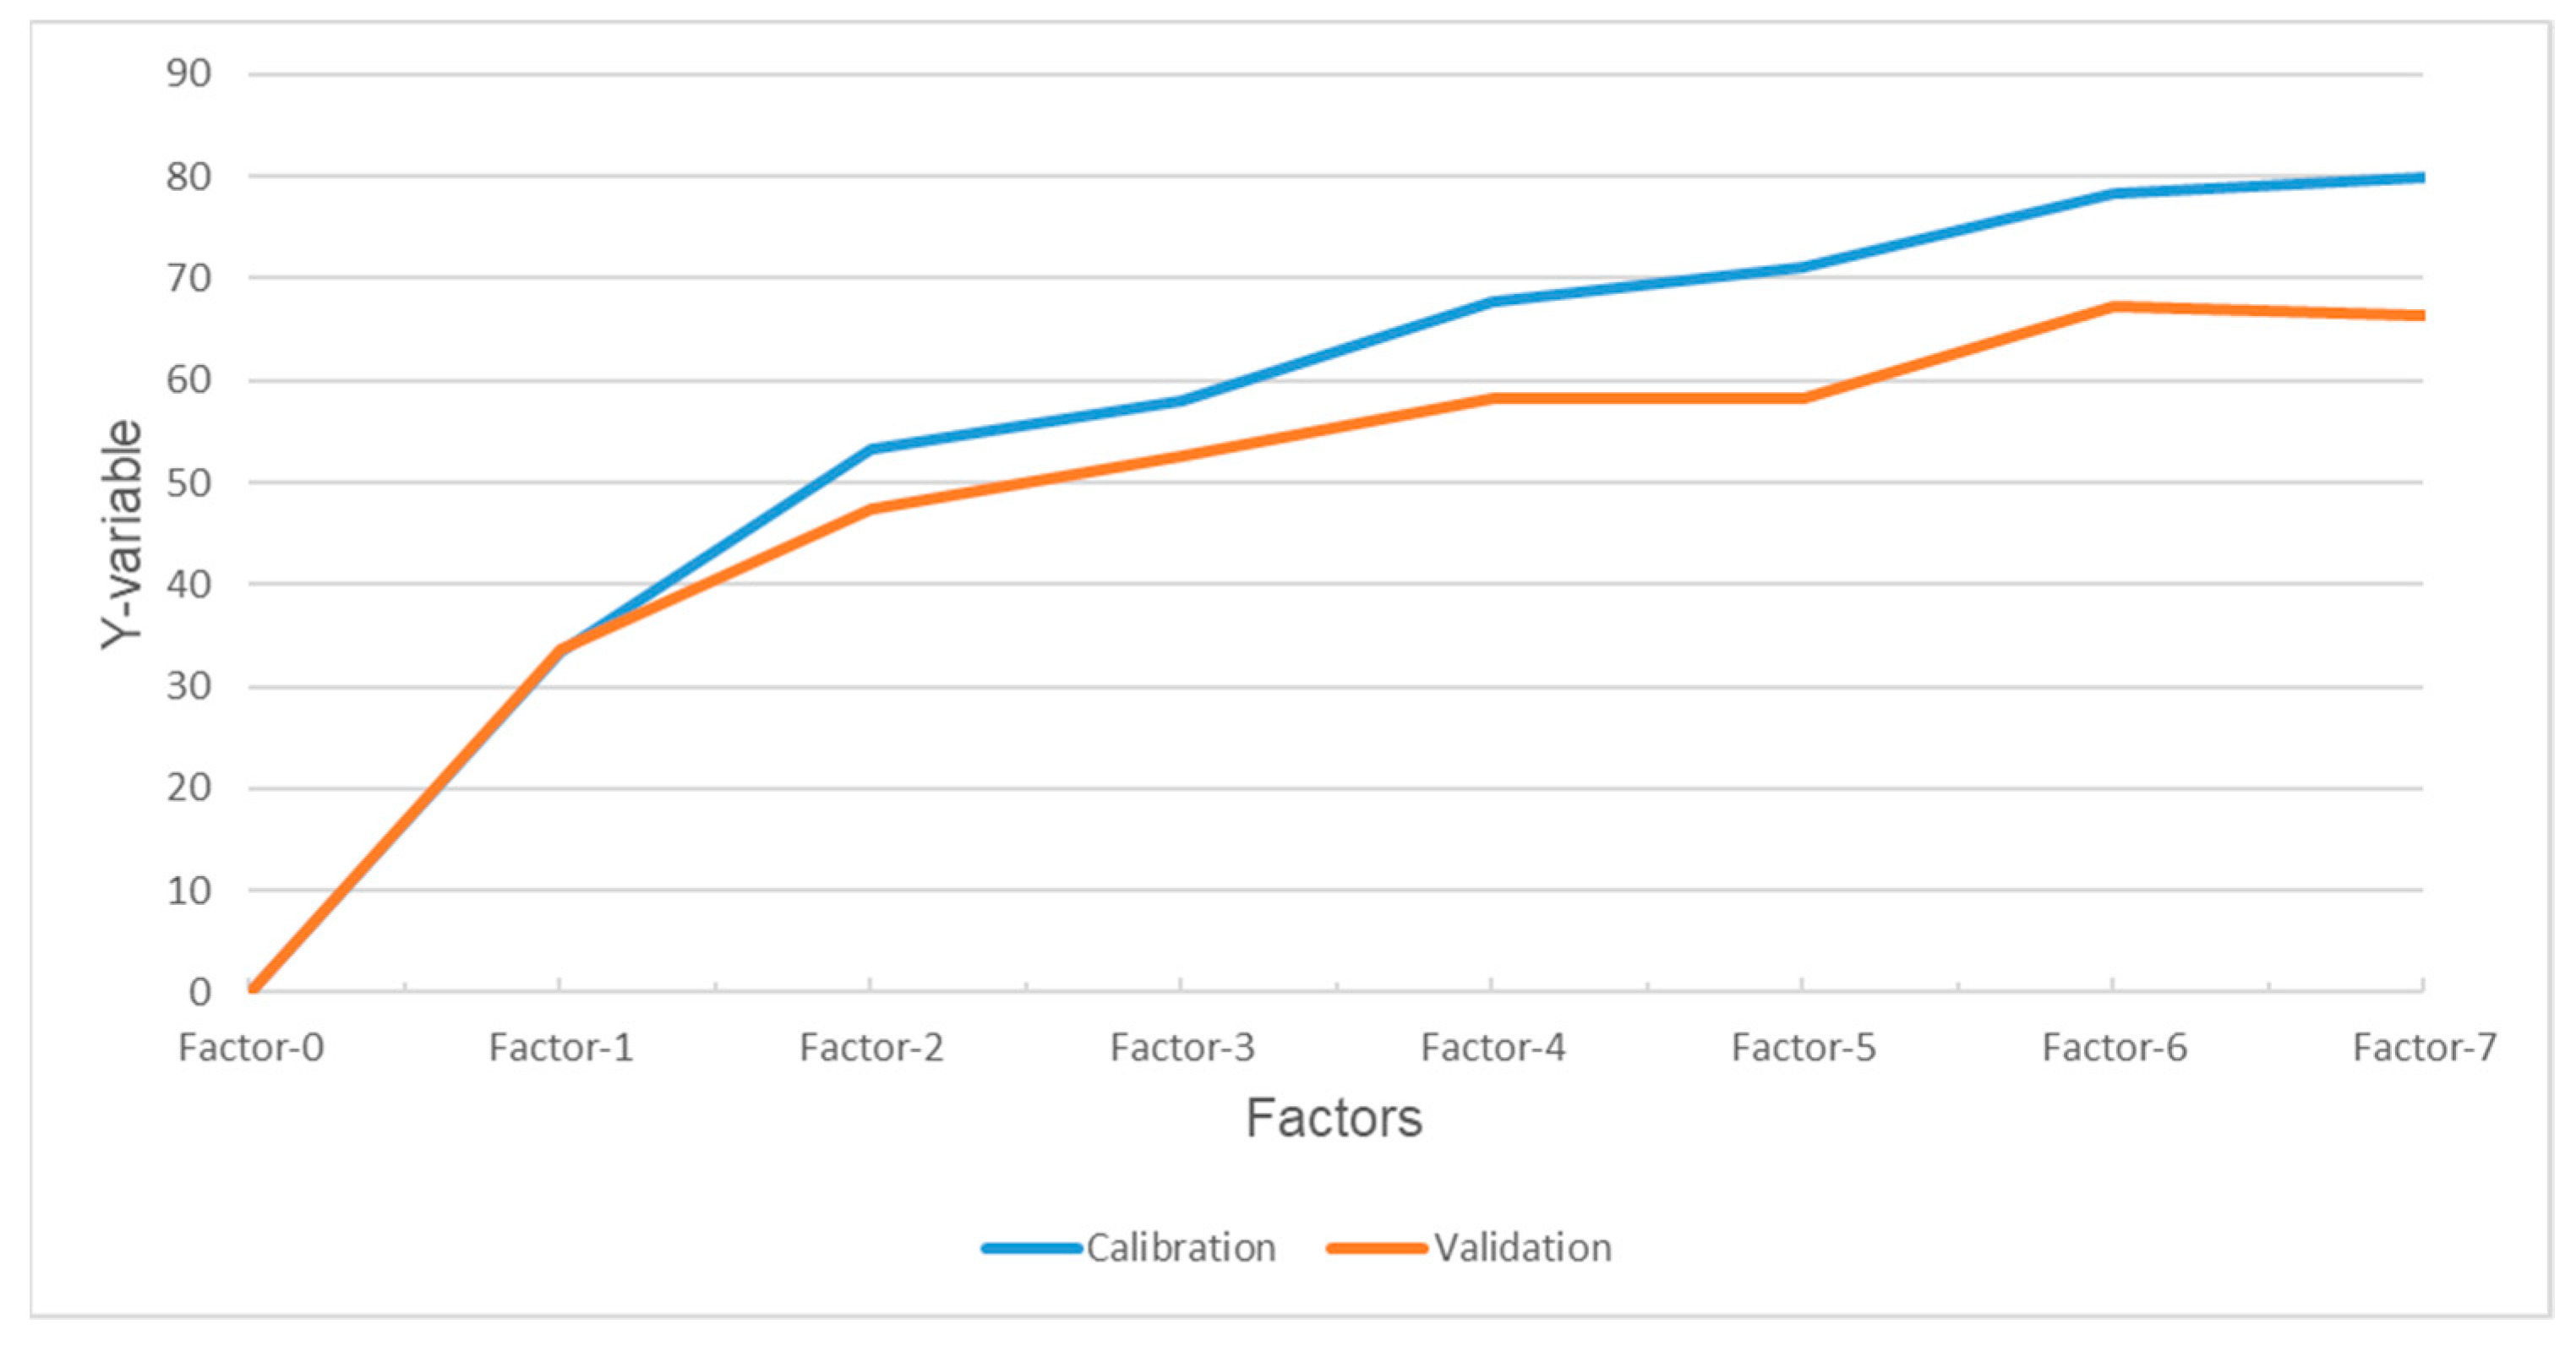
3.2. Partial Least Square Analysis

There were four pretreatment methods used to develop the PLS prediction models (MSC, SGolay-1, SGolay-2, and SNV). The results of the pretreatment methods of the original data are shown in Figure 6. Both MSC and SNV resemble similar plots, while the Savitsky–Golay first and second derivatives showed the same plot profile. The pretreatment methods were then used to develop the PLS prediction models with random cross-validation using 20 segments and 6 samples per segment for the training.
The raw data were also used to develop the PLS models for comparison purposes, as shown in Table 4. The table showed that the accuracies increased as pretreatments were used in the PLS models. Using the different pretreatment method on the raw data showed an increased in the R2. The SNV prediction model showed the highest accuracy (R2 = 0.8446), while SGolay-2 second derivative showed the lowest of the four pretreatments.
Figure 7 shows the predicted vs. reference plot for the model development for the SNV method. The RMSE value, as shown in the figure, is the same unit used for the K nutrient (%) laboratory analysis.
The explained variance plot of the SNV method is shown in Figure 8. The number of factors/components increased in the PLS compared with the PCA, as the prior only have three prediction levels (low, medium, and high) compared with the PLS where the model will predict the K nutrient levels (1.3%~3.2%), as presented in the laboratory results. The number of factors suggested by the model were six, where there were only two for the PCA as shown in Figure 8.
The third leaf (lower part), as shown in Figure 2a, was used for this purpose, where the input variables were all the spectra in the image (500 nm~900 nm). The R2 was 0.8101 with an RMSE of 0.3214. Although slightly lower than the model training R2 (0.8446) and with a higher RMSE, the result is consistent with another study with a different crop [2].
The SNV model with PLS produced promising results that correlated with the K levels of peach leaves. The results show that the HSI can predict K nutrients in peach trees at varying nutrient levels.

4. Conclusions

This work uses a snapshot hyperspectral camera in the visible to the near-infrared range to predict the K nutrient of peach leaves. Four pretreatment methods (MSC, SGolay1-first derivative, SGolay2-second derivative, and SNV) were used to address the shifting of the data. PCA was used to minimize the number of spectra of interests and the number of components to predict the three levels of K nutrient (low, medium, and high). Based on the result, two components will suffice to predict the three levels, as shown on the score plot. The factor loading for all the three K nutrient levels also showed similar results, and the sample groupings in the score plot indicate that the three levels were separated.
PLS was used to predict the K nutrients, and the results of the pretreatment were presented. The PLS prediction models were developed using 20 segments and 6 samples per segment with random cross-validation. The SNV prediction model showed the highest accuracy of the four, with an R2 of 0.8446, followed by MSC (R2 = 0.8099). The SNV prediction model was then used for the validation data, which yielded lower R2 (0.8101) and higher RMSE, but the result is consistent with other similar work for a different crop.
This study showed that HSI could predict K concentration in peach tree cultivars and opens the possibility of predicting other nutrients relevant to peach tree growth.

Author Contributions

Conceptualization, M.I.A.A. and J.M.M.; methodology, M.I.A.A. and J.M.M.; software, M.I.A.A. and J.M.M.; validation, M.I.A.A. and J.M.M.; formal analysis, M.I.A.A. and J.M.M.; investigation, M.I.A.A.; resources, J.M.M., M.C., J.C.M. and H.L.; data curation, M.I.A.A.; writing—original draft preparation, M.I.A.A.; writing—review and editing, M.I.A.A., J.M.M., M.C., J.C.M. and H.L.; visualization, M.I.A.A. and J.M.M.; supervision, J.M.M. and J.C.M.; project administration, J.M.M.; funding acquisition, J.M.M. All authors have read and agreed to the published version of the manuscript.

Funding

This research is based on work supported by NIFA/USDA under project numbers SC-1700611, SC-1700546, and SC-1700581.

Institutional Review Board Statement

Not applicable.

Informed Consent Statement

Not applicable.

Data Availability Statement

Not applicable.

Acknowledgments

The authors would like to thank Jeff Hopkins, Brian Lawrence, and the staff at Musser Farm for their support and assistance in this project and for allowing us to use the farm to research peach trees. We want to acknowledge the support of Tanju Karanfil at the Clemson University Division of Research for the purchase of the hyperspectral camera.

Conflicts of Interest

The authors declare no conflict of interest.

References

  1. Tranker, M.; Tavakol, A.; Jakli, B. Functioning of K and Magnesium in photosynthesis, photosynthate translocation and photoprotection. Physiol. Plant 2018, 163, 414–431. [Google Scholar] [CrossRef] [PubMed] [Green Version]
  2. Wang, C.; Li, X.; Wang, L.; Yang, C.; Chen, X.; Li, M.; Li, M.; Ma, S. Prediction of N, P and K contents in Sugarcane Leaves by Vis-NIR Spectrocopty and Modeling of NP Interactons Effects. Trans. ASABE 2019, 62, 1427–1433. [Google Scholar] [CrossRef]
  3. Kuzin, A.; Solovchenko, A. Essential Role of Potassium in Apple and Its Implications for Management of Orchard Fertilization. Plants 2021, 10, 2624. [Google Scholar] [CrossRef] [PubMed]
  4. Weksler, S.; Rozenstein, O.; Haish, N.; Moshelion, M.; Wallach, R.; Ben-Dor, E. Detection of Potassium Deficiency and Momentary Transpiration Rate Estimation at Early Growth Stages Using Proximal Hyperspectral Imaging and Extreme Gradient Boosting. Sensors 2021, 21, 958. [Google Scholar] [CrossRef]
  5. Bustamante, M.; Muñoz, A.; Romero, I.; Osorio, P.; Mánquez, S.; Arriola, R.; Reyes-Díaz, M.; Ribera-Fonseca, A. Impact of Potassium Pre-Harvest Applications on Fruit Quality and Condition of Sweet Cherry (Prunus avium L.) Cultivated under Plastic Covers in Southern Chile Orchards. Plants 2021, 10, 2778. [Google Scholar] [CrossRef]
  6. Torabian, S.; Farhangi-Abriz, S.; Qin, R.; Noulas, C.; Sathuvalli, V.; Charlton, B.; Loka, D.A. Potassium: A Vital Macronutrient in Potato Production—A Review. Agronomy 2021, 11, 543. [Google Scholar] [CrossRef]
  7. Ghanem, M.; Ben Mimoun, M. Effects of potassium foliar sprays on Royal Glory peach trees. Acta Hortic. 2010, 868, 261–266. [Google Scholar] [CrossRef]
  8. Zhai, Y.; Cui, L.; Zhou, X.; Gao, Y.; Fei, T.; Gao, W. Estimation of Nitrogen, Phosphorous, and Potassium contents in the leaves of differnet plants using laboratory-based visible and near-infrared reflectance spectroscopy: Comparison of partial least square regression and support vector machine regression methods. Int. J. Remote Sens. 2013, 34, 2502–2518. [Google Scholar]
  9. Rotbart, N.; Schmilovitch, Z.; Cohen, Y.; Alchanatis, V.; Erel, R.; Ignat, T.; Shenderey, C.; Dag, A.; Yermiyahu, U. Estimation of olive leaf nitrogen concentration using visible and near-infrared spectral reflectance. Biosyst. Eng. 2013, 114, 426–434. [Google Scholar] [CrossRef]
  10. Alchanatis, V.; Schmilovitch, Z.; Meron, M. In-field assessment of single leaf nitrogen status by spectral reflectance measurements. Precis. Agric. 2005, 6, 25–39. [Google Scholar] [CrossRef]
  11. Cohen, Y.; Alchanatis, V.; Zusman, Y.; Dar, Z.; Bonfil, D.J.; Karnieli, A.; Zilberman, A.; Moulin, A.; Ostrovsky, V.; Levi, A.; et al. Leaf nitrogen estimation in potato based on spectral data and on simulated bands of the Venus Satellite. Precis. Agric. 2010, 11, 520–537. [Google Scholar] [CrossRef]
  12. Min, M.; Lee, W.S.; Kim, Y.H.; Bucklin, R.A. Nondestructive detection of nitrogem in Chinese cabbage leaves using VIS-NIR spectroscopy. HortScience 2006, 41, 162–166. [Google Scholar] [CrossRef] [Green Version]
  13. Saranga, Y.; Landa, A.; Shekel, Y.; Bosak, A.; Kafkafi, U. Near-infrared analysis of cotton leaves as a guide for nitrogen fertilization. Agron. J. 1998, 90, 16–21. [Google Scholar] [CrossRef]
  14. Thomas, J.; Gausman, H. Leaf reflectance vs. leaf chlorophyll and carotenoid concentrations for eight crops. Agron. J. 1977, 69, 799–802. [Google Scholar] [CrossRef]
  15. Siedliska, A.; Baranowski, P.; Pastuszka-Wozniak, J.; Zubik, M.; Krzyszczak, J. Identification of plant leaf phosphorous content at different growth stages based on hyperspectral reflectance. BMC Plant Biol. 2021, 21, 28. [Google Scholar] [CrossRef]
  16. Kamruzzaman, M.; ElMasry, G.; Sun, D.-W.; Allen, P. Prediction of some quality attributes of lamb meat using near-infrared hyperspectral imaging and multivariate analysis. Anal. Chim. Acta 2012, 714, 57–67. [Google Scholar] [CrossRef]
  17. Zhang, X.; Liu, F.; He, Y.; Gong, X. Detecting macronutrients content and distribution in oilseed rape leaves based on hyperspectral imaging. Biosyst. Eng. 2013, 115, 56–65. [Google Scholar] [CrossRef]
  18. Shimoni, M.; Haelterman, R.; Perneel, C. Hypersectral Imaging for Military and Security Applications: Combining Myriad Processing and Sensing Techniques. IEEE Geosci. Remote Sens. Mag. 2019, 7, 101–117. [Google Scholar] [CrossRef]
  19. Briottet, X.; Boucher, Y.; Dimmeler, A.; Malaplate, A.; Cini, A.; Diani, M.; Bekman, H.; Schwering, P.; Skauli, T.; Kasen, I.; et al. Military applications of hyperspectral imagery. In Targets and Backgrounds XII: Characterization and Representation; International Society for Optics and Photonics: Bellingham, WA, USA, 2006; Volume 6239, pp. 82–89. [Google Scholar]
  20. Sankaran, S.; Mishra, A.; Maja, J.M.; Ehsani, R. Visible-near infrared spectroscopy for detection of Huanglongbing in citrus orchards. Comput. Electron. Agric. 2011, 77, 127–134. [Google Scholar] [CrossRef]
  21. Sankaran, S.; Maja, J.M.; Buchanon, S.; Ehsani, R. Huanglongbing (Citrus Greening) Detection Using Visible, Near Infrared and Thermal Imaging Techniques. Sensors 2013, 13, 2117–2130. [Google Scholar] [CrossRef] [Green Version]
  22. Jung, A.; Vohland, M.; Thiele-Bruhn, S. Use of A Portable Camera for Proximal Soil Sensing with Hyperspectral Image Data. Remote Sens. 2015, 7, 11434–11448. [Google Scholar] [CrossRef] [Green Version]
  23. Steffens, M.; Kohlpaintner, M.; Buddenbaum, H. Fine spatial resolution mapping of soil organic matter quality in a Histosol profile. Eur. J. Soil Sci. 2014, 65, 827–839. [Google Scholar] [CrossRef]
  24. Cheng, W.; Sun, D.W.; Pu, H.; Wei, Q. Chemical spoilage extent traceability of two kinds of processed pork meats using one multispectral system developed by hyperspectral imaging combined with effective variable selection methods. Food Chem. 2017, 221, 1989–1996. [Google Scholar] [CrossRef] [PubMed]
  25. Peng, Y.; Zhao, L.; Hu, Y.; Wang, G.; Wang, L.; Liu, Z. Prediction of Soil Nutrient Contents Using Visible and Near-Infrared Reflectance Spectroscopy. ISPRS Int. J. Geo-Inf. 2019, 8, 437. [Google Scholar] [CrossRef] [Green Version]
  26. Xie, Y.; Plett, D.; Liu, H. The Promise of Hyperspectral Imaging for the Early Detection of Crown Rot in Wheat. AgriEngineering 2021, 3, 924–941. [Google Scholar] [CrossRef]
  27. Mee, C.; Balasundram, S.; Hanif, A.H. Detecting and Monitoring Plant Nutrient Stress Using Remote Sensing Approaches: A Review. Asian J. Plant. Sci. 2017, 16, 1–8. [Google Scholar]
  28. What is Hyperspectral Imaging? Available online: https://www.middletonspectral.com/resources/what-is-hyperspectral-imaging/ (accessed on 11 February 2022).
  29. HSC-2 Hyperspectral Camera. Available online: https://senop.fi/wp-content/uploads/senop-hsc-2-hyperspectral-camera-V3iAWSvw.pdf (accessed on 11 February 2022).
  30. Savitzky, A.; Golay, M.J. Smoothing and differentiation of data by simplified least squares procedures. Anal. Chem. 1964, 36, 1627–1639. [Google Scholar] [CrossRef]
  31. Dhanoa, M.S.; Lister, S.J.; Sanderson, R.; Barnes, R.J. The link between multiplicative scatter correction (MSC) and standard normal variate (SNV) transformations of NIR spectra. J. Near-Infrared Spectros 1994, 2, 43–47. [Google Scholar] [CrossRef]
  32. Schafer, R.W. What Is a Savitzky-Golay Filter? [Lecture Notes]. IEEE Signal Process. Mag. 2011, 28, 111–117. [Google Scholar] [CrossRef]
  33. Lohringer, H. Fundamental of Statistics. Available online: http://www.statistics4u.info/fundstat_eng/index.html (accessed on 2 April 2022).
  34. Geladi, P.; MacDougall, D.; Martens, H. Linearization and Scatter-Correction for Near-Infrared Reflectance Spectra of Meat. Appl. Spectrosc. 1985, 39, 491–500. [Google Scholar] [CrossRef]
  35. Meacham-Hensold, K.; Montes, C.M.; Wu, J.; Guan, K.; Fu, P.; Ainsworth, E.; Pederson, T.; Moore, C.; Brown, K.L.; Raines, C.; et al. High-throughput field phenotyping using hyperspectral reflectance and partial least squares regression (PLSR) reveals genetic modifications to photosynthetic capacity. Remote Sens. Environ. 2019, 231, 111176. [Google Scholar] [CrossRef] [PubMed]
  36. Wu, D.; Nie, P.C.; Cuello, J.; He, Y.; Wang, Z.P.; Wu, H.X. Application of visible and near infrared spectroscopy for rapid and non-invasive quantification of common adulterants in Spirulina powder. J. Food Eng. 2011, 102, 278–286. [Google Scholar] [CrossRef]
  37. Gallardo-Velazquez, T.; Osorio-Revilla, G.; Loa, M.Z.; Rivera-Espinoza, Y. Application of FTIR-HATR spectroscopy and multivariate analysis to the quantification of adulterants in Mexican honeys. Food Res. Int. 2009, 42, 313–318. [Google Scholar] [CrossRef]
  38. Heckmann, D.; Schlüter, U.; Weber, A.P.M. Machine learning techniques for predicting crop photosynthetic capacity from leaf reflectance spectra. Mol. Plant 2017, 10, 878–890. [Google Scholar] [CrossRef] [PubMed] [Green Version]
  39. Yendrek, C.; Tomaz, T.; Montes, C.M.; Cao, Y.; Morse, A.M.; Brown, P.J.; McIntyre, L.; Leakey, A.; Ainsworth, E. High-throughput phenotyping of maize leaf physiology and biochemistry using hyperspectral reflectance. Plant Physiol. 2017, 173, 614–626. [Google Scholar] [CrossRef] [PubMed]
  40. Silva-Perez, V.; Molero, G.; Serbin, S.P.; Condon, A.G.; Reynolds, M.P.; Furbank, R.T.; Evans, J.R. Hyperspectral reflectance as a tool to measure biochemical and physiological traits in wheat. J. Exp. Bot. 2018, 69, 483–496. [Google Scholar] [CrossRef] [Green Version]
Figure 1. Leaf sample collection for the three levels of K nutrients.
Agriengineering 04 00027 g001
Figure 2. (a) Three points sampling for each leaf, and (b) the setup for the hyperspectral imaging system.
Agriengineering 04 00027 g002
Figure 3. The raw spectral data from random samples of peach leaves.
Agriengineering 04 00027 g003
Figure 4. The (a) score plot color-coded according to clusters and (b) explained variance of the PCA result.
Agriengineering 04 00027 g004aAgriengineering 04 00027 g004b
Figure 5. The factor loading plots for (a) high, (b) medium, and (c) low K levels.
Agriengineering 04 00027 g005aAgriengineering 04 00027 g005b
Figure 6. Results of the different pretreatment methods used: (a) MSC, (b) SGolay1, (c) SGolay2, and (d) SNV.
Agriengineering 04 00027 g006aAgriengineering 04 00027 g006b
Figure 7. PLS model result for SNV pretreatment method.
Agriengineering 04 00027 g007
Figure 8. The explained variance plot of the PLS of the SNV.
Agriengineering 04 00027 g008
Table 1. Complete description of all treatments in the experiment.
Bag NameNo. of SamplesTree No.Orchard No. 1K Nutrient Concentration 2
H1_T1_B1151P24K1High
H1_T1_B2151P24K1High
H1_T1_B3151P24K1High
H1_T2_B1152P24K1High
H1_T2_B2152P24K1High
H1_T2_B3152P24K1High
H1_T3_B1153P24K1High
H1_T3_B2153P24K1High
H1_T3_B3153P24K1High
M3_T1_B1151P24K3Medium
M3_T1_B2151P24K3Medium
M3_T1_B3151P24K3Medium
M3_T2_B1152P24K3Medium
M3_T2_B2152P24K3Medium
M3_T2_B3152P24K3Medium
M3_T3_B1153P24K3Medium
M3_T3_B2153P24K3Medium
M3_T3_B3153P24K3Medium
L3_T1_B117115Low
L3_T1_B217115Low
L3_T1_B316115Low
L3_T2_B117215Low
L3_T2_B217215Low
L3_T2_B316215Low
L3_T3_B117315Low
L3_T3_B217315Low
L3_T3_B316315Low
1 Orchard number were designated by the Research Center. 2 K nutrient concentration were designated by the research staff working on the same plot.
Table 2. Technical description of the HSI system [29].
ParametersSpecifications
Spectral Range400–1000 nm
Spectral FWHM5–10 nm
Spectral Step0.1 nm
Spectral Bandsup to 1000
Horizontal FOV36.8°
Vertical FOV36.8°
Image SensorCMOS
Dynamic Range10–12 bits
Max Image Rate (frames/s)74 (12 bit)
149 (10 bit)
Image Resolutions1024 × 1024
Exposure timeAdjustable
Memory1TB
GigE RJ-45
USB 2.0 type-C
ConnectionsMini-Displayport v1.2
IO port with UART and 4GPIO pins
MMCX for external GPS antenna (if needed)
Weight986 g
Dimensions (l × w × h)199.5 mm × 130.9 mm × 97.2 mm
PositioningGPS and BeiDou
Voltage supply7–17 VDC
Inertial Measurement UnitGyroscope
3 axis accelerometer
Adjustable opticsFocus distance: ∞–30 cm
Live UseExternal display can be attached
PC-softwareSenop HSI-2
Data exportStandard ENVI
Table 3. Summary of the dominant wavelength in nm for the high, medium, and low potassium peach trees.
TreesCorrelated Bands
Group 1Group 2Group 3Group 4
H1-T1500–520630–640550690
H1-T2500–520630–640550690
H1-T3500–520630–640550690
M3-T1500–520630–640550690
M3-T2500–520630–640550690
M3-T3500–520630–640550690
L3-T1500–520630–640550690
L3-T2500–510630–640550700
L3-T3500–520630–640550690
Table 4. PLS prediction models performance for K nutrient of the different pretreatment methods.
Original-PLSMSC-PLSSGolay1-PLSSGolay2-PLSSNV-PLS
R20.34790.80990.67230.55860.8446
RMSE0.60420.31820.41080.48570.2917
Publisher’s Note: MDPI stays neutral with regard to jurisdictional claims in published maps and institutional affiliations.

