Abstract
Machine learning (ML) within the edge internet of things (IoT) is instrumental in making significant shifts in various industrial domains, including smart farming. To increase the efficiency of farming operations and ensure ML accessibility for both small and large-scale farming, the need for a low-cost ML-enabled framework is more pressing. In this paper, we present an end-to-end solution that utilizes tiny ML (TinyML) for the low-cost adoption of ML in classification tasks with a focus on the post-harvest process of olive fruits. We performed dataset collection to build a dataset that consists of several varieties of olive fruits, with the aim of automating the classification and sorting of these fruits. We employed simple image segmentation techniques by means of morphological segmentation to create a dataset that consists of more than 16,500 individually labeled fruits. Then, a convolutional neural network (CNN) was trained on this dataset to classify the quality and category of the fruits, thereby enhancing the efficiency of the olive post-harvesting process. The goal of this study is to show the feasibility of compressing ML models into low-cost edge devices with computationally constrained settings for tasks like olive fruit classification. The trained CNN was efficiently compressed to fit into a low-cost edge controller, maintaining a small model size suitable for edge computing. The performance of this CNN model on the edge device, focusing on metrics like inference time and memory requirements, demonstrated its feasibility with an accuracy of classification of more than and minimal edge inference delays ranging from 6 to 55 inferences per second. In summary, the results of this study present a framework that is feasible and efficient for compressing CNN models on edge devices, which can be utilized and expanded in many agricultural applications and also show the practical insights for implementing the used CNN architectures into edge IoT devices and show the trade-offs for employing them using TinyML.
1. Introduction
The olive tree, a vital tree crop in regions like the Mediterranean, has seen impressive growth in farming in recent decades. This growth has been primarily driven by the burgeoning market for olive fruit products, which play a pivotal role in the food industry. However, despite this growth, the industry still largely relies on conventional technologies for sorting and producing derivatives of this important fruit. Reports from the International Olive Council and Expert Market Research business intelligence company highlight that the demand for table olive and olive oil has nearly doubled in the last two decades [1,2]. To address these market needs, especially for small-sized producers, it is imperative to tackle challenges like operational costs and improving product quality by removing subpar fruits.
The post-harvesting process, particularly sorting (i.e., varieties or quality sorting), is a major cost driver in the industry, often necessitating significant investment and leading to higher final product prices [3,4]. This paper seeks to address these cost concerns by exploring innovative, low-cost technological solutions. Hence, integrating new technology into the sector is crucial to reduce operational expenses. However, existing high-tech solutions are typically costly and represent significant financial burdens in terms of capital expenditure (CAPEX).
The advent of artificial intelligence (AI) and the Internet of Things (IoT) has brought transformative changes to various industries. These technologies are central to the framework of Industry 4.0 and beyond (i.e., industry 5.0), promising smart process speeds, real-time monitoring, decision-making, and improved automation operated by AI [5,6,7,8,9,10]. However, such high-tech solutions, often requiring high-performance computers (GPU-powered) or cloud solutions, are not always feasible for low-cost AI applications, particularly for small and medium-sized farmers. Thus, the need arises for new frameworks that enable AI to penetrate these edge markets.
Edge computing, enabling decision-making closer to the data source, leads to faster response times and real-time processing critical in tasks such as sorting and classification. Tiny ML (TinyML) is emerging as a major shift in ML for edge computing. By compressing and quantizing full-sized ML models into lightweight versions, TinyML facilitates the deployment of ML models on edge devices with limited resources. This makes TinyML an ideal solution for small to medium-sized olive farmers, allowing them to leverage AI-driven solutions without significant investment.
In light of these developments, this paper aims to explore the feasibility of TinyML as a potential solution for low-cost, AI-driven decision-making in edge farming. Our focus is on bridging the technological gap to enable more efficient and smarter farming practices. We seek to provide a detailed analysis of how TinyML can revolutionize the olive farming industry, particularly in the context of post-harvest sorting and classification.
2. Related Works
AI has been playing a pivotal role in building the new face of the farming ecosystem in recent years. This is generally led by modern deep learning (DL) and transfer learning (TL) with the main objectives of having more efficiency and cost reductions [11,12,13,14,15,16,17]. At the cortex of these changes lies the utilization of IoT sensors on the edge for data collection via plant-attached sensors or remote sensing using drones. These granular data, when processed with advanced AI and TL algorithms, ensure precise irrigation, optimized fertilizer application, efficient product classification, and targeted pest control [18,19]. Further DL, combined with historical data, proves itself invaluable in predicting crop yields, potential disease outbreaks, and imminent climatic changes, allowing farmers to adapt their strategies proactively [20,21]. Specific applications of DL, particularly in conjunction with TL, have achieved significant milestones in forecasting crop yields, recommending cultivation practices, detecting diseases in leaves, and analyzing diverse farming parameters [22,23,24,25]. While AI, through deep learning and transfer learning, has broadly transformed farming practices with enhanced efficiency and precision, a particularly notable advancement is in the domain of computer vision, where deep learning has revolutionized the way agricultural imagery is processed and interpreted across different farming sectors.
In recent years, the field of computer vision has significantly advanced due to the revolution in deep learning (DL). This technology is increasingly being applied across various domains of the farming ecosystem, such as crop farming, livestock farming, and fish farming. In aquaculture, for instance, deep learning plays a crucial role in tasks like fish identification, species classification, and water quality prediction [26,27].
The primary advantages of computer vision in farming include image segmentation and classification. Image segmentation is critical for applications like yield prediction and counting; for example, segmenting individual wheat grains helps in estimating harvest volumes [28]. Image classification, on the other hand, is key in determining the health status or variety classification of crops such as olives [29,30]. These advancements have significantly contributed to ’precision farming’, which combines IoT, data mining, ML, and DL to increase productivity and decrease labor.
However, challenges exist, particularly in the need for labeled data and adapting pre-trained models to specific agricultural contexts [13,31,32,33]. While AI-enhanced convolutional neural networks (CNNs) like mask R-CNN offer improved segmentation capabilities [34], their complexity can be a drawback in resource-constrained edge-device applications.
Furthermore, while TL has been instrumental in refining general models for specific agricultural needs, deploying these sophisticated models on resource-limited edge devices poses significant challenges due to computational and memory constraints [35,36]. This limitation is particularly relevant in our study, where the focus is on olive fruit classification for low-cost edge implementation. In this context, the simplicity and lower computational requirements of classical image segmentation techniques become advantageous, aligning more closely with the needs of small- and medium-sized producers. Therefore, our approach utilizes classical image segmentation methods, demonstrating their suitability for effective and efficient olive fruit classification on edge devices.
In our research context, there have been some initiatives targeting post-harvest classification of olive fruits. However, these efforts are predominantly focused on specific geographical locations and particular varieties of olive fruits. Crucially, none of these endeavors have addressed the need for low-cost ML solutions to effectively tackle this issue. For instance, the authors in [29] provide a CNN model for olive varieties classification, but their dataset is collected from regions in Spain, featuring varieties different from those we study in this paper. Additionally, these authors have not emphasized the development of cost-effective ML solutions, which is a central focus of our research. Another effort in olive fruit grading and classification, which centers on the evaluation of olive fruits based on their geometrical dimensions, size, and mass estimation, is detailed in [37]. However, this approach is limited to varieties found in Spain and does not address the implementation of low-cost, edge-based classification solutions, which is a gap our research aims to fill. In [38], the authors introduce an image segmentation algorithm using discrete wavelets transform and a classification scheme based on texture features to assess the quality of olive fruits, focusing on defect detection. However, the study is limited to quality classification without addressing variety differentiation or implementation on low-cost edge devices.
Here, we acknowledge these existing limitations in the field of post-harvest olive fruit classification, particularly the lack of focus on low-cost, scalable ML solutions suitable for diverse geographical contexts and olive varieties. By shifting our focus to TinyML, we aim to bridge this gap, offering an innovative approach that enables efficient and cost-effective AI solutions for edge computing. This direction not only addresses the specific needs of olive classification in varied regions but also sets a new benchmark for deploying advanced DL models in resource-constrained agricultural settings.
TinyML can be considered as the key enabler to tackle the challenges that are related to the cost and the connectivity in the industrial distributed edge applications [36,39]. TinyML allows for real-time near-field decision-making and this, in essence, reduces the costs of adopting AI solutions in the farming ecosystem. Recently, TinyML has been proven to show high-accuracy inferences for both classification and regression tasks. In human activity recognition, for example, TinyML has been utilized to empower IoT edge devices to make real-time on-the-edge activity recognition [40,41]. In industrial applications, TinyML has been demonstrated for use in an extreme industrial domain for ML-based anomaly detection [42]. In the context of audio signal processing, TinyML has been used as a hardware accelerator for audio conversion using CNN architectures at the edge [43].
TinyML provides the path for low-latency answers crucial for real-time monitoring and improvements in agricultural techniques by minimizing the computing hard work and enabling on-device analytics. Utilizing this technology will not only increase production and sustainability but will also lower the costs that are associated with data transfer and cloud processing, bringing an age of innovation into the current farming operations.
Building on the promise of TinyML in agriculture, this paper makes several key contributions to the field. The main contributions can be summarized as follows:
- Pioneering adoption of AI in Industry 4.0 and 5.0: We emphasize the adoption of ML for smart agriculture jointly with the development of industrial applications toward Industry 4.0 and Industry 5.0. We highlight the potential of AI in this domain by emphasizing the imperative need for low-cost, ML-enabled edge devices to universalize the benefits of smart agriculture across multiple farming scales.
- Dataset collection for Jordanian olive varieties: One of the major contributions of this paper is to collect and build a dataset for diverse olive fruits. We focus on the Jordanian varieties from northern Jordan as a special case of the Mediterranean region. The study also presents a framework for building the dataset, starting from capturing images, segmenting individual objects, and then moving toward data augmentation for the elimination of latent biases. This involved the collection of images for three distinct categories of olives, resulting in a dataset enriched with more than 16,500 individual fruits labeled across categories for good and bad qualities, for the sake of variety and quality classifications.
- CNN architecture implementation: The core framework of this paper presents the adoption of a sophisticated CNN model architecture that can solve the classification problem with minimal hardware resources via optimization for TinyML for edge devices.
- TinyML evaluation for edge deployment: To ensure that the adopted CNN model is suitable and feasible to run on ultra-low-cost edge devices, we present a practical implementation with inference results on the ESP32-S3 micro-controller unit (MCU). The results show the pipeline of how to tune the model hyperparameters while keeping a sensible accuracy with minimal performance degradation and memory footprints even after model compression and quantization.
- Assessing challenges and practical limitations: The final contribution of this paper is to provide technical and practical insights for deploying TinyML on edge devices for general-purpose classification or regression problems. We discussed the inference rate, image size effect, and memory footprints and how to deal with the trade-offs of these parameters.
3. Materials and Methods
In this paper, we go through multiple phases in collecting the dataset of the olive fruits. We use the main three varieties of the Jordanian farming sector as a case study of the Mediterranean basin. Then, we build a CNN model for training and validation and apply the trained model on the edge MCU (ESP32-S3) to test the feasibility of the proposed solution for adoption in low-cost machinery. First, we start with the data acquisition as in the following section.
3.1. Data Acquisition
For the sake of collecting a dataset to build an artificial intelligence-based industrial classifier, we performed data collection via massive image capturing of olive fruit batches. The batch picturing eliminates the headache of single image acquisition for each fruit for different types of the fruit. We specifically chose three prominent varieties of olives from the northern Jordan region (32.5373188 N, 35.7359672 E) known by the local names: (1) Baladi, (2) Nabali, and (3) Romi.
In addition to capturing images of these sorted healthy varieties, we also took pictures of unhealthy olive fruits with major defects. With this collection, we can build a dataset for two distinct classification tasks: first, variety classification, and second, health status classification. In the dataset preparation, we capture a batch of olives in one image to simplify the dataset collection. On average, each image contained between 70 and 200 olives, amounting to a total of approximately 50 images per type. The capturing was done on a black plate to provide contrast and simplify the subsequent image processing tasks. As for the dataset preparation, post-acquisition, the images underwent a segmentation process, which will be detailed in the following section. Ultimately, our dataset comprises four distinct classes, with each class representing a single olive fruit. For which we can do variety or quality classification. The final processed images have dimensions of pixels and are in the red–green–blue (RGB) format. We chose the -pixel dimensions for the images due to our goal of utilizing TinyML for end-to-end classification, which requires a minimal memory footprint. However, the segmentation process can generate images of any specified dimensions, as long as the resolution of the olive batch is sufficient to do so. In the classification task, we use grayscale versions of the dataset. This is due to that the classification task is primarily performed on the shape of the olive and not the color. Hence, we can decrease the memory footprint and the complexity of the CNN model.
3.2. Fruit Detection and Segmentation
The preparation of the dataset for the ML process includes using computer vision techniques to perform olive or object detection and segmentation. For precision agriculture, specifically in the context of olives, achieving high fidelity in segmentation directly corresponds to enhanced harvesting efficiency and enhanced ML results accuracy. Within this subsection, we elaborate on a technically rigorous methodological framework that we’ve devised for the detection and segmentation of olives from 2D digital imagery. We use traditional image processing algorithms that we sequentially employed to accurately differentiate olives even in the presence of background clutter or overlapping items.
- Original image: The image is loaded in its original form as shown in Figure 1a.
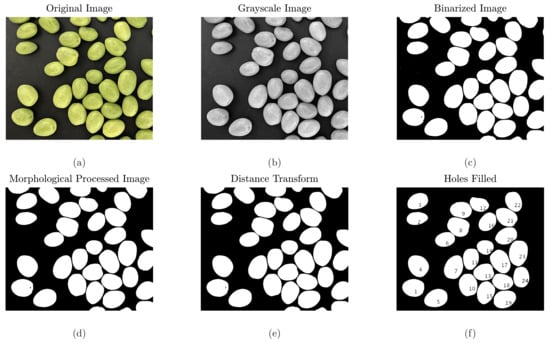 Figure 1. Computer-vision and image-processing steps visualization.
 - Grayscale conversion: The RGB image is converted to grayscale to simplify further processing. This process can be represented mathematically as:where and are the red, green, and blue channels of the image, respectively. The result of this process is shown in Figure 1b.
- Binarization: The grayscale image is binarized using Otsu’s method, which determines an optimal threshold by minimizing the intra-class variance. Let T be the threshold, then the binarized image can be given as:The result of this process is shown in Figure 1c–f.
- Morphological processing: The binary image undergoes morphological operations to remove small artifacts. In our proposed methodology, we harness the principles of connected-component labeling to segment distinct entities within a 2D binary image. Adopting an 8-connectivity criterion ensures a comprehensive evaluation of objects, even if their neighboring pixels are diagonally juxtaposed. Post segmentation, morphological attributes, such as the area and the eccentricity of each object were meticulously calculated. Eccentricity, which is symbolic of an object’s deviation from a perfect circular form, was employed as the pivotal metric for subsequent morphological filtering. Once the filtering phase was complete, the refined binary representation, encapsulating only those entities that conformed to our eccentricity criteria, was visualized and cataloged for subsequent processing and analysis. The result of this process is shown in Figure 1d.
- Watershed process: This process aims at segmenting objects that are close to each other. By applying the watershed algorithm, boundaries of neighboring objects can be identified, especially when they touch or overlap. This ensures that each object, in this case, each olive fruit, is distinctly segmented from the rest. The outcome of this step facilitates the successive processes and increases the accuracy of object classification. The result of this process is shown in Figure 1e.
- Boundary smoothing: This stage focuses on preserving the actual shape of the detected objects. Using methods like Gaussian smoothing, the jagged edges or noise present in the object boundaries are smoothed out. This results in masks that more accurately represent the original shape of the object, thus leading to improved results in further analyses. The result of this process is shown in Figure 1e.
- Distance transform, voids filling, and boundary object removal: In the subsequent stage of our image analysis, a Euclidean distance transform was applied to the complement of the binary image. This operation transformed the segmented regions into a scalar representation of their distance from the closest non-object boundary. To further refine this transformation, small artifacts, potentially resulting from noise or minor discrepancies in the initial segmentation, were removed through an area-based opening operation with a predefined threshold. Ensuring this refinement, any existing internal voids within the segmented objects were addressed using a hole-filling technique, ensuring the coherence and solidity of each segmented region. By this transformation, we ensure robust clarity and precision for the fruit boundaries within the processed image. The result of this process and the numbering of the detected olives is shown in Figure 1f.
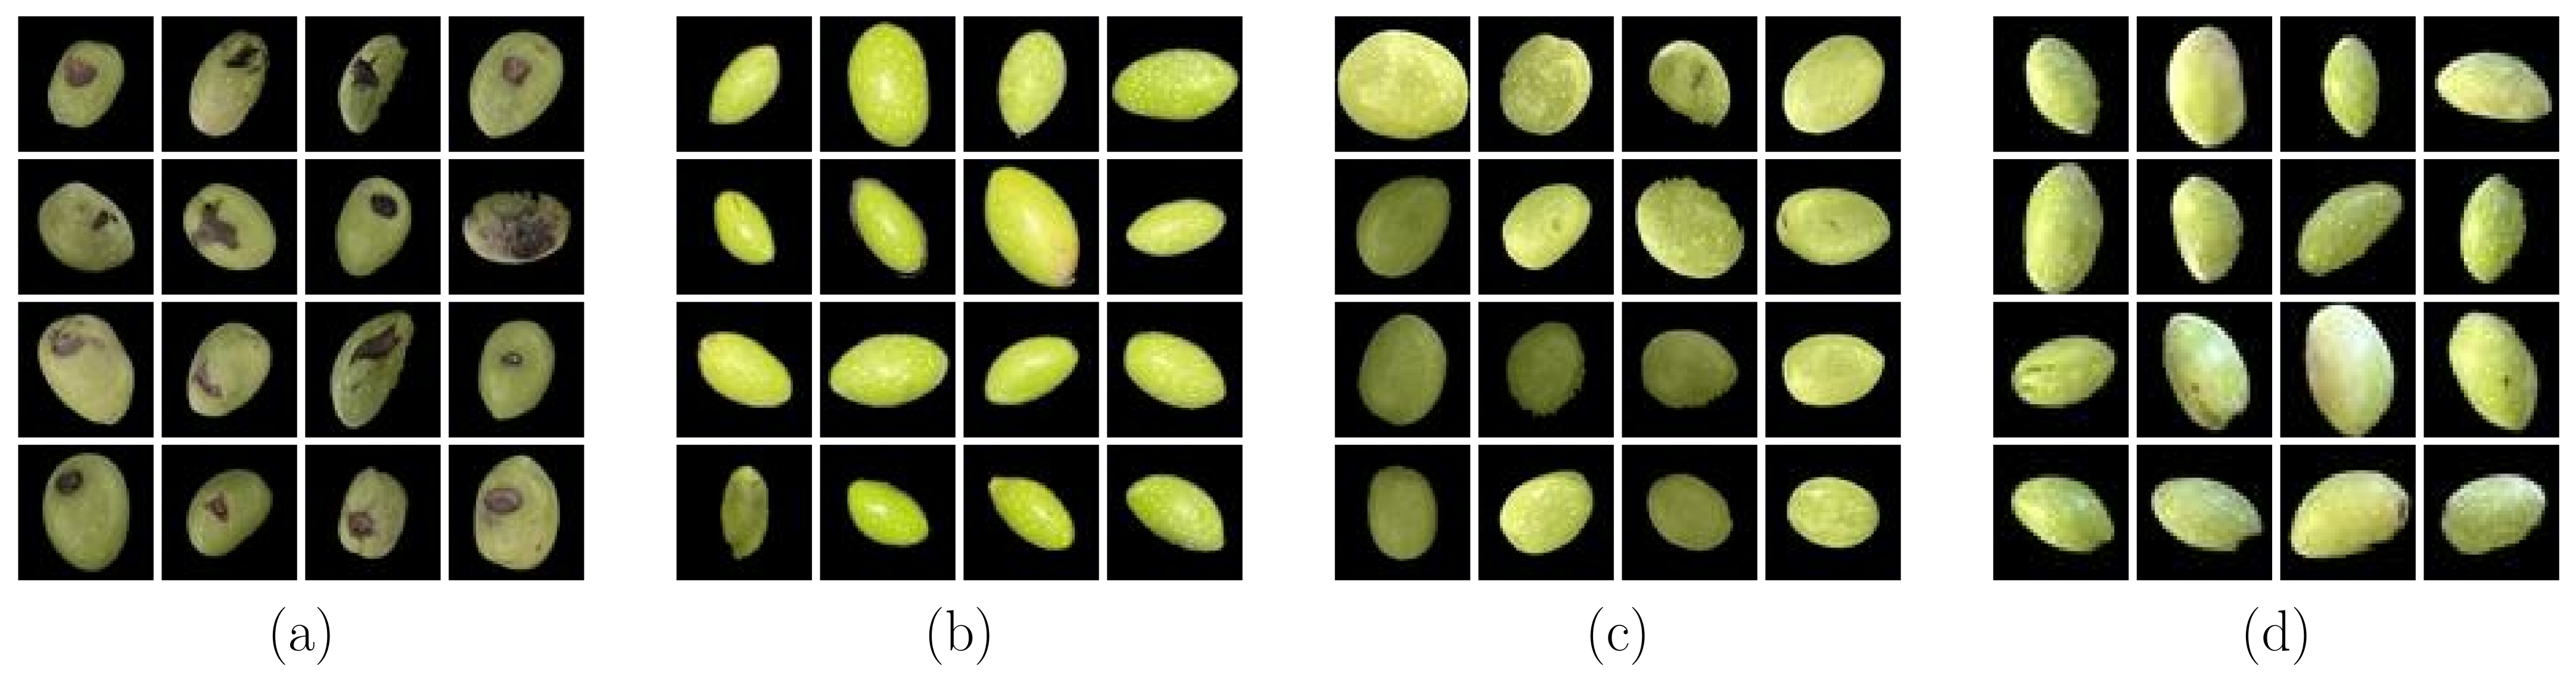
As can be seen from Figure 2, the olives are not all of the same size and hence the ML process may make generalizations based on the size of the object within the sample image. However, the size of the fruit is not usually the indicator of the variety class and may be an indication of the time of the harvesting only. Hence, following the application of the aforementioned image processing processes, we store each segmented olive into a distinct image file in preparation for the ML classification stage. However, to use a more rigorous ML classification method, we must verify that the results do not overfit due to biases in the gathered dataset. To that purpose, we employ a further dataset process through augmentation to increase the number of samples and create some visual variants.
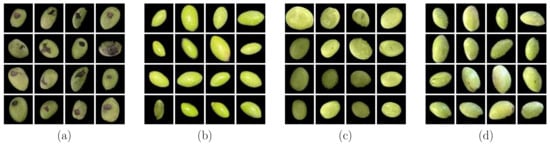
Figure 2.
Samples of the olive fruits from four different varieties. Each 16-image grid is for one of the varieties (three good-quality varieties and one bad-quality mixed varieties). (a) Bad quality, (b) Baladi, (c) Nabali, and (d) Romi.
In light of the above discussion on image segmentation, is noteworthy to mention that image segmentation is a sophisticated process. However, the segmentation is intended to deal with dataset preparation and not with inference. In industrial applications, it is customary to undertake mechanical separation of the olive fruits during the inference step, which allows for easier object detection algorithms to distinguish the olive fruit inside the image. For example, in industrial practical implementation, we may choose to opt out of the watershed algorithm if mechanical separations can be achieved.
As a final remark, in light of advancements in AI for image processing, it is worth considering AI-based alternatives to conventional morphological segmentation. U-Net, a neural network tailored for segmentation, stands out with its encoder–decoder design for precise pixel-wise segmentation [44]. Other models, like mask R-CNN, DeepLabV3+, and PSPNet also offer robust solutions [34,45,46]. While these models outperform traditional methods in accuracy and efficiency, they come with challenges for a low-cost pipeline. Their computational demands and the need for involved prepossessing to build the dataset for AI-based image segmentation might render them less feasible in resource-limited scenarios.
3.2.1. Dataset Augmentation
Data augmentation is a sophisticated process aimed at amplifying the cardinality and heterogeneity of datasets by artificially introducing transformed instances of existing samples. When dissected in the domain of image analytics, it entails the generation of varied visual perspectives of an image by employing a plethora of transformation techniques. These techniques serve to fabricate new images which, although derivative in nature, appear distinct from computational models, thus enriching the dataset. The primary intent behind leveraging image augmentation is twofold: to counteract the possible scarcity of certain visual manifestations within a dataset and to inhibit model overfitting by curbing any latent biases that might favor certain classes during the classification procedure.
This augmentation could manifest in diverse forms, ranging from altering an image’s spatial orientation (rotation) to inducing pixel-level shifts (both vertical and horizontal), rescaling, skewing perspectives, or even introducing flips. Such diverse transformations ensure that the model remains invariant to these alterations and can recognize the object of interest under various conditions. Table 1 offers a concise enumeration of the applied augmentation strategies, detailing the specific parameter ranges for each transformation. For illustrative purposes, Figure 1 showcases the outcome of this augmentation mechanism on a representative sample, underscoring the multifaceted visual adaptations of a singular olive fruit specimen.

Table 1.
Image augmentation parameters.
Table 1 reveals a meticulously calibrated range for each augmentation strategy, tailored to ensure the creation of a diverse yet relevant set of image derivatives. The rotation parameter, limited to a range of , introduces subtle angular variations that simulate real-world scenarios where the object of interest may not always be perfectly oriented. However, keeping the rotation within this bound ensures that the rotated images do not deviate too far from plausible real-world visuals. Similarly, the constraints on horizontal and vertical pixel shifts are intentionally set to a modest range of −10 to 10 pixels. This mimics the minor positional variations an object might exhibit in different images while ensuring that the central features of the object remain largely visible and recognizable. The scaling factor’s range from 0.8 to 1.2 implies that images can be either slightly reduced or enlarged. This mimics variations in object size or distance from the camera, imparting resilience to the model against size-based variations. The inclusion of both vertical and horizontal skewing introduces a level of geometric distortion, further challenging the model to recognize objects under non-standard perspectives. Finally, the provision for both vertical and horizontal flipping is particularly instrumental in equipping the model to identify mirrored instances of the objects, reinforcing its invariance to such transformations.
3.2.2. CNN Model Architecture
Given the complexities inherent in our image classification tasks, a CNN is ideally suited for our classification problem. CNNs capture the hierarchical patterns in data due to their depth, local connectivity, and transnational in-variance.
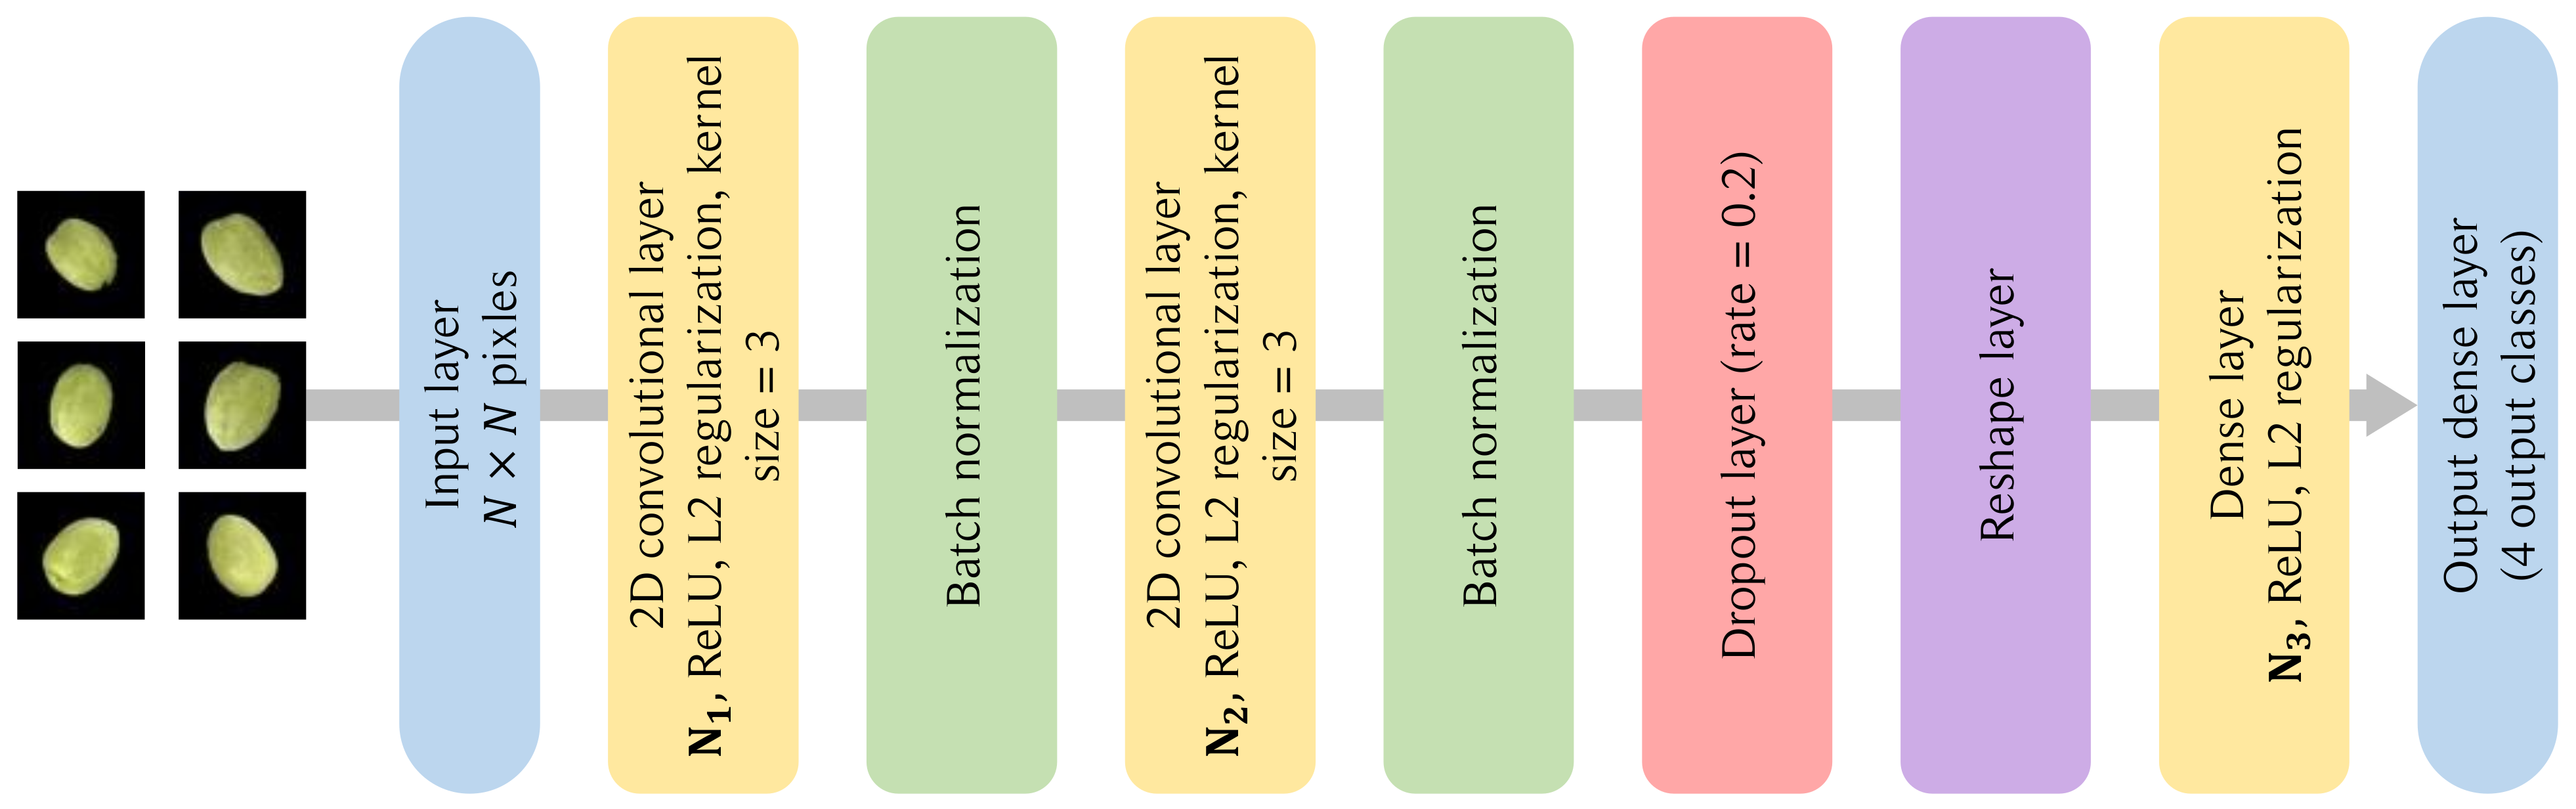
Model Overview: As depicted in Figure 3, the proposed model is built using a sequential architecture, meaning the output from one layer is inputted directly into the next, facilitating a clear flow of information.
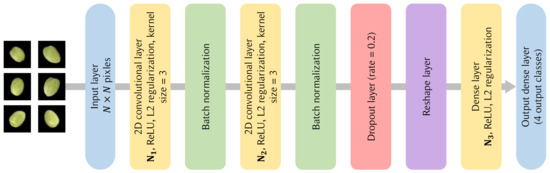
Figure 3.
CNN network architecture.
- Input layer: The model initiates with an input layer, denoted by the input_shape, which corresponds to the dimensions of our processed images.
- Conventional layer: The architecture incorporates two convolutional layers, each succeeded by a max-pooling layer. These convolutional layers employ filters of size , which are adept at detecting localized features in the image. The ReLU activation function introduces non-linearity, enabling the model to learn complex patterns. Regularization is achieved through regularization to prevent overfitting.
- Pooling layer: Subsequent to each convolutional layer, max-pooling layers of size are employed. These layers effectively down-sample the spatial dimensions while retaining the most salient features, thus enhancing computational efficiency and reducing the risk of overfitting.
- Dropout layer: After each pooling layer, dropout is applied with a rate specified by dropout_rate. Dropout is a regularization technique that randomly sets a fraction of input units to 0 at each update during training, which aids in preventing overfitting.
- Flatten layer: Post convolution and pooling, the matrix is flattened into a vector to prepare it for the fully connected layers.
- Dense layer: The flattened output is then passed through a dense layer, also known as a fully connected layer, with ReLU activation. Another regularization is applied here. The final dense layer uses a softmax activation to output the probability distribution over the classes, facilitating classification.
The model employs the Adam optimizer while the loss function used is the categorical cross-entropy, which is suitable for multi-class classification problems. Finally, we employ the accuracy metric to evaluate our ML model performance.
3.3. Performance Analysis
In this paper, we employ different types of quality assessment of the classification model; the well-known performance metrics are as follows:
where TP is the true positive rate, FP is the false positive, TN is the true negative, and FN is the false negative rate. C is the total number of classes. is a binary indicator if class label i is the correct classification for the observation and is the predicted probability that the observation belongs to class i. The reason behind using different performance metrics is to validate no over-fitting bias toward any of the classes due to unbalanced data and any type of outliers.
3.4. CNN with TinyML for Edge Devices
This section presents the ML operations (MLOps) of employing CNNs with TinyML, ensuring that the computational demands are met for the edge IoT devices. The main operations of the MLOps pipeline are quantization, conversion for compatibility with TinyML and the continuous monitoring of performance metrics directly on the edge. The operation of the MLOps pipeline can be summarized as follows:
Quantization: To make the model suitable for edge devices, quantization-aware training was implemented. Weights and activations were quantified from 32-bit floating points to 8-bit integers, using techniques like TensorFlow Lite’s post-training quantization. This quantization technique can be mathematically represented as follows:
where Q is the quantized value, uint8 is the rounding process from 32-bit floating points to 8-bit unsigned integers, r is the original floating-point number, S is the scale, and Z is the zero point. This equation is applied to the weights, activations, and biases in the model to convert them to an integer-only representation suitable for edge devices.
TinyML toolkit and model conversion: Post-quantization, the model was converted to a TensorFlow Lite flat buffer format using the TFLite converter. This compact model was then integrated with TinyML libraries, ensuring its compatibility with edge device MCUs. The TinyML toolkit also facilitated model optimization, adjusting operations for latency-critical applications on edge MCUs.
On-device inference and pipelining: Edge devices performed on-device inferences leveraging the optimized CNN model. Given the streaming nature of data capture, a pipelined approach was adopted. As raw images entered the system, they underwent on-the-fly preprocessing for real-time inference. The pipelined architecture ensured minimal latency, crucial for the rapid quality assessment of olives.
Model evaluation metrics on edge: To validate the deployed model’s performance, edge devices continuously reported metrics like -score, precision, recall, and accuracy. These metrics were monitored and then recorded to perform further analysis as will be shown in the results section.
3.5. Validation and Continuous Learning
Edge-based feasibility testing: Before full-scale deployment, we conducted rigorous feasibility testing directly on the edge devices. This testing phase was pivotal in assessing the compatibility of our models with the hardware constraints and real-world conditions of these devices. Memory footprint and inference rates were logged and analyzed. This evaluation provided us with a clear view of the models’ resource demands, enabling us to fine-tune them for optimal performance in the edge environment.
Edge inference metrics monitoring: Once deployed, we continuously tracked vital metrics to ensure robust performance. Beyond inference latency and throughput, specific attention was given to the memory footprint and the inference rate. Any anomalies or deviations from expected behavior were promptly flagged, ensuring the system remained responsive and efficient in real-time scenarios.
4. Results
This section provides a detailed evaluation of our model’s performance during both the training and TL stages, as well as the appraisal of the resource-constrained edge devices. In the initial training phase, the model is trained and tested on a powerful computing setup that includes an 11th generation Intel(R) Core(TM) i7-11800H CPU operating at a 2.30 GHz clock speed and supporting 8 cores, a substantial 16.0 GB of RAM, and an Nvidia RTX 3050 Ti graphics processing unit equipped with 4 GB of memory. For the inference stage, we utilize TinyML on ESP32-S3 MCU to emphasize the feasibility of TinyML computing for inference on the edge. The training parameters for this section are summarized in Table 2.
Table 2.
Training and edge inference parameters for the CNN structure.
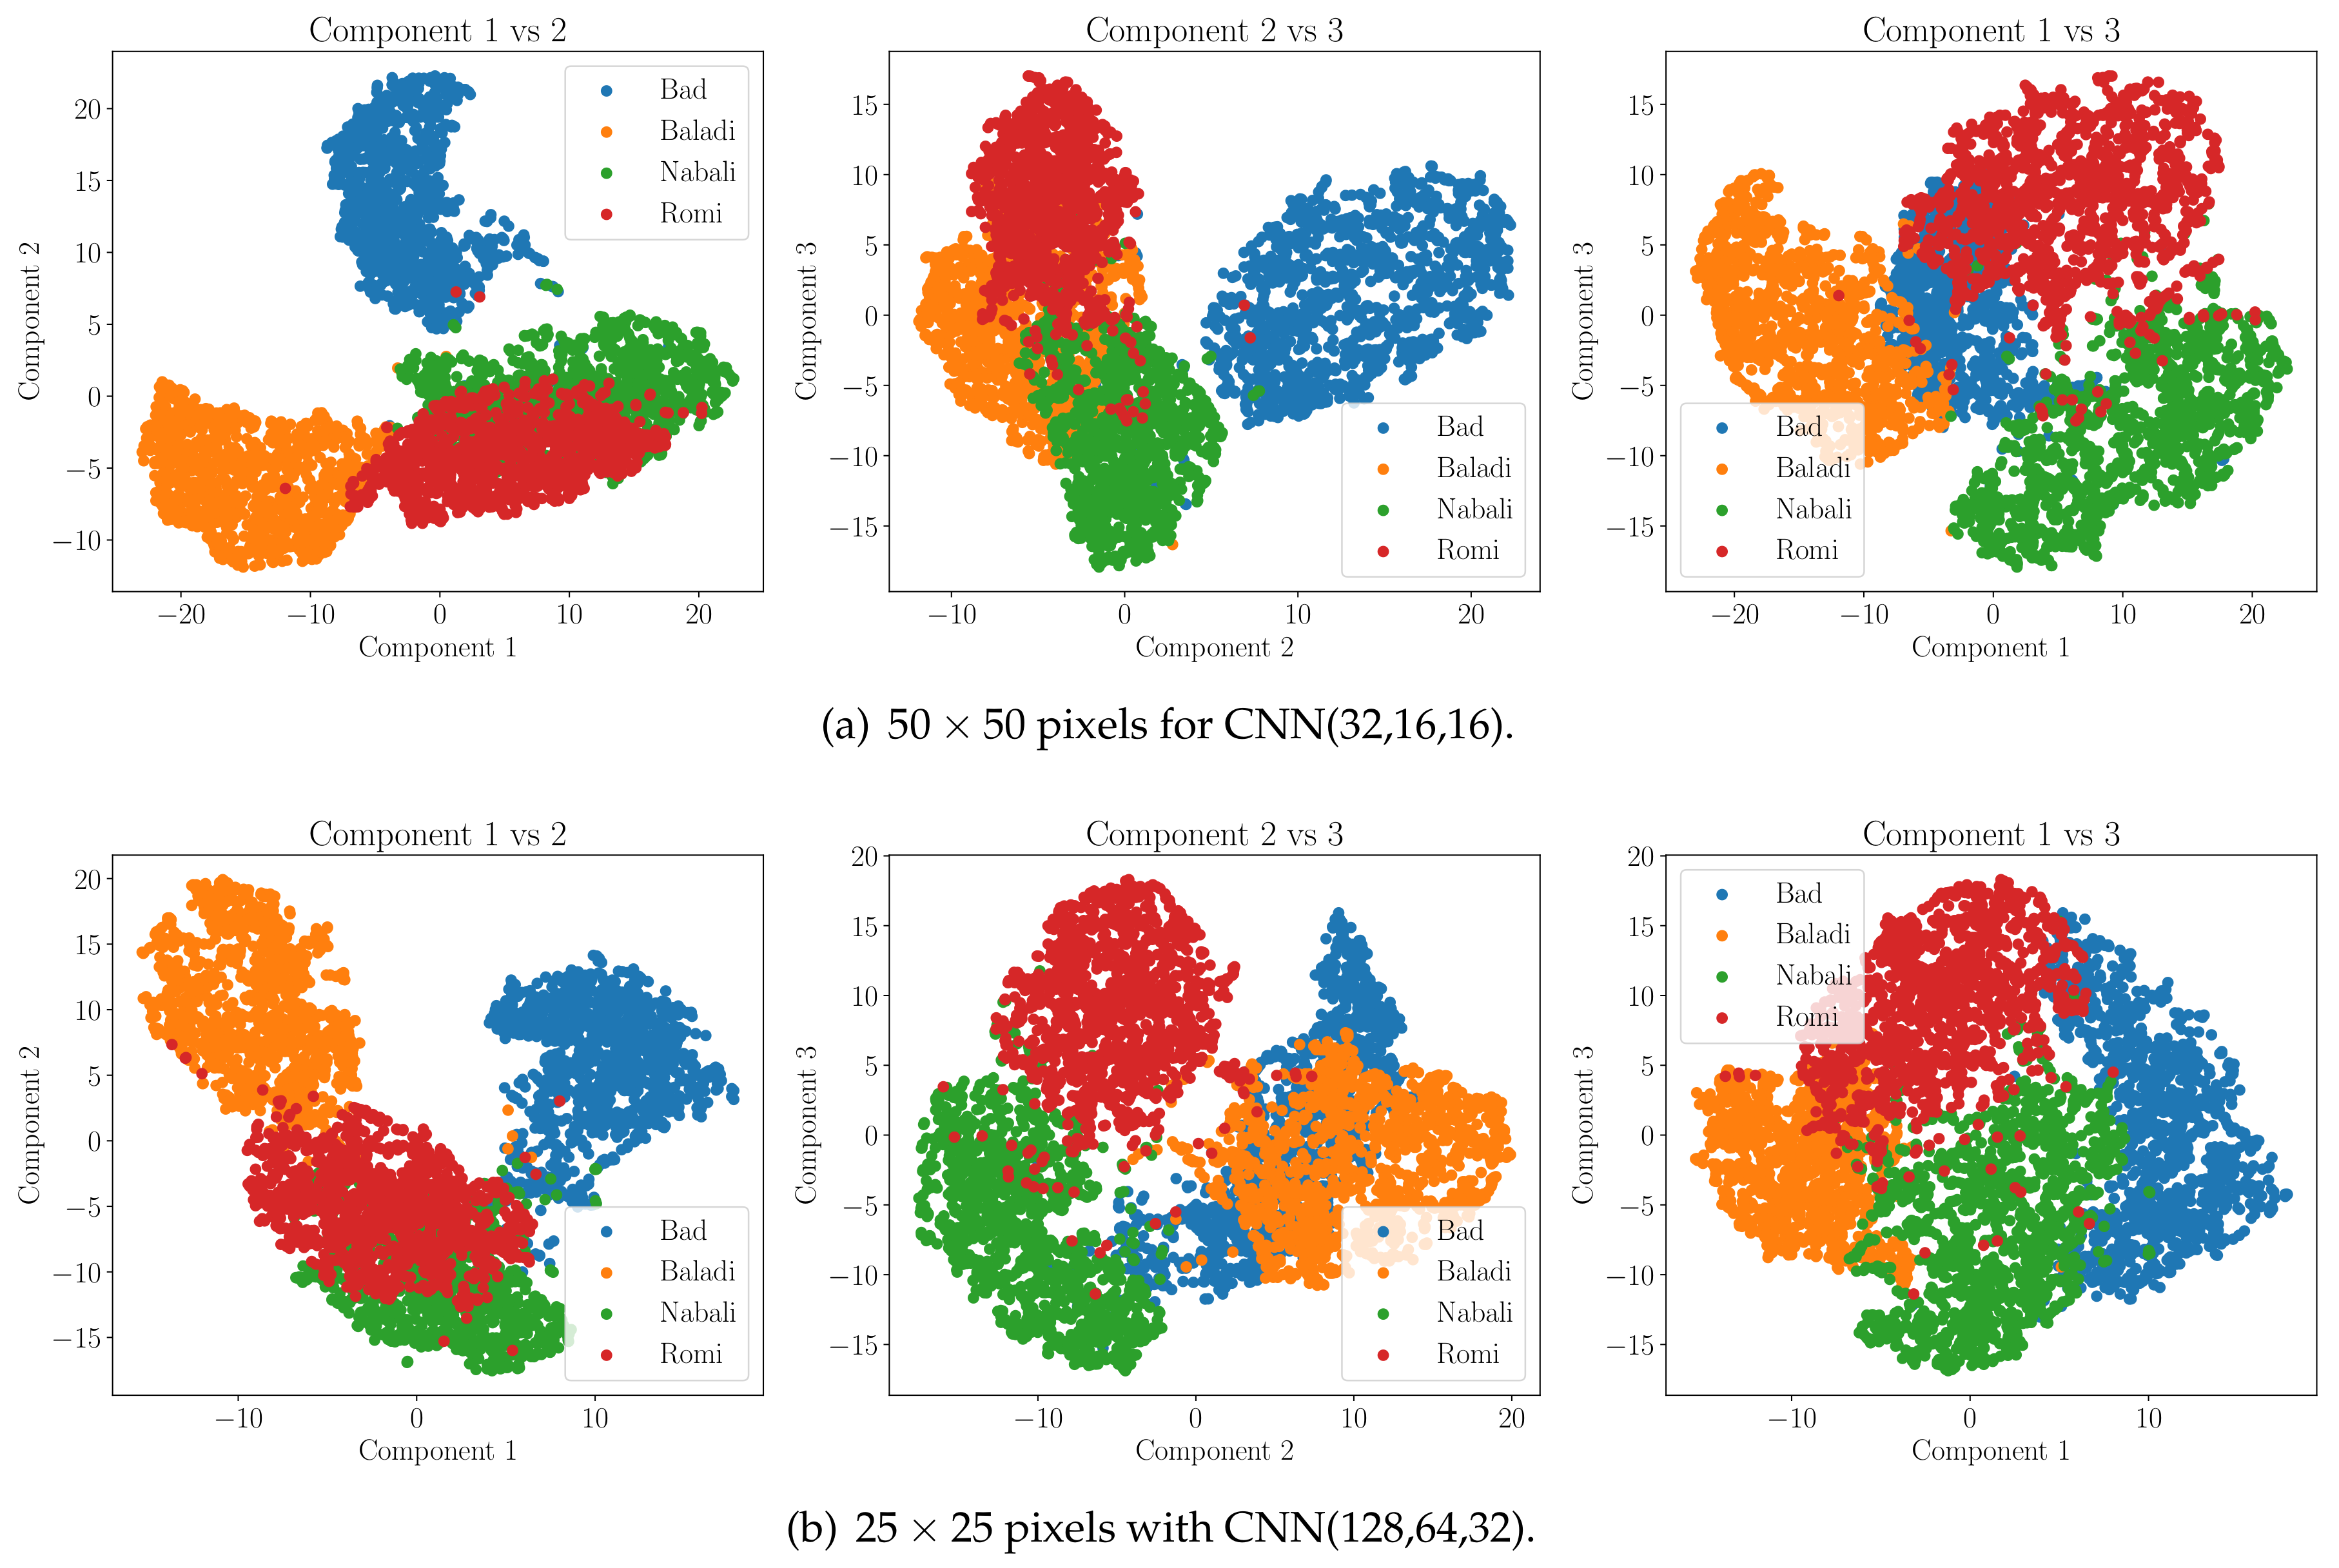
For a further step of evaluating the stability and strength of the chosen model, we employ the well-known dimensionality reduction technique, t-distributed stochastic neighbor embedding (t-SNE). The t-SNE here is used to visualize the last dense layer capabilities of the CNN ML model to distinguish between the target classes by plotting a map that shows in 3D space the separation between the studied classes. The shown sub-figures in Figure 4 give an illustration of the features of the last dense layer that can be visualized from 3D space into 2D space while maintaining a reasonable separation of the target classes. As also shown in Figure 4, we can obviously show that the employed CNN architecture can easily separate the various olive classes into different clusters. Here, it is worth mentioning that Figure 4 not only presents the model’s proficiency in differentiating the different fruit classes, but also that the model is capable of extracting the latent features of the classes. Hence, this adds an extra layer for ensuring that the model is not memorizing the the training data (i.e., no overfitting).

Figure 4.
T-SNE visualization demonstrating class distinction and classification efficacy of the CNN models. (a) T-SNE for CNN model of input image and model architecture CNN(32,16,16) and (b) T-SNE for CNN model of input image and model architecture CNN(128,64,32).
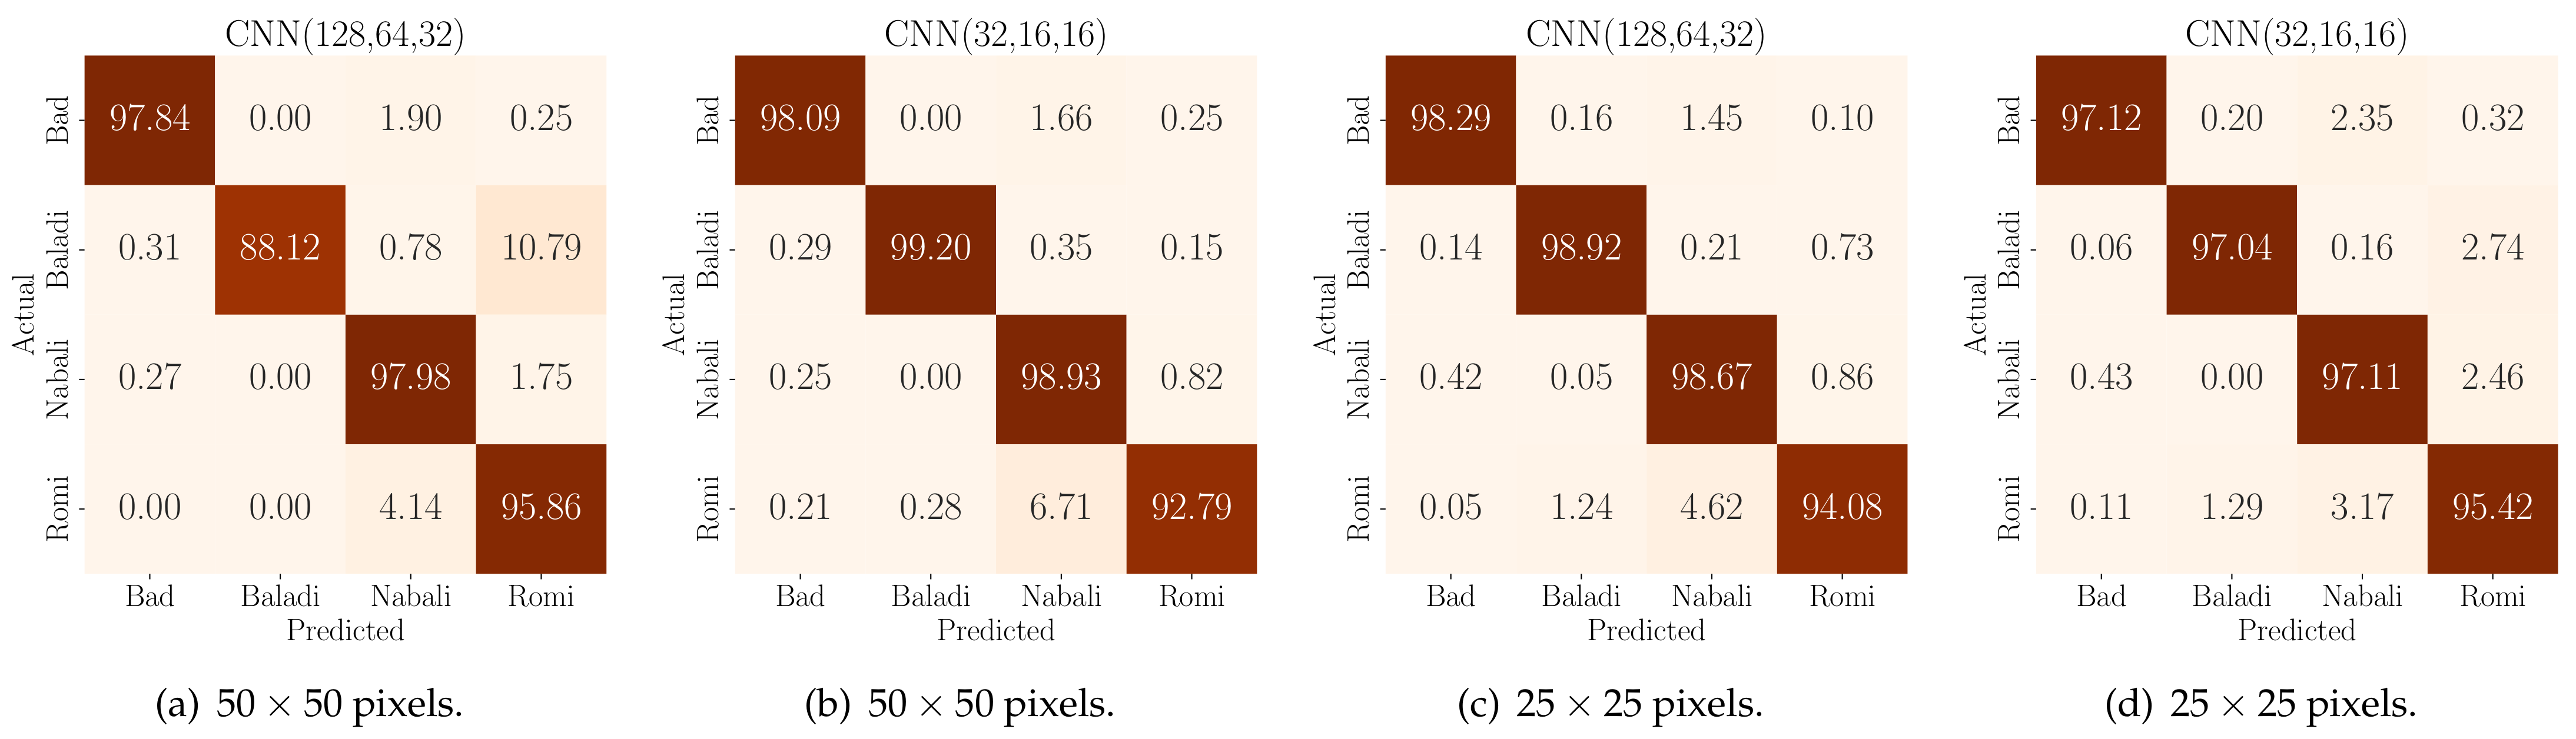
The solidity and robustness of a classification model are discerned not just by its accuracy, precision, or recall, but also from the distribution of its true and false predictions across different categories. In the domain of olive fruit classification, understanding these predictions becomes vital when classifying based on both quality and variety. For the pixels configuration, the confusion matrix exhibited in Figure 5 exhibits a clear diagonal trend for both quality and variety classification tasks, indicating a high rate of correct predictions. There were minimal misclassifications, suggesting that the features extracted from this image size are distinctive and suitable for the classification tasks. The pixels configuration, despite its reduced resolution, shows a similar trend in its confusion matrix. This is remarkable as the reduction in image size and resolution often impacts the feature quality.
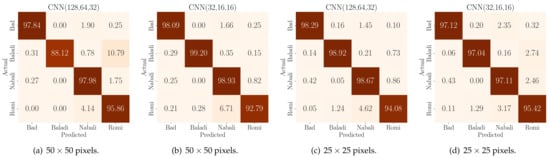
Figure 5.
Confusion matrices for various CNN architecture for two distinct image resolutions.
When comparing the two input settings in Figure 5, we can easily conclude that the reduction of the input image resolution to some extent does not seriously affect the model’s performance metrics. However, it adds another degree of freedom in designing and building the classification model for deployment for low-cost constrained edge IoT devices. That is, when optimizing the model hyperparameters, we can choose between different scenarios and settings that are suitable to the available device constraints. Therefore, the results from the confusion matrices validate the model’s robustness and also guide the model optimization process for practical deployment in real-world farming settings. Another insight that can be drawn from the confusion matrices is the olive fruit quality classification. That is, while our primary model involved multi-class classification for quality and variety classification, these matrices can also be interpreted to measure the performance of the binary classification with regard to olive health and quality. Such a binary classification perspective might offer advantages, including a reduced model size for the CNN and an enhanced inference rate.
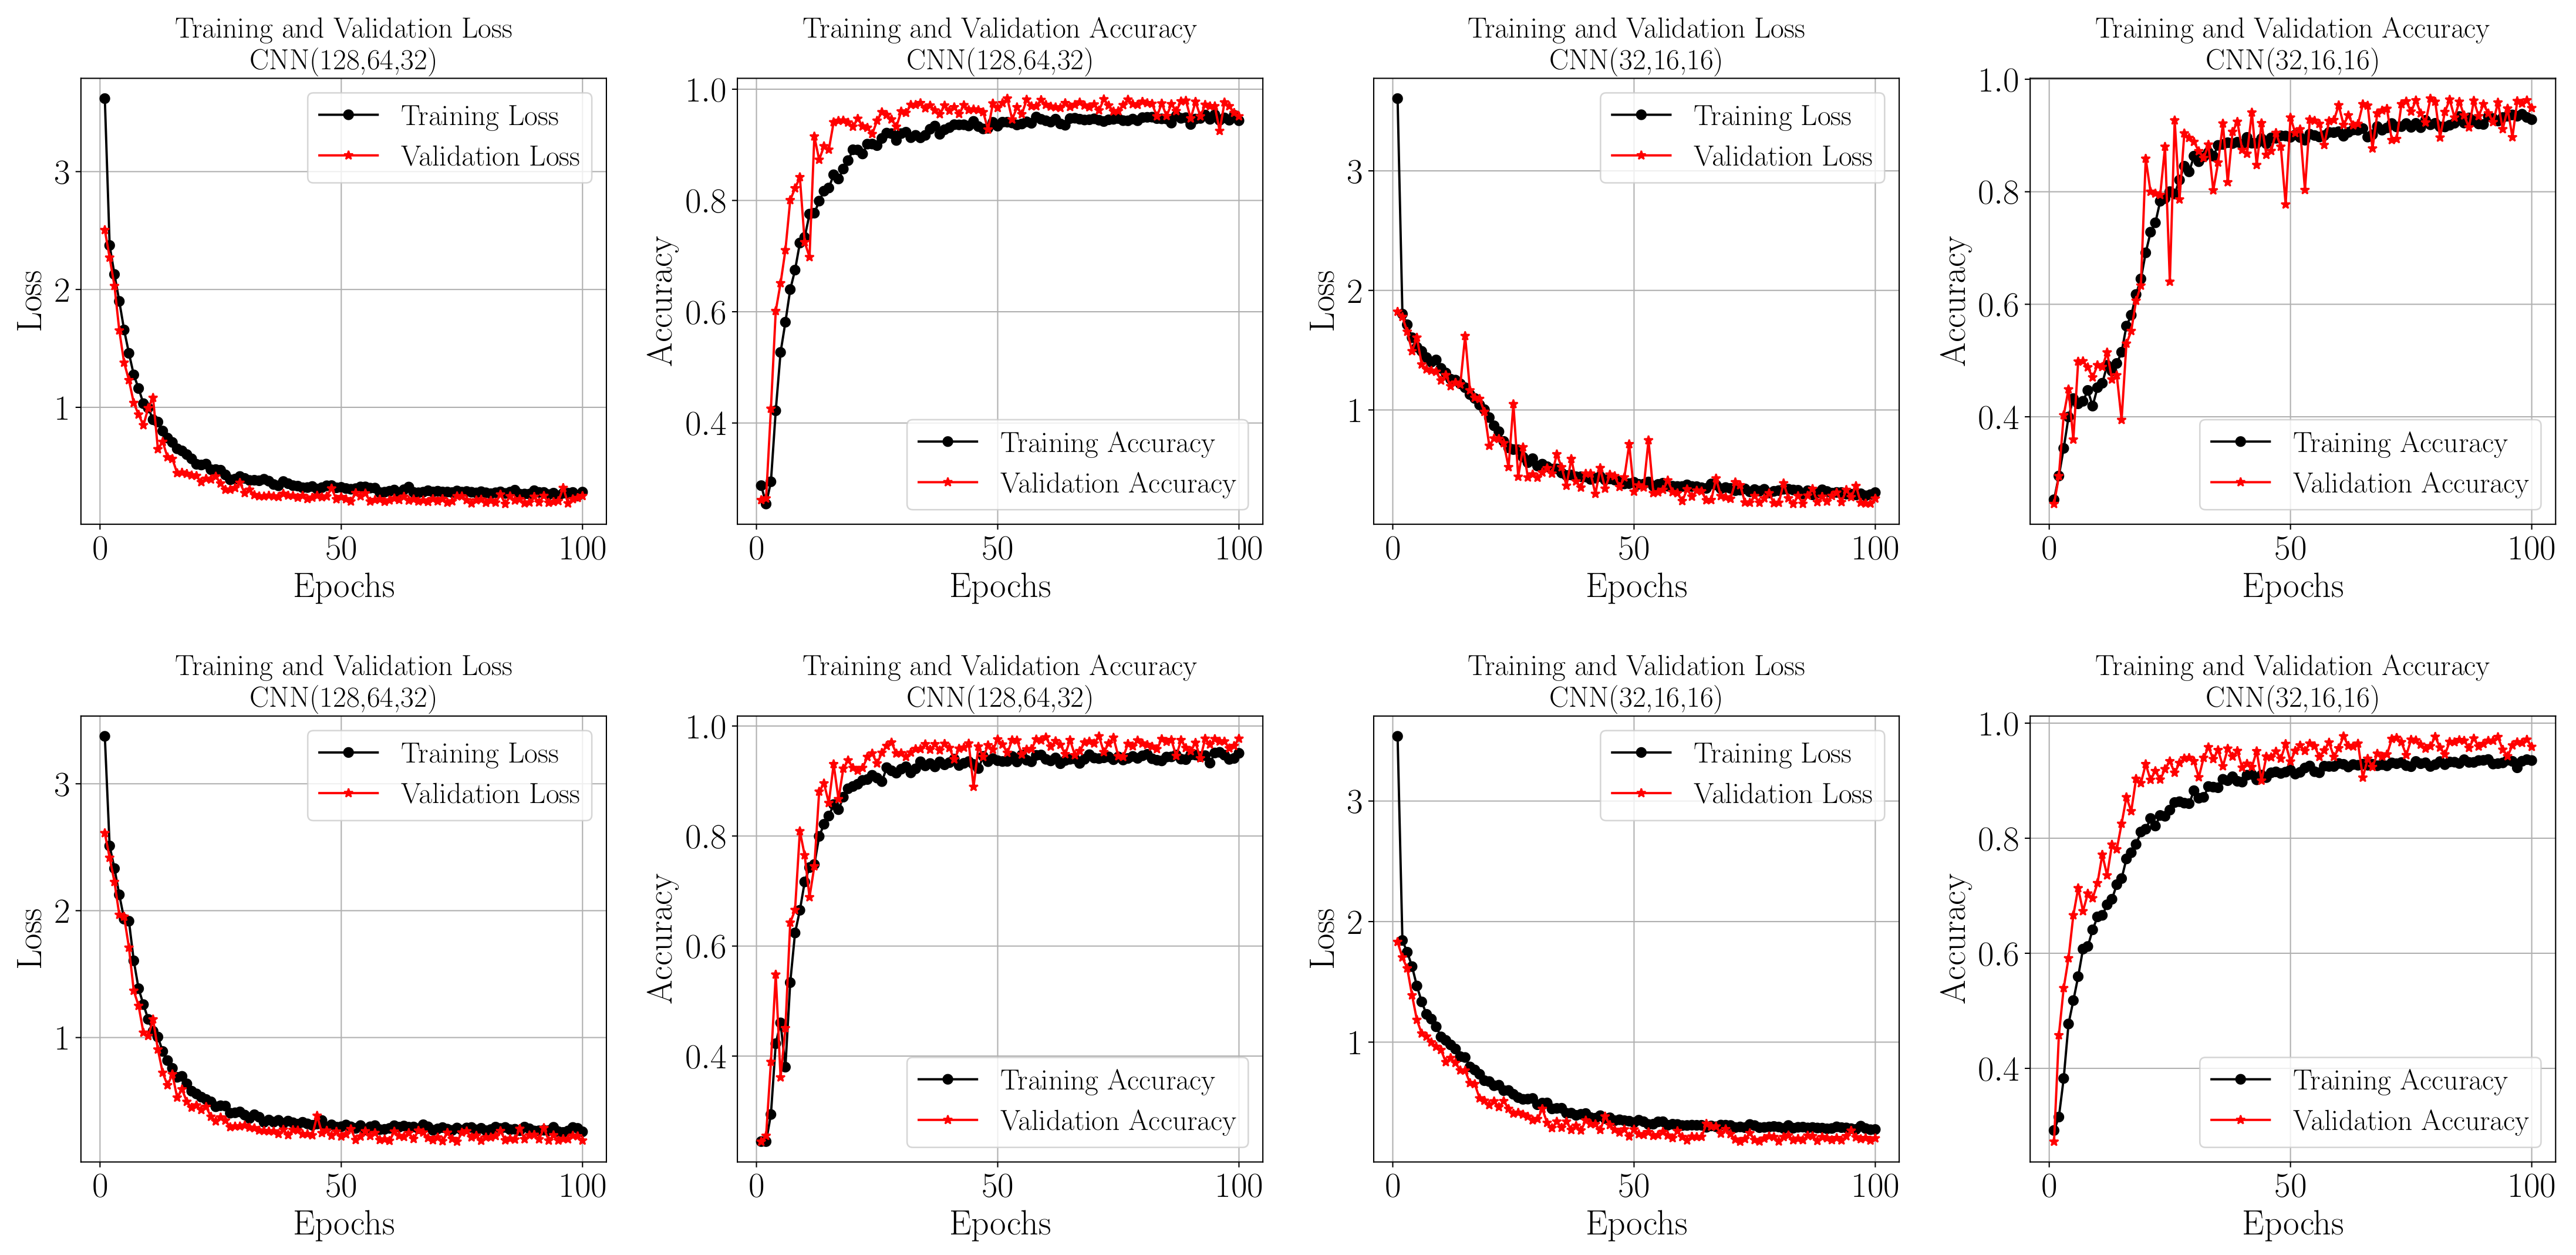
In Figure 6, the loss and accuracy curves for the four different CNN configurations are presented, each subjected to training for a duration of 100 epochs with batch sizes comprising 64 images. Two distinct input image dimensions, (Top sub-figures) and (bottom sub-figures), have been used across the configurations. Notably, the augmentation techniques applied during pre-processing have imparted certain peculiarities to the training outcomes. It can be observed that, for both image sizes and across all CNN configurations, the validation accuracy tends to slightly surpass the training accuracy. This indicates that the models, perhaps due to the augmentation, are effectively generalizing without over-fitting. Similarly, the validation loss is slightly lower than the training loss, a behavior that further validates the robustness of the training process and the effectiveness of the augmentation in creating a diverse and representative dataset.
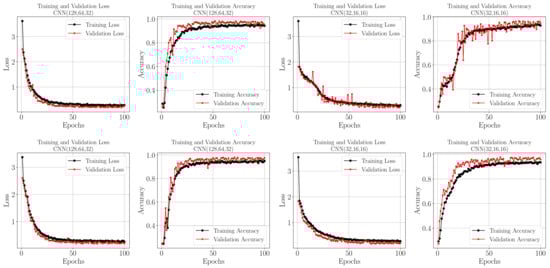
Figure 6.
Loss and accuracy curves for the training and validation datasets. The top row for pixels and the bottom for for samples of the tested CNN architectures.
Figure 6 provides crucial insight into the model’s training key performance measures, as well as extra evidence of the model’s capabilities of classification with high accuracy and low loss on unseen datasets, ensuring the models are not overfitting. The trends observed in these curves are indicative of the models’ ability to generalize effectively, a key characteristic of a robust ML model. This is particularly significant as it demonstrates that the models are not overfitting to the training data, but rather learning and adapting in a way that translates well to real-world scenarios.
To assess the quality of the employed CNN architectures amongst different olive fruit image resolutions. We performed a set of different training and testing procedures and listed the results in Table 3. Upon analyzing the data presented in Table 3, several insightful observations can be made and can be summarized as follows: Firstly, the results affirm the viability of utilizing CNN architectures with varying complexities for olive fruit classification. This is particularly evident when considering reduced model sizes and input dimensions. Moreover, all tested architectures demonstrate high performance, not just in traditional testing scenarios but also when deployed using TinyML. This consistency underscores the robustness of the model across diverse computational settings.
Table 3.
Performance and footprint analysis of TinyML-based CNN classifiers for the olive fruit.
Interestingly, there is a noticeable trade-off between the model size and the performance. For example, the model CNN(32,16,16)’ for a image size is much smaller (41.3 kilobytes) compared to CNN(128,64,32)’ (332.3 kilobytes). Despite its smaller size, the former’s performance in terms of accuracy, recall, precision, and score is remarkably competitive. Furthermore, reducing the image size to pixels results in a further decrease in model size, yet without a significant drop in performance metrics. This characteristic is particularly beneficial for devices with limited computational capacity and storage, typical of edge devices.
A notable point in our observations is the ‘Stack overflow’ issue, which was encountered only by the most complex architecture for the image size for only the CNN(128,64,32). This suggests that beyond a certain level of model complexity, deployment on the ESP32-S3—and more generally on edge devices—may require additional optimizations. Lastly, the results in Table 3 reveal that the inference rate, measured in Hz, is inversely proportional to the model’s size and complexity. Simpler architectures, especially those designed for smaller image sizes, achieve faster inference rates, which are crucial for real-time applications and fast fruit-sorting and classification. This finding is vital for practical implementations where speed and efficiency are paramount. Further discussion on the practical implications and observations can be found in the practical implementations section of the discussion.
5. Discussions
The results of our study open up a new horizon in the application of TinyML for smart agriculture, specifically in the domain of fruit classification. Here, we discuss the implications of our solution. We address the innovative integration of TinyML in edge computing and the potential impact on sustainable agricultural practices. We also detail the inherent challenges in deploying advanced ML models on edge devices, particularly in resource-constrained settings. In the following subsections, we explore each of these aspects in depth, offering insights into the practical applications.
5.1. Comparative Performance Analysis with Previous Studies
As aforementioned, this paper addresses the idea of olive fruit variety classification using CNN models and TinyML for low-cost edge implementations, which stands as the novelty of our work. However, while previous works have addressed similar classification tasks, there are notable distinctions. Primarily, the olive fruit varieties examined in this paper are different, rendering a direct comparison of performance metrics with previous works less relevant, especially with the absence of publicly available datasets. However, comparing the results that we achieved in this paper can be made with the results shown in [29], as they utilize CNN models. The results in [29] show that a top accuracy of can be achieved by utilizing inception ResNetV2 architecture for TL. The key difference here between our top accuracy model and an accuracy of is in the model complexity. Our models are less complex than the CNN ResNetV2 architecture used in [29], making them more suitable for compression and deployment on low-cost, constrained edge IoT devices. It is important to note that while our models are simpler, they do not compromise the accuracy or effectiveness of the classification, ensuring a fair comparison of results within the constraints of our implementation objectives.
Another aspect of comparing the performance of the model presented in this paper involves examining the image segmentation process. While we employed a conventional morphological segmentation approach, it is noteworthy that more advanced object detection and segmentation methods using DL can also be utilized, particularly when computational resources permit. However, the segmentation process employed in this study primarily serves the purpose of preparing the dataset, under the assumption that the classification task using the CNN models is directly performed on individual olive fruit images and hence simple is better, especially on resource constrained settings. These images are obtained with the assistance of mechanical separation as part of the end-to-end solution to prepare for single olive fruit images. The state-of-the-art models include YOLOv7 [47], known for its exceptional object detection capabilities, and YOLOv8 [48], which offers enhanced object detection and image segmentation features. Additionally, DINOv2, a self-supervised training method for computer vision models, represents another significant advancement in this field [49]. However, the segmentation process utilized in this study is primarily aimed at dataset preparation, assuming that the classification task using the CNN models is executed directly on individual olive fruit images. Furthermore, this paper introduces an end-to-end solution for edge devices, where internet connectivity to any cloud service for classification and segmentation tasks is not necessary and may not be available. In conclusion, the segmentation process that we utilized in this paper is sufficient and simple but utilizing more advanced segmentation techniques can be integrated in the framework if a new dataset collection is required with minimal pre-processing and annotation efforts.
5.2. Practical Implications for Edge Real-World Implementation
In order to provide a holistic overview of the end-to-end solution for employing TinyML on fruit image classification, we analyze the computational aspects encompassing various dimensions of model development and deployment. Specifically, we focus on:
- Model selection for deployment: Opting for an architecture is a game of balance. For instance, while the CNN(128,64,32) for the image size showcases superior traditional test results, its large model size (332.3 kilobytes) and arena requirement (368.6 kilobytes) combined with a ‘Stack overflow’ issue make it unsuitable for deployment on the ESP32-S3. Instead, architectures like CNN(32,16,16) for both and image sizes, with their smaller footprint and no stack overflow issues, seem a more practical choice for edge deployment. These results emphasize the need to optimize the model hyperparameters and architectures to adapt to the available resources. Hence, based on the available edge resources, we need to optimize the input image resolution, the CNN model architecture, and the available memory of the edge device to ensure seamless integration while achieving the required olive fruit variety classification accuracy.
- Optimization techniques in TensorFlow Lite: TensorFlow Lite provides several optimization methods such as full integer quantization, which could further reduce the model size. For instance, the fact that ‘Model and input unsigned integers of 8 bits (uint8) quantization’ was employed and yielded good results implies that even higher quantization might be explored, leveraging TensorFlow Lite’s capabilities to achieve smaller models without significantly compromising accuracy. It is important to note that, given the nature of the RGB images of olives and their grayscale conversion, representing pixel intensity with numbers in the 0–255 range makes quantization using uint8 suitable for input to the CNN model without significantly degrading accuracy. However, quantizing the model’s weights contributes most prominently to the difference from representations using 32-bit floating points. Consequently, while the model’s memory footprint is reduced, the impact on accuracy is minimal.
- Memory management: The ‘Min Arena size’, which refers to the allocated memory for the tensors in the CNN model to run on the memory of the edge MCU (i.e., for this paper ESP32-S3), is a direct indication of the dynamic memory TensorFlow Lite needs to run the inference. Keeping the arena size minimal, as in the case of CNN(32,16,16) for a image size (22.33 kilobytes), ensures that the model runs efficiently without running out of memory, especially critical for devices with strict memory constraints.
- Real-time decision-making: The inference rate is paramount for real-time applications. As evident, simpler architectures with smaller image sizes, like CNN(32,16,16) for , can achieve rates as high as 55.56 Hz. This rapid processing allows for real-time decisions in an industrial setup, where olive fruits can be sorted or classified at high speeds. High real-time inference rates are typically sought after, but they become particularly beneficial in the classification of olive fruit quality as “good” or “bad”. To accurately assess the quality of an olive fruit, multiple views of the fruit are needed to ensure that defects are not concealed on its unseen sides. This demands rapid classification speeds. On the other hand, when classifying the variety of the olive, capturing just one side of the fruit is sufficient, as the primary determinant is its shape.
- Model simplification: To further reduce the model footprint on the ultra-low-cost MCUs, more model compression and size reduction techniques such as model pruning can be employed. Model pruning allows the model to skip some of the model weights that are relatively close to zero and thus remove the connection between the CNN nodes. This allows for less computational time and hence improves the real-time efficiency of the system. This could be useful, especially for architectures that currently experience stack overflow issues on the edge MCUs due to the inability to allocate the memory for the model tensors.
6. Conclusions
In this article, we developed a comprehensive end-to-end framework to evaluate the effectiveness of TinyML using various CNN architectures on edge devices targeting agricultural applications. Our approach involved extensive data acquisition and morphological image segmentation techniques to build a robust dataset for training and validating the ML model. We then applied image classification techniques for predicting the class and quality of olive fruits, demonstrating the practical application of our framework for edge inference in computationally constrained farming settings.
We successfully illustrated the training of the CNN by ensuring no ML model bias and overfitting, followed by its efficient transfer to edge devices using advanced ML model compression and porting tools. We conducted a detailed analysis of inference metrics on edge devices, including inference time, accuracy, and memory footprint across multiple CNN models. This analysis revealed how variations in CNN model hyperparameters influence performance in terms of inference time and accuracy on edge MCUs. Our findings show that, even in resource-constrained settings, an accuracy ranging from to is feasible, demonstrating better or similar accuracy when compared to the in [29] and in [38], as presented in previous studies with full computational resources. By achieving similar or superior accuracy in resource-limited settings, our study paves the way for the broader adoption of ML technologies in smart agriculture in a scalable manner. This expands the potential applications of ML in agriculture and demonstrates how advanced technologies can be adapted to fit the varying needs and limitations of different farming environments.
For future work, several directions can be addressed. More olive fruit varieties might be added to the dataset. This is important because adding additional olive varieties may necessitate more complicated CNN architectures, which may be challenging to implement on edge devices. More model compression techniques, like model pruning, knowledge distillation, and low-rank factorization, which promise more improvements, can also be used to improve the model’s performance on edge devices. Another approach is to use TL to capitalize on the benefits of pre-trained models, such as ResNet or VGG. This might increase the CNN model’s efficiency, especially in situations when the dataset is restricted. Thus, in conclusion, this study has demonstrated the practical feasibility of a novel framework that harnesses TinyML for the classification of olive fruits on edge devices. This innovative approach not only marks a significant step forward in smart agriculture, specifically in the context of olive fruit processing, but also lays the groundwork for expanding and adapting this technology to a wider range of applications within the agricultural sector and beyond.
Author Contributions
Conceptualization, A.M.H., S.B. and E.A.; methodology, A.M.H.; software, A.M.H.; validation, A.M.H., S.B. and E.A.; formal analysis, A.M.H.; investigation, A.M.H.; resources, A.M.H.; data curation, A.M.H.; writing—original draft preparation, A.M.H.; writing—review and editing, S.B., E.A. and A.M.H.; visualization, A.M.H. and M.A.; supervision, A.M.H.; project administration, A.M.H. All authors have read and agreed to the published version of the manuscript.
Funding
This work was supported in part by the Royal Academy, UK through the Distinguished International Associates under Grant DIA-2021-18.
Data Availability Statement
The data presented in this study are available on request from the corresponding author.
Acknowledgments
We extend our sincere gratitude to Mohammad A. Hayajneh and Noha R. Alomari for their invaluable assistance in data collection and the meticulous sorting of the olive fruits. Their expertise and dedication played a pivotal role in the accuracy and reliability of the dataset used in this study.
Conflicts of Interest
The authors declare no conflict of interest.
References
- Expert Market Research. Global Olive Market Size, Share, Growth, Forecast. Available online: https://www.expertmarketresearch.com/reports/olive-market (accessed on 24 September 2023).
- International Olive Council. The World of Olive Oil. Available online: https://www.internationaloliveoil.org/the-world-of-olive-oil/ (accessed on 24 September 2023).
- Al Hiary, M.; Dhehibi, B.; Kassam, S. Market study and marketing strategy for olive and olive oil sector in the southern arid part of Jordan. J. Agric. Sci. Technol. 2019, 21, 1065–1077. [Google Scholar]
- Dong, L. Toward resilient agriculture value chains: Challenges and opportunities. Prod. Oper. Manag. 2021, 30, 666–675. [Google Scholar] [CrossRef]
- Xu, X.; Lu, Y.; Vogel-Heuser, B.; Wang, L. Industry 4.0 and Industry 5.0—Inception, conception and perception. J. Manuf. Syst. 2021, 61, 530–535. [Google Scholar] [CrossRef]
- Leng, J.; Sha, W.; Wang, B.; Zheng, P.; Zhuang, C.; Liu, Q.; Wuest, T.; Mourtzis, D.; Wang, L. Industry 5.0: Prospect and retrospect. J. Manuf. Syst. 2022, 65, 279–295. [Google Scholar] [CrossRef]
- Lee, J.; Davari, H.; Singh, J.; Pandhare, V. Industrial Artificial Intelligence for industry 4.0-based manufacturing systems. Manuf. Lett. 2018, 18, 20–23. [Google Scholar] [CrossRef]
- Ribeiro, J.; Lima, R.; Eckhardt, T.; Paiva, S. Robotic process automation and artificial intelligence in industry 4.0—A literature review. Procedia Comput. Sci. 2021, 181, 51–58. [Google Scholar] [CrossRef]
- Mhlanga, D. Artificial intelligence in the industry 4.0, and its impact on poverty, innovation, infrastructure development, and the sustainable development goals: Lessons from emerging economies? Sustainability 2021, 13, 5788. [Google Scholar] [CrossRef]
- Cioffi, R.; Travaglioni, M.; Piscitelli, G.; Petrillo, A.; De Felice, F. Artificial intelligence and machine learning applications in smart production: Progress, trends, and directions. Sustainability 2020, 12, 492. [Google Scholar] [CrossRef]
- Sharif, M.; Khan, M.A.; Iqbal, Z.; Azam, M.F.; Lali, M.I.U.; Javed, M.Y. Detection and classification of citrus diseases in agriculture based on optimized weighted segmentation and feature selection. Comput. Electron. Agric. 2018, 150, 220–234. [Google Scholar] [CrossRef]
- Tang, Z.; Yang, J.; Li, Z.; Qi, F. Grape disease image classification based on lightweight convolution neural networks and channelwise attention. Comput. Electron. Agric. 2020, 178, 105735. [Google Scholar] [CrossRef]
- Kamilaris, A.; Prenafeta-Boldú, F.X. A review of the use of convolutional neural networks in agriculture. J. Agric. Sci. 2018, 156, 312–322. [Google Scholar] [CrossRef]
- Horng, G.J.; Liu, M.X.; Chen, C.C. The smart image recognition mechanism for crop harvesting system in intelligent agriculture. IEEE Sensors J. 2019, 20, 2766–2781. [Google Scholar] [CrossRef]
- Zheng, Y.Y.; Kong, J.L.; Jin, X.B.; Wang, X.Y.; Su, T.L.; Zuo, M. CropDeep: The crop vision dataset for deep-learning-based classification and detection in precision agriculture. Sensors 2019, 19, 1058. [Google Scholar] [CrossRef] [PubMed]
- Paymode, A.S.; Malode, V.B. Transfer Learning for Multi-Crop Leaf Disease Image Classification using Convolutional Neural Network VGG. Artif. Intell. Agric. 2022, 6, 23–33. [Google Scholar] [CrossRef]
- Loddo, A.; Loddo, M.; Di Ruberto, C. A novel deep learning based approach for seed image classification and retrieval. Comput. Electron. Agric. 2021, 187, 106269. [Google Scholar] [CrossRef]
- Albanese, A.; Nardello, M.; Brunelli, D. Automated pest detection with DNN on the edge for precision agriculture. IEEE J. Emerg. Sel. Top. Circuits Syst. 2021, 11, 458–467. [Google Scholar] [CrossRef]
- Sujatha, R.; Chatterjee, J.M.; Jhanjhi, N.; Brohi, S.N. Performance of deep learning vs. machine learning in plant leaf disease detection. Microprocess. Microsyst. 2021, 80, 103615. [Google Scholar] [CrossRef]
- Sharma, A.; Jain, A.; Gupta, P.; Chowdary, V. Machine learning applications for precision agriculture: A comprehensive review. IEEE Access 2020, 9, 4843–4873. [Google Scholar] [CrossRef]
- Chlingaryan, A.; Sukkarieh, S.; Whelan, B. Machine learning approaches for crop yield prediction and nitrogen status estimation in precision agriculture: A review. Comput. Electron. Agric. 2018, 151, 61–69. [Google Scholar] [CrossRef]
- Coulibaly, S.; Kamsu-Foguem, B.; Kamissoko, D.; Traore, D. Deep neural networks with transfer learning in millet crop images. Comput. Ind. 2019, 108, 115–120. [Google Scholar] [CrossRef]
- Behera, S.K.; Rath, A.K.; Sethy, P.K. Maturity status classification of papaya fruits based on machine learning and transfer learning approach. Inf. Process. Agric. 2021, 8, 244–250. [Google Scholar] [CrossRef]
- Shahi, T.B.; Sitaula, C.; Neupane, A.; Guo, W. Fruit classification using attention-based MobileNetV2 for industrial applications. PLoS ONE 2022, 17, e0264586. [Google Scholar] [CrossRef] [PubMed]
- Altaheri, H.; Alsulaiman, M.; Muhammad, G. Date fruit classification for robotic harvesting in a natural environment using deep learning. IEEE Access 2019, 7, 117115–117133. [Google Scholar] [CrossRef]
- Hu, X.; Liu, Y.; Zhao, Z.; Liu, J.; Yang, X.; Sun, C.; Chen, S.; Li, B.; Zhou, C. Real-time detection of uneaten feed pellets in underwater images for aquaculture using an improved YOLO-V4 network. Comput. Electron. Agric. 2021, 185, 106135. [Google Scholar] [CrossRef]
- Yang, X.; Zhang, S.; Liu, J.; Gao, Q.; Dong, S.; Zhou, C. Deep learning for smart fish farming: Applications, opportunities and challenges. Rev. Aquac. 2021, 13, 66–90. [Google Scholar] [CrossRef]
- Ghahremani, M.; Williams, K.; Corke, F.M.; Tiddeman, B.; Liu, Y.; Doonan, J.H. Deep segmentation of point clouds of wheat. Front. Plant Sci. 2021, 12, 608732. [Google Scholar] [CrossRef] [PubMed]
- Ponce, J.M.; Aquino, A.; Andujar, J.M. Olive-fruit variety classification by means of image processing and convolutional neural networks. IEEE Access 2019, 7, 147629–147641. [Google Scholar] [CrossRef]
- Alshammari, H.; Gasmi, K.; Ben Ltaifa, I.; Krichen, M.; Ben Ammar, L.; Mahmood, M.A. Olive disease classification based on vision transformer and CNN models. Comput. Intell. Neurosci. 2022, 2022, 3998193. [Google Scholar] [CrossRef]
- Ghosh, S.; Das, N.; Das, I.; Maulik, U. Understanding deep learning techniques for image segmentation. ACM Comput. Surv. (CSUR) 2019, 52, 1–35. [Google Scholar] [CrossRef]
- Seo, H.; Badiei Khuzani, M.; Vasudevan, V.; Huang, C.; Ren, H.; Xiao, R.; Jia, X.; Xing, L. Machine learning techniques for biomedical image segmentation: An overview of technical aspects and introduction to state-of-art applications. Med Phys. 2020, 47, e148–e167. [Google Scholar] [CrossRef]
- Hesamian, M.H.; Jia, W.; He, X.; Kennedy, P. Deep learning techniques for medical image segmentation: Achievements and challenges. J. Digit. Imaging 2019, 32, 582–596. [Google Scholar] [CrossRef] [PubMed]
- He, K.; Gkioxari, G.; Dollár, P.; Girshick, R. Mask r-cnn. In Proceedings of the IEEE International Conference on Computer Vision, Venice, Italy, 22–29 October 2017; pp. 2961–2969. [Google Scholar]
- Chen, Q.; Zheng, Z.; Hu, C.; Wang, D.; Liu, F. On-edge multi-task transfer learning: Model and practice with data-driven task allocation. IEEE Trans. Parallel Distrib. Syst. 2019, 31, 1357–1371. [Google Scholar] [CrossRef]
- Zaidi, S.A.; Hayajneh, A.M.; Hafeez, M.; Ahmed, Q. Unlocking Edge Intelligence through Tiny Machine Learning (TinyML). IEEE Access 2022, 10, 100867–100877. [Google Scholar] [CrossRef]
- Ponce, J.M.; Aquino, A.; Millan, B.; Andújar, J.M. Automatic counting and individual size and mass estimation of olive-fruits through computer vision techniques. IEEE Access 2019, 7, 59451–59465. [Google Scholar] [CrossRef]
- Nashat, A.A.; Hassan, N.H. Automatic segmentation and classification of olive fruits batches based on discrete wavelet transform and visual perceptual texture features. Int. J. Wavelets Multiresolution Inf. Process. 2018, 16, 1850003. [Google Scholar] [CrossRef]
- Hayajneh, A.M.; Aldalahmeh, S.A.; Alasali, F.; Al-Obiedollah, H.; Zaidi, S.A.; McLernon, D. Tiny machine learning on the edge: A framework for transfer learning empowered unmanned aerial vehicle assisted smart farming. IET Smart Cities 2023, 1–17. [Google Scholar] [CrossRef]
- Hassan, M.M.; Uddin, M.Z.; Mohamed, A.; Almogren, A. A robust human activity recognition system using smartphone sensors and deep learning. Future Gener. Comput. Syst. 2018, 81, 307–313. [Google Scholar] [CrossRef]
- Yang, Y.; Wang, H.; Jiang, R.; Guo, X.; Cheng, J.; Chen, Y. A review of IoT-enabled mobile healthcare: Technologies, challenges, and future trends. IEEE Internet Things J. 2022, 9, 9478–9502. [Google Scholar] [CrossRef]
- Antonini, M.; Pincheira, M.; Vecchio, M.; Antonelli, F. A TinyML approach to non-repudiable anomaly detection in extreme industrial environments. In Proceedings of the 2022 IEEE International Workshop on Metrology for Industry 4.0 & IoT (MetroInd4. 0&IoT), Trento, Italy, 7–9 June 2022; pp. 397–402. [Google Scholar]
- Vitolo, P.; Licciardo, G.D.; Amendola, A.C.; Di Benedetto, L.; Liguori, R.; Rubino, A.; Pau, D. Quantized ID-CNN for a low-power PDM-to-PCM conversion in TinyML KWS applications. In Proceedings of the 2022 IEEE 4th International Conference on Artificial Intelligence Circuits and Systems (AICAS), Incheon, Republic of Korea, 13–15 June 2022; pp. 154–157. [Google Scholar]
- Huang, H.; Lin, L.; Tong, R.; Hu, H.; Zhang, Q.; Iwamoto, Y.; Han, X.; Chen, Y.W.; Wu, J. Unet 3+: A full-scale connected unet for medical image segmentation. In Proceedings of the 2020 IEEE International Conference on Acoustics, Speech and Signal Processing (ICASSP 2020), Barcelona, Spain, 4–8 May 2020; pp. 1055–1059. [Google Scholar]
- Chen, L.C.; Papandreou, G.; Kokkinos, I.; Murphy, K.; Yuille, A.L. Deeplab: Semantic image segmentation with deep convolutional nets, atrous convolution, and fully connected crfs. IEEE Trans. Pattern Anal. Mach. Intell. 2017, 40, 834–848. [Google Scholar] [CrossRef]
- Zhao, H.; Shi, J.; Qi, X.; Wang, X.; Jia, J. Pyramid scene parsing network. In Proceedings of the IEEE Conference on Computer Vision and Pattern Recognition, Honolulu, HI, USA, 21–26 July 2017; pp. 2881–2890. [Google Scholar]
- Wang, C.Y.; Bochkovskiy, A.; Liao, H.Y.M. YOLOv7: Trainable bag-of-freebies sets new state-of-the-art for real-time object detectors. In Proceedings of the IEEE/CVF Conference on Computer Vision and Pattern Recognition, Vancouver, BC, Canada, 17–24 June 2023; pp. 7464–7475. [Google Scholar]
- Jocher, G.; Chaurasia, A.; Qiu, J. YOLO by Ultralytics. 2023. Available online: https://github.com/ultralytics/ultralytics (accessed on 21 November 2023).
- Oquab, M.; Darcet, T.; Moutakanni, T.; Vo, H.; Szafraniec, M.; Khalidov, V.; Fernandez, P.; Haziza, D.; Massa, F.; El-Nouby, A.; et al. Dinov2: Learning robust visual features without supervision. arXiv 2023, arXiv:2304.07193. [Google Scholar]

Disclaimer/Publisher’s Note: The statements, opinions and data contained in all publications are solely those of the individual author(s) and contributor(s) and not of MDPI and/or the editor(s). MDPI and/or the editor(s) disclaim responsibility for any injury to people or property resulting from any ideas, methods, instructions or products referred to in the content. |
© 2023 by the authors. Licensee MDPI, Basel, Switzerland. This article is an open access article distributed under the terms and conditions of the Creative Commons Attribution (CC BY) license (https://creativecommons.org/licenses/by/4.0/).