Abstract
Climate change is linked to CO2 emissions, the reduction of which has become a top priority. In response to these circumstances, scientists must constantly develop new technologies that increase fuel efficiency and reduce emissions. Agriculture today is dominated by arable fields of various sizes, shapes, and dimensions, and to achieve fuel economy and environmental impact requirements, it is not enough to know only the principles of optimization of tillage processes; it is also necessary to understand the influence of field size and its shape and dimensions on tillage performance. The purpose of this research is to present a methodology that allows predicting tractor fuel demand and CO2 emissions per unit of ploughed area when ploughing field plots with different shapes and dimensions and to confirm a suitable variable for such a prediction. Theoretical calculations and experimental tests have shown that the field ploughing time efficiency coefficient is a useful metric for comparing field plots of different shapes and dimensions. This coefficient effectively describes tractor fuel consumption and CO2 emissions during ploughing operations on differently configured field plots. A reasonable method for calculating the real field ploughing time efficiency coefficient is based on field and tillage data and a practical determination method using tractor engine load reports. It was found that during the research, when ploughing six field plots of different shapes and dimensions, with an area of 6 ha, the field ploughing time efficiency coefficient varied from 0.68 to 0.82, and fuel consumption between 15.6 and 16.5 kg/ha. In the field plot of 6 ha, where the field ploughing time efficiency coefficient was 15% higher, the fuel consumption per unit area was lower by about 5.5%. The results of this study will help to effectively predict tillage time and tractor fuel consumption required for different field shapes and dimensions.
1. Introduction
Climate change is associated with the emission of greenhouse gases, mainly CO2, the reduction of which has become a top priority. In agriculture, the tractor is one of the machines that contributes significantly to climate change, as it is the main source of energy for various agricultural operations. Tillage uses about a quarter of all energy used in crop production, and currently, more than 90% of this energy comes from fossil fuels [1]. In particular, tillage operations such as ploughing or rotation are relatively long and require high fuel consumption, which contributes to accelerated climate change [2,3,4]. In response to these circumstances, scientists need to work with farmers to develop technologies that increase the fuel efficiency of self-propelled agricultural machinery and reduce emissions. Researchers from different countries [2,3,4,5,6,7] conducted various field experiments in different soil conditions and found that with the correct selection of engine operating mode, transmission drive, and correct adjustment of the tire inflation pressure, the size of the ballast mass, and the distribution of the tractor’s weight on the axles, fuel consumption during ploughing could be reduced by 10–45%. Over time, more attention has been paid to the performance of agricultural machinery, and the ability to simulate field time has accelerated due to improvements in technology and simulation methods. This work is very helpful in effectively predicting the tillage time required for different fields. The results of this study will help to effectively predict tillage time and tractor fuel consumption required for different field shapes and dimensions. The calculation and planning of the working time of agricultural machinery is closely related to the economic and ecological indicators of the farm and its productivity. The ability to pre-calculate the efficiency of tillage operations, especially fuel consumption and exhaust gas pollution, is one of the more important tasks in order to rationally use energy resources in agricultural production and have less harmful impact on the environment [8,9]. Paris et al. conducted a review emphasising the need to create and apply standardized methodologies for the analysis of energy use in agricultural systems [10].
Practice and scientific research show that fuel consumption during tillage depends not only on the size of the field but also on its shape. Traditional agricultural mechanization is more efficient when the fields are relatively large and have a regular shape. Irregularly shaped small fields are often considered uneconomical [8]. Many small, irregularly shaped agricultural fields in the United States were abandoned during the 20th century. The European Union has kept small fields in production with subsidies [11]. Small arable fields for agriculture are often associated with higher costs per unit area, both in terms of field time requirements and energy input, resulting in lower yields and lower farmland values [12]. Depending on the implement’s working width and working speed, a 1 ha arable plot may require 30–90% more machine field time per unit area compared to a 5 ha arable plot [13]. Since field operations take longer on a small field plot, smaller arable fields will also use more fuel per unit area than larger fields [14]. In order to use larger equipment and ensure better fuel economy, field sizes in Lithuania were increased by removing small farms, old buildings, field trees, and bushes. At the same time, scientists have revealed the advantages of small fields. Studies in the European Union, Canada, and the United States have shown that farming in smaller fields naturally increases biodiversity [8].
When ploughing the soil, the work efficiency is determined by how much time is effectively travelled on the field plot; when the agricultural implement is in the working position, all turning manoeuvres in the headlands are not counted, as they reduce the work efficiency [12,15]. Mechanized tillage, such as ploughing, starts from the edge of a cultivated plot, lowers the implement into a working position, accelerates to the technological speed, drives across the field, then slows down the speed of the tractor and finally rotates the unit at the end of the field plot [2,12]. Theoretically, the time spent by the tractor in the field during ploughing can be divided into two parts: the time of productive ploughing work (the plough is in working position and the tractor is moving) and the remaining time, called unproductive work time [7,16]. Most often, farmers try to shorten the duration of non-productive activities by optimally planning routes in field plots and assessing the shape and dimensions of the field plot, but in practice, there are route restrictions related to terrain features or agro-technological operational requirements. Many studies have proposed methodologies to optimize the tillage route in field plots of various shapes. There are long-known simple methods, according to which the direction of travel during tillage is determined according to the longest edge of the field plot, and then continues as in the rectangular plot scheme [17,18]. Optimizing tillage routes can reduce differences in fuel consumption in field plots of the same area with different dimensions, but the actual measured fuel consumption per hectare will still vary here [15,19,20]. In addition, energy consumption in agricultural production is closely related to economic indicators of farm development [21].
Monitoring of agricultural activities, especially the fuel consumption of machinery, is a very important factor in improving the economic indicators of a farm and reducing environmental pollution. In order to develop a reliable methodology for analysing fuel consumption for tillage operations such as ploughing fields of various shapes and sizes, it is first necessary to find common variables on which to base the monitoring. Previous studies have shown that such a variable can be the time efficiency factor when analysing tractor performance. It has also been shown that the value of time efficiency for a tillage operation can be evaluated by processing data reports from the tractor engine control module (ECM) [22,23].
The purpose of this research is to present a methodology that would allow calculating tractor fuel demand and CO2 emissions per area unit when ploughing field plots with different shapes and dimensions. The results of this study will help to effectively predict tillage time and tractor fuel consumption required for different field shapes and dimensions and to confirm a suitable variable for such a prediction. The aim was also to approve the methodology for the theoretical determination of the time efficiency coefficient of ploughed field plots of different shapes and dimensions. The results of this study will help to effectively predict tillage time and tractor fuel consumption required for different field shapes and dimensions, evaluating the following variables: the area of the ploughed plot, its average length in the ploughing direction, and the maximum width perpendicular to the ploughing, as well as the duration of the tractor turn in the field headland, the width of the ploughing strip, and the actual speed of the tractor during ploughing.
2. Materials and Methods
Practice and research show that fuel consumption during tillage depends not only on the condition of the soil, its cultivation technology and equipment, and the size of the plot but also on its shape. The decisive theoretical decision in this research was to find a suitable variable on the basis of which it would be possible to predict and compare tractor fuel demand and CO2 emissions per area unit when ploughing field plots of different shapes and dimensions. The results of this study will help to effectively predict tillage time and tractor fuel consumption required for different field shapes and dimensions. At the Joniškėlis test station of the Lithuanian Centre for Agriculture and Forestry, experimental ploughing tests were carried out in wheat stubble fields in clay loam soil (56°2′6.71″ N, 24°11′46.43″ W). For ploughing experiments, six field plots of equal area but different shapes and dimensions were formed: three rectangles, two irregular quadrangles and one irregular hexagonal plot. The shapes and dimensions of the field plots selected for ploughing experiments are shown in Figure 1. The field size of 6 ha was chosen for the study because the estimates of the field efficiency algorithm showed that the efficiency factor of a field larger than 10 ha does not change much depending on the field size [8,19], and there are relatively few fields smaller than 3 ha in Lithuania. From this, it can be assumed that the most relevant studies on the dependence of tractor fuel demand and CO2 emissions on field plot shape and dimensions would be for field plots of 3–10 ha.
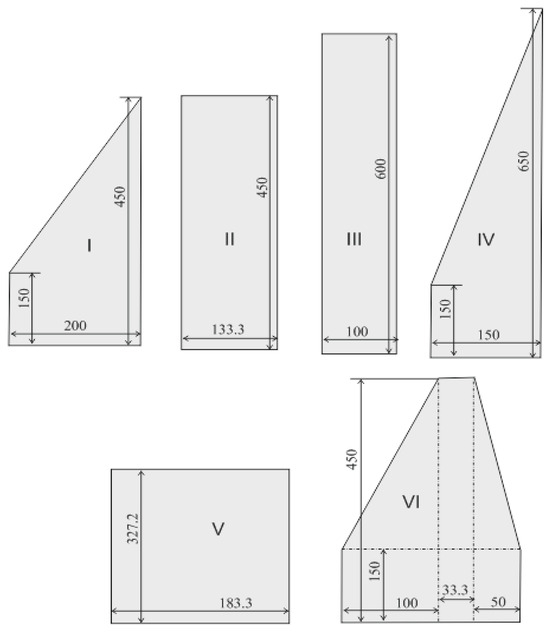
Figure 1.
Schemes and dimensions of test plots: (I) 200 m wide, irregular quadrangular shape; (II) 133.3 m wide, rectangular shape; (III) 100 m wide, rectangular shape; (IV) 200 m wide, irregular quadrangular shape; (V) 183.3 m wide, rectangular shape; (VI) 50 m wide, irregular hexagonal shape.
Field operations such as ploughing involve starting from the edge of the field, lowering the implement into working position by increasing the speed to the technological speed, ploughing by driving across the field, then slowing down the tractor and engine, and finally turning the machine at the end of the ploughed field. The implement is lowered to the working position at the beginning of the acceleration to the working speed and the implement is raised at the beginning of the turn. Theoretically, the time that the tractor is in the field during ploughing can be divided into two specific parts: the time of the ploughing operation (when the plough is in working position and the tractor is moving), and non-productive working time. The continuous time spent by the tractor in the field in various operating modes can be obtained by processing the information stored in the ECM of the tractor [23]. In addition, using a method of processing the information accumulated by the ECM, the time of continuous field ploughing in various tractor working modes can be divided into the time of productive field ploughing and non-productive field activity time [23].
2.1. Equipment and Experimental Procedure
The MF 6499 tractor manufactured in France (agricultural machinery company Massey Ferguson) was chosen for experimental field tests. In tractors of this model, the database stored by the ECM is updated every second. The most important technical information about the tractor is presented in Table 1.

Table 1.
Massey Ferguson MF 6499 tractor main technical data.
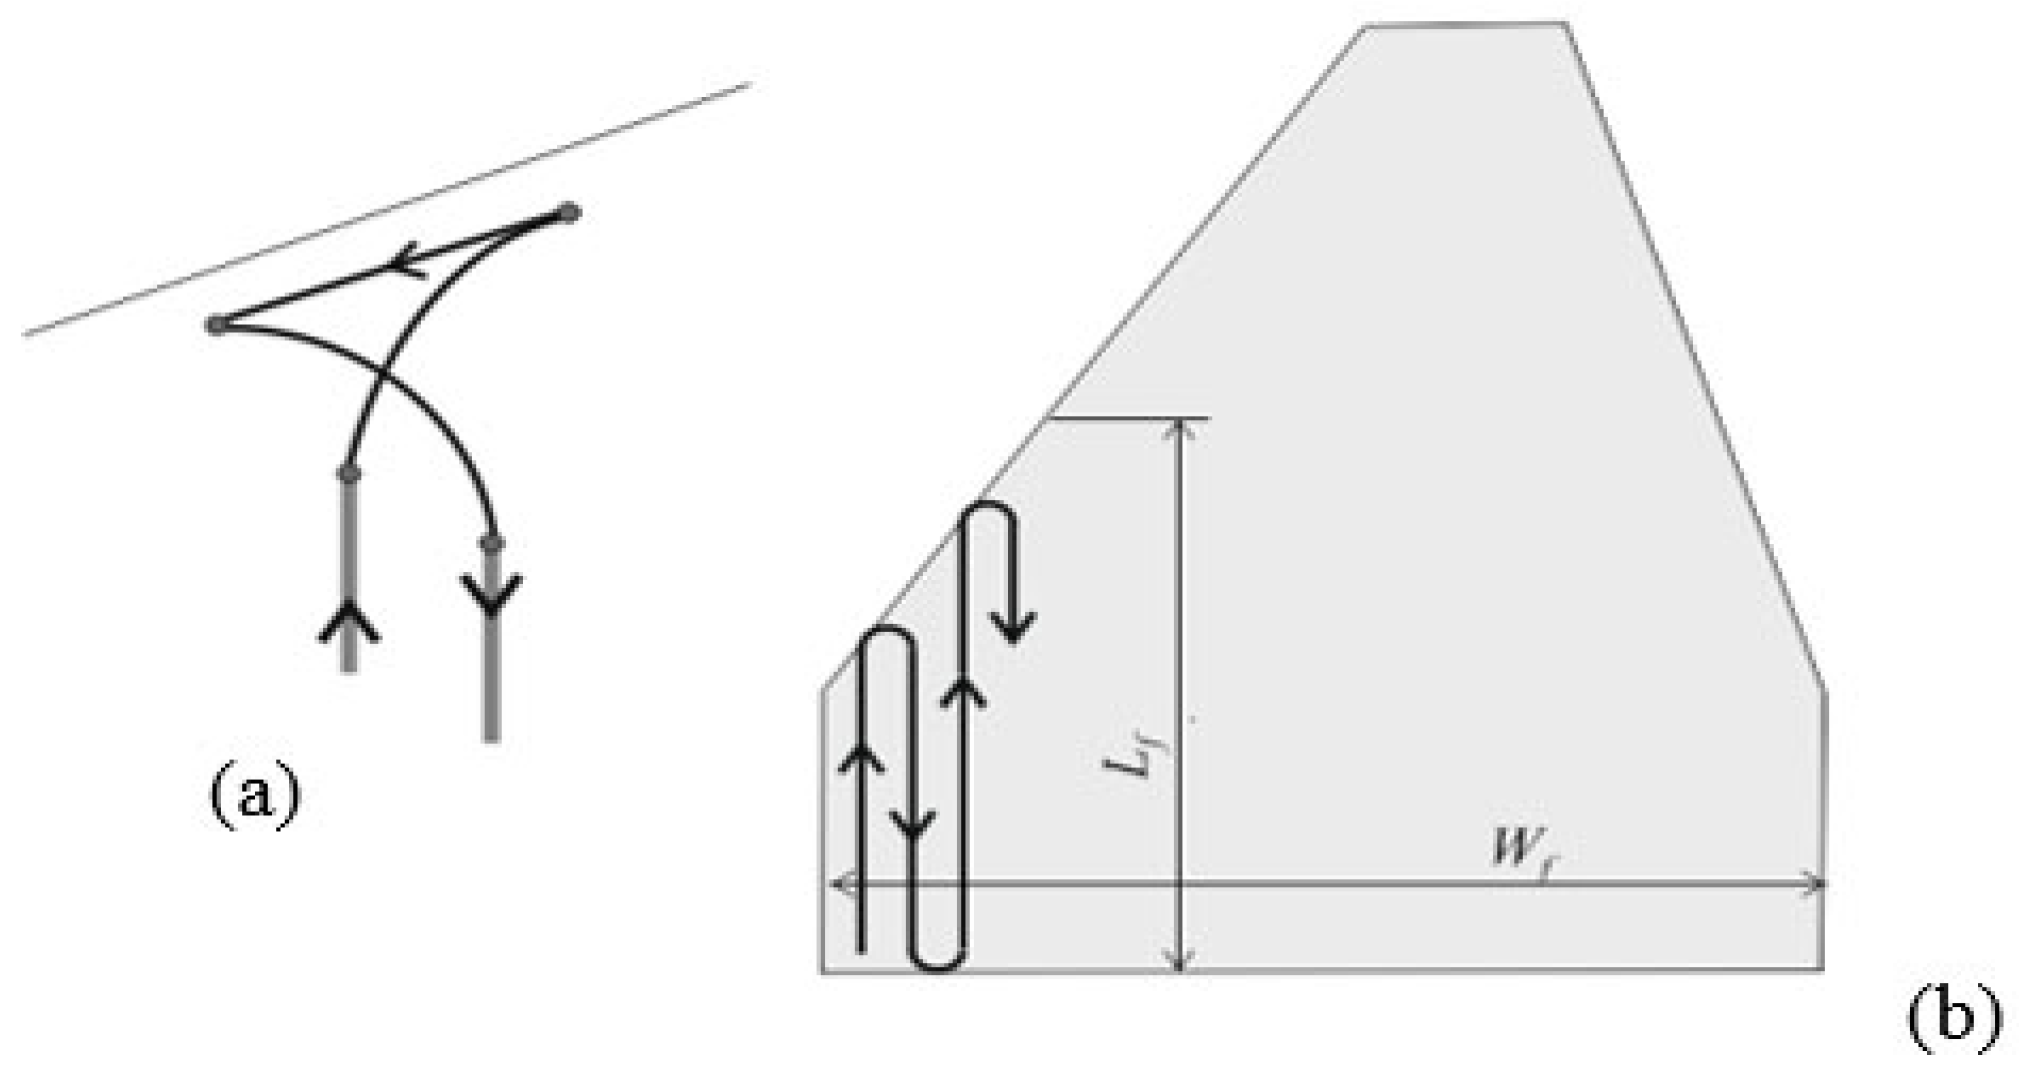
For stubble field ploughing tests, a LEMKEN EurOpal 9 mounted reversible six-furrow plough (LEMKEN GmbH & Co. KG, Alpen, Germany) was coupled to an MF 6499 tractor. The total working width of the plough was chosen—2.40 ± 0.05 m, and the ploughing depth of all furrows—0.22 ± 0.015 m. All runs in the ploughing tests were carried out with four-wheel drive, differential lock, d-range 1 gear, and an engine speed of 1850 ± 20 min−1. During the turning manoeuvre in the field headlands, the average forward speed of the tractor was 0.84 m s−1, and the reverse was 0.76 m s−1 at an engine speed of 990 ± 15 min−1. The average slip of the rear drive wheels of the tractor in all field plots during all ploughing tests varied between 11 and 16%. During these field tests, the inflation pressure of the tractor tires was 140 kPa. Additional weights were attached to the frame at the front of the tractor, totalling 540 kg. During the experiment, all test plots were ploughed according to the same driving sequence scheme shown in Figure 2. In each plot, continuous ploughing was carried out from the left side of the plot. The 180° turns of the tractor with the raised plough in the field headlands were performed according to the X-turn manoeuvring scheme shown in Figure 2a.

Figure 2.
Diagrams: X-turn manoeuvres in the field headland (a) and the driving sequences (b) used in ploughing tests; Lf is the average length of the ploughed field plot in the ploughing direction, and Wf is the maximum width of the ploughed plot perpendicular to ploughing.
An X-turn in the headland consists of a ≃90° turn while moving forward, then straight back, and a ≃90° turn back while moving forward [15,24,25]. At the end of the first turn, the tractor stops, moves backwards, and turns again to begin a new furrow parallel to the master line. In each ploughing test field plot, 12 m field edge strips (headlands) for tractor turns were measured at both ends of the plot. All six test plots were measured in horizontal fields of wheat stubble soil with soil texture ranges of sand 43–49%, silt 30–36%, and clay 19–23%. Soil penetration resistance of 1.02–1.24 MPa prevailed at a depth of 15 cm in all field test plots measured at various locations. Measurements were performed using a penetrometer with an iron cone measuring tip with a diameter of 1.128 cm and a cone angle of 60° [26].
2.2. Data Collection and Calculations
During these studies, the performance data of the MF 6499 tractor were obtained by processing the engine load reports accumulated in the ECM, copied before and after ploughing each test field plot. The engine load report generated by the Massey Ferguson MF 6499 ECM in the form of a histogram with a table (Figure 3) can be transferred to a computer at any time.
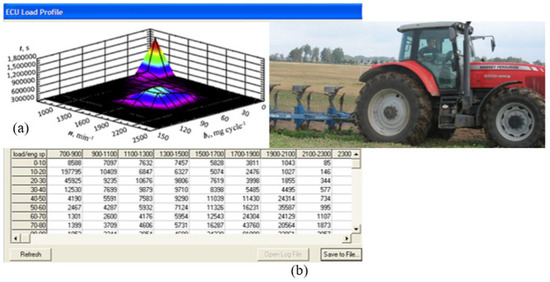
Figure 3.
The image of the report of engine load in histogram (a) and table (b) form transferred from MF 6499 tractor ECM to a computer.
Tractor ECM report data are copied at the following intervals: engine revolutions data interval every 100 min−1, fuel injected per cycle data interval 10 mg cycle−1, data recording time interval every 1 s. During the ploughing tests, tractor engine load data (load profile table) for each field plot were obtained from the ECM reports. For each field plot, the tractor load data table was calculated from the ECM report copied after the completion of the ploughing test in the corresponding field plot by subtracting the data from the ECM report copied before the ploughing test for that plot. In this way, histograms and tables of the ploughing time distribution of each test plot were created according to the engine revolutions per minute and the quantity of injected fuel per cycle. From the histograms and tables of the ploughed field plots, after estimating the engine load for certain engine revolutions per minute and the quantity of fuel injected per cycle, the production and non-production activity times were calculated.
In the ploughing process, ploughing time efficiency can be described as the ratio of the time spent productively ploughing to the continuous field time the tractor spends in that field [15]. In the ASAE standard, the continuous time a machine spends in the field from the start of the operation to the end of the operation is called field time [27]. Therefore, according to the standard [27], the field time of a ploughing operation is the period that the tractor spends in the field from the beginning of the ploughing operation to the end of the ploughing operation. To calculate the efficiency of the ploughing time of the test plots, the following equation of the relationship between productive ploughing time and field time was used [15,28]:
where is the productive ploughing time, is the field time of the ploughed plot.
The theoretical productive ploughing time when ploughing field plots of different shapes and dimensions can be calculated as the ratio of the average ploughed plot length in the ploughing direction and the actual speed of the tractor during ploughing, multiplied by the number of ploughing strips in the ploughed plot:
where Lf is the average length of the ploughed field plot in the ploughing direction (m), v is the actual speed of the tractor during ploughing (m s−1), is the number of ploughing strips in the ploughed plot, Wf is the maximum width of the ploughed plot perpendicular to ploughing, (m), and ww is the effective plough width, which is the ploughing strip width (m).
When calculating the theoretical field time of ploughing activity of field plots with different shapes and dimensions, the following equation was applied:
where is the average duration of a fully completed turning manoeuvre at the headland of the field(s).
The following equation was applied to calculate the duration of a fully completed 180° turn in the headland:
After combining Equations (2) and (3) on the basis of Equation (1), after performing mathematical processing, we created an equation for the theoretical calculation of the field time efficiency, suitable for performing calculations when ploughing fields of different shapes and dimensions:
where is the plot area for ploughing, and is the number of 180° turns made at the headlands of the plot during ploughing.
Tractor fuel consumption for each engine speed–fuel quantity mode during ploughing of the entire test plot was calculated using the equation:
where , , and are the engine running time (h) in engine speed–fuel quantity mode, the quantity of fuel injection per cycle (mg cycle−1), and engine speed (min−1), and is the number of cylinders in the engine.
Based on Equation (6) and the division of ploughing field time into productive and non-productive, fuel quantities are calculated for productive and non-productive ploughing operations. Tractor fuel consumption when ploughing investigated plots of different shapes and dimensions was calculated by summing up the total fuel amounts for productive and non-productive operations:
where and is the fuel consumption for certain modes of engine speed–fuel quantity corresponding to a productive or non-productive ploughing operation.
Using a similar methodology, CO2 emissions were calculated per unit of ploughed area of plots with different shapes and dimensions and were also calculated in the case of productive ploughing and non-productive activities. CO2 emissions for each tractor engine speed–fuel quantity mode were calculated using the equation [23]:
where is the engine mode correction factor to estimate changes in engine rpm or load during transient mode (the tractor model used in the tests has a transient correction factor of 1.09) [29], is the duration of engine operation in a certain engine mode, h, is the concentration of CO2 in the exhaust gas in a given engine speed–fuel quantity mode (%), is the volumetric gas flow in a given engine speed–fuel quantity mode, m3 h−1, and is the molar gas density, kg kmol−1.
For the sake of brevity, more detailed descriptions are not provided here, and previously published work [30] should be considered.
3. Results and Discussion
During the experimental study, all stubble field plots selected for research were ploughed in the modes indicated in the methodology. To collect tractor performance data, data tables and histograms (engine load profile) were created for each ploughing test field based on the field time distribution in engine speed–fuel quantity modes. Tractor load profile data for each stubble field ploughing test plot were calculated from the ECM data report copied after the completion of the ploughing test in the corresponding field plot, minus the analogue ECM report data copied before that test. One such histogram, that is, the histogram of the ploughing time distribution of the test field plot “I” in the different engine speed–fuel quantity modes is shown in Figure 4.
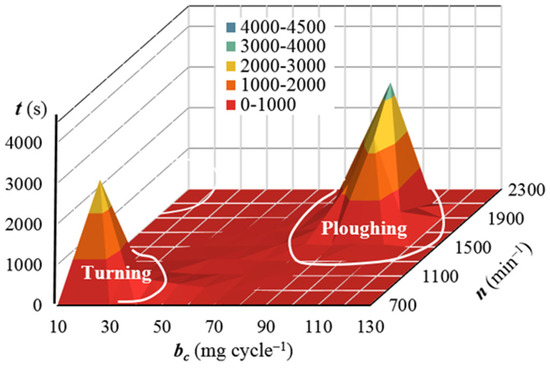
Figure 4.
Time distribution histogram of the 6 ha irregular quadrangular ploughed field plot I obtained from the ECM data report copied after the ploughing test in plot I minus the analogue data of the ECM report copied before the test.
From such data tables of tractor load profile histograms, based on the presented methodology, the distribution of ploughing field time, fuel consumption, and CO2 emissions for productive and non-productive activities of the ploughing process in all test field plots was calculated. The results of the experimental tests obtained from the histogram data of all test plots are presented in Table 2.
Table 2.
Distribution of tractor field time, fuel consumption, and CO2 emissions for productive and non-productive activities when ploughing field plots with different shapes and dimensions.
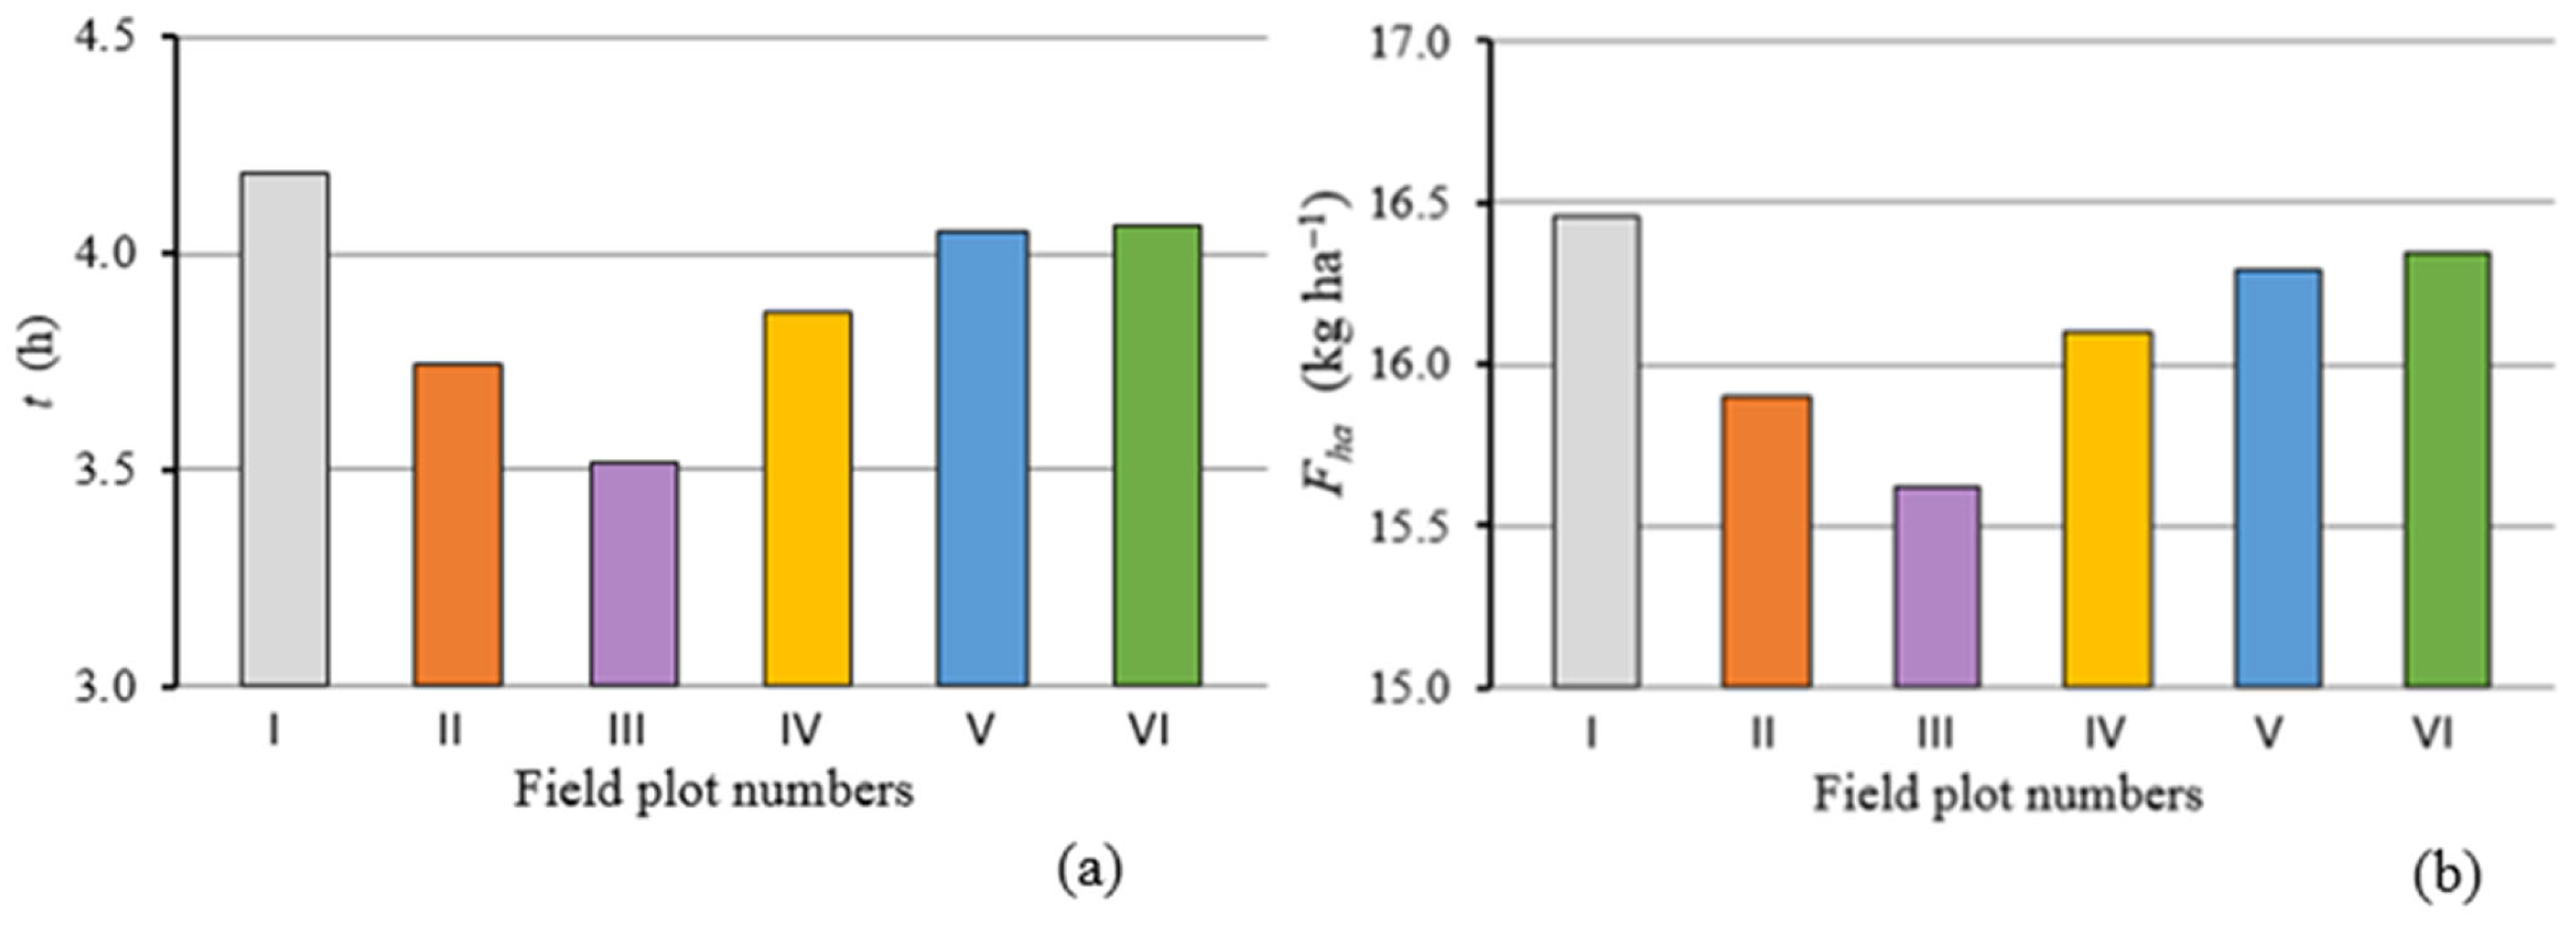
Next, in this section, we will analyse the relationship between fuel consumption, CO2 emissions, tractor field time, field time efficiency, and different shapes and dimensions of field plots when ploughing stubble fields. For such an analysis, Figure 5 shows the values of tractor field time (h) and fuel demand (kg ha−1) for ploughing 6 ha field plots with different shapes and dimensions.
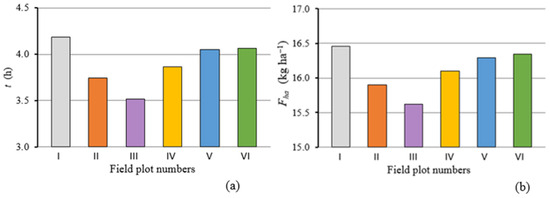
Figure 5.
Variation in tractor field time (a) and fuel consumption (b) when ploughing 6 ha field plots with different shapes and dimensions: (I) 200 m wide, irregular quadrangular shape; (II) 133.3 m wide, rectangular shape; (III) 100 m wide, rectangular shape; (IV) 200 m wide, irregular quadrangular shape; (V) 183.3 m wide, rectangular shape; (VI) 50 m wide, irregular hexagonal shape.
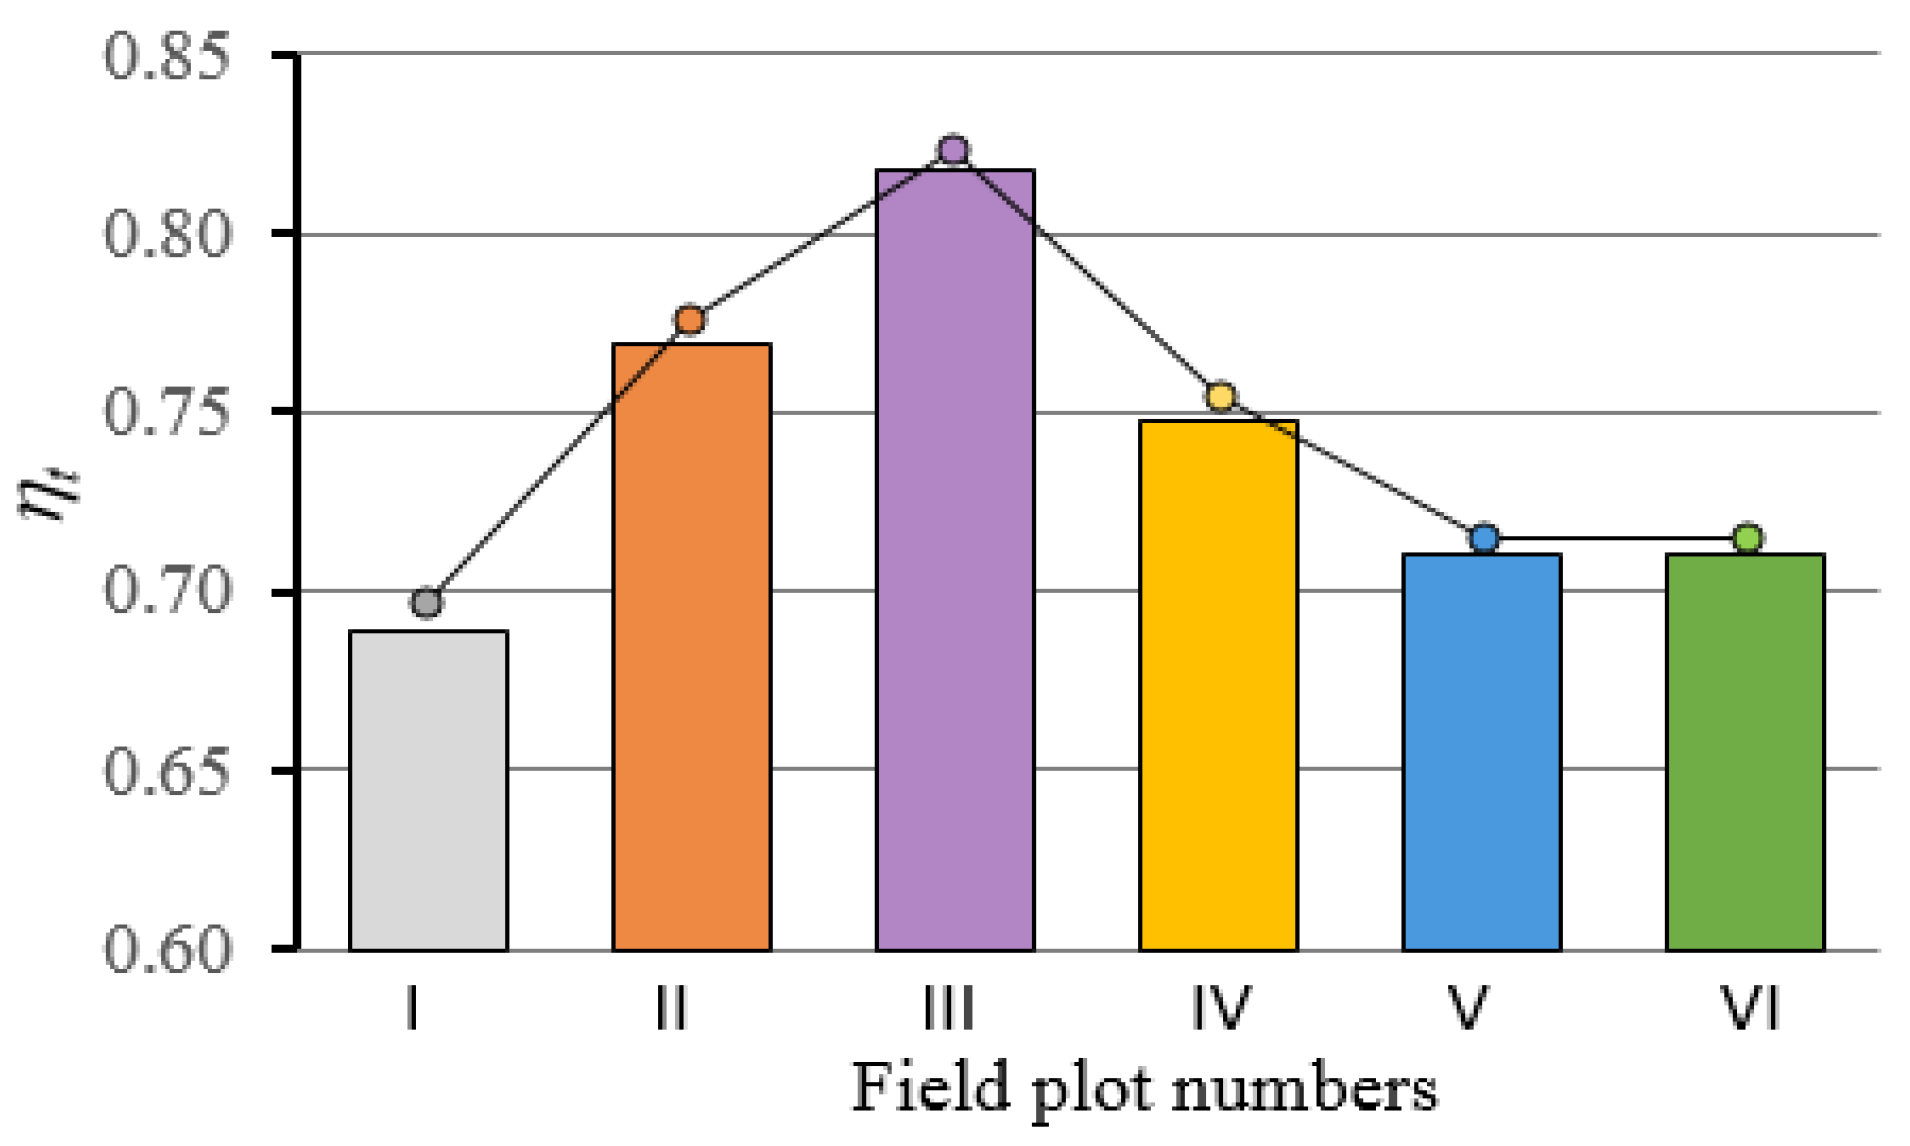
The bar graphs in Figure 5 show a significant difference in tractor field time and fuel consumption values for different field plot shapes and dimensions. The biggest differences were between the 200 m wide, irregular quadrangular field (I) and the 100 m wide, rectangular field (III): the difference between the tractor field times was 0.66 h and the difference in fuel consumption was 0.85 kg/ha. However, the tractor field time and fuel consumption results (Figure 5) analysed in various combinations with the field plot shapes shown in Figure 1 and the dimensions listed in Table 1 did not show a stable dependence on any of those parameters. This means that the bar graphs in Figure 5 do not provide a suitable parameter to compare tractor field times and fuel consumption for different field shapes and dimensions. It should be noted that previous studies did not show a relationship between tractor fuel consumption per hectare and other tractor performance characteristics, on the one hand, and the size of the ploughed field area, on the other [23]. However, previous studies have shown that tractor performance has a reliable linear relationship with field ploughing time efficiency [23]. In the following analysis, we will look for a relationship between tractor fuel consumption and CO2 emissions, on the one hand, and field ploughing time efficiency, on the other, when ploughing stubble plots with the same area, but with different shapes and dimensions. The values of the field ploughing time efficiency factor for a tractor unit with a reversible plough when ploughing 6 ha stubble field plots of different shapes and dimensions are presented in Figure 6. Field ploughing time efficiency values for stubble plots calculated from Equation (5) are shown as dark bar graphs in Figure 6. The experimental values of the field ploughing time efficiency coefficient of stubble plots with different shapes and dimensions, calculated according to the ratio of ploughing operation duration and field time determined by ECM reports, are presented in the white columns of Figure 6.
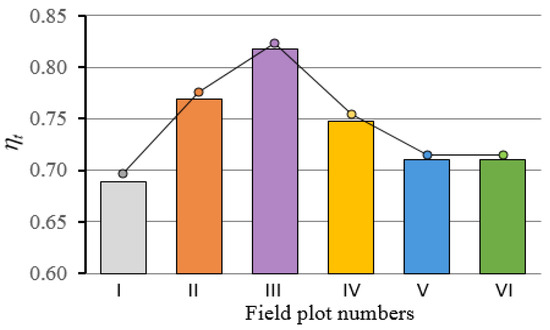
Figure 6.
Field ploughing time efficiency values for ploughing 6 ha field plots with different shapes and dimensions: the bar graphs show the results calculated using Equation (5), and the line chart shows the experimental results: (I) 200 m wide, irregular quadrangular shape; (II) 133.3 m wide, rectangular shape; (III) 100 m wide, rectangular shape; (IV) 200 m wide, irregular quadrangular shape; (V) 183.3 m wide, rectangular shape; (VI) 50 m wide, irregular hexagonal shape.
The presented results show that when ploughing field plots of different shapes and dimensions with an area of 6 ha, the coefficient of field ploughing time efficiency varied from 0.68 to 0.82. The difference between the field ploughing time efficiency values of field plots of the same area, shape, and dimensions, calculated by applying Equation (5), and the results of the experimental measurements was small, less than 5 per cent. The data presented in Figure 6 show that when ploughing field plots V and VI, which have different shapes and dimensions, more or less the same values of the field ploughing time efficiency coefficient were obtained, both calculated and experimental. Such results are explained by the fact that field plots V and VI of different shapes and dimensions have common parameters: the average length of the plot in the direction of ploughing and the maximum width of the plot perpendicular to ploughing are of the same size. The fact that the values of the average length of the plot in the direction of ploughing and the maximum width of the plot perpendicular to the ploughing of field plots V and VI are the same is confirmed by the dimensions describing the investigated plots presented in Table 2.
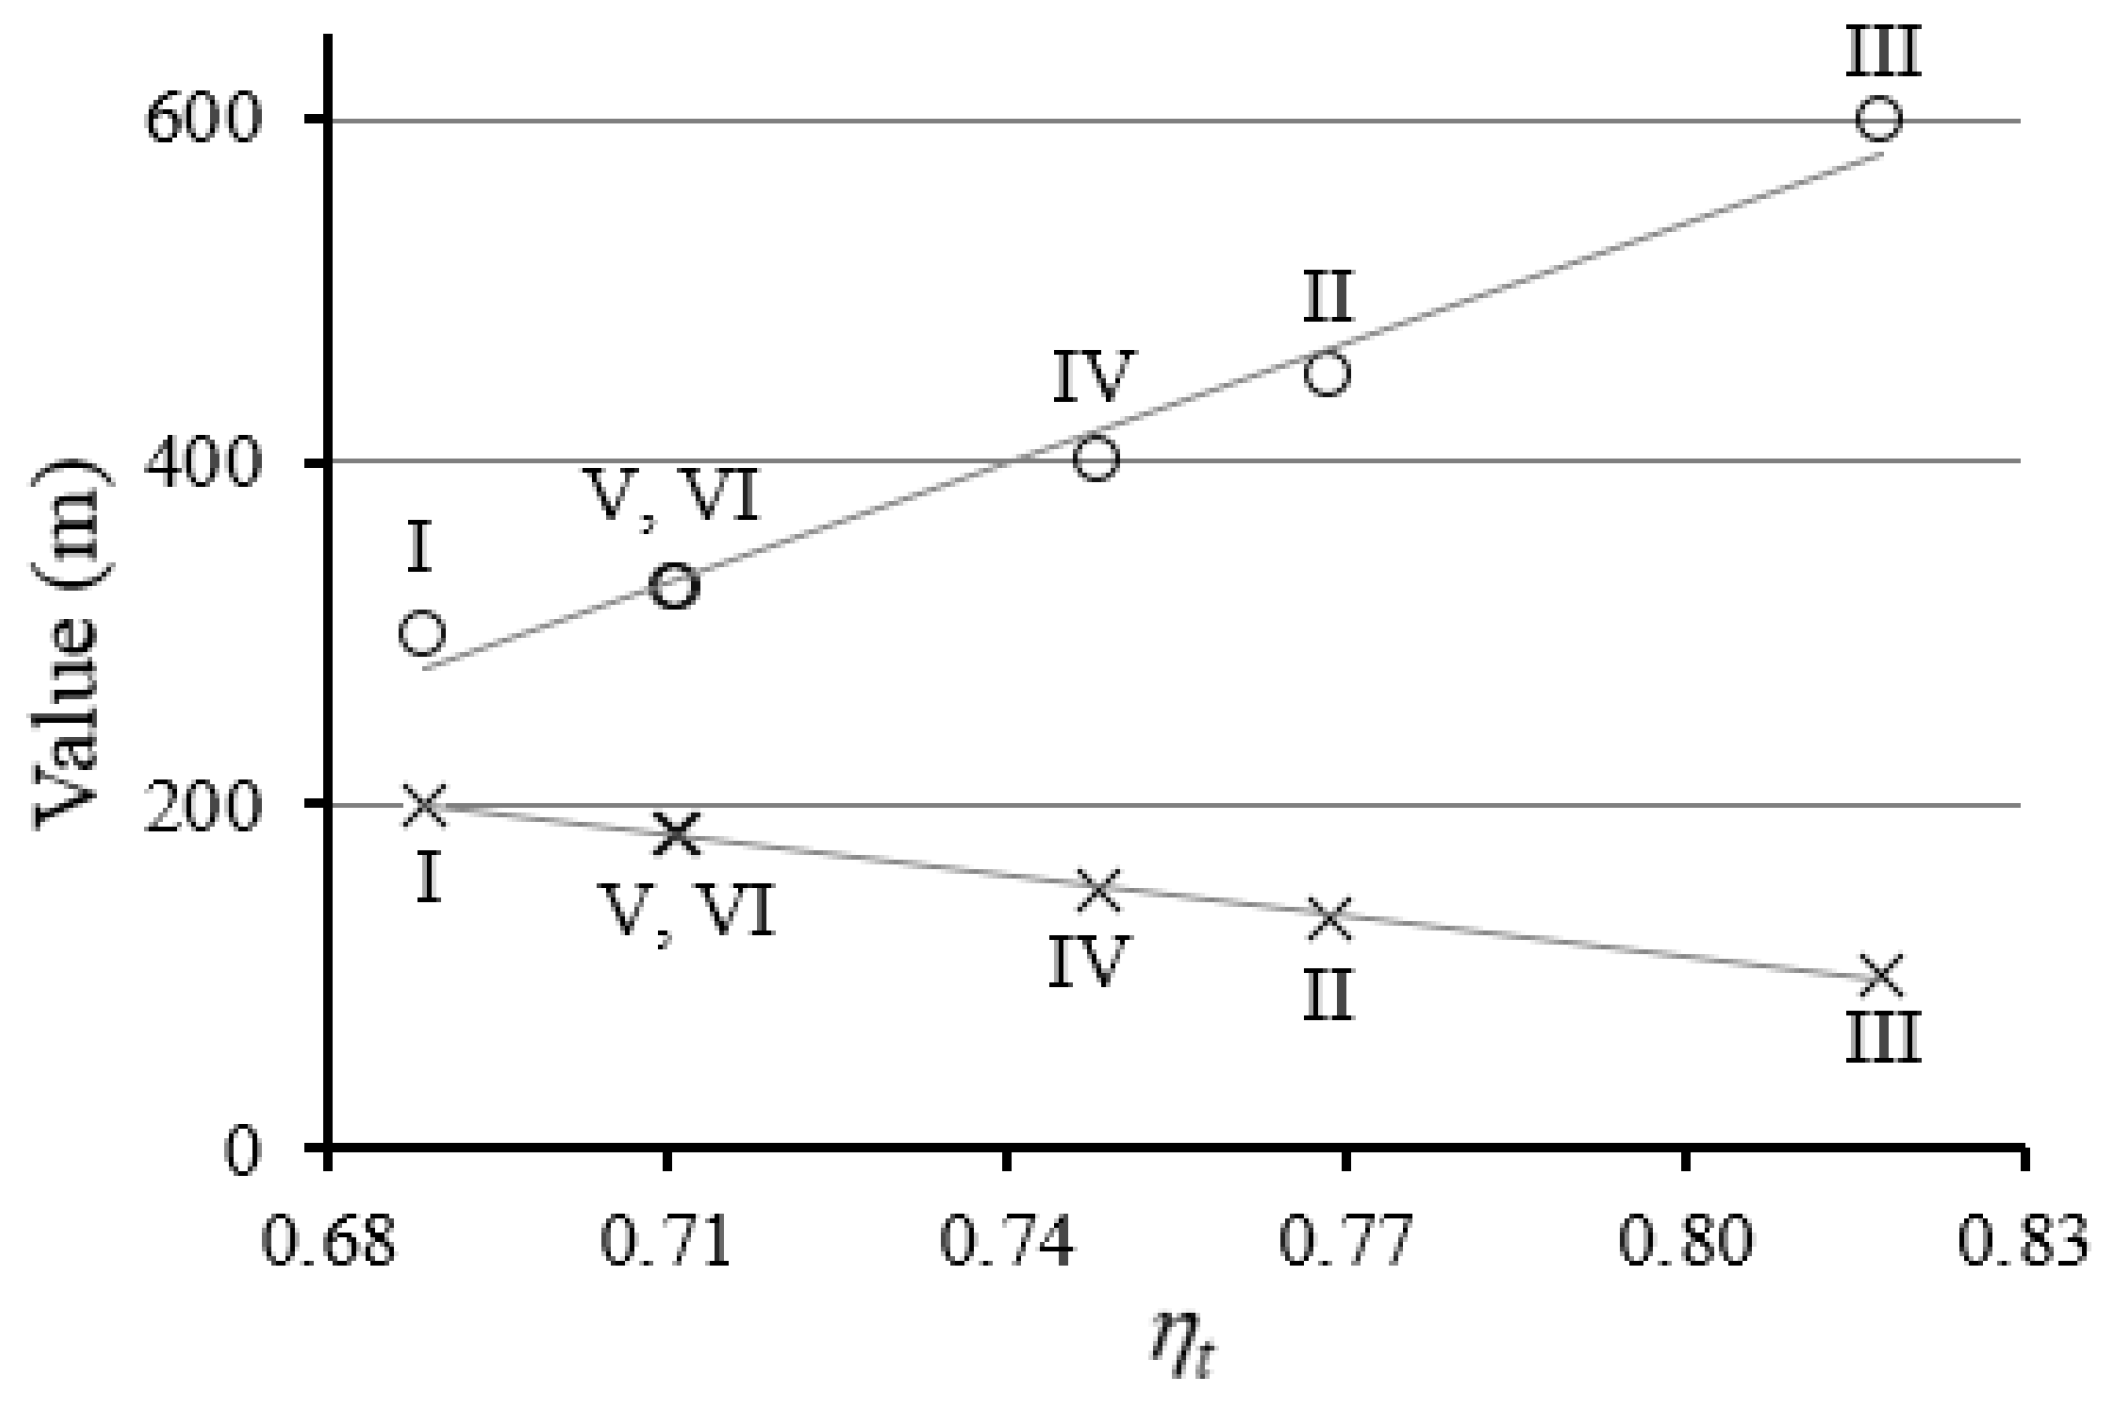
The highest value of the field ploughing time efficiency coefficient of 0.82 was obtained when ploughing field plot III, the average length of the plot in the direction of ploughing of which was the largest at 600 m, and the maximum plot width perpendicular to ploughing was the smallest at 100 m. The lowest field ploughing time efficiency coefficient value of 0.68 was obtained when ploughing field plot I, whose average length of the plot in the direction of ploughing was the smallest at 300 m, and the maximum width of the plot perpendicular to ploughing was the largest at 200 m. Thus, the research results show that the field ploughing time efficiency coefficient is linearly related to the parameters of the studied field plots: the average length of the plot in the direction of ploughing and the maximum width of the plot perpendicular to ploughing (Figure 7). A correlation relationship between the field ploughing time efficiency coefficient and field plot length in the ploughing direction was also found in previous studies that examined field plots of different areas [23]. In addition, the article by Janulevičius et al. [23] shows that there is no reliable relationship between the coefficient of field ploughing time efficiency and the field area. No other parameters with a reliable relationship with the field ploughing time efficiency coefficient were found during this study.

Figure 7.
The ratio of the average length of the plot in the direction of ploughing and the maximum width of the plot, perpendicular to the ploughing, with the efficiency factor of field ploughing time: o is the average length of the plot in the direction of ploughing, and × is the maximum width of the plot, perpendicular to the ploughing: (I) 200 m wide, irregular quadrangular shape; (II) 133.3 m wide, rectangular shape; (III) 100 m wide, rectangular shape; (IV) 200 m wide, irregular quadrangular shape; (V) 183.3 m wide, rectangular shape; (VI) 50 m wide, irregular hexagonal shape.
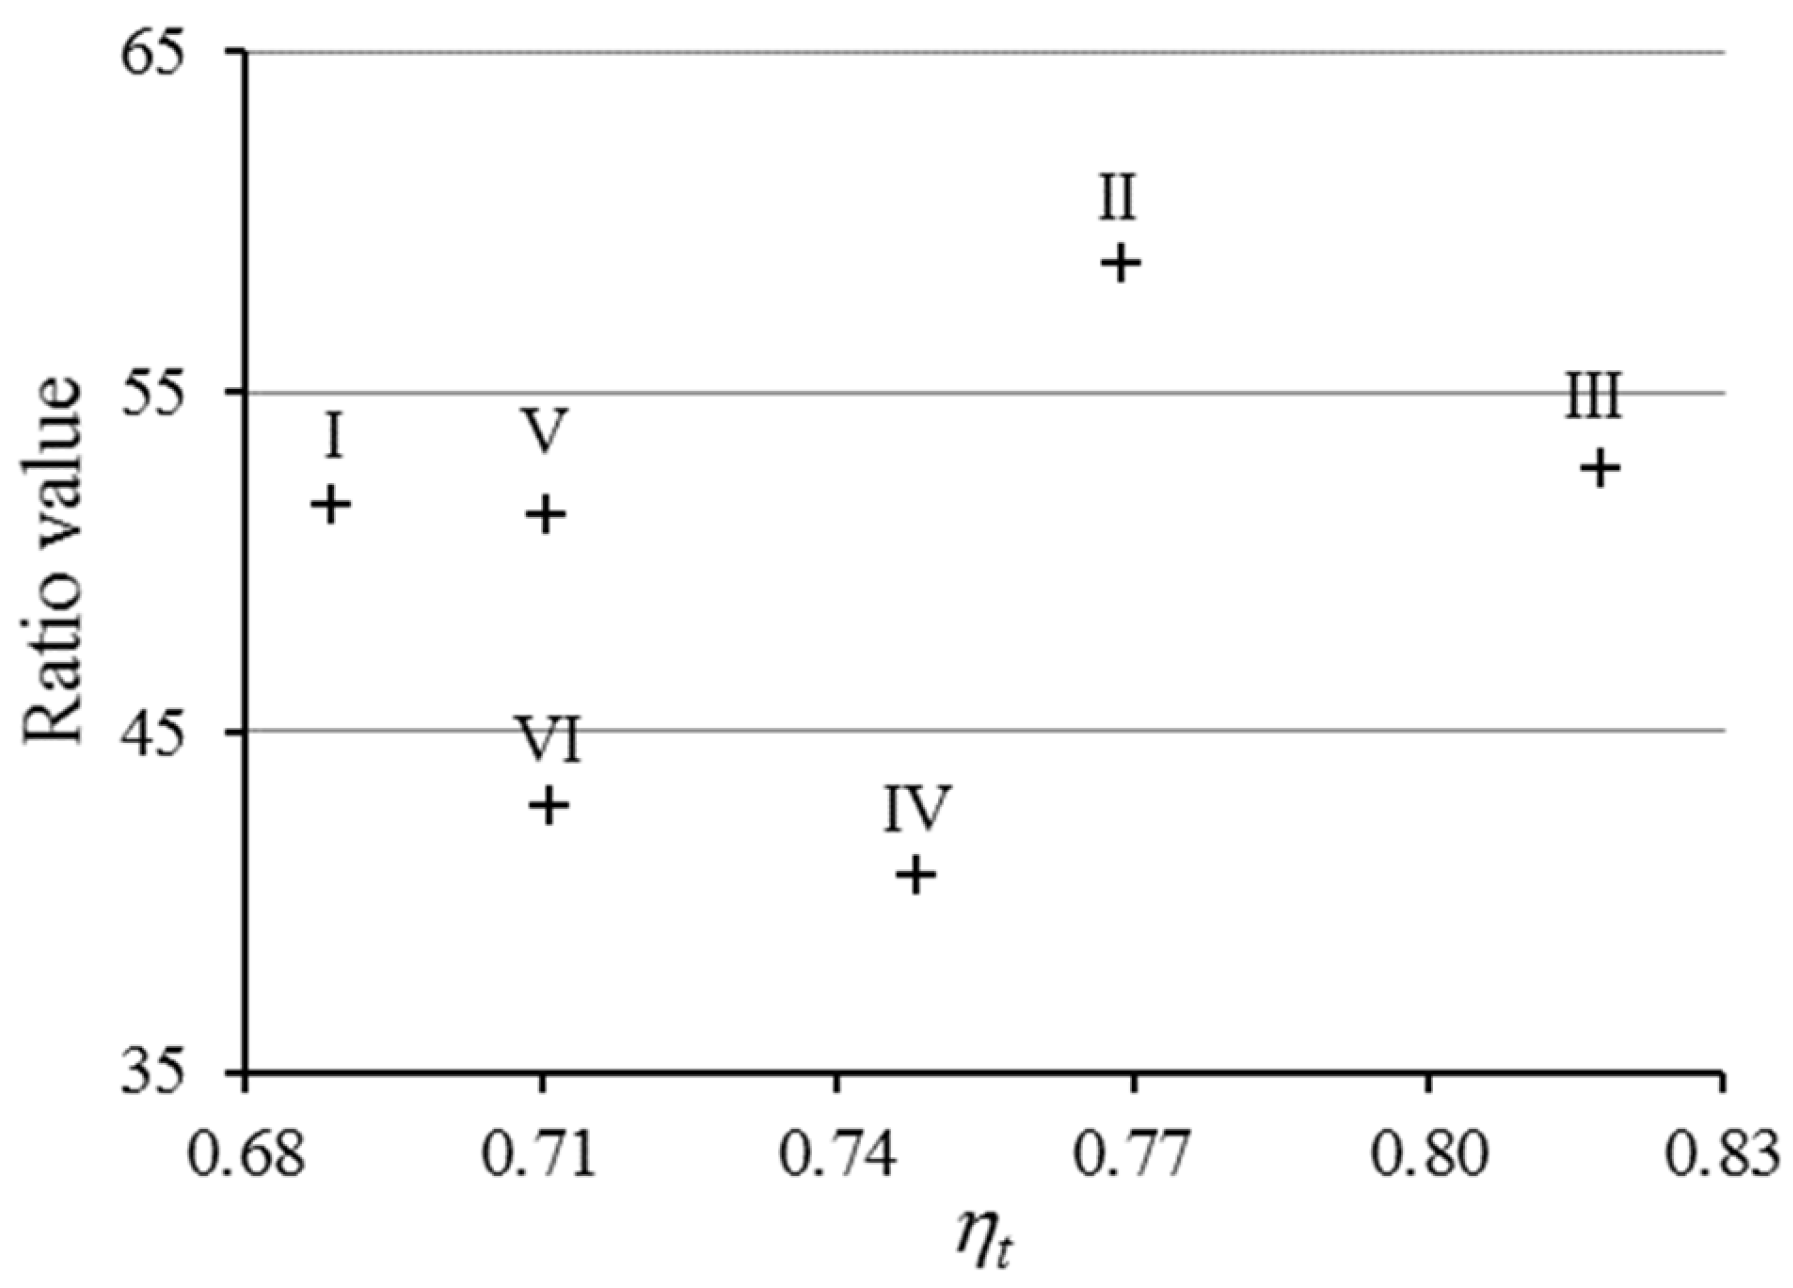
In addition, in order to facilitate the understanding of the results, an attempt was made to describe the shape of each field with practically known parameters, for example, the ratio of the area of the field to its perimeter. The relationship between the ratio of the field area to its perimeter and the coefficient of field ploughing time efficiency is presented in Figure 8. Figure 8 shows that there is no reliable relationship between the coefficient of field ploughing time efficiency and the ratio of the field area to its perimeter. Thus, from a practical point of view, the ratio of the area of the field to its perimeter is an obvious parameter, but it is not suitable for calculating the time efficiency factor of field ploughing.

Figure 8.
The relationship between the ratio of the field area to its perimeter and the coefficient of field ploughing time efficiency, marked as point (+): (I) 200 m wide, irregular quadrangular shape; (II) 133.3 m wide, rectangular shape; (III) 100 m wide, rectangular shape; (IV) 200 m wide, irregular quadrangular shape; (V) 183.3 m wide, rectangular shape; (VI) 50 m wide, irregular hexagonal shape.
In the following analysis, we will discuss the dependence of tractor fuel demand and CO2 emissions per hectare on the shape and dimensions of ploughed field plots, based on the values of field ploughing time efficiency coefficients. Here, the hourly fuel consumption for each field plot, calculated from the tractor ECM reports, was converted to fuel consumption per hectare, as is common practice in many agricultural studies. The dependences of tractor fuel consumption for productive ploughing, non-productive activities, and total field fuel consumption per hectare on the field ploughing time efficiency coefficient are shown in Figure 9.

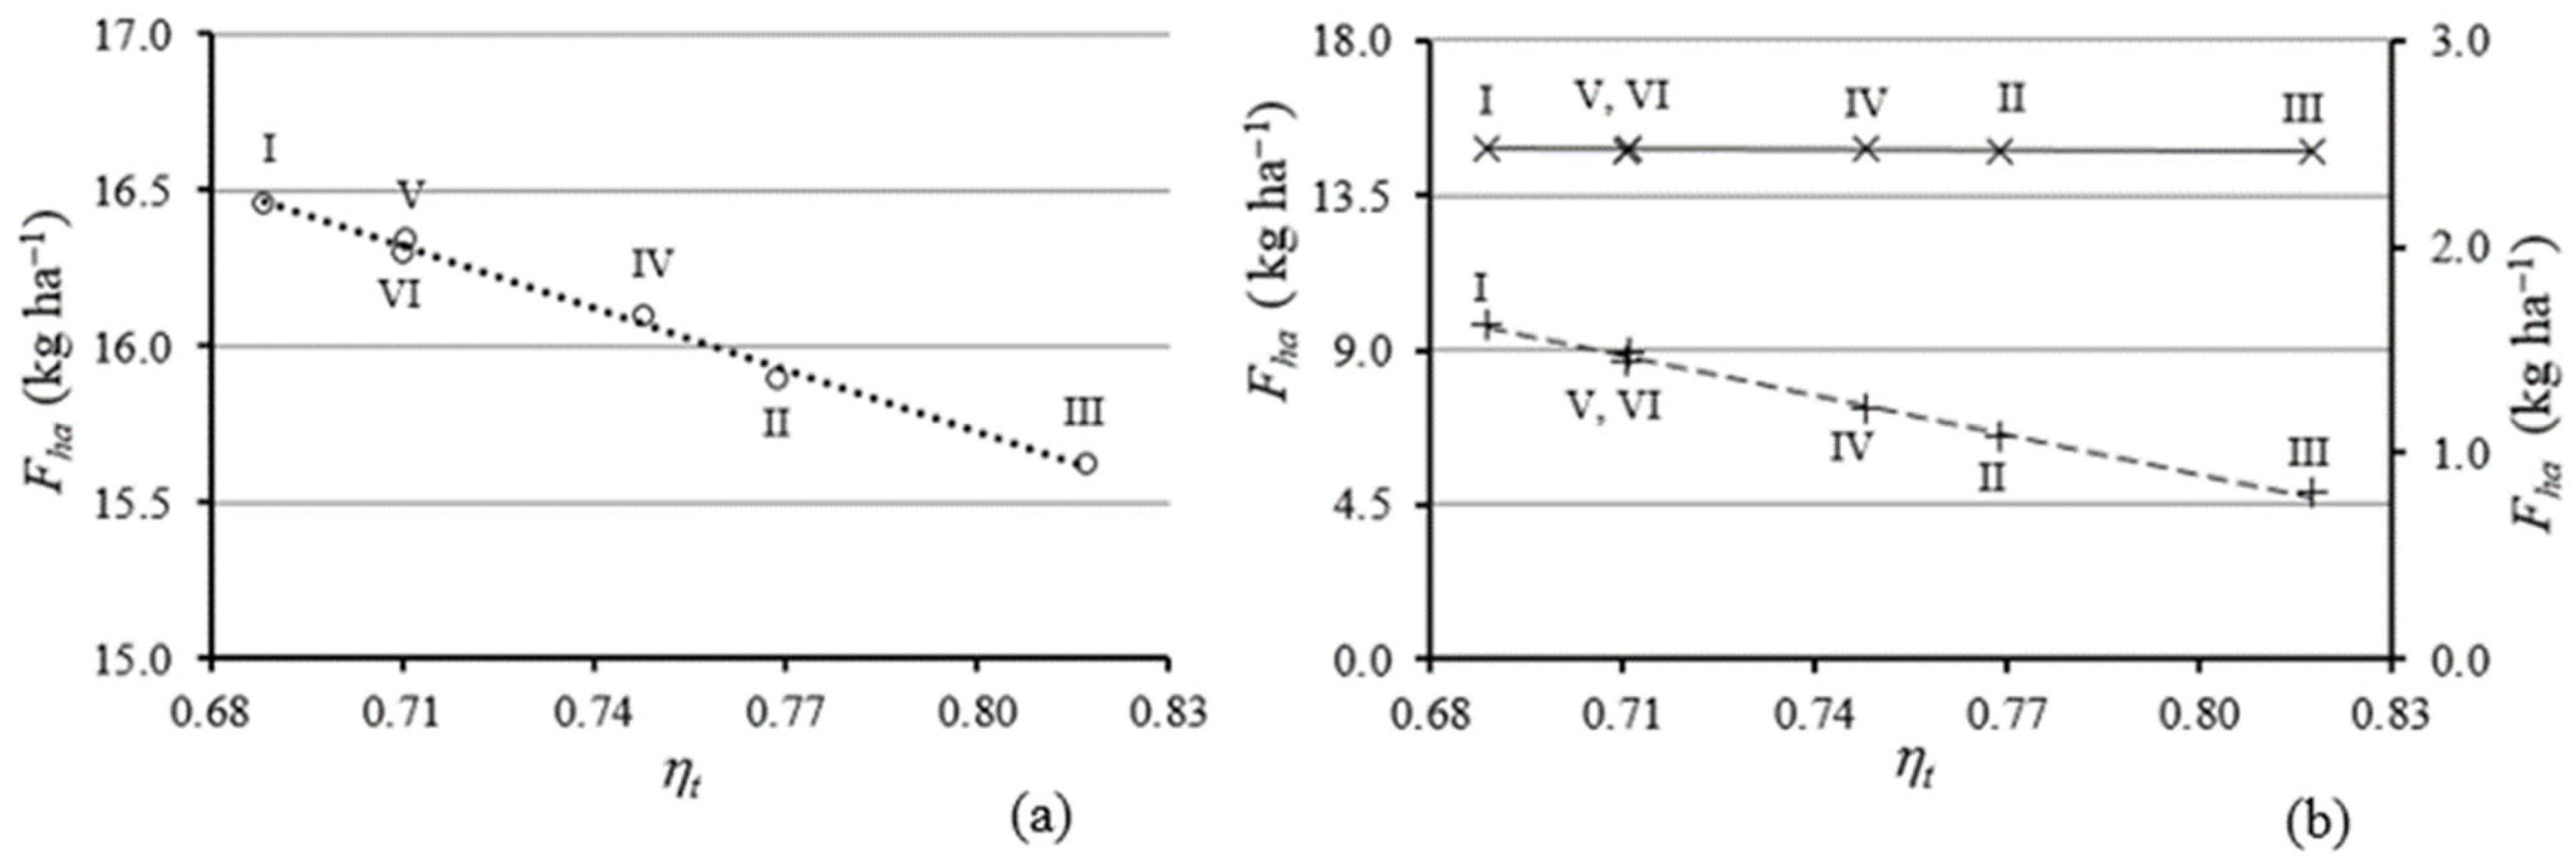
Figure 9.
Tractor fuel consumption when ploughing field plots of different shapes and dimensions, according to the field ploughing time efficiency coefficient: (a) ο is the total field fuel consumption; (b) × is the fuel consumption during productive ploughing; + is the fuel consumption during non-productive activities (on the secondary axis); (I) 200 m wide, irregular quadrangular shape; (II) 133.3 m wide, rectangular shape; (III) 100 m wide, rectangular shape; (IV) 200 m wide, irregular quadrangular shape; (V) 183.3 m wide, rectangular shape; (VI) 50 m wide, irregular hexagonal shape.
The dependences presented in Figure 9 show that the total field fuel consumption of the tractor, as well as the fuel consumption for non-productive activities when ploughing plots of different shapes and dimensions, have a linear relationship with the field ploughing time efficiency coefficient. Also, the obtained results show that the change in fuel consumption for productive ploughing from the field ploughing time efficiency coefficient was very insignificant—the value was about 14.85 kg ha−1. This allows us to say that the shape and dimensions of the field plot do not affect the fuel consumption of productive ploughing. Meanwhile, the fuel consumption of non-productive activities during ploughing depends greatly on the field ploughing time efficiency coefficient, which means that those costs also depend on the shape and dimensions of the field plot. As the time efficiency increases, when ploughing stubble plots of the same area but different shapes and dimensions, fuel consumption for non-productive activities decreases. Thus, the variation in field fuel consumption depending on the field ploughing time efficiency coefficient and, accordingly, on the shape and dimensions of the ploughed plot is determined by the non-productive activity of the ploughing process. In the investigated 6 ha stubble field plots, an increase in the field ploughing time efficiency coefficient from 0.68 to 0.82 reduced total fuel consumption per hectare by 0.85 kg ha−1, that is, from 16.47 kg ha−1 to 15.62 kg ha−1. Figure 10 shows the dependence of productive ploughing, non-productive activities, and total field CO2 emissions per hectare on the field ploughing time efficiency coefficient when ploughing stubble plots with the same area but different shapes and dimensions.
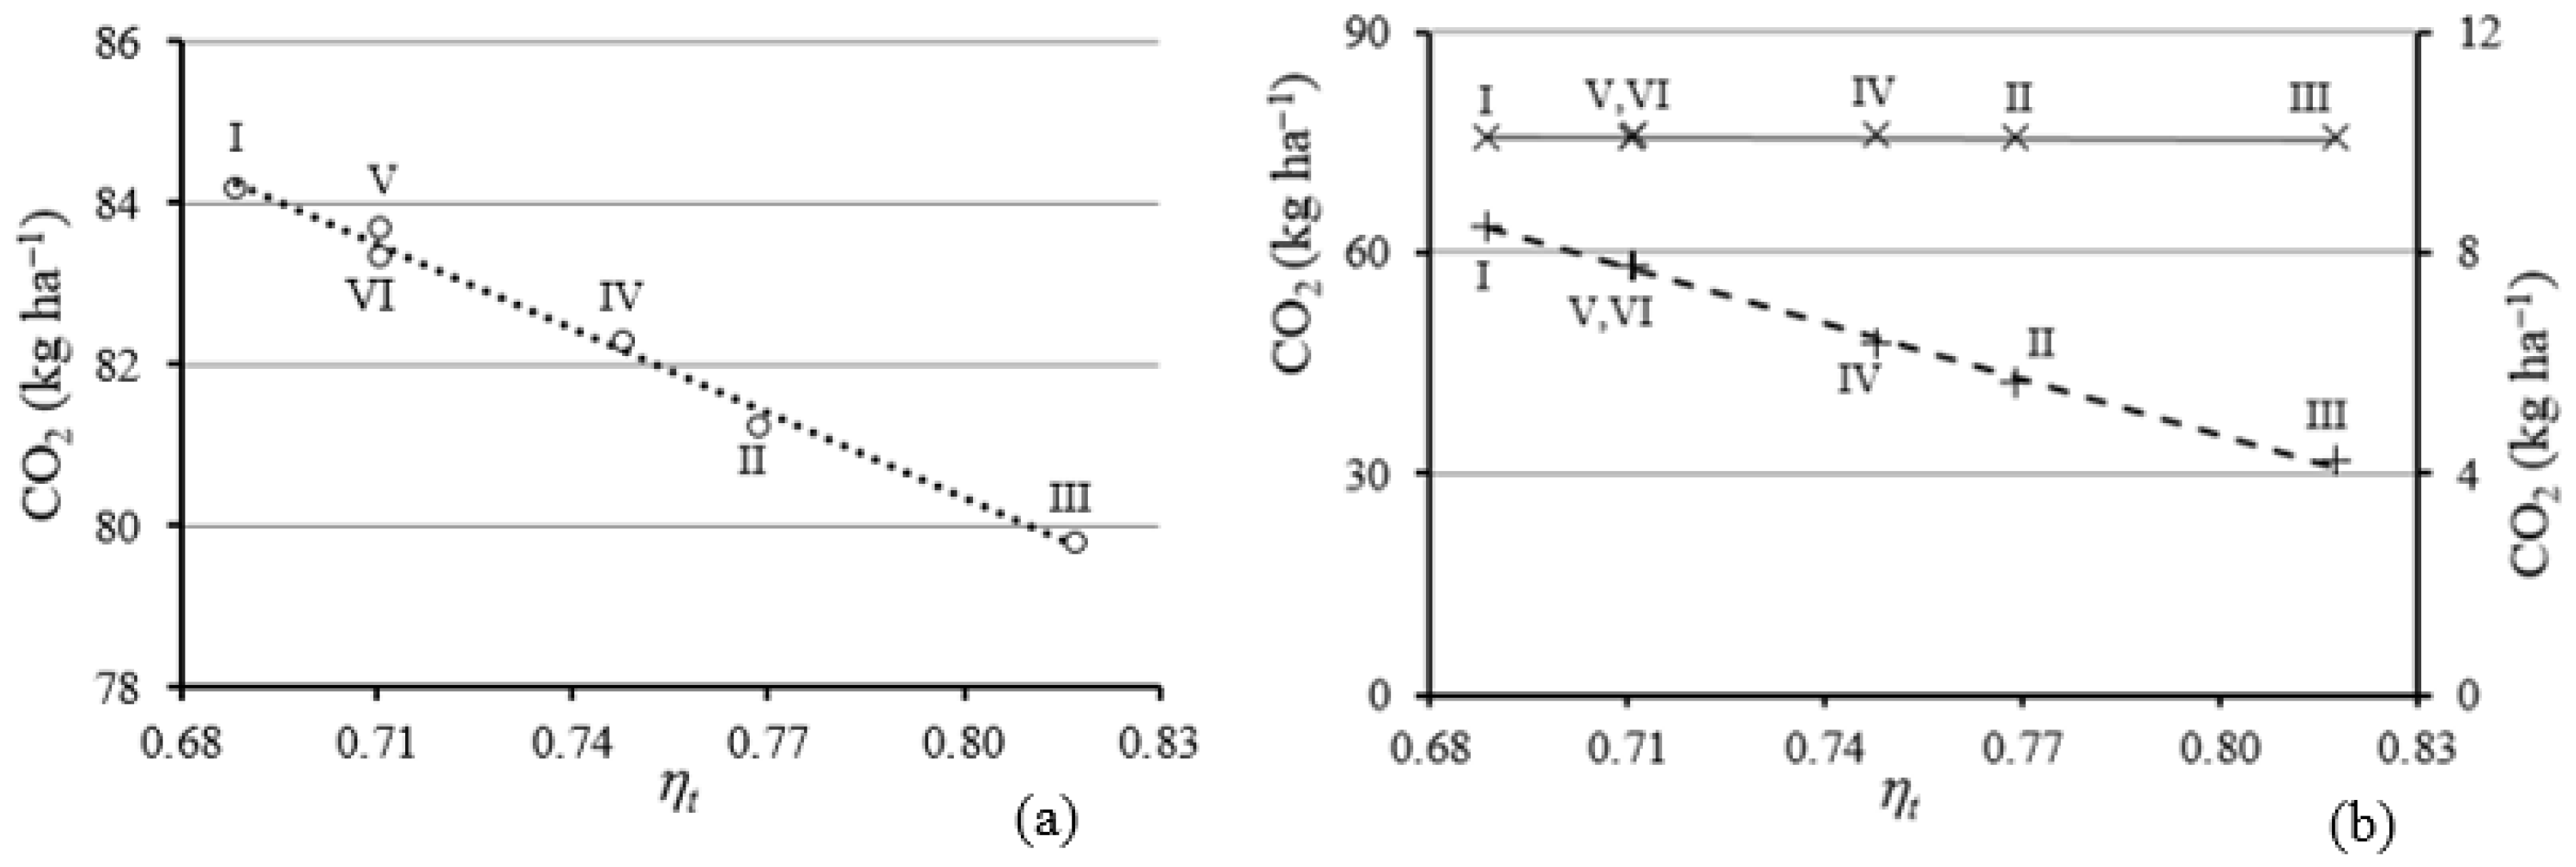
Figure 10.
Dependence of CO2 emissions per hectare on the field ploughing time efficiency coefficient when ploughing field plots of different shapes and dimensions: (a) ο is total field CO2 emissions; (b) × is the CO2 emissions during productive ploughing; + is CO2 emissions during non-productive activities (on the secondary axis); (I) 200 m wide, irregular quadrangular shape; (II) 133.3 m wide, rectangular shape; (III) 100 m wide, rectangular shape; (IV) 200 m wide, irregular quadrangular shape; (V) 183.3 m wide, rectangular shape; (VI) 50 m wide, irregular hexagonal shape.
The dependences presented in Figure 10 show that the total CO2 emissions of the tractor, as well as the CO2 emissions for non-productive activities when ploughing plots of different shapes and dimensions, have a linearly changing relationship with the field ploughing time efficiency coefficient. Also, the obtained results show that the change in CO2 emissions for productive ploughing from the field ploughing time efficiency coefficient was very insignificant, the value being about 63.10 ± 31 kg ha−1. The curves presented in Figure 9 and Figure 10 confirm the published results of previous studies [31,32,33] that CO2 emissions are inextricably linked to tractor fuel consumption. The CO2 emissions of a tractor engine are proportional to the amount of fuel burned [34,35]. Due to this relationship, as fuel consumption increases, CO2 emissions also increase proportionally. Analysis of the results revealed that during ploughing, 4.25 ± 2 kg of CO2 gas is released into the environment when 1 kg of diesel fuel is burned in the tractor engine. From the research results published by other authors [34,35,36], it can be seen that when 1 kg of diesel fuel is burned in the engine, somewhere between 3.3 and 4.5 kg of CO2 gas is emitted into the atmosphere. Thus, when ploughing fields with different shapes and dimensions, changes in CO2 emissions are proportional to changes in fuel consumption, and both actually depend only on non-productive activities in the ploughing process. In the investigated 6 ha field plots, the increase in the field ploughing time efficiency coefficient from 0.68 to 0.82 reduced field CO2 emissions by 4.30 kg ha−1, that is, from 70.32 kg ha−1 to 66.02 kg ha−1.
Researchers [2,4,5,7,37] have conducted field tillage and ploughing experiments with different implements, working regimes, and soil conditions, and obtained different fuel consumption per hectare, from 17 to 24 L ha−1. According to A. Soysal and H.H. Ozturk, the average fuel consumption for ploughing in 540 farms in Germany is 21.8 L/ha [38]. According to the data of A. Soysal and H.H. Ozturk, the results covering many farms are clearly defined, but the non-detailed limits of the conditions do not allow comparison of these data with specific research results. Tillage operations are quite complex and due to their complexity and differences in soil physical and mechanical properties, fuel consumption and CO2 emission values are widely dispersed in published research results [35,36]. Research reports provide the basic conditions of experimental studies, implement characteristics, working regimes, soil conditions, and field size, but often do not provide data on the shape and dimensions of the field. Moreover, in widely applied practice, fields of regular shape are often chosen for studies of one or other conventional properties. These studies show that fuel consumption results are affected by the shape and dimensions of the field, and without taking this into account the analysis will not be accurate under the given conditions.
Validation of the field ploughing time efficiency coefficient as an index of connectivity of field plots with different shapes and dimensions, which allows characterizing tractor fuel consumption and CO2 emissions when ploughing stubble field plots of the same area but with different shapes and dimensions, shows the novelty and uniqueness of this study. In addition, the specificity of this work is supplemented by the confirmed dependence of the linear relationship between the field ploughing time efficiency coefficient and tractor fuel consumption and CO2 emissions when ploughing stubble field plots of the same area, but with different shapes and dimensions. It is expected that the relationship between fuel consumption, CO2 emissions, and the shape and dimensions of the field plot, expressed in the time efficiency of field ploughing, determined in this study will contribute to the formation of cultivated fields and the management of their cultivation in order to reduce the impact on the environment.
4. Conclusions
Accelerating climate change requires scientists to develop new technologies to reduce CO2 emissions. Today, agriculture is dominated by arable fields of various sizes, shapes, and dimensions, and in order to evaluate the efficiency of the fuel used and CO2 emissions during their tillage, comparison methodology and criteria are needed.
This study presents a reasonable method for calculating the real field ploughing time efficiency coefficient based on field and tillage data and a practical determination method using tractor engine load reports. Using the theoretical method, the ploughing time efficiency for a particular field is calculated based on the area of the plot, its average length in the direction of ploughing, and the maximum width perpendicular to the direction of ploughing, as well as the duration of the tractor turning in the field headland, the width of the ploughing strip, and the actual speed of the tractor. In the practical determination method, the ploughing time efficiency of a particular field is determined by processing tractor ECM reports copied before and after work in that field. Theoretical calculations and experimental tests have shown that the field ploughing time efficiency coefficient is a useful metric for comparing field plots with different shapes and dimensions. This coefficient effectively describes tractor fuel consumption and CO2 emissions during ploughing operations on differently configured field plots.
It has been theoretically calculated and experimentally confirmed that tractor fuel consumption and CO2 emissions when ploughing fields of the same area, but of different shapes and dimensions, have a reliable linear relationship with the field ploughing time efficiency coefficient. It was found that during the research, when ploughing six field plots of different shapes and dimensions, with an area of 6 ha, the field ploughing time efficiency coefficient varied from 0.68 to 0.82, fuel consumption between 15.6 and 16.5 kg/ha, and CO2 emissions between 79.7 and 84.2 kg/ha. In the field plot of 6 ha, where the field ploughing time efficiency coefficient was 15% higher, the fuel consumption and CO2 emissions per unit area were lower by about 5.5%.
The results of this study make it possible to more effectively predict the tillage time and tractor fuel consumption required for different field shapes and dimensions. In order to determine the limits of fuel consumption prediction when operating in fields of various shapes and dimensions, research should be continued by expanding the variety of field sizes and shapes.
Author Contributions
Conceptualization, V.D. and A.J.; methodology, A.J.; investigation, A.J.; resources, V.D.; data curation, A.J.; writing—original draft preparation, A.J.; writing—review and editing, V.D.; visualization, A.J.; supervision, V.D. All authors have read and agreed to the published version of the manuscript.
Funding
This research received no external funding.
Institutional Review Board Statement
Not applicable.
Informed Consent Statement
Not applicable.
Data Availability Statement
The data supporting the findings of this study are available within the article.
Acknowledgments
This research was supported by the research programme “Productivity and sustainability of agricultural and forest soils” implemented by the Lithuanian Research Centre for Agriculture and Forestry.
Conflicts of Interest
The authors declare no conflict of interest.
References
- Varani, M.; Mattetti, M.; Molari, G.; Biglia, A.; Comba, L. Correlation between power harrow energy demand and tilled soil aggregate dimensions. Biosyst. Eng. 2023, 225, 54–68. [Google Scholar] [CrossRef]
- Lee, J.W.; Kim, J.S.; Kim, K.U. Computer simulations to maximise fuel efficiency and work performance of agricultural tractors in rotovating and ploughing operations. Biosyst. Eng. 2016, 142, 1–11. [Google Scholar] [CrossRef]
- Lovarelli, D.; Bacenetti, J.; Fiala, M. Effect of local conditions and machinery characteristics on the environmental impacts of primary soil tillage. J. Clean. Prod. 2017, 140, 479–491. [Google Scholar] [CrossRef]
- Moitzi, G.; Haas, M.; Wagentristl, H.; Boxberger, J.; Gronauer, A. Energy consumption in cultivating and ploughing with traction improvement system and consideration of the rear furrow wheel-load in ploughing. Soil Tillage Res. 2013, 134, 56–60. [Google Scholar] [CrossRef]
- Bacenetti, J.; Lovarelli, D.; Facchinetti, D. An environmental comparison of techniques to reduce pollutants emissions related to agricultural tractors. Biosyst. Eng. 2018, 171, 30–40. [Google Scholar] [CrossRef]
- Janulevičius, A.; Damanauskas, V. Prediction of tractor drive tire slippage under different inflation pressures. J. Terramechanics 2022, 101, 23–31. [Google Scholar] [CrossRef]
- Lacour, S.; Burgun, C.; Perilhon, C.; Descombes, G.; Doyen, V. A model to assess tractor operational efficiency from bench test data. J. Terramechanics 2014, 54, 1–18. [Google Scholar] [CrossRef]
- Abdullah Al-Amin, A.K.M.; Lowenberg DeBoer, J.; Franklin, K.; Behrendt, K. Economics of field size for autonomous crop machines. In Proceedings of the 15th International Conference on Precision Agriculture, Minneapolis, MN, USA, 26–29 June 2022; pp. 1–15. [Google Scholar]
- Guerrieri, M.; Fedrizzi, M.; Antonucci, F.; Pallottino, F.; Sperandio, G.; Pagano, M.; Figorilli, S.; Menesatti, P.; Costa, C. An innovative multivariate tool for fuel consumption and costs estimation of agricultural operations. Span. J. Agric. Res. 2016, 14, e0209. [Google Scholar] [CrossRef]
- Paris, B.; Vandorou, F.; Balafoutis, A.T.; Vaiopoulos, K.; Kyriakarakos, G.; Manolakos, D.; George Papadakis, G. Energy use in open-field agriculture in the EU: A critical review recommending energy efficiency measures and renewable energy sources adoption. Renew. Sustain. Energy Rev. 2022, 158, 112098. [Google Scholar] [CrossRef]
- Lowenberg-DeBoer, J.; Franklin, K.; Behrendt, K.; Godwin, R. Economics of autonomous equipment for arable farms. Precis. Agric. 2021, 22, 1992–2006. [Google Scholar] [CrossRef]
- Clough, Y.; Kirchweger, S.; Kantelhardt, J. Field sizes and the future of farmland biodiversity in European landscapes. Conserv. Lett. 2020, 13, e12752. [Google Scholar] [CrossRef] [PubMed]
- Martin, E.A.; Dainese, M.; Clough, Y.; Baldi, A.; Bommarco, R.; Gagic, V.; Steffan-Dewenter, I. The interplay of landscape composition and configuration: New pathways to manage functional biodiversity and agroecosystem services across Europe. Ecol. Lett. 2019, 22, 1083–1094. [Google Scholar] [CrossRef] [PubMed]
- Latruffe, L.; Piet, L. Does land fragmentation affect farm performance? A case study from Brittany, France. Agric. Syst. 2014, 129, 68–80. [Google Scholar] [CrossRef]
- Han, X.; Kim, H.-J.; Jeon, C.W.; Kim, J.H. Study to Develop Implement Control and Headland Turning Algorithms for Autonomous Tillage Operations. J. Biosyst. Eng. 2019, 44, 245–257. [Google Scholar] [CrossRef]
- Varani, M.; Perez Estevez, M.A.; Renzi, M.; Alberti, L.; Mattetti, M. Controlling idling: A ready-made solution for reducing exhaust emissions from agricultural tractors. Biosyst. Eng. 2022, 221, 283–292. [Google Scholar] [CrossRef]
- Bulgakov, V.; Ivanovs, S.; Adamchuk, V.; Nadykto, V. Theoretical investigation of turning ability of machine and tractor aggregate on basis of ploughing and intertilling wheeled tractor. Eng. Rural Dev. 2016, 1077–1084. [Google Scholar]
- Bulgakov, V.; Pascuzzi, S.; Adamchuk, V.; Nadykto, V.; Ivanovs, S.; Aboltins Kaletnik, A.H.; Santoro, F.; Vicino, F.; Nowak, J. Theoretical study of the trajectory of movement of a ploughing aggregate with a reversible plough on the headlands. In Proceedings of the International Symposium on Farm Machinery and Processes Management in Sustainable Agriculture 2022; Lecture Notes in Civil Engineering; Springer: Cham, Switzerland, 2022; Volume 289, pp. 27–35. [Google Scholar] [CrossRef]
- Fedrizzi, M.; Antonucci, F.; Sperandio, G.; Figorilli, S.; Pallottino, F.; Costa, C. An artificial neural network model to predict the effective work time of different agricultural field shapes. Span. J. Agric. Res. 2019, 17, e0201. [Google Scholar] [CrossRef]
- Seyyedhasani, H.; Dvorak, J.S. Reducing field work time using fleet routing optimization. Biosyst. Eng. 2018, 169, 1–10. [Google Scholar] [CrossRef]
- Gołasa, P.; Wysokinski, M.; Bienkowska-Gołasa, W.; Gradziuk, P.; Golonko, M.; Gradziuk, B.; Siedlecka, A.; Gromada, A. Sources of Greenhouse Gas Emissions in Agriculture, with Particular Emphasis on Emissions from Energy Used. Energies 2021, 14, 3784. [Google Scholar] [CrossRef]
- Janulevičius, A.; Damanauskas, V. Validation of relationships between tractor performance indicators, engine control unit data and field dimensions during tillage. Mech. Syst. Signal Process. 2023, 191, 110201. [Google Scholar] [CrossRef]
- Janulevičius, A.; Šarauskis, E.; Čiplienė, A.; Juostas, A. Estimation of farm tractor performance as a function of time efficiency during ploughing in fields of different sizes. Biosyst. Eng. 2019, 179, 80–93. [Google Scholar] [CrossRef]
- Bochtis, D.D.; Vougioukas, S.G. Minimising the non-working distance travelled by machines operating in a headland field pattern. Biosyst. Eng. 2008, 101, 1–12. [Google Scholar] [CrossRef]
- Tu, X.; Tang, L. Headland turning optimisation for agricultural vehicles and those with towed implements. J. Agric. Food Res. 2019, 1, 100009. [Google Scholar] [CrossRef]
- ASABE ASAE S313.3; Soil Cone Penetrometer. American Society of Agricultural and Biological Engineers: St. Joseph, MI, USA, 2004.
- ASAE EP496.3; Agricultural Machinery Management. American Society of Agricultural and Biological Engineers: St. Joseph, MI, USA, 2006; pp. 384–390.
- Abdullah Al-Amin, A.K.M.; Lowenberg DeBoer, J.; Franklin, K.; Behrendt, K. Economics of field size and shape for autonomous crop machines. Precis. Agric. 2023, 24, 1738–1765. [Google Scholar] [CrossRef]
- Exhaust and Crankcase Emission Factors for Nonroad Engine Modeling: Compression-Ignition; EPA-420-R-10-018, NR-009d; US Environmental Protection Agency: Washington, DC, USA, 2010.
- Janulevičius, A.; Čiplienė, A. Estimation of engine CO2 and NOx emissions and their correlation with the not-to-exceed zone for a tractor ploughing fields of various sizes. J. Clean. Prod. 2018, 198, 1583–1592. [Google Scholar] [CrossRef]
- Pishgar-Komleh, S.H.; Ghahderijani, M.; Sefeedpari, P. Energy consumption and CO2 emissions analysis of potato production based on different farm size levels in Iran. J. Clean. Prod. 2012, 33, 183–191. [Google Scholar] [CrossRef]
- Shin, C.S.; Kim, K.U. CO2 Emissions by Agricultural Machines in South Korea. Appl. Eng. Agric. 2018, 34, 311–315. [Google Scholar] [CrossRef]
- Janulevičius, A.; Juostas, A.; Čiplienė, A. Estimation of carbon-oxide emissions of tractors during operation and correlation with the not-to-exceed zone. Biosyst. Eng. 2016, 147, 117–129. [Google Scholar] [CrossRef]
- API Compendium of Greenhouse Gas Emissions Methodologies for the Natural Gas and Oil Industry; American Petroleum Institute: Washington, DC, USA, 2021; p. 20001.
- Filipovic, D.; Kosutic, S.; Gospodaric, Z.; Zimmer, R.; Banaj, D. The possibilities of fuel savings and the reduction of CO2 emissions in the soil tillage in Croatia. Agric. Ecosyst. Environ. 2006, 115, 290–294. [Google Scholar] [CrossRef]
- Šarauskis, E.; Vaitauskienė, K.; Romaneckas, K.; Jasinskas, A.; Butkus, V.; Kriaučiūnienė, Z. Fuel consumption and CO2 emission analysis in different strip tillage scenarios. Energy 2017, 118, 957–968. [Google Scholar] [CrossRef]
- Ettl, J.; Bernhardt, H.; Pickel, P.; Remmele, E.; Thuneke, K.; Emberger, P. Transfer of agricultural work operation profiles to a tractor test stand for exhaust emission evaluation. Biosyst. Eng. 2018, 176, 185–197. [Google Scholar] [CrossRef]
- Soysal, A.; Ozturk, H.H. Energy Saving Measures for Soil Tillage. Eur. J. Agric. Food Sci. 2023, 5, 590. [Google Scholar] [CrossRef]


Disclaimer/Publisher’s Note: The statements, opinions and data contained in all publications are solely those of the individual author(s) and contributor(s) and not of MDPI and/or the editor(s). MDPI and/or the editor(s) disclaim responsibility for any injury to people or property resulting from any ideas, methods, instructions or products referred to in the content. |
© 2023 by the authors. Licensee MDPI, Basel, Switzerland. This article is an open access article distributed under the terms and conditions of the Creative Commons Attribution (CC BY) license (https://creativecommons.org/licenses/by/4.0/).