Article

Proposal of an Original Methodology to Evaluate the Performance of Chipper Machines

1
Consiglio per la Ricerca in Agricoltura e l’Analisi dell’Economia Agraria (CREA), Centro di Ricerca Ingegneria e Trasformazioni Agroalimentari, Via della Pascolare 16, 00015 Monterotondo, Italy
2
National Research Council of Italy (CNR), Institute of Research on Terrestrial Ecosystems, Via Salaria km 29.300, 00015 Monterotondo, Italy
*
Author to whom correspondence should be addressed.
AgriEngineering 2024, 6(2), 1619-1638; https://doi.org/10.3390/agriengineering6020092
Submission received: 11 March 2024 / Revised: 21 May 2024 / Accepted: 28 May 2024 / Published: 4 June 2024
(This article belongs to the Section Agricultural Mechanization and Machinery)

Abstract

:
Wood fuel from the agroforestry sector is one of the main strategies cited by the EU for reducing energetic dependance on foreign markets. Its sustainability, both economic and environmental, can be improved through the optimization of harvesting and chipping operations. This study was focused on the dynamic and energetic balance of the chipping phase carried out by a chipper operated by the power-take-off (PTO) of a medium-power tractor. Both machines were equipped with sensors for real-time monitoring of fuel consumption, PTO torque and speed, trunk diameter and working time during the comminution of 61 poplar trees grown in a medium rotation coppice system. The data analysis was carried out on the entire dataset (about 29,000 records) without considering their belonging to different trees. By means of proper data ordinations, it has been possible to define all the intervals in which the chipping stopped (e.g., between two trees) and to exclude them from the intervals of actual chipping. This has allowed forcomputation of operative and actual working time, as well as of the basic power required to operate the chipper and the power for actual chipping. Subsequently, the parameter values observed during actual chipping were related to the cutting diameters measured at the same instant. Subsequently, the dataset was divided according to seven diameter classes, and, for each class, the descriptive statistical indices of working time, work productivity, CO2 emissions, energy requirement and fuel consumption were calculated. Eventually, the correlation between the variations in trunk diameter and other parameters was verified both on the whole dataset and based on the class average values. The analysis made it possible to identify the conditions of greatest efficiency for the chipper. More generally, the method could help to increase the accuracy of measurements aimed at characterizing the performance of chippers from the point of view of dynamic energy requirements as well as in relation to different wood species.

1. Introduction

Among the challenges that the EU will face in next years, limiting global warming and achieving energy independence are certainly of crucial importance. The exploitation of renewable energy sources can help in reaching both objectives [1,2]. The agroforestry sector can significantly contribute to the production of renewable solid fuels [3,4,5], considering that the production of renewable energy should reach 32% of the whole domestic energy production by 2030. Beyond natural forests, solid biofuel can also be obtained from dedicated energy crops [6] based on fast growing species, like poplar (Populus spp.) which is usually employed as a stabilizer of the wood supply to the market, granting price stability and constant revenues [7,8], which are fundamental conditions for a successful shifting from fossil fuels to renewable energy [9].
The cultivation systems mainly being adopted for the fast growing species are the medium rotation coppice (MRC) and the short rotation coppice (SRC). The first is characterized by a wood harvesting period of 5–7 years and trunk mean diameter of 15–20 cm [10,11], which determine higher production of biomass of better quality than in SRC systems due to the reduced bark/fiber ratio [12,13].
The aspects of energy requirements and costs related to the felling and extraction of trunks have been widely studied both in SRC and MRC [10], while, with regard to wood comminution, which is an operation with high energy requirements (ranging from 10 to 150 kWh·Mg−1) [14], further investigation is needed in order to contribute to the reduction in fuel consumption and CO2 emissions [15].
The wood comminution can be obtained by means of chippers or grinders, characterized, respectively, by knives and hammers as working tools [16,17]. The latter are used in the presence of hard impurities like nails and stones [18], while the chippers are preferred on uncontaminated wood because of the higher quality of the final product (chips) and the lower energy requirements per unit of biomass [13].
These can be influenced by the characteristics of the biomass processed (such as wood hardness, storage time, wood humidity [19] and the dimensions of raw materials [20]) as well as by those of the chippers (such as type (e.g., disc or drum) [21], design [22], dimensions and settings of cutting angle, speed of wood feeding, speed of the power-take-off (PTO) of the tractor which operates the chipper [23,24] and screen size [25,26]).
Energy requests are also influenced by the state of efficiency of the chipping tools, whose progressive wear leads to increases in energy loss and fuel consumption [22].
The evaluation of the performance of chippers from the point of view of energy requirement is often carried out indirectly by observing the overall variations in some parameters, such as productivity (Mg h−1, m3 h−1), fuel consumption (kg h−1; kg Mg−1) [27] and time consumption (h m−3; h Mg−1) [28,29], measured at the end of chipping with reference to the start of the operation by weighting the mass of wood chips produced and by determining the fuel volume needed to refill the reservoir.
More detailed information on the performances of chippers can be obtained through direct measurement of the main operating parameters by means of specific sensors. These can be used in laboratory conditions in tests aimed at studying the forces related to the variation in cutting speeds, cutting angles, chip lengths and changing knives in an electrically operated wood chipper [30].
As to the application of sensors in field tests, torque transducers and digital encoders were applied to the PTO of the tractors which operate the chippers to measure, respectively, the torque and the rotational PTO speed. These parameters were used to calculate the power required by the chipper, in terms of average and maximum values, to characterize the operation relating to the production of wood chips and to verify the correct coupling between the chipper and tractor and/or the correct sizing of the machines used, with reference to the type of work to be carried out [31]. These sensors were later integrated by fuel consumption meters (volumetric or gravimetric) applied to the fuel circuit, which increased the accuracy of such a type of measurement [32], and by potentiometric encoders capable of measuring the diameter of logs as they enter the chipper, with the aim of studying the relationship between log dimensions and power and energy demand [19].
The association of direct measurement of the diameter of logs as they enter the chipper with the data of the PTO torque, speed and fuel consumption being contemporaneously measured could significantly improve the quality of the results provided by the chipper testing activity. For this reason, said sensor configuration was adopted in the present study, which involved the sequential chipping of 61 trees resulting from the felling of a medium rotation poplar coppice. The chipping test was carried out by means of a small-scale forestry chipper powered by an agricultural tractor. Both machines were sensorized for real-time measurement of the following basic operational parameters: working time, fuel consumption, speed and torque at tractor PTO, trunk diameter and trunk feeding speed. These were used to calculate derivative parameters like power, operative and actual working time, volume and mass of chipped wood, hourly fuel consumption, specific fuel consumption (per mass unit), energy, specific energy (per mass unit), specific costs (per mass unit) and CO2 emissions. The resulting dataset consisted of approximately 29,000 records. Each record was made up of the series of measured and calculated values relating to all the parameters mentioned, all referring to the same instant of time.
The aim of this study was to propose an original method for the analysis of the data. According to this method, the dataset was processed as a whole regardless of the fact that the data came from different trees. Through subsequent and appropriate sorting of the data, it was possible to extract from the original dataset detailed information on the phases of the chipping and on the relationship between the operational parameters, as well as to verify the presence of significant correlations between them. The most significant variables were clustered according to classes of diameter and statistically analyzed. Eventually, the whole series of values of the variables directly measured during the tests were used as independent variables to develop high R2 multi-linear regression (MLR) models capable of assessing six dependent variables, mostly concerning energetic aspects and costs of the chipper performance.

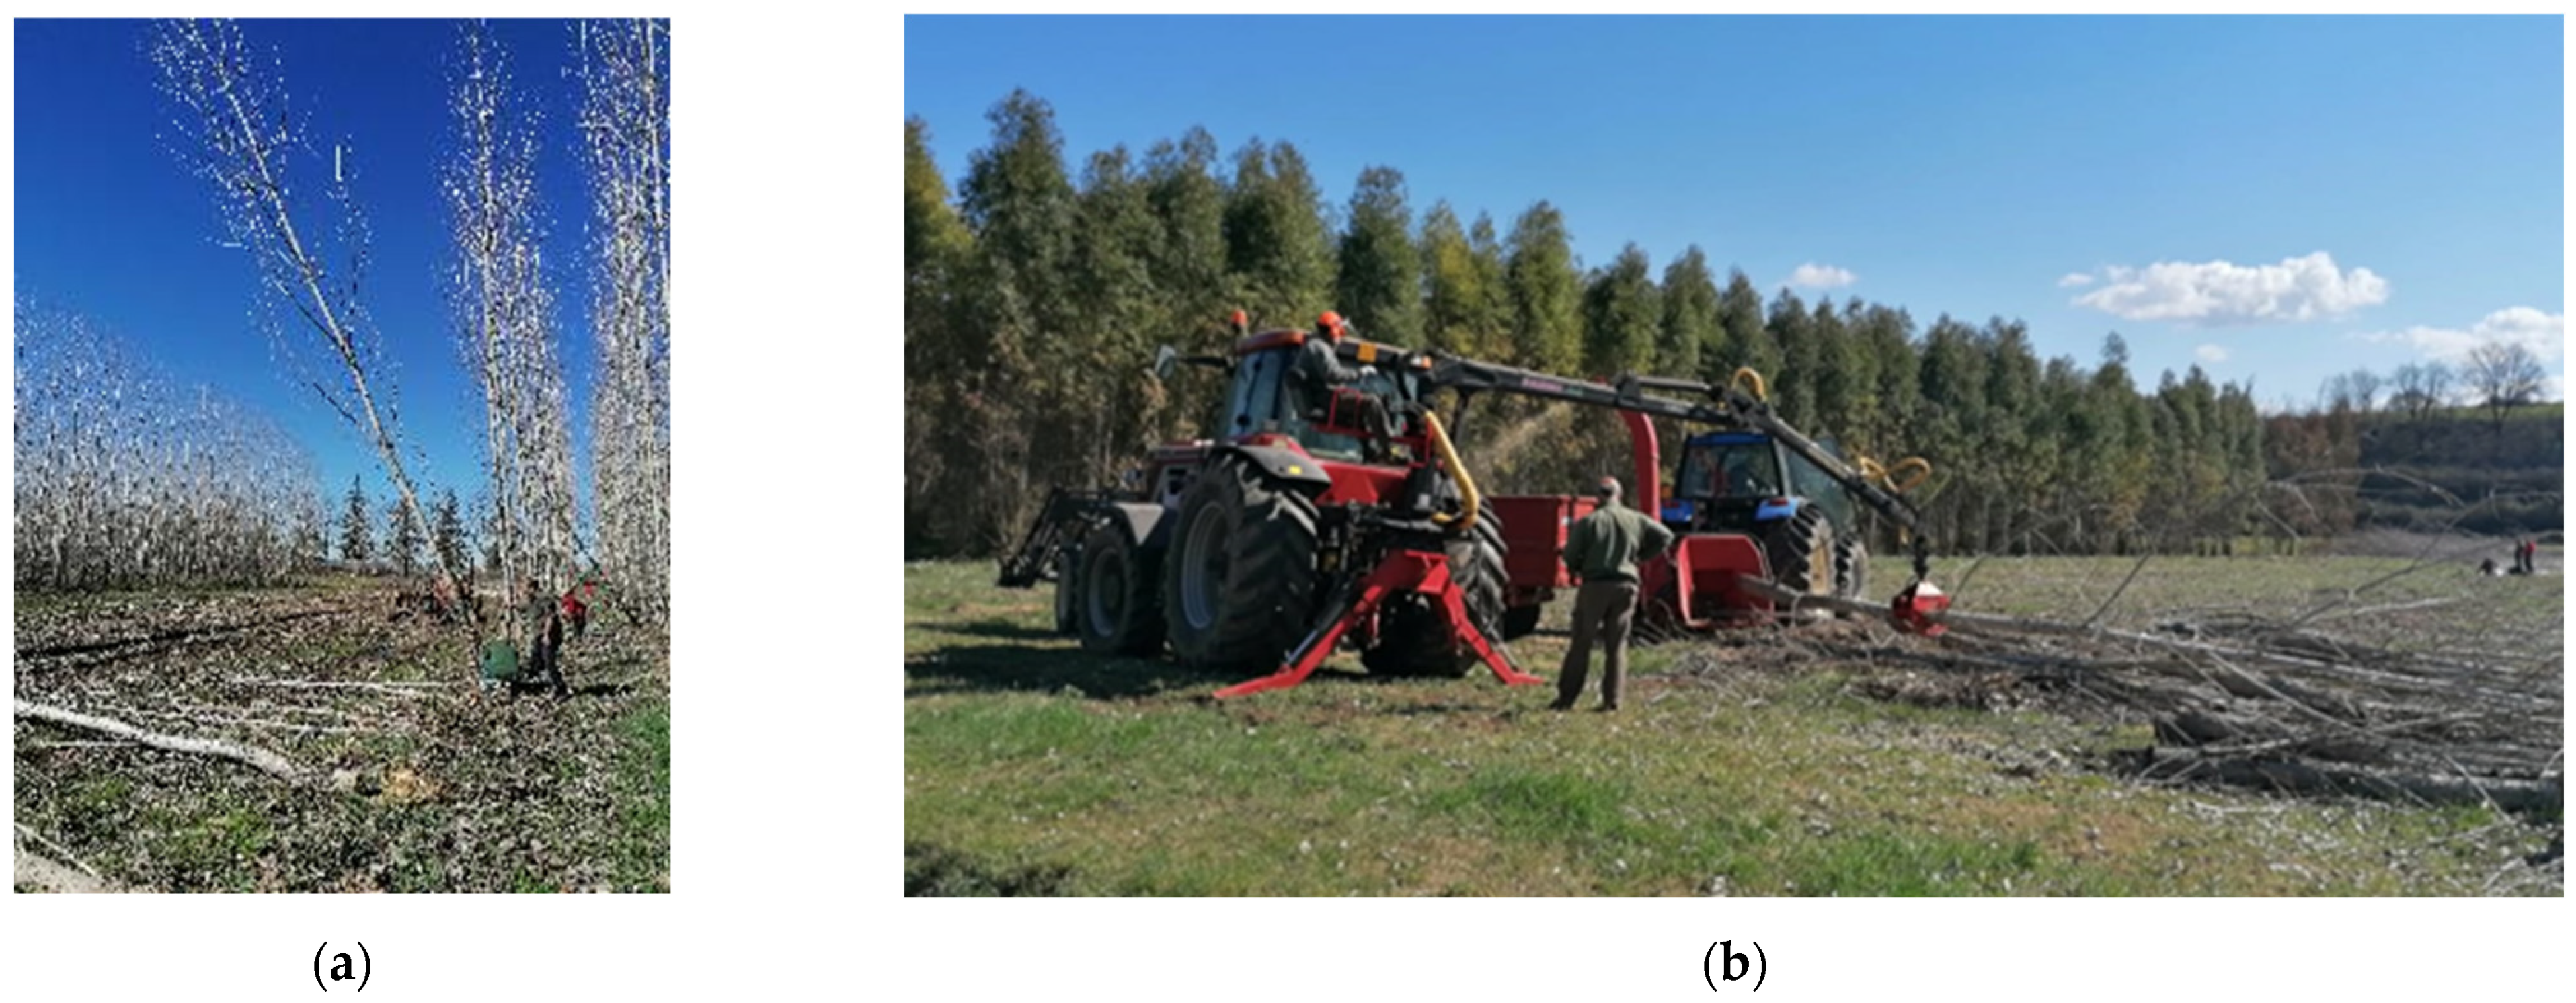
2. Materials and Methods

The test consisted of the sequential chipping of 61 trees resulting from the felling of a 7-year-old MRC poplar crop (clone AF8) grown without irrigation or fertilization in a 0.42 ha field located in Monterotondo (Rome, Italy). Plants spacing was 2 × 3 m approximately, corresponding to 1700 plants ha−1 with an average diameter of 13 cm (diameter at breast height), average height of 1.2 m corresponding to a 0.08 m3 in volume (according to the national allometric equations developed for poplar), corresponding to a theoretical yield of 43.178 Mg DM ha−1. The average wood moisture, determined at harvesting with the gravimetric method according to the ISO 18134-2:2024 [33], was 54.05%. The felling was carried out using a professional Stihl 201TX chainsaw. To reduce the massive dispersion of highly impactful pollutants from mineral chain lubricants, due to the chainsaw’s total loss lubrication system, the felling operations were carried out using a highly biodegradable biolubricant [34]. A tractor equipped with a front lift moved the felled plants out of the field where the chipping test took place (Figure 1).
Table 1 reports a synthetic description of the machineries used in the chipping test and of the sensor system used to collect the data.
The chipping was carried out by means of a small-scale forestry chipper operated by the PTO of a tractor. To feed the chipper with the felled plants, a hydraulic forestry crane equipped with a grapple and operated by a second tractor was used. To reduce the risk due to possible oil leaks in the test environment, both the chipper and hydraulic crane were supplied with a vegetable-based hydraulic fluid, previously tested in a specific experimental test rig [35]. Although all felled plants were chipped, the very chipping test concerned 61 trees randomly chosen from the total. During the test, the tractor and chipper were equipped with an instrumental chain specifically developed at CREA for testing agricultural machinery [36] that was capable of monitoring in real time several parameters descriptive of machine performance; it is described in Table 1. A torquemeter, a digital encoder and a photoelectric encoder were installed at the tractor PTO (Figure 2a) to measure, respectively, the torque exerted by the engine to operate the chipper and the PTO rotational speed, parameters which allow for calculating the power absorption. The tractor was also fitted with a volumetric fuel consumption meter which provided the volume (cm3) of fuel actually consumed by difference between delivered and recovered fuel (Figure 2b).
Considering that the tractor was around 30 years old, its efficiency conditions were verified in tests at the dynamometric brake (Table 2). The tests provided the characteristic curves of the engine (torque, power, fuel hourly consumption and specific consumption) at maximum fuel delivery, according to the OECD Code No. 2 standard for the testing of tractors [37], and of the engine efficiency. Further tests were conducted at the dynamometric brake, properly setting the engine speed (through the adjustment of fuel delivery) and PTO torque in order to replicate the engine load conditions encountered during the chipping.
As to the chipper, its infeed upper roller was sensorized with a potentiometric string encoder whose elongation continuously measured its vertical displacement (corresponding to the distance from the lower roller), thus providing the variation in the diameter of the trunk being chipped as it entered the machine (Figure 3). The parameters directly measured by the system were time, t (s), fuel consumption, F (cm3), PTO speed, s (min−1); PTO torque, T (daNm) and trunk diameter, D (mm).
The data were collected by an on-board PC equipped with a PCI card. The time of test was measured by the internal timer of the PC and was associated with each record of the measured parameters. The frequency of acquisition was set at 20 Hz, with an average acquisition time of 0.2 s. The instant time ti (interval of time between two acquisition) was used to calculate the instant values of the time-dependent parameters derived from the measured ones like, e.g., the instant hourly fuel consumption from the fuel volume consumed in ti between two acquisitions.
Data acquisition started with the introduction of the first tree into the chipper and stopped at the end of the comminution of the 61st tree, providing the base dataset consisting of all the parameter values measured in real time. These were monitored throughout the test to verify that the system was working correctly.
Table 2 shows all parameters used to evaluate the performance of the chipper divided into the following two categories: measured and derived. The base dataset consisted of all records carried out during the total test time. The base dataset was processed remotely by means of the software Microsoft Excel 365. The first step of the data elaboration was the calculation of the derived parameters, according to the relations reported in Table 2, which provided the final dataset.
The next step involved the analysis of the curve diagrams of the instantaneous values of the trunk diameters and of the torque exerted to cut all 61 trees in sequence. The data regarding trunk diameters and those of other sensors had to be synchronized due to the delay (≅ 3 s) between the time the trunk entered the feed rollers and the time it reached the chipper, causing variations in torque, PTO speed and fuel consumption. Assuming that the maximum torque is applied when the diameter is maximum, the synchronization was achieved by sliding the series of trunk diameters forward so that its peaks coincided with those of the torque and PTO speed. The diagrams of synchronized parameters allowed us to distinguish the 61 intervals of time of actual chipping from the intervals between contiguous trees (where the machine was running without chipping). With reference to the parameters reported in Table 2, the blocks of data corresponding to said intervals were accurately selected and extracted from the final dataset of synchronized data, and the instant values were used to determine the following parameters, which provided general information on the chipper performance:
-
Actual time, ta, (net chipping time) by difference between operative time, top, (total time of test) and basic time, tb (sum of the time intervals in which the machine was running without chipping).
-
Net power, Wn, (average power required only by chipping) by difference between gross power, Wg, (average total power measured) and basic power, Wb (average power needed to operate the chipper at the required rotational speed without chipping).
-
Actual fuel consumption, Fa (fuel meanly consumed in ta), by difference between operative fuel consumption, Fop (average total consumption observed in top), and basic fuel consumption, Fb (average consumption observed in tb).
-
Operative energy, Eop, by multiplying the test average power, Wg, by top.
-
Actual energy, Ea, by multiplying the average total power employed in chipping (Wn + Wb) by ta.
-
Basic energy, Eb, by multiplying the average basic power, Wb, by to.
The data analysis concerned the whole set of actual chipping instant data. The dataset was formed by the variables reported in Table 2. They underwent the Shapiro–Wilk normality test and the Levene test for the homogeneity of the variance. Then, the dataset was clustered according to seven diametric classes to highlight the behaviors of the variables and the differences among classes by means of ANOVA and a Mann–Whitney pairwise test. Basing on the results of said elaboration, some variables were chosen among those directly provided by the sensor system as predictors (independent variables) in Multiple Linear Regression (MLR) models proposed to assess the following dependent variables: (1) gross power, Wg, (kW); (2) hourly fuel consumption, Fch, (kg·h−1); (3) mass of chipped wood, M (kg); (4) gross energy Eg, (kWh); (5) specific cost, Csp, (EUR · Mg−1). The analysis was conducted via XLSTAT 2023.3.0 (1415) statistical software.

3. Results and Discussion

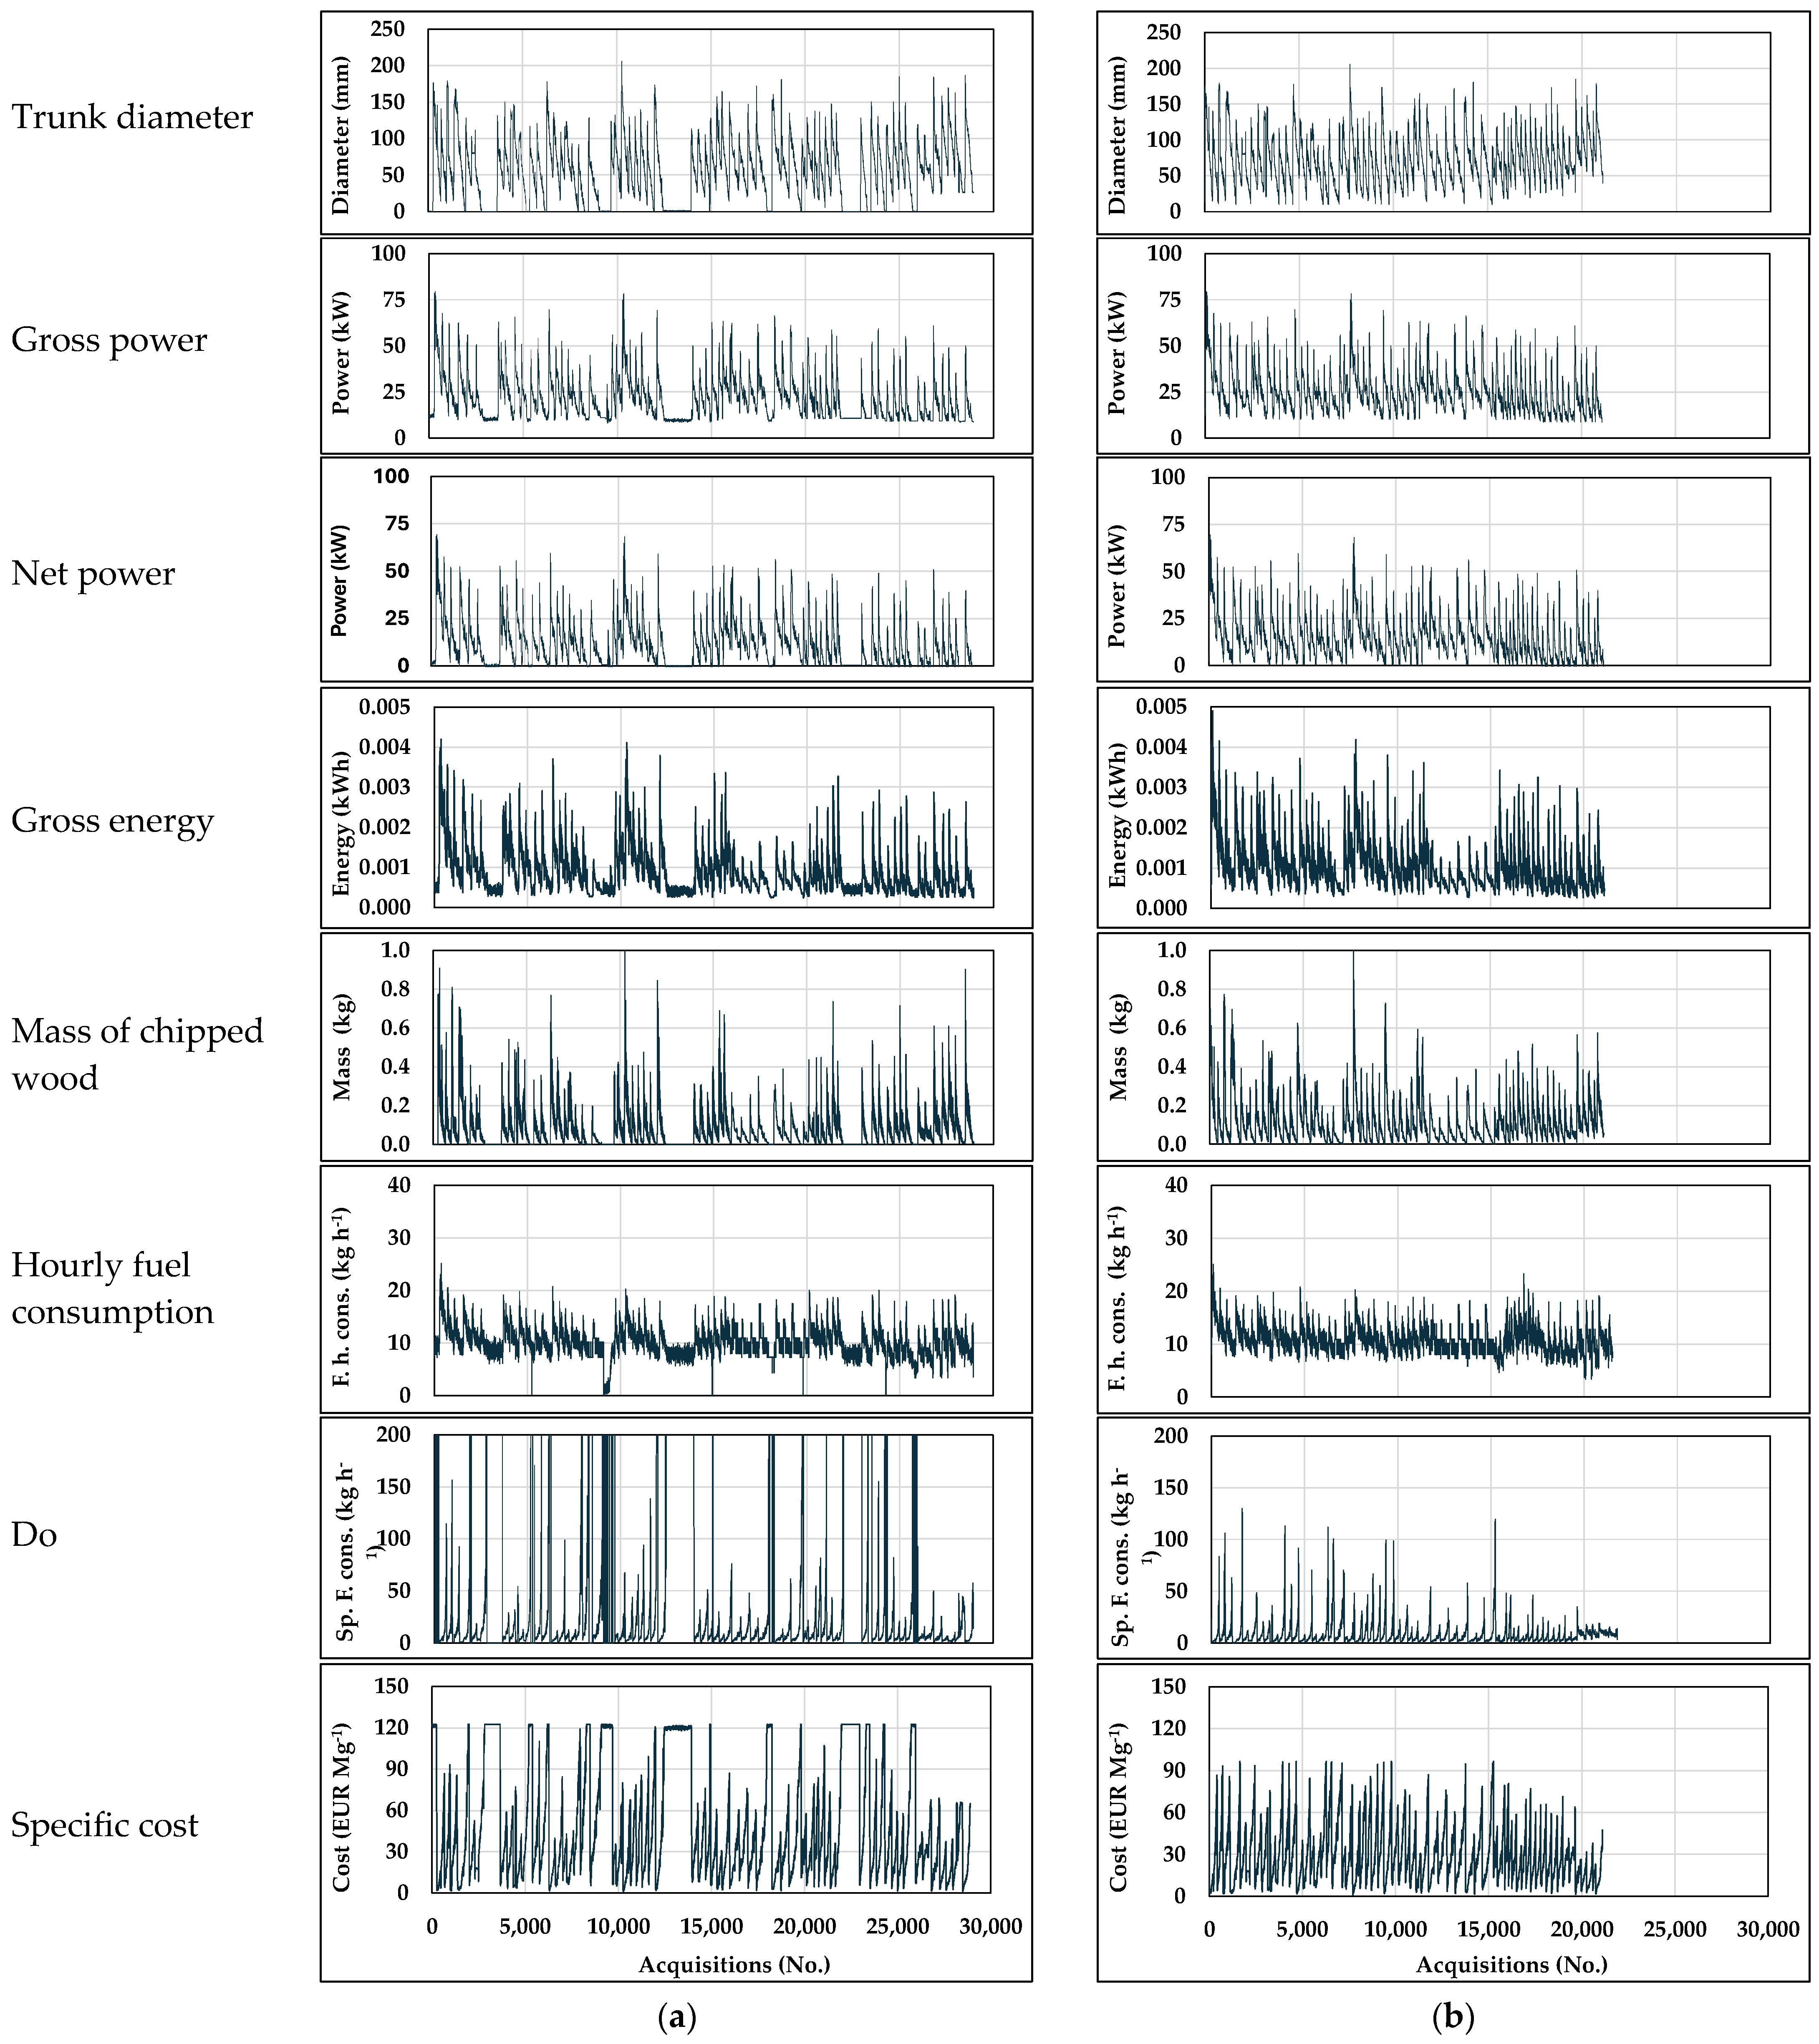
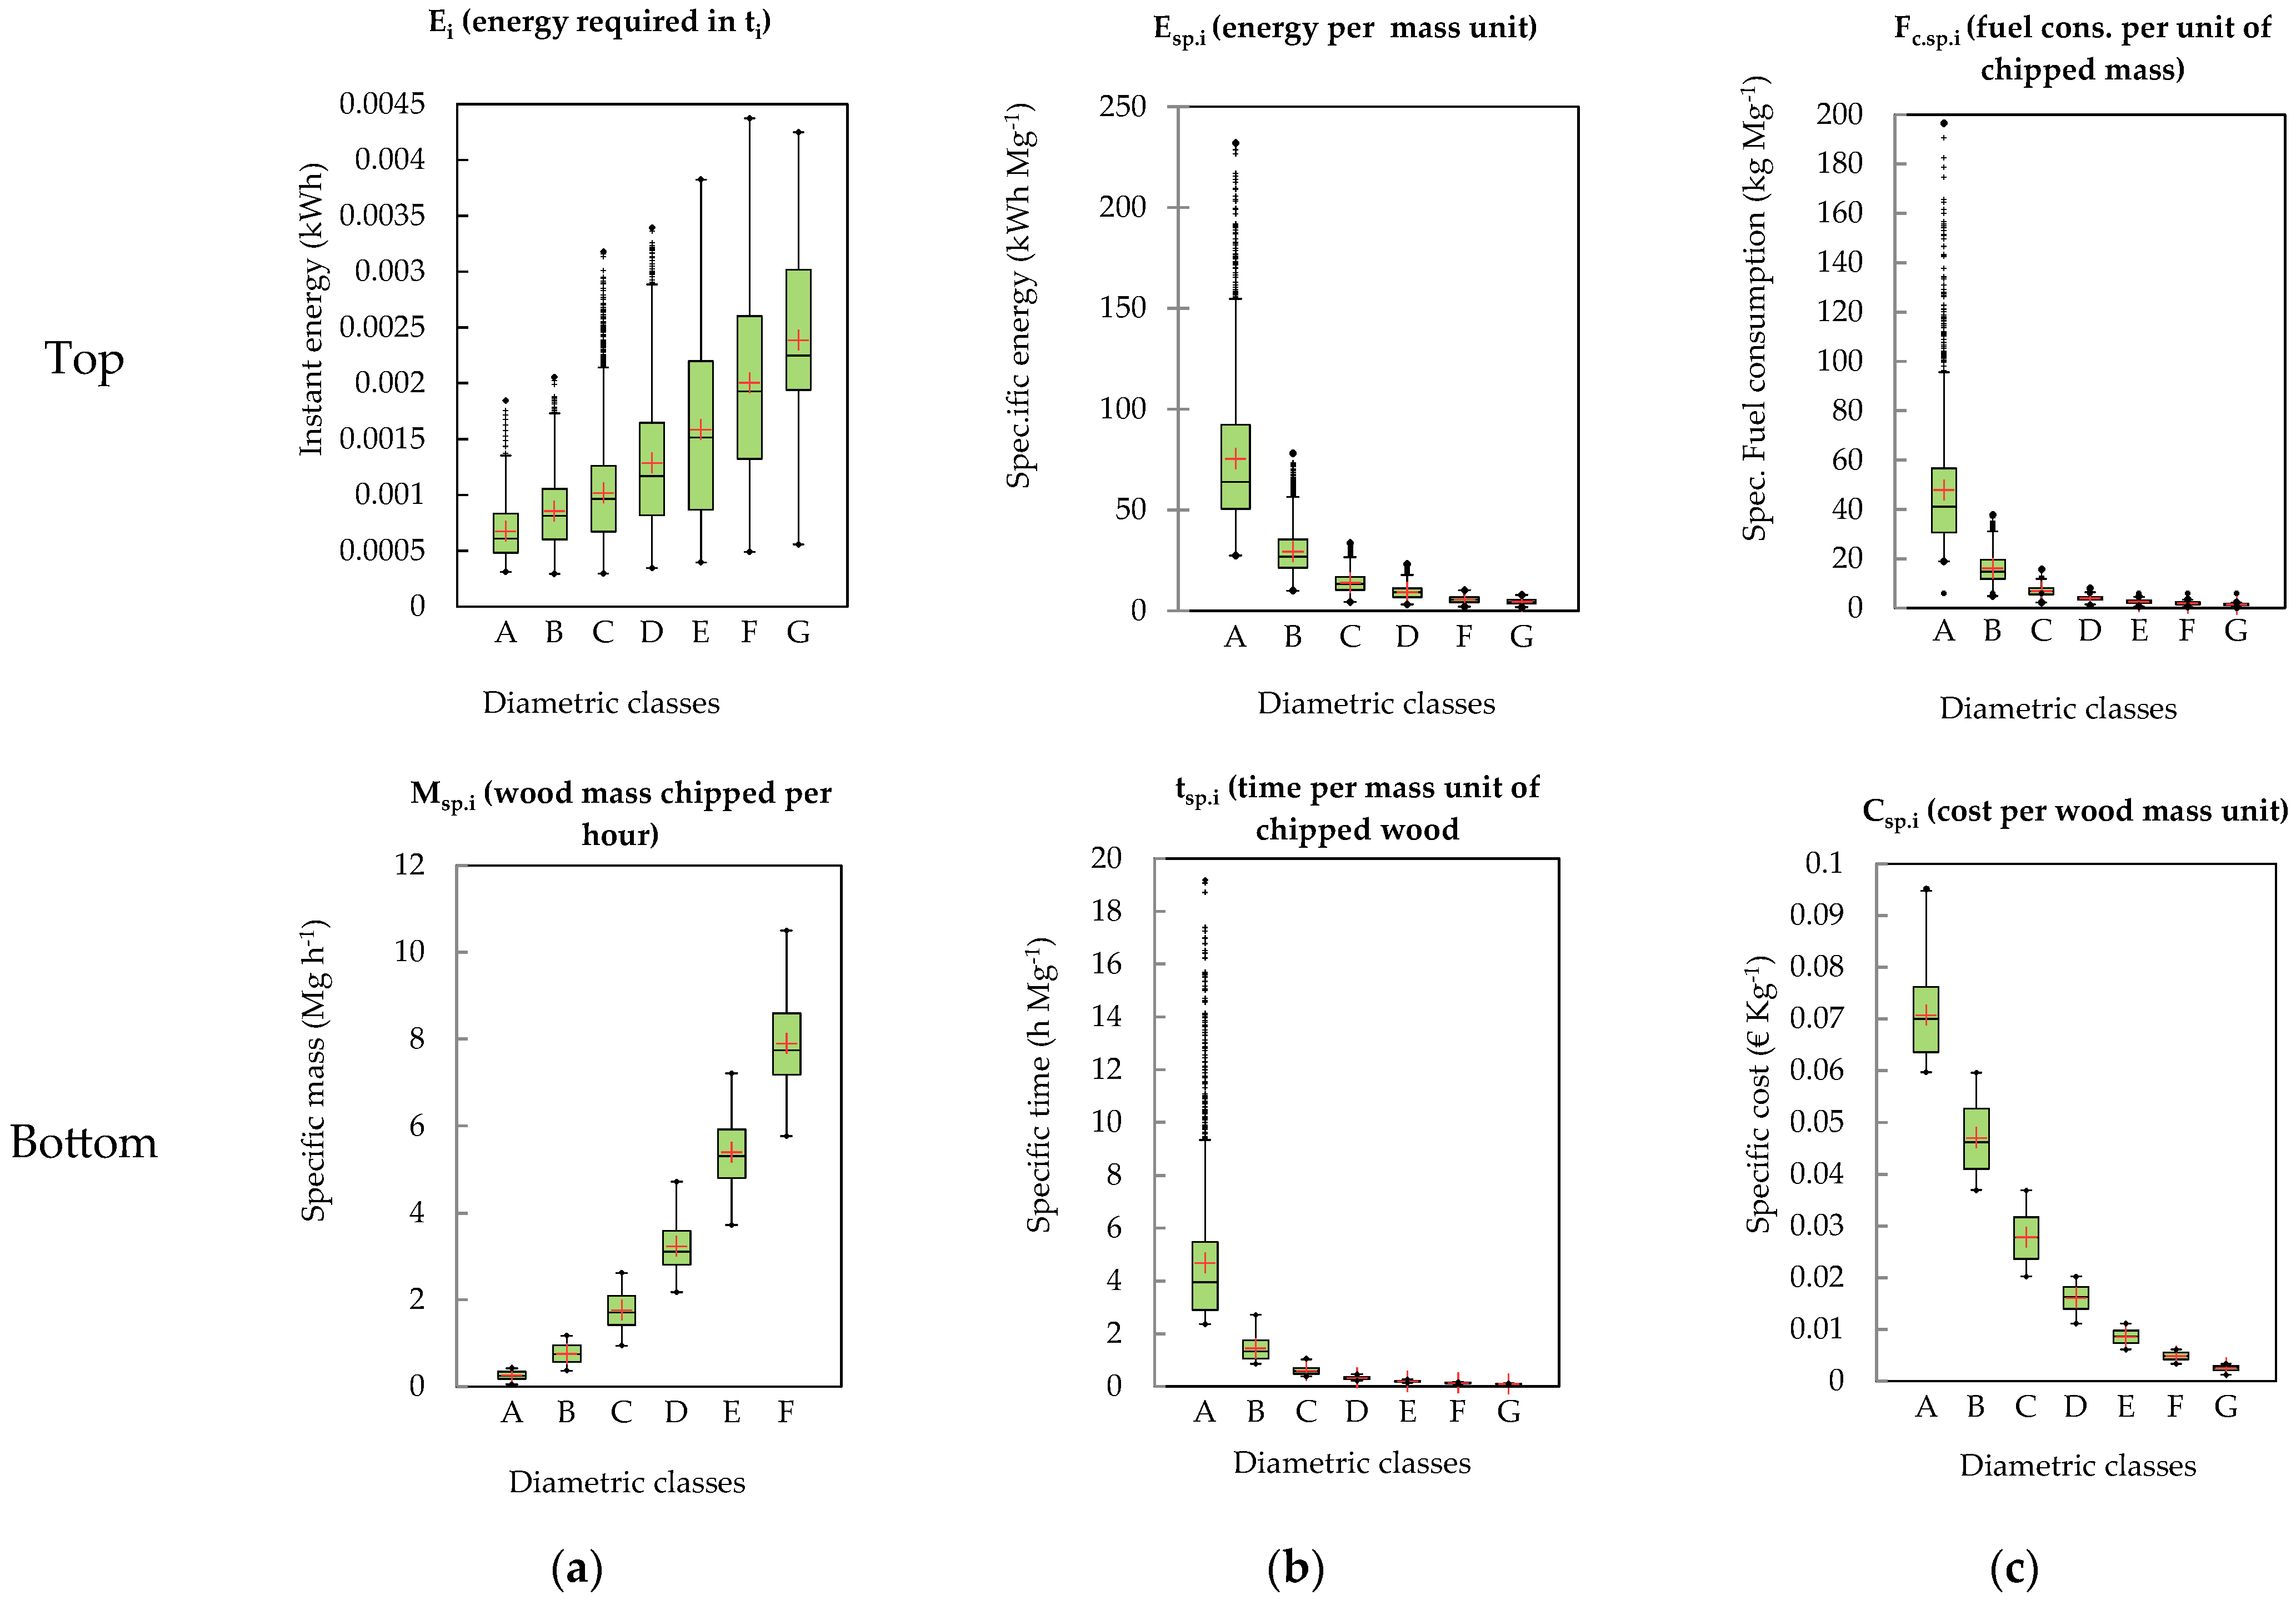
3.1. Experimental Data

Data acquisition during chipping provided 28,945 records of time, trunk diameter, fuel consumption, PTO torque and PTO speed. Due to the 3 s delay observed between the data of diameters (measured at the feed rollers) and those of torque, PTO speed and fuel consumption (measured exactly during the chipping), it was necessary to synchronize the series of data. Their alignment was obtained by sliding the series of diameters forward until their peaks coincided with the peaks of other measured parameters. The dataset formed by the measured parameters was extended by calculating the derived parameters of Table 2, which were used to assess the performance of the chipper. The results of this elaboration are shown as examples in Figure 4a by the diagrams of the instant values of some of the parameters considered. They show a clear connection between the curve of trunk diameters and those of other parameters, with peaks and minimum values which generally occur simultaneously. In the curve of diameters, it is possible to identify various intervals with a zero-diameter, and, correspondingly, similar intervals occur in the curves of other parameters. Each of them represents the interval between two contiguous trunks and provides information on the working conditions when the tractor−chipper system is running without chipping.
On purpose, all records corresponding to zero-diameter were accurately selected, extracted from the original dataset, and analyzed separately. Similarly, three more datasets were extracted from the original dataset. For the resulting five datasets, Table 3 reports the statistical descriptor of all considered variables. This, together with the observation of Figure 4, provided information on the contribution of the different operative conditions to the overall balance of the operation, in terms of time, power, energy and fuel demands, operation costs and CO2 emissions.
The five datasets of Table 3 were:
-
I: The original dataset (from which the diagrams of Figure 4a were drawn), which provided the operational instant data of the chipping operation as a whole.
-
II: This dataset comprehended the zero-diameter block of data (all records with diameter <1 mm). It allowed for characterizing of the base working conditions of the tractor−chipper system.
-
III: This dataset comprehended all records with diameters between 1 and 10 mm, i.e., the fraction consisting of the smallest branches.
-
IV: This dataset was formed by all records with diameters between 10 and 30 mm, i.e., the fraction of bigger branches.
-
V: This dataset consisted of the records with diameters higher than 30 mm.
Datasets IV and V were merged to form the final dataset (of 21,104 records), which can be considered representative of the actual chipping operation described by the diagrams of Figure 4b.
Comparing Figure 4a,b shows the differences between the original and final dataset. Beyond the number of acquisitions, in particular it can be noticed that the out-of-scale values of specific fuel consumption and specific costs, visible in Figure 4a in correspondence of very low or equal to zero values of diameter, disappeared in the diagrams of Figure 4b. It is the case, for instance, of the specific gross energy, which results from the ratio between gross energy and instant mass. In considering dataset III (Table 3), the mean diameter reported is 3.49 mm, which corresponds to an instant mass of 1.8 × 10⁻⁷ Mg. Assuming an instant power of 11 kW, multiplying this value by the acquisition time (0.2 s) provides an instant gross energy of 0.00061 kWh. The ratio between 0.00061 kWh and 1.8 × 10⁻⁷ Mg will provide the out-of-scale value of gross specific energy of 3370 kWh Mg−1. It can be noticed that this value is different from the 6502 kWh reported in Table 4. This is because the average values of the derived parameters in Table 4 were not calculated from the averages of the measured parameters reported in the same row of the table; rather, they represent the averages of all their instant values present in the respective datasets. Although not shown, similar behaviors were also observed for net specific energy and specific time, whose calculation requires the diameter to be present in the denominators of the relating formulas. In Table 3, they were not reported for dataset III. As to the other parameters reported in Figure 4:
-
The instant gross power, (Wgi, Table 3 dataset I): This is calculated by multiplying the torque, Tgi, and the speed, vpto, measured at tractor PTO according to the Formula (1) reported in Table 2. It represents the overall power required for the chipping and includes (1) the base power, (Wb = Wgi, of Table 3 dataset II), needed to operate the chipper, without chipping, at the required PTO speed (≅1000 min−1). The level of Wgi can be observed in Figure 4a in the diagram of gross power in correspondence with the intervals between the chipping of contiguous trunks, intervals identifiable by diameter values equal to zero. During the test, Wgi varied between 8.9 and 13.6 kW, with an average of 10.49 kW. The instant gross power also involves (2) the net power, Wni = Wgi of Table 3, dataset V, which is the power employed in wood chipping. It was calculated by the difference between Wgi and the mean Wn and is represented in Figure 4a,b in the relating diagrams.
-
The energy, Egi: This is calculated from Wgi, Table 2, Formula (8), and represents the total mechanical energy consumed during each acquisition. The base instant energy, Eb = Egi of Table 3, dataset II, was 0.00042 kWh, as visible in Figure 4a in the zero-diameter intervals.
-
The instant chipped wood volume Vi: This is calculated with the Formula (2) (Table 2). From Vi we can calculate the instant chipped wood mass, Mi, by means of the Formula (3) (Table 2). It varies as well with the diameters, showing peaks and minimum values in the same intervals. Thus, for zero-diameter, the chipped mass is also zero.
-
The hourly fuel consumption, Fchi: This also follows the trend of the variation in the diameter. It is calculated with the Formula (5) (Table 2). For zero-diameter, an average Fchi of 7.51 kg h−1 resulted in Table 3 and can be observed in the relating diagrams in Figure 4a.
In Table 3, the sum of all records is reported for some parameters to obtain further information. Thus, the sum of the instant fuel consumptions (cm3) gathered in the original dataset (I) is 13.74 dm3 and represents the operational fuel consumption, while in the final dataset, formed by datasets IV and V, it is 11.65 dm3 (1.23 + 10.42 dm3) and corresponds to the actual fuel consumption (84.9% of the total). In dataset II, Fc = 2.92 dm3 (1.5% of total Fc) represents the fuel consumed when the machine ran without chipping, while in dataset III, Fc = 0.43 dm3 (3.13% of total Fc).
By extending these considerations to other parameters, Table 3 also provides the following:
-
Operational working time, top, of 4355 s (dataset I) and actual working time, ta, 3463 s (436 s + 3027 s, respectively, in dataset IV and V), i.e., 79.5% of the former.
-
Total volume and mass of wood chipped (dataset I), respectively, at 3553.4 dm3 and 2523 kg, considering an average specific gravity of 0.71 kg dm−3 for poplar wood. The chipped wood came almost totally from datasets IV + V (3552.8 dm3 and 2522.5 kg), while dataset III only provided 0.61 dm3 and 0.43 kg.
-
Operational gross and net energy requirements, from dataset I, respectively, at 25.8 and 13.6 kWh.
-
Actual gross and net energy requirements, from datasets IV + V, respectively, at Eg = 23.1 kWh (1.8 + 21.3 kWh) and En = 14.6 kWh (0.6 + 14.6 kWh).
-
Overall CO2 emissions of 36.3 kg (dataset I), of which 30.8 kg (84.8%) occurred in the final dataset (3.3 kg in dataset IV and 27.5 kg in dataset V). The total CO2 emissions produced during the intervals between contiguous trunks (dataset II) were 5.46 kg (≅15% of total emissions).
The overall energy, E, required in the different datasets is calculated by means of Formula (7) from fuel consumption, Fc, and LHW value (Table 2). Table 4 reports the values of E resulting from the total Fc values obtained for the five datasets of Table 3 together with the total values of gross energy (Eg) and the efficiency, η, resulting from the ratio:
η = Eg · E−1
The data of Table 4 indicate a total energy consumption of 136.8 kWh (dataset I) with an average mechanical efficiency of 0.189. The highest efficiency occurred in dataset V with bigger diameters. The lowest efficiency values were observed with small diameters, particularly in dataset III (1 < D < 10 mm). All values reported in Table 4 are confirmed by the results of the tests at the dynamometric brake, shown in Figure 5, in which the engine load conditions were replicated by properly setting the engine speed and PTO torque. The former was set on 2000 min−1 without load, similar to the value set in the field to operate the chipper. The progressive increase in torque determined the reduction in the engine speed and the variation in power, hourly, as well as the specific fuel consumption and engine efficiency.
The green solid lines in Figure 5 indicate that the mean power of 25.1 kW, resulting in dataset V in Table 3, corresponds with an engine speed of around 1940 min−1 and a mechanical efficiency of around 0.21, similar to the value reported in Table 4. The diagrams indicate that the engine efficiency of the tractor ranges from 0 to a maximum of 0.37, in line with the data reported in the literature for tractors of a similar age [41], achievable under optimal engine working conditions (high torque, lowest fuel specific consumption), However, very far from those of our chipping test. Similarly, following the green dashed lines, a maximum efficiency around 0.335 can be assessed in Figure 5 (at engine speed of 1740 min−1 and fuel consumption of 20 kg h−1) based on the maximum gross power of 79.5 kW (Table 3) observed during the chipping (dataset V). According to Table 4, the maximum instant fuel consumption is 1.4 cm3. It should occur at maximum power demand and corresponds to an hourly fuel consumption of 20.16 kg min−1 (considering ti = 0.2 s and fuel specific gravity of 0.84 kg dm−3).
The application of the methodology is subordinated to the use of specific sensors, which could result in difficulties in normal operative conditions. Despite this, the introduction of the direct measurement of trunk diameters integrating the data provided by the other sensors offers the possibility to achieve information directly from a big bulk of data directly measured during the chipping. Their analysis, carried out as described above, can improve the quality and quantity of specific information on the performance of the chippers and could be also applied in existing test plants with properly sensorized chippers used as test rigs aimed at specific evaluation of the efficiency of different chipping organs and of their wear [24,30], or in testing activities aimed at verifying/certifying the functionality and efficiency of the chippers, allowing for their comparison theoretically without the necessity of significant interventions to characterize and classify the trunks, except for the determination of moisture. If needed, most information on trunk characteristics, like length or average diameter, could be achieved through analysis of the dataset.
However, the proposed method would integrate the present applications of sensors mostly aimed at assessing the average data of power, fuel consumption and working time during the execution of real operations, and, therefore, commonly refer to the overall production of wood chips. On purpose, the data processing could be simplified by improving the arrangement of sensors to avoid the described misalignment between the series of diameters and of all other parameters due to the time needed by the trunk to pass from the feeder rollers to the chipping organs. The use of modern technologies (i.e., image analysis) to assess the diameters (or masses) of the trunks and/or a more suitable configuration of different channels of data acquisition could help to solve the problem, avoiding the operation of realignment of the series. The variables of Table 3 were tested for normality. The results of the Shapiro–Wilk test always indicated non-normal distribution, as shown in Table 5 for twelve of them, which were selected for their importance and used in further analyses.
The non-normality of the variables is confirmed in Figure 6 by the frequency distribution of the values of diameter, D, instant fuel consumption, Fci, and gross torque, Tg, parameters directly measured by the sensor system. The positive skewness of the three distributions suggests the presence of a relationship between the trend of D and of Fci, and particularly of Tg. A similar trend was observed for the other parameters.
With reference to the results reported in Table 3, since the data provided by dataset III are negligible relating to those of the whole dataset (I), as said above, dataset IV and V were merged, for further analysis, into a final dataset that was considered significant for evaluating the performance of the chipper. The data of the twelve variables of Table 5 were grouped according to the following diametric classes: A: 10 < D < 30 mm; B: 30 ≤ D < 50 mm; C: 50 ≤ D < 75 mm; D: 75 ≤ D < 100 mm; E: 100 ≤ D < 125 mm; F: 125 ≤ D < 150 mm; G: D ≥ 150 mm. The resulting distributions are reported in the boxplots of Figure 7 and Figure 8. Figure 7 relates to the parameters, Di, Fci and Tgi, directly measured by the sensors (Figure 7, top), and to the basic parameters, Mi, Wgi and Fch, calculated from them, in real time, by the acquisition system (Figure 7, bottom). Figure 8 refers to six parameters, Egi, Egspi, Fcspi, Mspi, Tspi and Cspi calculated remotely by combining the previous ones to better characterize the quality of the chipping carried out. The twelve class distributions of Figure 7 and Figure 8 underwent ANOVA and Mann–Whitney pairwise tests, always resulting significantly different for the mean and median (p-value < 0.05).
Several boxplots of Figure 7 and Figure 8 show outliers. For instance, high Tgi values occurred in lower diametric classes and were directly reflected in the boxplot of Wgi and Egi. The magnitude of the outliers was amplified when they were divided by very small values of mass (which result from small diameters) in order to obtain the corresponding values of derivative parameters like Egspi, Fcspi, Mspi, tspi and Cspi. The outliers could occur in particular work situations. For instance, if a trunk broke after entering the feed rollers, but before the chipping organs, the continuity of the process was interrupted, and we could find high diameters paired to low torque values. Otherwise, low diameters could be associated with high torque values when the feed rollers pushed towards the chipping unit multiple small diameter branches whose mass was capable of exerting a certain resistance against chipping.
Despite the presence of outliers, the boxplots of Figure 7 and Figure 8 confirm the above observation and the results of previous studies [31] about possible relationships between the trend of diameters and other parameters, suggesting that at increasing diameters, the torque, instant and hourly fuel consumption, power, and energy increase as well, following quite linear trends. On the other hand, when the diameter increases, the mass, specific energy, specific mass, specific time, specific fuel consumption and specific cost show exponential trends, increasing or decreasing depending on whether the mass, Mi, is, respectively, in the numerator or denominator. In the formulae used to calculate these elements, the mass is the product of the specific gravity of poplar wood by the volume, Vi, of the virtual cylinder of wood chipped in ti. (Table 2, Formula (2)). Consequently, when Di increases, Vi increases more than proportionally, since it depends on the square of the radius and the height of the cylinder, which corresponds to the distance covered in ti by the trunk inside the chipper.

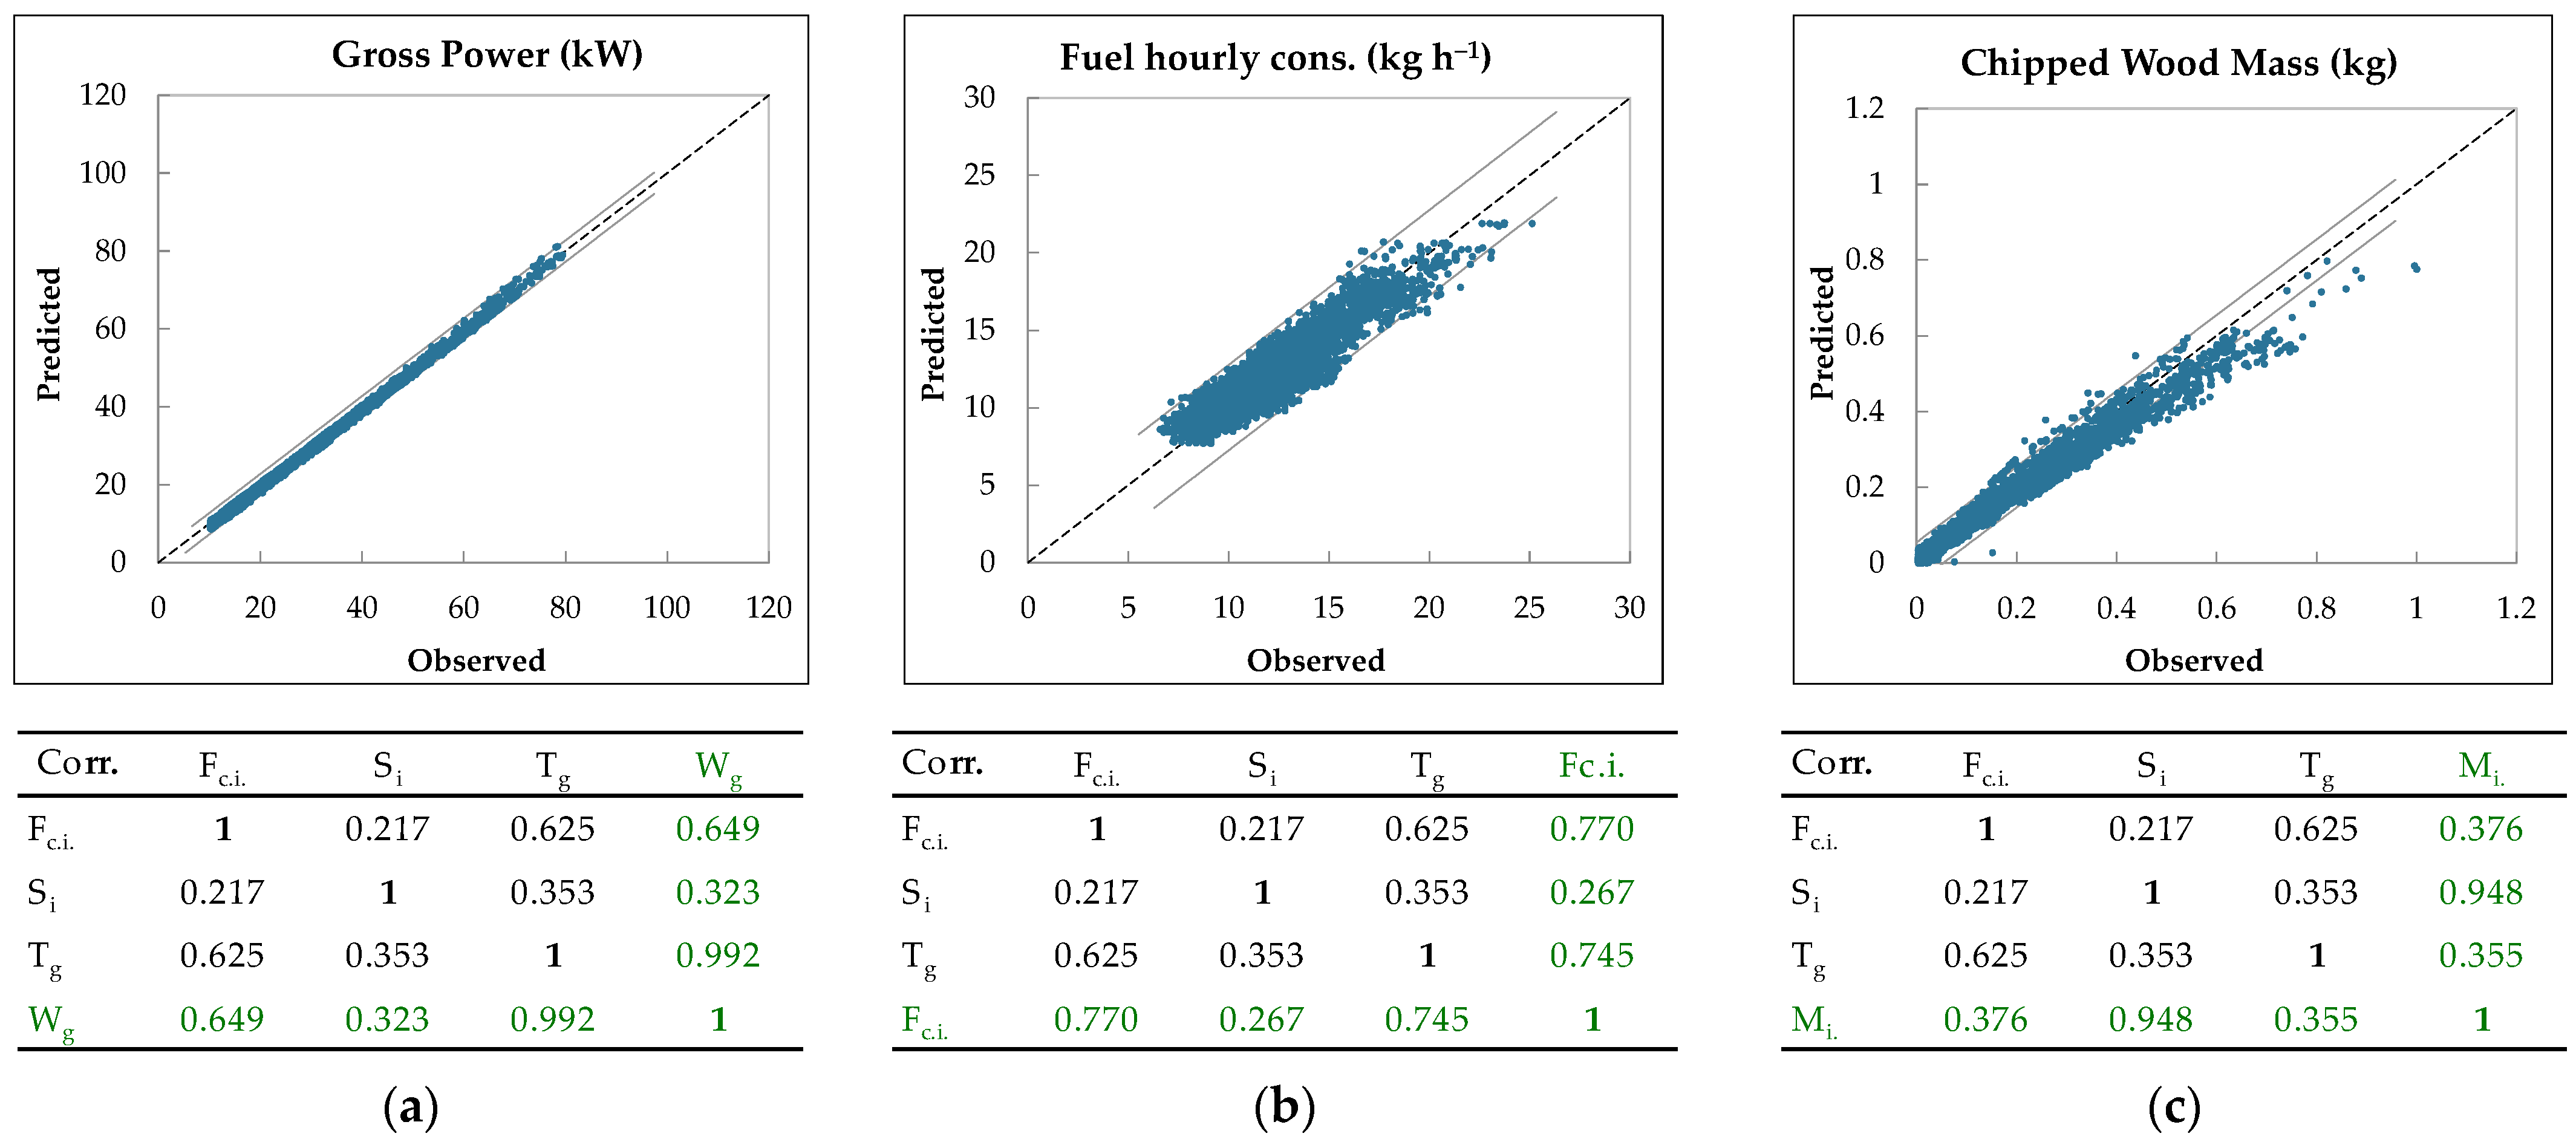
3.2. Predictive Models

According to previous considerations, multi-linear MLR predictive models were developed for several variables based on the dataset IV and V of Table 3. They are reported in Table 6, which shows the formulas and relating statistics indices. The models were divided into two groups. The models of Group 1 were based on three independent variables: Fci (cm3), i.e., fuel instant consumption directly measured by the relating sensor, and Tgi (daNm), instant torque directly measured by the torque meter; Si (m2), i.e., instant section of the trunk being chipped, directly calculated by the acquisition system from the instant diameter. They were used to assess Wg (gross power, kWh), Fch (fuel hourly consumption, kg h−1); Mi (mass of wood chipped in ti, kg).
Group 2 comprehended three models used to assess Eg (gross energy, kWh), Msp (specific mass of wood chipped per hour, Mg h−1) and Csp (specific cost, EUR · Mg−1). The independent variables used in this case were as follows: trunk section, Si (m2); gross power, Wg (kW); instant chipped mass, Mi (kg); instant diameter, Di (mm); specific chipped mass, Msp (Mg·h−1); specific fuel consumption, Fcsp (kg·Mg−1). The proposed MLR model formulas, chosen predictors, and the relating R2, adjusted R2 and standard deviations are shown in Table 6.
Figure 9 and Figure 10 show the results of the application of the models of Table 6 to the final datasets resulting from merging datasets IV and V of Table 3, by comparison between the observed and predicted values. For each diagram, a table is also reported with the pairwise correlation analysis between all variables involved in the specific model formula. The dependent variables are reported in green characters. All models have high R2 and adjusted R2, ranging from 0.762 to 0.985, comparable to those reported in other studies [10,42]. The diagrams show in all cases good correspondence between the observed and model-predicted data. The greatest dispersion of points was observed with the model for Fch (Figure 9b), which, in Table 6, showed the lower R2.
The application of the models to the average values of the five datasets reported in Table 3 confirmed their high accuracy with datasets IV and V, used to develop them. The accuracy slightly decreased with dataset I, formed by all data, including the lower diameter classes (D < 10 mm). With datasets II and III, the models provided abnormal data and are unapplicable. This trend is confirmed, for instance, for the specific costs by the comparison between the mean values calculated in Table 2 and those provided by the MLR model. The mean specific costs reported in Table 2 are: 49 EUR · Mg−1 in dataset I; non determined in dataset II; 113 EUR · Mg−1 in dataset III; 71.5 EUR · Mg−1 in dataset IV and 24.39 EUR · Mg−1 in dataset V. The values provided by the MLR model for specific cost using the mean values of the related descriptors are: 44.6 EUR · Mg−1 in dataset I; non determined in dataset II; 2714 EUR · Mg−1 in dataset III; 69.8 EUR · Mg−1 in dataset IV and 24.99 EUR · Mg−1 in dataset V.
The models of Group 1 (Figure 9) are based on three independent variables measured by the sensor system, which allows for direct assessment of the gross power, hourly fuel consumption and mass of chipped wood as dependent variables. Due to their accuracy, they represent an alternative to the formulas used by the data processing system. However, since they are mostly based on data measured directly from sensors, their application is difficult when sensors are not available. The three models of Group 2 (Table 6, Figure 10) provide the assessment of the gross energy, specific chipped mass (i.e., productivity) and specific cost. The values of their descriptors, in addition to being calculated with formulas, can also be estimated based on operational hypotheses, which allows these models to be used to obtain information even outside of a context specifically dedicated to testing.
MLR models were shown to poorly fit with other derived variables like specific energy (kWh Mg−1), specific fuel consumption (kg Mg−1), and specific time (h Mg−1), which, despite their good correlation with all potential independent variables, always gave non-linear responses to the attempts of modelling due to their characteristic of varying non-linearly with respect to the descriptors.

4. Conclusions

This study proposes an original methodology concerning the evaluation of the performance of chipping operations through direct analysis of the dataset provided by sensors applied to the tractor−chipper system for continuous measurement of trunk diameters, torque at power-take-off (PTO) and fuel consumption. From these parameters, the data processing system provides calculations of all parameters typical of the operation, which range from power requirements and wood mass chipped to the parameters relating to energy and efficiency, productivity, CO2 emissions and costs.
In our test, a dataset of approximately 29,000 records, resulting from continuous chipping of 61 poplar trees, was processed as a whole based on the hypothesis that fuel consumption and PTO torque (and all parameters derived from them) vary as a function of trunk diameter. Sorting all records by increasing diameters allowed us to extract different subsets of data and obtain accurate information on performance relating to the different operational conditions encountered during the chipping. For instance, the zero-diameter subset of data was extracted and analyzed, allowing us to characterize the base working conditions, i.e., the conditions in which the machine was run without chipping. For each subset, the method provided the operative and actual working time, the gross and net values of power, energy and specific energy and specific fuel consumption, together with the total amounts of fuel consumption, masses chipped and CO2 emissions. This allowed us to identify the interval of diameter values with higher chipper efficiency. The above hypothesis about the relationship between the variation in diameter and other parameters was verified by clustering the dataset according to seven diameter classes and verifying the statistical significance of the differences.
Eventually, six high R2 multi-linear-regression (MLR) models were developed to assess the values of six dependent variables. Despite their high accuracy, three of them were based on descriptors directly provided by the sensors, which make them inapplicable to normal operations where sensors are not available. Unlike them, a more general application is possible for the remaining three models, as they are based on descriptors which can be calculated or simply hypothesized. In any case, the general usefulness of MLR models can be considered rather limited, as they have proven to poorly fit with variables, like specific energy (kWh Mg−1), specific fuel consumption (kg Mg−1) and specific mass (Mg h−1), which vary non-linearly with trunk diameter.
The proposed methodology based on the use of sensors offers the possibility of obtaining information directly from a set of data measured directly during chipping, theoretically without the need to characterize and classify the logs, since data analysis can provide most of the information about their dimensions. It could be used to integrate the existing test methods both in laboratory and in field conditions. Eventually, it could be improved through the execution of additional tests to confirm the first results here reported and to extend their validity to other working conditions, such as different machines, wood species and tree dimensions. With this purpose, the methodology could result very useful if adopted in specific tests aimed at characterizing the performance of chipper models on different wood species from the point of view of energy requirements and related parameters such as efficiency, fuel consumption and CO2 emissions, thus providing a sort of certificate that will accompany all machines of the same model.

Author Contributions

Conceptualization, all authors; methodology, D.P., W.S. and G.S.; data curation, D.P. and R.F.; writing—original draft preparation, all authors; writing—review and editing D.P., D.S. and R.F.; supervision, D.P.; funding acquisition, G.S. All authors have read and agreed to the published version of the manuscript.

Funding

This study was funded by the Italian Ministry of Agriculture, Food and Forestry Policies (MiPAAF, D.D. n. 26329, 1 April 2016) for the AGROENER national project “Energia dall’agricoltura: innovazioni sostenibili per la bioeconomia”.

Data Availability Statement

The data presented in this study are available on request from the corresponding author.

Acknowledgments

The authors gratefully acknowledge Cesare Cervellini, Franco Bernardini, Gino Brannetti, Sandu Lazar for helpful collaboration during the harvesting operations.

Conflicts of Interest

The authors declare no conflicts of interest.

References

  1. European Parliament Resolution of 5 February 2014 on a 2030 Framework for Climate and Energy Policies (2013/2135(INI)). Official Journal of the European Union 2014, C 93, 79–102. Available online: https://eur-lex.europa.eu/legal-content/EN/TXT/PDF/?uri=CELEX:52014IP0094 (accessed on 12 October 2023).
  2. Directive (EU) 2015/1513 of the European Parliament and of the Council of 9 September 2015 amending Directive 98/70/EC Relating to the Quality of Petrol and Diesel Fuels and Amending Directive 2009/28/EC on the Promotion of the Use of Energy from Renewable Sources. Official Journal of the European Union 2015, L239 Vol. 58, 1–29. Available online: https://eur-lex.europa.eu/legal-content/EN/TXT/PDF/?uri=OJ:L:2015:239:FULL (accessed on 12 October 2023).
  3. European Commission Memo. Indirect Land Use Change (ILUC) What Are Biofuels? Available online: https://ec.europa.eu/commission/presscorner/detail/en/MEMO_12_787 (accessed on 12 October 2023).
  4. Lindegaard, K.N.; Adams, P.W.R.; Holley, M.; Lamley, A.; Henriksson, A.; Larsson, S.; von Engelbrechten, H.G.; Esteban Lopez, G.; Pisarek, M. Short Rotation Plantations Policy History in Europe: Lessons from the Past and Recommendations for the Future. Food Energy Secur. 2016, 5, 125–152. [Google Scholar] [CrossRef]
  5. Reinhardt, J.; Hilgert, P.; von Cossel, M. A Review of Industrial Crop Yield Performances on Unfavorable Soil Types. Agronomy 2021, 11, 2382. [Google Scholar] [CrossRef]
  6. Spinelli, R.; Nati, C.; Sozzi, L.; Magagnotti, N.; Picchi, G. Physical Characterization of Commercial Woodchips on the Italian Energy Market. Fuel 2011, 90, 2198–2202. [Google Scholar] [CrossRef]
  7. Verani, S.; Sperandio, G.; Picchio, R.; Marchi, E.; Costa, C. Sustainability Assessment of a Self-Consumption Wood-Energy Chain on Small Scale for Heat Generation in Central Italy. Energies 2015, 8, 5182–5197. [Google Scholar] [CrossRef]
  8. Hillring, B. Price Trends in the Swedish Wood-Fuel Market. Biomass Bioenergy 1997, 12, 41–51. [Google Scholar] [CrossRef]
  9. Junginger, J.; Claypoole, K.; Laygo, R.; Crisanti, A. Effects of Serious Mental Illness and Substance Abuse on Criminal Offenses. Psychiatr. Serv. 2006, 57, 879–882. [Google Scholar] [CrossRef]
  10. Stefanoni, W.; Fanigliulo, R.; Pochi, D.; Fornaciari, L.; Grilli, R.; Benigni, S.; Latterini, F.; Sperandio, G. Assessment of Energy, Dynamic and Economic Balance of Chipping Operation in Poplar Medium Rotation Coppice (MRC) Plantations. Forests 2023, 14, 1358. [Google Scholar] [CrossRef]
  11. Santangelo, E.; Scarfone, A.; Del Giudice, A.; Acampora, A.; Alfano, V.; Suardi, A.; Pari, L. Harvesting Systems for Poplar Short Rotation Coppice. Ind. Crops Prod. 2015, 75, 85–92. [Google Scholar] [CrossRef]
  12. Saulino, L.; Allevato, E.; Rossi, S.; Minotta, G.; Fiorentino, N.; Saracino, A. Lengthening Single-Stem Rotation Improves Biomass Yield and Water Use Efficiency in Black Poplar Genotype Multi-Stem Rotation Coppice Plantations. Biomass Bioenerg. 2021, 154, 106256. [Google Scholar] [CrossRef]
  13. Magagnotti, N.; Spinelli, R.; Kärhä, K.; Mederski, P.S. Multi-Tree Cut-to-Length Harvesting of Short-Rotation Poplar Plantations. Eur. J. For. Res. 2021, 140, 345–354. [Google Scholar] [CrossRef]
  14. Latterini, F.; Stefanoni, W.; Alfano, V.; Palmieri, N.; Mattei, P.; Pari, L. Assessment of Working Performance and Costs of Two Small-Scale Harvesting Systems for Medium Rotation Poplar Plantations. Forests 2022, 13, 569. [Google Scholar] [CrossRef]
  15. Tavankar, F.; Nikooy, M.; Latterini, F.; Venanzi, R.; Bianchini, L.; Picchio, R. The Effects of Soil Moisture on Harvesting Operations in Populus Spp. Plantations: Specific Focus on Costs, Energy Balance and GHG Emissions. Sustainability 2021, 13, 4863. [Google Scholar] [CrossRef]
  16. Naimi, L.J.; Sokhansanj, S.; Mani, S.; Hoque, M.; Bi, T.; Womac, A.R.; Narayan, S. Cost and Performance of Woody Biomass Size Reduction for Energy Production. In Proceedings of the CSBE/SCGAB Annual Conference, Edmonton, AB, Canada, 16–19 July 2006. Paper no. 06-107. [Google Scholar]
  17. Spinelli, R.; de Arruda Moura, A.; da Silva, P. Decreasing the Diesel Fuel Consumption and CO2 Emissions of Industrial In-Field Chipping Operations. J. Clean. Prod. 2018, 172, 2174–2181. [Google Scholar] [CrossRef]
  18. Pottie, M.A.; Guimier, D.Y. Preparation of Forest Biomass for Optimal Conversion; Special Report SR-32; Forest Engineering Research Institute of Canada: Pointe Claire, QC, Canada, 1985; p. 112. [Google Scholar]
  19. Pochi, D.; Civitarese, V.; Fanigliulo, R.; Spinelli, R.; Pari, L. Effect of Poplar Fuel Wood Storage on Chipping Performance. Fuel Process. Technol. 2015, 134, 116–121. [Google Scholar] [CrossRef]
  20. Goldstein, N.; Diaz, L.F. Size Reduction Equipment Review. Biocycle 2005, 46, 48–53. [Google Scholar]
  21. Manzone, M. Energy consumption and CO2 analysis of different types of chippers used in wood biomass plantations. Appl. Energy 2015, 156, 686–692. [Google Scholar] [CrossRef]
  22. Spinelli, R.; Marchi, E. Trends and perspective in the design of mobile wood chippers. Croat. J. For. Eng 2021, 42, 25–38. [Google Scholar] [CrossRef]
  23. Tawfk, M.A.; El-Didamony, M.I. Manufacturing and performance of a prototype wood chipping machine to produce mini-chips. MISR J. Agric. Eng. 2015, 34, 1511–1528. [Google Scholar] [CrossRef]
  24. Guerrini, L.; Tirinnanzi, A.; Guasconi, F.; Fagarazzi, C.; Baldi, F.; Masella, P.; Parenti, A. A Plackett-Burman Design to Optimize Wood Chipper Settings. Croat. J. For. Eng. 2017, 40, 81–86. [Google Scholar]
  25. Spinelli, R.; Ivorra, L.; Magagnotti, N.; Picchi, G. Performance of a Mobile Mechanical Screen to Improve the Commercial Quality of Wood Chips for Energy. Bioresour. Technol. 2011, 102, 7366–7370. [Google Scholar] [CrossRef]
  26. Choi, Y.-S.; Cho, M.-J.; Paik, S.-H.; Mun, H.-S.; Kim, D.-H.; Han, S.-K.; Oh, J.-H. Factors Affecting the Chipping Operation Based on the Screen Size of the Drum Chipper. Forests 2019, 10, 1029. [Google Scholar] [CrossRef]
  27. Mihelič, M.; Spinelli, R.; Magagnotti, N.; Poje, A. Performance of a new industrial chipper for rural contractors. Biomass Bioenerg. 2015, 83, 152–158. [Google Scholar] [CrossRef]
  28. Manzone, M.; Balsari, P. Productivity and Woodchip Quality of Different Chippers during Poplar Plantation Harvesting. Biomass Bioenerg. 2015, 83, 278–283. [Google Scholar] [CrossRef]
  29. Laitila, J.; Routa, J. Performance of a Small and a Medium Sized Professional Chippers and the Impact of Storage Time on Scots pine (Pinus sylvestris) Stem Wood Chips Characteristics. Silva. Fenn. 2015, 49, 1382. [Google Scholar] [CrossRef]
  30. Hellström, L.M.; Gradin, P.A.; Gulliksson, M.; Carlberg, T. A Laboratory Wood Chipper for Chipping Under Realistic Conditions. Exp. Mech. 2011, 51, 1309–1316. [Google Scholar] [CrossRef]
  31. Kováč, J.; Krilek, J.; Mikleš, M. Energy consumption of a chipper coupled to a universal wheel skidder in the process of chipping wood. J. For. Sci.-Prague 2011, 57, 34–40. [Google Scholar] [CrossRef]
  32. Spinelli, R.; Cavallo, E.; Eliasson, L.; Facello, A. Comparing the efficiency of drum and disc chippers. Silva. Fenn. 2013, 47, 930. [Google Scholar] [CrossRef]
  33. ISO 18134-2; Solid Biofuels. Determination of Moisture Content. Part 2: Simplified Method. International Organisation for Standardisation: Geneva, Switzerland, 2024.
  34. Fanigliulo, R.; Pochi, D.; Bondioli, P.; Grilli, R.; Fornaciari, L.; Folegatti, L.; Malaguti, L.; Matteo, R.; Ugolini, L.; Lazzeri, L. Semi-refined Crambe abyssinica (Hochst. EX R.E.Fr.) Oil as a Biobased Hydraulic Fluid for Agricultural Applications. Biomass Convers. Biorefin. 2023, 13, 1859–1871. [Google Scholar] [CrossRef]
  35. Pochi, D.; Fanigliulo, R.; Bisaglia, C.; Cutini, M.; Grilli, R.; Fornaciari, L.; Betto, M.; Pari, L.; Gallucci, F.; Capuzzi, L.; et al. Test Rig and Method for Comparative Evaluation of Conventional and Bio-based Hydraulic Fluids and Lubricants for agricultural Transmissions. Sustainability 2020, 12, 8564. [Google Scholar] [CrossRef]
  36. Fanigliulo, R.; Pochi, D.; Servadio, P. Conventional and Conservation Seedbed Preparation Systems for Wheat Planting in Silty-clay Soil. Sustainability 2021, 13, 6506. [Google Scholar] [CrossRef]
  37. OECD. Code 2: Standard Codes for the Official Testing of Agricultural and Forestry Tractors Performance; Organisation for Economic Co-Operation and Development: Paris, France, 2018. [Google Scholar]
  38. ENEA. Agenzia Nazionale per le Nuove Tecnologie, L’energia e lo Sviluppo Economico Sostenibile. Potere Calorifico Inferiore Convenzionale del Greggio e dei Principali Prodotti Derivati. Available online: https://www.efficienzaenergetica.enea.it/glossario-efficienza-energetica/lettera-p/potere-calorifico.html (accessed on 12 October 2023).
  39. Contaldi, M.; Ilacqua, M. Analisi dei Fattori di Emissione di CO2 dal Settore dei Trasporti. Metodo di Riferimento IPCC, Modello COPERT ed Analisi Sperimentali; Rapporto 28/2003; APAT, Agenzia per la Protezione dell’Ambiente e per i Servizi Tecnici: Roma, Italy, 2003.
  40. Miyata, E.S. Determining Fixed and Operating Costs of Logging Equipment; General Technical Report NC-55; U.S. Department of Agriculture, Forest Service, North Central Forest Experiment Station: St. Paul, MN, USA, 1980. [CrossRef]
  41. Pellizzi, G. Meccanica Agraria, Materiali e Motori; Edagricole: Verona, Italy, 1976; pp. 160–163. [Google Scholar]
  42. Mola-Yudego, B.; Picchi, G.; Röser, D.; Spinelli, R. Assessing Chipper Productivity and Operator Effects in Forest Biomass Operations. Silva Fenn. 2015, 49, 1342. [Google Scholar] [CrossRef]
Figure 1. (a) Test field during the felling of trees; (b) chipping work site with the tractor−chipper coupling and a second tractor operating a hydraulic forestry crane used to feed the chipper.
Agriengineering 06 00092 g001
Figure 2. (a) Chipper coupled to the tractor PTO with torquemeter and photoelectric encoder installed between PTO and power shaft; (b) Volumetric fuel meter directly installed in the fuel circuit of the tractor.
Agriengineering 06 00092 g002
Figure 3. Potentiometric wire transducer applied at the chipper to measure the vertical movements of the upper infeed roller.
Agriengineering 06 00092 g003
Figure 4. Variations in some parameters during the chipping of 61 poplar trees: (a) Whole data set, including the data collected when the machine ran without chipping (between contiguous trunks, corresponding to diameter equal to 0 mm); (b) Data set resulting from the elimination of all data associated with diameter values <10 mm. Net power and net energy, respectively, represent the power and energy actually required by the wood chipping. The gross power and the gross energy, beyond the net power and energy, respectively, also include the base power and energy required to operate the chipper without chipping. The levels of base power, energy and fuel consumption can be observed in the diagrams (a), in correspondence with the intervals with diameter values equal to zero.
Agriengineering 06 00092 g004
Figure 5. Results of the test with a tractor at the dynamometric brake. The solid lines refer to the test at maximum fuel delivery, according to the OECD tractor test Code 2 standard. The dashed lines refer to the test at partial fuel delivery, reproducing the engine working conditions of the chipping. The green lines connect the three diagrams in order to visualize the values of all parameters for a given engine speed.
Agriengineering 06 00092 g005
Figure 6. Frequency distribution of the values of the parameters directly measured by the sensor system: (a) Diameter; (b) Instant fuel consumption; (c) Gross torque.
Agriengineering 06 00092 g006
Figure 7. Boxplots of the distributions of the instantaneous values of the fundamental chipping parameters, grouped according to seven diametric classes. Top: Directly measured parameters. Bottom: Parameters calculated from the previous ones. (a-top) Trunk diameters measured in ti; (b-top) Volume of fuel requested in ti; (c-top) Instantaneous torque values; (a-bottom) Wood mass chipped in ti; (b-bottom) Instant power demand; (c-bottom) Instant hourly fuel consumption calculated from the instant volume of fuel.
Agriengineering 06 00092 g007
Figure 8. Boxplots of the distributions of the instantaneous values of some calculated specific parameters of Table 3, grouped according to seven diametric classes. (a-top) Instant values of energy required for chipping; (b-top) Instant values of specific energy; (c-top) Instant values of fuel consumption per mass unit of chipped wood; (a-bottom) Wood mass chipped per hour calculated from the values of mass chipped in ti; (b-bottom) Instant values of time per mass of chipped wood; (c-bottom) Instant values of the specific cost for the chipping of the wood mass unit.
Agriengineering 06 00092 g008
Figure 9. Diagrams of observed and predicted values provided by the MLR model for gross power, fuel hourly consumption and mass chipped. The matrices relating to each diagram show correlation among all parameters involved (dependent variables in green character). (a) Gross power; (b) Fuel hourly consumption; (c) Mass of chipped wood.
Agriengineering 06 00092 g009
Figure 10. Diagrams of observed and predicted values provided by the MLR model for gross energy, specific mass, and specific cost. The matrices relating to each diagram show correlation among all parameters involved (dependent variables in green character). (a) Gross energy required by the chipping; (b) Wood mass chipped per hour; (c) Cost per unit of chipped wood mass.
Agriengineering 06 00092 g010
Table 1. Summary description of the chipping test setup.
Machineries used in chipping operationsFarmi CH260 forestry chipperPowered by tractor PTO
Landini Legend 145-S tractorNominal power: 105 kW; nominal PTO speed: 1000 min−1; transmission ratio between engine speed and PTO speed: 1.957
Farmi HK3861 forestry crane Powered by the PTO of tractor Fiat 80–90 (4 WD)
Instruments and test equipmentElectromagnetic dynamometric brake “Borghi e Saveri” FE600 S
Photoelectric Encoder
For PTO tests on tractors up to 300 kW power
OMRON E3F2-R2B4,
Torquemeter “HBM” T30FN Full scale torque: 2 kNm; full scale rotational speed: 3000 min−1
Fuel consumption meter 1Full scale: 150 dm3 h−1
String encoder Celesco VT, model 201-0025Signal range: 0–10 V; distance range: 0–1400 mm
Data logger On-board PC On-board notebook
PCI card 8 digital and 8 analogic channels
Frequency of acquisitions20 Hz
1 The volumetric fuel consumption meter was self-realized and validated at CREA Research Centre.
Table 2. Parameters used in the evaluation of the chipper’s performance. They are distinguished into measured parameters and derived parameters, calculated from the formers.
ParametersSymbolUnitFormulasNo.References
MeasuredTime/instant timet/tis, min, h---
PTO rot. speed/PTO instant speedspto/sptoimin−1---
PTO torque/instant torqueT/TidaNm---
Fuel consumption/instant cons.Fc/Fcicm3---
Trunk diameter/instant diameterD/Dimm---
DerivedPower at PTO/instant powerW/WikWW = T·vpto·k−1(1)[10]
Trunk infeed speed/instant speedvt/vtim·s−1---
Wood volume/instant volumeV/Vim3Vi = p·(Di/2)2·vti·ti(2)-
Wood mass/wood instant massM/Mikg, MgM = V·δw(3)[10]
Specific mass (work productivity)MspMg h−1Msp = St(Vi·ti−1)·δW(4)-
Hourly fuel cons./instant hourly f.c.Fch/Fchikg·h−1Fch = F·δF·t−1·3.6(5)-
Specific fuel consumptionFcspkg·Mg−1Fcsp = Fch·Msp−1(6)[36]
Overall energyEMJE = Fc × LHV(7)[38]
Gross mechanical energyEgkWhEg = W·t(8)-
Specific mech. En. (per volume unit)EgspkWh·m−3Egsp = Eg M−1(9)-
CO2 emissionsEmCO2kgEmCO2 = 44.11·F·
(12.01 + 1.01·rH/C)−1
(10)[39]
Specific cost of the operationCspEUR · Mg−1--[40]
(1) k = 955.0206 (constant); (2) the instant chipped volume is calculated by multiplying vti by Di and ti, where each vti was calculated from the variation in spto referred to the mean spto of 997 min−1, which corresponded to the trunk infeed speed of 0.217 m·s−1 observed while chipping a series of trunks of known length; (3,4) the wood specific gravity, δW, was assumed equal to 0.71 kg·dm−3; (5) δF: diesel fuel specific gravity assumed equal to 0.840 kg·dm−3; (6) Fcsp: mass of fuel (kg) needed to chip the mass unit (Mg) of wood; (7) LHW: lower calorific value of diesel fuel assumed as 42.68 MJ·kg−1; (8) Eg: gross energy (kWh) required by the chipping, obtained by multiplying the gross power (kW) by the time (h) it is delivered; (9) Egsp: gross energy required to chip the wood mass unit (Mg); (10) rH/C is the ratio of atoms between hydrogen and carbon atoms, about 2 in diesel fuel, and F is the fuel consumption in liters. In our case, the resulting CO2 emissions per liter of fuel are 2.64 kg L−1.
Table 3. Statistical descriptors of the variables considered in the test reported for the original dataset (I) and for four datasets extracted from (I), based on diameter values to highlight the contribution of different operative conditions to the overall requirements of time, energy, fuel consumption and cost in regard to CO2 emissions.
Measured Basic ParametersCalculated Basic ParametersCalculated Specific ParametersEmiss.
DatasetDescript.tiFciDiTgiTnisptoWgiWniViMiEgiEniFchiEgspEnspMsptspFcspCspiCO2
scm3mmdaNmdaNmmin−1kWkWdm3kgkWhkWhkg h−1kWh Mg−1kWh m−3Mg h−1h Mg−1kg Mg−1EUR Mg−1kg
I
total
Mean0.20.555.320.711.197421.110.90.120.090.000.0010.1510.235.342.331.0912.1749.450.0013
St. dev.0.10.241.711.911.957.011.911.90.160.120.000.002.925.474.941.951.6316.2241.220.0005
Sum435513,737------3553252225.813.5-------36.28
Max0.31.420681.972.3103679.569.31.431.020.010.0126.509.508.247.040.143.77122.600.0037
Min0.10.10.08.10.07718.20.00.000.000.000.007.2------0.0000
II
D < 1 mm, 0 diameter data
Mean0.20.30.110.00.2100410.50.20.0000040.0000030.000420.0000138.18------0.0009
St. dev.0.10.10.31.51.5371.51.50.0000070.0000050.000160.0000673.64------0.0003
Sum6941576.7------0.020.452.650.13-------4.61
Max0.30.91.012.52.5103613.618.90.0000370.0000260.00160.00105225.17------0.0025
Min0.10.10.08.90.18638.00.00.000.000.000.007.2------0.0000
III
1 < D < 10 mm
smallest branches
Mean0.20.373.4911.01.4100111.51.30.00050.000370.00050.000068.15650263.10.00888927195113.010.0010
St. dev.0.050.132.842.32.3332.52.50.00080.000540.00020.000123.257313390.012081175467.480.0003
Sum173.6432.8------0.610.430.560.07-------1.1430
Max0.301.069.9526.218.0103127.617.40.00370.002640.001540.00096932.024,89016,2730.043824387321200.0028
Min0.10.21.008.20.08568.70.30.000.000.000.000079.0161−28200.00042321,94096.550.0000
IV
10 < D < 30 mm
bigger branches
Mean0.20.422.814.75.198115.25.00.01350.00960.000620.0002059.30.000080.000030.233.936.271.530.0011
St. dev.0.10.25.14.74.7575.15.10.00730.00520.000310.0002412.20.000060.000030.12.626.19.050.0004
Sum4361248 39.8128.271.840.61-------3.30
Max0.31.230.062.953.3103551.741.50.050.030.000.0021.30.000570.000350.418.1287.696.550.0031
Min0.10.010.08.90.47868.70.30.00170.00120.000240.0000851.20.000030.000020.01.83.459.700.0000
V
D > 30 mm
trunks + biggest branches
Mean0.20.577.024.916.496425.115.10.180.130.00110.000714.18.58.462.900.656.6824.390.0014
St. dev.0.10.231.512.012.059.112.112.10.170.120.00070.000610.67.27.172.450.555.9014.670.0005
Sum302710,420------3513249421.3214.01-------27.52
Max0.31.420681.973.4103579.569.51.4311.0160.00970.0086133.311318.52.942.78.259.700.0037
Min0.10.1308.50.0367718.51.50.0130.0090.0090.00407.200.700.150.340.050.430.880.0000
Table 4. Overall energy, E, gross energy Eg, (mechanical) and efficiency resulting from the data of the five datasets of Table 3.
DatasetEEgη
MJkWhkWh
I492.5136.8025.800.189
II56.515.702.650.169
III15.54.310.560.130
IV44.712.431.800.145
V373.6103.7721.300.205
Table 5. Results of the Shapiro–Wilk normality test on the parameters reported in Table 3, which were the subject of further analyses.
Test
Indicators
Measured Basic
Parameters
Calculated Basic ParametersCalculated Specific Parameters
FciDiTgiWgiMi EgiFchiEgspMsptspFcspCspi
cm3mmdaNmkWkgkWhkg h−1kWh Mg−1Mg h−1h Mg−1kg Mg−1EUR Mg−1
W0.970.980.890.900.820.870.980.630.860.540.580.92
p-value 0.000.000.000.000.000.000.000.000.000.000.000.00
α0.050.050.050.050.050.050.050.050.050.050.050.05
Table 6. MLR models for the assessment of gross power, fuel hourly consumption, mass of wood chipped, gross energy, specific mass, and specific cost.
GroupsDependent VariablesEquationsR2R2 (adj.)St. Dev.
1Gross power (kWh)Wg = 0.049 + 2.813Fci − 78.247Si + 0.970Tgi0.9850.9851.412
Fuel hourly cons. (kg h−1)Fch = 5.132 + 6.651Fci − 3.546Si + 0.0960Tgi0.7620.7621.502
Chipped wood mass (kg)Mi = -4.426 + 0.149Fci − 23.426Si − 1.338Tgi0.9410.9410.027
2Gross energy (kWh)Eg = −5.892 × 10⁻⁵ − 0.12423Si + 4.486 × 10⁻⁵Wg +5.486 × 10⁻³Mi0.9030.9030.0002
Chipped specific mass (kg h−1)Msp = 5.711 × 10⁻² + 21.755Mi − 743.23Eg + 8.2034 × 10⁻²Fhc0.9250.9250.666
Specific cost (EUR · Mg−1)Csp = 78.069 − 1.030Di + 8.178Msp + 0.367Fcsp0.9830.9832.618
Descriptors: Wg = gross power (kW); Fci = fuel consumption (cm3); Si = trunk section (m2); Tgi = instant torque (daNm); Fch = fuel hourly consumption; Mi = instant chipped mass (kg); Eg = gross energy (kWh); Msp = specific chipped mass (Mg·h−1); Csp = specific cost (EUR · Mg−1); Di = instant diameter (mm); Fcsp = specific fuel consumption (kg·Mg−1).
Disclaimer/Publisher’s Note: The statements, opinions and data contained in all publications are solely those of the individual author(s) and contributor(s) and not of MDPI and/or the editor(s). MDPI and/or the editor(s) disclaim responsibility for any injury to people or property resulting from any ideas, methods, instructions or products referred to in the content.

